integrated system for protein liquid optimized adsorbents ... · pdf file1 1 integrated system...
TRANSCRIPT
Loughborough UniversityInstitutional Repository
Integrated system fortemperature-controlled fast
protein liquidchromatography. II.
Optimized adsorbents and`single column continuous
operation'
This item was submitted to Loughborough University's Institutional Repositoryby the/an author.
Citation: CAO, P. ... et al, 2015. Integrated system for temperature-controlledfast protein liquid chromatography. II. Optimized adsorbents and `single col-umn continuous operation'. Journal of Chromatography A, 1403, pp. 118-131.
Metadata Record: https://dspace.lboro.ac.uk/2134/18243
Version: Accepted for publication
Publisher: c© Elsevier B.V
Rights: This work is made available according to the conditions of the Cre-ative Commons Attribution-NonCommercial-NoDerivatives 4.0 International(CC BY-NC-ND 4.0) licence. Full details of this licence are available at:https://creativecommons.org/licenses/by-nc-nd/4.0/
Please cite the published version.

1
Integrated system for temperature-controlled fast protein liquid chromatography. II. 1
Optimized adsorbents and ‘single column continuous operation’ 2
3
Ping Caoa,3
Tobias K.H. Müllerb,1,3
, Benedikt Kettererb, Stephanie Ewert
a,b, Eirini 4
Theodosioua,2
, Owen R.T. Thomasa,*
, Matthias Franzrebb,**
5
6
aSchool of Chemical Engineering, College of Engineering and Physical Sciences, University 7
of Birmingham, Edgbaston, Birmingham B15 2TT, England, UK 8
bInstitute for Functional Interfaces, Karlsruhe Institute of Technology, Hermann-von-9
Helmholtz-Platz 1, 76344 Eggenstein-Leopoldshafen, Germany 10
11
*Corresponding author. Tel. +44 121 414578; fax: +44 121 4145377. 12
**Corresponding author. Tel.: +49 721 608 23595; fax: +49 721 608 23478 13
E-mail addresses: [email protected] (O.R.T. Thomas); [email protected] 14
(M. Franzreb). 15
16
1 Present address: Evonik Industries AG, Rodenbacher Chausee 4, 63457 Hanau, Germany 17
2 Present address: Department of Chemical Engineering, School of Aeronautical, 18
Automotive, Chemical and Materials Engineering, Loughborough University, Loughborough 19
LE11 3TU, UK 20
3 These authors contributed equally to the experimental work in this study 21
22

2
Abstract 23
Continued advance of a new temperature-controlled chromatography system, comprising a 24
column filled with thermoresponsive stationary phase and a travelling cooling zone reactor 25
(TCZR), is described. Nine copolymer grafted thermoresponsive cation 26
exchangers(thermoCEX) with different balances of thermoresponsive (N-27
isopropylacrylamide), hydrophobic (N-tert-butylacrylamide) and negatively charged (acrylic 28
acid) units were fashioned from three cross-linked agarose media differing in particle size and 29
pore dimensions. Marked differences in grafted copolymer composition on finished supports 30
were sourced to base matrix hydrophobicity. In batch binding tests with lactoferrin, maximum 31
binding capacity (qmax) increased strongly as a function of charge introduced, but became 32
increasingly independent of temperature, as the ability of the tethered copolymer networks to 33
switch between extended and collapsed states was lost. ThermoCEX formed from Sepharose 34
CL-6B (A2), Superose 6 Prep Grade (B2) and Superose 12 Prep Grade (C1) under identical 35
conditions displayed the best combination of thermoresponsiveness (qmax,50°C / qmax,10°C ratios 36
of 3.3, 2.2 and 2.8 for supports ‘A2’, ‘B2’ and ‘C1’ respectively) and lactoferrin binding 37
capacity (qmax,50°C ~56, 29 and 45 mg/g for supports ‘A2’, ‘B2’ and ‘C1’ respectively), and 38
were selected for TCZR chromatography. With the cooling zone in its parked position, 39
thermoCEX filled columns were saturated with lactoferrin at a binding temperature of 35 °C, 40
washed with equilibration buffer, before initiating the first of 8 or 12 consecutive movements 41
of the cooling zone along the column at 0.1 mm/s. A reduction in particle diameter (A2 42
B2) enhanced lactoferrin desorption, while one in pore diameter (B2 C1) had the opposite 43
effect. In subsequent TCZR experiments conducted with thermoCEX ‘B2’ columns 44
continuously fed with lactoferrin or ‘lactoferrin + bovine serum albumin’ whilst 45
simultaneously moving the cooling zone, lactoferrin was intermittently concentrated at 46
regular intervals within the exiting flow as sharp uniformly sized peaks. Halving the 47
lactoferrin feed concentration to 0.5 mg/mL, slowed acquisition of steady state, but increased 48

3
the average peak concentration factor from 7.9 to 9.2. Finally, continuous TCZR mediated 49
separation of lactoferrin from bovine serum albumin was successfully demonstrated. While 50
the latter’s presence did not affect the time to reach steady state, the average lactoferrin mass 51
per peak and concentration factor both fell (respectively from 30.7 to 21.4 mg and 7.9 to 6.3), 52
and lactoferrin loss in the flowthrough between elution peaks increased (from 2.6 to 12.2 mg). 53
Fouling of the thermoCEX matrix by lipids conveyed into the feed by serum albumin is 54
tentatively proposed as responsible for the observed drops in lactoferrin binding and recovery. 55
56
Keywords: Copolymer modified agarose adsorbents; Ion exchange adsorption; Lower critical 57
solution temperature (LCST); N-isopropylacrylamide; Smart polymers; Travelling cooling 58
zone reactor 59
60
4
1. Introduction 61
Today, liquid chromatography is universally recognized as a supremely effective and practical 62
bioseparation tool [1,2]. There are a multitude of reasons for this, but perhaps the two most 63
important are the technique’s adaptability to analytical and preparative separation tasks [3] 64
and the availability of a huge variety of differently functionalized chromatographic supports 65
affording orthogonal separation mechanisms [4,5]. In typical adsorption chromatography, 66
defined amounts of a given feed solution, containing a single target component and multiple 67
contaminants, are loaded onto a fixed-bed of adsorbent contained in a chromatography 68
column. While the target component adsorbs, to be recovered in a later dedicated elution step 69
by changing the chemical composition of the mobile phase, contaminant species either flow 70
through the column unhindered, or alternatively are washed out in a subsequent washing step 71
and/or during elution procedures. In addition to modifying the mobile phase’s chemical 72
composition, physical parameters can also be manipulated to influence protein adsorption to 73
and desorption from chromatographic supports; the most popular of these being temperature, 74
especially in the case of Hydrophobic Interaction Chromatography, HIC [6-10]. According to 75
the Gibbs-Helmholtz equation, an increase in temperature exerts an influence similar to that 76
imposed by raising the cosmotropic salt content in the mobile phase during HIC, which leads 77
to enhanced protein adsorption affinity [8]. However, the relatively small differences in 78
working capacity, even across temperature differentials as high as 40 °C, makes HIC 79
adsorbents unattractive materials for purely temperature mediated liquid chromatography. The 80
anchoring of ‘smart’ temperature–sensitive polymers or ‘smart’ thermoresponsive polymers 81
onto chromatography supports offers a potential means of overcoming this drawback. 82
83
Smart thermoresponsive polymers are ones that exhibit inverse temperature solubility 84
behaviour, i.e. they are water-soluble at low temperature and insoluble at high temperature, 85
above a critical temperature known as the lower critical solution temperature (LCST) [11]. 86
5
The most studied smart thermoresponsive polymer by far is poly(N-isopropylacrylamide) or 87
pNIPAAm [12-14], and it’s successful and broad application within biomedicine and 88
biotechnology is extensively documented [15-18]. pNIPAAm undergoes a sharp reversible 89
‘hydrophilic coil – hydrophobic globule’ phase transition in water at an LCST of 32–34 ºC 90
[12,13]. A large body of work on endowing chromatographic packing materials with 91
temperature switchable behavior, through their modification with e.g. pNIPAAm or 92
pNIPAAm copolymers, has appeared since the 1990s [19-24]. Most of this has involved 93
modification of small pored inorganic or hydrophobic (polystyrene based) chromatography 94
supports for use in analytical separations of small biomolecules (especially steroids). In stark 95
contrast, very little has been done on the modification of softer macroporous media for 96
preparative separations of much larger macromolecules, such as proteins. [22-24]. Maharjan 97
et al. [22] and subsequently we [23] grafted lightly cross-linked networks of poly(N-98
isopropylacrylamide-co-N-tert-butylacrylamide-co-acrylic acid) into the surfaces of cross-99
linked agarose supports to produce thermoresponsive cation exchangers (hereafter abbreviated 100
to thermoCEX). In tests with the thermally robust protein lactoferrin (LF) and jacketed 101
columns of thermoCEX media, LF previously adsorbed at a higher temperature could be 102
desorbed by lowering the mobile phase and column temperature. 103
104
To exploit thermoresponsive chromatography media more effectively, we invented a bespoke 105
column arrangement [23], the so-called Travelling Cooling Zone Reactor (TCZR). TCZR 106
chromatography employs a vertically held stainless steel walled column filled with 107
thermoresponsive stationary phase and a computer-controlled motor-driven Peltier cooling 108
device (the travelling cooling zone, TCZ) surrounding a discrete zone of the column (Fig. 1). 109
In standard operation, a protein feed is administered to the column at an elevated temperature. 110
On completion of the loading phase, the column is irrigated with an equilibration buffer 111
whilst simultaneously moving the TCZ along the full length of the separation column 112

6
(multiple times) in the direction of the mobile phase, and at a velocity lower than that of the 113
interstitial fluid. With each TCZ arrival at the end of the column, a sharp concentrated protein 114
peak appears in the exiting flow, which can be collected by means of a fraction collector. 115
116
In this second follow up study, we push the boundaries of the TCZR chromatography concept 117
further. From 3 different agarose base matrices, we construct and fully characterize 9 118
thermoCEX media varying in particle size, pore diameter, and copolymer composition, and 119
subsequently identify, from batch adsorption and batch mode TCZR chromatography, the 120
thermoCEX variant best suited for operation in TCZR modified columns. We then 121
demonstrate, for the first time, how TCZR can be operated in continuous mode, to accumulate 122
and concentrate a model binding protein (LF), and then separate the same target molecule 123
from a simple protein mixture. 124
125
2. Materials and methods 126
2.1 Materials 127
The base matrices, Sepharose CL-6B (Cat. no. 170160-01, Lot no. 10040943), Superose 6 128
Prep Grade (Cat. no. 17-0489-01, Lot. no. 10037732) and Superose 12 Prep Grade (Cat. 129
no.17-0536-01, Lot. no. 10057699) were all supplied by GE Healthcare Life Sciences (Little 130
Chalfont, Bucks, UK). The chemicals, N-isopropylacrylamide (Cat. no. 415324, 97%; 131
NIPAAm), N-tert-butylacrylamide (Cat. no. 411779, 97%; t-BAAm), acrylic acid (Cat. no. 132
147230, anhydrous, 99%, AAc), 2-ethoxy-1-ethoxycarbonyl-1,2-dihydroquinoline (Cat. no. 133
149837, ≥99%; EEDQ), 4,4′-azobis(4-cyanovaleric acid) (Cat. no. 11590, ≥98%; ACV), N,N-134
dimethylformamide (Cat. no. 270547, >99.9%; DMF), N,N′-methylenebisacrylamide (Cat. 135
No. 146072, 99%; MBAAm), epichlorohydrin (Cat. no. E1055, 99%; ECH), tetrahydrofuran 136
(Cat. no. 34865, >99%; THF), diethyl ether (Cat. no. 309966, >99.9%), sodium borohydride 137
(Cat. no. 71321, >99%) and sodium hydroxide (Cat. no. S5881, anhydrous, >98%) were 138

7
obtained from Sigma-Aldrich Company Ltd (Poole, Dorset, UK). Absolute ethanol (Cat. no. 139
E/0650DF/17, 99.8+%) and ammonia solution (Cat. no. A/3280/PB15, AR grade, 0.88 S.G., 140
35%) were acquired from Fisher Scientific UK Ltd (Loughborough, Leics, UK), and bottled 141
oxygen-free nitrogen gas was supplied by the British Oxygen Co Ltd (Windlesham, Surrey, 142
UK). Bovine whey lactoferrin (MLF-1, Lot. No. 12011506, ~96%) was a gift from Milei 143
GmbH (Leutkirch, Germany), and bovine serum albumin (BSA, Cat. No. A7906, lyophilized 144
powder, ≥98% by agarose gel electrophoresis) and ‘Blue Dextran MW 2,000,000’ (Cat. No. 145
D-5751) were purchased from Sigma-Aldrich. Di-sodium hydrogen phosphate (Cat. no. 146
4984.1, dihydrate, ≥99.5%) was from Carl Roth GmbH + Co. KG (Karlsruhe, Germany). 147
Disodium hydrogen phosphate (dihydrate, ≥99.5%) and sodium chloride (ACS reagent, 148
≥99.5%) were supplied by Carl Roth or Sigma-Aldrich, and citric acid monohydrate (≥99%) 149
and Coomassie Brilliant Blue R250 (C.I. 42660) were from Merck Millipore (Darmstadt, 150
Germany). Pre-cast 15% mini-PROTEAN® TGX™ gels and Precision Plus Protein All 151
Blue Standards were supplied by Bio-Rad Laboratories Inc. (Hercules, CA, USA). All other 152
chemicals not stated above were from Sigma-Aldrich or Merck Millipore. The water used in 153
all experiments was deionized and purified using a Milli-Q Ultrapure system (Merck 154
Millipore, Darmstadt, Germany. 155
156
2.2 Preparation of the thermoCEX media used in this work 157
For detailed descriptions of the procedures involved in the four step conversion of 158
underivatized beaded agarose chromatography supports into thermoCEX media, the reader is 159
referred to our previous study [23]. Exactly the same methods were applied here to three 160
different beaded agarose starting materials (i.e. Sepharose CL-6B, Superose 6 Prep Grade and 161
Superose 12 Prep Grade; see Tables 1 and 2). The first three steps of the conversion, i.e. 162
epoxy activation, amine capping and immobilization of the ACV radical initiator were 163
identically performed, but in the fourth and final ‘graft from’ polymerization step the initial 164
8
AAc monomer concentration entering reactions with ACV anchored supports was 165
systematically varied between 25 and 150 mM (equivalent to 2.5 to 13.5% of the total 166
monomer concentration), whilst maintaining fixed concentrations of all other monomers, i.e. 167
900 mM NIPAAm, 50 mM tBAAm, and 10 mM of the cross-linking monomer, MBAAm. For 168
point of comparison, the AAc concentration used in our previous study [23] was 50 mM 169
(corresponding to ~5% of the total monomer composition). 170
171
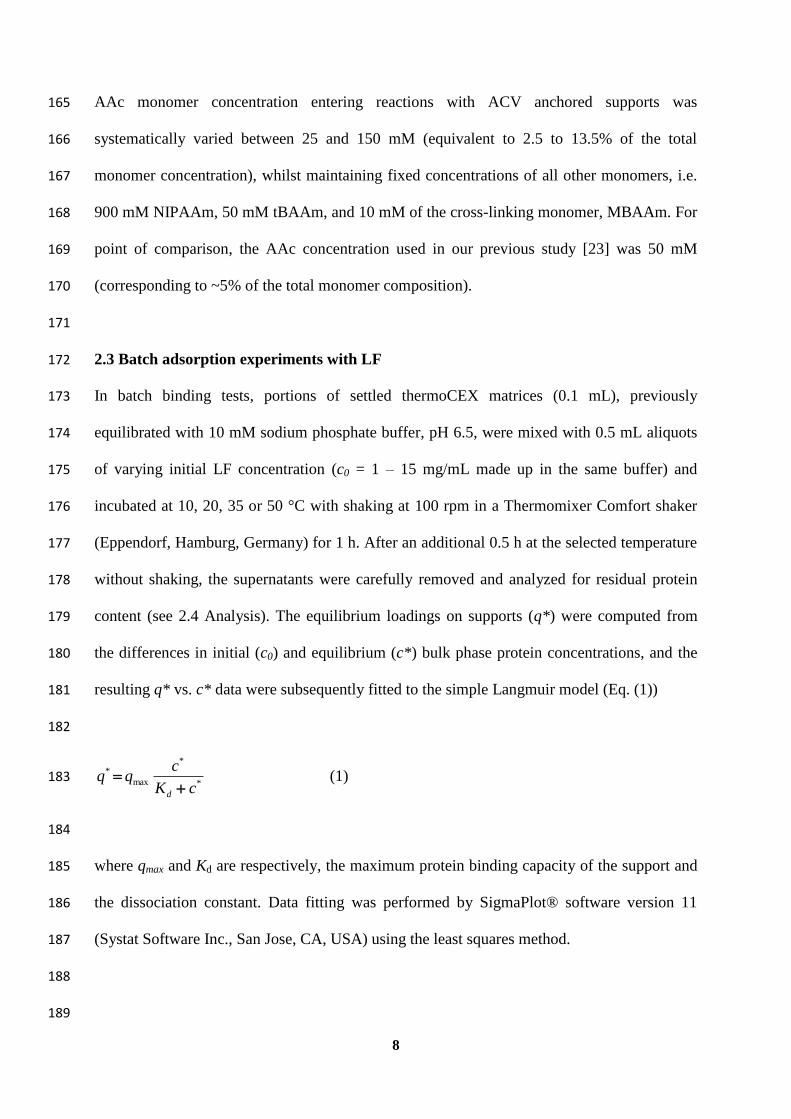
2.3 Batch adsorption experiments with LF 172
In batch binding tests, portions of settled thermoCEX matrices (0.1 mL), previously 173
equilibrated with 10 mM sodium phosphate buffer, pH 6.5, were mixed with 0.5 mL aliquots 174
of varying initial LF concentration (c0 = 1 – 15 mg/mL made up in the same buffer) and 175
incubated at 10, 20, 35 or 50 °C with shaking at 100 rpm in a Thermomixer Comfort shaker 176
(Eppendorf, Hamburg, Germany) for 1 h. After an additional 0.5 h at the selected temperature 177
without shaking, the supernatants were carefully removed and analyzed for residual protein 178
content (see 2.4 Analysis). The equilibrium loadings on supports (q*) were computed from 179
the differences in initial (c0) and equilibrium (c*) bulk phase protein concentrations, and the 180
resulting q* vs. c* data were subsequently fitted to the simple Langmuir model (Eq. (1)) 181
182
*
*
max
*
cK
cqq
d (1) 183
184
where qmax and Kd are respectively, the maximum protein binding capacity of the support and 185
the dissociation constant. Data fitting was performed by SigmaPlot® software version 11 186
(Systat Software Inc., San Jose, CA, USA) using the least squares method. 187
188
189
9
2.3. TCZR chromatography experiments 190
All chromatographic experiments were conducted using Travelling Cooling Zone Reactors 191
(TCZRs) connected to ÄKTA Purifier UPC 10 or Explorer 100 Air chromatography 192
workstations (GE Healthcare, Uppsala, Sweden) For detailed descriptions of the TCZR 193
arrangement, the reader is referred to our recent study [23]. A brief, but necessary description 194
of the workings of the system is given here. The TCZR set-up features four components, i.e. 195
(i) a temperature controlled box housing, (ii) the thermoresponsive stationary phase contained 196
in (iii) a stainless steel walled (1 mm thick) fixed-bed column (length = 10 cm; internal 197
diameter = 6 mm; volume = 2.83 mL), and (iv) a movable assembly of copper blocks and 198
Peltier elements surrounding a small discrete zone of the column. The whole cooling unit can 199
be moved up or down the column’s length via a ball bearing guided linear motorized axis, and 200
by adjusting the Peltier elements, the centre of the assembly can be cooled down by >20 °C. 201
In all of the work described here, the constant surrounding temperature was 35 °C, and the 202
velocity of the TCZ assembly (c) was the lowest attainable in the system (0.1 mm/s), 203
generating a maximum temperature difference of 22.6 °C corresponding to a minimum 204
temperature in the centre of the column of 12.4 °C extending across 2 cm of column length. 205
206
2.3.2 Batch mode TCZR chromatography of LF 207
LF (cf = 2 mg/mL) in an equilibration buffer of 10 mM sodium phosphate, pH 6.5 was 208
continuously applied to beds of thermoCEX media (packing factor = 1.2) until almost 209
complete breakthrough had been achieved in each case (i.e. c/cf approaching 1). At this point 210
the LF saturated columns were then washed with 5 CVs of equilibration buffer, before 211
moving the TCZ assembly multiple times (8 times in the case of thermoCEX-CL6B and 212
thermoCEX-S6pg, and 12 times for thermoCEX-S12pg) along the full separation column’s 213
length at its minimum velocity of 0.1 mm/s, generating a minimum temperature in the centre 214
of the column of 12.4 °C [23]. On completion of TCZ’s last movement residually bound LF 215
10
was dislodged from the columns using a 1 M NaCl step gradient. Constant mobile phase 216
velocities of 30 mL/h for the small particle sized Superose based thermoCEX media, or 60 217
mL/h for the larger Sepharose CL-6B derived thermoCEX adsorbent, were employed, giving 218
rise to interstitial velocities for the packed columns of thermoCEX-S6pg, thermoCEX-S12pg 219
and thermoCEX-CL6B of 0.70 mm/s, 0.84 mm/s and 1.89 mm/s respectively. The 220
percentages of LF in each of collected peaks were calculated by dividing the LF mass eluted 221
in each by the total mass of LF recovered in all of the elution peaks. 222
223
2.3.3 Continuous TCZR chromatography 224
In continuous chromatography experiments, feeds of LF (cf = 0.5 or 1 mg/mL) or ‘LF + BSA 225
(1 mg/mL of each) in 10 mM sodium phosphate equilibration buffer were continuously fed at 226
a temperature of 35 °C, and interstitial velocity of 0.74 mm/s on to a column filled with 227
thermoCEX-S6pg. During the first 2 h of operation the TCZ remained in its parking position 228
above the separation column, by which point the protein loading front had approached ~75% 229
of the column’s length. At this stage slow constant movement of the TCZ along the column 230
was initiated resulting in the first elution peak. At the applied velocity (vc = 0.1 mm/s) the 231
TCZ travelled down the column at less than a seventh the rate of the interstitial mobile phase 232
velocity. On reaching the base of the column, some ~20 minutes later, the elution peak left the 233
column, and the TCZ was once again moved, at high speed, to its parking position above the 234
column. Seven further movements of the TCZ along the column’s length were conducted in 235
each experiment at regular 80 minute intervals, i.e. after 200, 280, 360 440, 520, 600 and 680 236
minutes had elapsed. During the continuous application of the TCZR system, desorbed 237
proteins were fractionated after every movement of the TCZ. The fractionation started when 238
the UV adsorption at 280 nm in the effluent showed values above 100 mAu. The protein 239
peaks were collected and the protein concentration was determined. Residual bound protein 240
finally was eluted by an increase to 1 M of sodium chloride in the mobile phase. The 241
11
concentration factor (CFPeak,i) of every single protein peak i was determined by dividing the 242
protein peak concentration by the feed concentration (Eq. (2)): 243
244
f
iPeak
iPeakc
cCF
,
, (2) 245
246
where cPeak,i is the peak concentration of the respective fractionated protein peak. An averaged 247
concentration factor (CF) was determined by calculating the average of the peak 248
concentration factors when a steady-state was reached (Eq. (3)): 249
250
j
CFCF
iPeak
, (3) 251
252
where j is the number of fractionated protein peaks in a steady-state. By multiplying the 253
protein concentration of the fractions and the fraction volume, the eluted protein mass could 254
be calculated. 255
256
2.4 Analysis 257
The battery of methods employed to characterize the various thermoCEX adsorbents prepared 258
in this work, including all intermediates in their manufacture, are summarized briefly below 259
and described in detail elsewhere [23]. 260
261
Reactive epoxide contents introduced by activation with epichlorohydrin were determined as 262
described by Sundberg and Porath [25]. 263
264
12
For qualitative FT-IR analysis of solid supports, oven dried samples (~3 mg) were mixed with 265
potassium bromide (300 mg), ground down to a fine powder and hydraulically pressed (15 266
tonne) into tablet form. Each tablet was subjected to 64 scans (averaged at a resolution of 2 267
cm-1
) in a Nicolet 380 FT-IR (Thermo Fisher Scientific, Waltham, MA, USA) in direct beam 268
mode. Quantitative estimation of ‘NIPAAm + tBAAm’ consumption by supports during 269
grafting reactions, by monitoring changes in area of the characteristic peak for N-H bending 270
(1575 –1500 cm-1
), was performed on liquid samples (150 L) applied directly to the surface 271
of the Nicolet 30 FT-IR’s Smart 53 Orbit diamond accessory. The samples were scanned 64 272
times at a resolution of 2 cm-1
in attenuated total reflectance mode (ATR FT-IR). 273
274
Gravimetric analyses was used to determine the immobilized ACV and copolymer contents 275
on solid supports and also of dried residues recovered from liquid samples, to allow 276
determination of free ungrafted copolymer content and unreacted monomers remaining in 277
solution post-grafting. Free copolymers were separated from unreacted monomers by rotary 278
evaporating to dryness, resuspending in tetrahydrofuran, precipitating with diethyl ether and 279
oven drying, and unreacted monomers remaining in the supernatants were recovered by rotary 280
evaporating to dryness. 281
282
The relative amounts of NIPAAm and tBAAm in ungrafted copolymers were obtained by 283
proton NMR spectroscopic analysis of CDCl3 dissolved samples using a Bruker AV400 NMR 284
Spectrometer (Bruker-BioSpin Corporation, Billerica, MA, USA). ‘NIPAAm:tBAAm’ ratios 285
(Tables 1 & 2) were computed from characteristic chemical shifts in 1H NMR spectra at 1.15 286
ppm and 1.34 ppm for two strong methyl proton peaks arising from the NIPAAm and tBAAm 287
side chains respectively [22,23]. 288
289

13
Full temperature dependent ‘coil–globule’ transition profiles and lower critical solution 290
temperature (LCST) values for ungrafted copolymers were obtained by monitoring the optical 291
transmittance (at = 500 nm) of test solutions (0.5% w/v copolymer in 10 mM sodium 292
phosphate, pH 6.5) in a Cecil CE7500 UV/visible dual beam spectrometer equipped with a 293
water thermostatted cuvette holder. 294
295
H+ exchange capacities of supports were determined by titration using GE Healthcare’s 296
method for determination of the ionic capacity of CM Sepharose media (No. 30407). The void 297
volumes of packed beds of thermoCEX media were determined by SEC of Blue Dextran (50 298
L, 1 mg/mL) under non binding conditions, using an equilibrating and mobile phase of 50 299
mM Tris-HCl, pH 7.5 supplemented with 100 mM KCl. 300
301
The protein content in samples was spectrophotometrically assayed at a wavelength of 280 302
nm either off-line during batch binding experiments using a NanoDrop® ND-1000 303
Spectrophotometer (Thermo Fisher Scientific, Waltham, MA, USA) or quartz cuvettes in a 304
Lambda 20 UV-vis spectrophotometer (PerkinElmer Analytical Instruments, Shelton, CT, 305
USA), or on-line during chromatographic investigations using ÄKTA chromatography 306
workstations operated under Unicorn™ software (GE Healthcare, Uppsala, Sweden). 307
308
The composition of fractions generated during continuous TCZR chromatographic separation 309
of LF and BSA was examined by reducing SDS-PAGE [26] in 15% (w/v) pre-cast 310
polyacrylamide gels in a Mini-Protean Tetracell electrophoresis system (Bio-Rad 311
Laboratories, Hercules, CA, USA). After electrophoresis, gels were stained with 0.1% (w/v) 312
Coomassie Brilliant Blue R250, dissolved in 40% (v/v) ethanol and 10% (v/v) acetic acid) for 313
1 h at room temperature, and were subsequently destained at the same temperature in a 314
solution composed of 7.5% (v/v) acetic acid and 10% (v/v) ethanol. The LF and BSA contents 315
14
were determined by densitometric analysis of scanned TIFF images of appropriately loaded 316
Coomassie Blue stained gels following electrophoresis. The images were captured with an HP 317
ScanJet C7716A flat bed scanner (Hewlett-Packard Company, Palo Alto, CA, USA) at a 318
resolution of 2400 dpi, and analyzed using ImageJ software [27]. 319
320
3. Results and discussion 321
3.1 Concept of single-column continuous chromatography 322
Schematic concentration and loading profiles within the TCZR fitted column are illustrated in 323
Fig. 2 for the various operation phases. These are characterized by different positions of the 324
TCZ relative to the column. The profiles at three different positions of the TCZ are shown, 325
i.e.: (i) outside the column (Fig. 2a); and after travelling (ii) a quarter (Fig. 2b) and (iii) three-326
quarters (Fig. 2c) of the separation column’s length. When the TCZ is parked ‘outside’ (Fig 327
2a), the whole column is operated at an increased temperature (TB). Protein is continuously 328
loaded and binds to the adsorbent. In keeping with the binding strength of the protein to the 329
support at TB, sharp concentration and loading fronts of the protein propagate through the 330
system at a constant velocity, vpf (Eq. (4)): 331
332
c
q
uv
b
b
ipf
11
(4) 333
334
Here, vpf is a function of the slope of the isotherm, , the interstitial fluid velocity, ui, and the 335
phase ratio between the solid and liquid phases expressed by the bed voidage, εb, of the 336
column packing. 337
338
15
When the TCZ starts to move along the column, previously bound protein desorbs at the front 339
of the zone, resulting in a strong increase in mobile phase protein concentration (Fig. 2b, 340
lower trace). Because the TCZ’s velocity (vc) is slower than that of the mobile phase (i.e. vc < 341
ui), the flow transports the desorbed protein further along the column into the adjacent region, 342
which is still at the elevated temperature, TB. At TB, this increased protein concentration leads 343
to a corresponding rise in the local protein loading at this point within the column. When, 344
sometime later, the constantly moving TCZ reaches this ‘protein-laden’ part of the column, its 345
action desorbs the bound protein, resulting in an even larger surge in mobile phase protein 346
concentration. In essence, what results within the column, provided that mass transfer 347
limitations are small, are sharp concentration and loading waves formed in front of the 348
moving TCZ. The concentration of adsorbing species will be much higher than that in the 349
feed, and protein loading closely approaches the maximum capacity of the adsorbent. With 350
progressive movement of the TCZ along the column more and more protein is desorbed at its 351
front, to continuously supply the immediately flanking high temperature (TB) region (‘over-352
travelled’ column section) with an increasing protein challenge (Fig. 2c. lower trace). Given 353
that the adsorbent’s protein binding capacity cannot be exceeded (Fig. 2c, upper trace) the 354
protein concentration wave broadens (Fig. 2c, lower trace). 355
356
Closer scrutiny of the plots in Fig. 2 reveals further noteworthy features of the TCZR 357
principle highlighted as follows: 358
1. When the rate of progress of the feed concentration front along the column is slower than 359
that of the TCZ, an increasingly wide region of low protein loading and concentration forms 360
in the TCZ’s wake (compare Figs 2b & 2c). The extent of reduction in protein loading and 361
concentration, and therefore in effect the operational working capacity of the TCZR, are 362
determined by the TCZ’s efficiency in eluting the adsorbed protein. 363
16
2. When the protein wave cresting the TCZ reaches the column outlet, protein elutes in high 364
concentration. In the meantime, the protein feed is continuously applied at the other end of the 365
column (inlet), protein loading of the front section of the column attains equilibrium with the 366
feed, and once this loaded section reaches ~70% of the column length, another movement of 367
the TCZ is initiated, giving rise to a second elution peak, and so on and so forth. 368
3. Thus, by careful selection of both the velocity of the TCZ and the timing between 369
successive movements of the device, a quasi-stationary state operation should be attained, 370
where similar concentration and protein loading profiles are generated before every 371
movement of the TCZ. This confers unique capabilities on the TCZR system, namely the 372
possibility of continuously loading protein at one end of column whilst simultaneously 373
desorbing previously bound protein from the other, in a single-column installation without 374
need of additional steps of regeneration and/or equilibration. 375
376
3.2 Manufacture and characterization of thermoresponsive CEX adsorbents 377
Three types of beaded cross-linked agarose matrices (Sepharose CL-6B, Superose 6 Prep 378
Grade and Superose 12 Prep Grade) differing in particle diameter, agarose content and pore 379
size (see Tables 1 and 2) were fashioned into thermoCEX adsorbents in four successive steps, 380
i.e. epoxide activation, amine capping, ACV initiator immobilization and graft-from 381
polymerization using improved protocols detailed previously [23]. The initial composition of 382
monomers entering the final copolymer grafting step was systematically varied to create 383
families of thermoCEX materials with different balances of thermoresponsive, hydrophobic 384
and charged building blocks in the copolymers anchored to their exteriors and lining their 385
pores. The resulting thermoCEX adsorbents and intermediates in their manufacture (both 386
supports and reaction liquors) underwent rigorous qualitative and quantitative 387
phyiscochemical analysis prior to use. 388
389
17
FTIR spectra obtained during the stepwise conversion of Superose 6 Prep Grade into the 390
thermoCEX-S6pg adsorbent family are shown in Fig. 3. Identical sets of spectra were 391
obtained with Superose 12 Prep Grade and Sepharose CL-6B subjected to the same 392
procedures. During the various steps, the expected peaks previously assigned in converting 393
Sepharose CL-6B into a thermoresponsive cation exchanger [23], were also observed during 394
the manufacture of the Superose based thermoCEX media in this work. Of special note are: (i) 395
the growth in peak heights between 1474 and 1378 cm-1
in the spectrum of epoxy-activated 396
S6pg due to increased alkyl group content, consistent with incorporation of glycidyl moieties 397
into S6pg; (ii) sharpening and growth of the signal at 1378 cm-1
following amination of 398
epoxy-activated S6pg, likely arising from diminished flexibility, and therefore reduced 399
variance in the vibrational frequency of the CH2 groups in the backbone; (iii) the appearance 400
of two new peaks in the FTIR spectrum of ACV immobilized S6pg (1736 cm-1
for carboxylic 401
acid C=O stretching, and 1552 cm-1
for azo N=N stretching and/or amide N-H bending); the 402
growth of (iv) amide N–H bending (1570 cm-1
) and amide C=O stretching (1670 cm-1
) 403
contributions from incorporated NIPAAm, tBAAm and MBAAm units, and (v) of carboxylic 404
acid C=O stretching (1736 cm-1
), arising from the presence of AAc in the grafted copolymer 405
on the thermoCEX supports; and finally that (vi) despite marked differences in the 406
compositions of grafted copolymers on thermoCEX supports B1-B4 (see Table 2), their FTIR 407
spectra appear identical. 408
409
Analysis of the immobilized copolymer compositions of Sepharose CL-6B and Superose 410
based thermoCEX (Tables 1 and 2 respectively) illustrates marked differences. Under 411
identical reaction conditions, unique monomer consumption preferences appear to be 412
displayed by the different ACV-coupled supports. Compare supports ‘A2’, ‘B2’ and ‘C1’ for 413
example. When normalized against the initial monomer composition entering polymerization 414
reactions with ACV immobilized supports, ACV-immobilized Sepharose CL-6B consumed 415

18
tBAAm and AAc roughly equally (32.5% cf. 30.4%), and ~2.4 times more readily than 416
NIPAAm (13.2%); by contrast, ACV-coupled S6pg consumed tBAAm (33.5%) in >1.8 fold 417
preference to both AAc (19.0%) and NIPAAm (18.7%), whereas ACV-linked S12pg 418
consumed tBAAm (39.2%) ~1.5 and ~2.2 fold more readily than AAc (25.4%) and NIPAAm 419
(17.6%) respectively. Thus, despite the higher initial epoxide density (878 mol/g) driving 420
increased ACV immobilization (568 mol/g) and ~1.4 fold higher mass of grafted copolymer, 421
the ionic capacity of the thermoCEX-S6pg was 38% lower than that on thermoCEX-CL6B 422
(i.e. 293 cf. 469 mol/g dried support), whereas its NIPAAm and tBAAm contents had both 423
increased (by 42% and 3% respectively). We observed this phenomenon previously during 424
fabrication of thermoCEX adsorbents fashioned from ostensibly very similar cross-linked 6% 425
agarose media, and suggested that differences were likely linked to the epoxide densities 426
introduced in the first synthetic step, rather than to subtle chemical disparities between the 427
two base matrices [23]. Based on findings in this study with 15 support materials, i.e. 9 428
finished thermoCEX and 6 intermediates in their manufacture (Tables 1 & 2), we no longer 429
believe this to be the case. Though sharing agarose backbones and being subjected to identical 430
polymer modification reactions, it appears here that differences in proprietary modification 431
(principally cross linking) of the base matrix starting materials [29-33] influence the initial 432
epoxy activation level, subsequent immobilized initiator density, loading and composition of 433
grafted copolymer of the finished thermoCEX adsorbents. 434
435
Sepharose CL-6B is prepared by first reacting Sepharose 6B with 2,3-dibromopropanol under 436
strongly alkaline conditions and then desulphating post cross-linking, by reducing alkaline 437
hydrolysis, to give a cross-linked matrix with high hydrophilicity and very low content of 438
ionizable groups [30,33]. In the manufacture of Superose media, cross-linking to confer 439
rigidity occurs in two stages, i.e. initial priming reaction with a cocktail of long-chain bi- and 440
poly- functional epoxides in organic solvent, followed by cross-linking via short-chain bi-441
19
functional cross-linkers conducted in aqueous solvent [30,32]. Superose media are thus less 442
hydrophilic than Sepharose CL supports, and it is this fundamental difference that likely: (i) 443
contributes to the 30 – 50% greater number of immobilized oxiranes introduced into Superose 444
matrices (Table 2, 878 mol/g for S6pg, 1018 mol/g for S12pg) by epichlorohydrin 445
activation (step 1) under identical conditions cf. Sepharose CL-6B (Table 1, 662 mol/g); 446
leads in turn (ii) both to higher immobilized ACV contents (568 – 611 mol/g for S6pg, 878 447
mol/g for S12pg cf. 380 mol/g for Sepharose CL-6B) and elevated grafted polymer yields 448
(6005 ± 68 mol/g for ThermoCEX-Superose adsorbents cf. 4675 ± 97 mol/g for 449
ThermoCEX-CL6B); and (iii) significantly higher incorporation of the charged AAc 450
monomer into the grafted copolymers on ThermoCEX-CL6B cf. ThermoCEX adsorbents 451
fashioned from Superose media across all AAc input concentrations during grafting (see 452
Tables 1 and 2). 453
454
The temperature dependent phase transition behaviour of ungrafted free copolymer solutions 455
emanating from various grafting reactions with ACV-immobilized Sepharose CL-6B and 456
Superose Prep Grade are compared in Fig. 4. Figures 4a and 4b display the raw transmittance 457
vs. temperature profiles, and Fig. 4c examines the wider impact of NIPAAm replacement on 458
the LCST and full transition temperature ranges of the copolymers. 459
460
In accord with literature reports [12-14], the LCST at 50% optical transmittance (T50%) for the 461
‘smart’ homopolymer pNIPAAm was 32.3 °C and sharp transition from fully extended 462
‘hydrophilic coil’ (T90%) to fully collapsed ‘hydrophobic globule’ (T0.4%) occurred between 31 463
and 35 °C (dashed line traces in Figs 4 a-c). Copolymerizing NIPAAm with more 464
hydrophobic monomers leads to a reduction in the LCST [34,35], whereas incorporation of 465
more hydrophilic species increases it [34]. Here, simultaneous low level substitution of AAc 466

20
and tBAAm into pNIPAAm’s backbone (‘A1’, ‘B1’ & ‘C1’) at the expense of 12.1 to 16.9% 467
of its NIPAAm content (Tables 1 & 2), had the effect of lowering the LCST (by 1.4 °C for 468
‘A1’, 2.3 °C for ‘B1’, 1.5 °C for ‘B2’ and 0.9 °C for ‘C1’) and broadening the transition 469
temperature range in both directions (i.e. 28.3 to 36.7 °C for ‘A1’, 26.5 to 34.8 °C for ‘B1’, 470
26.5 to 37.7 °C for ‘B2’, and 28.5 to 36.8 °C for ‘C1’). With mounting NIPAAm replacement 471
(‘A3’, ‘A4’, ‘B3’, ‘B4’), smart thermoresponsive behaviour became increasingly 472
compromised. For example, the LCST for the ‘67.3:15.8:16.9’ copolymer (Fig. 4d, ‘A4’) 473
reached 36.6 °C and temperature range over which full ‘coil – globule’ transition range 474
extended >25 °C, i.e. from 20.5 to 46 °C. 475
476
3.3 Temperature dependent adsorption of LF on thermoCEX adsorbents 477
The optimum condition for an effective thermoresponsive adsorbent is one where the binding 478
of a given target is strongly temperature dependent; in the ideal case being effectively 479
switched ‘on’ (powerful adsorption) and ‘off’ (no adsorption) by a small change in bulk phase 480
temperature across the LCST of the thermoresponsive copolymer. In practice this has not 481
been achieved, i.e. the sharp ‘coil – globule’ transitions observed in free solution are not 482
mirrored by protein binding vs. temperature plots [22,23]. The collapse and extension of 483
surface-anchored thermoresponsive copolymer chains is considerably more constrained [36] 484
and complex [23,36,37] than that of the free untethered species. As a consequence, changes to 485
the binding interface in response to a thermal trigger are gradual in nature. 486
487
The effect of temperature on the maximum LF adsorption capacity (qmax) for all nine 488
thermoCEX supports is illustrated in Fig. 5. In all cases, qmax rose linearly with increase in 489
temperature over the examined range (10 – 50 °C), as the tethered copolymer networks 490
gradually transitioned from predominantly hydrophilic and fully extended low charge density 491
states (Fig. 1, bottom right) to increasingly flattened, hydrophobic and highly charged ones 492

21
(Fig. 1, top right), as the distance between neighboring charged AAc units within the 493
collapsed copolymer decreased and previously shielded/buried negative charges became 494
exposed [22]. However, the degree of thermoresponsiveness exhibited varied significantly 495
between and within each thermoCEX family, and a clear trend emerged. For the least 496
substituted supports in the Sepharose CL-6B and Superose 6pg thermoCEX families, i.e. ‘A1’ 497
(Fig. 5a, Table 1) and ‘B1’ (Fig. 5b, Table 2), LF binding capacity was strongly temperature 498
dependent (‘qmax, 50°C / qmax, 10°C’ ratios of 2.2 for ‘A1’ & 3.3 for ‘B1’), but low (qmax,50°C values 499
of <22 mg/mL for ‘B1’ and <27 mg/mL for ‘A1’). With increasing NIPAAm replacement by 500
hydrophobic tBAAm and negatively charged AAc monomers (‘A2’‘A3’‘A4’, Fig. 5a; 501
‘B2’‘B3’‘B4’; Fig. 5b), LF binding increased dramatically (qmax, 50°C rising to ~52 502
mg/mL for ‘B4’ and ~83 mg/mL for ‘A4’), but became increasingly temperature independent 503
(‘qmax, 50°C / qmax, 10°C’ ratios of 1.06 for A4 & 1.1 for ‘B4’), as the ability of the tethered 504
copolymers to transition between extended and collapsed states was lost. ThermoCEX 505
supports with moderate levels of NIPAAm replacement, i.e. ‘A2’, ‘B2’ & ‘C1’, displayed the 506
best combination of thermoresponsiveness and LF binding capacity (i.e. reasonable qmax, 50°C 507
and low qmax,10°C values), and were therefore selected for further study. 508
509
Fig. 6 shows adsorption isotherms obtained for the binding of LF to these at different 510
temperatures, and Table 3 presents the fitted Langmuir parameters. At the lowest temperature 511
of 10 °C, the binding of LF to all three thermoCEX adsorbents is rather weak (Kd values 512
between 0.82 and 4.8 mg/mL) and of low capacity (qmax values <17 mg/mL), but as the 513
temperature is gradually stepped up, the tightness and capacity of LF sorption rise strongly. 514
At the highest temperature of 50 °C, the paired values for qmax and tightness of binding (initial 515
slope, qmax/Kd) are 55.9 mg and 631 for support ‘A2’, 28.6 mg/mL and 168 for ‘B2’, and 44.7 516
mg/mL and 213 for support ‘C1’ (Table 3). An identical pattern of behaviour in response to 517
temperature (between 20 and 50 °C) was noted previously by Maharjan et al. [22] for a 518
22
thermoCEX support fashioned out of Sepharose 6 FF. The ranking of static LF binding 519
performance of this family of thermoCEX supports of ‘Sepharose CL-6B > Superose 12 Prep 520
Grade > Superose 6 Prep Grade > Sepharose 6 FF’ (initial slope values at 50 °C of 610, 213, 521
168 and 120 respectively) is not correlated with mass of copolymer attached (respectively 522
4177, 5495, 5733, 2060 mol/g dried support), nor the tBAAm content (respectively 501, 523
604, 516, 165 mol/g dried support), but rather with the support’s intrinsic ionic capacity (i.e. 524
469 mol > 391 mol > 293 mol > 154 mol H+/g dried support). 525
526
Figure 7 compares chromatographic profiles arising from batch TCZR chromatography of LF 527
on fixed beds of three thermoCEX manufactured under identical conditions from cross-linked 528
agarose base matrices differing in particle diameter and pore size (see Tables 1 & 2), i.e. 529
thermoCEX-CL6B ‘A2’ (Fig. 7a), thermoCEX-S6pg ‘B2’ (Fig. 7b) and thermoCEX-S12pg 530
‘C1’ (Fig. 7c). A striking similarity is instantly evident, namely that every movement of the 531
TCZ results in a sharp LF elution peak. Of greater importance, however, are the differences. 532
Following 8 movements of the TCZ along beds of the thermoCEX-CL6B ‘A2’ (Fig. 7a) and 533
thermoCEX-S6pg ‘B2’ (Fig. 7b), the percentages of eluted LF recovered in peaks ‘a’ to ‘h’ 534
combined were practically the same, i.e. 64.6% of that initially bound for thermoCEX-CL6B 535
‘A2’ cf. 67.1% for thermoCEX-S6pg ‘B2’. But whereas just over half (54.4%) of the 536
thermally eluted LF from all 8 peaks (‘a – h’) was recovered by the first movement of the 537
TCZ (peak ‘a’) along the thermoCEX-CL6B ‘A2’ column (Fig. 7a), peak ‘a’ accounted for 538
more three-quarters (76.6%) of the combined thermally eluted LF (a – h inclusive) from 539
thermoCEX-S6pg ‘B2’ (Fig. 7b). Twelve movements of the TCZ were employed during 540
TCZR chromatography on thermoCEX-S12pg ‘C1’. In this case, eluted LF recovered in peaks 541
‘a – l’ was just 58.3%, and the first movement of the TCZ accounted for only 17.5% of 542
combined thermally eluted LF (‘a – l’). 543
544
23
Achieving significantly higher LF desorption with a single movement of the TCZ, i.e. 545
approaching the 100% level, would require the absence of both mass transport limitations and 546
LF binding at the minimum column temperature of 12.4 °C. Clearly, neither condition 547
applies. Inspection of Fig. 6 and Table 3 confirm that LF is still able to bind to the 548
thermoCEX media at 10 °C albeit weakly, thus at 12.4 °C in the TCZR system some LF will 549
inevitably remain bound. Further, evidence of significant limitations on mass transport during 550
TCZR mediated elution (though noticeably less marked for thermoCEX-S6pg ‘B2’) is 551
provided by the observation that LF elution continued up to and including the last TCZ 552
movement for all three matrices (Fig. 7). Because the total amounts of LF eluted on 553
approaching equilibrium (after 8 movements of the TCZ) were essentially the same for 554
thermoCEX-CL6B ‘A2’ and thermoCEX-S6pg ‘B2’, the lower LF binding strength of 555
thermoCEX-S6pg ‘B2’ cannot adequately explain its improved LF recovery following the 556
first TCZ movement (peak ‘a’ in Figs 7 a & b). Instead, differences in particle size and pore 557
diameter (highlighted in Tables 1 & 2) manifested in form of pore diffusion limitation, likely 558
account for the significant disparity in % LF desorption observed following the first TCZ 559
movement along packed beds of the three different thermoCEX media, i.e. 76.6% for 560
thermoCEX-S6pg ‘B2’ cf. 55.4% for thermoCEX-CL6B ‘A2’ cf. 17.5% for thermoCEX-561
S12pg ‘C1’. 562
563
Consider the case of a target protein adsorbed close to the centre of a thermoCEX support 564
particle. If such a species is to be desorbed by the temperature change effected by the TCZ, it 565
must diffuse out of the support particle’s pores and into the mobile phase to be eluted from 566
the column. However, should the time required for this diffusion process be greater than the 567
TCZ’s contact time with the region of the column where the support resides, the target protein 568
will re-adsorb en route and hence will not contribute to the elution peak. The advantage of 569
smaller adsorbent particle diameters and adequately large pores for TCZR application with 570

24
protein adsorbates is therefore clear. Smaller particles dictate shorter diffusion paths, while 571
large pores provide less of an impediment to mass transfer of large macromolecules [38]. This 572
combination leads to reduced times for the diffusion process, culminating practically in fewer 573
numbers of movements of the TCZ to achieve a desired target desorption yield, and is 574
displayed best in this work by the Superose 6 Prep Grade based thermoCEX matrix. 575
576
3.4 Continuous protein accumulation experiments 577
In our first series of continuous TCZR chromatography experiments, the influence of the 578
target protein concentration (cf) on total system performance during continuous feeding and 8 579
movements of the TCZ along the column was examined using LF as the model binding 580
component and thermoCEX-S6pg ‘B2’ as the column packing material. Chromatograms 581
corresponding to continuous feeding of LF at 0.5 mg/mL and 1 mg/mL are shown in Figs 8a 582
and 8b respectively. In both cases, residual bound LF not desorbed by the TCZ was eluted 583
after the last movement by raising the mobile phase’s ionic strength. 584
585
Visual comparison of the 8 individual eluted peaks (a – g) within each chromatogram 586
suggests a certain time is required before the profiles and peak areas become uniform (i.e. 4 587
movements at cf = 0.5 mg/mL and 3 movements at cf = 1 mg/mL), and the quantitative 588
analysis in Table 4 confirms this. Quasi-stationary states are effectively reached from peaks 589
‘d’ (cf = 0.5 mg/mL) and ‘c’ (cf =1 mg/mL) onwards, where the mass of LF eluted in each 590
peak remains essentially constant (i.e. 14.2 ± 2.1 mg and 30.7 ± 1.3 mg for the low and high 591
LF feed concentrations respectively) and small traces of LF are lost in the flowthrough 592
between successive individual elution peaks (i.e. averages of 1.5 and 2.6 mg for low and high 593
LF feed conditions respectively). The observation that steady state was reached later, when 594
feeding the lower strength LF feed, merits explanation. Attaining a quasi-stationary condition 595
is only possible after the TCZ has completed its transit and the protein loading across the full 596

25
column length approaches equilibrium. Under such circumstances, the amount of protein 597
temporarily loaded at the elevated temperature TB, (with the TCZ parked outside, Fig. 2a) will 598
be constant. From this it follows that raising the protein concentration in the feed should 599
speed the acquisition of a steady state. 600
601
Another important parameter influenced by the protein concentration in feed is averaged 602
concentration factor, CF, (Eq. (3)) attainable during steady state operation. The CF reached 603
9.2 at cf = 0.5 mg/mL (Fig. 8a), but dropped to 7.9 on increasing the LF concentration in the 604
feed twofold (Fig. 8b). An explanation for the slight reduction in CF with increasing LF 605
concentration can be found in the isotherm describing LF adsorption to thermoCEX-S6pg 606
‘B2’ at 35 °C (Fig. 6b); i.e. isotherm starts to become non-linear between 0.5 and 1 mg LF per 607
mL. 608
609
3.5 Continuous separation of a binary protein mixture 610
The ability of TCZR to function continuously having been established (Fig. 8, Table 4), the 611
next step was to test TCZR’s feasibility to not only accumulate and concentrate a single target 612
protein, but to continuously separate it from a protein mixture. For this we employed a simple 613
binary protein mixture consisting 1 mg/mL LF and 1 mg/mL BSA in a 10 mM sodium 614
phosphate pH 6.5 buffer. At this pH the binding species LF carries an overall cationic charge, 615
whereas the BSA is negatively charged. The experiment was conducted in a similar manner 616
to the LF accumulation study reported above (Section 3.4, Fig. 8), and Fig. 9 shows the 617
chromatogram obtained. Shortly after applying the protein mix to the column, the UV signal 618
stepped steeply to ~350 mAU where it remained (first flowthrough pooled ‘a’) until directly 619
after the first of 8 individual movements of the TCZ (highlighted by shaded gray bars). Each 620
TCZ movement led immediately to a sharp (>2750 mAU) symmetrical elution peak, and the 621
UV signal of the flowthrough between each temperature mediated elution peak rapidly 622

26
returned to roughly constant threshold of ~500 mAU. Following the 8th
TCZ motion, 623
residually bound protein was desorbed from the column by a step change in ionic strength (S). 624
625
SDS-PAGE analysis of the feed (F), pooled flowthrough (c, e, g, i, k, m, o & q), peak (b, d, f, 626
h, j, l, n & p) and salt-stripped (S) fractions corresponding to the chromatogram in Fig. 9 is 627
presented in Fig. 10. Commercial BSA and LF were employed in this work, and neither 628
protein was subjected to further purification prior to use. Thus, the binary ‘LF+BSA’ mixture 629
used actually contained many additional species present in trace quantitites. Cation exchange 630
chromatography had been employed as the main purification step for the ~96% pure LF, and 631
all but one contaminant species observable in Fig. 10 (esp. noticeable in pool ‘S’) emanates 632
from this preparation. Only two species within the BSA preparation are observed in 633
Coomassie Blue stained electrophoretograms following SDS-PAGE, i.e. the 66.4 kDa 634
monomer accounting for >98% of the BSA content, and a much lower intensity 130.5 kDa 635
dimer contaminant. The intensities of the lower migrating BSA monomer and upper dimer 636
species remain constant across all flowthrough and peak fractions indicating their continued 637
presence in the mobile phase throughout the run. The early UV signal surge to 350 mAU in 638
Fig. 9 (flowthrough pool ‘a’) is primarily due to breakthrough of BSA (see Fig. 10, only a 639
small percentage of the feed’s LF is noted in pool ‘a’); the sharp strong peaks, on the other 640
hand, arise from the accumulation on and subsequent temperature mediated elution of LF 641
along with small traces of numerous contaminants of the LF preparation (Fig. 10) from the 642
adsorbent bed. The increase in UV signal from 350 mAU for the flowthrough pool ‘a’ to 500 643
mAU for all inter peak flowthroughs (pools c, e, g, i, k, m, o, & q) is due to LF leakage. The 644
addition of 1 mg/mL BSA to the 1 mg/mL LF feed did not disturb the time taken to attain 645
quasi-stationary state; in both cases this was reached from the third peak on (compare Figs 8b 646
and 9). However, the average eluted LF mass per peak and concentration factors were 647
significantly lower (i.e. 21.4 mg cf. 30.7 mg & CF = 6.3 cf. 7.9), and the loss of LF in the 648
27
flowthrough between successive elution peaks was much higher (12.2 cf. 2.6 mg). 649
Nevertheless, the mean purity of LF in eluted peaks was ~86%. 650
651
Reasons for impaired LF recovery in the presence of BSA are presently unclear. The presence 652
of small amounts of BSA in the NaCl stripped pool ‘S’ (Fig. 10) illustrates that a tiny fraction 653
of applied BSA had been adsorbed sufficiently strongly to resist desorption by 8 movements 654
of the TCZ. The occurrence of BSA in the strip fraction ‘S’ and unbound fractions (pools a, c, 655
e, g, i, k, m, o, & q) raises the possiblity of two or more distinct BSA species, i.e. those that 656
electrostatically repelled, and others that bind strongly and possibly unfold and spread on the 657
thermoCEX matrix at 35 °C. Such a scenario could occur were the distribution of exposed 658
hydrophobic and charged monomers within the collapsed copolymer non-uniform, such that 659
highly hydrophobic clusters or islands are created occupying a few percent of the overall 660
binding surface. In this instance a slight drop in the adsorbent’s LF binding capacity, but not 661
in its LF binding affinity, would be anticipated. 662
663
A more satisfactory explanation for the reduction in both LF binding strength and capacity in 664
the presence of BSA is fouling of binding interface by the lipids it carries. Long-chain free 665
fatty acids (FFAs) are found in many bioprocess liquors (e.g. fermentation broths), but their 666
influence on fouling of chromatography media and membrane units has gone largely ignored 667
owing to their low concentrations and poor solubility [39,40]. Serum albumin’s principal role 668
in vivo is to bind otherwise insoluble long-chain fatty acids released into the blood from 669
adipose cells and transport them within circulating plasma, and the effectiveness with which it 670
binds FFAs is highlighted by the fact that the solution concentration of a given long-chain 671
FFA can be increased as much 500 fold in its presence [41]. To date, most chromatographic 672
studies with BSA have employed commercial preparations substantially pure with respect to 673
protein, but not free of lipids. Procedures for delipidation of serum albumin usually involve 674
28
extraction with organic phases at elevated temperatures or sorption of free fatty acids (FFAs) 675
onto activated charcoal at elevated temperature under acidic–neutral conditions [41,42]. 676
Under the operating conditions employed here, i.e. mobile phase of pH 6.5, temperature of 35 677
°C, FFA binding to BSA is weak [42] and FFA solubility is comparatively high [40]; it is 678
conceivable that FFAs bind to and foul the copolymer binding surface, thereby reducing both 679
the adsorbent’s binding affinity and occupancy for LF. 680
681
4. Conclusions 682
The fabrication and detailed characterisation of porous beaded thermoCEX adsorbents 683
varying in particle size, pore dimensions and grafted poly(N-isopropylacrylamide-co-N-tert-684
butylacrylamide-co-acrylic acid) composition has been done for two main reasons, i.e. to (i) 685
challenge an earlier hypothesis [23] that intra-particle diffusion of desorbed protein out of the 686
support pores is the main parameter affecting TCZR performance; and (ii) identify an 687
effective adsorbent customized for TCZR chromatography. ThermoCEX matrices with 688
moderate levels of NIPAAm replacement (by N-tert-butylacrylamide and acrylic acid) 689
displayed the best combination of thermoresponsiveness and LF binding capacity. Head-to-690
head batch TCZR chromatography tests with LF and three such materials confirmed the 691
advantage of small particles with adequately sized pores, namely faster diffusion leading to 692
fewer numbers of TCZ movement to attain a set desorption yield. 693
694
Chromatographic separations of proteins are typically performed in batch mode requiring 695
sequential steps of equilibration, loading, washing elution and regeneration. Unless fully 696
optimized, a common feature is inefficient use of the separation medium. The switch from 697
batch to continuous operation promises several advantages, key of which is more efficient 698
utilization of the bed [43]. Several continuous chromatography formats have been developed 699
and applied for the separation of biomacromolecules thus far, including Continuous Annular 700

29
Chromatography [44], Continuous Radial Flow Chromatography [43], Simulated Moving Bed 701
in various guises [45-49], and Periodic Counter-current Chromatography [50]. The new 702
addition described here, Continuous Travelling Cooling Zone Reactor Chromatography, 703
employs a single column operated isocratically. The simplicity of its configuration 704
notwithstanding, the main benefits over batchwise operation include reduced solvent and 705
buffer component usage, time savings and increased productivity. The continuous steady state 706
accumulation on and regular cyclic elution of the thermostable basic protein, LF, from a fixed 707
bed of a thermoresponsive cation exchange adsorbent in the form of sharp uniformly sized 708
peaks has been demonstrated in this work. The time required to reach quasi steady state 709
operation and the degree of concentration attained on TCZ mediated elution appear inversely 710
related to the concentration of LF being continuously supplied to the bed. The addition of the 711
non-binding species, BSA, to the LF feed had unexpectedly deleterious effects on lactoferrin 712
accumulation and recovery; the latter being tentatively attributed to fouling of the thermoCEX 713
matrix by lipids carried into the feed by serum albumin. No evidence of temperature induced 714
protein unfolding during TCZR chromatography was observed in the current study, but it 715
remains a potential problem, especially for more thermolabile proteins. Non-NIPAAm based 716
thermoresponsive polymers tuned to transition at lower temperatures should mitigate this 717
concern [23,51]. 718
719
Currently, the primary limiters on TCZR system throughput come from the necessary use of 720
low flow rates – a direct consequence of the prevailing mass transfer limitations. In the 721
present example the sorbate, LF, must diffuse into and back out of individual thermoCEX 722
adsorbent beads within a period of ~3 minutes. A small particle diameter combined with 723
sufficiently large pores is necessary in this instance (hence Superose 6 Prep Grade’s 724
superiority over Sepharose CL-6B and Superose 12 Prep Grade), and the magnitude of the 725
interstitial fluid velocity is practically constrained to ~1 mm/s (i.e. ~10 times the TCZ’s 726
30
minimum speed of 0.1 mm/s). It should be possible to overcome the above issues by using 727
thermoresponsive adsorbents fashioned from either more pressure tolerant smaller uniformly 728
sized support particles with similar pore dimensions, or monolithic materials [51-53]. Future 729
work on TZCR will explore this tenet. 730
731
Acknowledgements 732
This work was funded by the European Framework 7 large scale integrating collaborative 733
project ‘Advanced Magnetic nano-particles Deliver Smart Processes and Products for Life’ 734
(MagPro2Life, CP-IP 229335-2). 735
736
References 737
[1] S.C. Goheen, B.M. Gibbins, Protein losses in ion-exchange and hydrophobic interaction 738
high-performance liquid chromatography, J. Chromatogr. A 890 (2000) 73 – 80. 739
[2] J.A. Asenjo, B.A. Andrews, Protein purification using chromatography: selection of type, 740
modelling and optimization of operating conditions, J. Molec. Recognit. 22 (2009) 65 – 76. 741
[3] G. Guiochon, Preparative liquid chromatography, J. Chromatogr. A 965 (2002) 129 – 161. 742
[4] Y. Shi, R. Xiang, C. Horvath, J.A. Wilkins, The role of liquid chromatography in 743
proteomics, J. Chromatogr. A 1053 (2004) 27 – 36. 744
[5] C.J. Venkatramani, Y. Zelechonok, An automated orthogonal two-dimensional liquid 745
chromatograph, Anal. Chem. 75 (2003) 3484 – 3494. 746
[6] D. Haidacher, A. Vailaya, C. Horváth, Temperature effects in hydrophobic interaction 747
chromatography, Proc. Nat. Acad. Sci. 93 (1996) 2290 – 2295. 748
[7] S. Hjertén, Some general aspects of hydrophobic interaction chromatography, J. 749
Chromatogr. 87 (1973) 325 – 331. 750
[8] J.A. Queiroz, C.T. Tomaz, J.M.S. Cabral, Hydrophobic interaction chromatography of 751
proteins, J. Biotechnol. 87 (2001) 143 – 159. 752
31
[9] R. Muca, W. Piatkowski, D. Antos, Altering efficiency of hydrophobic interaction 753
chromatography by combined salt and temperature effects, J. Chromatogr. A 1216 (2009) 754
6716-6727. 755
[10] R. Muca, W. Piatkowski, D. Antos, Effects of thermal heterogeneity in hydrophobic 756
interaction chromatography, J. Chromatogr. A 1216 (2009) 8712 – 8721. 757
[11] L. Taylor, D. Cerankowski, Preparation of films exhibiting a balanced temperature 758
dependence to permeation by aqueous solutions – a study of lower consolute behavior, J. 759
Polym. Sci., Part A: Polym. Chem. 13 (1975) 2551 – 2570. 760
[12] M. Heskins, J.E. Guillet, Solution properties of poly(N-isopropylacrylamide), J. 761
Macromolec. Sci. A 2 (1968) 1441 – 1455. 762
[13] K. Kubota, S. Fujishige, I. Ando, Single-chain transition of poly(N-isopropylacrylamide) 763
in water, J. Phys. Chem., 94 (1990) 5154 – 5158. 764
[14] H.G. Schild, Poly(N-isopropylacrylamide): Experiment, theory and application, Prog. 765
Polym. Sci. 17 (1992) 163 – 249. 766
[15] P. Maharjan, B.W. Woonton, L.E. Bennett, G.W. Smithers, K. DeSilva, M.T.W. Hearn, 767
Novel chromatographic separation – The potential of smart polymers, Innov. Food Sci. 768
Emerg. Technol. 9 (2008) 232 – 242. 769
[16] I.Y. Galaev, B. Matthiasson, 'Smart' polymers and what they could do in biotechnology 770
and medicine, Trends Biotechnol. 17 (1999) 335 – 340. 771
[17] A.S. Hoffman, P. Stayton, Bioconjugates of smart polymers and proteins: synthesis and 772
applications, Macromol. Symp. 207 (2004) 139 – 151. 773
[18] N. Matsuda, T. Shimizu, M. Yamato, T. Okano, Tissue Engineering based on cell sheet 774
technology, Adv. Mater. 19 (2007) 3089 – 3099. 775
[19] K. Hoshino, M. Taniguchi, T. Kitao, S. Morohashi, T. Sasakura, Preparation of a new 776
thermo-responsive adsorbent with maltose as a ligand and its application to affinity 777
precipitation, Biotechnol. Bioeng. 60 (1998) 568 – 579. 778
32
[20] H. Kanazawa, K. Yamamoto, Y. Matsushima, N. Takai, A. Kikuchi, Y. Sakurai, T. 779
Okano, Temperature-responsive chromatography using poly(N-isopropylacrylamide)-780
modified silica, Anal. Chem. 68 (1996) 100 – 105. 781
[21] K. Yamamoto, H. Kanazawa, Y. Matsushima, T. Nobuhara, A. Kikuchi, T. Okano, 782
Chromatogr. 21 (2000) 209 – 215. 783
[22] P. Maharjan, M.T. Hearn, W.R. Jackson, K. De Silva, B.W. Woonton, Development of a 784
temperature-responsive agarose-based ion-exchange chromatographic resin, J. Chromatogr. A 785
1216 (2009) 8722 – 8729. 786
[23] T.K.H. Müller, P. Cao, S. Ewert, J. Wohlgemuth, H. Liu, T.C. Willett, E. Theodosiou, 787
O.R.T. Thomas, M. Franzreb, Integrated system for temperature-controlled fast protein liquid 788
chromatography comprising improved copolymer modified beaded agarose adsorbents and a 789
travelling cooling zone reactor arrangement, J. Chromatogr. A 1285 (2013) 97 – 109. 790
[24] N.S. Terefe, O. Glagovskaia, K. De Silva, R. Stockmann, Application of stimuli 791
responsive polymers for sustainable ion exchange chromatography, Food Bioprod. Process. 792
92 (2014) 208 –225. 793
[25] L. Sundberg. J. Porath, Preparation of adsorbents for biospecific affinity 794
chromatography: I. Attachment of group-containing ligands to insoluble polymers by means 795
of bifunctional oxiranes, J. Chromatogr. 90 (1974) 87 – 98. 796
[26] U.K. Laemmli, Cleavage of structural proteins during the assembly of the head of 797
Bacteriophage T4, Nature (London) 227 (1970) 680 – 685. 798
[27] C.A. Schneider, W.S. Rasband, K.W. Eliceiri, NIH Image to ImageJ: 25 years of image 799
analysis, Nat. Methods 9 (2012) 671 – 675. 800
[28] M.D. Oza, R. Meena, K. Prasad, P. Paul, A.K. Siddhanta, Functional modification of 801
agarose: A facile synthesis of a fluorescent agarose–guanine derivative, Carbohydr. Polym. 81 802
(2010) 878 – 884. 803
33
[29] J. Porath, J.-C. Janson, T Låås, Agar derivatives for chromatography, electrophoresis and 804
gel-bound enzymes, J. Chromatogr. 60 (1971) 167 – 177. 805
[30] T. Andersson, M. Carlsson, L. Hagel, P.-A. Pernemalm, J.-C. Janson, Agarose-based 806
media for high-resolution gel filtration of biopolymers, J. Chromatogr. 326 (1985) 33 – 44. 807
[31] G.E.S. Lindgren, Method of cross-linking a porous polysaccharide gel, US Patent 808
4,973,683, Publication date: 11/27/1990. 809
[32] P.A. Pernemalm, M. Carlsson, G. Lindgren, Separation material and its preparation, 810
European Patent EP 0132244, Publication date: 12/17/1986. 811
[33] M. Andersson, M. Ramberg, B.-L. Johansson, The influence of the degree of cross-812
linking, type of ligand and support on the chemical stability of chromatography media 813
intended for protein purification, Process Biochem. 33 (1998) 47 – 55. 814
[34] A.S. Hoffman, P. Stayton, V. Bulmus, G. Chen, J. Chen, C. Cheung, A. Chilkoti, Z. 815
Ding, L. Dong, R. Fong, C.A. Lackey, C. J. Long,M. Miura, J.E. Morris, N. Murthy, Y. 816
Nabeshima, T.G. Park, O.W. Press, T. Shimoboji, S. Shoemaker, H.J. Yang, N. Monji, R.C. 817
Nowinski, C.A. Cole, J.H. Priest, J.M. Harris, K. Nakamae, T. Nishino, T. Miyata, Really 818
smart bioconjugates of smart polymers and receptor proteins, J. Biomed. Mater. Res. 52 819
(2000) 577 – 586. 820
[35] Y. Yoshimatsu, B.K. Lesel, Y. Yonamine, J.M. Beierle, Y. Hoshino, K.J. Shea, 821
Temperature-responsive “catch and release” of proteins by using multifunctional polymer-822
based nanoparticles, Angew. Chem. Int. Ed. 51 (2012) 2405 – 2408. 823
[36] M. Andersson, S. Hietala, H. Tenhu, S.L. Maunu, Polystyrene latex particles coated with 824
crosslinked poly(N-isopropylacrylamide), Colloid Polym. Sci. 284 (2006) 1255 – 1263 825
[37] K.N. Plunkett, Z., Xi, J.S. Moore, D.E. Leckband, PNIPAM chain collapse depends on 826
the molecular weight and grafting density Langmuir 22 (2006) 4259 – 4266. 827
34
[38] J.F. Langford, M.R. Schure, Y. Yao, S.F. Maloney, A.M. Lenhoff, Effects of pore 828
structure and molecular size on diffusion in chromatographic adsorbents, J. Chromatogr. A 829
1126 (2006) 95 – 106. 830
[39] J. Jin, S. Chhatre, N.J. Titchener-Hooker, D.G. Bracewell, Evaluation of the impact of 831
lipid fouling during the chromatographic purification of virus-like particles from 832
Saccharomyces cerevisiae, J. Chem. Technol. Biotechnol. 85 (2010) 209 – 215. 833
[39] J. Brinck, A.-S. Jönsson, B. Jönsson, J. Lindau, Influence of pH on the adsorptive fouling 834
of ultrafiltration membranes by fatty acid, J. Membr. Sci. 164 (2000) 187 – 194. 835
[41] A.A. Spector, K. John, J.E. Fletcher, Binding of long-chain fatty acids to bovine serum 836
albumin, J. Lipid Res. 10 (1969) 56 – 67. 837
[42] R. Chen, Removal of fatty acids from serum albumin by charcoal treatment removal of 838
fatty acids by charcoal treatment from serum albumin, J. Biol. Chem. 242 (1967) 173 – 181. 839
[43] M.C. Lay, C.J. Fee, J.E. Swan, Continuous radial flow chromatography of proteins, Food 840
Bioprod. Process. 84 (2006) 78 – 83. 841
[44] R. Giovanni, R. Freitag, Continuous isolation of plasmid DNA by annular 842
chromatography, Biotechnol. Bioeng. 77 (2002) 445 – 454. 843
[45] J. Andersson, B. Mattiasson, Simulated moving bed technology with a simplified 844
approach for protein purification: Separation of lactoperoxidase and lactoferrin from whey 845
protein concentrate, J. Chromatogr. A 1107 (2006) 88 – 95. 846
[46] B.J. Park, C.H. Lee, S. Mun, Y.M. Koo, Novel application of simulated moving bed 847
chromatography to protein refolding, Process Biochem. 41 (2006) 1072 – 1082. 848
[47] S. Palani, L. Gueorguieva, U. Rinas, A. Seidel-Morgenstern, G. Jayaraman, Recombinant 849
protein purification using gradient-assisted simulated moving bed hydrophobic interaction 850
chromatography. Part I: Selection of chromatographic system and estimation of adsorption 851
isotherms, J. Chromatogr. A 1218 (2011) 6396 – 6401. 852

35
[48] M. Bisschops, BioSMB™ Technology: Continuous Countercurrent Chromatography 853
Enabling a Fully Disposable Process, in: G. Subramanian (Ed.), Biopharmaceutical 854
Production Technology, Volume 1 & Volume 2Wiley-VCH Verlag GmbH & Co. KGaA, 855
Weinheim, Germany, 2012, pp. 769 – 791. 856
[49] M. Angarita, T. Mueller-Spaeth, D. Baur, R. Lievrouw, G. Lissens, M. Morbidelli, Twin-857
column CaptureSMB: A novel cyclic process for protein A affinity chromatography, J. 858
Chromatogr. A 1389 (2015) 85 – 95. 859
[50] R. Godawat, K. Brower, S. Jain, K. Konstantinov, F. Riske, V. Warikoo, Periodic 860
counter-current chromatography – design and operational considerations for integrated and 861
continuous purification of proteins, Biotechnol. J. 7 (2012) 1496 – 1508. 862
[51] N. Li, L. Qi, Y. Shen, Y. Li, Y. Chen, Thermoresponsive oligo(ethylene glycol)-based 863
polymer brushes on polymer monoliths for all-aqueous chromatography, ACS Appl. Mater. 864
Interfaces, 5 (2013) 12441 – 12448. 865
[52] E.C. Peters, F. Svec, J.M.J. Frechet, Thermally responsive rigid polymer monoliths, Adv. 866
Mater. 9 (1997) 630 – 632. 867
[53] K. Nagase, J. Kobayashi, A. Kikuchi, Y. Akiyama, H. Kanazawa, T. Okano, Thermally 868
modulated cationic copolymer brush on monolithic silica rods for high-speed separation of 869
acidic biomolecules, ACS Appl. Mater. Interfaces 5 (2013) 1442 – 1452. 870
871
36
Figure legends 872
873
Fig.1. Schematic illustration of the TCZR principle. A stainless steel column filled with 874
thermoresponsive copolymer modified chromatographic media is contained in a temperature-875
controlled environment at a value above the copolymer’s LCST. At this temperature 876
(indicated by red) the grafted thermoresponsive copolymer network exists in a collapsed and 877
highly charged state (top right) that affords high protein binding affinity. For elution a motor-878
driven Peltier cooling device, the travelling cooling zone or TCZ (shown as a turquoise ring), 879
is moved along the column’s full length at a velocity (vc) lower than that of the mobile phase. 880
Within the cooled zone (shown in blue) generated by the TCZ travels along the column, the 881
tethered thermoresponsive copolymer expands, the charge density drops (bottom right) and 882
bound protein detaches from the support surfaces and is carried away in the exiting mobile 883
phase. For more details the reader is referred to sections 2.3, 3.1 and 3.3 of the text. 884
885
Fig.2. Schematic illustrations of single protein loading (top) and concentration (bottom) 886
profiles at different stages during TCZR operation. The profiles correspond to three discrete 887
z/z0 positions (<0, 0.25, 0.75) of the TCZ illustrated by the gray shaded vertical bars, i.e.: (i) 888
parked outside the separation column resulting in conventional operation with slowly 889
progressing concentration and loading profiles; (ii) shortly after initiation of TCZ movement, 890
where a sharp concentration peak evolves just ahead of the TCZ; and (iii) as the TCZ nears 891
the end of its journey along the column. At this point, in addition to further protein 892
accumulation within the elution peak, new loading and concentration profiles arising from 893
constant feed flow at the column inlet become clearly visible. 894
895
Fig. 3. FT-IR spectra during the fabrication of thermoCEX-S6pg supports (B1-B4) 896
characterized in Table 2. All spectra are normalized for peak height at the ‘fingerprint’ 897
37
wavenumber for agarose of 930 cm-1
characteristic of 3,6 anhydro moiety [28], and functional 898
groups expected of cross-linked agarose [23,28] are identified on the spectrum for Superose 6 899
Prep Grade. 900
901
Fig. 4. Optical transmittance (500 nm) vs. temperature profiles for 0.5% (w/v) solutions of 902
ungrafted free poly(NIPAAm-co-tBAAm-co-AAc-co-MBAAm) arising during fabrication of 903
(a) Sepharose CL-6B and (b) Superose based thermoCEX supports (detailed in Tables 1 and 904
2), and (c) the influence of NIPAAm content on temperature transition behaviour of the 905
copolymers. The symbols in ‘c’ indicate the determined LCST values at 50% transmittance 906
(T50%), capped bars define the temperature range over which phase transition occurred, and 907
the lower dotted and upper dashed lines respectively delineate the temperatures at which full 908
collapse (T0.4%) and extension (T90%) of the copolymer chains occurred. Key: pNIPAAm (); 909
Sepharose CL6B series (A1 – , A2 – , A3 – , A4 – ); Superose series (B1 – , B2 – 910
, B3 – , B4 – , C1 – ). 911
912
Fig. 5. Effect of temperature on the maximum adsorption capacity (qmax) of LF on (a) 913
thermoCEX-CL-6B supports (open circles) and (b) thermoCEX-S6pg (filled black circles) 914
and thermoCEX-S12pg (filled gray circles). The asterisks next to supports ‘A2’, ‘B2’ and 915
‘C1’ indicate those initially selected for TCZR chromatography (Fig. 7). The solid lines 916
represent linear fits to the data. 917
918
Fig. 6. Equilibrium isotherms for the adsorption of LF to thermoCEX supports initially 919
selected for TCZR chromatography (Fig. 7) ‘A2’ (a), ‘B2’ (b) and ‘C1’ (c) at 10, 20, 35 and 920
50 °C. The solid lines through the data points represent fitted Langmuir curves with parameter 921
values presented in Table 3. 922
923

38
Fig. 7. Chromatograms arising from TCZR tests conducted with thermoCEX supports ‘A2’ 924
(a), ‘B2’ (b) and ‘C1’ (c), employing multiple movements of the TCZ at a velocity, vc, of 0.1 925
mm/s. Columns were saturated with LF (cf = 2 mg/mL) and washed at the binding 926
temperature (35°C) prior to initiating the first of eight (a & b) or twelve (c) sequential 927
movements of the TCZ. Unshaded regions indicate column operation at a temperature of 35 928
°C with the TCZ in its ‘parked’ position. Gray shaded zones indicate the periods when the 929
TCZ moves along the column. The solid and dashed lines represent the absorbance and 930
conductivity signals respectively. 931
932
Fig. 8. Chromatograms arising from TCZR tests conducted with thermoCEX support ‘B2’ 933
employing eight movements of the TCZ at a velocity, vc, of 0.1 mm/s. The columns were 934
continuously supplied with LF at concentrations cf of (a) 0.5 mg/mL and (b) 1.0 mg/mL. 935
Unshaded regions indicate column operation at a temperature of 35 °C with the TCZ ‘parked’. 936
Gray shaded zones indicate the periods when the TCZ moves along the column. The solid and 937
dashed lines represent the absorbance and conductivity signals respectively. 938
939
Fig. 9. Chromatogram arising from TCZR test conducted with thermoCEX support ‘B2’ 940
during continuous feeding of a binary protein mixture (1 mg/mL LF + 1 mg/mL BSA) and 941
movement of the TCZ at a velocity, vc, of 0.1 mm/s. Unshaded regions indicate column 942
operation at a temperature of 35 °C with the TCZ ‘parked’. Gray shaded zones indicate the 943
periods when the TCZ moves along the column. The solid and dashed lines represent the 944
absorbance and conductivity signals respectively. SDS-PAGE analysis of pooled flowthrough 945
(a, c, e, g, i, k, m, o & q); peak (b, d, f, h, j, l, n & p) and salt-stripped (S) fractions are shown 946
in Fig. 10. 947
948

39
Fig. 10. Reducing SDS 15% (w/v) polyacrylamide gel electrophoretogram corresponding to 949
the chromatogram shown in Fig. 9. Key: molecular weight markers (M); feed (F); 950
flowthrough fractions (a, c, e, g, i, k, m, o & q); peak fractions (b, d, f, h, j, l, n & p); and salt-951
stripped fraction (S). 952
953
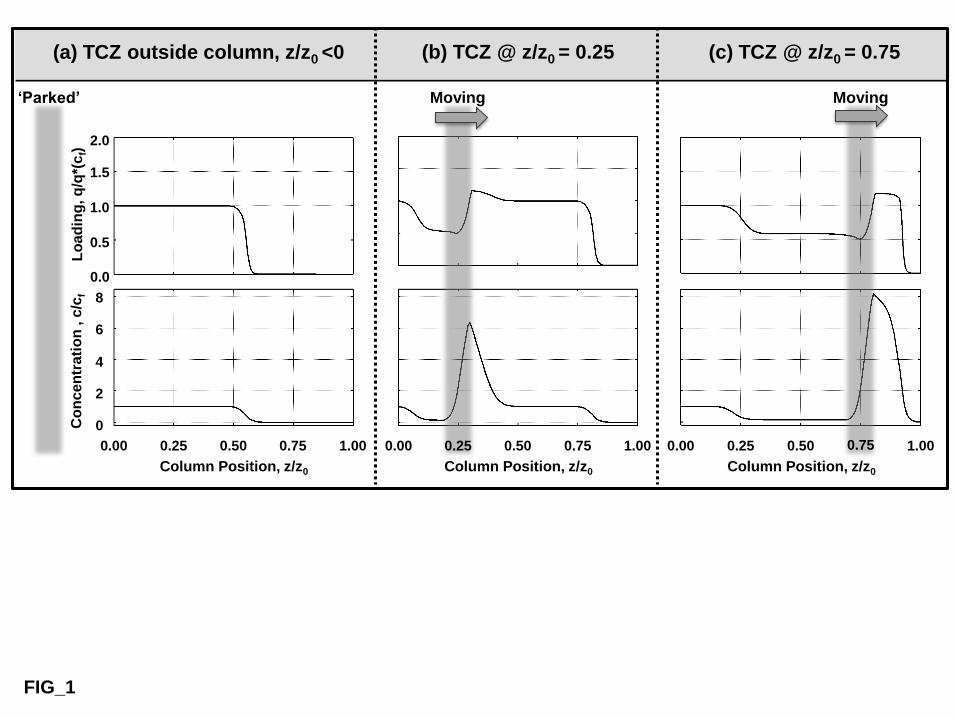
FIG_1
(a) TCZ outside column, z/z0 <0
Column Position, z/z0
(c) TCZ @ z/z0 = 0.75 (b) TCZ @ z/z0 = 0.25 C
on
ce
ntr
ati
on
, c
/cf
Lo
ad
ing
, q
/q*(
cf) 2.0
0.0
8
1.0
4
0
2
6
1.5
0.5
0.00 1.00 0.00 1.00 0.75 0.50 0.25 0.00
Moving ‘Parked’ Moving
Column Position, z/z0
0.75 0.50 0.25
Column Position, z/z0
1.00 0.75 0.50 0.25

1800 1600 1400 1200 1000 800 600
15701670
1460
1736
1552
1653
1474
1419
1383
1190
1152
1064
1042
B4
B1
B3
B2
Superose 6 Prep Grade
ThermoCEX
(S6pg series)
ACV immobilized
Amine terminated
Epoxy activated
Ab
so
rba
nc
e
Wavenumber (cm-1
)
930
FIG_2

66 68 70 72 74 76 78 80 82 84 86 88 98 10020
25
30
35
40
45
Te
mp
era
ture
(oC
)
NIPAAm content (%)
b
c
a
A4A3A2A1
20 25 30 35 40 45 50
1
10
100
T
ran
sm
itta
nce
(%
)
Temperature (oC)
B4
B3
B2
C1
B1
C1
B4B3
B2B1
A2 A1A3
A4
20 25 30 35 40 45 50
1
10
100
Tra
ns
mit
tan
ce
(%
)Temperature (
oC)
FIG_3

0 10 20 30 40 50 600
15
30
45
60
75
90
B2*
qm
ax (
mg
/mL
)
Temperature (oC)
B4
C1*
B1
B3
A4
A2*
A1
A3
a b0 10 20 30 40 50 60
0
10
20
30
40
50
60
qm
ax (
mg
/mL
)
Temperature (oC)
FIG_4
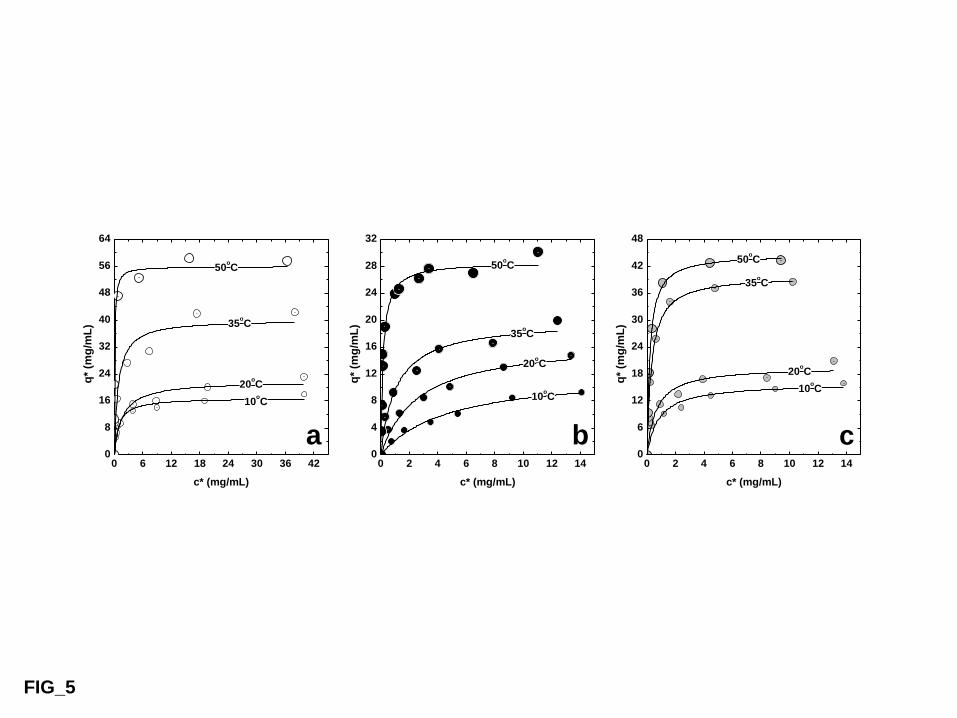
0 6 12 18 24 30 36 420
8
16
24
32
40
48
56
64
10oC
20oC
35oC
20oC
10oC
35oC
35oC
50oC
50oC50
oC
q*
(mg
/mL
)
c* (mg/mL)
0 2 4 6 8 10 12 140
4
8
12
16
20
24
28
32
b ca
q*
(mg
/mL
)
c* (mg/mL)
0 2 4 6 8 10 12 140
6
12
18
24
30
36
42
48
10oC
20oC
q*
(mg
/mL
)
c* (mg/mL)
FIG_5
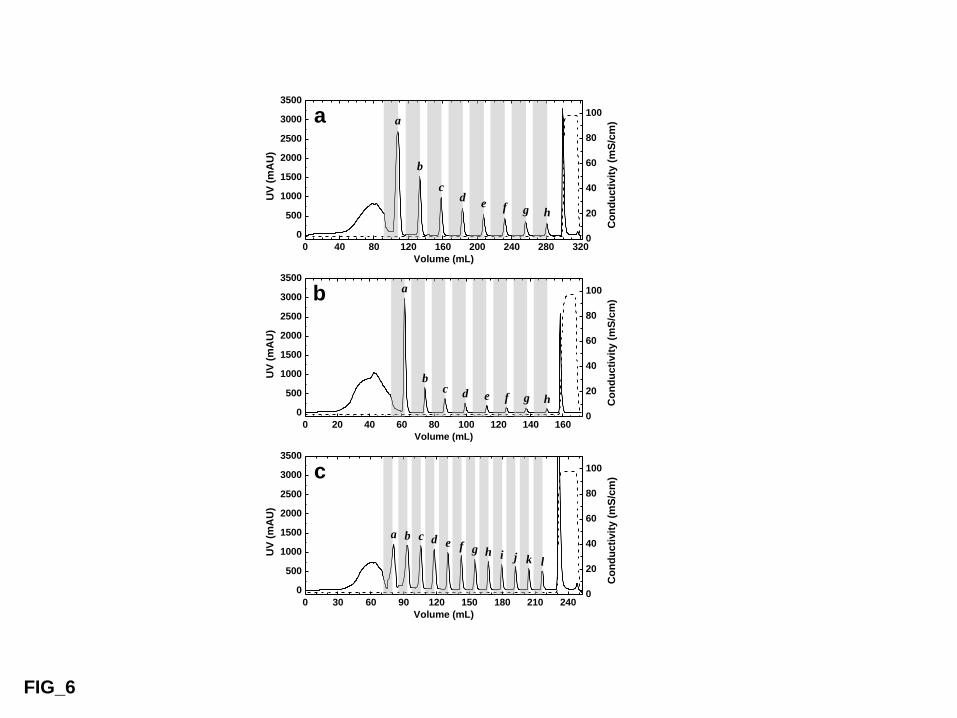
0 30 60 90 120 150 180 210 240
0
500
1000
1500
2000
2500
3000
3500
0
20
40
60
80
100
0
20
40
60
80
100
0
20
40
60
80
100
UV
(m
AU
)
Volume (mL) C
on
du
cti
vit
y (
mS
/cm
)
0 20 40 60 80 100 120 140 160
0
500
1000
1500
2000
2500
3000
3500
U
V (
mA
U)
Volume (mL)
0 40 80 120 160 200 240 280 320
0
500
1000
1500
2000
2500
3000
3500
c
b
UV
(m
AU
)Volume (mL)
a
Co
nd
ucti
vit
y (
mS
/cm
) C
on
du
cti
vit
y (
mS
/cm
)
a f
b c d e g h i j k l
a
b
c d
e f g h
b c d e f g h
a
FIG_6
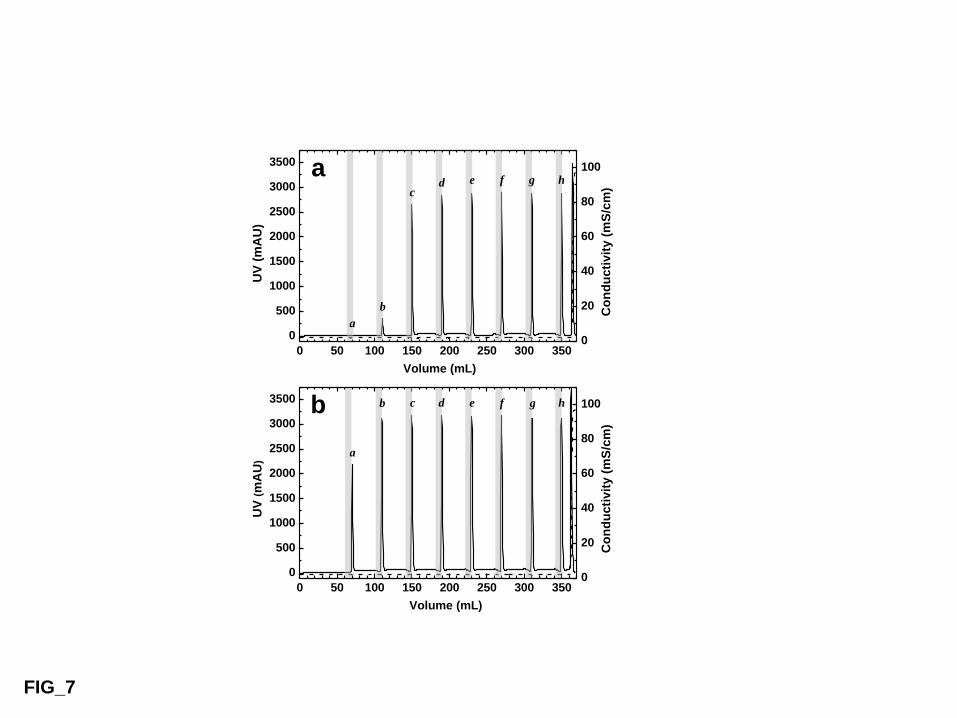
0 50 100 150 200 250 300 350
0
500
1000
1500
2000
2500
3000
3500
0
20
40
60
80
100
0
20
40
60
80
100
UV
(m
AU
)
Volume (mL)
b
Co
nd
ucti
vit
y (
mS
/cm
)
0 50 100 150 200 250 300 350
0
500
1000
1500
2000
2500
3000
3500 a
Volume (mL)
UV
(m
AU
)
Co
nd
ucti
vit
y (
mS
/cm
)
a
b
c d e f g h
a
b c d e f g h
FIG_7
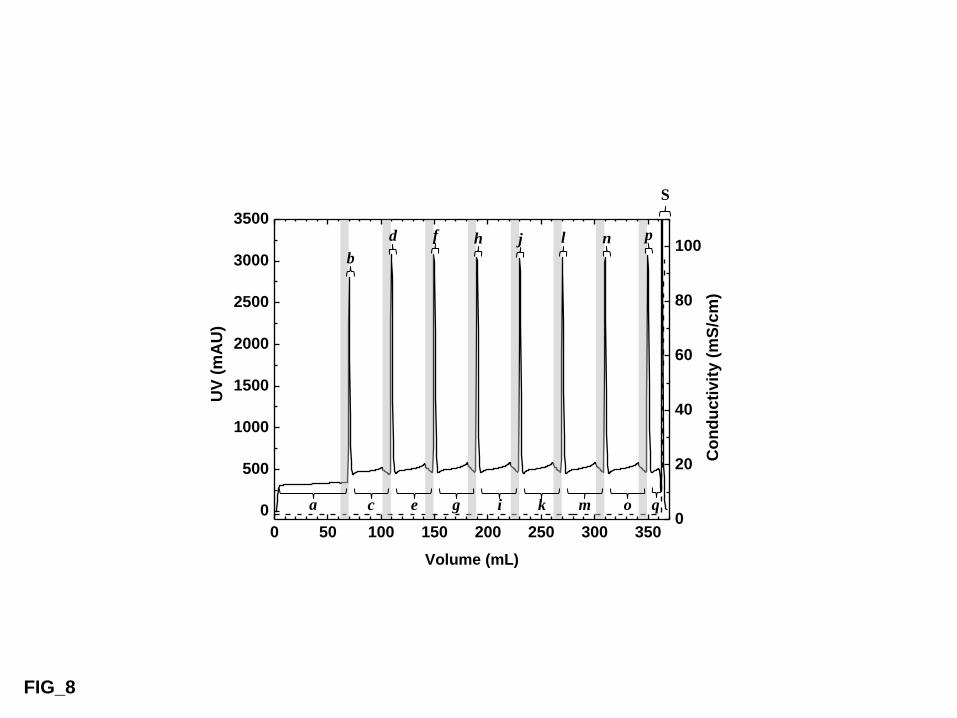
0 50 100 150 200 250 300 350
0
500
1000
1500
2000
2500
3000
3500
0
20
40
60
80
100
UV
(m
AU
)
Volume (mL)
Co
nd
ucti
vit
y (
mS
/cm
)
a c e g i k m o
b
d f h j l n p
S
q
FIG_8

250
130 100
55
35
25
15
10
F a b c d e f g h i j k l m M n o p q S
70 LF
kDa
BSA dimer
BSA monomer
FIG_9

Table 1. Characterization of the Sepharose CL6B based thermoCEX supports prepared and used in this work. See text for details.
Parameter ThermoCEX-CL-6B
Support ID A1 A2 A3 A4
Base matrix Sepharose CL-6B (lot 10061497)
Particle size distribution 45 – 165 m (98%)
Globular protein fractionation range, Mr 1 ×10⁴ – 4 ×10
6 Da
Step 1. Immobilized oxirane content (mol/g dried support) a 662
Step 3. Immobilised ACV content (mol/g dried support) b 380
Step 4. Free monomers entering reaction:
‘NIPAAm:tBAAm:AAc’ (mM) 900:50:25 900:50:50 900:50:100 900:50:150
‘NIPAAm:tBAAm:AAc’ ratio 90:5:2.5 90:5:5 90:5:10 90:5:15
Immobilized copolymer composition of thermoCEX support:
‘NIPAAm + tBAAm’ content (mol/g dried support) b,c
4227 4177 4131 3974
‘NIPAAm:tBAAm’ ratiod 90:10 88:12 85:15 81:19
NIPAAm content (mol/g dried support) 3804 3676 3511 3219
tBAAm content (mol/g dried support) 423 501 620 755
Ion exchange capacity (mol H+/g dried support)
e 330 469 582 811
‘pNIPAAm + tBAAm + AAc’ content (mol/g dried support) 4557 4646 4713 4785
‘NIPAAm:tBAAm:AAc’ ratio 83.5:9.3:7.2 79.1:10.8:10.1 74.5:13.2:12.3 67.3:15.8:16.9
% monomer consumed by support:
NIPAAm + tBAAm + AAc 15.1 15.0 14.5 14.1
NIPAAm 13.7 13.2 12.6 11.6
tBAAm 27.4 32.5 40.2 49.0
AAc 42.8 30.4 18.9 17.5
Key: Determined by: aoxirane ring opening reaction followed by titration [25];
bgravimetric measurement;
cATR-FTIR spectrometry of
supernatant samples before and after polymerization reactions, dProton NMR of the ungrafted free copolymer in CDCl3;
etitration.

Table 2. Characterization of the Superose 6 and 12 based thermoCEX supports prepared and used in this work. See text for details.
Parameter ThermoCEX-S6pg ThermoCEX-S12pg
Support ID B1 B2 B3 B4 C1
Base matrix Superose 6 Prep Grade (lot 10037732) Superose 12 Prep
Grade (lot 10057699)
Particle size distribution 20 – 40 m (83%) 20 – 40 m (88%)
Globular protein fractionation range, Mr 5 ×10³ – 5 ×10
6 Da 1 ×10
3 – 3 ×10
5 Da
Step 1 Immobilized oxirane content (mol/g dried support) a 878 1018
Step 3. Immobilised ACV content (mol/g dried support) b 568 611
Step 4. Free monomers entering reaction:
‘NIPAAm:tBAAm:AAc’ (mM) 900:50:25 900:50:50 900:50:100 900:50:150 900:50:50
‘NIPAAm:tBAAm:AAc’ ratio 90:5:2.5 90:5:5 90:5:10 90:5:15 90:5:5
Immobilized copolymer composition of thermoCEX support:
‘NIPAAm + tBAAm’ content (mol/g dried support) b,c
5745 5733 5659 5641 5495
‘NIPAAm:tBAAm’ ratiod 92:8 91:9 87:13 84:16 89:11
NIPAAm content (mol/g dried support) 5285 5217 4923 4738 4891
tBAAm content (mol/g dried support) 460 516 736 903 604
Ion exchange capacity (mol H+/g dried support)
e 268 293 382 416 391
‘NIPAAm + tBAAm + AAc’ content (mol/g dried support) 6013 6026 6041 6057 5886
‘NIPAAm:tBAAm:AAc’ ratio 87.9:7.6:4.5 86.6:8.5:4.9 81.5:12.2:6.3 78.2:14.9:6.9 83.1:10.3:6.6
% monomer consumed by support:
NIPAAm + tBAAm + AAc 19.9 19.5 18.6 17.8 19.1
NIPAAm 19.0 18.7 17.6 17.0 17.6
tBAAm 29.8 33.5 47.7 58.5 39.2
AAc 34.8 19.0 12.4 9.0 25.4
Key: Determined by: aoxirane ring opening reaction followed by titration [25];
bgravimetric measurement;
cATR-FTIR spectrometry of
supernatant samples before and after polymerization reactions, dProton NMR of the ungrafted free copolymer in CDCl3;
etitration.
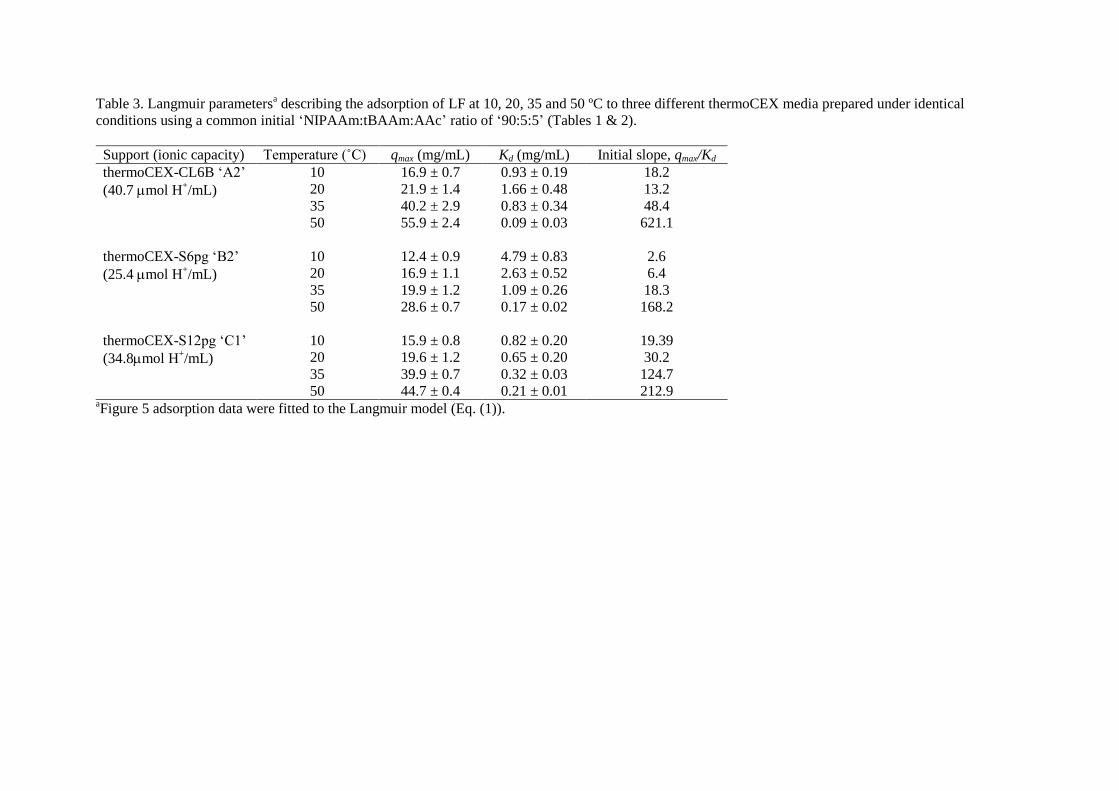
Table 3. Langmuir parametersa describing the adsorption of LF at 10, 20, 35 and 50 ºC to three different thermoCEX media prepared under identical
conditions using a common initial ‘NIPAAm:tBAAm:AAc’ ratio of ‘90:5:5’ (Tables 1 & 2).
Support (ionic capacity) Temperature (˚C) qmax (mg/mL) Kd (mg/mL) Initial slope, qmax/Kd
thermoCEX-CL6B ‘A2’
(40.7 mol H+/mL)
10 16.9 ± 0.7 0.93 ± 0.19 18.2
20 21.9 ± 1.4 1.66 ± 0.48 13.2
35 40.2 ± 2.9 0.83 ± 0.34 48.4
50 55.9 ± 2.4 0.09 ± 0.03 621.1
thermoCEX-S6pg ‘B2’
(25.4 mol H+/mL)
10 12.4 ± 0.9 4.79 ± 0.83 2.6
20 16.9 ± 1.1 2.63 ± 0.52 6.4
35 19.9 ± 1.2 1.09 ± 0.26 18.3
50 28.6 ± 0.7 0.17 ± 0.02 168.2
thermoCEX-S12pg ‘C1’
(34.8mol H+/mL)
10 15.9 ± 0.8 0.82 ± 0.20 19.39
20 19.6 ± 1.2 0.65 ± 0.20 30.2
35 39.9 ± 0.7 0.32 ± 0.03 124.7
50 44.7 ± 0.4 0.21 ± 0.01 212.9 aFigure 5 adsorption data were fitted to the Langmuir model (Eq. (1)).

Table 4. LF contents in peaks a – h obtained following eight sequential movements of the cooling zone during
continuous feeding of LF (cf = 0.5 and 1 mg/mL) to a column filled with the thermoCEX-S6pg ‘B2’ matrix (see
Table 2).
LF concentration in feed (mg/mL) LF content (mg) in peak:
a b c d e f g h
0.5 0.0 1.46 10.5 12.3 13.4 14.5 17.8 13.2
1.0 7.54 28.9 31.3 31.2 31.4 30.6 31.7 28.1