integrated report 2019 - 長瀬産業株式会社 · financial and corporate information 64...
TRANSCRIPT

https://www.nagase.co.jp/english/
Osaka Head Office : 1-1-17, Shinmachi, Nishi-ku, Osaka City, Osaka 550-8668, Japan Tel: (81) 6-6535-2114
: 5-1, Nihonbashi-Kobunacho, Chuo-ku, Tokyo 103-8355, Japan Tel: (81) 3-3665-3021
: 3-14-18, Marunouchi, Naka-ku, Nagoya City, Aichi 460-8560, Japan Tel: (81) 52-963-5615
Tokyo Head Office
Nagoya Branch Office
Printed in Japan
Integrated Report 2019
Introduction
2 Management Philosophy and the NAGASE Vision
4 Evolving Our Business Model —The Group’s Changes and Challenges—
6 Overview of the NAGASE Group
8 At a Glance
Foundation for Value Creation
10 13-Year Financial Highlights
12 Our Value Creation Process and Long-Term Management Policy
14 Business Designer: 8 Case Studies
Strategy
16 Message from the President
22 Message from the Executive Officer in Charge of Corporate Administration and Affiliates
26 Mid-Term Management Plan ACE-2020
About this Report Contents
The NAGASE Group has created this integrated report to help our diverse stakeholders better understand the Group’s wide-ranging business fields and business activities, as well as its unique value creation process. Going forward, we will continue to improve this report as a communication tool for conveying the Group’s corporate value enhancement activities in an easy to understand manner.
Referenced GuidelinesIn creating this report, we referred to the International Integrated Reporting Framework issued by the International Integrated Reporting Council.
Period CoveredApril 2018–March 2019 (FY2018). Some information after March 2019 is also included.
Organizations CoveredNAGASE & CO., LTD. and the NAGASE Group
Other InformationNAGASE’s website: https://www.nagase.co.jp/english/
Forward-Looking StatementsNon-historic information contained in this integrated report related to NAGASE Group revenue and profit plans, strategies, assumptions, etc., are forward-looking statements that entail elements of risk and uncertainty. Actual earnings may differ significantly from forecasts due to changes in these elements. Accordingly, the reader is cautioned to refrain from plac-ing undue reliance on such future forecasts contained in this document. Elements that could impact earnings results are not necessarily limited to those explicitly noted in this document.
Sustainability
28 Our Board
30 Corporate Governance
34 Interview with the Outside Directors —Dialogue for Value Creation—
36 Risk Management
40 Environment
42 Society
Business Portfolio
46 Functional Materials
48 Advanced Materials & Processing
50 Electronics
52 Mobility & Energy
54 Life & Healthcare
56 Global Network
58 Nagase ChemteX Corporation
59 Hayashibara Co., Ltd.
60 Nagase Business Expert Co., Ltd.
61 NVC (New Value Creation) Office
62 Nagase R&D Center
63 Nagase Application Workshop
Financial and Corporate Information
64 Management’s Discussion and Analysis of Operations and Finances
72 Consolidated Financial Statements
98 Consolidated Subsidiaries, Affiliates and Others
102 Corporate Information
103 Investor Information
Bringing it all togetherPeople, things, information, technology, ideas, world, and time.
The NAGASE Group Slogan embodies the idea of bringing
infinite possibilities together.
Financial and Corporate Information
Introduction SustainabilityFoundation for Value Creation
Strategy Business Portfolio
1NAGASE Group Integrated Report 2019
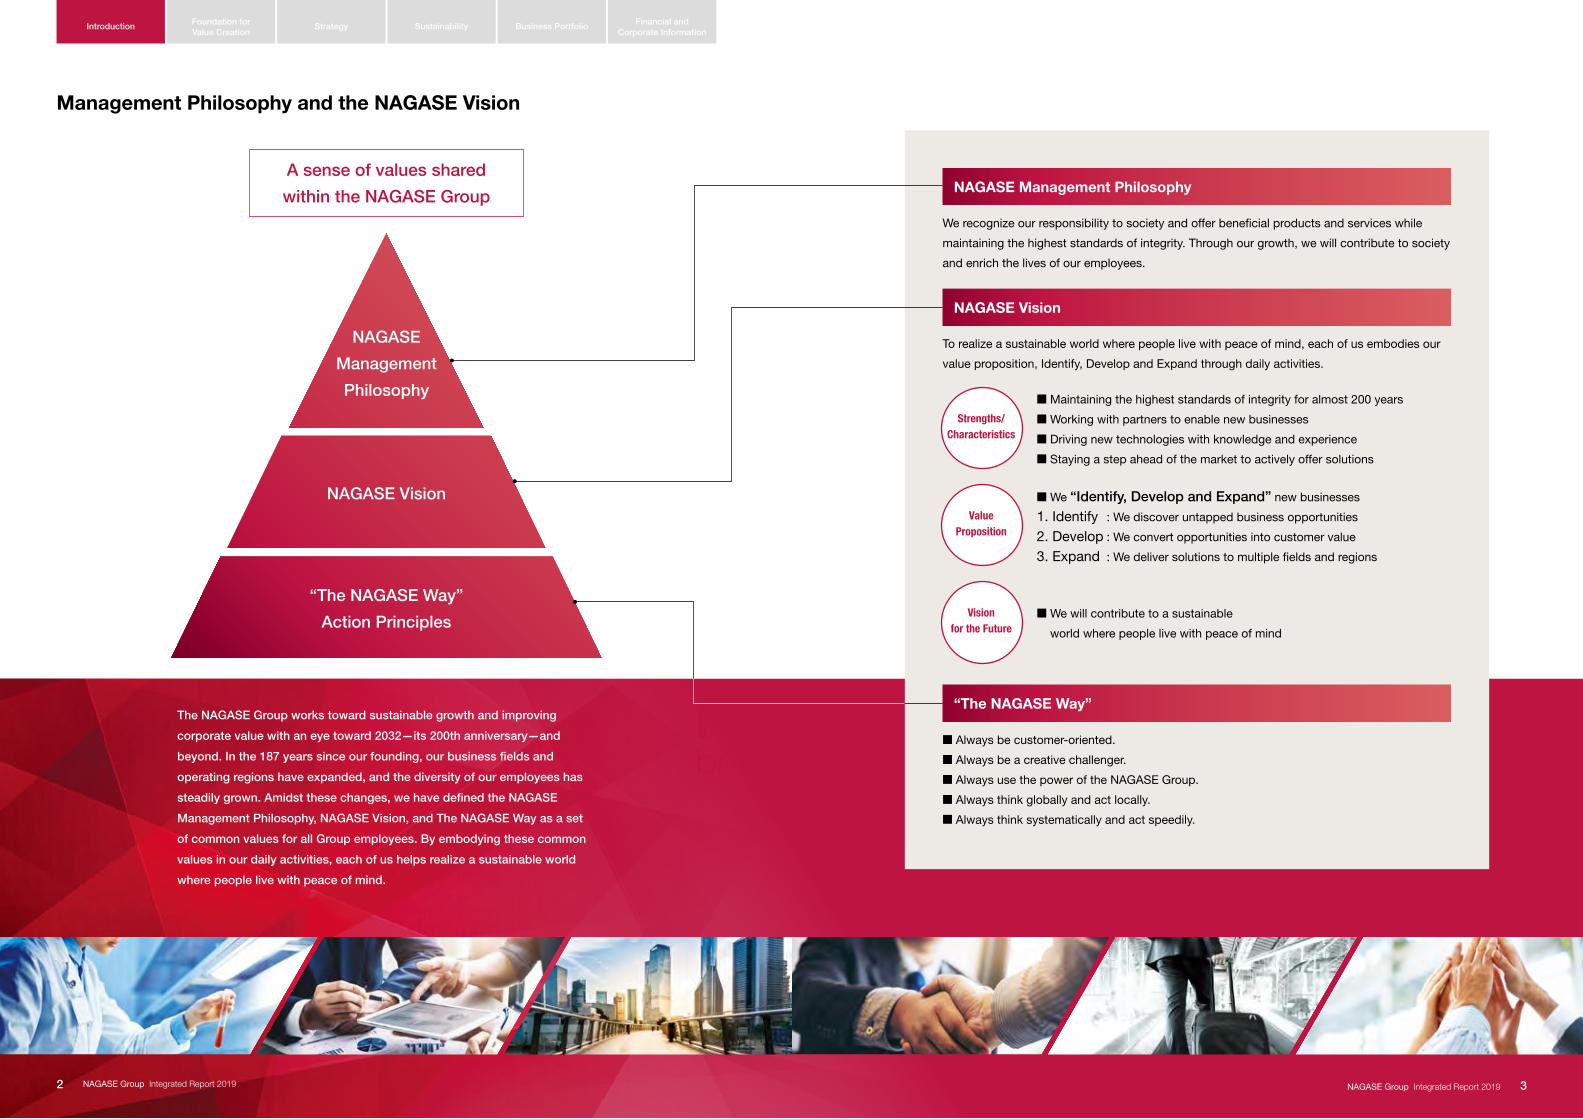
Management Philosophy and the NAGASE Vision
A sense of values shared
within the NAGASE Group
NAGASE
Management
Philosophy
NAGASE Vision
“The NAGASE Way”
Action Principles
The NAGASE Group works toward sustainable growth and improving
corporate value with an eye toward 2032—its 200th anniversary—and
beyond. In the 187 years since our founding, our business fields and
operating regions have expanded, and the diversity of our employees has
steadily grown. Amidst these changes, we have defined the NAGASE
Management Philosophy, NAGASE Vision, and The NAGASE Way as a set
of common values for all Group employees. By embodying these common
values in our daily activities, each of us helps realize a sustainable world
where people live with peace of mind.
NAGASE Management Philosophy
We recognize our responsibility to society and offer beneficial products and services while
maintaining the highest standards of integrity. Through our growth, we will contribute to society
and enrich the lives of our employees.
NAGASE Vision
To realize a sustainable world where people live with peace of mind, each of us embodies our
value proposition, Identify, Develop and Expand through daily activities.
“The NAGASE Way”
M Always be customer-oriented.
M Always be a creative challenger.
M Always use the power of the NAGASE Group.
M Always think globally and act locally.
M Always think systematically and act speedily.
M Maintaining the highest standards of integrity for almost 200 years
M Working with partners to enable new businesses
M Driving new technologies with knowledge and experience
M Staying a step ahead of the market to actively offer solutions
M We “Identify, Develop and Expand” new businesses
1. Identify : We discover untapped business opportunities
2. Develop : We convert opportunities into customer value
3. Expand : We deliver solutions to multiple fields and regions
M We will contribute to a sustainable
world where people live with peace of mind
Strengths/Characteristics
Value Proposition
Vision for the Future
Financial and Corporate Information
Introduction SustainabilityFoundation for Value Creation
Strategy Business Portfolio
NAGASE Group Integrated Report 20192 3NAGASE Group Integrated Report 2019
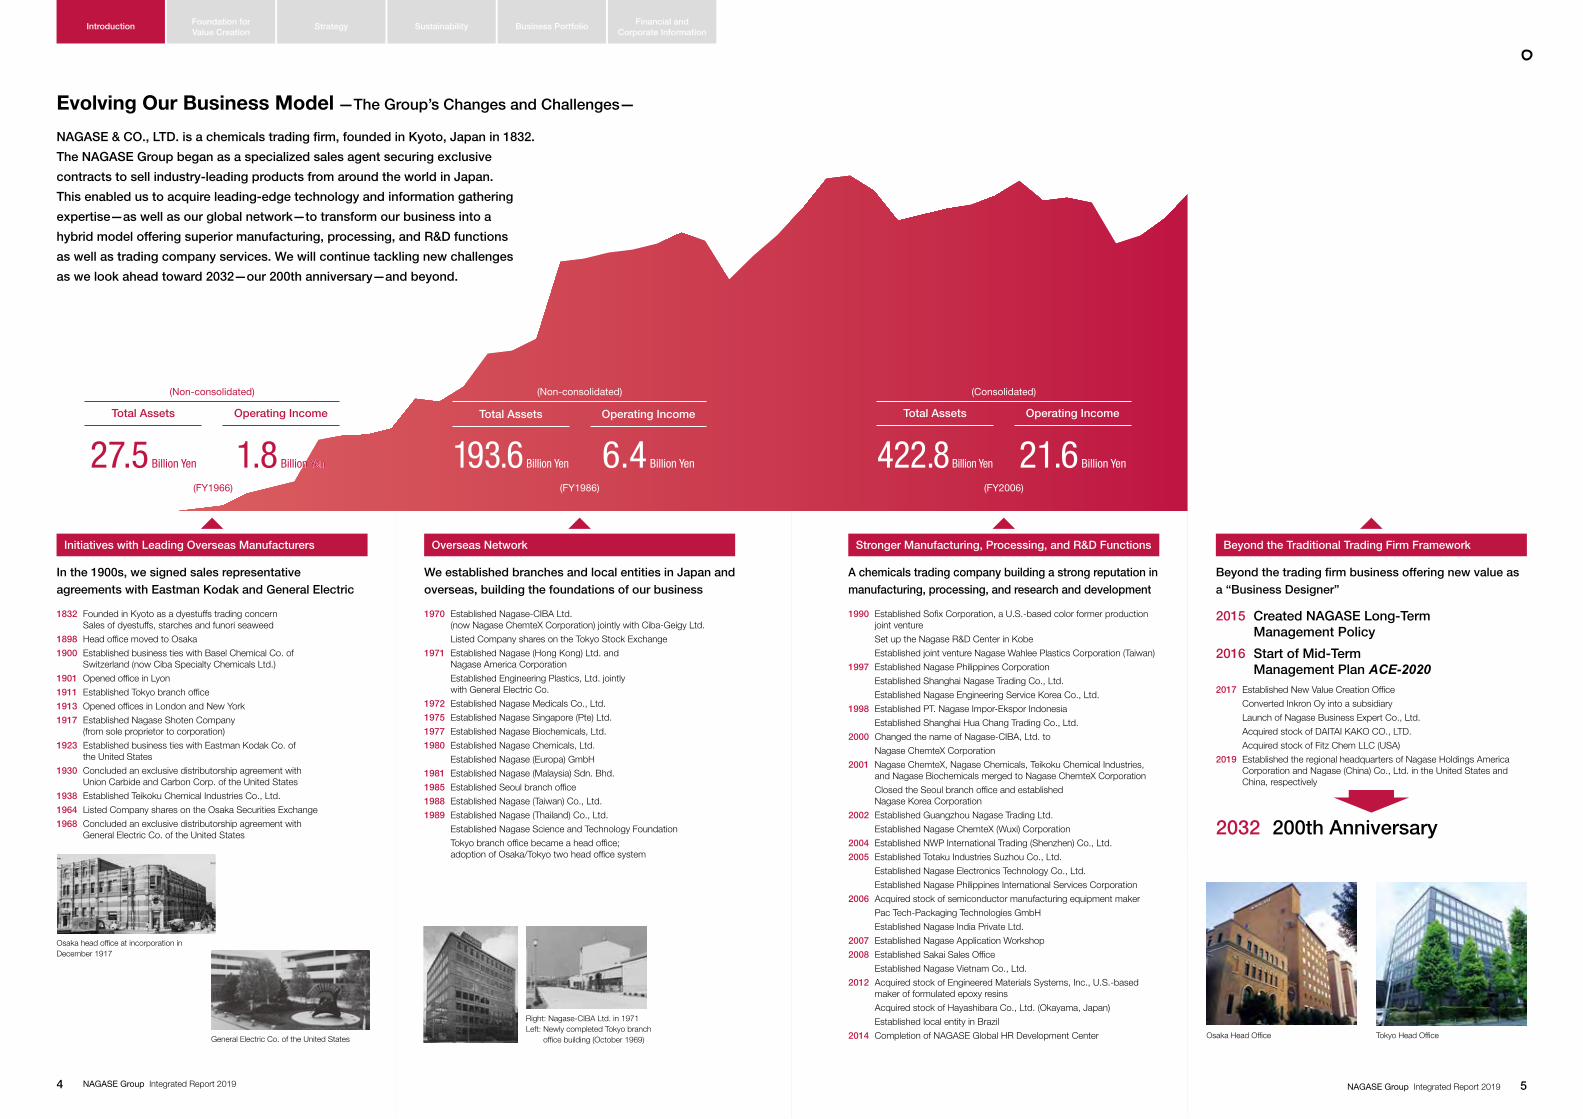
Evolving Our Business Model —The Group’s Changes and Challenges—
NAGASE & CO., LTD. is a chemicals trading firm, founded in Kyoto, Japan in 1832.
The NAGASE Group began as a specialized sales agent securing exclusive
contracts to sell industry-leading products from around the world in Japan.
This enabled us to acquire leading-edge technology and information gathering
expertise—as well as our global network—to transform our business into a
hybrid model offering superior manufacturing, processing, and R&D functions
as well as trading company services. We will continue tackling new challenges
as we look ahead toward 2032—our 200th anniversary—and beyond.
1970 Established Nagase-CIBA Ltd. (now Nagase ChemteX Corporation) jointly with Ciba-Geigy Ltd.
Listed Company shares on the Tokyo Stock Exchange
1971 Established Nagase (Hong Kong) Ltd. and Nagase America Corporation
Established Engineering Plastics, Ltd. jointly with General Electric Co.
1972 Established Nagase Medicals Co., Ltd.
1975 Established Nagase Singapore (Pte) Ltd.
1977 Established Nagase Biochemicals, Ltd.
1980 Established Nagase Chemicals, Ltd.
Established Nagase (Europa) GmbH
1981 Established Nagase (Malaysia) Sdn. Bhd.
1985 Established Seoul branch office
1988 Established Nagase (Taiwan) Co., Ltd.
1989 Established Nagase (Thailand) Co., Ltd.
Established Nagase Science and Technology Foundation
Tokyo branch office became a head office; adoption of Osaka/Tokyo two head office system
1990 Established Sofix Corporation, a U.S.-based color former production joint venture
Set up the Nagase R&D Center in Kobe
Established joint venture Nagase Wahlee Plastics Corporation (Taiwan)
1997 Established Nagase Philippines Corporation
Established Shanghai Nagase Trading Co., Ltd.
Established Nagase Engineering Service Korea Co., Ltd.
1998 Established PT. Nagase Impor-Ekspor Indonesia
Established Shanghai Hua Chang Trading Co., Ltd.
2000 Changed the name of Nagase-CIBA, Ltd. to
Nagase ChemteX Corporation
2001 Nagase ChemteX, Nagase Chemicals, Teikoku Chemical Industries, and Nagase Biochemicals merged to Nagase ChemteX Corporation
Closed the Seoul branch office and established Nagase Korea Corporation
2002 Established Guangzhou Nagase Trading Ltd.
Established Nagase ChemteX (Wuxi) Corporation
2004 Established NWP International Trading (Shenzhen) Co., Ltd.
2005 Established Totaku Industries Suzhou Co., Ltd.
Established Nagase Electronics Technology Co., Ltd.
Established Nagase Philippines International Services Corporation
2006 Acquired stock of semiconductor manufacturing equipment maker
Pac Tech-Packaging Technologies GmbH
Established Nagase India Private Ltd.
2007 Established Nagase Application Workshop
2008 Established Sakai Sales Office
Established Nagase Vietnam Co., Ltd.
2012 Acquired stock of Engineered Materials Systems, Inc., U.S.-based maker of formulated epoxy resins
Acquired stock of Hayashibara Co., Ltd. (Okayama, Japan)
Established local entity in Brazil
2014 Completion of NAGASE Global HR Development Center
2015 Created NAGASE Long-Term Management Policy
2016 Start of Mid-Term Management Plan ACE-2020
2017 Established New Value Creation Office
Converted Inkron Oy into a subsidiary
Launch of Nagase Business Expert Co., Ltd.
Acquired stock of DAITAI KAKO CO., LTD.
Acquired stock of Fitz Chem LLC (USA)
2019 Established the regional headquarters of Nagase Holdings America Corporation and Nagase (China) Co., Ltd. in the United States and China, respectively
2032 200th Anniversary
Osaka head office at incorporation in December 1917
Right: Nagase-CIBA Ltd. in 1971Left: Newly completed Tokyo branch
office building (October 1969)
567.3 Billion Yen422.8 Billion Yen193.6 Billion Yen27.5 Billion Yen 25.2 Billion Yen21.6 Billion Yen6.4 Billion Yen1.8 Billion Yen
807.7 Billion Yen
Initiatives with Leading Overseas Manufacturers Stronger Manufacturing, Processing, and R&D FunctionsOverseas Network Beyond the Traditional Trading Firm Framework
In the 1900s, we signed sales representative agreements with Eastman Kodak and General Electric
We established branches and local entities in Japan and overseas, building the foundations of our business
A chemicals trading company building a strong reputation in manufacturing, processing, and research and development
Beyond the trading firm business offering new value as a “Business Designer”
Net Sales (FY2018)
Total AssetsTotal AssetsTotal AssetsTotal Assets
(Non-consolidated) (Non-consolidated) (Consolidated) (Consolidated)
Operating IncomeOperating IncomeOperating IncomeOperating Income
(FY2018)(FY1986) (FY2006)
General Electric Co. of the United States
(FY1966)
1832 Founded in Kyoto as a dyestuffs trading concern Sales of dyestuffs, starches and funori seaweed
1898 Head office moved to Osaka
1900 Established business ties with Basel Chemical Co. of Switzerland (now Ciba Specialty Chemicals Ltd.)
1901 Opened office in Lyon
1911 Established Tokyo branch office
1913 Opened offices in London and New York
1917 Established Nagase Shoten Company (from sole proprietor to corporation)
1923 Established business ties with Eastman Kodak Co. of the United States
1930 Concluded an exclusive distributorship agreement with Union Carbide and Carbon Corp. of the United States
1938 Established Teikoku Chemical Industries Co., Ltd.
1964 Listed Company shares on the Osaka Securities Exchange
1968 Concluded an exclusive distributorship agreement with General Electric Co. of the United States
Osaka Head Office Tokyo Head Office
Financial and Corporate Information
Introduction SustainabilityFoundation for Value Creation
Strategy Business Portfolio
NAGASE Group Integrated Report 20194 5NAGASE Group Integrated Report 2019
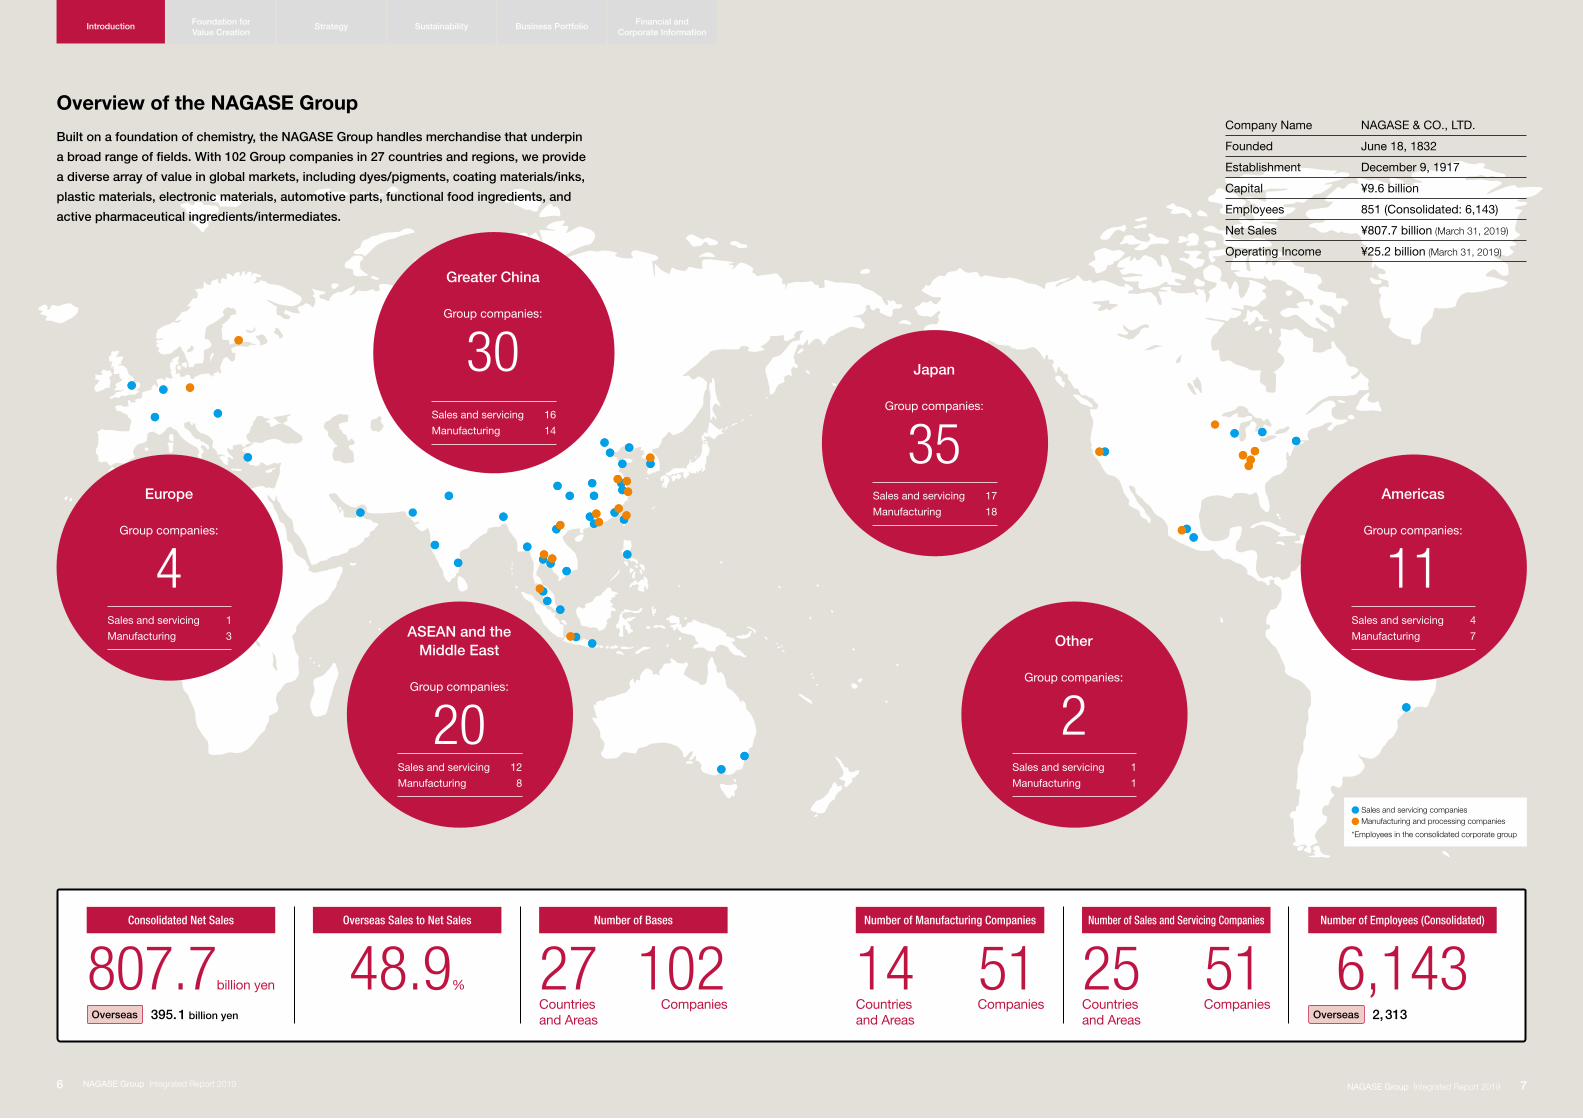
Overview of the NAGASE Group
Built on a foundation of chemistry, the NAGASE Group handles merchandise that underpin
a broad range of fields. With 102 Group companies in 27 countries and regions, we provide
a diverse array of value in global markets, including dyes/pigments, coating materials/inks,
plastic materials, electronic materials, automotive parts, functional food ingredients, and
active pharmaceutical ingredients/intermediates.
807.7billion yen 48.9% 14 5127 102 25 51 6,143
Europe
Group companies:
4
Greater China
Group companies:
30
Americas
Group companies:
11
Japan
Group companies:
35
ASEAN and the Middle East
Group companies:
20
Other
Group companies:
2
Consolidated Net Sales Overseas Sales to Net Sales Number of Manufacturing CompaniesNumber of Bases Number of Sales and Servicing Companies Number of Employees (Consolidated)
Sales and servicing companies Manufacturing and processing companies
*Employees in the consolidated corporate group
Overseas 395.1 billion yen
Company Name NAGASE & CO., LTD.
Founded June 18, 1832
Establishment December 9, 1917
Capital ¥9.6 billion
Employees 851 (Consolidated: 6,143)
Net Sales ¥807.7 billion (March 31, 2019)
Operating Income ¥25.2 billion (March 31, 2019)
Sales and servicing 16
Manufacturing 14
Sales and servicing 1
Manufacturing 3
Sales and servicing 12
Manufacturing 8
Sales and servicing 17
Manufacturing 18
Sales and servicing 1
Manufacturing 1
Sales and servicing 4
Manufacturing 7
Countriesand Areas
Countriesand Areas Overseas 2,313
Companies Companies Countriesand Areas
Companies
Financial and Corporate Information
Introduction SustainabilityFoundation for Value Creation
Strategy Business Portfolio
NAGASE Group Integrated Report 20196 7NAGASE Group Integrated Report 2019
179.6
275.2
122.3
139.2
90.7
0.5
5.4
8.0
7.4
3.0
4.6
(3.4)
472
792
1,848
100
2,497
782
314
1,542
3,201
329
3,206
2,018
646
1,474
1,516
343
1,122
1,042
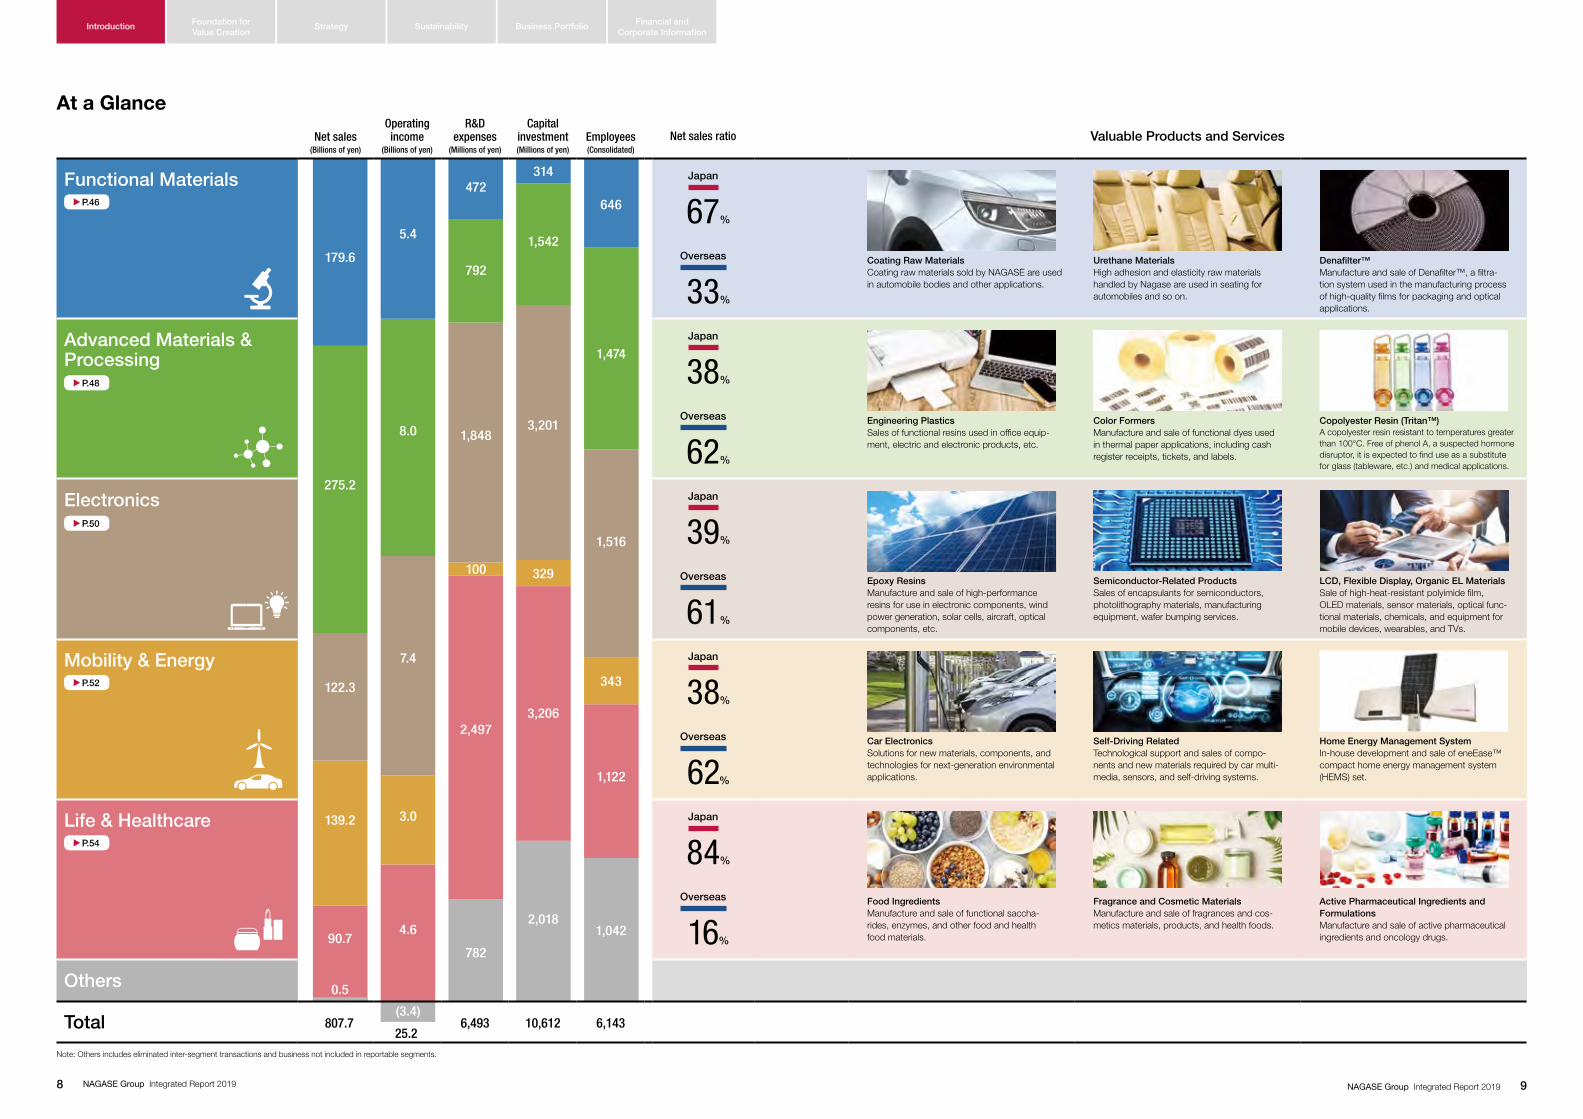
Net sales
(Billions of yen)
Operating income
(Billions of yen)
R&D expenses
(Millions of yen)
Capital investment(Millions of yen)
Employees(Consolidated)
Net sales ratio Valuable Products and Services
Functional Materials Japan
67%
Coating Raw MaterialsCoating raw materials sold by NAGASE are used in automobile bodies and other applications.
Urethane MaterialsHigh adhesion and elasticity raw materials handled by Nagase are used in seating for automobiles and so on.
Denafilter™Manufacture and sale of Denafilter™, a filtra-tion system used in the manufacturing process of high-quality films for packaging and optical applications.
Overseas
33%
Advanced Materials & Processing
Japan
38%
Engineering PlasticsSales of functional resins used in office equip-ment, electric and electronic products, etc.
Color FormersManufacture and sale of functional dyes used in thermal paper applications, including cash register receipts, tickets, and labels.
Copolyester Resin (Tritan™)A copolyester resin resistant to temperatures greater than 100°C. Free of phenol A, a suspected hormone disruptor, it is expected to find use as a substitute for glass (tableware, etc.) and medical applications.
Overseas
62%
Electronics Japan
39%
Epoxy ResinsManufacture and sale of high-performance resins for use in electronic components, wind power generation, solar cells, aircraft, optical components, etc.
Semiconductor-Related ProductsSales of encapsulants for semiconductors, photolithography materials, manufacturing equipment, wafer bumping services.
LCD, Flexible Display, Organic EL MaterialsSale of high-heat-resistant polyimide film, OLED materials, sensor materials, optical func-tional materials, chemicals, and equipment for mobile devices, wearables, and TVs.
Overseas
61%
Mobility & Energy Japan
38%
Car ElectronicsSolutions for new materials, components, and technologies for next-generation environmental applications.
Self-Driving RelatedTechnological support and sales of compo-nents and new materials required by car multi-media, sensors, and self-driving systems.
Home Energy Management SystemIn-house development and sale of eneEase™ compact home energy management system (HEMS) set.
Overseas
62%
Life & Healthcare Japan
84%
Food IngredientsManufacture and sale of functional saccha-rides, enzymes, and other food and health food materials.
Fragrance and Cosmetic MaterialsManufacture and sale of fragrances and cos-metics materials, products, and health foods.
Active Pharmaceutical Ingredients and FormulationsManufacture and sale of active pharmaceutical ingredients and oncology drugs.
Overseas
16%
Others
Total 807.725.2
6,493 10,612 6,143
Note: Others includes eliminated inter-segment transactions and business not included in reportable segments.
G
P.46
G
P.48
G
P.50
G
P.52
G
P.54
At a Glance
Financial and Corporate Information
Introduction SustainabilityFoundation for Value Creation
Strategy Business Portfolio
NAGASE Group Integrated Report 20198 9NAGASE Group Integrated Report 2019
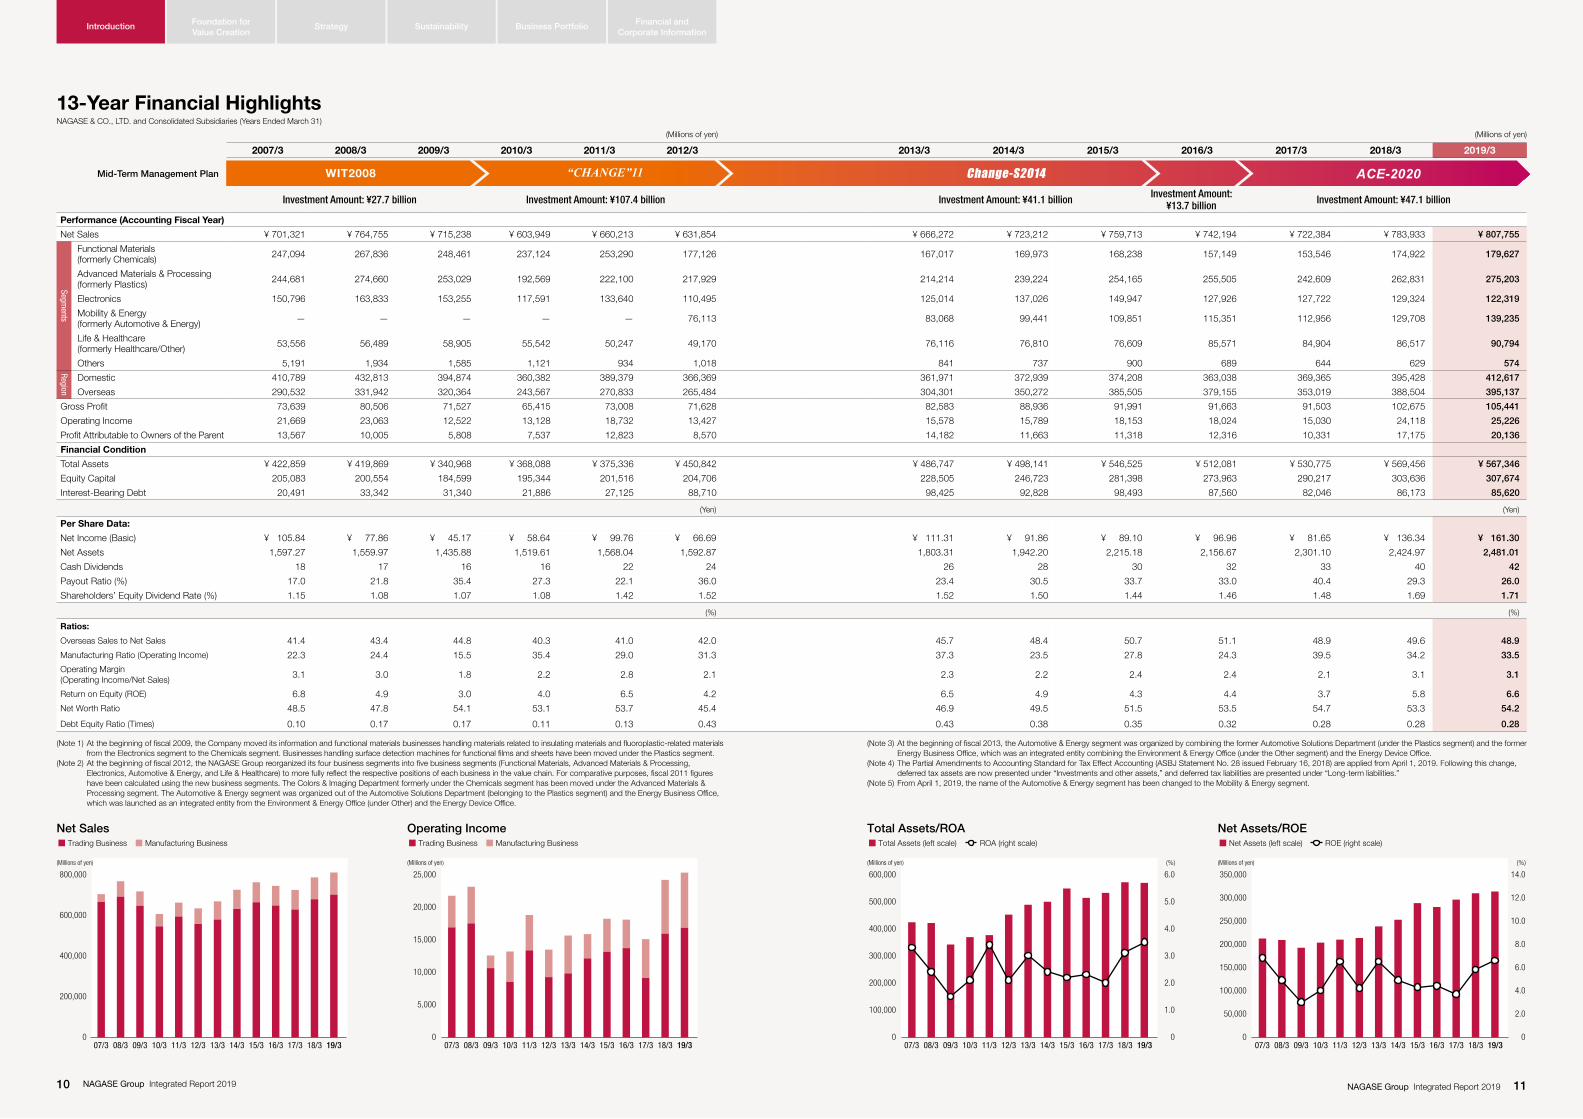
(Millions of yen) (Millions of yen)
2007/3 2008/3 2009/3 2010/3 2011/3 2012/3 2013/3 2014/3 2015/3 2016/3 2017/3 2018/3 2019/3
Mid-Term Management Plan
Performance (Accounting Fiscal Year)
Net Sales ¥ 701,321 ¥ 764,755 ¥ 715,238 ¥ 603,949 ¥ 660,213 ¥ 631,854 ¥ 666,272 ¥ 723,212 ¥ 759,713 ¥ 742,194 ¥ 722,384 ¥ 783,933 ¥ 807,755
Functional Materials (formerly Chemicals) 247,094 267,836 248,461 237,124 253,290 177,126 167,017 169,973 168,238 157,149 153,546 174,922 179,627
Advanced Materials & Processing (formerly Plastics) 244,681 274,660 253,029 192,569 222,100 217,929 214,214 239,224 254,165 255,505 242,609 262,831 275,203
Electronics 150,796 163,833 153,255 117,591 133,640 110,495 125,014 137,026 149,947 127,926 127,722 129,324 122,319
Mobility & Energy (formerly Automotive & Energy) — — — — — 76,113 83,068 99,441 109,851 115,351 112,956 129,708 139,235
Life & Healthcare (formerly Healthcare/Other) 53,556 56,489 58,905 55,542 50,247 49,170 76,116 76,810 76,609 85,571 84,904 86,517 90,794
Others 5,191 1,934 1,585 1,121 934 1,018 841 737 900 689 644 629 574
Domestic 410,789 432,813 394,874 360,382 389,379 366,369 361,971 372,939 374,208 363,038 369,365 395,428 412,617
Overseas 290,532 331,942 320,364 243,567 270,833 265,484 304,301 350,272 385,505 379,155 353,019 388,504 395,137
Gross Profit 73,639 80,506 71,527 65,415 73,008 71,628 82,583 88,936 91,991 91,663 91,503 102,675 105,441
Operating Income 21,669 23,063 12,522 13,128 18,732 13,427 15,578 15,789 18,153 18,024 15,030 24,118 25,226
Profit Attributable to Owners of the Parent 13,567 10,005 5,808 7,537 12,823 8,570 14,182 11,663 11,318 12,316 10,331 17,175 20,136
Financial Condition
Total Assets ¥ 422,859 ¥ 419,869 ¥ 340,968 ¥ 368,088 ¥ 375,336 ¥ 450,842 ¥ 486,747 ¥ 498,141 ¥ 546,525 ¥ 512,081 ¥ 530,775 ¥ 569,456 ¥ 567,346
Equity Capital 205,083 200,554 184,599 195,344 201,516 204,706 228,505 246,723 281,398 273,963 290,217 303,636 307,674
Interest-Bearing Debt 20,491 33,342 31,340 21,886 27,125 88,710 98,425 92,828 98,493 87,560 82,046 86,173 85,620
(Yen) (Yen)
Per Share Data:
Net Income (Basic) ¥ 105.84 ¥ 77.86 ¥ 45.17 ¥ 58.64 ¥ 99.76 ¥ 66.69 ¥ 111.31 ¥ 91.86 ¥ 89.10 ¥ 96.96 ¥ 81.65 ¥ 136.34 ¥ 161.30
Net Assets 1,597.27 1,559.97 1,435.88 1,519.61 1,568.04 1,592.87 1,803.31 1,942.20 2,215.18 2,156.67 2,301.10 2,424.97 2,481.01
Cash Dividends 18 17 16 16 22 24 26 28 30 32 33 40 42
Payout Ratio (%) 17.0 21.8 35.4 27.3 22.1 36.0 23.4 30.5 33.7 33.0 40.4 29.3 26.0
Shareholders’ Equity Dividend Rate (%) 1.15 1.08 1.07 1.08 1.42 1.52 1.52 1.50 1.44 1.46 1.48 1.69 1.71
(%) (%)
Ratios:
Overseas Sales to Net Sales 41.4 43.4 44.8 40.3 41.0 42.0 45.7 48.4 50.7 51.1 48.9 49.6 48.9
Manufacturing Ratio (Operating Income) 22.3 24.4 15.5 35.4 29.0 31.3 37.3 23.5 27.8 24.3 39.5 34.2 33.5
Operating Margin (Operating Income/Net Sales) 3.1 3.0 1.8 2.2 2.8 2.1 2.3 2.2 2.4 2.4 2.1 3.1 3.1
Return on Equity (ROE) 6.8 4.9 3.0 4.0 6.5 4.2 6.5 4.9 4.3 4.4 3.7 5.8 6.6
Net Worth Ratio 48.5 47.8 54.1 53.1 53.7 45.4 46.9 49.5 51.5 53.5 54.7 53.3 54.2
Debt Equity Ratio (Times) 0.10 0.17 0.17 0.11 0.13 0.43 0.43 0.38 0.35 0.32 0.28 0.28 0.28
(Note 1) At the beginning of fiscal 2009, the Company moved its information and functional materials businesses handling materials related to insulating materials and fluoroplastic-related materials from the Electronics segment to the Chemicals segment. Businesses handling surface detection machines for functional films and sheets have been moved under the Plastics segment.
(Note 2) At the beginning of fiscal 2012, the NAGASE Group reorganized its four business segments into five business segments (Functional Materials, Advanced Materials & Processing, Electronics, Automotive & Energy, and Life & Healthcare) to more fully reflect the respective positions of each business in the value chain. For comparative purposes, fiscal 2011 figures have been calculated using the new business segments. The Colors & Imaging Department formerly under the Chemicals segment has been moved under the Advanced Materials & Processing segment. The Automotive & Energy segment was organized out of the Automotive Solutions Department (belonging to the Plastics segment) and the Energy Business Office, which was launched as an integrated entity from the Environment & Energy Office (under Other) and the Energy Device Office.
(Note 3) At the beginning of fiscal 2013, the Automotive & Energy segment was organized by combining the former Automotive Solutions Department (under the Plastics segment) and the former Energy Business Office, which was an integrated entity combining the Environment & Energy Office (under the Other segment) and the Energy Device Office.
(Note 4) The Partial Amendments to Accounting Standard for Tax Effect Accounting (ASBJ Statement No. 28 issued February 16, 2018) are applied from April 1, 2019. Following this change, deferred tax assets are now presented under “Investments and other assets,” and deferred tax liabilities are presented under “Long-term liabilities.”
(Note 5) From April 1, 2019, the name of the Automotive & Energy segment has been changed to the Mobility & Energy segment.
Segments
Region
Investment Amount: ¥107.4 billion Investment Amount: ¥41.1 billion Investment Amount: ¥47.1 billion
WIT2008 ACE-2020
Investment Amount: ¥27.7 billion
Net SalesTrading Business Manufacturing Business
15/3 16/3 18/317/307/3 08/3 09/3 10/3 11/3 12/3 13/3 14/3 19/3
(Millions of yen)
0
200,000
400,000
600,000
800,000
“CHANGE”11 Change-S2014
13-Year Financial HighlightsNAGASE & CO., LTD. and Consolidated Subsidiaries (Years Ended March 31)
Operating Income
0
5,000
10,000
15,000
20,000
25,000
15/3 16/3 18/317/307/3 08/3 09/3 10/3 12/311/3 13/3 14/3 19/3
(Millions of yen)
Trading Business Manufacturing Business
Total Assets/ROA
(Millions of yen)
0
100,000
200,000
300,000
400,000
600,000
500,000
(%)
0
1.0
2.0
3.0
4.0
6.0
5.0
15/3 16/3 18/317/307/3 08/3 09/3 11/310/3 12/3 13/3 14/3 19/3
Total Assets (left scale) ROA (right scale)
Net Assets/ROE
(Millions of yen)
0
100,000
50,000
150,000
200,000
250,000
350,000
300,000
(%)
0
4.0
2.0
6.0
8.0
10.0
14.0
12.0
14/3 16/3 18/317/307/3 08/3 09/3 10/3 11/3 12/3 13/3 15/3 19/3
Net Assets (left scale) ROE (right scale)
Investment Amount: ¥13.7 billion
Financial and Corporate Information
Introduction SustainabilityFoundation for Value Creation
Strategy Business Portfolio
NAGASE Group Integrated Report 201910 11NAGASE Group Integrated Report 2019

2015 2020 2025 2032
Investment of Management Resources Long-Term Management Policy
Financial capital Manufacturing capital Human capital Social and related capital Intellectual capital
Growth Investment Capital Investment Employees Group Companies R&D Expenses
100 billion yen
Rating (R&I) [A]
32.2 billion yen
(FY2016-2018)
6,143 27 Countriesand Areas
17.7 billion yen
(FY2016-2018)
Stage 2 Stage 3
The stage where we reform
our profit structure and our
corporate culture
The stage where we grow
rapidly toward the goal
The stage where two reforms
have been permeated,
accelerating growth
Establish multinational management system
Enhance overseas operating structure
Stage 1Reform JumpGrowth
Functional Materials
Advanced Materials & Processing
Electronics
Life & Healthcare
Mobility & Energy
Business Portfolio
(FY)
Manufacturing and Processing
• Nagase ChemteX
• Hayashibara, 49 Other Companies
SuppliersBusiness Partners
R&D
• New Value Creation Office
• Nagase R&D Center
• Nagase Application Workshop
Foundation for Value Creation
Mid-Term Management Plan
ACE-2020
Sustainability
IdentifyFind needs and seeds
ExpandOngoing
business growth
DevelopGrow seeds into
businesses
Normalization of the profit more than tripled of the fiscal year ended
March 31, 2015
Invest- ment
Manufac- turing
GlobalNetwork
Logistics
Trading
R&D[ Six Functions ]
BusinessDesigner
Expand overseas operations
NAGASE Vision
NAGASE Group Strengths
• Strong Financial Foundation • Technological expertise
• Networks of business information • Chemical management know-how
• Global logistics • Credibility backed by our history
EP.46-57
EP.14-15
EP.58-59
EP.61-63
Supporting industry through materials and finished products
Supporting beauty and health
Challenges for Growth
• Increase investment• Accelerate organic growth• Expand overseas operations
Reinforce the Management Platform for Growth
• Restructure global governance• Increase flexibility in HR management• Enhance safety and assurance• Consolidate communications infrastructure
Summary of the Long-Term Management Policy
We contribute to creating
a sustainable world
where people live with
peace of mind.
Solving social problems
through business
Our Value Creation Process and Long-Term Management Policy
Financial and Corporate Information
Introduction SustainabilityFoundation for Value Creation
Strategy Business Portfolio
NAGASE Group Integrated Report 201912 13NAGASE Group Integrated Report 2019

We use the term Business Designer to describe the type of company we want to become. While our
main activities have been based in trading and chemicals, we have extended beyond those categories,
integrating six functions on a higher level: Trading, R&D, Investment, Logistics, Global Network,
Manufacturing. We are now designing businesses without boundaries.
Cases8 BusinessDesigner
Business Designer: 8 Case Studies
5G, IoT, Semiconductors
Invested in 3D Glass Solutions, Inc.• 3D Glass Solutions is a startup designing and
manufacturing high-frequency 5G devices.
• We promoted a joint development framework that utilizes the NAGASE Group’s mass production technology and quality control system.
Target Market
FocusArea
Logistics
Invest-ment
R&D
GlobalNetwork Trading
Manufac- turing
Food Ingredients
Hayashibara Co., Ltd. Concluded Long-Term Partnership Agreement with Lonza• Hayashibara respond to the expanding demand for plant-based
pullulan capsules.
• The company started to set up a new facility.
Target Market
FocusArea
Invest-ment
GlobalNetwork
Logistics R&D
Trading
Manufac- turing
Markets in Need of New Materials
Promoted Joint Development in Materials Informatics• We engaged in joint development with U.S.-based
IBM, Inc.
• We began use of AI and latest data processing technologies.
• We reduced costs and shortened time needed to develop new (alternative) materials.
Target Market
GrowthArea
Invest-ment
Logistics
GlobalNetwork Trading
R&D
Manufac- turing
LCD and Semiconductors in China
Collaborated with Joint Ventures and Wuxi Chenghong Electronic Materials• We aim to expand our chemicals business in the liquid crystal and semicon-
ductor markets, which are expected to grow in China.
• We expanded our operating area by leveraging the strengths of our joint ventures with local Chinese companies.
Target Market
FocusArea
Invest-ment
Logistics
GlobalNetwork
R&D
Trading
Manufac- turing
3D Printers
Established Infinite Material Solutions, Inc.• Infinite Material Solutions is a joint venture with U.S. based Interfacial
Consultants LLC.
• We aim to commercialize water-soluble support material filaments for fused deposition modeling (FDM). (AquaSyS™ is the industry’s first water-soluble support material compatible with super engineering plastics.)
Target Market
FocusArea
Invest-ment
Logistics
GlobalNetwork Trading
R&D
Manufac- turing
Mobility
Entered the Self-Driving Technology Field (LiDAR-Related)• We began alliances with U.S.-based TriLumina and
Canada-based LeddarTech.
• Laser and sensor technologies are indispensable to autonomous driving.
• We will help improve safety through long-distance and highly precise sensing technology.
Target Market
GrowthArea
Invest-ment
Logistics
GlobalNetwork Trading
R&D
Manufac- turing
Region-Specific Markets Overseas
Established Regional Headquarters in the United States and China• The Americas region includes Mexico and Brazil, and the Greater China region
includes Taiwan and Hong Kong.
• We accelerated creation of new region-leading businesses and strengthened governance in overseas businesses.
Target Market
FocusArea
Invest-ment
Logistics
Trading
R&D
GlobalNetwork
Manufac- turing
Next-Generation Displays
Established a Joint Venture with TOYOBO CO., LTD.• The joint venture manufactures and sells
XENOMAX™, a heat-resistant polyimide film.
• We aim to quickly build a ¥10 billion business.
Target Market
FocusArea
Invest-ment
Logistics
GlobalNetwork Trading
R&D
Manufac- turing
Financial and Corporate Information
Introduction SustainabilityFoundation for Value Creation
Strategy Business Portfolio
NAGASE Group Integrated Report 201914 15NAGASE Group Integrated Report 2019

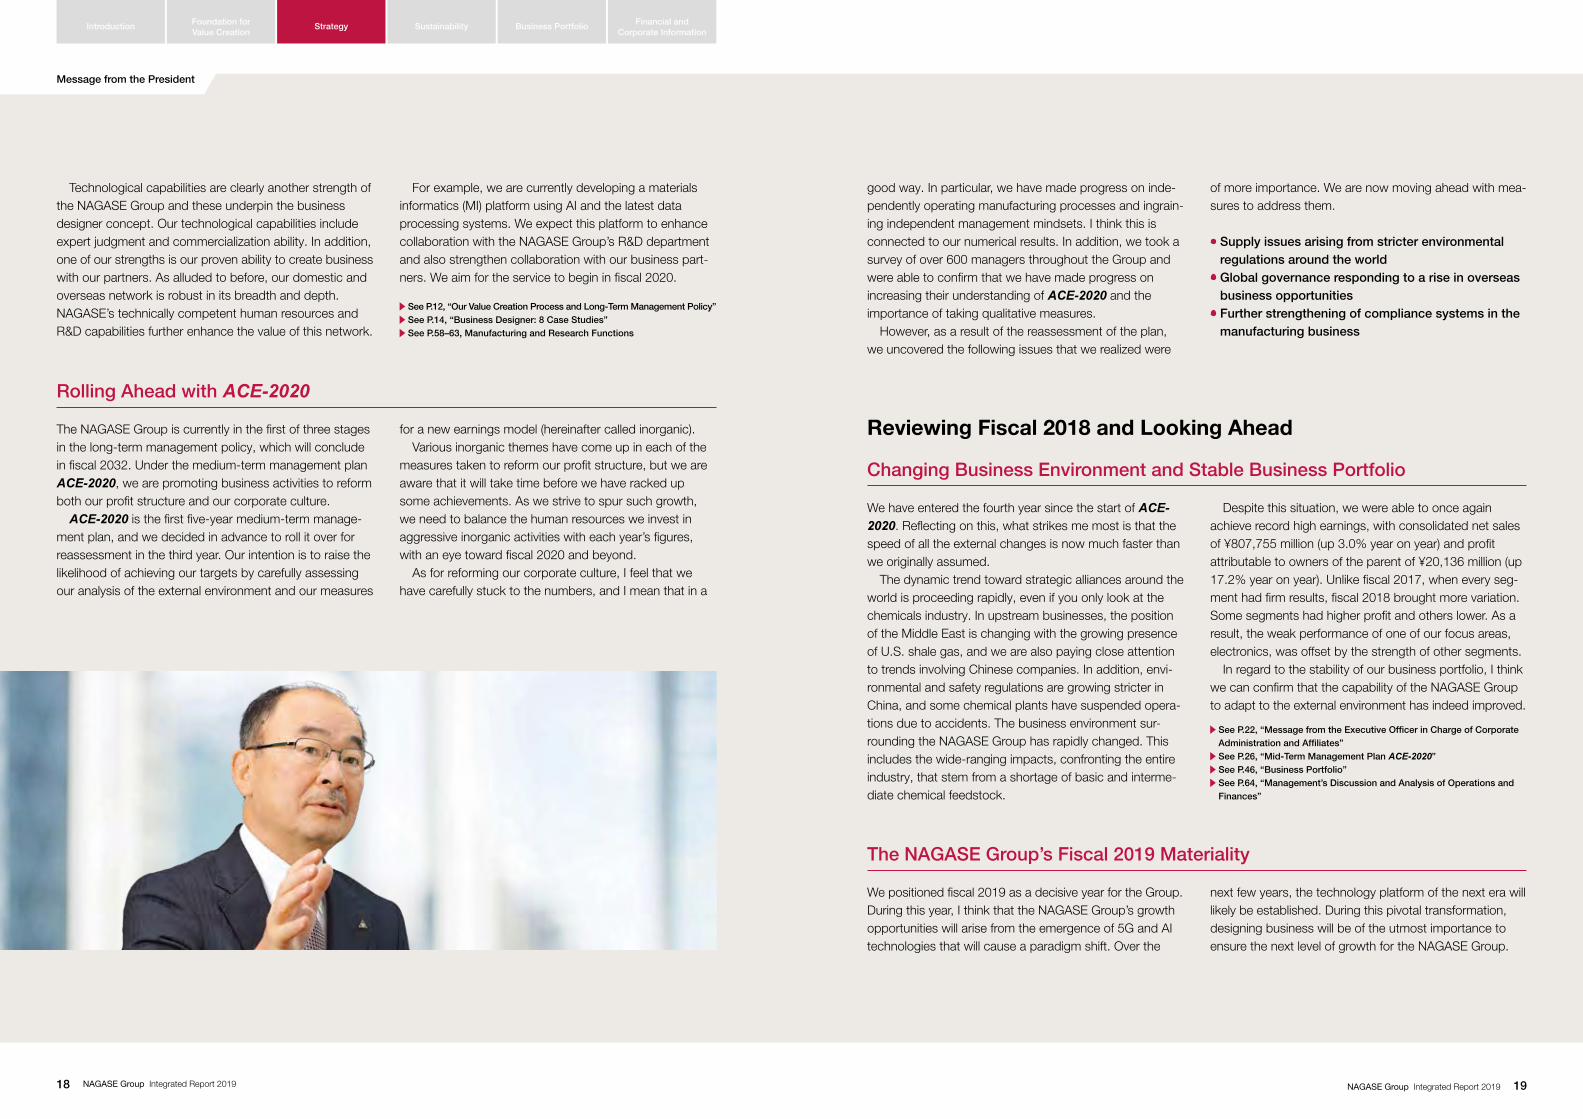
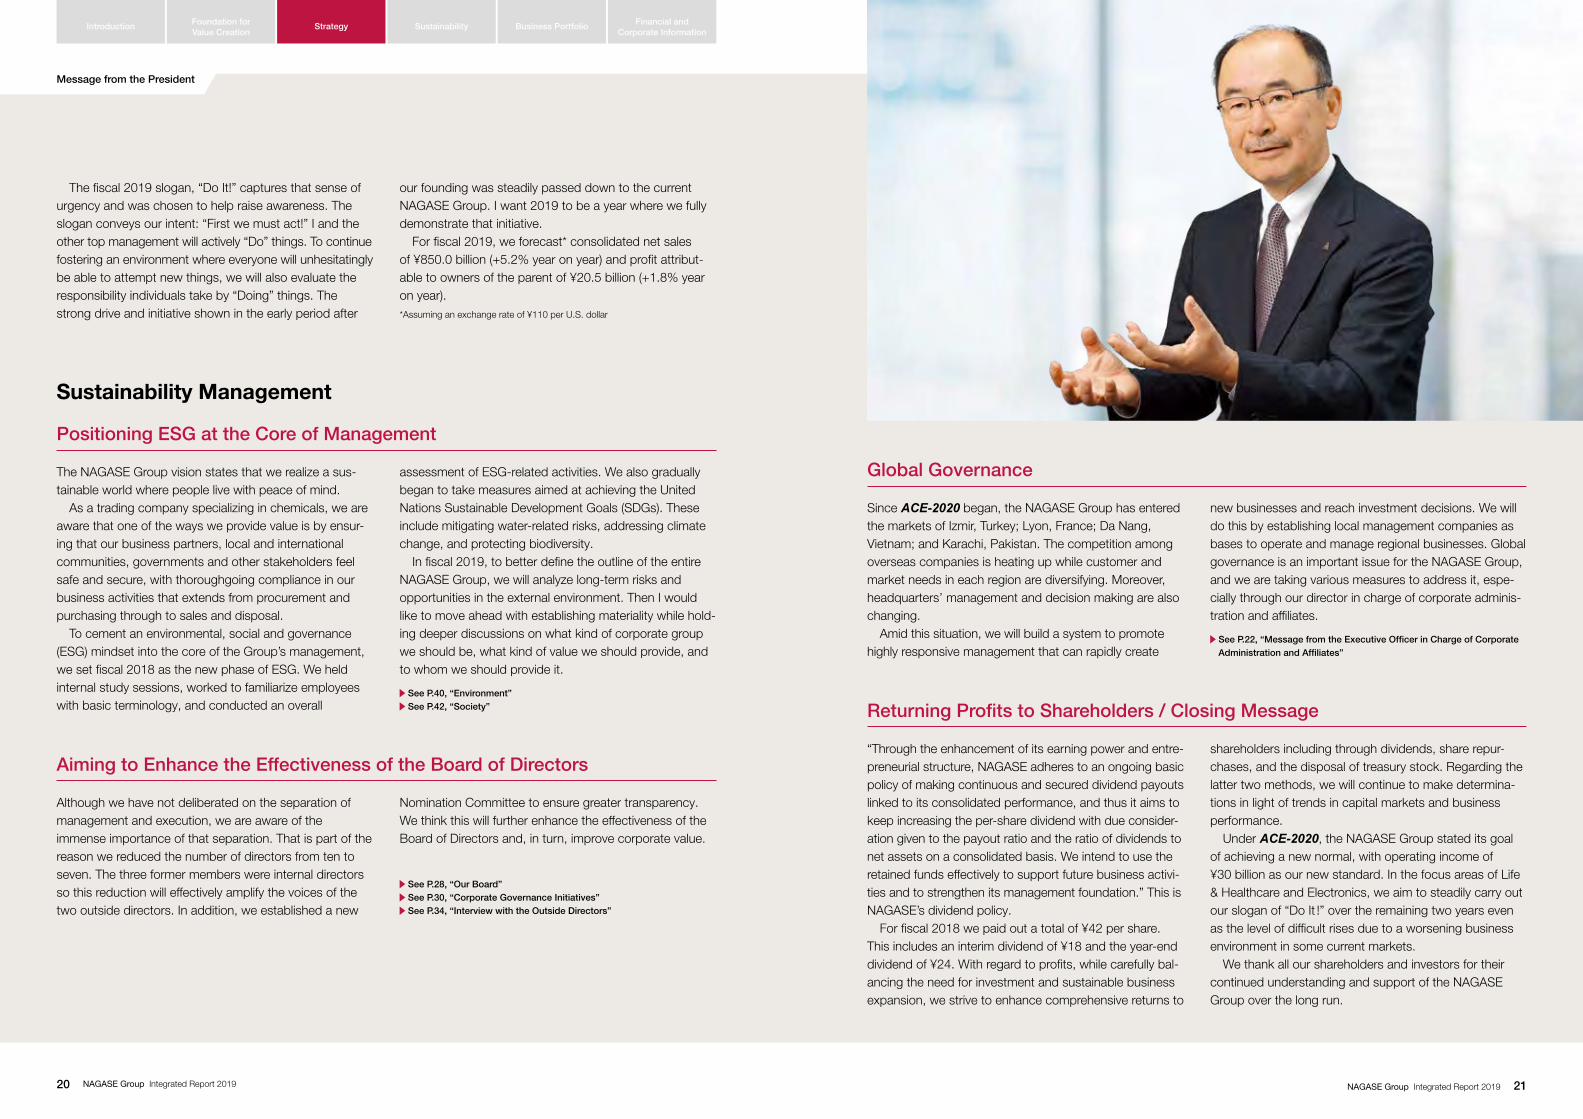
Message from the President
Representative Director and President
Kenji Asakura
July 2019
My Vision and Management Policies
Transitioning to a New Business Model
NAGASE CO., LTD. was founded 187 years ago as a sole proprietor in the Nishijin area of Kyoto that dealt with func-tional products, such as safflower dye. By anticipating overarching and technological trends, the Group has worked to grow its business. We have since built a network as a distributor for many global companies. This began in 1900 with imports of synthetic dyestuffs from a chemical company based in Basel, Switzerland currently known as BASF. Our network with these global companies remains NAGASE’s major strength. It has enabled our dramatic growth as a trading company specializing in chemicals in the past, present and, assuredly, into the future. Around 1900, this network allowed NAGASE to escape a domestic market essentially monopolized by foreign trad-ing houses. Since then, we have been singularly commit-ted to realizing direct trade. This led to a forward-looking
move to establish an office in Lyon, France, then center of the silk industry. The purpose was to sharpen our expert judgment on technology. The driving force of commitment, backed by action, has been firmly passed down, animating the current spirit of the NAGASE Group. However, there is a life cycle in the functions of trading houses too. Major trends are gaining speed, including the globalization of markets, diversification of people’s values, digitization, and increasing value of data. The value that our stakeholders seek from us is always changing. My vision for the NAGASE Group going forward is to not only perform trading house functions but to also be a corporate group that provides value over the mid to long term as a business designer.
See P.4, “Evolving Our Business Model”
As a Business Designer
I came up with the concept of a Business Designer after becoming president. We will align the six functions of the NAGASE Group (Trading, R&D, Investment, Logistics, Global Network, Manufacturing) and swiftly establish them as an integrated business. Although I fully comprehend the challenge of this task, I think this concept is quite
important. This particular combination of functions leverages the unique aspects of our businesses to realize the value being sought from the NAGASE Group. We can provide value to various markets by Identifying, Developing, and Expanding the seeds of business, as stated in the NAGASE Group vision.
Fiscal 2019 will be a decisive year for the NAGASE Group. I will steer management while striking a balance between the short term and the mid to long term.
Financial and Corporate Information
Introduction SustainabilityFoundation for Value Creation
Strategy Business Portfolio
NAGASE Group Integrated Report 201916 17NAGASE Group Integrated Report 2019
good way. In particular, we have made progress on inde-pendently operating manufacturing processes and ingrain-ing independent management mindsets. I think this is connected to our numerical results. In addition, we took a survey of over 600 managers throughout the Group and were able to confirm that we have made progress on increasing their understanding of ACE-2020 and the importance of taking qualitative measures. However, as a result of the reassessment of the plan, we uncovered the following issues that we realized were
of more importance. We are now moving ahead with mea-sures to address them.
• Supply issues arising from stricter environmental regulations around the world
• Global governance responding to a rise in overseas business opportunities
• Further strengthening of compliance systems in the manufacturing business
Reviewing Fiscal 2018 and Looking Ahead
Changing Business Environment and Stable Business Portfolio
We have entered the fourth year since the start of ACE-2020. Reflecting on this, what strikes me most is that the speed of all the external changes is now much faster than we originally assumed. The dynamic trend toward strategic alliances around the world is proceeding rapidly, even if you only look at the chemicals industry. In upstream businesses, the position of the Middle East is changing with the growing presence of U.S. shale gas, and we are also paying close attention to trends involving Chinese companies. In addition, envi-ronmental and safety regulations are growing stricter in China, and some chemical plants have suspended opera-tions due to accidents. The business environment sur-rounding the NAGASE Group has rapidly changed. This includes the wide-ranging impacts, confronting the entire industry, that stem from a shortage of basic and interme-diate chemical feedstock.
Despite this situation, we were able to once again achieve record high earnings, with consolidated net sales of ¥807,755 million (up 3.0% year on year) and profit attributable to owners of the parent of ¥20,136 million (up 17.2% year on year). Unlike fiscal 2017, when every seg-ment had firm results, fiscal 2018 brought more variation. Some segments had higher profit and others lower. As a result, the weak performance of one of our focus areas, electronics, was offset by the strength of other segments. In regard to the stability of our business portfolio, I think we can confirm that the capability of the NAGASE Group to adapt to the external environment has indeed improved.
See P.22, “Message from the Executive Officer in Charge of Corporate Administration and Affiliates” See P.26, “Mid-Term Management Plan ACE-2020” See P.46, “Business Portfolio” See P.64, “Management’s Discussion and Analysis of Operations and Finances”
The NAGASE Group’s Fiscal 2019 Materiality
We positioned fiscal 2019 as a decisive year for the Group. During this year, I think that the NAGASE Group’s growth opportunities will arise from the emergence of 5G and AI technologies that will cause a paradigm shift. Over the
next few years, the technology platform of the next era will likely be established. During this pivotal transformation, designing business will be of the utmost importance to ensure the next level of growth for the NAGASE Group.
Technological capabilities are clearly another strength of the NAGASE Group and these underpin the business designer concept. Our technological capabilities include expert judgment and commercialization ability. In addition, one of our strengths is our proven ability to create business with our partners. As alluded to before, our domestic and overseas network is robust in its breadth and depth. NAGASE’s technically competent human resources and R&D capabilities further enhance the value of this network.
For example, we are currently developing a materials informatics (MI) platform using AI and the latest data processing systems. We expect this platform to enhance collaboration with the NAGASE Group’s R&D department and also strengthen collaboration with our business part-ners. We aim for the service to begin in fiscal 2020.
See P.12, “Our Value Creation Process and Long-Term Management Policy” See P.14, “Business Designer: 8 Case Studies” See P.58–63, Manufacturing and Research Functions
Rolling Ahead with ACE-2020
The NAGASE Group is currently in the first of three stages in the long-term management policy, which will conclude in fiscal 2032. Under the medium-term management plan ACE-2020, we are promoting business activities to reform both our profit structure and our corporate culture. ACE-2020 is the first five-year medium-term manage-ment plan, and we decided in advance to roll it over for reassessment in the third year. Our intention is to raise the likelihood of achieving our targets by carefully assessing our analysis of the external environment and our measures
for a new earnings model (hereinafter called inorganic). Various inorganic themes have come up in each of the measures taken to reform our profit structure, but we are aware that it will take time before we have racked up some achievements. As we strive to spur such growth, we need to balance the human resources we invest in aggressive inorganic activities with each year’s figures, with an eye toward fiscal 2020 and beyond. As for reforming our corporate culture, I feel that we have carefully stuck to the numbers, and I mean that in a
Message from the President
Financial and Corporate Information
Introduction SustainabilityFoundation for Value Creation
Strategy Business Portfolio
NAGASE Group Integrated Report 201918 19NAGASE Group Integrated Report 2019
The fiscal 2019 slogan, “Do It!” captures that sense of urgency and was chosen to help raise awareness. The slogan conveys our intent: “First we must act!” I and the other top management will actively “Do” things. To continue fostering an environment where everyone will unhesitatingly be able to attempt new things, we will also evaluate the responsibility individuals take by “Doing” things. The strong drive and initiative shown in the early period after
our founding was steadily passed down to the current NAGASE Group. I want 2019 to be a year where we fully demonstrate that initiative. For fiscal 2019, we forecast* consolidated net sales of ¥850.0 billion (+5.2% year on year) and profit attribut-able to owners of the parent of ¥20.5 billion (+1.8% year on year).*Assuming an exchange rate of ¥110 per U.S. dollar
Sustainability Management
Positioning ESG at the Core of Management
The NAGASE Group vision states that we realize a sus-tainable world where people live with peace of mind. As a trading company specializing in chemicals, we are aware that one of the ways we provide value is by ensur-ing that our business partners, local and international communities, governments and other stakeholders feel safe and secure, with thoroughgoing compliance in our business activities that extends from procurement and purchasing through to sales and disposal. To cement an environmental, social and governance (ESG) mindset into the core of the Group’s management, we set fiscal 2018 as the new phase of ESG. We held internal study sessions, worked to familiarize employees with basic terminology, and conducted an overall
assessment of ESG-related activities. We also gradually began to take measures aimed at achieving the United Nations Sustainable Development Goals (SDGs). These include mitigating water-related risks, addressing climate change, and protecting biodiversity. In fiscal 2019, to better define the outline of the entire NAGASE Group, we will analyze long-term risks and opportunities in the external environment. Then I would like to move ahead with establishing materiality while hold-ing deeper discussions on what kind of corporate group we should be, what kind of value we should provide, and to whom we should provide it.
See P.40, “Environment” See P.42, “Society”
Aiming to Enhance the Effectiveness of the Board of Directors
Although we have not deliberated on the separation of management and execution, we are aware of the immense importance of that separation. That is part of the reason we reduced the number of directors from ten to seven. The three former members were internal directors so this reduction will effectively amplify the voices of the two outside directors. In addition, we established a new
Nomination Committee to ensure greater transparency. We think this will further enhance the effectiveness of the Board of Directors and, in turn, improve corporate value.
See P.28, “Our Board” See P.30, “Corporate Governance Initiatives” See P.34, “Interview with the Outside Directors”
Global Governance
Since ACE-2020 began, the NAGASE Group has entered the markets of Izmir, Turkey; Lyon, France; Da Nang, Vietnam; and Karachi, Pakistan. The competition among overseas companies is heating up while customer and market needs in each region are diversifying. Moreover, headquarters’ management and decision making are also changing. Amid this situation, we will build a system to promote highly responsive management that can rapidly create
new businesses and reach investment decisions. We will do this by establishing local management companies as bases to operate and manage regional businesses. Global governance is an important issue for the NAGASE Group, and we are taking various measures to address it, espe-cially through our director in charge of corporate adminis-tration and affiliates.
See P.22, “Message from the Executive Officer in Charge of Corporate Administration and Affiliates”
Returning Profits to Shareholders / Closing Message
“Through the enhancement of its earning power and entre-preneurial structure, NAGASE adheres to an ongoing basic policy of making continuous and secured dividend payouts linked to its consolidated performance, and thus it aims to keep increasing the per-share dividend with due consider-ation given to the payout ratio and the ratio of dividends to net assets on a consolidated basis. We intend to use the retained funds effectively to support future business activi-ties and to strengthen its management foundation.” This is NAGASE’s dividend policy. For fiscal 2018 we paid out a total of ¥42 per share. This includes an interim dividend of ¥18 and the year-end dividend of ¥24. With regard to profits, while carefully bal-ancing the need for investment and sustainable business expansion, we strive to enhance comprehensive returns to
shareholders including through dividends, share repur-chases, and the disposal of treasury stock. Regarding the latter two methods, we will continue to make determina-tions in light of trends in capital markets and business performance. Under ACE-2020, the NAGASE Group stated its goal of achieving a new normal, with operating income of ¥30 billion as our new standard. In the focus areas of Life & Healthcare and Electronics, we aim to steadily carry out our slogan of “Do It !” over the remaining two years even as the level of difficult rises due to a worsening business environment in some current markets. We thank all our shareholders and investors for their continued understanding and support of the NAGASE Group over the long run.
Message from the President
Financial and Corporate Information
Introduction SustainabilityFoundation for Value Creation
Strategy Business Portfolio
NAGASE Group Integrated Report 201920 21NAGASE Group Integrated Report 2019
Capital Efficiency for Achieving ACE-2020Measures to Improve Capital Efficiency and Related Issues
Under the mid-term management plan ACE-2020, we are working to improve capital efficiency, and, as a result, we have made ROE one of our quantitative targets. ROE improvement can be separated into the pre-tax profit ratio and invested capital turnover ratio, and we are strength-ening their correlation with each of the plan’s measures. In the fiscal year ended March 31, 2019, ROE was 6.6% (+2.2%), pre-tax profit ratio was 3.5% (+1.4%), and invested capital turnover ratio was 2.1 times (+0.1 times). (Comparison with the fiscal year ended March 31, 2016) The quantitative target for ROE in ACE-2020 is more than momentarily exceeding 6.0%; it is to swiftly make that percentage our new normal. We therefore believe our current performance demonstrates the serious progress
being made toward achieving that new normal. In addition, the five-year duration of the mid-term management plan corresponds with a transformational period in our long-term management policy. Again, I’d like to reiterate that the NAGASE Group is not simply aiming to achieve a 6.0% level for capital efficiency. We have made big decisions during the duration of ACE-2020, which includes improving the profitability of our manufacturing business, establishing shared service companies, and exiting unprofitable businesses. On the other hand, to improve capital efficiency, there are issues related to the invested capital turnover ratio, and we will continue working to improve that.
Message from the Executive Officer in Charge of Corporate Administration and Affiliates
Numerical Targets under ACE-2020
8.0
4.0
0.0
(%)
3.0%
4.0%
4.2%
6.5%
4.9%
3.7%
4.4%
4.3%
6.6%
5.8%
09/3 10/3 11/3 12/3 13/3 14/3 15/3 16/3 17/3 18/3 19/3 21/3
6.5%
ROE = Post-tax Profit ÷ Equity
ROIC =Pre-tax profit × Sales amount
Sales amount Equity + Interest-bearing debt
All measures that efficientlyincrease sales with limited assets
Increase growth investment
M&A
Reduce slow-moving,long-term inventory
Utilizegroup cash management system
Idle assets liquidation
All measures that efficientlyincrease profit by reduced cost
Sales of new andadded-value products
Logistics efficiency
Utilize shared service
Withdrawfrom unprofitable business
Rationalization
Pre-tax Profit RatioInvested CapitalTurn Over Ratio
Pre-tax ROIC = Pre-tax profit ÷ (Equity + Interest-bearing debt
ROE
Normalization of 6% or higher
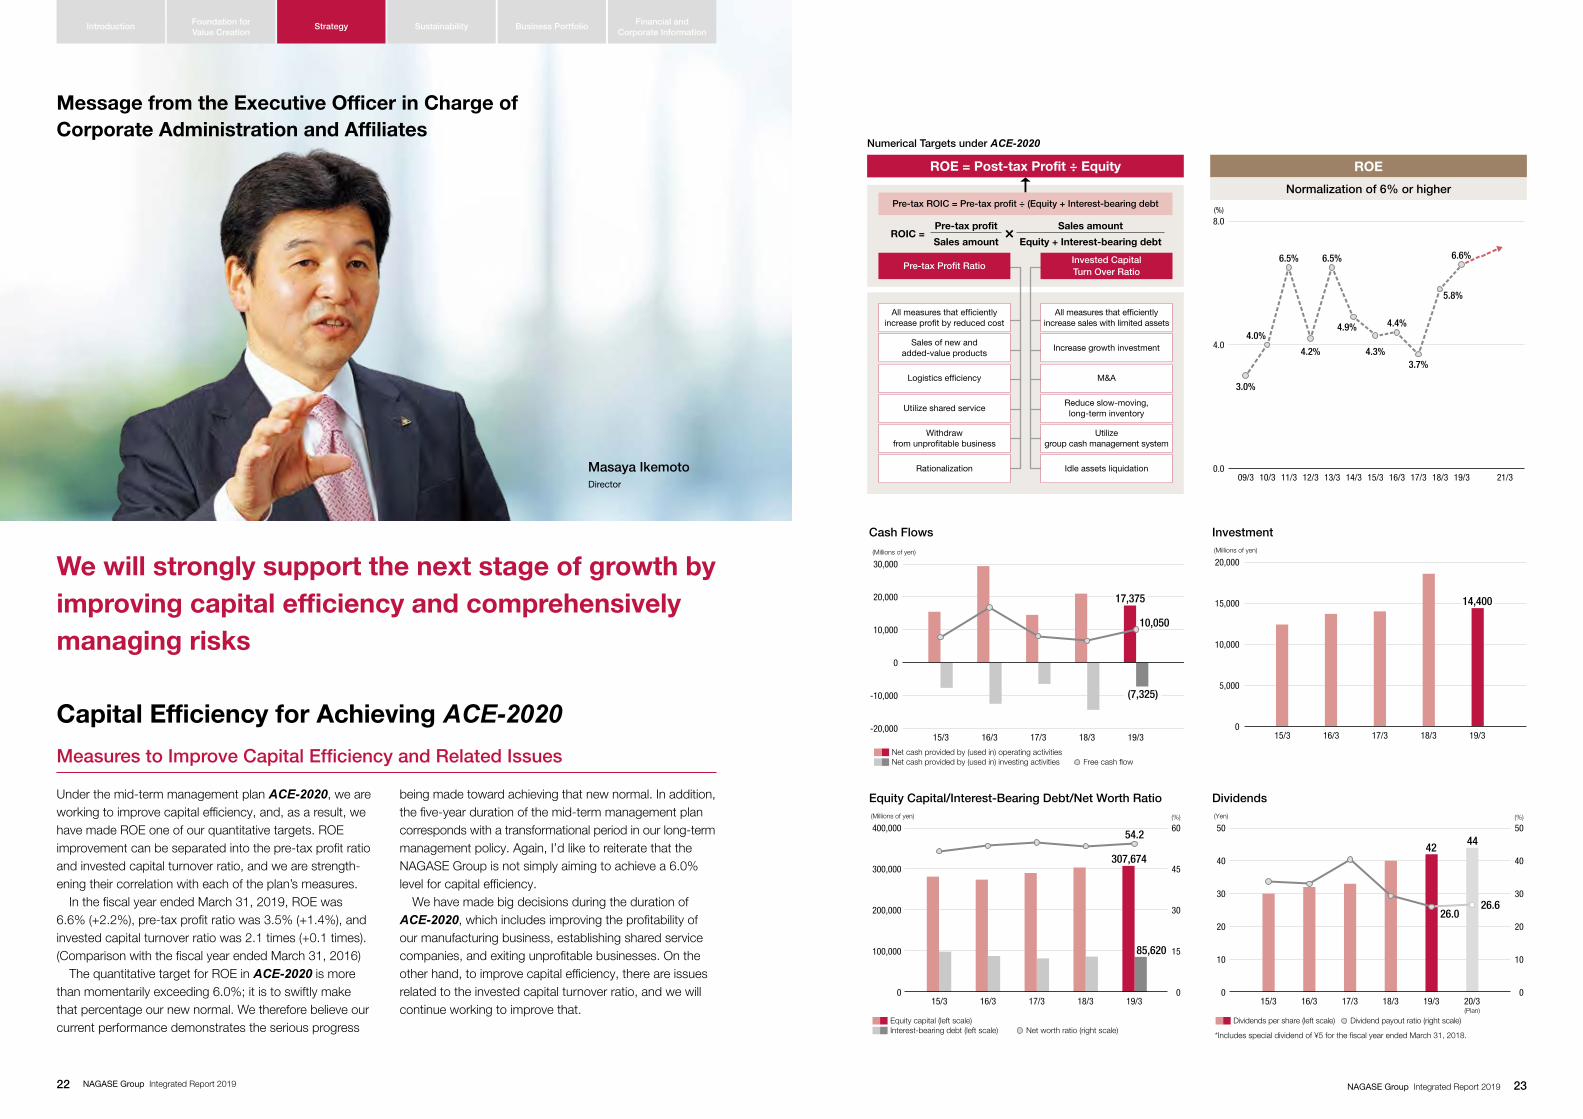
Masaya IkemotoDirector
15/3 16/3 17/3 18/3 19/3
30,000
-20,000
-10,000
0
10,000
20,000
(Millions of yen)
10,050
(7,325)
17,375
Net cash provided by (used in) operating activitiesNet cash provided by (used in) investing activities Free cash flow
400,000
0
100,000
200,000
300,000
60
0
15
30
45
(%)
15/3 16/3 17/3 18/3 19/3
85,620
307,674
54.2
(Millions of yen)
Equity capital (left scale)Interest-bearing debt (left scale) Net worth ratio (right scale)
15/3 16/3 17/3 18/3 19/3
20,000
0
5,000
10,000
15,000 14,400
(Millions of yen)
Cash Flows
Equity Capital/Interest-Bearing Debt/Net Worth Ratio
Investment
(Plan)
50
0
20
10
30
40
50
0
20
10
30
40
15/3 16/3 17/3
44
18/3 19/3 20/3
42
26.626.0
(%)(Yen)
Dividends per share (left scale) Dividend payout ratio (right scale)
Dividends
*Includes special dividend of ¥5 for the fiscal year ended March 31, 2018.
We will strongly support the next stage of growth by improving capital efficiency and comprehensively managing risks
Financial and Corporate Information
Introduction SustainabilityFoundation for Value Creation
Strategy Business Portfolio
NAGASE Group Integrated Report 201922 23NAGASE Group Integrated Report 2019

Policy on Optimizing Our Portfolio
Under ACE-2020, we are constantly taking inorganic growth measures. Many cases involve new business models where it is difficult to use the NAGASE Group’s existing experience to chart how we can create a track record of success or how long that might take. We are investing management resources in focus and growth areas while analyzing major trends in the external environ-ment, including 5G, IoT, self-driving technology, and materials informatics, but these efforts might not contrib-ute to results until after the plan concludes. I am aware that one of the important roles of the corporate adminis-trative director is to vigilantly monitor from when and to what degree each measure contributes to results.
In addition, while inorganic growth is certainly important, organic growth is also important in our long-term manage-ment policy and to achieve the goals of ACE-2020. It might seem mundane to consider how to ensure the basic businesses remain efficient and generate cash over the long term, but we must carefully monitor the situation to optimize our overall business portfolio. For example, Fitz Chem LLC, which is a distributor of specialty chemicals and personal care products in the U.S. Midwest, serves to complement the NAGASE Group’s businesses on the East and West coasts, forming a foundation for distributing var-ious products across the entire United States.
Investment Activities under ACE-2020
Investment activities accompany optimization of our busi-ness portfolio. After reflecting on past experiences, we revised our monitoring methods, and also revised our investment guidelines under ACE-2020. According to the revised standards, we will emphasize numerical results more than ever before and also use these in ranking and managing each project. The decision to exit an unprofit-
able business is made by the NAGASE Group after duly considering the decision criteria of the guidelines and the potential impact of an exit on our business partners and society as a whole. Since the plan commenced, we have formed and severed relationships with around 20 affiliate companies. The decision to replace assets is challenging, so we are constantly revising our guidelines and operations.
Regional Management to Achieve Our Long-Term Management Policy
Restructuring Global Governance: Region-Based Management
The goals laid out in the NAGASE Group’s long-term management policy (fiscal 2032) are to achieve a level of profit consistently three times higher than the fiscal year ended March 31, 2015, as well as to expand overseas
operations and restructure global governance with the dual pillars of overcoming challenges for growth and rein-forcing the management platform for growth.
The NAGASE Group has 51 overseas manufacturing bases in 14 countries around the world as of March 31, 2019. To further expand the scale of business, we are considering consolidating governance authority based on the idea of moving from local subsidiaries to region-based management. As one measure toward that end, we established a regional headquarters in China in January 2019 and another in the United States this April. For example, in the case of China, although each of our multiple local subsid-iaries are giving their best, each subsidiary varies in size and the potential business creation can be limited by the business scale of each company. By instead scaling gov-ernance up to a regional basis, we can expect a more diverse range of potential acquisitions and other growth investments determined on a regional basis, which would
be more suitable for each region. In addition, a regional platform would also strengthen compliance, checks-and-balances, and other defensive functions. We will construct a regional system that com-plements and reinforces the management-related special-ists spread across each company. This will contribute to our training and auditing systems, as well as the manage-ment of investments and risks. Ultimately, we will accelerate the appointment of local staff into key positions and thoroughly ingrain our newly constructed governance system into the local culture to achieve a new level of growth during this period of transformation.
See P.6, “Overview of the NAGASE Group” See P.12, “Our Value Creation Process and Long-Term Management Policy” See P.56, “Global Network”
Constructing a Platform of Our Manufacturing
The NAGASE Group’s manufacturing business accounts for over 40% of operating income, and its presence is growing. We are making steady progress toward our goal of improving profitability and autonomous management in the manufacturing business, which is also one of the mea-sures of ACE-2020. In our effort to create region-based management for the next stage of growth, we held the Group Manufacturing Managers Meeting, which serves as a basic platform for the NAGASE Group’s domestic man-ufacturing companies. Currently, each company is using its own standards for occupational safety and hygiene, product design, quality assurance and management, cost of sales management, human resources training, and so on. Regarding these standards, we will visualize the level of improvement and
management achieved by harmonizing these as a Group and we will continue strengthening the monitoring system. Moreover, in regard to the SDGs, including addressing water-related risks and climate change, we will coordinate our efforts as the Group manufacturing business. Furthermore, as a member of the NAGASE Group, which has a trading business and a manufacturing busi-ness, we anticipate an independent and proactive discus-sion to emerge on what the manufacturing business can do to achieve drastic growth. And then, beyond that, we aim to foster shared values that help us answer the ques-tions of how we can optimally unite the NAGASE Group’s manufacturing.
See P.34, “Interview with the Outside Directors”
In the lead up to 2032, the NAGASE Group’s 200th anniversary, we formulated a long-term management policy to achieve accelerated growth at a pace that had previously been unachievable with the systems in place. Under this policy, the Group is moving ahead with its transformation with the full participation of everyone.
Challenges for Growth
• Increase growth investment• Accelerate organic growth• Expand overseas operations
Reinforce the Management
Platform for Growth
• Restructure global governance• Increase flexibility in HR management• Enhance safety and assurance• Consolidate communications infrastructure
Long-Term Management Policy
Financial and Corporate Information
Introduction SustainabilityFoundation for Value Creation
Strategy Business Portfolio
NAGASE Group Integrated Report 201924 25NAGASE Group Integrated Report 2019

Mid-Term Management Plan ACE-2020
NAGASE Transforms from“Shosha/Trading” to “Business Designer.”NAGASE strings all the groups togetherto create and provide new value to the world through 6 key functions.
ACE-2020 Basic Policy
Reform Profit Structure
Portfolio Optimization Expand and StrengthenRevenue Base
• Categorize business and execute strate-gies suitable for each category
• Asset replacement and re-allocation• Acceleration in investment that creates
core business of group
• Accelerate globalization “G6000”• Improve manufacturing profitability
Reform Corporate Culture
Mindset StrengthenManagement Platform
• Build accountability, responsibility and risk awareness
• Share management’s message• Thorough monitoring and PDCA
• Pursue efficiency
• HR development
KGI (Key Goal Indicator)
KGI FY2016 FY2017 FY2018 FY20219 (planned) FY2020
Consolidated Net Sales 722.3 Billion Yen 783.9 Billion Yen 807.7 Billion Yen 850.0 Billion Yen 1.0 Trillion Yen or more
Consolidated Operating Income 15.0 Billion Yen 24.1 Billion Yen 25.2 Billion Yen 26.0 Billion Yen 30.0 Billion Yen or more
ROE 3.7% 5.8% 6.6% 6.0% or more 6.0% or more
KPI (Key Performance Indicator) Factor index to achieve KGI
Reform/Strategy Measures KPI (Index) FY2016 FY2017 FY2018 FY2019 (planned) FY2020
Profit Structure Reform Indicator
Increase Focused Business (Portfolio Optimization)
Operating Income in Focus Area* 11.9 B Yen 13.1 B Yen 12.6 B Yen 13.1 B Yen 16.9 B Yen
Growing Investment Distribution Ratio in Focus Area
46% 52% 82% 46% 35% or more
Accelerate Globalization (Expand and Strengthen Profit Structure)
Overseas Group Sales* 350.2 B Yen 389.0 B Yen 405.3 B Yen 420.5 B Yen 600.0 B Yen
Sales Growth Rate in the Americas 90% 103% 118% 125% 170%
Increase Manufacturing Profitability (Expand and Strengthen Profit Structure)
Operating Income from Manufacturing*
9.0 B Yen 11.4 B Yen 11.6 B Yen 12.0 B Yen 14.4 B Yen
Break-Even Point Sales Ratio* 76% 76% 76% 76% 73%
Corporate Culture Reform Indicator
Pursue Efficiency (Strengthen Management Platform)
Consolidated Selling, General and Administrative Ratio
10.6% 10.0% 9.9% 10.0% 9.4%
Financial Strategy Indicator
Investment Growth Investment 8.2 B Yen 23.5 B Yen** 32.4 B Yen 52.9 B Yen 100.0 B Yen**
Financial Structure Rating (R&I) [A] [A] [A] [A] or more [A] or more
* The figures in this chart are all simple management accounting data, which is different from the figures disclosed on the consolidated financial statements.** Total over five years
FY2016 FY2017 FY2018
Focus Areas
Life & Healthcare
• Expanded production facilities for TREHA™
• Entered the nucleic acids business and con-cluded a general distributor agreement with Shikoku Nucleic Acids Chemistry Co., Ltd.
• Established new branch in Lyon, France to expand cosmetics business in Europe
• Invested in PeptiStar, Inc. and developed next-generation pharmaceuticals
• Hayashibara Co., Ltd. concluded a long-term partnership agreement with Lonza, and construction began on a new pullulan and enzyme plant
Electronics
• Expanded our scope, mainly in chemical businesses and Chinese joint-venture Wuxi Chenghong Electronic Chemicals
• Decided to strengthen display and wearable businesses and make Inkron Oy a subsidiary
• Established a joint venture with Toyobo Co., Ltd. for the manufacture and sales of polyimide film
• Invested in Kyulux, Inc., an OLED venture
• Wuxi Chenghong Electronic Chemicals established a subsidiary in Mianyang, Sichuan Province
• Invested in 3D Glass Solutions, Inc., broadening our lineup of 5G products and expanding the semiconductor business
Growth/Emerging Areas• Invested venture capital, especially in Silicon Valley in the United States
• Established Huizhou Sanli Three Synergy Precision Co., Ltd., a car electronics joint venture company in China
• Provided additional funding for Minda Kyoraku, an automotive parts manufacturer in India
• Began joint development in materials informatics (MI)
• Entered the self-driving technology field (LiDAR-related)
• Established Infinite Material Solutions, aiming to commercialize water-soluble support materials for 3D printers
• Worked on development of Axonerve™ (an FPGA solution for associative memory in the era of 5G and IoT)
Base Areas• Acquired U.S. speciality chemical distributor Fitz Chem LLC
• Acquired DAITAI KAKO CO., LTD.
Improvement Areas• Integrated the functions of the Beauty Care Products Department and
its subsidiaries
• Withdrew from the plastic hose manufacturing business in China
Change-S2014 ACE-2020
Business S
cale
Year
Long-Term Management Policy
Stage1
Stage2
Stage3FY2018
H
The stage where we reform our profit structure and our corporate culture
Reform2016-2020
The stage where two reforms have been permeated,
accelerating growth
Growth2021-2025
The stage where we grow rapidly toward the goal
Jump2026-2032
Positioning of ACE-2020The long-term management policy spans some 17 years (2015 to 2032), which we divided into three stages. Stage 1 began with our ACE-2020 mid-term management plan. In fiscal 2019, the fourth year of ACE-2020, we will continue pushing ahead with transformation aimed at spectacular growth.
Portfolio OptimizationCategorize businesses into four areas (Growth, Focus, Base, Improvement) to drive growth and
maximize resource efficiencies
Expand and Strengthen Revenue Base
– Accelerate global expansion to grow sales overseas
– Improve manufacturing company profitability, develop new businesses
Mindset– Build accountability, responsibility, and risk awareness
– Share messages from management, engage in consistent monitoring and PDCA
Leverage Group functions to achievethe quantitative and qualitative targets.
ACE-2020 Aims FY2016–2018 FY2019
Mindset
• Build accountability, responsibility, and risk awareness and raise awareness of the mid-term management plan
• Engage in consistent monitoring and PDCA and improve the quality of investments
• Share messages from management and create better communication infrastructure
Strengthen Management Platform
• Eliminate excess/duplication and increase efficiency of the organization/function
• Develop human resource
Strengthen Management Platform
– Pursue efficiencies, human resource development
Consolidate operations and raise efficiency of Nagase Business Expert Co., Ltd.Launched a project to make back-office operations more efficient
Delegate authority and revise the Company-wide organization
Strengthen our monitoring system, create a dashboard, and revise our meeting structures
ACE-2020: Rolled over the plan, conducted a Company-wide survey, uncovered new issues and responded to them
Strengthen governance of our overseas manufacturing businesses
Introduce new investment guidelines and launch projects to promote M&A
Promote branding activities (Top Management Tours), upload videos of the president, and engage in community dialogue
Begin operating new HR programs
Establish sustainability management policies and materialityBegan considering disclosure policies for ESG activities
Develop new technologies through cross-company organizational collaboration
BusinessDesigner
Logistics
Invest-ment
R&D
GlobalNetwork Trading
Manufac- turing
Financial and Corporate Information
Introduction SustainabilityFoundation for Value Creation
Strategy Business Portfolio
NAGASE Group Integrated Report 201926 27NAGASE Group Integrated Report 2019

Our Board (As of June 21, 2019)
Directors
Executive Officers
Naoki YasubaManaging Executive OfficerHayashibara Co., Ltd.Nagase R&D Center
Takanori YamauchiManaging Executive OfficerNagase Business Expert Co., Ltd.
Satoru FujiiManaging Executive OfficerNagase ChemteX Corporation
Masatoshi KamadaExecutive OfficerCEO, Greater ChinaCEO & COO, Nagase (China) Co., Ltd.
Yasuhiro MiharaExecutive OfficerGM, Corporate Planning Department
Takahiro OkumuraExecutive OfficerEnergy Business OfficeNew Value Creation Office
Kusuo OtaExecutive OfficerGM, Colors & Advanced Processing DepartmentNagase Application Workshop
Hiroyuki UeshimaExecutive OfficerGM, Mobility Solutions DepartmentNagoya Branch
Koichi SagawaExecutive OfficerGM, Polymer Global Account Department
Akira TakamiExecutive OfficerGM, Finance DivisionGM, Accounting Division
Takayuki MasudaExecutive OfficerCEO, ASEAN and IndiaLeader, Regional Operating Centre
Yasumitsu OriiExecutive OfficerGM, New Value Creation Office
Ryuichi UchidaExecutive OfficerCEO, AmericasCEO, EuropeCEO, Nagase Holdings America Corporation
Takeshi TakadaExecutive OfficerGM, Electronics Department
Noriaki ArashimaExecutive OfficerGM, Speciality Chemicals Department
Noriyoshi YamaokaExecutive OfficerGM, Human Resources & General Affairs DivisionGM, BPR & Administration Division
1. Representative Director and ChairmanHiroshi Nagase
2. Director and Vice ChairmanReiji Nagase
3. Representative Director, President and CEOKenji Asakura
4. Representative Director and Managing Executive OfficerIchiro WakabayashiSales & Marketing
5. Director and Executive OfficerMasaya IkemotoCorporate AdministrationGroup Companies
6. Outside DirectorHidenori Nishi1975 Joined Kagome Co., Ltd. 2000 Director, Kagome Co., Ltd.2003 Director and Executive Officer,
Kagome Co., Ltd.2005 Director and Managing Executive Officer,
Kagome Co., Ltd.2008 Director and Senior Managing Executive
Officer, Kagome Co., Ltd.2009 Representative Director and President,
Kagome Co., Ltd.2014 Representative Director and Chairman,
Kagome Co., Ltd. Director, NAGASE & CO., LTD.
2016 Chairman of the Board, Kagome Co., Ltd.2018 Retired from Kagome Co., Ltd.
7. Outside DirectorNobumasa Kemori1980 Joined Sumitomo Metal Mining Co., Ltd.2006 Managing Executive Officer and Director,
Sumitomo Metal Mining Co., Ltd.2007 Representative Director and President,
Sumitomo Metal Mining Co., Ltd.2013 Representative Director and Chairman,
Sumitomo Metal Mining Co., Ltd.2016 Director and Chairman, Sumitomo Metal
Mining Co., Ltd. Director, NAGASE & CO., LTD.
2017 Executive Adviser, Sumitomo Metal Mining Co., Ltd.
Institutional FormatCorporation with Board of Directors and Audit & Supervisory Board / Executive Officer System Adopted
Total Number of Directors 7
Number of Outside Directors 2
Number of Board of Directors Meetings
16 (100% attendance rate by outside directors)
Director Term of Service One Year (same for outside directors)
Number of Compensation Committee Members
3 (2 outside directors)
Number of Independent Directors 4 (all outside directors)
Independent Auditor Ernst & Young ShinNihon LLC
Total Number of Audit & Supervisory Board Members
4
Number of Outside Audit & Supervisory Board Members
2
Number of Audit & Supervisory Board Meetings
16
Attendance ofOutside Directors’at FYE March 2019
Board Meetings
Percentage ofOutside Directors
Length of DirectorService by Years
1 24 5 6
73
100%
29%
57%
43%
Five years or longer
Less than five years
Audit & Supervisory Board Members
Audit & Supervisory Board MemberMitsuru Kanno
Outside Audit & Supervisory Board MemberNobuyuki Shirafuji1984 Joined the Sumitomo Bank, Ltd. (currently
Sumitomo Mitsui Banking Corporation)2003 General Head of the London Group of Global
Corporate Investment Dept. of Sumitomo Mitsui Banking Corporation and Sumitomo Mitsui Banking Corporation Europe Limited
2006 General Manager of Credit Dept., Europe, Middle East and Africa Division (London) of Sumitomo Mitsui Banking Corporation and
Sumitomo Mitsui Banking Corporation Europe Limited
2013 General Manager of Credit Review Dept. of Sumitomo Mitsui Banking Corporation
2016 Retired from Sumitomo Mitsui Banking Corporation Audit & Supervisory Board Member, NAGASE & CO., LTD.
Outside Audit & Supervisory Board MemberGan Matsui1980 Prosecutor, Tokyo District Public Prosecutors
Office1990 Prosecutor, Tokyo District Public Prosecutors
Office (Special Investigative Squad)2005 Director, Special Trial Department, Tokyo
District Public Prosecutors Office2010 Assistant Public Prosecutor, Osaka High
Public Prosecutors Office2012 Chief, Criminal Investigations, Supreme
Public Prosecutors Office
2014 Chief Prosecutor, Yokohama District Public Prosecutors Office
2015 Superintending Prosecutor, Fukuoka High Public Prosecutors Office
2016 Japan Federation of Bar Associations (Member, Tokyo Bar Association) Yaesu Sogo Law Office
2018 Audit & Supervisory Board Member, NAGASE & CO., LTD.
Audit & Supervisory Board MemberMasanori Furukawa
Financial and Corporate Information
Introduction SustainabilityFoundation for Value Creation
Strategy Business Portfolio
NAGASE Group Integrated Report 201928 29NAGASE Group Integrated Report 2019

Corporate Governance
Basic Approach
In line with the NAGASE Management Philosophy and to keep the promise made to stakeholders in the NAGASE Vision, we established a framework for sustainable growth in any external environment. This framework of our long-term management policy includes Challenges for Growth and Reinforce the Management Platform for Growth. We are improving our corporate value over the medium and long term guided by this framework.
We believe that rapid decision-making and execution, as well as transparency are essential for us to accomplish these initiatives as we engage in strengthening our corporate governance.
Note: Our latest Corporate Governance Report is available on our website. https://www.nagase.co.jp/english/assetfiles/tekijikaiji/20190722.pdf
M Initiatives to Strengthen Corporate Governance
-2000 2001 2002 2003 2004 2005 2006 2007 2008 2009 2010 2012 2015 2016 2017 2018 2019
President Hiroshi Nagase Kenji Asakura
Chairman of the Board of Directors
Chairman President Chairman
Separation of Management and Business Execution
20 directors
11 10 8 10 9 10 9 10 7
Adopted executive officer system (for faster decisions and stronger business execution)
Advisory Board 2 1
Outside Directors 1 2
Outside Audit & Supervisory Board Members
1994- 1 Individual, 1998- 2 Individuals
Compliance
Compliance Committee Risk Management & Compliance Committee
Established Basic Compliance Policy (2002)/Established NAGASE Group Compliance Behavior Standards (2003)
Established Compliance Call Center Rules
Internal Controls Promotion Committee
Internal Control Committee
Director Compensation
Compensation Committee
Board Member Appointment
Nomination Committee
1 Board of Directors2 Audit & Supervisory Board/
Audit & Supervisory Board Members3 General Managers’ Meeting 4 Nomination Committee
The Board of Directors is clearly posi-tioned as the body in charge of mak-ing decisions on management policies and strategies, and it super-vises the execution of operations. Holding a regular monthly meeting, the Board of Directors makes import-ant decisions, tracks business per-formance and formulates measures.
In accordance with audit policy and audit plans set at Audit & Supervisory Board meetings, Audit & Supervisory Board Members attend important meetings, such as Board of Directors meetings, and conduct audits of the execution of duties of directors based on reports solicited from sub-sidiaries on an as-needed basis.
Executive officers attend General Managers’ Meetings, where each department provides a status report. Meeting attendees discuss and for-mulate specific measures.
A majority of the members are outside directors and Audit & Supervisory Board Members. The committee deliberates on appointment proposals for directors and executive officers, and succession plans for the Chief Executive Officer. Then provides reports and recommendations to the Board of Directors with the aim of ensuring objectivity and transparency in nominations of NAGASE’s top management.
5 Compensation Committee6 Risk Management &
Compliance Committee7 Internal Control Committee 8 Security Trade Control Committee
With the majority of its members made up of outside directors, the Compensation Committee ensures the objectivity and transparency of the decision-making process regarding compensation of directors and exec-utive officers, by screening the appro-priateness of every compensation level and the compensation system to report and make recommendations to the Board of Directors.
The Risk Management & Compliance Committee establishes and strength-ens risk management and compli-ance systems that cover not only legal compliance but also corporate ethics. The committee also maintains ISO environmental management standards and promotes energy con-servation initiatives.
The committee deliberates on the basic policies for the internal control system, builds frameworks estab-lished by the internal control system, and monitors the management of the frameworks to ensure the appropri-ateness of business operations.
The Security Trade Control Committee thoroughly complies with export related laws and regulations in relation to foreign currency exchange and foreign trade for its trading of cargoes and technologies covered by such laws and regulations.
Audit
Audit Supervision
Audit
Liaison Liaison
Liaison
Shareholders’ Meeting
Independent Auditor Audit & SupervisoryBoard Members/
Audit & Supervisory Board
4(including 2 outside Audit & Supervisory
Board Members)
General Managers’ Meeting
President
Nomination Committee5
(including 3 outside directors)
Compensation Committee3
(including 2 outside directors)
Risk Management &Compliance Committee
Compliance Call Center• Internal• External
Internal Control Committee
Security Trade ControlCommittee
Audit Office
Board of Directors7
(including 2 outside directors)
12
3
5
7
8
6
In the fiscal year ended March 31, 2019, NAGASE CO.,LTD. estab-lished the Nomination Committee to ensure objectivity and transpar-ency in the nominations put forward for directors and executive officers, as well as strengthen succession planning for these posi-tions. The majority of the Committee is comprised of independent outside directors and Audit & Supervisory Members. In addition, we reduced the number of internal directors by three, reducing the total number of directors from ten to seven, with the aim of enhancing
the effectiveness and vitality of the Board of Directors. Following internal discussions and dialogue with shareholders, it was decided that the anti-takeover defense measures instituted in 2007 would not be renewed at the general meeting of shareholders held on June 21, 2019. To sustainably provide value to all stake-holders, NAGASE CO.,LTD. will continue to strengthen, manage, and monitor its governance system.
Compliance with the Corporate Governance Code (As of July 1, 2019)
NAGASE’s Corporate Governance System
4
Compensation Committee Members
Chair Kenji Asakura (Representative Director and President)
Member Hidenori Nishi (Outside Director)
Member Nobumasa Kemori (Outside Director)
Nomination Committee Members
Chair Kenji Asakura (Representative Director and President)
Member Hiroshi Nagase (Representative Director and Chairman)
Member Hidenori Nishi (Outside Director)
Member Nobumasa Kemori (Outside Director)
Member Gan Matsui (Outside Audit & Supervisory Board Member)
Supervision
Financial and Corporate Information
Introduction SustainabilityFoundation for Value Creation
Strategy Business Portfolio
NAGASE Group Integrated Report 201930 31NAGASE Group Integrated Report 2019
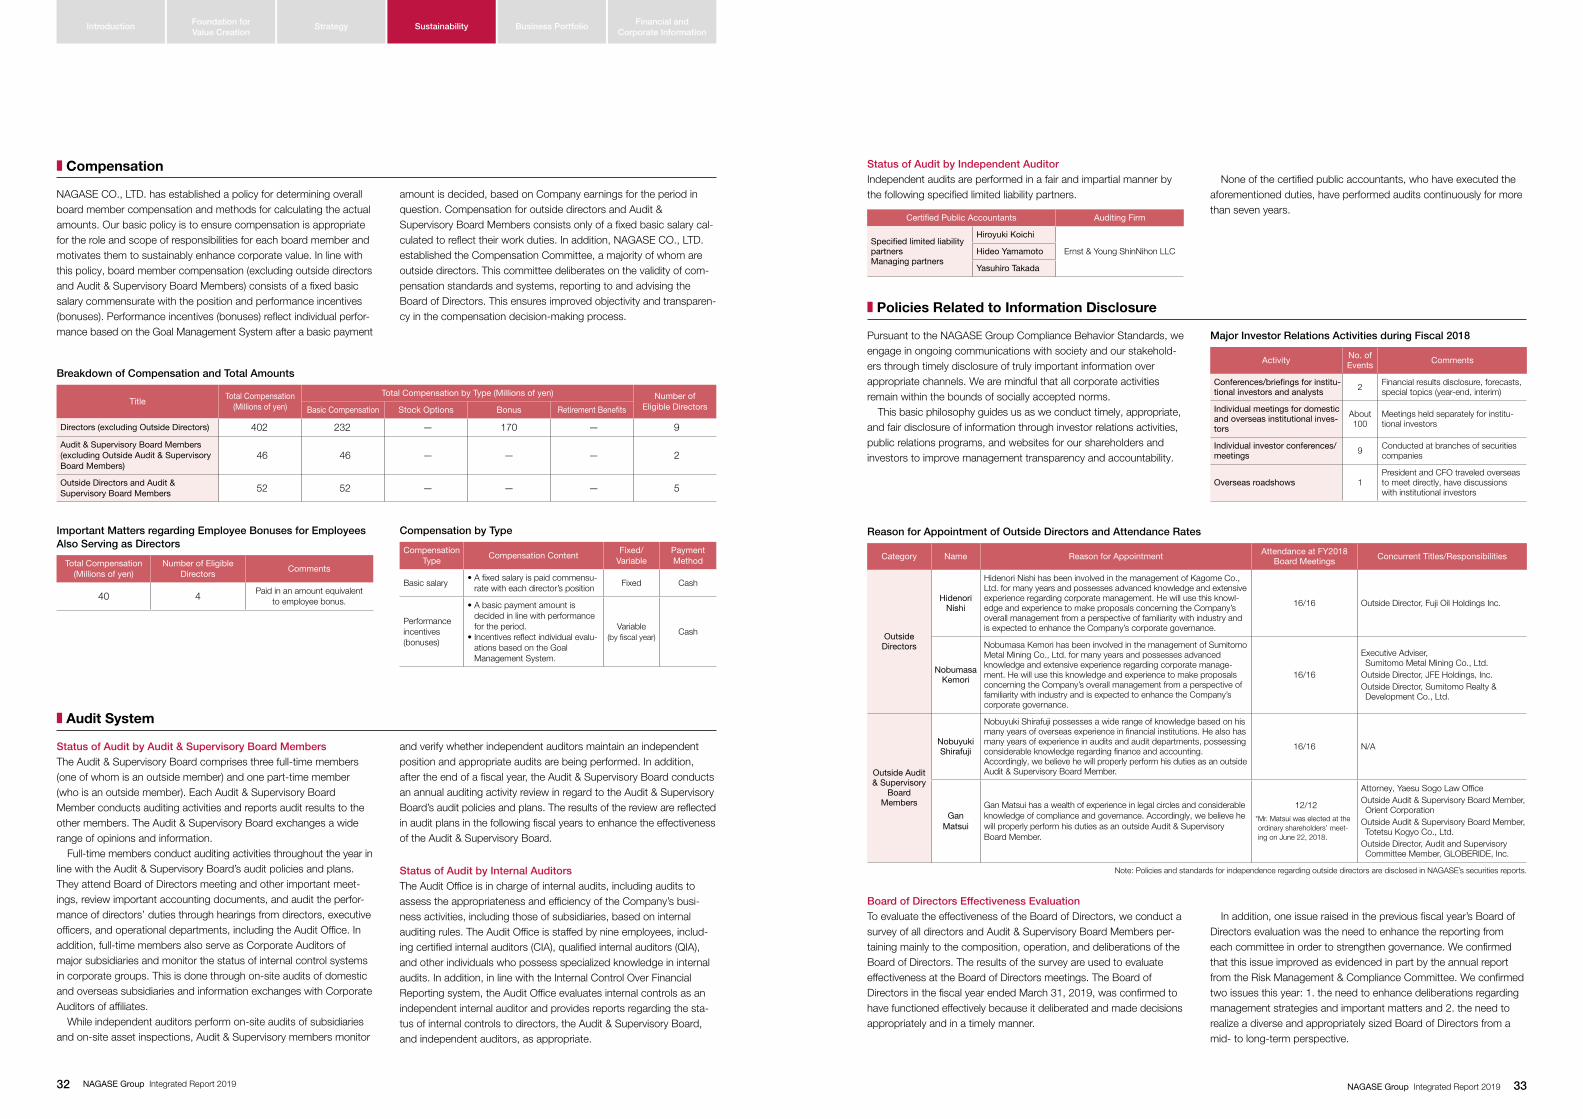
Status of Audit by Independent AuditorIndependent audits are performed in a fair and impartial manner by the following specified limited liability partners.
None of the certified public accountants, who have executed the aforementioned duties, have performed audits continuously for more than seven years.
NAGASE CO., LTD. has established a policy for determining overall board member compensation and methods for calculating the actual amounts. Our basic policy is to ensure compensation is appropriate for the role and scope of responsibilities for each board member and motivates them to sustainably enhance corporate value. In line with this policy, board member compensation (excluding outside directors and Audit & Supervisory Board Members) consists of a fixed basic salary commensurate with the position and performance incentives (bonuses). Performance incentives (bonuses) reflect individual perfor-mance based on the Goal Management System after a basic payment
amount is decided, based on Company earnings for the period in question. Compensation for outside directors and Audit & Supervisory Board Members consists only of a fixed basic salary cal-culated to reflect their work duties. In addition, NAGASE CO., LTD. established the Compensation Committee, a majority of whom are outside directors. This committee deliberates on the validity of com-pensation standards and systems, reporting to and advising the Board of Directors. This ensures improved objectivity and transparen-cy in the compensation decision-making process.
M Compensation
Breakdown of Compensation and Total Amounts
TitleTotal Compensation
(Millions of yen)
Total Compensation by Type (Millions of yen) Number of Eligible DirectorsBasic Compensation Stock Options Bonus Retirement Benefits
Directors (excluding Outside Directors) 402 232 — 170 — 9
Audit & Supervisory Board Members (excluding Outside Audit & Supervisory Board Members)
46 46 — — — 2
Outside Directors and Audit & Supervisory Board Members 52 52 — — — 5
Important Matters regarding Employee Bonuses for Employees Also Serving as Directors
Total Compensation(Millions of yen)
Number of Eligible Directors
Comments
40 4 Paid in an amount equivalent to employee bonus.
Compensation by Type
Compensation Type
Compensation ContentFixed/
VariablePayment Method
Basic salary• A fixed salary is paid commensu-
rate with each director’s positionFixed Cash
Performance incentives (bonuses)
• A basic payment amount is decided in line with performance for the period.
• Incentives reflect individual evalu-ations based on the Goal Management System.
Variable(by fiscal year)
Cash
Status of Audit by Audit & Supervisory Board MembersThe Audit & Supervisory Board comprises three full-time members (one of whom is an outside member) and one part-time member (who is an outside member). Each Audit & Supervisory Board Member conducts auditing activities and reports audit results to the other members. The Audit & Supervisory Board exchanges a wide range of opinions and information. Full-time members conduct auditing activities throughout the year in line with the Audit & Supervisory Board’s audit policies and plans. They attend Board of Directors meeting and other important meet-ings, review important accounting documents, and audit the perfor-mance of directors’ duties through hearings from directors, executive officers, and operational departments, including the Audit Office. In addition, full-time members also serve as Corporate Auditors of major subsidiaries and monitor the status of internal control systems in corporate groups. This is done through on-site audits of domestic and overseas subsidiaries and information exchanges with Corporate Auditors of affiliates. While independent auditors perform on-site audits of subsidiaries and on-site asset inspections, Audit & Supervisory members monitor
and verify whether independent auditors maintain an independent position and appropriate audits are being performed. In addition, after the end of a fiscal year, the Audit & Supervisory Board conducts an annual auditing activity review in regard to the Audit & Supervisory Board’s audit policies and plans. The results of the review are reflected in audit plans in the following fiscal years to enhance the effectiveness of the Audit & Supervisory Board.
Status of Audit by Internal AuditorsThe Audit Office is in charge of internal audits, including audits to assess the appropriateness and efficiency of the Company’s busi-ness activities, including those of subsidiaries, based on internal auditing rules. The Audit Office is staffed by nine employees, includ-ing certified internal auditors (CIA), qualified internal auditors (QIA), and other individuals who possess specialized knowledge in internal audits. In addition, in line with the Internal Control Over Financial Reporting system, the Audit Office evaluates internal controls as an independent internal auditor and provides reports regarding the sta-tus of internal controls to directors, the Audit & Supervisory Board, and independent auditors, as appropriate.
M Audit System
Certified Public Accountants Auditing Firm
Specified limited liability partnersManaging partners
Hiroyuki Koichi
Ernst & Young ShinNihon LLCHideo Yamamoto
Yasuhiro Takada
Pursuant to the NAGASE Group Compliance Behavior Standards, we engage in ongoing communications with society and our stakehold-ers through timely disclosure of truly important information over appropriate channels. We are mindful that all corporate activities remain within the bounds of socially accepted norms. This basic philosophy guides us as we conduct timely, appropriate, and fair disclosure of information through investor relations activities, public relations programs, and websites for our shareholders and investors to improve management transparency and accountability.
M Policies Related to Information Disclosure
Major Investor Relations Activities during Fiscal 2018
Activity No. of Events Comments
Conferences/briefings for institu-tional investors and analysts 2 Financial results disclosure, forecasts,
special topics (year-end, interim)
Individual meetings for domestic and overseas institutional inves-tors
About 100
Meetings held separately for institu-tional investors
Individual investor conferences/meetings 9 Conducted at branches of securities
companies
Overseas roadshows 1President and CFO traveled overseas to meet directly, have discussions with institutional investors
Reason for Appointment of Outside Directors and Attendance Rates
Category Name Reason for Appointment Attendance at FY2018 Board Meetings Concurrent Titles/Responsibilities
Outside Directors
Hidenori Nishi
Hidenori Nishi has been involved in the management of Kagome Co., Ltd. for many years and possesses advanced knowledge and extensive experience regarding corporate management. He will use this knowl-edge and experience to make proposals concerning the Company’s overall management from a perspective of familiarity with industry and is expected to enhance the Company’s corporate governance.
16/16 Outside Director, Fuji Oil Holdings Inc.
Nobumasa Kemori
Nobumasa Kemori has been involved in the management of Sumitomo Metal Mining Co., Ltd. for many years and possesses advanced knowledge and extensive experience regarding corporate manage-ment. He will use this knowledge and experience to make proposals concerning the Company’s overall management from a perspective of familiarity with industry and is expected to enhance the Company’s corporate governance.
16/16
Executive Adviser, Sumitomo Metal Mining Co., Ltd.Outside Director, JFE Holdings, Inc.Outside Director, Sumitomo Realty & Development Co., Ltd.
Outside Audit & Supervisory
Board Members
Nobuyuki Shirafuji
Nobuyuki Shirafuji possesses a wide range of knowledge based on his many years of overseas experience in financial institutions. He also has many years of experience in audits and audit departments, possessing considerable knowledge regarding finance and accounting. Accordingly, we believe he will properly perform his duties as an outside Audit & Supervisory Board Member.
16/16 N/A
Gan Matsui
Gan Matsui has a wealth of experience in legal circles and considerable knowledge of compliance and governance. Accordingly, we believe he will properly perform his duties as an outside Audit & Supervisory Board Member.
12/12
* Mr. Matsui was elected at the ordinary shareholders’ meet-ing on June 22, 2018.
Attorney, Yaesu Sogo Law OfficeOutside Audit & Supervisory Board Member, Orient CorporationOutside Audit & Supervisory Board Member, Totetsu Kogyo Co., Ltd.Outside Director, Audit and Supervisory Committee Member, GLOBERIDE, Inc.
Board of Directors Effectiveness EvaluationTo evaluate the effectiveness of the Board of Directors, we conduct a survey of all directors and Audit & Supervisory Board Members per-taining mainly to the composition, operation, and deliberations of the Board of Directors. The results of the survey are used to evaluate effectiveness at the Board of Directors meetings. The Board of Directors in the fiscal year ended March 31, 2019, was confirmed to have functioned effectively because it deliberated and made decisions appropriately and in a timely manner.
In addition, one issue raised in the previous fiscal year’s Board of Directors evaluation was the need to enhance the reporting from each committee in order to strengthen governance. We confirmed that this issue improved as evidenced in part by the annual report from the Risk Management & Compliance Committee. We confirmed two issues this year: 1. the need to enhance deliberations regarding management strategies and important matters and 2. the need to realize a diverse and appropriately sized Board of Directors from a mid- to long-term perspective.
Note: Policies and standards for independence regarding outside directors are disclosed in NAGASE’s securities reports.
Financial and Corporate Information
Introduction SustainabilityFoundation for Value Creation
Strategy Business Portfolio
NAGASE Group Integrated Report 201932 33NAGASE Group Integrated Report 2019

The Role of Outside Directors
Nishi: Throughout the entire NAGASE Group, everyone is working together to create value by leveraging six func-tions to realize new synergies. Although the manufacturing function is not quite where it should be in terms of engraining important manufacturing concepts, this is steadily improving through various exchanges and discus-sions within the Group. I have also been tapping into my management experience at Kagome Co., Ltd. to monitor operations and provide advice related to manufacturing management.
Kemori: Outside directors bring different experiences than their counterparts from inside the company. I have experi-ence as a Director at Sumitomo Metal Mining Co., Ltd. Fundamentally, however, I don’t think there is that much difference between the two companies. Accordingly, regarding the same management point, I try to facilitate thorough discussion at the Board of Directors meetings while providing a different point of view. As for monitoring, I act as a check on management and am vigilant not to undervalue the more procedural aspects of the job, such as those pertaining to basic formalities.
Interview with the Outside Directors
Corporate Governance of the NAGASE Group
Nishi: I think disciplined autonomy is pivotal. Unless this is established, governance cannot fundamentally improve, regardless of the form of governance or how many out-side directors are appointed. Autonomy means each indi-vidual fully understands the standards and willingly follows them. Based on that, it is important to regularly consider systems that complement autonomy with third-party over-sight to keep up with the changing times. To do that, the key is to identify stakeholders in a real sense, similar to Kagome’s strategies including potential users aligninig with its shareholders.
Kemori: There have been several cases of Japanese com-panies that were unable to rein in out-of-control managers. That kind of situation currently seems inconceivable at the NAGASE Group, but it is still important to plan for environ-mental factors similar to those cases. In addition, at Kagome and Sumitomo Metal Mining, respectively, Mr. Nishi and I have experienced a wide range of successes and failures. There is rarely an occasion when a discussion lacks reality because of NAGASE’s inexperience. Therefore, I think what is clearly vital is that we enrich discussion by sharing the lessons and perspectives gained from our experiences.
The Strengths and Future Potential of the NAGASE Group
Nishi: One of the Group’s clear strengths is the fact that it infuses R&D and manufacturing functions into the regions and networks it has cultivated as a trading house. Looking at it from the perspective of resource allocation, you could also call this dispersion. This approach could become a weakness, but at present, the NAGASE Group allocates resources while keeping an eye on the big picture. Because the Group is currently lining up individual ele-ments, it needs to unite these going forward to create a large wave, with an awareness of the increasing impor-tance of the Board of Directors.
Kemori: I concur with Mr. Nishi although I might use dif-ferent words. The NAGASE Group has a strong network as a trading house as well as manufacturing subsidiaries with global potential, namely Nagase ChemteX Corporation and Hayashibara Co., Ltd. I believe that if the Group can develop these three important strategic resources under a big picture, there will be new growth trajectories. On the other hand, because growth trajecto-ries lead to bigger risks, the Board of Directors needs to engage in thorough discussion of these matters.
The NAGASE Group’s Corporate Culture and Medium- to Long-Term Growth
Nishi: I see many good people in the NAGASE Group. Looking at it another way, however, you could also say that there isn’t much pointing out. In my experience, that can mean things are great when the sailing is smooth. When you try to effect a change, however, there’s always the possibility that it could end up failing. You should keep what works and point out what doesn’t work in order to foster a culture where everyone strives to raise the bar. I hope everyone is excited about what’s to come for the NAGASE Group in the next few years as it gains a new business model and management skill set.
Kemori: One of the reasons I accepted the role of outside director was the NAGASE Group’s Management Philosophy to maintain the highest standard of integrity. Many com-panies with long histories, including Sumitomo Metal Mining, are basically earnest and hard working. You could say that the NAGASE Group, in actuality, is a group of sincere, dedicated individuals. In addition, as Mr. Nishi said, I have a strong impression of the good people in the Group. However, that is completely separate from my assessment of their work. I pointedly ask about work-related achieve-ments and clarify the factors behind poor performance so it becomes a valuable asset and facilitates future accom-plishments. The NAGASE Group is in the middle of a major growth phase. I hope everyone enthusiastically supports this growth over a medium- to long-term perspective.
Enhancing Board Effectiveness to Ensure Medium- to Long-Term Growth
Nobumasa KemoriOutside DirectorExecutive Adviser, Sumitomo Metal Mining Co., Ltd.
Hidenori NishiOutside DirectorFormer Chairman of the Board, Kagome Co., Ltd.
Financial and Corporate Information
Introduction SustainabilityFoundation for Value Creation
Strategy Business Portfolio
Dialoguefor Value Creation
NAGASE Group Integrated Report 201934 35NAGASE Group Integrated Report 2019

Risk Management
M Internal Controls
The NAGASE Group established an internal control system to build a stable and sustainable corporate foundation for the Group with the aim of enhancing corporate value through corporate activities. In line with the Management Philosophy of maintaining highest integrity, the
internal controls of the NAGASE Group monitor the construction and operation of frameworks defined under the internal control system and ensures the propriety of operations.
Addressing Company-wide Risks
1. Framework to ensure that duties executed by directors and employees comply with laws, regulations, and the Articles of Incorporation
2. Framework related to preserving and managing data regarding the execution of duties by directors
3. Rules and other frameworks related to management of loss risks
4. Framework to ensure that directors are efficiently executing their duties
5. Framework to ensure the propriety of operations throughout the Group comprising the Company and its subsidiaries
6. Matters related to employees Audit & Supervisory Board Members need to support their work
7. Matters related to ensuring the effectiveness of Audit & Supervisory Board Member directions and the independence of the abovementioned employees from directors
8. Framework for directors and employees to report to Audit & Supervisory Board Members and framework related to other reports to Audit & Supervisory Board Members
9. Framework to ensure that other audits by Audit & Supervisory Board Members are being conducted effectively
Basic Policy of Internal Controls (Index)
Note: The basic policy related to internal controls is available on our website. https://www.nagase.co.jp/english/csr/governance/
M Compliance
The Risk Management & Compliance Committee formulates the NAGASE Group Basic Compliance Policy to ensure corporate activi-ties are strictly in line with the NAGASE Group Code of Conduct. Should an illegal act or other issue be discovered at NAGASE & CO. or a group company, such should be reported immediately to the Risk Management & Compliance Committee, which shall report promptly to the Board of Directors and the Audit & Supervisory Board. In addition, the Company has introduced a compliance hotline whereby directors, officers, employees and others, including those from Group companies, can report or discuss issues directly.
Compliance Regulation System
Management Philosophy
Basic Compliance Policy
Code of Conduct
1. Comply with applicable laws and regulations; conform to internal rules • Conduct business fairly and in good faith, in keeping with laws, company rules and social norms. • Conduct work in keeping with internationally accepted norms to ensure our growth as a global enterprise. • Comply strictly with domestic and foreign laws including laws regarding bribery and competition laws.
2. Eliminate anti-social elements We firmly reject any anti-social elements that threaten the public order and safety.
3. Provide useful products and services Contribute to society through useful goods and services.
4. Respect employee personality and individuality We foster a corporate culture in which employees can contribute with their independence and creativity. We will protect employee health, respect their basic rights, and treat them fairly and without discrimination. We will provide a safe and
enriching work environment for our employees.
5. Disclose information We will ensure management transparency by fairly disclosing corporate information to our stakeholders, including our customers,
suppliers, employees, and shareholders.
6. Protect the global environment We recognize and perform on our responsibility to improve the environment.
7. Responsibilities to top management The top management of all NAGASE Group members shall take the lead to ensure that the business is administered “with the highest
standard of dignity as a member of society”.
Under its Code of Conduct, the NAGASE Group is ensuring strict compliance with laws, regulations, and rules as well as internal regu-lations and rules. The risk of cartel enforcement, particularly surcharges, under the Antimonopoly Act can have a major impact on a business. Accordingly, the NAGASE Group actively conducts education activi-ties, mainly for our manufacturing companies, to ensure there is no involvement in unfair trade. We intend to strengthen our approach to the prevention of bribery of foreign public officials with respect to Japan’s Unfair Competition Prevention Act. To ensure strict compli-ance with anticorruption measures, we are also educating employees worldwide regarding bribery prevention regulations, reflecting consid-erations of extraterritorial application of the U.S. Foreign Corrupt Practices Act and the UK Bribery Act.
M Fair Business Practice Initiatives
M Information Security
The NAGASE Group strongly recognizes the importance of protecting data assets owned and managed in the course of conducting busi-ness activities. The economic and social losses incurred from infor-mation leaks and other accidents are incalculable. As for information security measures, all NAGASE Group employees are aware of the importance and need to work together Group-wide on this matter. Regarding the promotion of information security, we have estab-lished the Basic Policy of Information Security, as well as the Guideline for Information Security Measures which comprehensively detail recommended security levels and rules that need to be followed. In addition, each Group company creates a manual detailing rules and things to be careful about during daily tasks as well as various rules and procedures outlining how to implement information security countermeasures. We are also fostering greater awareness among all employees through regular education and training.
Basic Compliance Policy
The NAGASE Group has both trading house and manufacturing functions and operates multifaceted global businesses, exposing itself to various risks associated with the unique features of its businesses. We therefore need to realize sustainable growth while minimizing harm from emerging risks. Each relevant department has accurately assessed the internal and external risks related to business activities and enacted countermeasures to improve the situation.
Note: Specifically, we established the Risk Management & Compliance Committee to monitor risk management and compliance. We have defined its functions and authority, and it operates under a framework with clear roles and responsibilities.
Sp
ecific R
isks
Product Safety and Quality Control
Security Trade Controls
Regulatory Compliance in
Products
Enterp
rise R
isks
Internal controls (including financial reporting)
Compliance
Data security
BCPs/Business crisis management
Main Risk Countermeasures
Information Security Policy and Related Rules
Countermeasure Guidelines
Various Rules and ProceduresSecurity Protocol Manual
Basic Policy
Group LevelInform
ation Security Policy
Group Company
LevelRelated Rules
Education Activities (Fiscal 2018)
July 2018 Targets: All employees of Hayashibara Co., Ltd., Nagase ChemteX Corporation, Totaku Industries, Inc., Nagase Medicals Co., Ltd.
Content: Compliance awareness survey
October 2018 Targets: Sales representatives of Totaku Industries, Inc.Content: Explanation of the Antimonopoly Act
(fixing resale price, cartels)
November 2018 Targets: Managers of Hayashibara Co., Ltd., Nagase ChemteX Corporation, Totaku Industries, Inc., Nagase Medicals Co., Ltd.
Content: Presentations on current status of each company based on the results of a compliance awareness survey
February 2019 Targets: All employees of Hayashibara Co., Ltd.Content: Explanation of the Antimonopoly Act
(fixing resale price, cartels)
March 2019 Targets: Group manufacturing company managersContent: Overall explanation of compliance activities
Basic Approach
Note: The Basic Compliance Policy is also available on our website. https://www.nagase.co.jp/english/csr/compliance/policy/
Financial and Corporate Information
Introduction SustainabilityFoundation for Value Creation
Strategy Business Portfolio
NAGASE Group Integrated Report 201936 37NAGASE Group Integrated Report 2019

Each NAGASE Group company has taken steps to mitigate such risks as those related to natural disasters that could impact the conti-nuity of business activities as well as the safety and lives of employees. NAGASE has enacted measures for crisis prevention to protect human life and assets as well as business continuity plans (BCPs) to ensure steady operations. As for crisis prevention activities, we annu-ally conduct one drill that coordinates our major domestic bases of Tokyo, Nagoya, and Osaka, checking the first responses during times of crisis, such as the transfer of head office functions. As for BCPs, each department has formulated a recovery plan to assure delivery to major business partners.
Ensuring Satellite Office Functions during CrisesThe NAGASE Group’s training facility NAGASE Global HR Development Center in Shibuya, Tokyo is highly resilient to earth-quakes and is equipped with power generators. In an emergency in which the Tokyo head office cannot be used, this facility will function as a satellite office with a 150-person capacity.
The safe handling of chemicals is an important foundation underpin-ning the NAGASE Group’s businesses. At NAGASE, we continue to improve product-related compliance and centralized information management, including management of chemical products. All the products we deal in are subject to our management system. This allows us to comply properly with any laws or regulations that affect our products.
M Specific Compliance FrameworkThe NAGASE Group monitors related laws for the chemical compo-nents and regulated effects of new products we plan to introduce to the market. We register each chemical component to ensure com-pliance with every country’s laws and regulations that cover particu-lar components. Information related to these products is registered in the aforementioned Product Management System database in an effort to centralize the Group’s management of said information. By joining relevant industry organizations, we have access to the latest information regarding chemical regulations. We endeavor to pass on accurate information to relevant parties in part through our use of chemSHERPA, a tool for sharing information on chemical substanc-es contained in products across the supply chain.
M Responding to Global Chemical Laws and RegulationsThe Strategic Approach to International Chemical Management (SAICM) adopted at the 2002 World Summit on Sustainable Development—also known as the Johannesburg Summit—is aimed at ensuring that, by the year 2020, chemicals are produced and used in ways that minimize significant adverse impacts on the environment and human health. In accordance with this policy, the entire world is adopting more strict and standardized regulations concerning chemical management. Accordingly, we anticipate global regulatory trends related to chemical management, working with our overseas subsidiaries to educate, provide instructions, and adopt product management systems. In this way, we facilitate the global management of information related to chemical substances to provide accurate, up-to-date information to our business partners.
The NAGASE Group considers product safety and quality control a major social responsibility in order to provide customers with safe products and build a safe and secure society. According to the NAGASE Group Product Safety Principles, we strive to ensure the
safety of products through Group-wide rules and education. In addi-tion, the Quality Management Section of the Legal Division provides management of vendors and manufacturing contractors, support to Group manufacturing companies, and internal education.
Trade is the foundation of the NAGASE Group’s activities. To conduct appropriate trade in line with laws and regulations as a member of international society, the Security Trade Control Committee works to understand the export control situation, follow the latest revisions to the Foreign Exchange and Foreign Trade Control Law, and ascertain a detailed picture of export controls across the entire Group, while formulating related Group policies. The Item Compliance Management Council is in charge of directing and educating each business division and Group company in matters and statute updates determined by the Security Trade Control Committee. It is the responsibility of the Item Compliance Management Council to protect the Company and affiliates against the risk of illegal acts.
M Specific Import-Export Management FrameworkInformation about our export products, technologies, and overseas customers is stored in and managed via our proprietary Product Management System. We confirm whether certain products or Technologies are subject to restriction under the rules of the Foreign Exchange and Foreign Trade Control Law and the U.S. Export
Administration Regulations. Only those products approved by the Item Compliance Management Section are put into the system as products allowed for export. Going one step beyond mere adherence to the law, we define policies for the entire NAGASE Group associated with security trade controls that, as a rule, prohibit trade of products that are military- related items or that have military applications.
M Efforts to Promote Personnel DevelopmentThe practical business of security trade controls changes every year. To keep pace with developments, the NAGASE Group encourages its employees—primarily those involved in export operations—to become Security Trade Control Associates by taking the exam offered by the Center for Information on Security Trade Controls (CISTEC).
Security Trade Controls
Regulatory Compliance in Products
Product Safety and Quality Control
The Group’s Approved Operations and Products
Manufacture of poisonous and deleterious substances
Import of poisonous and deleterious substances
General sale of poisonous and deleterious substances
Manufacture of pharmaceuticals Categories: packaging, labeling, storage
Sale of pharmaceuticals
Manufacture of veterinary pharmaceuticals Categories: packaging, labeling, storage
Wholesale of veterinary pharmaceuticals
Export of narcotics, etc.
Import of narcotics, etc.
Wholesale and retail of specified narcotics, etc.
Export of psychotropics
Import of psychotropics
Export of stimulants raw materials
Import of stimulants raw materials
Handling of stimulants raw materials
Manufacture and sale of Class II medical devices
Sale of high-pressure gas (type 1)
Sale of high-pressure gas (type 2)
Sale of agrochemicals
Sale of fertilizers
Import of animal feed
Sale of animal feed
Import of feed additives
Sale of feed additives
Sale of liquor
Import of alcohol
Sale of alcohol
Wholesale of salt
Specified sale of salt (import/export)
Construction (installation of machinery and equipment)
M Crisis Prevention and Business Continuity Planning
We established the Crisis Management Guidelines to prepare for a business crisis that could disrupt business continuity. The guidelines aim to build a system that can swiftly and appropriately launch on-site first responses as well as a Group-wide organizational response, encompassing an assessment of the real situation, status
reports, action guidance, and more. Another aim is to raise aware-ness of this system. In an emergency, we will strive to maintain the stability of our business operations and minimize stakeholder losses under the Crisis Management Guidelines.
M Business Crisis Management
Crisis Prevention Activities
Protect human life and assets
• Prevent damage from disasters (reinforce anti-seismic structures, hold drills, etc.)
• Ensure rapid first response to emer-gencies (Crisis Prevention Head Office)
• Prevent collateral disaster damage• Enact measures for stranded employees• Recover safely
BCPs
Ensure steady operations
• Maintain the value chain• Continue deliveries at an alternate site• Prioritize activities that preserve trust
and credibility
Measures in Various Countries to Implement SAICM
Responses to Individual Risks
M Nagase ChemteX Corporation
Nagase ChemteX’s Fukuchiyama Plant, which manufactures food additives and health food materials, manages everything from the acceptance of raw materials and manufacturing to quality assurance and product delivery. These practices comply with ISO 9001, Food Additive Good Manufacturing Practices, and FSSC 22000, which is an international standard for food safety that we plan to acquire in fiscal 2019.
M Hayashibara Co., Ltd.
Hayashibara has acquired FSSC 22000 certification for its mainstay product TREHA™. In addition, Hayashibara follows applicable GMPs for its active pharmaceutical ingredients, and pharmaceutical excipi-ents in the management of everything from the accep-tance of raw materials and manufacturing to quality assurance and product delivery.
Nagase ChemteX’s Fukuchiyama Plant Hayashibara’s functional saccharide plant
NAGASE Global HR Development Center
Qualified Security Trade Associates (Cumulative)
Fiscal year ended March 31, 2017 856
Fiscal year ended March 31, 2018 890
Fiscal year ended March 31, 2019 947
Region/Country Inventory GHS
Japan Chemical Substance Control LawIndustrial Safety and
Health Act
United States TSCA HCS (OSHA)
EU REACH CLP
China China REACHRegulations on the Safe Management
of Hazardous Chemicals
South Korea K-REACHOccupational Safety and
Health Act
TaiwanToxic and Chemical Substances
of Concern Control ActOccupational Safety and
Health Act
ASEAN Under development in each country Under development in each country
Note: The Product Safety Principles are available on our website. https://www.nagase.co.jp/english/csr/compliance/product-safety-principles/
Inventory: Existing chemical substance lists in each countryGHS: Globally Harmonized System of Classification and Labeling of Chemicals
Financial and Corporate Information
Introduction SustainabilityFoundation for Value Creation
Strategy Business Portfolio
NAGASE Group Integrated Report 201938 39NAGASE Group Integrated Report 2019

Environment
M Basic Environmental Approach
The NAGASE Group aims to realize a sustainable world where peo-ple live with peace of mind. We believe a prerequisite of this vision is a sustainable global environment. Currently, changes in the global environment are pressuring com-panies and individuals to make big decisions.
The NAGASE Group helps realize a sustainable society by actively working to solve environmental problems, including by promoting a low-carbon society, realizing a recycling society, preventing pollution, preserving biodiversity, and efficiently using water.
Environmental Management
Environmental Management Structure
1 Comply with all environmental laws, regulations and other rules
We will observe all environmental laws, municipal bylaws, environmen-tal regulations and other rules as we conduct our business activities.
2 Develop businesses that give full consideration to environmental issues
We will conduct our business activities in full awareness of the need to preserve ecosystems and protect the environment, and we will make every possible effort to give full consideration to the environment within the limits of technological and economic feasibility.
3 Fulfill our responsibilities as a good corporate citizen As a good corporate citizen, we will work together with public institu-
tions, industries, and local communities to promote environmental con-servation measures that are suitable for the NAGASE Group.
4 Environmental management systems and continuous improvement
The NAGASE Group has set environmental targets to achieve our envi-ronmental policies. Further, we have established and operate an envi-ronmental management system, striving for continuous improvement.
5 Disclose and make the relevant parties fully aware of our Environmental Policy
We will disclose our Environmental Policy to the public and make all who work for the NAGASE Group fully aware of its contents.
In line with the Revised Act on the Rational Use of Energy, NAGASE & CO., LTD. has been designated as a specified corporation by the Bureau of Economy, Trade and Industry, as our energy usage exceeds fixed levels. Consequently, since fiscal 2011, we have compiled data on the amount of energy consumed at every facility, formulating medium- and long-term energy reduction plans and submitting regular reports to the Bureau of Economy, Trade and Industry.
We adopted and operate a building energy management system (BEMS) at our Tokyo head office building, Nagoya branch office, and NAGASE Global HR Development Center. We automated controls and energy conservation operations during summer peak usage times to keep environmental settings within target levels.
M Reducing Our Ecological Footprint
M Environmental Performance Data
Environmental Policy
M Environmental Management Structure
We incorporate environmental management activities into our daily business activities. Specific activities include (1) promoting environ-mental businesses, (2) pursuing energy-efficient activities, and (3) improving operational efficiencies. One example of our environmental businesses is using the technol-ogies from our key environment and energy segment to develop and grow other businesses. We are building a system to quickly roll out products and services toward creating recycling-oriented and low-carbon societies.
One example of energy-efficient activities is the Nagase Energy Calculation Online System, or NECO System. We began operating this system in August 2008. The NECO System uses logistics voucher data to calculate domestic cargo transport volumes, helping reduce our environmental footprint through logistics efficiencies. In addition to calculating annual cargo transport volume and CO2 emissions, the system analyzes optimal transport routes to reduce CO2, aiding our efforts to reduce energy used in transportation. We are also taking action in our headquarters building to conserve energy and resources.
Electricity Usage
Fiscal 2016 Fiscal 2017 Fiscal 2018
Electricity Usage (kWh) 6,131,628 6,068,534 5,825,310
Waste and Recycling
Fiscal 2016 Fiscal 2017 Fiscal 2018
Waste (t) 189 194 193
Recycling (t) 154 156 158
Recycling (Ratio) 81.7% 80.6% 81.8%
Participating Companies: NAGASE & CO., LTD.Period: April 2016 to March 2019
CO2 Output
Fiscal 2016 Fiscal 2017 Fiscal 2018
CO2 Output (t-CO2) 3,196 3,070 2,765
Paper Usage
Fiscal 2016 Fiscal 2017 Fiscal 2018
Paper Usage (1,000 sheets) 5,431 4,603 4,585
Paper Usage (t) 23.4 19.7 19.6
CO2 Output from Logistics Activities
Fiscal 2016 Fiscal 2017 Fiscal 2018
CO2 Output (t-CO2) 1,840 2,044 2,268
Risk Management & Compliance Committee
Management
Environmental ISOManagement Organization
Environmental ISOManagement Representative
Environmental ISOManagement General Secretariat
Chief EnvironmentalManagement Representative
Environmental ManagementRepresentative
Internal Environmental
Audit Team
Secretariat
Environmental ProtectionOfficers
Eco-Leaders
Environmental ManagementRepresentative
Internal Environmental
Audit Team
Secretariat
Environmental ProtectionOfficers
Eco-Leaders
Affiliates NAGASE & CO., LTD.
M NAGASE Group Environmental Management Activities
The NAGASE Group began building an environmental management structure in May 1999 by establishing an Environmental Protection Committee, a role currently assumed by the Risk Management & Compliance Committee. The committee encouraged and supported certification for ISO 14001, an international standard for environmen-tal management systems. Today, NAGASE & CO., LTD. operates an environmental ISO organization that includes six other group compa-nies: Nagase Chemical, Nagase Plastics, Nagase Abrasive Materials, Nishinihon Nagase, Nagase Elex, and Nagase-OG Colors & Chemicals. Japan group companies Nagase ChemteX, Nagase Medicals, Totaku Industries, Nagase Techno-Engineering, Nagase Techno Service, and Fukui Yamada Chemical have received indepen-dent certification. We will continue activities to improve environmental management systems among certified group companies.
Note: The NAGASE Group Environmental Policy is available on our website. https://www.nagase.co.jp/english/csr/environment/policy/
In 2019, Fukui Yamada Chemical Co., Ltd., which manufactures Color Former functional dyes for printing receipts, tickets and more, received the 2018 Fukui Governor’s Award for Excellence in Energy Management by Businesses. This award is given to companies that take excellent energy-saving measures. Fukui Yamada Chemical is taking energy-saving measures in an effort to reduce the amount of electricity and heavy oil used at its plants. In 2016, the company established the Safety Planning and Energy-Saving Office. The company reduced its idling electricity usage by visualizing the operating status of its machines and then staggering the peak hours of multiple machines to improve efficiency.
As a result of these repeated efforts, the company was able to reduce electricity usage by around 12% and heavy oil by about 16% year on year in fiscal 2018 in terms of the energy needed to manu-facture one kilogram of products. This achieve-ment was one of the citations for the award.
The ceremony for the Fukui Governor’s Award
Fukui Yamada Chemical Received the Fukui Governor’s Award for Excellence in Energy Management by Businesses
Financial and Corporate Information
Introduction SustainabilityFoundation for Value Creation
Strategy Business Portfolio
NAGASE Group Integrated Report 201940 41NAGASE Group Integrated Report 2019

1. Internal education1 Periodic messages from top management
and broadcasts of related information
2 Instill the NAGASE Management Philosophy, NAGASE Vision, and NAGASE Way deeply into NAGASE Group employees
2. Diversity in organizations and individuals
3 Improve global communications
4 Support employees’ career development
5 Continue employing non-Japanese people and women as main career track staff and improve our corporate culture
3. Develop good places to work6 Instill awareness and activate
initiatives for continuity and productivity improvements
7 Support employees who are dealing with home care or other challenges
Themes for Diversity Promotion
Society
The NAGASE Group believes that diversity is an important part of overall corporate strategy. To nimbly respond to changes in the envi-ronment, we need to ensure we have human resources with a wide variety of ideas and perspectives, both in Japan and overseas.
Having a diverse range of employees encourages more dynamic dis-cussions and leads to new ideas that become the source of compet-itive advantage in the market. This in turn leads to the growth of both the NAGASE Group and each individual employee.
Basic Stance on Diversity
M The NAGASE Group HR Development Policy and Approach
The NAGASE Group believes that human resource development strengthens the business foundations undergirding the Group’s growth. We hold Group-wide training by job title and sponsor ongo-ing training for local staff, engaging in global unified human resource development programs that bring the comprehensive functions of the NAGASE Group to bear. HR development programs form the foundation of our corporate activities. These programs consist of an organized combination of on-the-job and off-the-job training. On-the-job training lets employees experience real-world work in a variety of roles to gain new knowledge and skills. Off-the-job training also involves training and gaining skills
through both formal lectures and self-directed learning. The NAGASE Group promotes on-the-job training, while at the same time ensuring employees are able to learn knowledge and skills for their continued growth. These programs include rank-specific training for young staff, training for managers, and position-specific training to ensure employ-ees have the necessary knowledge and skills to perform their work. We have emphasized the following three points among our various development policies. We will continue to revise Group education and training programs according to changes in the external business environment and NAGASE Group strategy.
Training and Supporting Our Human Resources
The NAGASE Group believes empowering female employees to be an important initiative for promoting diversity. We have been actively leveraging the power of our female workforce in business, by hiring more women in core roles, promoting more women to management, and expanding their career opportunities. We are also focused on fostering an environment where women can promote work life bal-ance and continue their career, by enhancing the support for employees with child rearing and caregiving needs. Although the number of women in management has improved, it is still an
ongoing challenge for us to achieve further increases. The proportion of women among all employees is also not high, so we will continue to improve the situation by increasing the number of women’s employment.
Empowering Women in the Workplace
Discussions among Employees who Have
Various Backgrounds
Frank Exchanges of Opinions
Sharing New, Value- Added Ideas
Company Growth and Contribution to Society
New Proposals to Customers
M Hiring People with DisabilitiesThe NAGASE Group strives to create a work environment where everyone can thrive together, regardless of whether they have a dis-ability or not. We respect the capabilities of each employee, and foster an environment where they can excel with reasonable accom-modation for disabilities.
M Posting Non-Japanese Employees to Core PositionsThe Group is expanding its business in various countries and regions around the globe. Based on the basic approach of respect-ing the diversity of employees’ ideas and perspectives, we are post-ing outstanding non-Japanese employees to core positions in accordance with the needs of each country, region, and company.
Hiring People with Disabilities and Posting Non-Japanese Employees to Core Positions
Our Benefit Programs for Promoting Work-Life Balance
Program Overview
Maternity leave Leave from six weeks before giving birth to eight weeks after the birth
Parental leave Leave for raising children (for both male and female employees)
Time off for childcare Time off for nursing sick/injured children
Reduced working hours for child-rearing Reduction of working hours for employees with child-rearing needs
Flextime for childcare Flexible working hours for child-rearing
Subsidy for childcare service A subsidy that covers a part of the childcare service cost
Time off for caregiving Time off for caregiving for a family member
Caregiving leave Leave for caregiving for a family member
Reduced working hours for caregiving Working hours reduced for employees with caregiving needs
Flextime for caregiving Flexible working hours for employees with caregiving needs
Subsidy for caregiving service A subsidy that covers a part of the caregiving service cost
Kurumin Logo
1 Promote globalization
• Assign employees to overseas entities • Send employees to overseas business school • Provide cross-cultural training • Offer English language training support
2 Train managers Improving awareness in competitive environment (send
employees to business school or MBA basic training, etc.)
3 Instill shared values • Provide shared value workshops in rank-specific training • Offer shared value workshops for managers • Conduct surveys regarding shared value • Revise programs as needed in line with changes in the
external environment going forward
Strengthening Management Capabilities and Operating Skills and Fostering Globally Proficient Personnel
Note: The Group’s HR development programs is available on our website. https://www.nagase.co.jp/english/csr/employees-relations/
Financial and Corporate Information
Introduction SustainabilityFoundation for Value Creation
Strategy Business Portfolio
NAGASE Group Integrated Report 201942 43NAGASE Group Integrated Report 2019
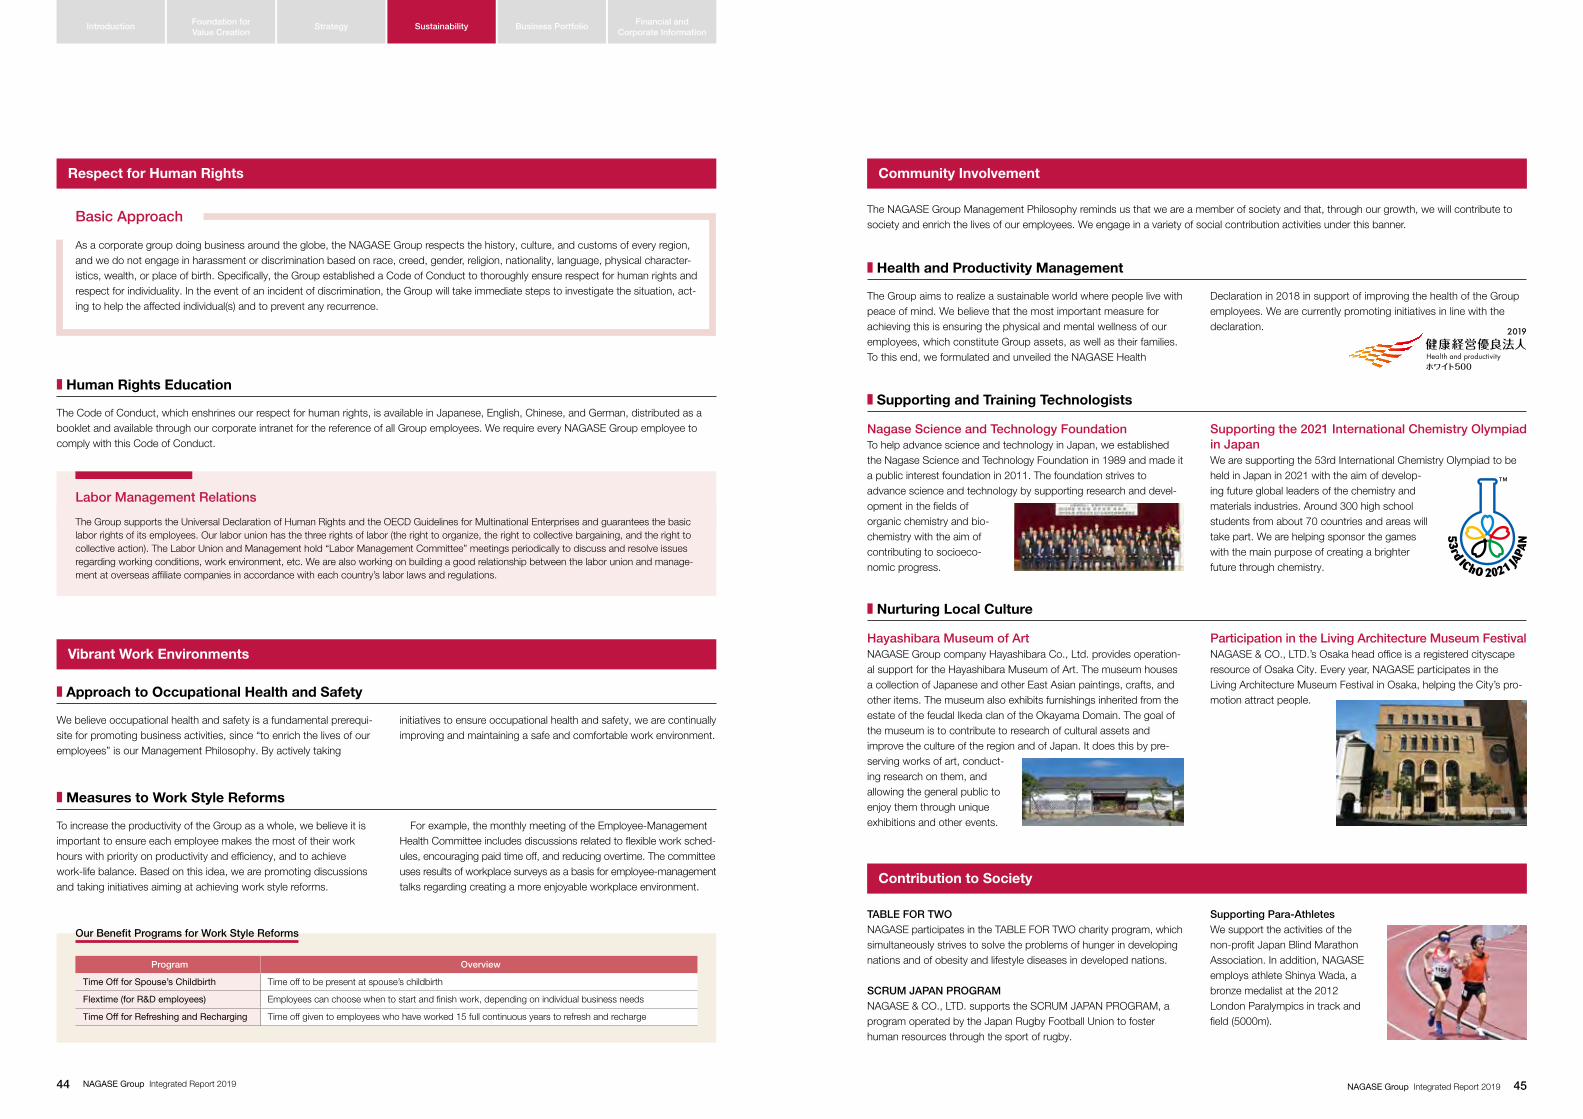
Labor Management Relations
The Group aims to realize a sustainable world where people live with peace of mind. We believe that the most important measure for achieving this is ensuring the physical and mental wellness of our employees, which constitute Group assets, as well as their families. To this end, we formulated and unveiled the NAGASE Health
Declaration in 2018 in support of improving the health of the Group employees. We are currently promoting initiatives in line with the declaration.
M Approach to Occupational Health and Safety
We believe occupational health and safety is a fundamental prerequi-site for promoting business activities, since “to enrich the lives of our employees” is our Management Philosophy. By actively taking
initiatives to ensure occupational health and safety, we are continually improving and maintaining a safe and comfortable work environment.
Vibrant Work Environments
M Measures to Work Style Reforms
To increase the productivity of the Group as a whole, we believe it is important to ensure each employee makes the most of their work hours with priority on productivity and efficiency, and to achieve work-life balance. Based on this idea, we are promoting discussions and taking initiatives aiming at achieving work style reforms.
For example, the monthly meeting of the Employee-Management Health Committee includes discussions related to flexible work sched-ules, encouraging paid time off, and reducing overtime. The committee uses results of workplace surveys as a basis for employee-management talks regarding creating a more enjoyable workplace environment.
Our Benefit Programs for Work Style Reforms
Program Overview
Time Off for Spouse’s Childbirth Time off to be present at spouse’s childbirth
Flextime (for R&D employees) Employees can choose when to start and finish work, depending on individual business needs
Time Off for Refreshing and Recharging Time off given to employees who have worked 15 full continuous years to refresh and recharge
Respect for Human Rights
The Group supports the Universal Declaration of Human Rights and the OECD Guidelines for Multinational Enterprises and guarantees the basic labor rights of its employees. Our labor union has the three rights of labor (the right to organize, the right to collective bargaining, and the right to collective action). The Labor Union and Management hold “Labor Management Committee” meetings periodically to discuss and resolve issues regarding working conditions, work environment, etc. We are also working on building a good relationship between the labor union and manage-ment at overseas affiliate companies in accordance with each country’s labor laws and regulations.
M Human Rights Education
The Code of Conduct, which enshrines our respect for human rights, is available in Japanese, English, Chinese, and German, distributed as a booklet and available through our corporate intranet for the reference of all Group employees. We require every NAGASE Group employee to comply with this Code of Conduct.
As a corporate group doing business around the globe, the NAGASE Group respects the history, culture, and customs of every region, and we do not engage in harassment or discrimination based on race, creed, gender, religion, nationality, language, physical character-istics, wealth, or place of birth. Specifically, the Group established a Code of Conduct to thoroughly ensure respect for human rights and respect for individuality. In the event of an incident of discrimination, the Group will take immediate steps to investigate the situation, act-ing to help the affected individual(s) and to prevent any recurrence.
M Health and Productivity Management
The NAGASE Group Management Philosophy reminds us that we are a member of society and that, through our growth, we will contribute to society and enrich the lives of our employees. We engage in a variety of social contribution activities under this banner.
Community Involvement
Nagase Science and Technology FoundationTo help advance science and technology in Japan, we established the Nagase Science and Technology Foundation in 1989 and made it a public interest foundation in 2011. The foundation strives to advance science and technology by supporting research and devel-opment in the fields of organic chemistry and bio-chemistry with the aim of contributing to socioeco-nomic progress.
Supporting the 2021 International Chemistry Olympiad in JapanWe are supporting the 53rd International Chemistry Olympiad to be held in Japan in 2021 with the aim of develop-ing future global leaders of the chemistry and materials industries. Around 300 high school students from about 70 countries and areas will take part. We are helping sponsor the games with the main purpose of creating a brighter future through chemistry.
M Supporting and Training Technologists
Hayashibara Museum of ArtNAGASE Group company Hayashibara Co., Ltd. provides operation-al support for the Hayashibara Museum of Art. The museum houses a collection of Japanese and other East Asian paintings, crafts, and other items. The museum also exhibits furnishings inherited from the estate of the feudal Ikeda clan of the Okayama Domain. The goal of the museum is to contribute to research of cultural assets and improve the culture of the region and of Japan. It does this by pre-serving works of art, conduct-ing research on them, and allowing the general public to enjoy them through unique exhibitions and other events.
Participation in the Living Architecture Museum FestivalNAGASE & CO., LTD.’s Osaka head office is a registered cityscape resource of Osaka City. Every year, NAGASE participates in the Living Architecture Museum Festival in Osaka, helping the City’s pro-motion attract people.
M Nurturing Local Culture
Contribution to Society
TABLE FOR TWONAGASE participates in the TABLE FOR TWO charity program, which simultaneously strives to solve the problems of hunger in developing nations and of obesity and lifestyle diseases in developed nations.
SCRUM JAPAN PROGRAMNAGASE & CO., LTD. supports the SCRUM JAPAN PROGRAM, a program operated by the Japan Rugby Football Union to foster human resources through the sport of rugby.
Supporting Para-AthletesWe support the activities of the non-profit Japan Blind Marathon Association. In addition, NAGASE employs athlete Shinya Wada, a bronze medalist at the 2012 London Paralympics in track and field (5000m).
Basic Approach
Financial and Corporate Information
Introduction SustainabilityFoundation for Value Creation
Strategy Business Portfolio
NAGASE Group Integrated Report 201944 45NAGASE Group Integrated Report 2019

Noriaki ArashimaExecutive OfficerGeneral Executive, Speciality Chemicals Department
Performance Chemicals Business• Acquired stock of Fitz Chem LLC, further developing the North American coating market• Acquired stock of DAITAI KAKO CO., LTD. thereby entering downstream industries
Speciality Chemicals Business
• Developed the market for Nagase ChemteX products. We redoubled our efforts and developed the market through our global marketing capabilities
• Expanded environmental infrastructure business and globally constructed a business model• Used digital marketing to discover new customers and applications• Expanded the filter business by increasing market share and strengthening initiatives in filter cleaning
Operating MarginNet Sales Operating Income
17/3 18/3 19/3
153.5
4.15.1 5.4
174.9 179.62.7
3.0 3.1
17/3 18/3 19/3
Major Achievements under ACE-2020
Creating a Circular Economy and Contributing to the Global Environment: Supporting Customer ESG Investment
Combating Infrastructure Decay with New Pat!naLock™ Reactive Paint
NAGASE jointly commercialized Pat!naLock™, an anti-rust paint that can extend the life of iron and steel infrastructure. Pat!naLock™ is a new, innovative reactive paint that prevents corrosion by forming a dense, protective layer of rust on the surface of iron and steel material through reactions with oxygen in the air. Because it is expected to protect structures from destructive rust that leads to decay, it is being widely adopted for plant engineering equipment and by communications and electric power companies, which will face difficulty in securing adequate labor in the future. In 2018, this prod-uct received an excellence award at the Second Annual Infrastructure Maintenance Awards and one of the 18th KCS Awards in Environmental Technology from the Kinka Chemical Society.
The concept of a circular economy, fully responsive to global environmen-tal regulations, has garnered recent attention in manufacturing. In response, NAGASE has focused its efforts on selling REARTH™ in regions where new environmental regulations have been adopted. This eco-friendly product of MORIKAWA INDUSTRIES CORPORATION achieves major cost reductions by collecting and reusing volatile organic compounds (VOCs) that otherwise pollute the atmosphere. We also sell the AQUABLASTER™ (pictured right) wastewater treatment sys-tem developed by Aience Limited. Though these sales, we help solve a variety of customer issues by reducing related costs for electricity and treatment, while increas-ing total treatment capacity.
Topics
JapanNagase ChemteX CorporationNagase Filter Co., Ltd.DAITAI KAKO CO., LTD.
AmericasTQ-1 de MEXICO S.A. de C.V.Cytech Products Inc.
Greater ChinaToyo Quality One Ningbo Co., Ltd.
Guangzhou Kurabo Chemicals Co., Ltd.Toyo Quality One (Guangzhou) Co., Ltd.
Europe
ASEANPT. Toyo Quality One Indonesia
Japan
67%Greater China
9%
ASEAN and the Middle East
14%
Americas
8%Europe
1%Korea
1%
Manufacturing 4% Sales and Servicing 96%
Business Scope and Operating Performance
Net Sales Ratio by Region and Field Main Manufacturing Bases (Includes equity affiliates)
Net Sales / Operating Income (Billions of yen) Operating Margin (%)
Business Solutions Providing Performance, Safety & Reduced Environmental LoadThe Coating Materials Division has been working to offer better solutions to customers while keeping a careful eye on challenges in the entire paint market amid global market reorganization. Our key product “Pat!naLock™” can contribute to society and the environment by extend-ing the life of infrastructure and reducing the necessary number of paint jobs. We are working to develop more applications for this product. In line with the concept of providing a much more comfortable life with our urethane busi-ness network, the Advanced Comfort Materials Division provides various combinations of new materials and services, enhancing the presence of the NAGASE Group. The Performance Chemicals Department has been making every effort for stable growth by providing chemicals for safety and comfort as well as biomass-derived materials for reduced environmental load.
Performance by Segment
Customer industries
Performance Chemicals Business Paints, inks, urethane
Speciality Chemicals BusinessPetrochemicals, plastics, electronic materials, semiconductors, industrial oil, surfactants, organic synthetics, environment-related etc.
Providing Value as a Specialist Chemicals GroupWe supply a wide variety of materials that meet the needs of our business partners, from general products to high function/high value-added products (speciality products). In addition, we are developing new materials in line with the technological advancements made in electric vehicles, IoT, 5G, 3D technology, and more. Furthermore, we provide our business partners with a wide range of data related to our value chain along with our unique technology-oriented sales and innovation capabilities. The data we provide covers not only prominent risks in the business environment but, also latent risks. We have earned highly favorable feedback from our business partners by offering forward-looking alternatives. In addition to enhancing our eco-friendly products and services, we are researching uses of digital technology in the chemicals industry. We will continue working to maximize the value we provide as a group that specializes in chemicals.
Tamotsu IsobeGM, Performance Chemicals Department
Risks & Opportunities
• Global reorganization of the pet-rochemical and paint industries
• Impact of stricter environmental regulations around the world on chemical manufacturing
Strengths
• The largest share in the coating and urethane industry and a borderless global network
• Business expansion through composites, chemical synthesis, and polymer technologies
• Proposal of composite materials and technologies using evaluation data at the Nagase Application Workshop (NAW)
• Technical background equivalent to a manufacturer and compliance with various regulatory trends around the world
Functional Materials
Financial and Corporate Information
Introduction SustainabilityFoundation for Value Creation
Strategy Business Portfolio
NAGASE Group Integrated Report 201946 47NAGASE Group Integrated Report 2019
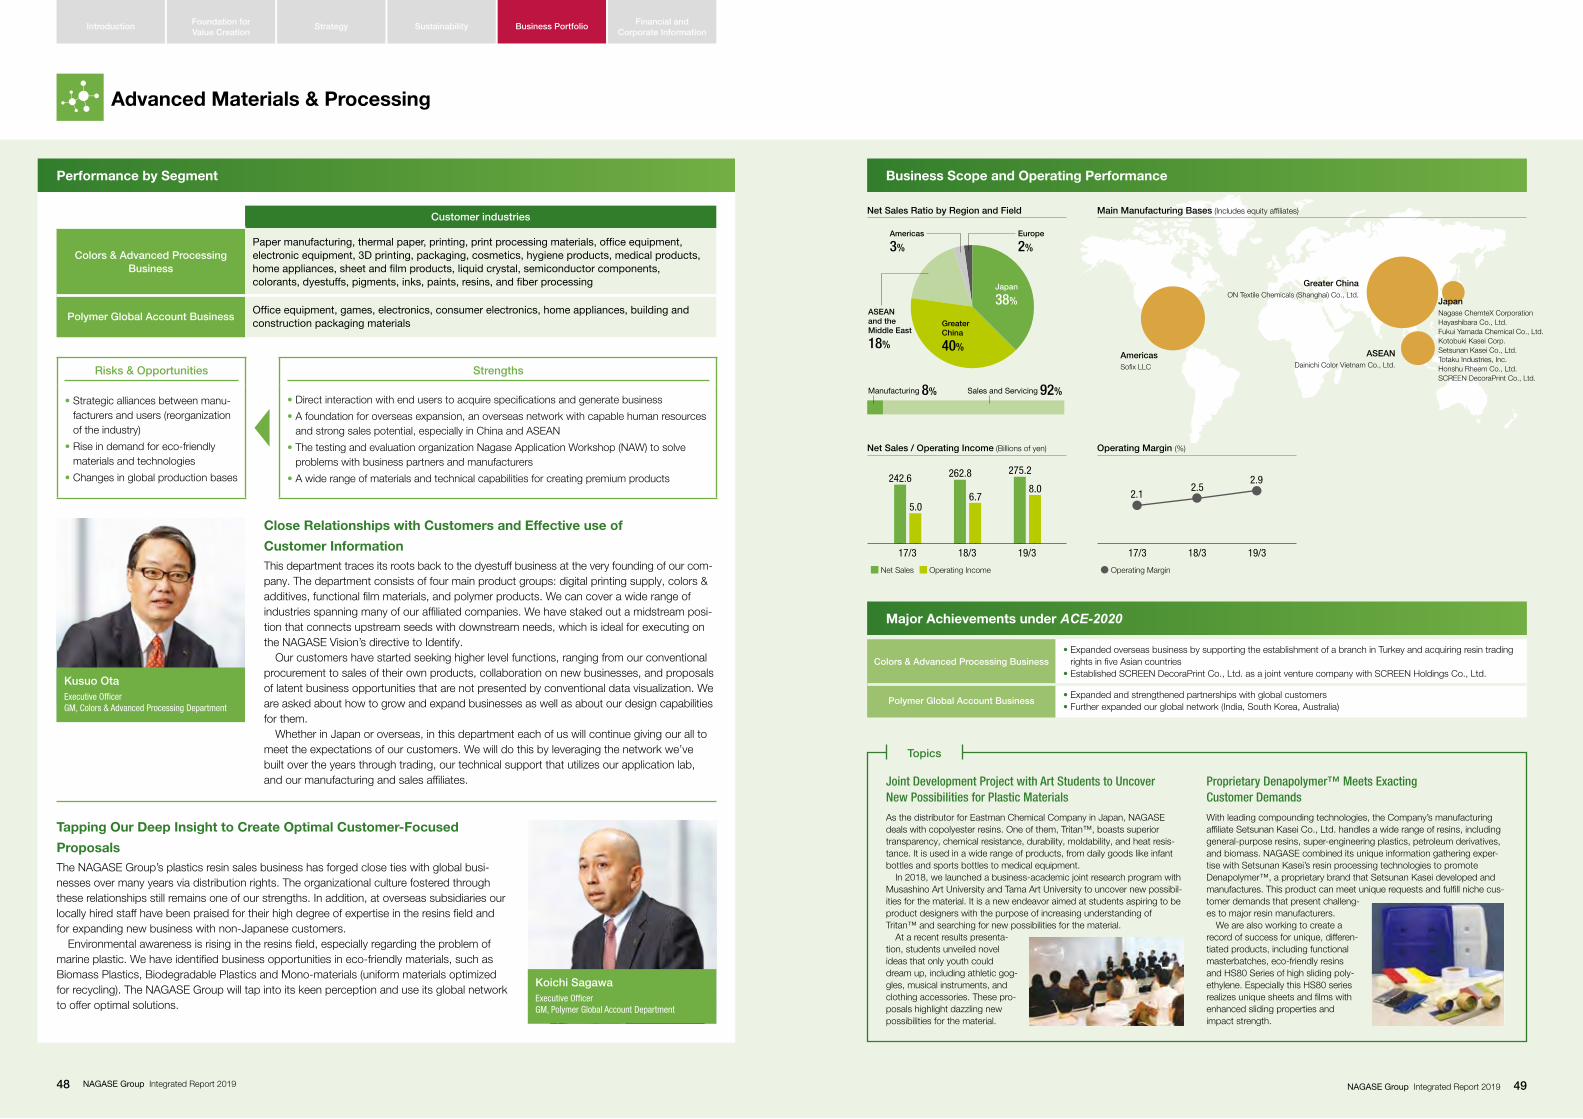
Close Relationships with Customers and Effective use of
Customer InformationThis department traces its roots back to the dyestuff business at the very founding of our com-pany. The department consists of four main product groups: digital printing supply, colors & additives, functional film materials, and polymer products. We can cover a wide range of industries spanning many of our affiliated companies. We have staked out a midstream posi-tion that connects upstream seeds with downstream needs, which is ideal for executing on the NAGASE Vision’s directive to Identify. Our customers have started seeking higher level functions, ranging from our conventional procurement to sales of their own products, collaboration on new businesses, and proposals of latent business opportunities that are not presented by conventional data visualization. We are asked about how to grow and expand businesses as well as about our design capabilities for them. Whether in Japan or overseas, in this department each of us will continue giving our all to meet the expectations of our customers. We will do this by leveraging the network we’ve built over the years through trading, our technical support that utilizes our application lab, and our manufacturing and sales affiliates.
Tapping Our Deep Insight to Create Optimal Customer-Focused
ProposalsThe NAGASE Group’s plastics resin sales business has forged close ties with global busi-nesses over many years via distribution rights. The organizational culture fostered through these relationships still remains one of our strengths. In addition, at overseas subsidiaries our locally hired staff have been praised for their high degree of expertise in the resins field and for expanding new business with non-Japanese customers. Environmental awareness is rising in the resins field, especially regarding the problem of marine plastic. We have identified business opportunities in eco-friendly materials, such as Biomass Plastics, Biodegradable Plastics and Mono-materials (uniform materials optimized for recycling). The NAGASE Group will tap into its keen perception and use its global network to offer optimal solutions.
Performance by Segment
Customer industries
Colors & Advanced Processing Business
Paper manufacturing, thermal paper, printing, print processing materials, office equipment, electronic equipment, 3D printing, packaging, cosmetics, hygiene products, medical products, home appliances, sheet and film products, liquid crystal, semiconductor components, colorants, dyestuffs, pigments, inks, paints, resins, and fiber processing
Polymer Global Account BusinessOffice equipment, games, electronics, consumer electronics, home appliances, building and construction packaging materials
Colors & Advanced Processing Business• Expanded overseas business by supporting the establishment of a branch in Turkey and acquiring resin trading
rights in five Asian countries• Established SCREEN DecoraPrint Co., Ltd. as a joint venture company with SCREEN Holdings Co., Ltd.
Polymer Global Account Business• Expanded and strengthened partnerships with global customers• Further expanded our global network (India, South Korea, Australia)
17/3 18/3 19/3 17/3 18/3 19/3
242.6
5.06.7
8.0
262.8 275.2
2.12.5
2.9
Operating MarginNet Sales Operating Income
Major Achievements under ACE-2020
Koichi SagawaExecutive OfficerGM, Polymer Global Account Department
Topics
Risks & Opportunities
• Strategic alliances between manu-facturers and users (reorganization of the industry)
• Rise in demand for eco-friendly materials and technologies
• Changes in global production bases
Strengths
• Direct interaction with end users to acquire specifications and generate business
• A foundation for overseas expansion, an overseas network with capable human resources and strong sales potential, especially in China and ASEAN
• The testing and evaluation organization Nagase Application Workshop (NAW) to solve problems with business partners and manufacturers
• A wide range of materials and technical capabilities for creating premium products
Business Scope and Operating Performance
Joint Development Project with Art Students to Uncover New Possibilities for Plastic Materials
As the distributor for Eastman Chemical Company in Japan, NAGASE deals with copolyester resins. One of them, Tritan™, boasts superior transparency, chemical resistance, durability, moldability, and heat resis-tance. It is used in a wide range of products, from daily goods like infant bottles and sports bottles to medical equipment. In 2018, we launched a business-academic joint research program with Musashino Art University and Tama Art University to uncover new possibil-ities for the material. It is a new endeavor aimed at students aspiring to be product designers with the purpose of increasing understanding of Tritan™ and searching for new possibilities for the material. At a recent results presenta-tion, students unveiled novel ideas that only youth could dream up, including athletic gog-gles, musical instruments, and clothing accessories. These pro-posals highlight dazzling new possibilities for the material.
Proprietary Denapolymer™ Meets Exacting Customer Demands
With leading compounding technologies, the Company’s manufacturing affiliate Setsunan Kasei Co., Ltd. handles a wide range of resins, including general-purpose resins, super-engineering plastics, petroleum derivatives, and biomass. NAGASE combined its unique information gathering exper-tise with Setsunan Kasei’s resin processing technologies to promote Denapolymer™, a proprietary brand that Setsunan Kasei developed and manufactures. This product can meet unique requests and fulfill niche cus-tomer demands that present challeng-es to major resin manufacturers. We are also working to create a record of success for unique, differen-tiated products, including functional masterbatches, eco-friendly resins and HS80 Series of high sliding poly-ethylene. Especially this HS80 series realizes unique sheets and films with enhanced sliding properties and impact strength.
JapanNagase ChemteX CorporationHayashibara Co., Ltd.Fukui Yamada Chemical Co., Ltd.Kotobuki Kasei Corp.Setsunan Kasei Co., Ltd.Totaku Industries, Inc.Honshu Rheem Co., Ltd.SCREEN DecoraPrint Co., Ltd.
AmericasSofix LLC
Greater ChinaON Textile Chemicals (Shanghai) Co., Ltd.
ASEANDainichi Color Vietnam Co., Ltd.
Japan
38%
Greater China
40%
ASEAN and the Middle East
18%
Americas
3%Europe
2%
Manufacturing 8% Sales and Servicing 92%
Net Sales Ratio by Region and Field Main Manufacturing Bases (Includes equity affiliates)
Net Sales / Operating Income (Billions of yen) Operating Margin (%)
Kusuo OtaExecutive OfficerGM, Colors & Advanced Processing Department
Advanced Materials & Processing
Financial and Corporate Information
Introduction SustainabilityFoundation for Value Creation
Strategy Business Portfolio
NAGASE Group Integrated Report 201948 49NAGASE Group Integrated Report 2019
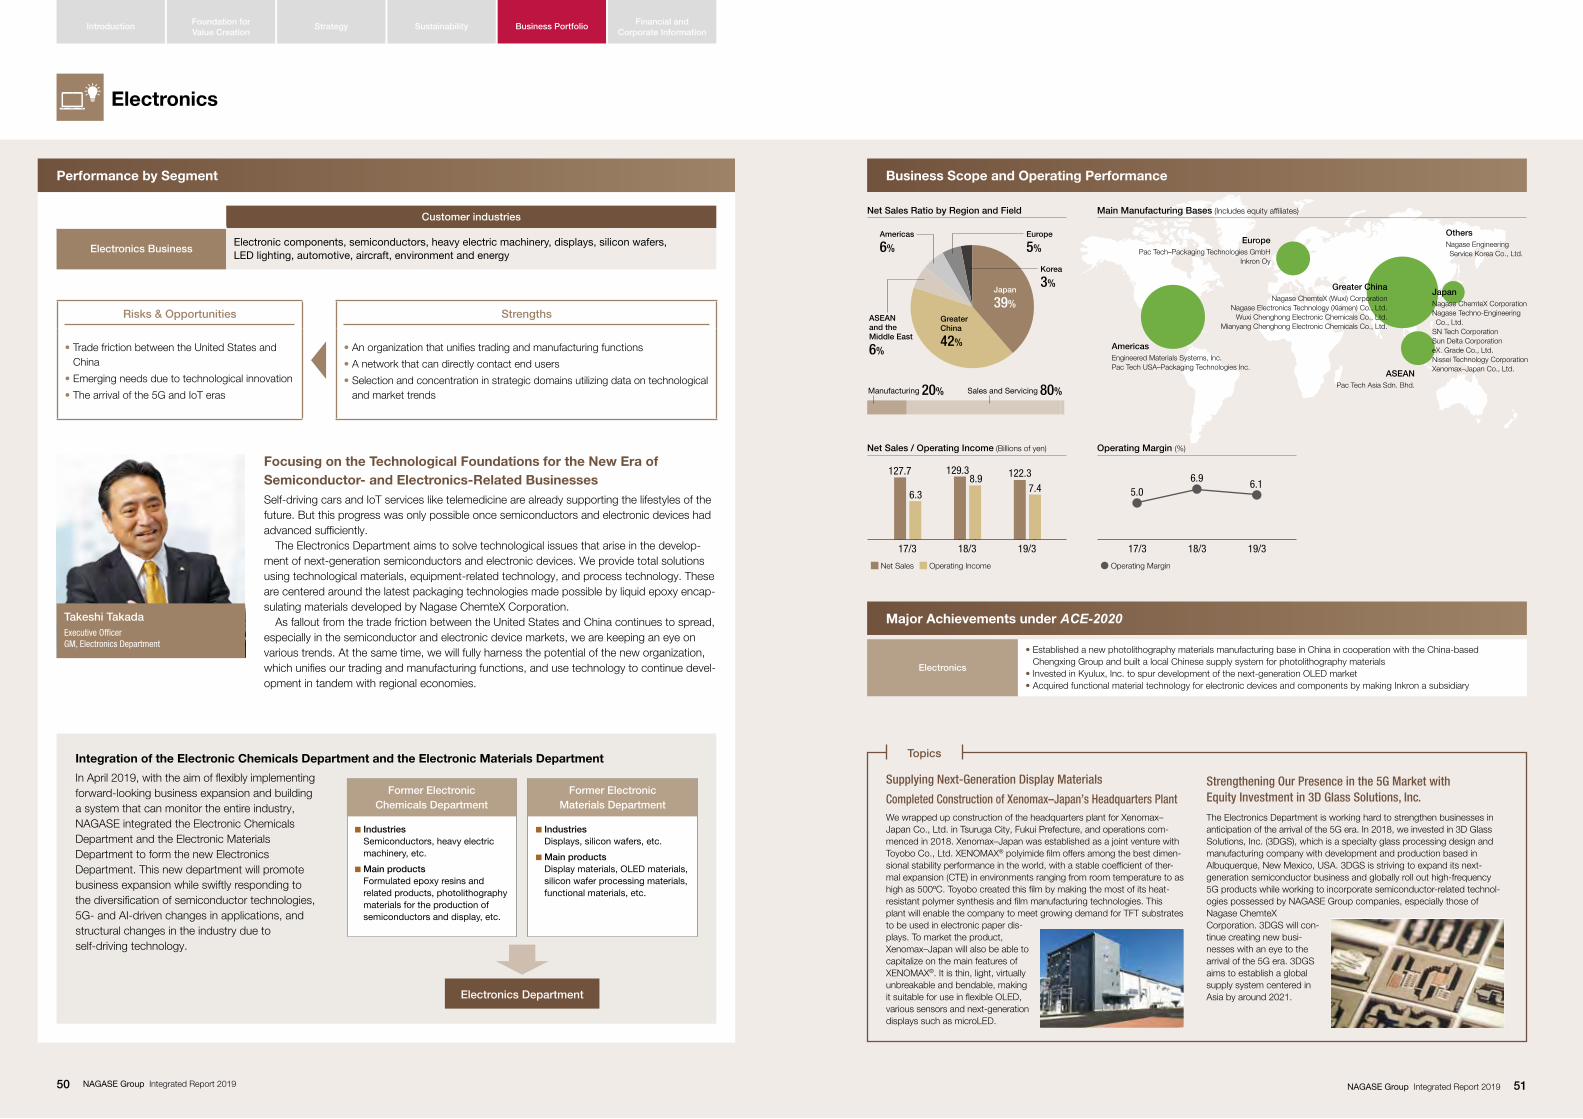
Focusing on the Technological Foundations for the New Era of Semiconductor- and Electronics-Related BusinessesSelf-driving cars and IoT services like telemedicine are already supporting the lifestyles of the future. But this progress was only possible once semiconductors and electronic devices had advanced sufficiently. The Electronics Department aims to solve technological issues that arise in the develop-ment of next-generation semiconductors and electronic devices. We provide total solutions using technological materials, equipment-related technology, and process technology. These are centered around the latest packaging technologies made possible by liquid epoxy encap-sulating materials developed by Nagase ChemteX Corporation. As fallout from the trade friction between the United States and China continues to spread, especially in the semiconductor and electronic device markets, we are keeping an eye on various trends. At the same time, we will fully harness the potential of the new organization, which unifies our trading and manufacturing functions, and use technology to continue devel-opment in tandem with regional economies.
Performance by Segment
Customer industries
Electronics BusinessElectronic components, semiconductors, heavy electric machinery, displays, silicon wafers, LED lighting, automotive, aircraft, environment and energy
Electronics
• Established a new photolithography materials manufacturing base in China in cooperation with the China-based Chengxing Group and built a local Chinese supply system for photolithography materials
• Invested in Kyulux, Inc. to spur development of the next-generation OLED market• Acquired functional material technology for electronic devices and components by making Inkron a subsidiary
17/3 18/3 19/3 17/3 18/3 19/3
127.7
6.3
8.97.4
129.3 122.3
5.06.9 6.1
Operating MarginNet Sales Operating Income
Major Achievements under ACE-2020Takeshi TakadaExecutive OfficerGM, Electronics Department
Supplying Next-Generation Display Materials
Completed Construction of Xenomax–Japan’s Headquarters PlantWe wrapped up construction of the headquarters plant for Xenomax–Japan Co., Ltd. in Tsuruga City, Fukui Prefecture, and operations com-menced in 2018. Xenomax–Japan was established as a joint venture with Toyobo Co., Ltd. XENOMAX® polyimide film offers among the best dimen-sional stability performance in the world, with a stable coefficient of ther-mal expansion (CTE) in environments ranging from room temperature to as high as 500ºC. Toyobo created this film by making the most of its heat- resistant polymer synthesis and film manufacturing technologies. This plant will enable the company to meet growing demand for TFT substrates to be used in electronic paper dis-plays. To market the product, Xenomax–Japan will also be able to capitalize on the main features of XENOMAX®. It is thin, light, virtually unbreakable and bendable, making it suitable for use in flexible OLED, various sensors and next-generation displays such as microLED.
Strengthening Our Presence in the 5G Market with Equity Investment in 3D Glass Solutions, Inc.
The Electronics Department is working hard to strengthen businesses in anticipation of the arrival of the 5G era. In 2018, we invested in 3D Glass Solutions, Inc. (3DGS), which is a specialty glass processing design and manufacturing company with development and production based in Albuquerque, New Mexico, USA. 3DGS is striving to expand its next- generation semiconductor business and globally roll out high-frequency 5G products while working to incorporate semiconductor-related technol-ogies possessed by NAGASE Group companies, especially those of Nagase ChemteX Corporation. 3DGS will con-tinue creating new busi-nesses with an eye to the arrival of the 5G era. 3DGS aims to establish a global supply system centered in Asia by around 2021.
Topics
Risks & Opportunities
• Trade friction between the United States and China
• Emerging needs due to technological innovation
• The arrival of the 5G and IoT eras
Strengths
• An organization that unifies trading and manufacturing functions
• A network that can directly contact end users
• Selection and concentration in strategic domains utilizing data on technological and market trends
Integration of the Electronic Chemicals Department and the Electronic Materials Department
In April 2019, with the aim of flexibly implementing forward-looking business expansion and building a system that can monitor the entire industry, NAGASE integrated the Electronic Chemicals Department and the Electronic Materials Department to form the new Electronics Department. This new department will promote business expansion while swiftly responding to the diversification of semiconductor technologies, 5G- and AI-driven changes in applications, and structural changes in the industry due to self-driving technology.
JapanNagase ChemteX CorporationNagase Techno-Engineering Co., Ltd.SN Tech CorporationSun Delta CorporationeX. Grade Co., Ltd.Nissei Technology CorporationXenomax–Japan Co., Ltd.
AmericasEngineered Materials Systems, Inc.Pac Tech USA–Packaging Technologies Inc.
Greater ChinaNagase ChemteX (Wuxi) Corporation
Nagase Electronics Technology (Xiamen) Co., Ltd.Wuxi Chenghong Electronic Chemicals Co., Ltd.
Mianyang Chenghong Electronic Chemicals Co., Ltd.
ASEANPac Tech Asia Sdn. Bhd.
Japan
39%Greater China
42%
ASEAN and the Middle East
6%
Americas
6%Europe
5%
Korea
3%
Manufacturing 20% Sales and Servicing 80%
Net Sales Ratio by Region and Field Main Manufacturing Bases (Includes equity affiliates)
Net Sales / Operating Income (Billions of yen) Operating Margin (%)
Business Scope and Operating Performance
OthersNagase Engineering Service Korea Co., Ltd.
EuropePac Tech–Packaging Technologies GmbH
Inkron Oy
K Industries Semiconductors, heavy electric
machinery, etc.
K Main products Formulated epoxy resins and
related products, photolithography materials for the production of semiconductors and display, etc.
K Industries Displays, silicon wafers, etc.
K Main products Display materials, OLED materials,
silicon wafer processing materials, functional materials, etc.
Electronics Department
Former Electronic Chemicals Department
Former Electronic Materials Department
Electronics
Financial and Corporate Information
Introduction SustainabilityFoundation for Value Creation
Strategy Business Portfolio
NAGASE Group Integrated Report 201950 51NAGASE Group Integrated Report 2019

The Possibilities of the Energy Management FieldCountries around the world are grappling with energy-related problems, a situation which creates major business opportunities. For example, the household FIT scheme that began in Japan in 2009 to buy back surplus power from photovoltaic generation will be phased out from 2019. For households whose buyback programs have ended, it will therefore become more economical to store the surplus energy in batteries for personal use than to sell it to power companies. The Energy Business Office is promoting the development and sales of energy storage systems for that express purpose. We are also working to establish an engi-neering service system for the market. We are developing an energy management system that can avoid region-wide blackouts like the one that occurred in Hokkaido Prefecture last year. Our system is expected to help solve problems related to emergency preparedness. In addition, we are working on the development of optical wireless communication as a reliable, low-cost means of communi-cating even in places where traditional wireless technology too often ends in disconnection or interference. Going forward, we will continue working to reduce the energy consumption of the NAGASE Group as a whole.
Bringing Networks and Know-How Cultivated in the Automotive
Industry to the Entire Mobility SectorWith the rise of electric and IT-capable automobiles, a paradigm shift is underway as the con-ventional automobile market moves beyond vehicles to embrace a broader concept of mobil-ity. In addition, data systems are beginning to account for a larger percentage of related product sales. In light of this situation, the Automotive Solutions Department was renamed the Mobility Solutions Department. We will not only supply automotive materials and parts as before, we will now offer total mobility solutions. The department is aiming to achieve double-digit growth, focusing on the overseas busi-ness. To this end, we will continue working to quickly change the mindset of every person in the NAGASE Group as we unite to create the kind of business model needed in a next- generation mobility society.
Performance by Segment
Customer industries
Mobility Solutions Business Automobiles, trains, aircraft, spacecraft, mobility, social infrastructure
Energy BusinessBatteries, photovoltaic generation, automobiles, electric components, construction, distribution, lighting, commercial facilities, public facilities, etc.
Mobility Solutions Business• Expanded business in India as MINDA KYORAKU LTD.’s plant in Gujarat came on line• Concluded a consulting agreement with an automotive parts design company and began providing manufacturing
methods and alternative materials to metals during the design concept stage
Energy Business
• Established a production system for household and industrial storage batteries at our affiliate CAPTEX Co., Ltd. as well as a sales system and field engineering functions for launching products on the market
• Continued running pilot tests in the market to establish new optical wireless communications technologies using LEDs and lasers
17/3 18/3 19/3 17/3 18/3 19/3
112.9
1.5
2.43.0
129.7 139.2
1.41.9
2.2
Operating MarginNet Sales Operating Income
Major Achievements under ACE-2020
Risks & Opportunities
• Transitioning to a next-generation mobility society for people, things, and data
• Responding to global energy- and envi-ronment-related issues
Strengths
• A pipeline from which we can extract data by directly contacting key players and our customer base in the automotive industry
• Possession of in-house battery development and manufacturing capabilities
Net Sales Ratio by Region and Field
The Value the Mobility Solutions Department ProvidesSafety (Protecting Lives): We provide solutions that enhance safety each day in a society shaped by smart mobility, enabling people to live their lives without worry.
Environment (Protecting the Planet): We help protect the global environment by promoting electric-powered mobility and materials with minimal environmental impact, to meet the overarching aim of realizing a low-carbon society.
Comfort (Enriching Lives): We help create lives that are richer on a daily basis, by providing new value that saves time and space for people who use mobility.
Start of Mass Production of Molded Parts for Hybrid and Electric Vehicles at Chinese Joint Venture
The global shift from gasoline and diesel vehicles to electric vehicles is accelerating, and that trend is rapidly picking up speed in China. Seizing this business opportunity, NAGASE in 2018 established a joint venture with China-based Shenzhen Kedali Industry Co., Ltd., which is the No. 1 producer of lithium ion battery cases in China, and with Japan-based ATECS Corporation, whose strength lies in metal insert moldings. The company began full-scale mass production for the Chinese market of module cases (pictured below) for molded components (semiconductor devices called IGBTs) used in hybrid and electric vehi-cles. The aim is to capture a larger share of the Chinese market, which is expected to see strong growth going forward.
Full-Scale Entry into the Field of Self-Driving Technology
Start of Collaboration with Two LiDAR-Related CompaniesNAGASE has begun collaborating with Canada-based LeddarTech Inc. and US-based TriLumina Corp., which possess strengths in light detection and ranging (LiDAR) sensor systems. These systems are garnering atten-tion for being indispensable to making autonomous driving more practical. TriLumina has developed modules for vertical-cavity surface-emitting lasers (VCSELs), which are used in industrial and private-use 3D sensing light sources, including for automotive LiDAR. This technology is expected to enable high-definition and long-distance LiDAR detection capability, boosting it to over 200 meters. LeddarTech makes automotive systems on chip (SoCs) (pictured below) that are unique for being compat-ible with short- to long-range LiDAR systems. This helps enhance the product lineup of automotive part manufacturers and shortens development periods.
Topics
JapanCAPTEX Co., Ltd.
AmericasKN Platech America Corporation
Greater ChinaTokai Spring Mfg. (Foshan) Co., Ltd.
Huizhou Sanli Three Synergy Precision Co., Ltd.
ASEANSanko Gosei Technology (Thailand) Ltd.Automotive Mold Technology Co., Ltd.
MINDA KYORAKU LTD.
Main Manufacturing Bases (Includes equity affiliates)
Japan
38%
Greater China
29%
ASEAN and the Middle East
21%
Europe
1%
Korea
2%
Americas
10%
Manufacturing 0% Sales and Servicing 100%
Business Scope and Operating Performance
Net Sales / Operating Income (Billions of yen) Operating Margin (%)
Hiroyuki UeshimaExecutive OfficerGM, Mobility Solutions Department
Kiyoshi SatoGM, Energy Business Office
Mobility & Energy
Financial and Corporate Information
Introduction SustainabilityFoundation for Value Creation
Strategy Business Portfolio
NAGASE Group Integrated Report 201952 53NAGASE Group Integrated Report 2019

Leveraging the Wide-Ranging Strengths of the Group’s Manufacturing CompaniesThe NAGASE Group’s Life & Healthcare Segment includes the manufacturing companies of Hayashibara Co., Ltd., Nagase Medicals Co., Ltd., Nagase ChemteX Corporation, and more. The beauty care products business is mainly composed of Nagase Beauty Care Co., Ltd. The unique characteristic of this segment is its wide variety of products. Hayashibara’s vitamin C derivatives command the largest share of the domestic market. Nagase Medicals has built a disposable production line, which does not require cleaning vali-dation, for high-potency formulations including those for anti-cancer drugs. Nagase ChemteX’s unique enzymes derived from actinomycetes have a competitive edge and poten-tial to shine on the global stage. Strengthening the position of Hayashibara in the food industry overseas will be a specific area of interest going forward. As for pharmaceuticals, we will continue aiming to roll out our own formulations (anti-cancer drugs) in Europe and the United States. As for toiletries and cosmetics, we will expand overseas from Asia to Europe and the United States using our network comprising the Lyon, France branch (established in 2017) and the U.S.-based Group company Fitz Chem LLC.
Performance by Segment
Customer industries
Life & Healthcare Products Business
Food products, pharmaceuticals, health care, diagnostic drugs, fragrances, cosmetics, household products, agriculture, fisheries, and livestock
Life & Healthcare Product Business
• Invested in PeptiStar, Inc., which has specialty peptide pharmaceutical technologies• Established the Lyon branch in France to focus on cosmetics• Concluded a general distributor agreement with Shikoku Nucleic Acids Chemistry Co., Ltd.• Launched the bread-making enzyme DENABAKE™ EXTRA in collaboration with Nagase ChemteX Corporation
and Hayashibara Co., Ltd.• Completed an expansion of the T Building at Hayashibara’s Okayama Functional Saccharide Plant
17/3 18/3 19/3 17/3 18/3 19/3
84.9
3.34.2 4.6
86.5 90.73.9
4.9 5.1
Operating MarginNet Sales Operating Income
Major Achievements under ACE-2020
Yoshihiro ShimizuGM, Life & Healthcare Products Department
Peptide Pharmaceuticals Underpin Industry Trend toward Medium to Large Molecule Drugs
In the pharmaceutical industry, development of medium to large molecule drugs is accelerating amid the shift away from conventional small molecule drugs. To align its portfolio with this trend, the NAGASE Group has invest-ed in PeptiStar, Inc., which possesses specialty peptide pharmaceutical technologies. In addition, we have spearheaded initiatives focused on forward-looking biotechnology-based medicine through an alliance with Shikoku Nucleic Acids Chemistry Co., Ltd. PeptiStar engages in R&D and manufacturing based on PeptiDream Inc.’s peripheral knowl-edge and technologies related to specialty peptide pharmaceuticals. Through investment in and collabo-ration with PeptiStar, NAGASE helps develop and manufacture new pharmaceuticals to underpin next-generation healthcare.
Collaboration between Nagase Beauty Care and Tanita Corp.
In collaboration with Tanita Corp., we opened TANITA × NAGASE Iki Iki Plaza, a members-only female fitness club, in Kosai City, Shizuoka Prefecture. Nagase Beauty Care had struggled to raise brand awareness, but by entering this new industry, the company aims to boost its recogni-tion and promote the health of women in the community. The mostly female clientele enjoys the twin benefits of health support, which is an area of competitive strength for Tanita, and beauty support, which is an area of competitive strength for Nagase Beauty Care. Nagase Beauty Care will continue promoting new activities that expand the scope of its main fields of Activity, Beauty, Youth, and Health.
Topics
Risks & Opportunities
• Intensifying global competition
• Growing demand for eco-friendly materials
Strengths
• License for manufacture and sales of drugs, development of generic pharmaceuticals (formu-lation, specification of active pharmaceutical ingredients, registration of drug master files), and manufacture of pharmaceuticals using unique drug delivery system (DDS) technology or through our alliance with PeptiStar, Inc.
• Applying actinomycetes, which form a fundamental technology of the Nagase R&D Center, to production of fermentation products and enzymes
• Enzyme production technology of Nagase ChemteX Corporation (Lactase, PLA2, etc.)
• Development and manufacturing functions of Hayashibara Co., Ltd., Nagase Medicals Co., Ltd., and Nagase ChemteX Corporation
JapanHayashibara Co., Ltd.Nagase ChemteX CorporationNagase Medicals Co., Ltd.Toyo Beauty Supply Corporation
Japan
84%Greater China
3%
ASEAN and the Middle East
3%
Europe
5%Americas 4%
Manufacturing 27% Sales and Servicing 73%
Business Scope and Operating Performance
Net Sales Ratio by Region and Field Main Manufacturing Bases (Includes equity affiliates)
Net Sales / Operating Income (Billions of yen) Operating Margin (%)
Nagase Beauty Care Co., Ltd.
Nagase Beauty Care is a wholly owned subsidiary of NAGASE & CO., LTD. and conducts research, development, and sales of NAGASE brand cosmetics and health foods. The company’s 50,000 beauty consultants located nationwide conduct door-to-door sales.
Measures for Achieving the Goals of ACE -2020We promote sales-focused activities and have created an integrated manufacturing and sales structure. As a result, sales of skincare and other mainstay products began to turn around and are now increasing. By further enhancing sales-focused activities, we aim to expand sales of health foods and other mainstay products.
New Skin Care BrandRASISA
Risks & Opportunities Strengths
• Declining birthrate and aging population• Spread of e-commerce
• The expansive sales networks of our organization of around 500 sales agents (managers)• Data and know-how accumulated from a 50-year history in direct sales
Action Policy: Three Arrows Strategy Pursuing Total Beauty: The Exercise, Nutrition, and Rest Initiative
• Focusing on sales: Strengthening the training system for sales personnel• Training the next generation of managers: Appealing to younger generations• Running business under the direct control of the head office
We offer services and hold events related to exercise, nutrition, and rest with the aim of helping customers, especially seniors, extend beauty and health for many more years. This will in turn sharpen our appeal to younger customers and generations to come.
Life & Healthcare Materials
Financial and Corporate Information
Introduction SustainabilityFoundation for Value Creation
Strategy Business Portfolio
NAGASE Group Integrated Report 201954 55NAGASE Group Integrated Report 2019
Global Network
Built on a foundation of chemistry, the NAGASE Group is engaged in global business across a wide spectrum of indus-tries. One of the NAGASE Group’s biggest strengths is its global network, which can respond to precise needs and is well acquainted with the logistics and relevant laws and regu-lations of each country and region.
Note: Employees in the consolidated corporate group as of March 31, 2019
Aiming for ¥600 Billion in Total Overseas Group Sales
Launched in 2016, ACE-2020 designates twin pillars to grow revenues:
1. Accelerate Globalization
2. Improve Manufacturing Profitability
Base established: 1971Number of employees: 246
Base established: 1975Number of employees: 723
Base established: 1971Number of employees: 1,049
Base established: 1980Number of employees: 260
Basic information
Basic information
Basic information
Basic information
Breakdown of Net Sales
Goals of Mid-Term Management Plan ACE-2020
Americas
Europe
Korea
ASEAN and the Middle East
Greater China
Representative:
Ryuichi UchidaExecutive OfficerAmericas CEOEurope CEONagase Holdings America Corporation CEO
Representative:
Ryuichi UchidaExecutive OfficerEurope CEOAmericas CEONagase Holdings America Corporation CEO
Representative:
Hideharu YamazakiExecutive OfficerNagase Korea Corporation CEO and COO
Representative:
Takayuki MasudaExecutive OfficerASEAN and India CEORegional Operating Centre Leader
Representative:
Masatoshi KamadaExecutive OfficerGreater China CEONagase (China) Co., Ltd. CEO and COO
M Aiming to Achieve ACE-2020In addition to spurring inorganic growth in our focus fields, we will take measures aimed at enhancing the corporate value of the Group companies Fitz Chem LLC and Infinite Material Solutions LLC. In mobility and life & healthcare, we are considering investments and alliances. We will continue expanding our business in new markets, especially in Central and South America. We will also meet customer needs through Group products and new technological discovery. We are expanding businesses that can contribute to a sustainable society.
M Aiming to Achieve ACE-2020Due to the maturation of existing businesses and the need for eco-friendly business, we are shifting toward high-value-added prod-ucts and environmental business. In pharmaceutical raw materials, we continue providing solutions that closely match customer needs. Furthermore, we are discovering investment opportunities for natural materials, batteries, and recycled and energy-efficient products. That includes collaboration with start-up companies.
M Aiming to Achieve ACE-2020We not only sell materials to major Korean companies and industries (such as semiconductors, display devices, and rechargeable batteries), we also support the overseas expansion of unique products from companies underpinning those supply chains. In addition, with the overseas expansion of Korean companies, we aim to achieve drastic growth by actively forming alliances with their overseas subsidiaries.
M Aiming to Achieve ACE-2020In addition to the basic business of plastics, in the automotive indus-try, we are working to steadily capture demand in growth markets, especially Thailand, Vietnam, and Indonesia. We are also striving to create new businesses and expand our area through a region-wide collaborative framework with partner companies. In the food materials business, amid rising income levels, we expect demand to rise for functional and high-value-added products. We will continue develop-ing businesses key to achieving the goals of ACE-2020 by leveraging the expertise cultivated at Hayashibara Co., Ltd. and strengthening the specialization and R&D functions in the region.
M Aiming to Achieve ACE-2020Amid a rapidly changing industry structure and ongoing technological advances in China, under the slogan of “One China” we have orga-nized and consolidated NAGASE’s key resources (human resources and data). These had previously been dispersed across China’s dif-ferent regions. We set four focus businesses of semiconductors, mobility, electronics, and life & health. We will continue dynamically growing our businesses through active investment.
M VISION Region / Main Businesses
Mobility We will acquire mobility-related technologies and focus on selling functional resins.
Life & Healthcare We will expand sales of our own products in the life and healthcare field.
M VISION Region / Main Businesses
Pharmaceutical Raw Materials We will contribute to a sustainable society through the bioeconomy.
Mobility We will focus on e-mobility, including battery systems and Robotics.
M VISION Region / Main Businesses
Electronics We will expand business in semiconductors, electronic components, and display devices.
Businesses Related to Korean Products
We will create and expand businesses where South Korean companies excel and accelerate global expansion.
M VISION Region / Main Businesses
Mobility We aim to create new businesses and expand our area by assessing customer needs for electric vehicles.
Food MaterialsBy expanding our sales channels and pursuing regional specialization, we will accelerate the development into our main businesses.
M VISION Region / Main Businesses
SemiconductorsLeveraging the supply chain’s information gathering expertise and the local human resources, we are lead-ing the expansion of Chinese businesses through win-win relationships as an overseas manufacturing busi-ness consultant
MobilityWe will help develop smart mobility in China by quickly responding to technological advances in the industry and providing value-added products and services.
ElectronicsIn such fields as next-generation displays, 5G, and car electronics, we create high-value-added local com-munication businesses by uncovering needs using our strengths and providing solutions.
FOCUSIn April 2019, we established Nagase Holdings America Corporation as a regional headquarters. Looking to expand business in the Americas, which is still expected to be a promising market, this headquarters will serve as a base for the NAGASE Group’s total capabilities. We aim to spur M&A and other business investments, create new businesses through regional leadership, strengthen governance, and make swift man-agement decisions in response to local conditions.
FOCUSExpanding South Korean Communication BusinessesShifting from a technology-driven approach toward global expansion, we aim to expand our range of NAGASE Group products and products that South Korean companies excel in producing, including OLED-related materials, semiconductor process materials, battery materials, and cosmetic materials.
FOCUSEstablishment of Nagase (Thailand) Co., Ltd.’s Pakistan OfficeIn February 2019, we established an overseas representative office for Nagase Thailand (NTL) in Karachi, Pakistan. The office began opera-tions with NTL representatives and two local staff members to meet the need for local production, especially in the automotive industry. In addition to its existing customers, the office is contributing to the Group’s growth as a strategic base in Pakistan and neighboring countries through collaboration with local companies and active entry into non-automotive industries.
FOCUSAs the regional headquarters for Greater China, including Taiwan and Hong Kong, we established Nagase (China) Co., Ltd. in January 2019. Fully leveraging the Group’s total capabilities, we aim to expand business in the still promising Chinese market by swiftly assessing invest-ments, creating new businesses and strengthening governance with the regional headquarters as the center base.
FOCUSClean Labels and White Biotechnology: Addressing Regulations and Customer DemandsTo meet various changing demands in the cosmetics field, we will establish a synthesis laboratory facility in Lyon, France, to develop formula-tions, especially with natural materials. Using current artificial 3D skin models, we are working to acquire basic and application data for natural materials for use in approved acquisitions and marketing activities.
FunctionalMaterials
7%
Advanced Materials & Processing
50%
Electronics
23%
Mobility &Energy
18%
Life & Healthcare
1%
Breakdown of Net Sales
FunctionalMaterials
22%
Advanced Materials & Processing
43%
Electronics
6%
Mobility &Energy
26%
Life & Healthcare
3%
Breakdown of Net Sales
FunctionalMaterials
12%
Advanced Materials & Processing
27%
Electronics
30%
Mobility &Energy
9%
Life & Healthcare
22%
FunctionalMaterials
31%
Advanced Materials & Processing
16%
Electronics
15%
Mobility &Energy
29%
Life & Healthcare
9%
Breakdown of Net Sales
Base established: 1985Number of employees: 35
Basic information
Breakdown of Net Sales
FunctionalMaterials
15%
Advanced Materials & Processing
12%
Electronics
45%
Mobility &Energy
24%
Life & Healthcare
4%
205.4Billion yen
(FY2019)
15.2Billion yen
(FY2019)
39.4Billion yen
(FY2019)
16.8Billion yen
(FY2019)
118.1Billion yen
(FY2019)
Financial and Corporate Information
Introduction SustainabilityFoundation for Value Creation
Strategy Business Portfolio
NAGASE Group Integrated Report 201956 57NAGASE Group Integrated Report 2019
Topics
Formed Long-Term Partnership for Expanding Pullulan Capsule MarketTo keep pace with the expanding market for pullulan capsules, we concluded a long-term part-nership agreement with Switzerland-based Lonza, a leading supplier to the pharmaceutical, bio-tech and specialty ingredients markets. Pullulan is a highly water-soluble polysaccharide produced through the natural fermentation of starch. It is used as a food ingredient and a pharmaceutical ingredient for supplement capsules and other such products. We started to set up a new facility, which will be completed in September 2020 in order to respond to the expanding demand.
Core Technologies / CreativeWe have developed a wide variety of elemental technolo-gies based on our core technologies, which encompass synthesis technologies (organic and polymerization), formu-lation technologies, biotechnologies, and evaluation tech-nologies. Into technologies that we have nurtured and passed down over many years, we have infused innovation to create unique product lineups in the Functional Resins, Photolithography Materials, Performance Chemicals, and Bio Chemicals businesses.
Net Sales and Operating Income (Billions of Yen)
25.6
2.9
25.9
2.9
26.0
2.8
17/3 18/3 19/3Net Sales Operating Income
Functional Resins Business
Photolithography Materials Business
Performance Chemicals Business
Bio Chemicals Business
We develop and manufacture for-mulated epoxy resins and other high-value-added products, espe-cially in the fields of environmentally friendly energy, mobility, and mobile devices. We have established a global supply system (covering Japan, the United States, and China) to provide total solutions.
We conduct development and manufacturing activities based on technologies developed in the chemicals business for liquid crystal display and front-end process of semiconductors. We are garnering praise from customers for develop-ing new products for mid-end pro-cess of semiconductors. We are also steadily developing new pho-toresist for lift-off process for next-generation devices.
We are developing new applications for highly functional materials, based on organic synthesis technologies, polymerization technologies, and compounding technologies, in the fields of displays, automobiles, and hygiene products. We are working to create new businesses and expand existing business by devel-oping new materials, acquiring new technologies, and developing new applications.
This business serves as the core of the Life Science field and develops food and industrial applications for enzymes derived from microorgan-isms and plants. We are strength-ening our alliances with the Nagase R&D Center and Hayashibara Co., Ltd. and are focusing on develop-ing new products using actinomy-cete enzymes.
Materials Supporting Our Information-Based SocietyWe are supporting our information- based society through FRP matrix adhesives for the mobility field (EVs, PHVs), highly heat resistant potting materials for car electron-ics, and encapsulating materials for semiconductor packaging used in 5G communications and data pro-cessing. In addition, we have begun work on developing new materials geared toward a society based on ubiquitous information access.
NPR9000 SeriesThis is a series of photoresists spe-cialized for lift-off processes. These products enhance functionality, miniaturize, and reduce processing for electronic devices, including sensors that are expected to be more heavily used in IoT and self-driving applications. We are broadening our product lineup to meet every need.
Denacol™ / Denatron™The epichlorohydrin-derivatives Denacol™ is used as a resin for 3D printers and crosslinkers for super-absorbent polyment by leveraging its strengths (transparency and water solubility). We are working to devel-op applications for the conductive coating material Denatron™ for dis-plays and light control films by leveraging its high conductivity and antistatic properties.
DENABAKE™ EXTRADENABAKE™ EXTRA is a bread- making enzyme jointly developed with Hayashibara Co., Ltd. It is a unique product that can make bread soft and melt-in-your-mouth. It can also add natural sweetness. It works well with whole-wheat and barley flour. We are promoting this enzyme for mak-ing scrumptious, easy-to-eat, healthy bread.
Topics
Next-Generation Manufacturing and BiomaterialsAs for new businesses, we have entered the fields of next-generation manufacturing and bioma-terials. In the next-generation manufacturing field, we have expanded our lineup of resins for 3D printers and began sales of samples of low-temperature sintered wiring ink with the aim of full commercialization, earning positive feedback for both efforts. In the biomaterial field, we used our unique endotoxin removal technology to begin providing samples that use low-endotoxin materials, mainly for the medical industry.
Nagase ChemteX Corporation
“For the Future.”To leverage the strength of our unique product lineup, we aim to establish a competitive production system with a view to global markets.
President: Satoru FujiiEstablished: 1970Production and development bases:Domestic• Harima Plant • Fukuchiyama Plant• Sakai PlantOverseas• Nagase ChemteX (Wuxi) Corporation (China)• Wuxi Chenghong Electronic Chemical Co.,
Ltd. (China)• Engineered Materials Systems, Inc. (U.S.)• Inkron Oy (Finland)Number of employees: 584Number of patents held: 584 (including 279 overseas patents) (As of March 2019)
Biotechnology / InnovationOur core technologies are microorganism screening tech-nology, substance production technology using microor-ganisms and enzymes, and technologies for discovering functions of materials. We will continue working hard to develop new materials while refining our core technologies. We produce unique functional carbohydrates using enzymes created by microorganisms. We then supply these carbohydrates as ingredients for foods, cosmetics, and pharmaceuticals in a wide range of markets in Japan and overseas. In addition, we use sophisticated organic synthe-sis technologies to develop and manufacture a wide variety of functional dyes. The dyes are used in various industrial fields as well as the life science field as pharmaceuticals and diagnostic detectors.
Food Ingredient BusinessCosmetic and Pharmaceutical
Ingredient BusinessFunctional Dye Business
We develop, manufacture, and sell unique high- value-added food ingredients and health food ingredients. We are playing a part in NAGASE Group’s Life & Healthcare segment. We contribute to overseas subsidiaries by expanding their sales and sales channels through sales of food and health food ingredients.
We develop and manufacture unique high-value- added cosmetic and pharmaceutical ingredients. We provide products in the field of personal care and pharmaceuticals for the NAGASE Group’s Life & Healthcare segment. We also contribute to expanding the sales of each Group company in Japan and overseas.
We develop and manufacture a wide variety of functional dyes as an organic synthesis special-ist. Dyes with various functions are used in a broad range of fields. We also provide many dif-ferent kinds of products to the life sciences fields, including the NAGASE Group’s Advanced Materials & Processing segment.
TREHA™TREHA™ is a low-sweetness food ingredient with a clean finish. It has a wide range of functions, including prevention of starch retrogradation, protein denaturation, and freshness keeping.Because it retains good flavor and texture for a long time, it is used in Japan and overseas in a wide range of fields, such as processed foods, beverages, and food services including restau-rants, catering, and delis.
AA2G™AA2G™ is produced by the enzymatic binding of glucose to vitamin C. This enzymatic conversion makes AA2G™ stable when incorporated into cosmetics. This maintains its activity and provides resistance to discoloration and odors. When applied to the skin, AA2G™ is degraded by a natural enzyme to release vitamin C, resulting in cosmetics that promote brighter healthier looking skin. It is used in Japan and around the world.
Dyes for the Life SciencesSome functional dyes are known for having medicinal and/or bioactive functions. In addition, some dyes are used as cell staining dyes and have fluorescent properties. We are developing new medical and pharmaceutical applications using these functions.
Net Sales and Operating Income (Billions of Yen)
23.8
4.6
24.3
5.0
25.4
5.1
17/3 18/3 19/3Net Sales Operating Income
Hayashibara Co., Ltd.
“ We continue to innovate new and original materials with our advanced biotechnology.”
We will strengthen our overseas bases to make our functional ingredients a top global brand.
President: Naoki Yasuba
Established: 1932Production and development bases:DomesticOkayama Plant I, Okayama Plant II, Okayama Functional Saccharide Plant, Fujita Plant, Fujita Pharmaceutical Plant, Fujisaki Institute, L’ Plaza
Number of employees: 645Number of patents held: 801 (including 531 overseas patents) (As of March 2019)
Financial and Corporate Information
Introduction SustainabilityFoundation for Value Creation
Strategy Business Portfolio
NAGASE Group Integrated Report 201958 59NAGASE Group Integrated Report 2019

Nagase Business Expert Co., Ltd.
“Shared Service Center”We are contracted to perform intra-Group administrative operations, including logistics, trade, payroll, treasury services, and credit management, and we strive to make these operations more efficient.
Organizational Goals / StructureThe NVC Office was established in April 2017 to promote NAGASE Group innovation and build core businesses of the future that will create new value. The office assesses trends in the IT industry, including IoT and AI, planning and developing mechanisms for businesses not currently part of the NAGASE Group. These mechanisms will be deployed to the various business divisions for implementation. Semiconductors are running up against the limits of miniaturization, which had been the standard for measuring the advancement of electronics, and the technological revolution in this area is currently approaching a new turning point. Under its next-generation slogan of “Bio-Inspired Technologies,” the NVC Office aims to create new value by focusing on the integration of electronics and biology, as exemplified by neural devices and biomimicry.
Organizational GoalsK We will actively interact with academia to grasp industry-wide trends and build new busi-
nesses that look ahead five to ten years in the future.K We will take stock of trends in hardware technologies that support AI and IoT to ensure
that we always stay one step ahead of the next paradigm shift.
Organizational StructureThe NVC Office will be a flexible organization that benefits from synergistic effects between the business divisions, group companies, and partner companies.
New Value Creation (NVC) Office
“New Value Creation”We discover the cores of new businesses by using data science in the chemical big data fields.
Under the mid-term management plan ACE-2020, we outlined the pursuit of efficiency to strengthen our business foundation. Nagase Business Expert Co., Ltd. has highly specialized staff who handle the administrative operations of NAGASE & CO., LTD. and its Group companies. Through this work, we aim to help rationalize Group management, help enhance productivity and make Group administrative operations more efficient, fulfill such risk management func-tions as credit and legal management, and develop human resources that can contribute to the Group. We aim to fur-ther contribute to the Group’s value creation mainly by increasing the number of Group companies we provide ser-vices to and expanding the contracted operations in order to increase sales and profit, reduce costs, minimize future loss, and enhance the productivity of sales departments.
Number of Contracted Companies (By operation)
5
10
5
11
8
11
1
5
9
12 12 12
17/3 18/3 19/3
Debt management PayrollCredit management General administrative operations
Topics
President: Takanori Yamauchi
Established: 1996Note: The company relaunched in 2017 by
integrating the businesses of Nagase General Service Co., Ltd. and Nagase Trade Management Co., Ltd.
Number of employees: 172 (As of March 2019)
Promoting Working Style Reforms ahead of Group CompaniesTo enhance productivity, which is the source of the Company’s competitiveness, we have actively introduced flexible working styles. We had already introduced a four day work week, paid vacation that can be taken in one-hour units, and reduced working hours without the need for childcare and care giving as reasons. In addition to these programs, we aim to introduce a telecommuting program during fiscal 2019 and will conduct trials where employees can conduct business by accessing the company’s system from home. We are promoting working style reforms ahead of Group companies and will continue working to promote these good practices throughout the Group.
Project 1 Predicting and offering new materials sought by users
Materials InformaticsProject 2 Semiconductor design and technology supporting AI and 5G
Axonerve™ Intellectual Property Core
Technology OverviewMaterials Informatics (MI) is a field of technology for developing new materi-als by combining the latest data processing technologies with materials sci-ence. We recently jointly started to developed a platform with IBM Corporation. Using AI to analyze and systematize big data from materials- related literature and experiments, this platform utilizes a cognitive approach to predict and propose new materials sought by users. There is also an ana-lytics approach that shows the chemical structures of substances sought by users by having AI learn the relationships between chemical structures and physical properties from big data about substances.
Technology OverviewAxonerve™ is a data search algorithm developed by NAGASE and domestic research organizations. NAGASE developed an IP core for FPGAs, which are programmable semiconductors, and is expanding its IP core licensing busi-ness. Currently, FPGAs are garnering attention as a way to accelerate net-work functions and high-speed data processing at data centers, where virtualization is making inroads. We are working to cultivate the market with FPGA vendors.
Our AdvantageThe conventional way to develop new materials is to repeatedly conduct experiments and make proto-types. However, by introduc-ing MI, we aim to significantly reduce development costs and shorten development times. MI is also gaining a lot of attention due to its poten-tial to help discover revolu-tionary materials.
Our Advantage5G, which will start from 2019, will enable many simultaneous connections for high volume traffic and ultra-low latency. For telecommunication infra-structure that will support 5G and for edge serves that are expected to pro-vide low-latency services, FPGAs’ ability to accelerate servers is gaining attention for meeting tough low-latency demand and processing capabilities, as well as for enabling low-power-consumption systems. On the other hand, FPGA vendors are accelerating the development of design simplification tools using programming languages and sales of general-purpose cards for acceleration applications. They are promoting these design solutions with partners in Japan and overseas.
Topics
Launched Division-wide Technology Community ActivitiesWe launched the NAGASE Technical Vitality Program, a division-wide technology community activity, with the purpose of incubating new cross-functional business that will support the future of the NAGASE Group.
Aim of New Activities• Generate new division-wide themes (we will consider previously set themes and themes
generated by members in a bottom-up approach)• Engrain leading-edge technologies across the Company (AI, IoT, semiconductors, neural
devices, additive manufacturing, next-generation wireless technology (5G, 6G), etc.• Promote NAGASE Group technologies internally and externally (material informatics,
biotechnology, etc.)• Discover and develop specialist human resources
GM: Yasumitsu Orii
Established: 2017
For payroll operations, we plan to standard-ize the existing contracted companies by integrating our systems by fiscal 2020, and we plan to accept new contracts to expand our business from fiscal 2021 onward.
HR & General Affairs Services Department Trading Services Department
General Affairs Services DivisionThis division accepts contracts for a wide range of general affairs operations, including facility management, especially facility operations and building office environments; support for emergency preparedness, BCPs, and environ-mental ISO certifications; and employee welfare services. In addition, the department helps improve efficiency through Group-wide procurement, including for consumables and office equipment, and the joint use of services.
HR Services DivisionThis division accepts contracts from 11 Group companies, mainly for global HR training support and payroll-related services (domestic and overseas payroll, social insurance, labor insurance, work hour management, life insur-ance, non-life insurance, asset formation, stockholding associations, etc.). Regarding payroll-related operations, we are working to standardize the operations using a universal system.
Logistics DivisionThis division handles operations for Group companies, such as the creation of trade-related documents, procedures for customs clearance and ship loading, and insurance coverage. It also takes actions aimed at optimizing and reducing logistics costs, such as revising transportation routes and inventory bases.
Financial Services DivisionThis division accepts contracts from Group companies for operations related to domestic and overseas debt management, domestic treasury services (including paying business expenses), and overseas exchange rate manage-ment. The department is working to raise the efficiency of operations for making and receiving payments.
Sales Support DivisionThis division works to enhance the productivity of the entire Group using a unique system to manage credit, standardize various administrative opera-tions related to sales activities, and automate operations using robotic pro-cess automation (RPA). N
ew sub
stancesN
ew m
aterials
Financial and Corporate Information
Introduction SustainabilityFoundation for Value Creation
Strategy Business Portfolio
NAGASE Group Integrated Report 201960 61NAGASE Group Integrated Report 2019

Nagase R&D Center
“Unavailable Made Available in a Sustainable Way”The Nagase R&D Center will continue to advance the NAGASE Group’s bio-related businesses from the earliest stages of research development.
Nagase Application Workshop
“A Place for Open Innovation for Plastics and Coatings”We will enhance our global presence through high performance test and evaluation functions and technical support.
Fundamental Technologies / IntegrationSocieties around the world are currently facing a multitude of issues, including growing populations with dwindling resources, abnormal weather events, and environmental problems. To solve these issues, the Nagase R&D Center aims to create research themes that contribute to society from a macro perspective. By integrating advanced technologies and our knowledge spanning many different bio fields, we will continue to spur process innovation and contribute to health, safety, security, and solutions to environmental problems as we meet people’s needs.
Patent Field 1
Core TechnologiesPatent Field 2
Fundamental Technologies
• Fermentation technologies using actinomycetes
• Strain improvement technologies utilizing metabolic engineering
• Genetic engineering • Bioprocess engineering
• Metabolic engineering • Bioinformatics
• Fermentation engineering • Bioactivity assessment
Explanation of Patent Field: Materials production technologies using actinomycetesUsing actinomycete fermentation, we can efficiently manufacture valuable materials that are scarce in nature and are difficult to synthesize using organic chemistry.
Example applications:• Ergothioneine (antioxidant)• Nootkatone (fragrance ingredient)• Trehangelin (cosmetic) materials, etc.• Mycosporine-like amino acids (UV absorbers)
Explanation of Patent Field: BioinformaticsWe develop technologies that set us apart from competitors in regard to var-ious elemental technologies indispensable to bio-related manufacturing.
Specific Research Content:To use microorganisms to manufacture valuable materials that only plants produce, you first have to discover microorganism-derived enzymes that have a function equivalent to the unique enzymes in plants. Usually, the search begins with the genetic sequences that code for the enzyme. However, we found a search method that uses reaction patterns and does not rely on sequence data.
Plastics and Coatings / EvaluationsAs the testing and evaluation arm of the NAGASE Group for plastics and coatings, the Nagase Application Workshop (NAW) develops application technologies to meet various needs, including those of domestic and overseas customers as well as materials manufacturers and processing companies. Annual visitors exceed 200 companies, and we respond to between 200 and 300 testing and development requests. We have gained magnificent trust as a development partner of cus-tomers and suppliers. In addition, we have an excellent techno-logical expertise for new elemental technologies and functional materials, thereby enhancing the market presence of NAGASE.
Vision for NAW• Testing and Evaluation Arm of the NAGASE
Group (Testing Ground for New Technologies)Because NAW is a laboratory of a trading house, it has access to materials from a wide range of suppliers and serves as a place to carefully study all the differ-ent technologies in the world. We will continue to flexi-bly respond to the NAGASE Group’s various requests for testing, evaluation, prototyping, and development.
• Antenna for Technological Trends (Storehouse of Technologies)
As the storehouse of the NAGASE Group’s technologies, NAW fos-ters greater information sharing, combines and processes accu-mulated technologies, and promotes its findings across the Group.• Developer of Innovative Businesses (Development of
Proprietary Fundamental Technologies)Working with various partners, NAW promotes the development of proprietary fundamental technologies and helps create new businesses.
• Collaboration with Group Manufacturing Companies
We enhance the Group’s capabilities through collab-oration with Group manufacturing companies while maintaining mutual independence.• Developer of EngineersWe develop the NAGASE Group’s engineers using technical training and other programs.• Promoting NAGASE Group
GM: Xiaoli Liu
Established: 1990
Number of patents held: 30** Includes, pending applications and
10 overseas patents (As of March 2019)
GM: Akihiro Taniguchi
Established: 2007
Number of patents held: 42** Includes, pending applications and
25 overseas patents (As of March 2019)
Cumulative Number of Patent Applications*
16
6
18
7
21
8
17/3 18/3 19/3Domestic Overseas
*From fiscal 2013 onwardNumber of Patent Applications and Testing/Development Requests
5
366
13
324
15 218
17/3 18/3 19/3Patent applications Testing/development requests
Topics
Main Function 1 Plastics Main Function 2 Coating materials
Plastic material analysis using twin-screw extruders, injection molding machines, and various analytic equipment; compound formulation, prototypes of formed products, and materials analysis
Equipment:• Twin-screw extruders (15mm, 18mm, 26mm)• Injection molding machines (80t and 110t)• Forming presses• Analysis equipment• Measurement equipment, etc.
Coating material analysis using various processing equipment, evaluation and analysis equipment, development of paint and ink formulation, prototyping and property evaluation
Equipment:• Dry coating booths• Dispersing machines (paint conditioner, horizontal type, vertical type bead mill)• UV irradiation machines• Drying ovens• Various environmental testing machines
Products Developed in the Plastics Field• Plastic materials for molding (in collabora-
tion with automotive part makers)• High sliding polyethylene featuring superi-
or processing characteristics• Transparent, high impact plastics for use
in cosmetics, medical products, and food applications
Products Developed in the Coating Materials Field• Pat!naLock™, a reactive paint that sup-
presses rust using rust• A carbon hybrid coating system that dra-
matically reduces volatile organic com-pounds (VOCs) in paint
• New coating materials that enable new design offerings to meet industry needs
Processing companies
CustomersMaterials manufacturers NAGASE
• Evaluation of raw materials and processing technology
• Marketing, including application development
• Develop unique NAGASE brand products• Offering new function and product design
Automobiles/ Appliances, OA Equipment, Mobile Phones/ Amusement/Housing/ Apparel, Sporting Goods/ Cosmetics, Food Products, Beverages
This mechanism is made uniquely possible by NAGASE
1. Plastics 2. Coating materials
Multipurpose laboratory
Functions and Roles of NAW
NAW
Topics
Breakthrough in Fermentation Technology for Producing Functional Ingredient “Ergothioneine”Ergothioneine is a natural amino acid that has excellent antioxidant properties and can be found in trivial amounts in mushrooms and other organisms. Its applications in a wide range of fields, including foods, cosmetics, and pharmaceuti-cals are highly expected. The conventional method of extraction from mushrooms or chemical synthesis has issues in terms of stable supply, environmental impact, and cost. The Nagase R&D Center has researched an alternative fermen-tation method that is safe, secure and eco-friendly. The issue with the fermentation method is productivity, and it is important to control the complex microorganic metabolic systems. The R&D Center discovered an important factor related to the highly efficient production of ergothioneine and made a technological breakthrough that greatly raised production efficiency. We aim to quickly commercialize this technology as we continue to meet the needs of the market.
Renewable biomass
Natural genetic resources
Microorganism fermentation
Ergothioneine
Financial and Corporate Information
Introduction SustainabilityFoundation for Value Creation
Strategy Business Portfolio
NAGASE Group Integrated Report 201962 63NAGASE Group Integrated Report 2019

Financial and Corporate Information
Introduction SustainabilityFoundation for Value Creation
Strategy Business Portfolio
NAGASE Group Integrated Report 201964 65NAGASE Group Integrated Report 2019
Business Lines and Scope of Consolidation
The NAGASE Group is led by NAGASE & CO., LTD. (the “Company”
or “NAGASE”). The Company and its consolidated subsidiaries (col-
lectively, the “Group”) imports and exports a diverse array of prod-
ucts and engages in domestic transactions. In addition, the Group
manufactures and sells products and provides services. These busi-
nesses are conducted by 102 affiliated companies consisting of 69
subsidiaries and 33 affiliates. The NAGASE scope of consolidation
includes 60 companies, as well as 23 affiliates accounted for by the
equity method.
Overview of Consolidated Results
Net SalesThe Japanese economy remained strong throughout the fiscal year
ended March 31, 2019, supported by improved corporate earnings,
employment, and payrolls. However, uncertainties in the global econ-
omy have been increasing since the end of the prior year, and signs
have emerged of a slowing in growth, mainly in the industrial sector,
which relies on demand from overseas. Although corporate earnings
in the United States has been a major driving force in the global
economy, U.S.-China trade frictions, national fiscal policies, exchange
rate fluctuations, and other emerging risk factors have given rise to
concerns about the future direction of the world economy.
In this environment, the Company recorded domestic sales of
¥412.61 billion (+4.3% year on year) for the fiscal year. Overseas sales
amounted to ¥395.13 billion (+1.7%). In total, the Company recorded
¥807.75 billion in net sales (+3.0%), a record high.
Net Sales
(Billions of yen)
0
200
400
1,000
600
800
2017 2018 201920162015
722.38783.93 807.75
742.19759.71
(Fiscal years ended March 31)
Gross Profit and Profit Attributable to Owners of the Parent
The Company recorded gross profit of ¥105.44 billion (+2.7%) mainly
due to generally higher global sales and improved profitability among
the Company’s manufacturing subsidiaries. Operating income was
¥25.22 billion (+4.6%). As a result, gross profit margin and operating
income margin remained roughly in line with the previous fiscal year
at 13.1% and 3.1%, respectively. Ordinary income amounted to
¥26.64 billion (+2.5%). All profit indicators marked record highs in the
history of the Company.
Gross Profit and Operating Income
(Billions of yen)
0
30
60
120
90
2017 2018 201920162015
105.4
25.224.115.018.018.1
91.9102.6
91.591.6
(Fiscal years ended March 31)
Gross Profit (Left scale)Operating Income (Right scale)
The Company recorded profit before income taxes of ¥28.2 billion
(+17.3% year on year) with a ratio of profit before income taxes to net
sales of 3.5%, which was a 0.4 percentage point increase compared
to the prior fiscal year.
As a result, profit attributable to owners of the parent amounted to
¥20.13 billion (+17.2%). Return on sales increased by 0.3 percentage
points to 2.5%. Earnings per share was ¥161.30, compared to
¥136.34 in the prior year.
Profit Attributable to Owners of the Parent /Earnings per Share
(Billions of yen)
0
5
10
25
15
20
(Yen)
0
50
100
250
200
150
2017 2018 201920162015
10.33
17.17
20.13
12.3111.31
161.30
136.34
81.6596.9689.10
(Fiscal years ended March 31)
Profit Attributable to Owners of the Parent (Left scale)Earnings per Share (Right scale)
Management’s Discussion and Analysis of Operations and Finances
Millions of yen
Thousands of U.S. dollars
(Note 1)
2014 2015 2016 2017 2018 2019 2019
For the Fiscal Year:
Net Sales ¥723,212 ¥759,713 ¥742,194 ¥722,384 ¥783,933 ¥ 807,755 $7,277,728
Domestic 372,939 374,208 363,038 369,365 395,428 412,617 3,717,605
Overseas 350,272 385,505 379,155 353,019 388,504 395,137 3,560,114
Gross Profit 88,936 91,991 91,663 91,503 102,675 105,441 950,005
Operating Income 15,789 18,153 18,024 15,030 24,118 25,226 227,282
Profit before Income Taxes and Non-Controlling Interests 18,353 18,989 15,239 16,100 24,049 28,204 254,113
Profit Attributable to Owners of the Parent 11,663 11,318 12,316 10,331 17,175 20,136 181,422
As of the Fiscal Year-End:
Total Assets ¥498,141 ¥546,525 ¥512,081 ¥530,775 ¥569,456 ¥ 567,346 $5,111,686
Net Assets 251,892 287,500 279,149 295,198 308,804 312,609 2,816,551
Interest-Bearing Debt 92,828 98,493 87,560 82,046 86,173 85,620 771,421
Share Price (Yen) 1,275 1,573 1,237 1,551 1,805 1,589 14.32
Market Value 176,470 200,413 157,604 197,610 229,971 202,451 1,824,047
Number of Shares Issued and Outstanding (Thousands of Shares) 138,408 127,408 127,408 127,408 127,408 127,408 —
Number of Shareholders 6,984 6,781 7,338 10,394 11,357 12,788 —
Number of Employees 5,960 6,259 6,267 6,241 6,312 6,143 —
YenU.S. dollars
(Note 1)
Per Share Data
Profit Attributable to Owners of the Parent ¥ 91.86 ¥ 89.10 ¥ 96.96 ¥ 81.65 ¥ 136.34 ¥ 161.30 $ 1.45
Net Assets 1,942.20 2,215.18 2,156.67 2,301.10 2,424.97 2,481.01 22.35
Cash Dividends 28.00 30.00 32.00 33.00 40.00 42.00 0.38
%
Ratios
Operating Margin (Operating Income/Net Sales) 2.2 2.4 2.4 2.1 3.1 3.1 —
Ratio of Profit before Income Taxes and Non-Controlling Interests to Net Sales 2.5 2.5 2.1 2.2 3.1 3.5 —
Return on Sales (ROS) 1.6 1.5 1.7 1.4 2.2 2.5 —
Total Assets Turnover (Times) 1.5 1.5 1.4 1.4 1.4 1.4 —
Return on Assets (ROA) 2.4 2.2 2.3 2.0 3.1 3.5 —
Return on Equity (ROE) 4.9 4.3 4.4 3.7 5.8 6.6 —
Shareholders’ Equity Ratio 49.5 51.5 53.5 54.7 53.3 54.2 —
Debt to Equity Ratio (Times) 0.38 0.35 0.32 0.28 0.28 0.28 —
Current Ratio 187.2 187.0 200.1 192.9 183.1 181.2 —
Interest Coverage Ratio (Times) (Note: 2) 15.80 17.86 18.69 16.31 20.02 15.99 —
Note: 1. U.S. dollar amounts have been translated from yen, for convenience only, at the rate of ¥110.99=U.S. $1.00, the approximate rate of exchange prevailing on March 31, 2019.Note: 2. Interest coverage ratio is calculated as (operating income + interest income + dividend income) / interest expense.
Six-Year SummaryNAGASE & CO., LTD. and Consolidated Subsidiaries (Fiscal years ended March 31, 2014–2019)

Financial and Corporate Information
Introduction SustainabilityFoundation for Value Creation
Strategy Business Portfolio
NAGASE Group Integrated Report 201966 67NAGASE Group Integrated Report 2019
Results by Business Segment
Note: The Company reclassified certain reportable segments in the fiscal year ended March 31, 2019. The Company has reclassified reportable segment classifications for the prior fiscal year for comparative purposes.
Functional Materials
Fiscal years ended March 31 (Millions of yen)
2018 2019
Sales to Customers ¥174,922 ¥179,627
Segment Income 5,185 5,494
Segment Assets 86,176 87,158
Depreciation and Amortization 456 444
Amortization of Goodwill 82 110
Goodwill 2,031 2,012
Investments in Equity Affiliates 2,478 2,398Increase in Property, Plant, and Equipment and Intangible Fixed Assets 243 314
The Functional Materials segment recorded higher sales in both
domestic and overseas markets.
The Performance Chemicals business recorded higher sales, mainly
due to improved sales of coating raw materials and urethane materials,
spurred by strong automotive production in Japan and overseas, as
well as naphtha price increases. Another contributing factor was the
additional sales of the U.S. distributor acquired in the second quarter
of the prior fiscal year, reflected for the entire fiscal year.
The Speciality Chemicals business recorded sales slightly higher
compared to the prior fiscal year. Although overseas sales were lower
for the period, our domestic business experienced an increase in
sales of electronics chemicals and plastic materials/plastic additives
for the semiconductor and other related electronics industries.
As a result, the Functional Materials segment recorded sales of
¥179.62 billion, a ¥4.7 billion (+2.7%) increase compared to the prior
fiscal year. Operating income for the segment was ¥5.49 billion, an
increase of approximately ¥300 million (+6.0%).
Advanced Materials & Processing
Fiscal years ended March 31 (Millions of yen)
2018 2019
Sales to Customers ¥262,831 ¥275,203
Segment Income 6,700 8,093
Segment Assets 134,977 135,403
Depreciation and Amortization 645 692
Amortization of Goodwill — —
Goodwill — —
Investments in Equity Affiliates 1,482 1,545Increase in Property, Plant, and Equipment and Intangible Fixed Assets 2,817 1,542
The Advanced Materials & Processing segment recorded higher
sales in both domestic and overseas markets.
The Colors & Advanced Processing business recorded higher sales
as a whole, driven by growth in Japan for plastic resins for industrial
and packaging applications and dyes/additives, as well as growth in
digital print processing materials in both Japan and overseas.
The Polymer Global Account business mainly sells plastics to the
office equipment, appliance, and video game device markets. The
sales of those business were higher overall, driven by growth in
Japan, Greater China, and ASEAN.
As a result, the Advanced Materials & Processing segment recorded
sales of ¥275.2 billion, a ¥12.37 billion (+4.7%) increase compared to
the prior fiscal year. Operating income grew ¥1.39 billion (+20.8%),
reaching ¥8.09 billion for the year.
Electronics
Fiscal years ended March 31 (Millions of yen)
2018 2019
Sales to Customers ¥129,324 ¥122,319
Segment Income 8,917 7,400
Segment Assets 70,149 65,022
Depreciation and Amortization 2,454 2,511
Amortization of Goodwill 112 136
Goodwill 1,296 1,218
Investments in Equity Affiliates 2,751 3,765Increase in Property, Plant, and Equipment and Intangible Fixed Assets 1,834 3,201
The Electronics segment recorded lower sales in both domestic and
overseas markets.
Despite strong performance in formulated epoxy resins sales to
the semiconductor industry, lower photolithography materials sales
and equipment-related sales drove Electronic Chemicals business
sales lower.
The Electronic Materials business recorded lower sales due to
decreases in display-related products, despite strong performance in
our business for abrasives used in connection with interim process-
ing in semiconductors.
As a result, sales for the segment amounted to ¥122.31 billion,
which was a ¥7.0 billion (-5.4%) decrease. Operating income fell
¥1.51 billion (-17.0%) to ¥7.4 billion for the year.
Automotive & Energy
Fiscal years ended March 31 (Millions of yen)
2018 2019
Sales to Customers ¥129,708 ¥139,235
Segment Income 2,415 3,051
Segment Assets 51,109 56,747
Depreciation and Amortization 249 211
Amortization of Goodwill — —
Goodwill — —
Investments in Equity Affiliates 1,231 1,253Increase in Property, Plant, and Equipment and Intangible Fixed Assets 191 329
The Automotive Solutions business recorded higher sales, driven by
strong performance in our resins business in Japan, Greater China,
and ASEAN. Sales growth in car electronics-related products was
another positive factor.
As a result, sales for the segment amounted to ¥139.23 billion,
which was a ¥9.52 billion (+7.3%) increase compared to the prior
fiscal year. Segment operating income grew ¥630 million (+26.4%),
reaching ¥3.05 billion for the year.
(Note) As of April 1, 2019, the Automotive & Energy Segment has been renamed the Mobility & Energy Segment.
Life & Healthcare
Fiscal years ended March 31 (Millions of yen)
2018 2019
Sales to Customers ¥86,517 ¥90,794
Segment Income 4,201 4,648
Segment Assets 99,396 97,627
Depreciation and Amortization 3,552 3,801
Amortization of Goodwill 1,552 1,569
Goodwill 22,150 20,636
Investments in Equity Affiliates 2,601 2,769Increase in Property, Plant, and Equipment and Intangible Fixed Assets 2,369 3,206
The Life & Healthcare segment recorded higher sales in both domes-
tic and overseas markets.
Sales of TREHA™ and other products in the food ingredients field
in the Life & Healthcare Products business rose overseas and were
slightly higher in Japan. Sales of AA2G™ to customers in the skin
care and toiletries sectors were higher both in Japan and overseas.
In the medical and pharmaceutical field, sales of pharmaceutical raw
materials and intermediates, sales of medical materials, and pharma-
ceutical business sales were higher than the prior fiscal year. As a
result, the business recorded higher sales compared to the prior year.
The Beauty Care Products business, which includes sales of cos-
metics and health foods, recorded lower sales, driven down due to
weak performance across all product categories.
As a result, sales for the segment amounted to ¥90.79 billion,
which was a ¥4.27 billion (+4.9%) increase compared to the prior
fiscal year. Operating income grew ¥440 million (+10.6%), reaching
¥4.64 billion.
Others
No special matters to disclose.
Financial Condition
Summary of Consolidated Cash FlowsCash and cash equivalents (Cash) increased ¥1.15 billion (+2.7%)
compared to the end of the prior fiscal year, amounting to ¥44.01
billion. Cash from operating activities amounted to ¥17.37 billion,
while cash used in investing activities came to ¥7.32 billion and cash
used in financing activities amounted to ¥8.9 billion.
Cash Flows from Operating ActivitiesCash from operating activities for the fiscal year ended March 31,
2019 amounted to ¥17.37 billion. Cash decreased ¥12.52 billion
stemming from an increase in working capital, while the Company
recorded ¥4.87 billion in income taxes paid. In contrast, the Company
recorded ¥28.2 billion in profit before income taxes and cash
reserves of ¥9.32 billion related to depreciation and amortization.
Cash Flows from Investing ActivitiesCash used in investing activities for the fiscal year ended March 31,
2019 amounted to ¥7.32 billion. This result was mainly due to ¥10.75
billion in purchases of tangible and intangible fixed assets, as opposed
to ¥5.47 billion in proceeds from sales of investments in securities.
Cash Flows from Financing ActivitiesCash used in financing activities for the fiscal year ended March 31,
2019 amounted to ¥8.90 billion. This result was mainly due to repay-
ments of long-term loans in the amount of ¥11.17 billion and pay-
ments of dividends in the amount of ¥5.13 billion. These outlays
exceeded net proceeds from commercial paper of ¥7.0 billion.
Cash Flow Summary
Fiscal years ended March 31 (Millions of yen)
2015 2016 2017 2018 2019Cash Flows from Operating Activities ¥15,474 ¥29,376 ¥14,527 ¥21,013 ¥17,375Cash Flows from Investing Activities (7,732) (12,600) (6,518) (14,442) (7,325)Cash Flows from Financing Activities (3,205) (12,822) (10,592) (3,161) (8,909)
Financial and Corporate Information
Introduction SustainabilityFoundation for Value Creation
Strategy Business Portfolio
NAGASE Group Integrated Report 201968 69NAGASE Group Integrated Report 2019
Summary of the Consolidated Balance Sheet
AssetsAs of March 31, 2019, current assets amounted to ¥365.82 billion.
This represents an increase of ¥12.5 billion compared to the end of
the prior fiscal year, mainly due to increases in accounts receivable
and inventories. Non-current assets amounted to ¥201.51 billion,
down ¥14.61 billion. This decrease was mainly due to a decrease in
investments in securities stemming from the sale of certain shares
retained and lower fair values in shares retained. As a result of these
various factors, total assets decreased ¥2.1 billion to ¥567.34 billion
as of the end of the fiscal year.
Total Assets / ROA
(Billions of yen)
Total Assets (Left scale)ROA (Right scale)
0
200
400
600
(%)
0
6
4
2
2017 2018 201920162015(Fiscal years ended March 31)
530.77569.45 567.34
512.08546.52
3.53.1
2.02.32.2
LiabilitiesLiabilities amounted to ¥254.73 billion, a ¥5.91 billion decrease com-
pared to the end of the prior fiscal year. This decrease was mainly due
to repayments of long-term loans.
Working Capital / Prepaid Cost Recovery
(Billions of yen)
Working Capital (Left scale)Prepaid Cost Recovery (Right scale)
0
50
100
200
150
(Months)
0
4
3
2
1
2017 2018 201920162015(Fiscal years ended March 31)
167.89181.64
194.20
161.45171.48
2.802.682.692.532.63
Net AssetsNet assets amounted to ¥312.6 billion, up ¥3.8 billion. While the
Company recorded a decrease of ¥8.91 billion in net unrealized hold-
ing gain on securities, profit attributable to owners of the parent
amounted to ¥20.13 billion, which more than offset this decrease.
As a result, the Company recorded a shareholders’ equity ratio of
54.2%, 0.9 percentage points higher than the end of the prior fiscal year.
Shareholders’ Equity Ratio / ROE
(%)
0
15
30
60
45
(%)
0
2
4
8
6
2017 2018 201920162015
53.5 54.7 53.351.554.2
4.43.7
5.8
4.3
6.6
(Fiscal years ended March 31)
Shareholders’ Equity Ratio (Left scale)ROE (Right scale)
Capital Investment
During the fiscal year, the NAGASE Group recorded ¥10.61 billion in
capital investment (including purchases of intangible fixed assets).
This amount included ¥2.11 billion in capital investment at the new
pullulan and enzyme wing of the Okayama No. 2 Plant of
Hayashibara Co., Ltd. (Life & Healthcare Segment). The Group
used cash on hand and funds procured from external sources for
capital investments.
Reportable Segments (Millions of yen)
Functional Materials ¥ 314
Advanced Materials & Processing 1,542
Electronics 3,201
Automotive & Energy 329
Life & Healthcare 3,206
Others 2,018
Total 10,612
Research and Development Expenses
The NAGASE Group develops new technologies and products origi-
nating from our marketing activities. We also engage in research and
development activities for the purpose of generating and sharing
technological information. These activities bring the comprehensive
power of the group to bear in creating new businesses.
The New Value Creation Office promotes innovation within the
Group and creates new value that anticipates changing trends,
including AI and IoT, with the aim of creating business cores that the
Group has not had to date. (The office is a Company-wide corporate
asset held in common for use by all the segments.) The office con-
ducts development activities geared toward solutions for materials
informatics, which is a new technical field of material development
that combines advance data processing technologies and material
science, as well as enabling server acceleration to reduce the power
consumption of systems and to meet latency demands of processing
for edge serves, which are anticipated after realizing next-generation
telecommunication standards.
The Nagase R&D Center conducts foundational technology
research and proposes research topics for the biotechnology-related
businesses operated by the NAGASE Group. At present, the Nagase
R&D Center is working to help create a global-scale bioeconomy for
society through process innovation (Unavailable Made Available) to
facilitate high-efficiency production of plant- and animal-derived rare
and useful substances, which have been traditionally difficult to syn-
thesize. The center is leveraging our own core technologies
(N-STePP®*: Technology for breeding and fermenting actinomycetes)
and other foundational technologies to accomplish this goal.
Examples include algae-derived ultraviolet absorbing substances
(mycosporine-like amino acids), proteins in human and animal blood
(ferritin), unusual antioxidative amino acids (ergothioneine) contained
in mushrooms and wheat varieties, biodyes, and other functional
substances unique to actinomycetes. The center is developing these
useful substances to be applied across a wide range of functional
foods, cosmetics, and industrial products. The center also applies for
patents and registrations of numerous foundational and peripheral
technologies. In this way, the Nagase R&D Center fulfills its mission
to develop and utilize foundational biotechnologies, inventing prod-
ucts that will lead the NAGASE Group into the future.
The Nagase Application Workshop (NAW) is home to specialized
equipment and expert staff capable of conducting raw materials
analysis, application development, and final product formulation for
plastics and coating materials. The NAW supports the NAGASE
Group trading company differentiation strategy by combining materi-
als and processing technologies from business partners and group
manufacturing companies. This combination of materials and pro-
cesses produce solutions that respond to market needs identified
through the marketing functions of the NAGASE Group network. The
NAW accurately formulates new elemental technologies and func-
tional materials, developing these technologies and materials into
solutions for our customers. Here, the workshop coordinates closely
with NAGASE divisions and Group companies to explore the poten-
tial for new businesses.
Nagase ChemteX focuses on establishing new business in the
fields of next-generation manufacturing and biomaterials within the
New Business Development Headquarters. In the next-generation
manufacturing field, the company has developed various materials
that can use additive manufacturing methods, such as UV cured res-
ins for 3D printers and low-temperature sintered-type ink for wiring
applications, and has already begun product sales. Going forward,
the company will continue expanding its product lineup and upgrad-
ing its systems aimed at full-scale commercialization. In the biomate-
rials field, the company has begun supplying samples of
low-endotoxin biocompatible polymers, for which needs have been
increasing for medical equipment applications.
Using unique siloxane synthesis technologies, Inkron Oy has
begun mass production of materials for LED applications that require
high reliability. In addition, the company is developing special optical
materials in the AR/VR field, which is expected to grow going for-
ward, using refractive index control technologies that span a wide
range from a low of 1.25 to a high of 1.8. Nagase ChemteX uses
nanoparticle dispersion technologies, mass-production technologies,
and complementary synergies with quality control systems devel-
oped over many years to contribute to customer innovations by sup-
plying leading-edge materials for next-generation optical devices on a
global scale.
Hayashibara Co., Ltd. continues research and development activi-
ties for the use of TREHA™, pullulan, and other functional saccha-
rides in everything from foods, cosmetics, and pharmaceuticals/
medicines to applications in agricultural and industrial fields. The
company is raising consumer awareness of and accelerating devel-
opment activities for mainstay products Fibryxa™ and Hayashibara
Hesperidin S for applications in Foods with Function Claims and
other uses. Hayashibara is searching for new enzyme-producing
bacteria from microorganisms, moving forward with research and
development related to products created through unique enzymes.
As the company considers patents and intellectual property strategy
for commercializing functional saccharides with the potential of
becoming mainstay products for the next generation, it also contin-
ues to study manufacturing methods for new materials. Activities
include market analysis, suggestions for effective uses, and applica-
tions development. Meanwhile, the NAGASE Group is making use of
Hayashibara’s extensive library of functional dyes, focusing on devel-
oping new applications in commercial fields, such as photo and
printing plates, as well as in the currently growing life science fields,
including pharmaceuticals and in-vitro diagnostics. The NAGASE
Group incurred a total of ¥6.4 billion in research and development
expenses for the fiscal year.
* Abbreviation of Nagase Streptomyces Technology for Protein/Precious Products, a NAGASE registered trademark in Japan.
Research and Development Expenses
(Billions of yen)
0
2
4
8
6
2017 2018 201920162015
5.166.00
6.49
5.064.90
(Fiscal years ended March 31)
Outlook for the Year Ending March 31, 2020
Improving employment and payrolls in Japan should prevent any sig-
nificant declines in personal consumption in the Japanese economy.
However, we are concerned with the impact of the consumption tax
increase and uncertainty in the industrial sector, which relies mainly
on orders from overseas. The global economy is experiencing the
impact of U.S.-China trade frictions, as well as a rise in risk factors
reflecting national fiscal policies and exchange rate fluctuations. We
intend to keep a close eye on the U.S. and China, two countries with
a major impact on macroeconomic trends. With respect to our busi-
ness environment, we recognize the rising importance in supply
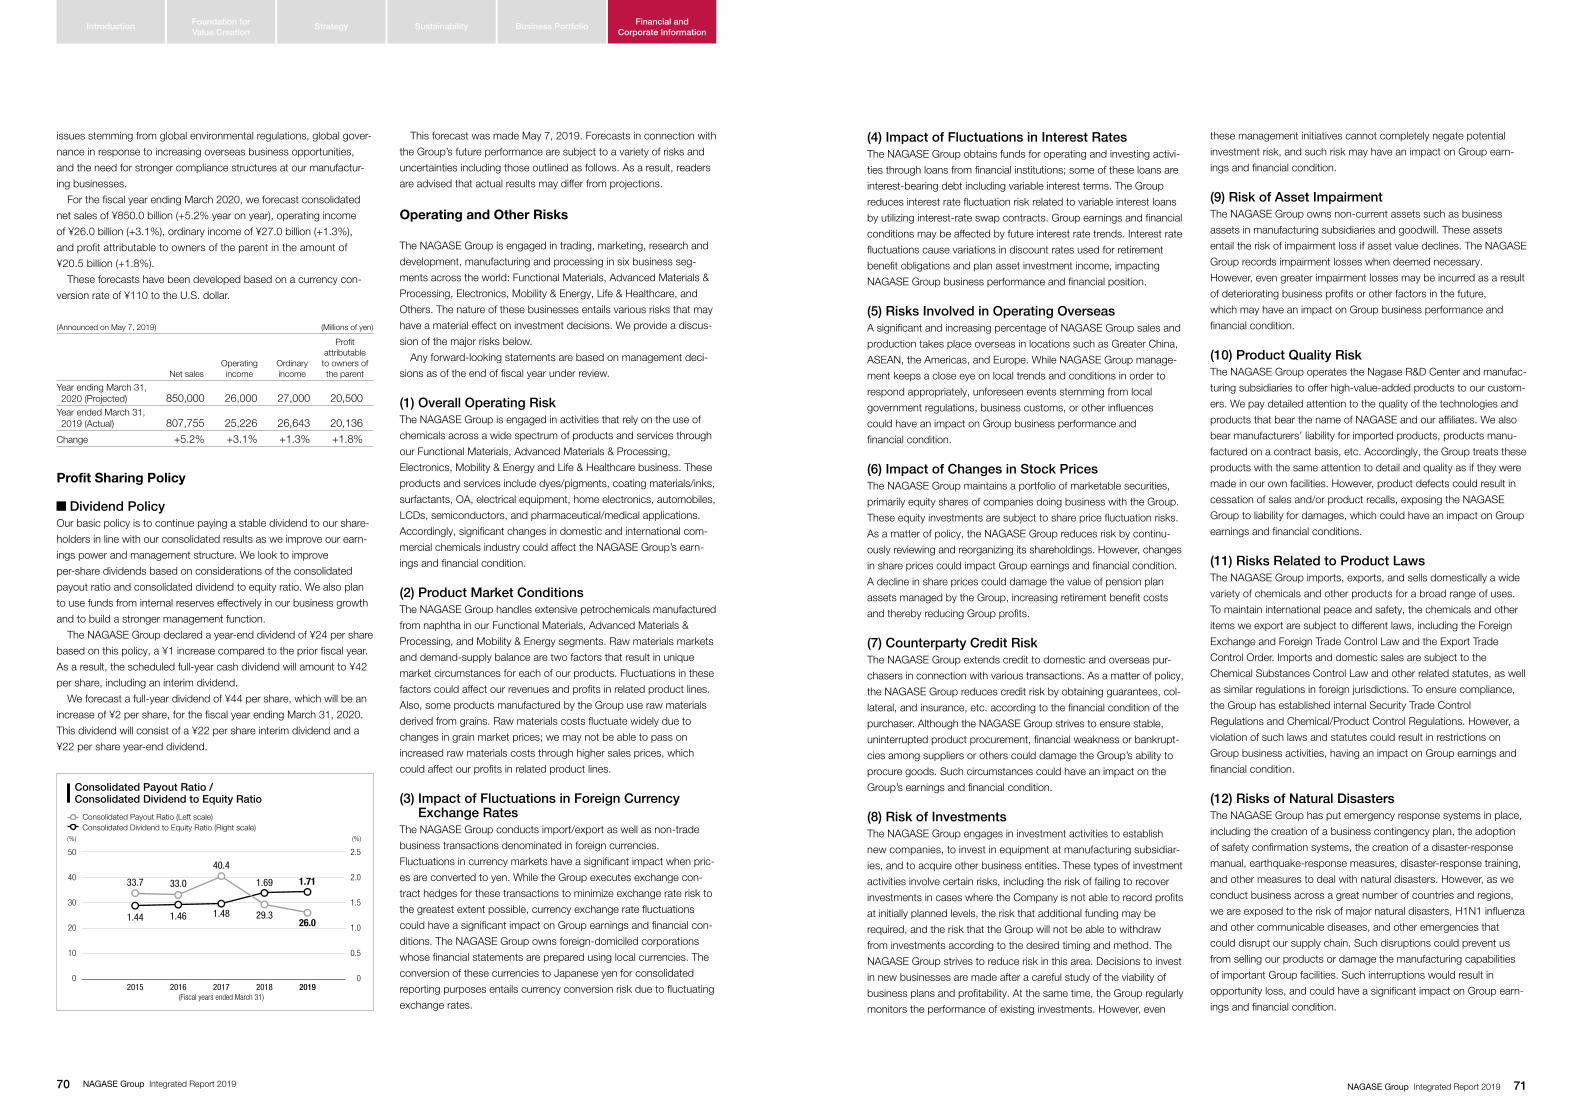
Financial and Corporate Information
Introduction SustainabilityFoundation for Value Creation
Strategy Business Portfolio
NAGASE Group Integrated Report 201970 71NAGASE Group Integrated Report 2019
issues stemming from global environmental regulations, global gover-
nance in response to increasing overseas business opportunities,
and the need for stronger compliance structures at our manufactur-
ing businesses.
For the fiscal year ending March 2020, we forecast consolidated
net sales of ¥850.0 billion (+5.2% year on year), operating income
of ¥26.0 billion (+3.1%), ordinary income of ¥27.0 billion (+1.3%),
and profit attributable to owners of the parent in the amount of
¥20.5 billion (+1.8%).
These forecasts have been developed based on a currency con-
version rate of ¥110 to the U.S. dollar.
(Announced on May 7, 2019) (Millions of yen)
Net salesOperating income
Ordinary income
Profit attributable
to owners of the parent
Year ending March 31, 2020 (Projected) 850,000 26,000 27,000 20,500Year ended March 31, 2019 (Actual) 807,755 25,226 26,643 20,136
Change +5.2% +3.1% +1.3% +1.8%
Profit Sharing Policy
Dividend PolicyOur basic policy is to continue paying a stable dividend to our share-
holders in line with our consolidated results as we improve our earn-
ings power and management structure. We look to improve
per-share dividends based on considerations of the consolidated
payout ratio and consolidated dividend to equity ratio. We also plan
to use funds from internal reserves effectively in our business growth
and to build a stronger management function.
The NAGASE Group declared a year-end dividend of ¥24 per share
based on this policy, a ¥1 increase compared to the prior fiscal year.
As a result, the scheduled full-year cash dividend will amount to ¥42
per share, including an interim dividend.
We forecast a full-year dividend of ¥44 per share, which will be an
increase of ¥2 per share, for the fiscal year ending March 31, 2020.
This dividend will consist of a ¥22 per share interim dividend and a
¥22 per share year-end dividend.
Consolidated Payout Ratio /Consolidated Dividend to Equity Ratio
(%)
0
20
10
30
50
40
(%)
0
1.0
0.5
1.5
2.5
2.0
2017 2018 201920162015
33.0
40.4
29.3
33.7
26.01.46 1.48
1.69
1.44
1.71
(Fiscal years ended March 31)
Consolidated Payout Ratio (Left scale)Consolidated Dividend to Equity Ratio (Right scale)
This forecast was made May 7, 2019. Forecasts in connection with
the Group’s future performance are subject to a variety of risks and
uncertainties including those outlined as follows. As a result, readers
are advised that actual results may differ from projections.
Operating and Other Risks
The NAGASE Group is engaged in trading, marketing, research and
development, manufacturing and processing in six business seg-
ments across the world: Functional Materials, Advanced Materials &
Processing, Electronics, Mobility & Energy, Life & Healthcare, and
Others. The nature of these businesses entails various risks that may
have a material effect on investment decisions. We provide a discus-
sion of the major risks below.
Any forward-looking statements are based on management deci-
sions as of the end of fiscal year under review.
(1) Overall Operating RiskThe NAGASE Group is engaged in activities that rely on the use of
chemicals across a wide spectrum of products and services through
our Functional Materials, Advanced Materials & Processing,
Electronics, Mobility & Energy and Life & Healthcare business. These
products and services include dyes/pigments, coating materials/inks,
surfactants, OA, electrical equipment, home electronics, automobiles,
LCDs, semiconductors, and pharmaceutical/medical applications.
Accordingly, significant changes in domestic and international com-
mercial chemicals industry could affect the NAGASE Group’s earn-
ings and financial condition.
(2) Product Market ConditionsThe NAGASE Group handles extensive petrochemicals manufactured
from naphtha in our Functional Materials, Advanced Materials &
Processing, and Mobility & Energy segments. Raw materials markets
and demand-supply balance are two factors that result in unique
market circumstances for each of our products. Fluctuations in these
factors could affect our revenues and profits in related product lines.
Also, some products manufactured by the Group use raw materials
derived from grains. Raw materials costs fluctuate widely due to
changes in grain market prices; we may not be able to pass on
increased raw materials costs through higher sales prices, which
could affect our profits in related product lines.
(3) Impact of Fluctuations in Foreign Currency Exchange Rates
The NAGASE Group conducts import/export as well as non-trade
business transactions denominated in foreign currencies.
Fluctuations in currency markets have a significant impact when pric-
es are converted to yen. While the Group executes exchange con-
tract hedges for these transactions to minimize exchange rate risk to
the greatest extent possible, currency exchange rate fluctuations
could have a significant impact on Group earnings and financial con-
ditions. The NAGASE Group owns foreign-domiciled corporations
whose financial statements are prepared using local currencies. The
conversion of these currencies to Japanese yen for consolidated
reporting purposes entails currency conversion risk due to fluctuating
exchange rates.
(4) Impact of Fluctuations in Interest RatesThe NAGASE Group obtains funds for operating and investing activi-
ties through loans from financial institutions; some of these loans are
interest-bearing debt including variable interest terms. The Group
reduces interest rate fluctuation risk related to variable interest loans
by utilizing interest-rate swap contracts. Group earnings and financial
conditions may be affected by future interest rate trends. Interest rate
fluctuations cause variations in discount rates used for retirement
benefit obligations and plan asset investment income, impacting
NAGASE Group business performance and financial position.
(5) Risks Involved in Operating OverseasA significant and increasing percentage of NAGASE Group sales and
production takes place overseas in locations such as Greater China,
ASEAN, the Americas, and Europe. While NAGASE Group manage-
ment keeps a close eye on local trends and conditions in order to
respond appropriately, unforeseen events stemming from local
government regulations, business customs, or other influences
could have an impact on Group business performance and
financial condition.
(6) Impact of Changes in Stock PricesThe NAGASE Group maintains a portfolio of marketable securities,
primarily equity shares of companies doing business with the Group.
These equity investments are subject to share price fluctuation risks.
As a matter of policy, the NAGASE Group reduces risk by continu-
ously reviewing and reorganizing its shareholdings. However, changes
in share prices could impact Group earnings and financial condition.
A decline in share prices could damage the value of pension plan
assets managed by the Group, increasing retirement benefit costs
and thereby reducing Group profits.
(7) Counterparty Credit RiskThe NAGASE Group extends credit to domestic and overseas pur-
chasers in connection with various transactions. As a matter of policy,
the NAGASE Group reduces credit risk by obtaining guarantees, col-
lateral, and insurance, etc. according to the financial condition of the
purchaser. Although the NAGASE Group strives to ensure stable,
uninterrupted product procurement, financial weakness or bankrupt-
cies among suppliers or others could damage the Group’s ability to
procure goods. Such circumstances could have an impact on the
Group’s earnings and financial condition.
(8) Risk of InvestmentsThe NAGASE Group engages in investment activities to establish
new companies, to invest in equipment at manufacturing subsidiar-
ies, and to acquire other business entities. These types of investment
activities involve certain risks, including the risk of failing to recover
investments in cases where the Company is not able to record profits
at initially planned levels, the risk that additional funding may be
required, and the risk that the Group will not be able to withdraw
from investments according to the desired timing and method. The
NAGASE Group strives to reduce risk in this area. Decisions to invest
in new businesses are made after a careful study of the viability of
business plans and profitability. At the same time, the Group regularly
monitors the performance of existing investments. However, even
these management initiatives cannot completely negate potential
investment risk, and such risk may have an impact on Group earn-
ings and financial condition.
(9) Risk of Asset ImpairmentThe NAGASE Group owns non-current assets such as business
assets in manufacturing subsidiaries and goodwill. These assets
entail the risk of impairment loss if asset value declines. The NAGASE
Group records impairment losses when deemed necessary.
However, even greater impairment losses may be incurred as a result
of deteriorating business profits or other factors in the future,
which may have an impact on Group business performance and
financial condition.
(10) Product Quality RiskThe NAGASE Group operates the Nagase R&D Center and manufac-
turing subsidiaries to offer high-value-added products to our custom-
ers. We pay detailed attention to the quality of the technologies and
products that bear the name of NAGASE and our affiliates. We also
bear manufacturers’ liability for imported products, products manu-
factured on a contract basis, etc. Accordingly, the Group treats these
products with the same attention to detail and quality as if they were
made in our own facilities. However, product defects could result in
cessation of sales and/or product recalls, exposing the NAGASE
Group to liability for damages, which could have an impact on Group
earnings and financial conditions.
(11) Risks Related to Product LawsThe NAGASE Group imports, exports, and sells domestically a wide
variety of chemicals and other products for a broad range of uses.
To maintain international peace and safety, the chemicals and other
items we export are subject to different laws, including the Foreign
Exchange and Foreign Trade Control Law and the Export Trade
Control Order. Imports and domestic sales are subject to the
Chemical Substances Control Law and other related statutes, as well
as similar regulations in foreign jurisdictions. To ensure compliance,
the Group has established internal Security Trade Control
Regulations and Chemical/Product Control Regulations. However, a
violation of such laws and statutes could result in restrictions on
Group business activities, having an impact on Group earnings and
financial condition.
(12) Risks of Natural DisastersThe NAGASE Group has put emergency response systems in place,
including the creation of a business contingency plan, the adoption
of safety confirmation systems, the creation of a disaster-response
manual, earthquake-response measures, disaster-response training,
and other measures to deal with natural disasters. However, as we
conduct business across a great number of countries and regions,
we are exposed to the risk of major natural disasters, H1N1 influenza
and other communicable diseases, and other emergencies that
could disrupt our supply chain. Such disruptions could prevent us
from selling our products or damage the manufacturing capabilities
of important Group facilities. Such interruptions would result in
opportunity loss, and could have a significant impact on Group earn-
ings and financial condition.

Financial and Corporate Information
Introduction SustainabilityFoundation for Value Creation
Strategy Business Portfolio
NAGASE Group Integrated Report 201972 73NAGASE Group Integrated Report 2019
ASSETSMillions of yen
Thousands of U.S. dollars (Note 1)
2019 2018 2019
Current assets:
Cash and time deposits (Notes 15 and 22) ¥ 44,068 ¥ 43,303 $ 397,045
Notes and accounts receivable (Note 15) 230,459 225,999 2,076,394
Inventories (Note 5) 81,003 73,671 729,823
Other current assets 10,651 10,953 95,964
Less allowance for doubtful accounts (355) (602) (3,198)
Total current assets 365,827 353,325 3,296,036
Property, plant and equipment, at cost (Note 6 and 7):
Land (Note 20) 20,456 21,154 184,305
Buildings and structures 57,846 58,016 521,182
Machinery, equipment and vehicles 82,397 82,437 742,382
Leased assets 247 530 2,225
Construction in progress 3,784 784 34,093
164,732 162,922 1,484,206
Less accumulated depreciation (98,264) (95,697) (885,341)
Property, plant and equipment, net (Note 23) 66,467 67,225 598,856
Investments and other assets:
Investments in securities (Notes 8 and 15):
Unconsolidated subsidiaries and affiliates 9,556 8,116 86,098
Other 80,706 92,287 727,147
90,263 100,403 813,253
Long-term loans receivable 243 109 2,189
Goodwill (Note 23) 23,866 25,478 215,028
Technology-based assets 10,639 12,215 95,855
Asset for retirement benefits (Note 11) 109 — 982
Deferred tax assets (Notes 3 and 12) 2,290 2,409 20,632
Other assets (Note 7) 7,732 8,389 69,664
Less allowance for doubtful accounts (92) (101) (829)
Total investments and other assets 135,051 148,904 1,216,785
Total assets (Note 23) ¥567,346 ¥569,456 $5,111,686
LIABILITIES AND NET ASSETSMillions of yen
Thousands of U.S. dollars (Note 1)
2019 2018 2019
Current liabilities:
Notes and accounts payable (Note 15) ¥117,256 ¥118,028 $1,056,456
Short-term loans (Notes 9 and 15) 34,964 31,934 315,019
Current portion of long-term loans and finance lease obligations (Notes 9, 15 and 20) 972 11,126 8,758
Commercial papers (Note 15) 12,000 5,000 108,118
Current portion of bonds (Notes 9 and 15) 10,000 — 90,098
Accrued income taxes (Note 12) 3,594 1,738 32,381
Accrued expenses 3,005 3,250 27,075
Accrued bonuses for employees 5,355 5,451 48,248
Accrued bonuses for directors and executive officers 287 274 2,586
Other current liabilities 14,429 16,191 130,003
Total current liabilities 201,866 192,996 1,818,776
Long-term liabilities:
Bonds (Notes 9 and 15) 10,000 20,000 90,098
Long-term loans and finance lease obligations (Notes 9, 15 and 20) 17,683 18,112 159,321
Deferred tax liabilities (Notes 3 and 12) 12,075 14,420 108,794
Liability for retirement benefits (Note 11) 12,461 14,518 112,271
Other long-term liabilities 650 603 5,856
Total long-term liabilities 52,870 67,655 476,349
Contingent liabilities (Note 19)
Net assets:
Shareholders’ equity (Note 13):
Common stock:
Authorized – 346,980,000 shares
Issued – 127,408,285 shares in 2019 and 2018 9,699 9,699 87,386
Capital surplus 10,647 11,158 95,928
Retained earnings (Notes 21 and 24) 247,617 232,534 2,230,985
Treasury stock, at cost (Note 14) – 3,396,352 shares in 2019 and 2,195,966 shares in 2018 (5,070) (3,114) (45,680)
Total shareholders’ equity 262,892 250,278 2,368,610
Accumulated other comprehensive income:
Net unrealized holding gain on securities (Note 8) 41,857 50,773 377,124
Deferred loss on hedges (Note 16) (7) (15) (63)
Translation adjustments 3,224 2,917 29,048
Retirement benefit liability adjustments (Note 11) (292) (317) (2,631)
Total accumulated other comprehensive income 44,781 53,358 403,469
Non-controlling interests 4,934 5,168 44,454
Total net assets 312,609 308,804 2,816,551
Total liabilities and net assets ¥567,346 ¥569,456 $5,111,686
See notes to consolidated financial statements.
Consolidated Balance SheetNAGASE & CO., LTD. and Consolidated Subsidiaries (March 31, 2019 and 2018)
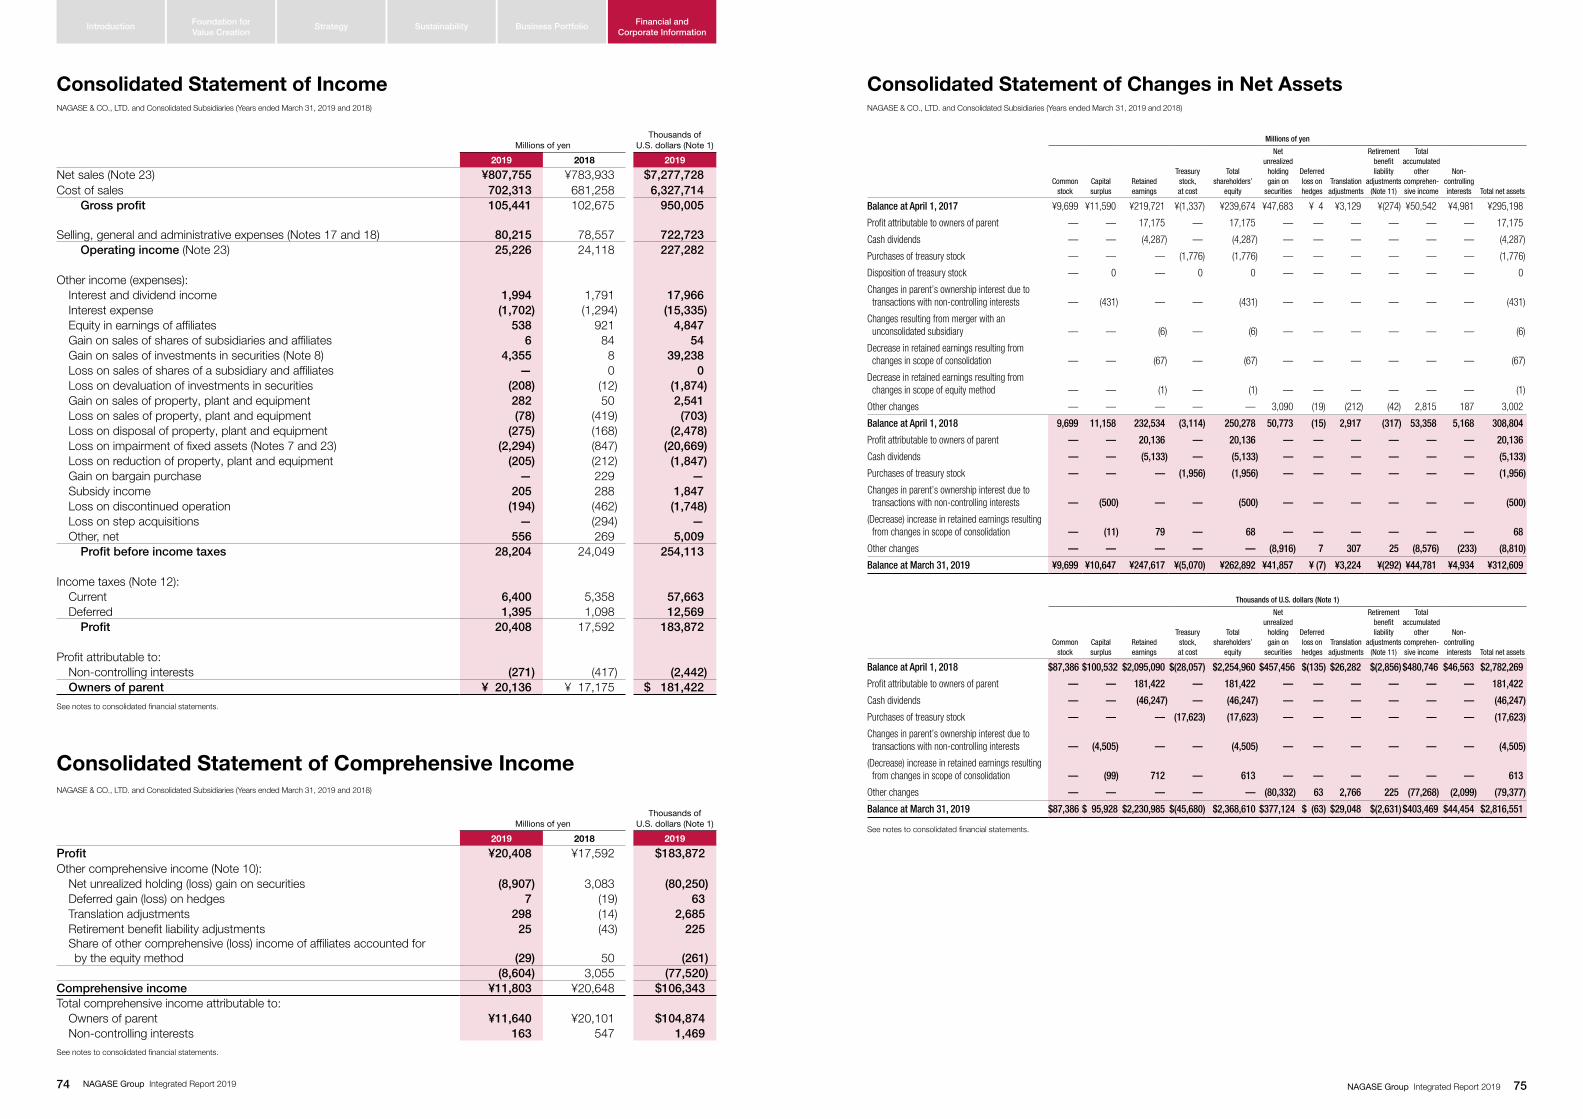
Financial and Corporate Information
Introduction SustainabilityFoundation for Value Creation
Strategy Business Portfolio
NAGASE Group Integrated Report 201974 75NAGASE Group Integrated Report 2019
Millions of yenThousands of
U.S. dollars (Note 1)
2019 2018 2019
Net sales (Note 23) ¥807,755 ¥783,933 $7,277,728Cost of sales 702,313 681,258 6,327,714 Gross profit 105,441 102,675 950,005
Selling, general and administrative expenses (Notes 17 and 18) 80,215 78,557 722,723 Operating income (Note 23) 25,226 24,118 227,282
Other income (expenses): Interest and dividend income 1,994 1,791 17,966 Interest expense (1,702) (1,294) (15,335) Equity in earnings of affiliates 538 921 4,847 Gain on sales of shares of subsidiaries and affiliates 6 84 54 Gain on sales of investments in securities (Note 8) 4,355 8 39,238 Loss on sales of shares of a subsidiary and affiliates — 0 0 Loss on devaluation of investments in securities (208) (12) (1,874) Gain on sales of property, plant and equipment 282 50 2,541 Loss on sales of property, plant and equipment (78) (419) (703) Loss on disposal of property, plant and equipment (275) (168) (2,478) Loss on impairment of fixed assets (Notes 7 and 23) (2,294) (847) (20,669) Loss on reduction of property, plant and equipment (205) (212) (1,847) Gain on bargain purchase — 229 — Subsidy income 205 288 1,847 Loss on discontinued operation (194) (462) (1,748) Loss on step acquisitions — (294) — Other, net 556 269 5,009 Profit before income taxes 28,204 24,049 254,113
Income taxes (Note 12): Current 6,400 5,358 57,663 Deferred 1,395 1,098 12,569 Profit 20,408 17,592 183,872
Profit attributable to: Non-controlling interests (271) (417) (2,442) Owners of parent ¥ 20,136 ¥ 17,175 $ 181,422
See notes to consolidated financial statements.
Millions of yenThousands of
U.S. dollars (Note 1)
2019 2018 2019
Profit ¥20,408 ¥17,592 $183,872Other comprehensive income (Note 10): Net unrealized holding (loss) gain on securities (8,907) 3,083 (80,250) Deferred gain (loss) on hedges 7 (19) 63 Translation adjustments 298 (14) 2,685 Retirement benefit liability adjustments 25 (43) 225 Share of other comprehensive (loss) income of affiliates accounted for
by the equity method (29) 50 (261)(8,604) 3,055 (77,520)
Comprehensive income ¥11,803 ¥20,648 $106,343Total comprehensive income attributable to: Owners of parent ¥11,640 ¥20,101 $104,874 Non-controlling interests 163 547 1,469See notes to consolidated financial statements.
Millions of yen
Commonstock
Capitalsurplus
Retained earnings
Treasury stock,at cost
Totalshareholders’
equity
Net unrealized
holding gain on
securities
Deferred loss on hedges
Translationadjustments
Retirement benefit liability
adjustments(Note 11)
Total accumulated
other comprehen-sive income
Non-controlling interests Total net assets
Balance at April 1, 2017 ¥9,699 ¥11,590 ¥219,721 ¥(1,337) ¥239,674 ¥47,683 ¥ 4 ¥3,129 ¥(274) ¥50,542 ¥4,981 ¥295,198
Profit attributable to owners of parent — — 17,175 — 17,175 — — — — — — 17,175
Cash dividends — — (4,287) — (4,287) — — — — — — (4,287)
Purchases of treasury stock — — — (1,776) (1,776) — — — — — — (1,776)
Disposition of treasury stock — 0 — 0 0 — — — — — — 0
Changes in parent’s ownership interest due to transactions with non-controlling interests — (431) — — (431) — — — — — — (431)
Changes resulting from merger with an unconsolidated subsidiary — — (6) — (6) — — — — — — (6)
Decrease in retained earnings resulting from changes in scope of consolidation — — (67) — (67) — — — — — — (67)
Decrease in retained earnings resulting from changes in scope of equity method — — (1) — (1) — — — — — — (1)
Other changes — — — — — 3,090 (19) (212) (42) 2,815 187 3,002
Balance at April 1, 2018 9,699 11,158 232,534 (3,114) 250,278 50,773 (15) 2,917 (317) 53,358 5,168 308,804
Profit attributable to owners of parent — — 20,136 — 20,136 — — — — — — 20,136
Cash dividends — — (5,133) — (5,133) — — — — — — (5,133)
Purchases of treasury stock — — — (1,956) (1,956) — — — — — — (1,956)
Changes in parent’s ownership interest due to transactions with non-controlling interests — (500) — — (500) — — — — — — (500)
(Decrease) increase in retained earnings resulting from changes in scope of consolidation — (11) 79 — 68 — — — — — — 68
Other changes — — — — — (8,916) 7 307 25 (8,576) (233) (8,810)
Balance at March 31, 2019 ¥9,699 ¥10,647 ¥247,617 ¥(5,070) ¥262,892 ¥41,857 ¥ (7) ¥3,224 ¥(292) ¥44,781 ¥4,934 ¥312,609
Thousands of U.S. dollars (Note 1)
Commonstock
Capitalsurplus
Retained earnings
Treasury stock,at cost
Totalshareholders’
equity
Net unrealized
holding gain on
securities
Deferred loss on hedges
Translationadjustments
Retirement benefit liability
adjustments(Note 11)
Total accumulated
other comprehen-sive income
Non-controlling interests Total net assets
Balance at April 1, 2018 $87,386 $100,532 $2,095,090 $(28,057) $2,254,960 $457,456 $(135) $26,282 $(2,856)$480,746 $46,563 $2,782,269
Profit attributable to owners of parent — — 181,422 — 181,422 — — — — — — 181,422
Cash dividends — — (46,247) — (46,247) — — — — — — (46,247)
Purchases of treasury stock — — — (17,623) (17,623) — — — — — — (17,623)
Changes in parent’s ownership interest due to transactions with non-controlling interests — (4,505) — — (4,505) — — — — — — (4,505)
(Decrease) increase in retained earnings resulting from changes in scope of consolidation — (99) 712 — 613 — — — — — — 613
Other changes — — — — — (80,332) 63 2,766 225 (77,268) (2,099) (79,377)
Balance at March 31, 2019 $87,386 $ 95,928 $2,230,985 $(45,680) $2,368,610 $377,124 $ (63) $29,048 $(2,631)$403,469 $44,454 $2,816,551
See notes to consolidated financial statements.
Consolidated Statement of Income Consolidated Statement of Changes in Net Assets
Consolidated Statement of Comprehensive Income
NAGASE & CO., LTD. and Consolidated Subsidiaries (Years ended March 31, 2019 and 2018) NAGASE & CO., LTD. and Consolidated Subsidiaries (Years ended March 31, 2019 and 2018)
NAGASE & CO., LTD. and Consolidated Subsidiaries (Years ended March 31, 2019 and 2018)

Financial and Corporate Information
Introduction SustainabilityFoundation for Value Creation
Strategy Business Portfolio
NAGASE Group Integrated Report 201976 77NAGASE Group Integrated Report 2019
Millions of yenThousands of
U.S. dollars (Note 1)
2019 2018 2019
Operating activities:Profit before income taxes ¥28,204 ¥24,049 $254,113Adjustments to reconcile profit before income taxes to net cash provided by operating activities: Depreciation and amortization other than amortization of goodwill 9,329 9,295 84,053 Amortization of goodwill 1,815 1,748 16,353 Loss on impairment of fixed assets 2,294 847 20,669 Gain on bargain purchase — (229) — Loss on step acquisitions — 294 — Subsidy income (205) (288) (1,847) Loss on reduction of property, plant and equipment 205 212 1,847 Loss on discontinued operation 194 462 1,748 Decrease in liability for retirement benefits (2,023) (210) (18,227) Interest and dividend income (1,994) (1,791) (17,966) Interest expense 1,702 1,294 15,335 Exchange loss (gain), net 295 (309) 2,658 Gain on sales of investments in securities, investments in capital, shares of subsidiaries
and affiliates, and investments in capital of subsidiaries and affiliates, net (4,359) (92) (39,274) Changes in operating assets and liabilities: Notes and accounts receivable (4,477) (17,382) (40,337) Inventories (7,157) (9,610) (64,483) Notes and accounts payable (894) 15,024 (8,055) Other, net (1,530) 1,623 (13,785) Subtotal 21,399 24,937 192,801 Interest and dividends received 2,520 2,235 22,705 Interest paid (1,670) (1,292) (15,046) Income taxes paid (4,874) (4,865) (43,914) Net cash provided by operating activities 17,375 21,013 156,546
Investing activities:Purchases of property, plant and equipment (10,253) (6,679) (92,378)Proceeds from sales of property, plant and equipment 917 1,360 8,262Purchases of intangible fixed assets included in other assets (505) (539) (4,550)Purchases of investments in securities (2,555) (1,603) (23,020)Proceeds from sales of investments in securities 5,479 105 49,365Purchases of investments in capital (96) (54) (865)Purchase of shares of subsidiaries resulting in change in scope of consolidation — (5,994) —Proceeds from sales of shares of subsidiaries resulting in change in scope of consolidation — 207 —(Increase) decrease in short-term loans receivable included in other current assets, net (807) 108 (7,271)Decrease (increase) in time deposits, net 392 (242) 3,532Subsidy income 205 288 1,847Other, net (102) (1,400) (919)Net cash used in investing activities (7,325) (14,442) (65,997)
Financing activities:Increase in short-term loans, net 2,771 3,632 24,966Increase in commercial papers, net 7,000 5,000 63,069Proceeds from long-term loans 582 8,301 5,244Repayments of long-term loans (11,175) (3,117) (100,685)Redemption of bonds — (10,000) —Purchase of treasury stock (1,956) (1,776) (17,623)Cash dividends paid (5,133) (4,287) (46,247)Cash dividends paid to non-controlling interests (398) (275) (3,586)Payments for purchases of shares of subsidiaries not resulting in change in scope of consolidation (498) (606) (4,487)Other, net (99) (30) (892)Net cash used in financing activities (8,909) (3,161) (80,268)
Effect of exchange rate changes on cash and cash equivalents 100 (175) 901Net increase in cash and cash equivalents 1,240 3,234 11,172Cash and cash equivalents at beginning of the year 42,857 39,730 386,134 Decrease in cash and cash equivalents resulting from exclusion of subsidiaries from consolidation (80) (111) (721)Increase in cash and cash equivalents resulting from merger with unconsolidated subsidiaries — 4 —Cash and cash equivalents at end of the year (Note 22) ¥44,017 ¥42,857 $396,585 See notes to consolidated financial statements.
Consolidated Statement of Cash FlowsNAGASE & CO., LTD. and Consolidated Subsidiaries (Years ended March 31, 2019 and 2018)
1. BASIS OF PREPARATIONThe accompanying consolidated financial statements of NAGASE &
CO., LTD. (the “Company”) and consolidated subsidiaries are pre-
pared on the basis of accounting principles generally accepted in
Japan, which are different in certain respects as to the application
and disclosure requirements of International Financial Reporting
Standards, and have been compiled from the consolidated financial
statements prepared by the Company as required by the Financial
Instruments and Exchange Act of Japan.
In preparing the accompanying consolidated financial statements,
certain reclassifications and rearrangements have been made to
the consolidated financial statements issued domestically in order
to present them in a format which is more familiar to readers
outside Japan.
Certain amounts in the prior year’s consolidated financial statements
have been reclassified to conform to the current year’s presentation.
Such reclassifications had no effect on consolidated profit or net assets.
The U.S. dollar amounts in the accompanying consolidated finan-
cial statements have been translated from yen amounts solely for the
convenience of the reader, as a matter of arithmetic computation
only, at ¥110.99 = U.S.$1.00, the rate of exchange prevailing on
March 31, 2019. This translation should not be construed as a repre-
sentation that the yen amounts have been, could have been, or
could in the future be, converted into U.S. dollars at the above or any
other rate.
As permitted by the Financial Instruments and Exchange Act of
Japan, amounts of less than one million yen for the years ended March
31, 2019 and 2018 have been omitted. Consequently, the totals
shown in the accompanying consolidated financial statements for the
years ended March 31, 2019 and 2018 (both in yen and in U.S. dol-
lars) do not necessarily agree with the sum of the individual amounts.
2. SUMMARY OF SIGNIFICANT ACCOUNTING POLICIES(a) Principles of Consolidation
The accompanying consolidated financial statements include the
accounts of the Company and companies that it controls directly or
indirectly. Affiliates over which the Company exercises significant
influence in terms of their operating and financial policies have been
accounted for by the equity method. All significant intercompany bal-
ances and transactions have been eliminated in consolidation.
Certain subsidiaries were excluded from the scope of consolidation
because the effect of their sales, net profit or loss, total assets and
retained earnings on the accompanying consolidated financial state-
ments was immaterial. The unconsolidated subsidiaries and affiliates
not accounted for by the entity method were excluded from the
scope of application of the equity method, because their profit or loss
and retained earnings attributable to the Company’s interest were not
material to the consolidated financial statements.
For consolidation purposes, the financial statements of the consoli-
dated subsidiaries whose fiscal year end date differs from that of the
Company have been included in consolidation based on a provisional
statement of accounts for a full fiscal year ending March 31.
Unrealized intercompany gains among the Company and the con-
solidated subsidiaries have been entirely eliminated and the portion
attributable to non-controlling interests has been charged to non-
controlling interests.
(b) Foreign Currency Translation
All monetary assets and liabilities denominated in foreign currencies
are translated into yen at the rates of exchange in effect at the balance
sheet date, except that receivables and payables hedged by qualified
foreign currency forward exchange contracts are translated at the cor-
responding contract rates. All other assets and liabilities denominated
in foreign currencies are translated at their historical rates. Gain or loss
on each translation is credited or charged to income.
Revenue and expense items arising from transactions denominat-
ed in foreign currencies are generally translated into yen at the rates
in effect at the respective transaction dates. Foreign exchange gain
or loss is credited or charged to income in the period in which such
gain or loss is recognized for financial reporting purposes.
The balance sheet accounts of the overseas consolidated subsid-
iaries are translated into yen at the rates of exchange in effect at the
balance sheet date, except that the components of net assets
excluding non-controlling interests, net unrealized holding gain on
securities, and deferred gain or loss on hedges are translated at their
historical exchange rates. Revenue and expense accounts are trans-
lated at the average rates of exchange in effect during the year.
Adjustments resulting from translating financial statements whose
accounts are denominated in foreign currencies are not included in
the determination of net income but are reported as “Translation
adjustments” as a component of accumulated other comprehensive
income or loss in the accompanying consolidated balance sheets.
(c) Cash and Cash Equivalents
Cash and cash equivalents consist of cash on hand, demand depos-
its, and short-term investments which are readily convertible to cash
and subject to an insignificant risk of any change in their value, which
were purchased with an original maturity of three months or less.
(d) Inventories
Inventories are stated at the lower of cost or net selling value, cost
being determined primarily by the moving-average method.
(e) Investments in Securities
Securities are classified into three categories: trading securities, held-
to-maturity debt securities or other securities. Trading securities, con-
sisting of debt and marketable equity securities, are stated at fair
value. Gain and loss, both realized and unrealized, are credited or
charged to income. Held-to-maturity debt securities are stated at
their amortized cost. Marketable securities classified as other securi-
ties are carried at fair value with any changes in unrealized holding
gain or loss, net of the applicable income taxes, reported as a sepa-
rate component of accumulated other comprehensive income or
loss. Non-marketable securities classified as other securities are car-
ried at cost determined by the moving-average method.
(f) Property, Plant and Equipment and Depreciation (except for
leased assets)
Property, plant and equipment are stated at cost.
Depreciation of property, plant and equipment is calculated by
the straight-line method based on the estimated useful lives of the
respective assets.
The estimated useful lives of the principal assets are as follows:
Buildings
(other than structures attached to the buildings) 15 to 50 years
Machinery and equipment 2 to 20 years
Notes to Consolidated Financial StatementsNAGASE & CO., LTD. and Consolidated Subsidiaries (March 31, 2019)

Financial and Corporate Information
Introduction SustainabilityFoundation for Value Creation
Strategy Business Portfolio
NAGASE Group Integrated Report 201978 79NAGASE Group Integrated Report 2019
(g) Intangible Assets (except for leased assets)
Technology-based assets recognized upon acquisition are amortized
on a straight-line basis over 13 to 17 years.
Costs incurred for computer software obtained for internal use are
capitalized and amortized on a straight-line basis over an estimated
useful life of 5 years.
(h) Goodwill
Goodwill is amortized over a period not exceeding 20 years on a
straight-line basis. When immaterial, goodwill is charged to income
as incurred.
(i) Leased Assets
Leased assets under finance lease contracts which do not transfer
ownership to the lessee are depreciated to a residual value of zero by
the straight-line method over the respective lease terms.
(j) Allowance for Doubtful Accounts
The Company and its consolidated subsidiaries provide allowances for
doubtful accounts based on their historical experience of bad debts
on ordinary receivables plus an additional estimate of probable specific
doubtful accounts from customers experiencing financial difficulties.
(k) Income Taxes
Income taxes are calculated based on taxable income and charged
to income on an accrual basis. Deferred tax assets and liabilities are
computed based on the temporary differences between the financial
reporting and the tax bases of the assets and liabilities that will result
in taxable or deductible amounts in the future. Computations of
deferred tax assets and liabilities are based on the tax rates which
have been enacted as of the balance sheet date. The Company and
certain domestic consolidated subsidiaries have adopted the consoli-
dated taxation system (the Company is the taxable entity), which
allows companies to make tax payments on the combined profits of
the parent company and its wholly owned domestic subsidiaries.
(l) Accrued Bonuses for Employees
Accrued bonuses for employees are provided based on the estimat-
ed amount of bonuses to be paid to employees in the following fiscal
year which is attributable to the current fiscal year.
(m) Accrued Bonuses for Directors and Executive Officers
Accrued bonuses for directors and executive officers are provided
based on the estimated amount of bonuses to be paid to directors
and executive officers in the following fiscal year which is attributable
to the current fiscal year.
(n) Liability for Retirement Benefits
Liability for retirement benefits is provided based on the amount of
the retirement benefit obligation less estimated pension plan assets
at the end of the fiscal year. The estimated benefit is attributed to
each period based on the plan’s benefit formula.
Prior service cost is charged to income in the fiscal year in which
such cost is recognized for financial reporting purposes. Actuarial
differences are principally credited or charged to income in the fiscal
year following the fiscal year in which such differences are recognized
for financial reporting purposes.
(o) Derivatives and Hedging Activities
Derivatives positions are carried at fair value with any changes in
unrealized gain or loss charged or credited to income, except for
those which meet the criteria for deferral hedge accounting under
which unrealized gain or loss is deferred as a component of net
assets. Foreign currency receivables and payables hedged by quali-
fied foreign currency forward exchange contracts are translated at
the corresponding foreign exchange contract rates (“allocation meth-
od”). Interest-rate swaps which meet certain conditions are account-
ed for as if the interest rates applied to the swaps had originally
applied to the underlying loans.
Derivative financial instruments are utilized principally in order to
manage the risk arising from adverse fluctuation in foreign currency
exchange rates and interest-rate swaps are also utilized to mitigate
the risk of fluctuation in interest rates on loans. Hedging instruments
are foreign currency forward exchange contracts, foreign currency
deposits, foreign currency loans and interest-rate swaps. Hedged
items are foreign currency receivables and payables, forecast trans-
actions and interest rates on loans from financial institutions.
The Company and its consolidated subsidiaries (collectively, the
“Group”) manage derivative transactions in accordance with internal
management rules. Under these rules, the Group conducts foreign
currency forward exchange contracts within a range of actual
demand of accounts receivable, accounts payable and actual trans-
actions in foreign currencies. Execution and management of interest-
rate swaps are based on internal management rules and hedged
items of interest-rate swaps are identified by individual contracts.
The Company and certain consolidated subsidiaries assess the
effectiveness of the hedging activities based on a comparison of the
accumulated fluctuations of the hedged items and those of the hedging
instruments in the period from the start of the hedging activities to the
assessment date. However, with regard to interest-rate swaps which
meet certain conditions, the evaluation of effectiveness is omitted.
(p) Research and Development Costs
Research and development costs are charged to income when
incurred.
(q) Distributions of Retained Earnings
Dividends and other distributions of retained earnings are approved
by the shareholders at a meeting held subsequent to the end of the
fiscal year to which such distributions are applicable. The accompa-
nying consolidated financial statements do not, however, reflect the
applicable distributions of retained earnings as approved by the
shareholders subsequent to the fiscal year end. (Refer to Note 24.)
3. CHANGES IN PRESENTATION METHODChanges in Conjunction with the Application of Partial
Amendments to Accounting Standard for Tax Effect Accounting
Effective from the beginning of the fiscal year ended March 31,
2019, the Company applied Partial Amendments to Accounting
Standard for Tax Effect Accounting (ASBJ Statement No.28,
February 16, 2018). Under this standard, the presentation method
was changed and the Company now classifies deferred tax assets
under investments and other assets, while deferred tax liabilities are
classified under long-term liabilities.
As a result, deferred tax assets under current assets on the con-
solidated balance sheet as of March 31, 2018 decreased ¥2,783 mil-
lion, while deferred tax assets under investments and other assets
increased ¥2,783 million. Deferred tax liabilities under current liabili-
ties decreased ¥44 million, while deferred tax liabilities under long-
term liabilities increased ¥44 million.
The Company offsets deferred tax assets and deferred tax liabilities
for the same taxable entity. Total assets as of March 31, 2018 have
decreased ¥1,989 million compared to the balance prior to this change.
4. ACCOUNTING STANDARDS ISSUED BUT NOT YET EFFECTIVE
Accounting Standard and Implementation Guidance for
Revenue Recognition
(a) Overview
On March 30, 2019, the ASBJ issued “Accounting Standard for
Revenue Recognition” (ASBJ Statement No.29) and “Implementation
Guidance on Accounting Standard for Revenue Recognition” (ASBJ
Guidance No.30). The International Accounting Standards Board
(hereinafter referred to as the “IASB”) and the Financial Accounting
Standards Board (hereinafter referred to as the “FASB”) in the United
States co-developed comprehensive accounting standards for reve-
nue recognition and issued “Revenue from Contracts with
Customers” (IFRS 15 by the IASB and Topic 606 by the FASB) in
May 2014. The ASBJ developed comprehensive accounting stan-
dards on revenue recognition and issued them in conjunction with
the implementation guidance based on fact that IFRS 15 is applied
from fiscal years starting on or after January 1, 2018 and Topic 606 is
applied from fiscal years starting after December 15, 2017.
As the basic policy in developing accounting standards for revenue
recognition, the ASBJ defined the accounting standard starting with
incorporating the basic principle of IFRS 15 from a standpoint of
comparability between financial statements, which is one benefit of
ensuring consistency with IFRS 15. Furthermore, the ASBJ added
alternative accounting treatment without impairing comparability
when there are matters to be considered related to accounting prac-
tices, etc. common in Japan.
(b) Scheduled date of adoption
The Company expects to adopt the accounting standard and imple-
mentation guidance from the beginning of the fiscal year ending
March 31, 2022.
(c) Impact of the adoption of accounting standard and imple-
mentation guidance
The Company is currently evaluating the effect of the adoption of the
accounting standard and the implementation guidance on its consoli-
dated financial statements.
5. INVENTORIESInventories at March 31, 2019 and 2018 are summarized as follows:
Millions of yenThousands ofU.S. dollars
2019 2018 2019
Merchandise and finished goods ¥74,471 ¥67,681 $670,970
Work in process 1,847 1,883 16,641
Raw materials and supplies 4,683 4,106 42,193
Total ¥81,003 ¥73,671 $729,823
6. REDUCTIONS IN ACQUISITION COSTS DUE TO SUBSIDIES
The amounts of subsidies received from the Japanese national government and deducted from the acquisition costs of property, plant and
equipment at March 31, 2019 and 2018 are as follows:
Millions of yenThousands ofU.S. dollars
2019 2018 2019
Land ¥ 190 ¥ — $ 1,712
Buildings and structures 528 528 4,757Machinery, equipment and vehicles 637 621 5,739
Total ¥1,356 ¥1,150 $12,217
7. LOSS ON IMPAIRMENT OF FIXED ASSETSLoss on impairment of fixed assets for the years ended March 31, 2019 and 2018 was as follows:
Millions of yenThousands ofU.S. dollars
Major use Classification Area 2019 2019
Business-use assets for manufacturing and selling of pharmaceutical products
Buildings and structures, machinery, equipment and vehiclesKinki ¥1,999 $18,011
Business-use assets for processing and selling of plastic materials
Buildings and structures, machinery, equipment and vehicles, and intangible assets included in other assets Kinki 217 1,955
Business-use assets for manufacturing and selling of rechargeable battery systems
Machinery, equipment and vehiclesTokai 22 198
Business-use assets for manufacturing of plastic resins products
Machinery, equipment and vehicles, and intangible assets included in other assets Jiangsu, China 4 36
Idle assets Land, machinery, equipment and vehicles Kinki 50 450
Total ¥2,294 $20,669
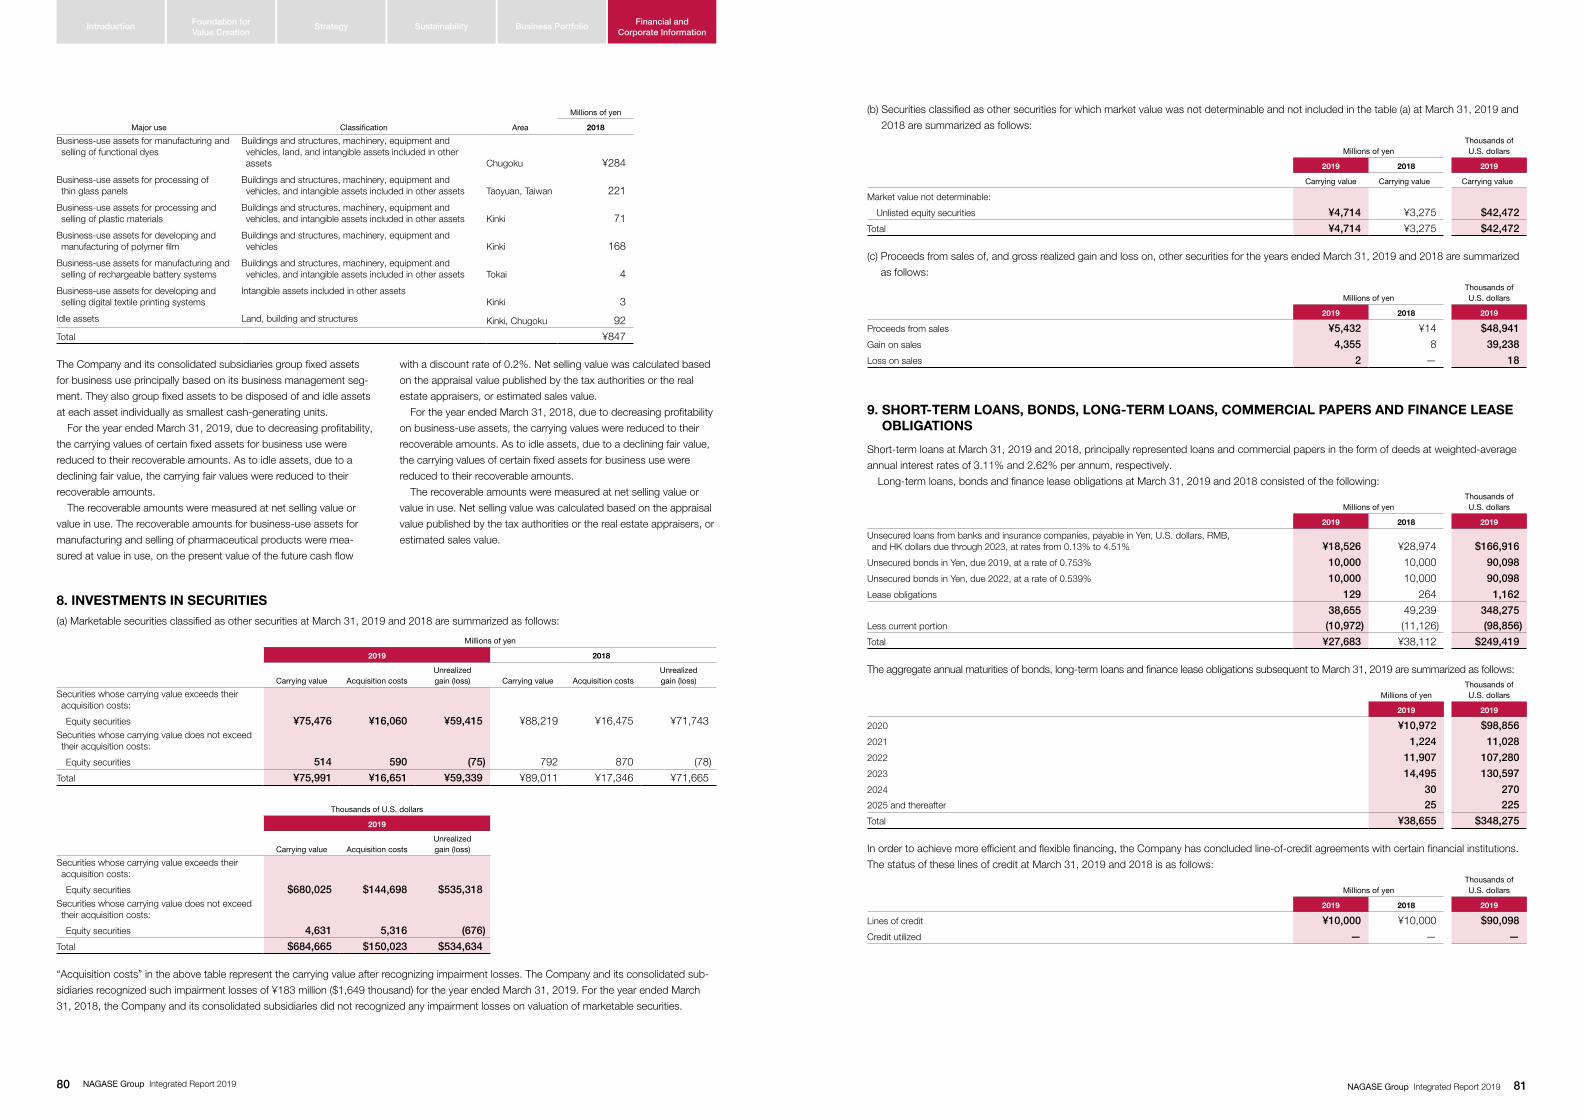
Financial and Corporate Information
Introduction SustainabilityFoundation for Value Creation
Strategy Business Portfolio
NAGASE Group Integrated Report 201980 81NAGASE Group Integrated Report 2019
Millions of yen
Major use Classification Area 2018
Business-use assets for manufacturing and selling of functional dyes
Buildings and structures, machinery, equipment and vehicles, land, and intangible assets included in other assets Chugoku ¥284
Business-use assets for processing of thin glass panels
Buildings and structures, machinery, equipment and vehicles, and intangible assets included in other assets Taoyuan, Taiwan 221
Business-use assets for processing and selling of plastic materials
Buildings and structures, machinery, equipment and vehicles, and intangible assets included in other assets Kinki 71
Business-use assets for developing and manufacturing of polymer film
Buildings and structures, machinery, equipment and vehicles Kinki 168
Business-use assets for manufacturing and selling of rechargeable battery systems
Buildings and structures, machinery, equipment and vehicles, and intangible assets included in other assets Tokai 4
Business-use assets for developing and selling digital textile printing systems
Intangible assets included in other assetsKinki 3
Idle assets Land, building and structures Kinki, Chugoku 92
Total ¥847
The Company and its consolidated subsidiaries group fixed assets
for business use principally based on its business management seg-
ment. They also group fixed assets to be disposed of and idle assets
at each asset individually as smallest cash-generating units.
For the year ended March 31, 2019, due to decreasing profitability,
the carrying values of certain fixed assets for business use were
reduced to their recoverable amounts. As to idle assets, due to a
declining fair value, the carrying fair values were reduced to their
recoverable amounts.
The recoverable amounts were measured at net selling value or
value in use. The recoverable amounts for business-use assets for
manufacturing and selling of pharmaceutical products were mea-
sured at value in use, on the present value of the future cash flow
with a discount rate of 0.2%. Net selling value was calculated based
on the appraisal value published by the tax authorities or the real
estate appraisers, or estimated sales value.
For the year ended March 31, 2018, due to decreasing profitability
on business-use assets, the carrying values were reduced to their
recoverable amounts. As to idle assets, due to a declining fair value,
the carrying values of certain fixed assets for business use were
reduced to their recoverable amounts.
The recoverable amounts were measured at net selling value or
value in use. Net selling value was calculated based on the appraisal
value published by the tax authorities or the real estate appraisers, or
estimated sales value.
8. INVESTMENTS IN SECURITIES(a) Marketable securities classified as other securities at March 31, 2019 and 2018 are summarized as follows:
Millions of yen
2019 2018
Carrying value Acquisition costsUnrealized gain (loss) Carrying value Acquisition costs
Unrealized gain (loss)
Securities whose carrying value exceeds their acquisition costs:
Equity securities ¥75,476 ¥16,060 ¥59,415 ¥88,219 ¥16,475 ¥71,743Securities whose carrying value does not exceed their acquisition costs:
Equity securities 514 590 (75) 792 870 (78)
Total ¥75,991 ¥16,651 ¥59,339 ¥89,011 ¥17,346 ¥71,665
Thousands of U.S. dollars
2019
Carrying value Acquisition costsUnrealized gain (loss)
Securities whose carrying value exceeds their acquisition costs:
Equity securities $680,025 $144,698 $535,318Securities whose carrying value does not exceed their acquisition costs:
Equity securities 4,631 5,316 (676)
Total $684,665 $150,023 $534,634
“Acquisition costs” in the above table represent the carrying value after recognizing impairment losses. The Company and its consolidated sub-
sidiaries recognized such impairment losses of ¥183 million ($1,649 thousand) for the year ended March 31, 2019. For the year ended March
31, 2018, the Company and its consolidated subsidiaries did not recognized any impairment losses on valuation of marketable securities.
(b) Securities classified as other securities for which market value was not determinable and not included in the table (a) at March 31, 2019 and
2018 are summarized as follows:
Millions of yenThousands ofU.S. dollars
2019 2018 2019
Carrying value Carrying value Carrying value
Market value not determinable:
Unlisted equity securities ¥4,714 ¥3,275 $42,472
Total ¥4,714 ¥3,275 $42,472
(c) Proceeds from sales of, and gross realized gain and loss on, other securities for the years ended March 31, 2019 and 2018 are summarized
as follows:
Millions of yenThousands ofU.S. dollars
2019 2018 2019
Proceeds from sales ¥5,432 ¥14 $48,941
Gain on sales 4,355 8 39,238
Loss on sales 2 — 18
9. SHORT-TERM LOANS, BONDS, LONG-TERM LOANS, COMMERCIAL PAPERS AND FINANCE LEASE OBLIGATIONS
Short-term loans at March 31, 2019 and 2018, principally represented loans and commercial papers in the form of deeds at weighted-average
annual interest rates of 3.11% and 2.62% per annum, respectively.
Long-term loans, bonds and finance lease obligations at March 31, 2019 and 2018 consisted of the following:
Millions of yenThousands ofU.S. dollars
2019 2018 2019
Unsecured loans from banks and insurance companies, payable in Yen, U.S. dollars, RMB, and HK dollars due through 2023, at rates from 0.13% to 4.51% ¥18,526 ¥28,974 $166,916
Unsecured bonds in Yen, due 2019, at a rate of 0.753% 10,000 10,000 90,098
Unsecured bonds in Yen, due 2022, at a rate of 0.539% 10,000 10,000 90,098
Lease obligations 129 264 1,162
38,655 49,239 348,275Less current portion (10,972) (11,126) (98,856)
Total ¥27,683 ¥38,112 $249,419
The aggregate annual maturities of bonds, long-term loans and finance lease obligations subsequent to March 31, 2019 are summarized as follows:
Millions of yenThousands ofU.S. dollars
2019 2019
2020 ¥10,972 $98,856
2021 1,224 11,028
2022 11,907 107,280
2023 14,495 130,597
2024 30 2702025 and thereafter 25 225
Total ¥38,655 $348,275
In order to achieve more efficient and flexible financing, the Company has concluded line-of-credit agreements with certain financial institutions.
The status of these lines of credit at March 31, 2019 and 2018 is as follows:
Millions of yenThousands ofU.S. dollars
2019 2018 2019
Lines of credit ¥10,000 ¥10,000 $90,098
Credit utilized — — —
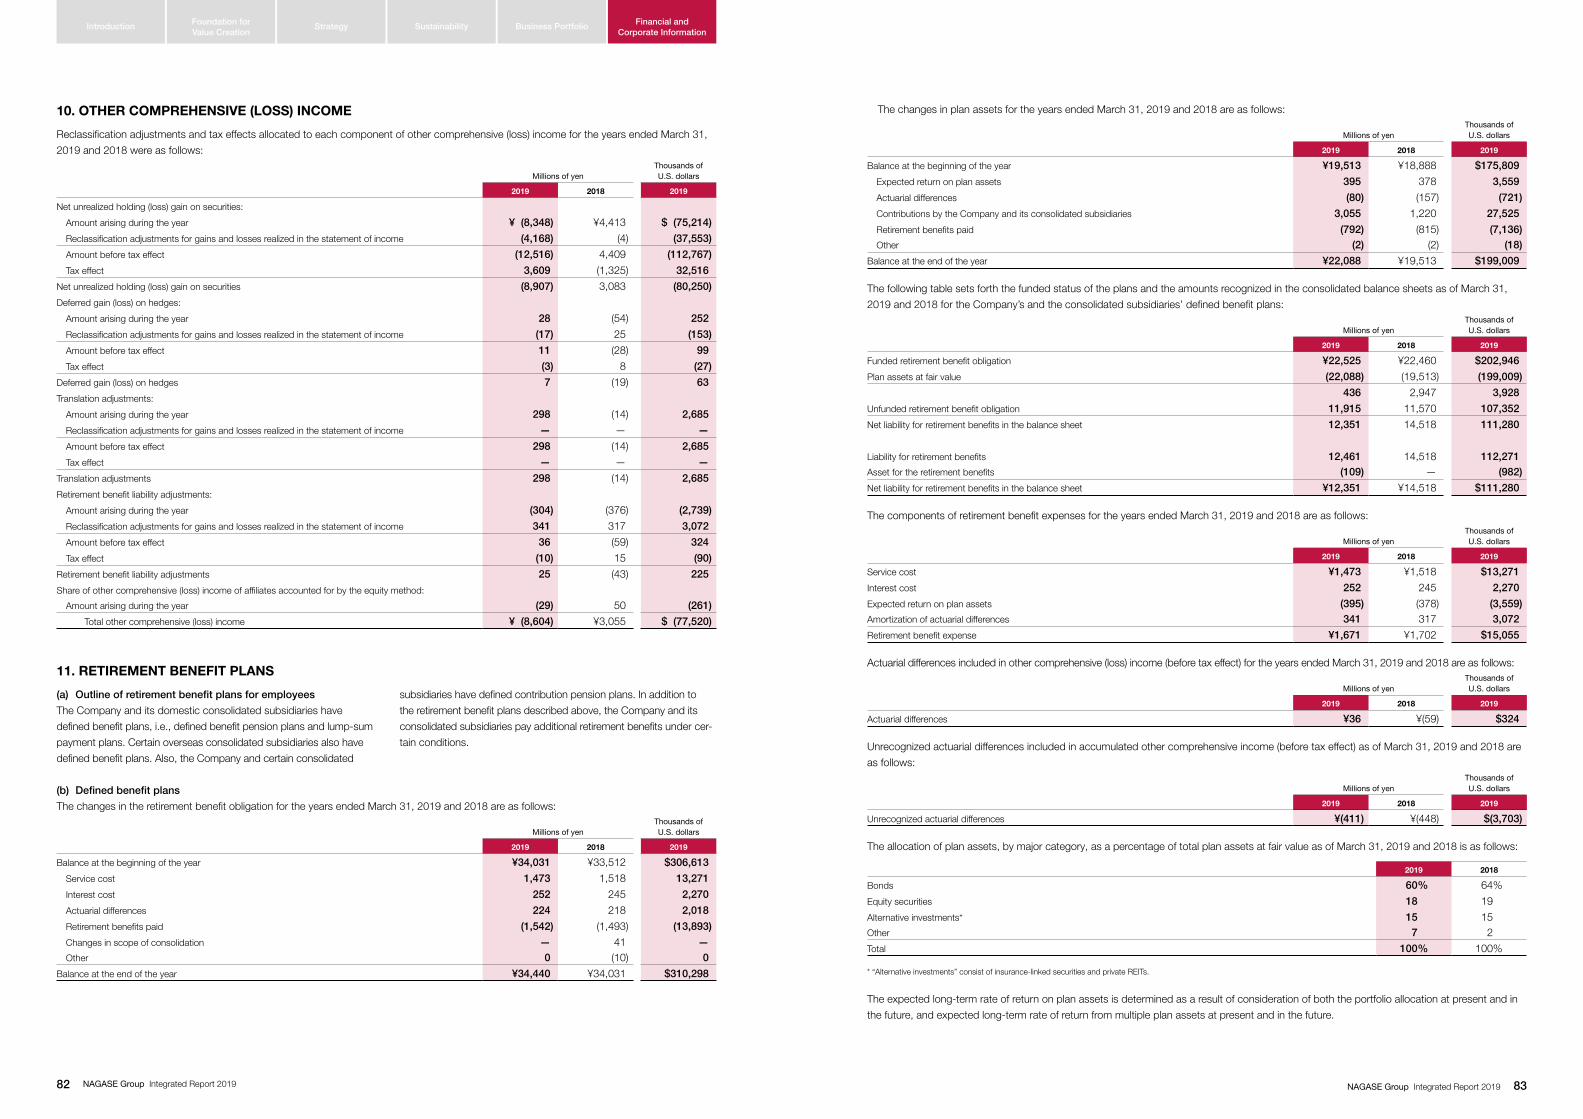
Financial and Corporate Information
Introduction SustainabilityFoundation for Value Creation
Strategy Business Portfolio
NAGASE Group Integrated Report 201982 83NAGASE Group Integrated Report 2019
10. OTHER COMPREHENSIVE (LOSS) INCOME
Reclassification adjustments and tax effects allocated to each component of other comprehensive (loss) income for the years ended March 31,
2019 and 2018 were as follows:
Millions of yenThousands ofU.S. dollars
2019 2018 2019
Net unrealized holding (loss) gain on securities:
Amount arising during the year ¥ (8,348) ¥4,413 $ (75,214)
Reclassification adjustments for gains and losses realized in the statement of income (4,168) (4) (37,553)
Amount before tax effect (12,516) 4,409 (112,767)
Tax effect 3,609 (1,325) 32,516
Net unrealized holding (loss) gain on securities (8,907) 3,083 (80,250)
Deferred gain (loss) on hedges:
Amount arising during the year 28 (54) 252
Reclassification adjustments for gains and losses realized in the statement of income (17) 25 (153)
Amount before tax effect 11 (28) 99
Tax effect (3) 8 (27)
Deferred gain (loss) on hedges 7 (19) 63
Translation adjustments:
Amount arising during the year 298 (14) 2,685
Reclassification adjustments for gains and losses realized in the statement of income — — —
Amount before tax effect 298 (14) 2,685
Tax effect — — —
Translation adjustments 298 (14) 2,685
Retirement benefit liability adjustments:
Amount arising during the year (304) (376) (2,739)
Reclassification adjustments for gains and losses realized in the statement of income 341 317 3,072
Amount before tax effect 36 (59) 324
Tax effect (10) 15 (90)
Retirement benefit liability adjustments 25 (43) 225
Share of other comprehensive (loss) income of affiliates accounted for by the equity method:
Amount arising during the year (29) 50 (261)
Total other comprehensive (loss) income ¥ (8,604) ¥3,055 $ (77,520)
11. RETIREMENT BENEFIT PLANS
(a) Outline of retirement benefit plans for employees
The Company and its domestic consolidated subsidiaries have
defined benefit plans, i.e., defined benefit pension plans and lump-sum
payment plans. Certain overseas consolidated subsidiaries also have
defined benefit plans. Also, the Company and certain consolidated
subsidiaries have defined contribution pension plans. In addition to
the retirement benefit plans described above, the Company and its
consolidated subsidiaries pay additional retirement benefits under cer-
tain conditions.
(b) Defined benefit plans
The changes in the retirement benefit obligation for the years ended March 31, 2019 and 2018 are as follows:
Millions of yenThousands ofU.S. dollars
2019 2018 2019
Balance at the beginning of the year ¥34,031 ¥33,512 $306,613
Service cost 1,473 1,518 13,271
Interest cost 252 245 2,270
Actuarial differences 224 218 2,018
Retirement benefits paid (1,542) (1,493) (13,893)
Changes in scope of consolidation — 41 — Other 0 (10) 0
Balance at the end of the year ¥34,440 ¥34,031 $310,298
The changes in plan assets for the years ended March 31, 2019 and 2018 are as follows:
Millions of yenThousands ofU.S. dollars
2019 2018 2019
Balance at the beginning of the year ¥19,513 ¥18,888 $175,809
Expected return on plan assets 395 378 3,559
Actuarial differences (80) (157) (721)
Contributions by the Company and its consolidated subsidiaries 3,055 1,220 27,525
Retirement benefits paid (792) (815) (7,136) Other (2) (2) (18)
Balance at the end of the year ¥22,088 ¥19,513 $199,009
The following table sets forth the funded status of the plans and the amounts recognized in the consolidated balance sheets as of March 31,
2019 and 2018 for the Company’s and the consolidated subsidiaries’ defined benefit plans:
Millions of yenThousands ofU.S. dollars
2019 2018 2019
Funded retirement benefit obligation ¥22,525 ¥22,460 $202,946
Plan assets at fair value (22,088) (19,513) (199,009)
436 2,947 3,928
Unfunded retirement benefit obligation 11,915 11,570 107,352
Net liability for retirement benefits in the balance sheet 12,351 14,518 111,280
Liability for retirement benefits 12,461 14,518 112,271Asset for the retirement benefits (109) — (982)
Net liability for retirement benefits in the balance sheet ¥12,351 ¥14,518 $111,280
The components of retirement benefit expenses for the years ended March 31, 2019 and 2018 are as follows:
Millions of yenThousands ofU.S. dollars
2019 2018 2019
Service cost ¥1,473 ¥1,518 $13,271
Interest cost 252 245 2,270
Expected return on plan assets (395) (378) (3,559)Amortization of actuarial differences 341 317 3,072
Retirement benefit expense ¥1,671 ¥1,702 $15,055
Actuarial differences included in other comprehensive (loss) income (before tax effect) for the years ended March 31, 2019 and 2018 are as follows:
Millions of yenThousands ofU.S. dollars
2019 2018 2019
Actuarial differences ¥36 ¥(59) $324
Unrecognized actuarial differences included in accumulated other comprehensive income (before tax effect) as of March 31, 2019 and 2018 are
as follows:
Millions of yenThousands ofU.S. dollars
2019 2018 2019
Unrecognized actuarial differences ¥(411) ¥(448) $(3,703)
The allocation of plan assets, by major category, as a percentage of total plan assets at fair value as of March 31, 2019 and 2018 is as follows:
2019 2018
Bonds 60% 64%
Equity securities 18 19
Alternative investments* 15 15Other 7 2
Total 100% 100%
* “Alternative investments” consist of insurance-linked securities and private REITs.
The expected long-term rate of return on plan assets is determined as a result of consideration of both the portfolio allocation at present and in
the future, and expected long-term rate of return from multiple plan assets at present and in the future.

Financial and Corporate Information
Introduction SustainabilityFoundation for Value Creation
Strategy Business Portfolio
NAGASE Group Integrated Report 201984 85NAGASE Group Integrated Report 2019
The assumptions used in accounting for the above plans were as follows:
2019 2018
Discount rate 0.8% 0.8%Expected long-term rate of return on plan assets 2.0 2.0
(c) Defined contribution plans
Millions of yenThousands ofU.S. dollars
2019 2018 2019
Contributions to defined contribution plans by the Company and its consolidated subsidiaries ¥282 ¥283 $2,541
12. INCOME TAXES
Income taxes applicable to the Company and its domestic consolidated subsidiaries consist of corporation, inhabitants’ and enterprise taxes, which,
in the aggregate, resulted in statutory tax rates of approximately 30.6% and 30.9% for the years ended March 31, 2019 and 2018, respectively.
The effective tax rates reflected in the accompanying consolidated statements of income for the years ended March 31, 2019 and 2018 differ
from the statutory tax rates for the following reasons:
2019 2018
Statutory tax rates 30.6% 30.9%
Adjustments for:
Expenses not deductible for income tax purposes 2.0 3.1
Dividends and other income deductible for income tax purposes (9.3) (9.2)
Net adjustment resulting from elimination of dividend income upon consolidation 8.9 8.3
Different tax rates applied at overseas subsidiaries (3.1) (3.8)
Tax credit (1.8) (1.6)
Amortization of goodwill 2.0 2.2
Valuation allowance (1.8) (5.0)
Other, net 0.2 1.9Effective tax rates 27.6% 26.8%
The significant components of the Company’s and its consolidated subsidiaries’ deferred tax assets and liabilities at March 31, 2019 and 2018
are summarized as follows:
Millions of yenThousands ofU.S. dollars
2019 2018 2019
Deferred tax assets:
Accrued bonuses for employees ¥ 1,448 ¥ 1,436 $ 13,046
Allowance for doubtful accounts 88 152 793
Unrealized gain on inventories 477 465 4,298
Accrued enterprise taxes 283 184 2,550
Tax loss carryforwards 3,187 3,832 28,714
Liability for retirement benefits 3,630 4,306 32,706
Investments in securities 973 1,007 8,767
Loss on impairment of fixed assets 1,653 1,107 14,893
Tax goodwill 4,214 6,321 37,967
Other 2,519 2,530 22,696
Gross deferred tax assets 18,477 21,345 166,474
Valuation allowance (4,265) (5,190) (38,427)
Total deferred tax assets ¥14,211 ¥16,154 $128,039
Deferred tax liabilities:
Technology-based assets ¥(3,240) ¥(3,720) $(29,192)
Deferred capital gain on property (1,233) (1,240) (11,109)
Reserve for special depreciation (251) (302) (2,261)
Undistributed earnings of subsidiaries and affiliates (655) (643) (5,901)
Revaluation of land (290) (290) (2,613)
Net unrealized holding gain on securities (17,651) (21,347) (159,032)
Other (673) (620) (6,064) Total deferred tax liabilities (23,996) (28,165) (216,200)
Net deferred tax liabilities ¥ (9,785) ¥(12,011) $ (88,161)
13. SHAREHOLDERS’ EQUITY
The Corporation Law of Japan (the “Law”) provides that an amount
equal to 10% of the amount to be disbursed as distributions of capi-
tal surplus (other than the capital reserve) and retained earnings
(other than the legal reserve) be transferred to the capital reserve and
the legal reserve, respectively, until the sum of the capital reserve and
the legal reserve equals 25% of the capital stock account.
Such distributions can be made at any time by resolution of the
shareholders, or by the Board of Directors if certain conditions are met.
The Company’s capital reserve included in capital surplus at March
31, 2019 amounted to ¥9,634 million ($86,801 thousand). In addi-
tion, the Company’s legal reserve included in retained earnings at
March 31, 2019 amounted to ¥2,424 million ($21,840 thousand).
Under the Law, upon the issuance and sale of new shares of com-
mon stock, the entire amount of the proceeds is required to be
accounted for as common stock, although a company may, by reso-
lution of the Board of Directors, account for an amount not exceed-
ing 50% of the proceeds of the sale of new shares as additional
paid-in capital.
Movements in common stock during the years ended March 31, 2019 and 2018 are summarized as follows:
Number of shares
2019
April 1, 2018 Increase Decrease March 31, 2019
Common stock 127,408,285 — — 127,408,285
2018
April 1, 2017 Increase Decrease March 31, 2018
Common stock 127,408,285 — — 127,408,285
14. TREASURY STOCK
Movements in treasury stock during the years ended March 31, 2019 and 2018 are summarized as follows:
Number of shares
2019
April 1, 2018 Increase Decrease March 31, 2019
Treasury stock 2,195,966 1,200,386 — 3,396,352
2018
April 1, 2017 Increase Decrease March 31, 2018
Treasury stock 1,287,366 908,602 2 2,195,966
The increase in treasury stock consists of 1,200,000 shares resulting
from the purchases of treasury stock by resolution of the Board of
Directors and 386 shares resulting from the purchase of shares less
than one voting unit for the year ended March 31, 2019.
The increase in treasury stock consists of 900,000 shares resulting
from the purchase of treasury stock by resolution of the Board of
Directors, 7,549 shares resulting from the purchases from untrace-
able shareholders, and 1,053 shares resulting from the purchase of
shares less than one voting unit for the year ended March 31, 2018.
The decrease in treasury stock consists of 2 shares resulting from the
disposition of shares less than one voting unit for the year ended
March 31, 2018.
15. FINANCIAL INSTRUMENTS(a) Policy for financial instruments
The Group invests excess funds in highly secure and short-term finan-
cial assets, whose principal is guaranteed to be recoverable. With
regard to financing policy, short-term working funds are raised by bank
borrowings or issuance of commercial papers and long-term funds are
raised by bank borrowings and the issuance of bonds. The policy for
derivative transactions is that those are utilized to mitigate the fluctua-
tion risk related to foreign currency exchange rates arising from the
receivables and payables denominated in foreign currencies, and fluc-
tuation risk related to interest rates with respect to loans payable, and
derivative transactions are not carried out for speculative purposes.
(b) Types of financial instruments, related risk and risk manage-
ment for financial instruments
Receivables such as trade notes and accounts receivable are
exposed to customers’ credit risks. With regard to this risk, the
Group manages the settlement date by each customer, and estab-
lishes credit limits by each customer based on the Group’s internal
credit rating policy and monitors outstanding balances. The Group
establishes system under which the credit status by each customer
is reviewed at least once a year and the sales limit amount updated
as necessary.
In the cases of notes and accounts receivable or payable denomi-
nated in foreign currencies, foreign currency forward exchange con-
tracts are used to hedge the risk of fluctuation. However, for foreign
currency transactions denominated in the same currency involving
either payables or receivables, foreign currency forward exchange
contracts are used solely for the netted position.
Investments in securities are subject to market price fluctuation
risk. However, these are mainly equity securities of other companies
with which the Group has business relationships. The Group regularly
monitors both their fair value and the financial condition of the issuer.
The Group also reviews as needed the condition of its holdings with
concern to the status of business and financial transactions.
Short-term loans are raised primarily in connection with business
activities. Long-term loans and bonds are taken out principally for the
purpose of making capital spending, investments and financing.
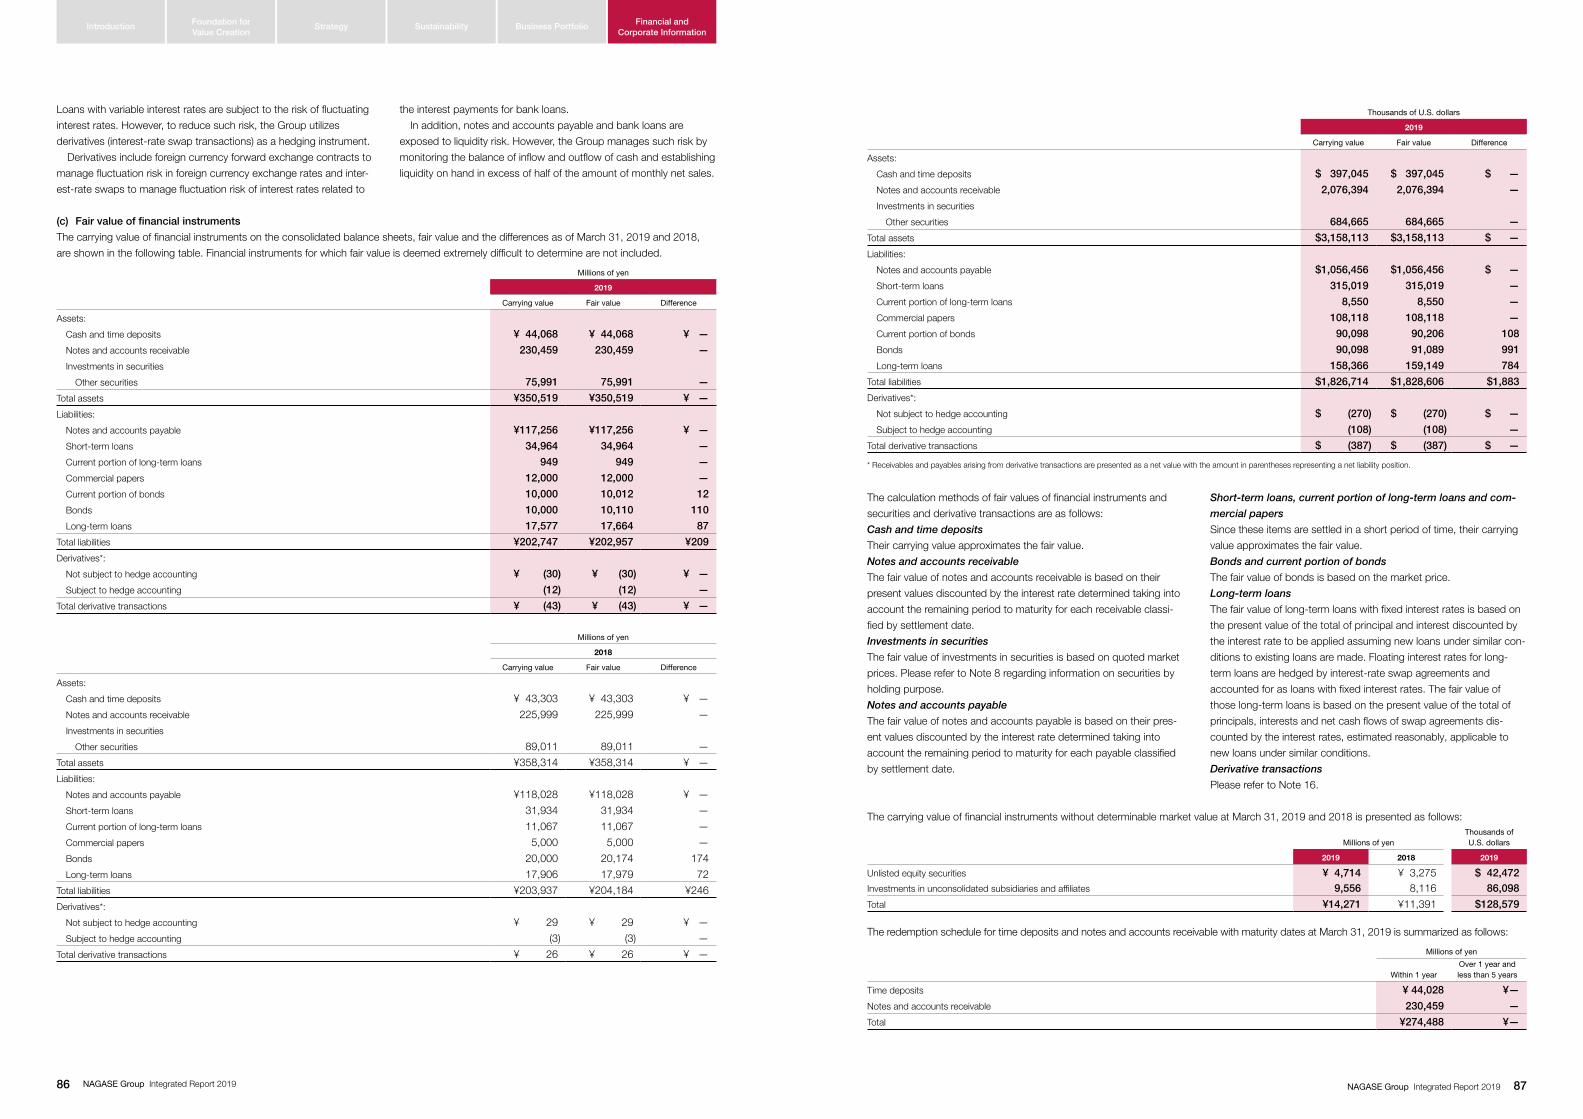
Financial and Corporate Information
Introduction SustainabilityFoundation for Value Creation
Strategy Business Portfolio
NAGASE Group Integrated Report 201986 87NAGASE Group Integrated Report 2019
Loans with variable interest rates are subject to the risk of fluctuating
interest rates. However, to reduce such risk, the Group utilizes
derivatives (interest-rate swap transactions) as a hedging instrument.
Derivatives include foreign currency forward exchange contracts to
manage fluctuation risk in foreign currency exchange rates and inter-
est-rate swaps to manage fluctuation risk of interest rates related to
the interest payments for bank loans.
In addition, notes and accounts payable and bank loans are
exposed to liquidity risk. However, the Group manages such risk by
monitoring the balance of inflow and outflow of cash and establishing
liquidity on hand in excess of half of the amount of monthly net sales.
(c) Fair value of financial instruments
The carrying value of financial instruments on the consolidated balance sheets, fair value and the differences as of March 31, 2019 and 2018,
are shown in the following table. Financial instruments for which fair value is deemed extremely difficult to determine are not included.
Millions of yen
2019
Carrying value Fair value Difference
Assets:
Cash and time deposits ¥ 44,068 ¥ 44,068 ¥ —
Notes and accounts receivable 230,459 230,459 —
Investments in securities
Other securities 75,991 75,991 —
Total assets ¥350,519 ¥350,519 ¥ —
Liabilities:
Notes and accounts payable ¥117,256 ¥117,256 ¥ —
Short-term loans 34,964 34,964 —
Current portion of long-term loans 949 949 —
Commercial papers 12,000 12,000 —
Current portion of bonds 10,000 10,012 12
Bonds 10,000 10,110 110
Long-term loans 17,577 17,664 87
Total liabilities ¥202,747 ¥202,957 ¥209
Derivatives*:
Not subject to hedge accounting ¥ (30) ¥ (30) ¥ —
Subject to hedge accounting (12) (12) —
Total derivative transactions ¥ (43) ¥ (43) ¥ —
Millions of yen
2018
Carrying value Fair value Difference
Assets:
Cash and time deposits ¥ 43,303 ¥ 43,303 ¥ —
Notes and accounts receivable 225,999 225,999 —
Investments in securities
Other securities 89,011 89,011 —
Total assets ¥358,314 ¥358,314 ¥ —
Liabilities:
Notes and accounts payable ¥118,028 ¥118,028 ¥ —
Short-term loans 31,934 31,934 —
Current portion of long-term loans 11,067 11,067 —
Commercial papers 5,000 5,000 —
Bonds 20,000 20,174 174
Long-term loans 17,906 17,979 72
Total liabilities ¥203,937 ¥204,184 ¥246
Derivatives*:
Not subject to hedge accounting ¥ 29 ¥ 29 ¥ —
Subject to hedge accounting (3) (3) —
Total derivative transactions ¥ 26 ¥ 26 ¥ —
Thousands of U.S. dollars
2019
Carrying value Fair value Difference
Assets:
Cash and time deposits $ 397,045 $ 397,045 $ —
Notes and accounts receivable 2,076,394 2,076,394 —
Investments in securities
Other securities 684,665 684,665 —
Total assets $3,158,113 $3,158,113 $ —
Liabilities:
Notes and accounts payable $1,056,456 $1,056,456 $ —
Short-term loans 315,019 315,019 —
Current portion of long-term loans 8,550 8,550 —
Commercial papers 108,118 108,118 —
Current portion of bonds 90,098 90,206 108
Bonds 90,098 91,089 991
Long-term loans 158,366 159,149 784
Total liabilities $1,826,714 $1,828,606 $1,883
Derivatives*:
Not subject to hedge accounting $ (270) $ (270) $ —
Subject to hedge accounting (108) (108) —
Total derivative transactions $ (387) $ (387) $ —
* Receivables and payables arising from derivative transactions are presented as a net value with the amount in parentheses representing a net liability position.
The calculation methods of fair values of financial instruments and
securities and derivative transactions are as follows:
Cash and time deposits
Their carrying value approximates the fair value.
Notes and accounts receivable
The fair value of notes and accounts receivable is based on their
present values discounted by the interest rate determined taking into
account the remaining period to maturity for each receivable classi-
fied by settlement date.
Investments in securities
The fair value of investments in securities is based on quoted market
prices. Please refer to Note 8 regarding information on securities by
holding purpose.
Notes and accounts payable
The fair value of notes and accounts payable is based on their pres-
ent values discounted by the interest rate determined taking into
account the remaining period to maturity for each payable classified
by settlement date.
Short-term loans, current portion of long-term loans and com-
mercial papers
Since these items are settled in a short period of time, their carrying
value approximates the fair value.
Bonds and current portion of bonds
The fair value of bonds is based on the market price.
Long-term loans
The fair value of long-term loans with fixed interest rates is based on
the present value of the total of principal and interest discounted by
the interest rate to be applied assuming new loans under similar con-
ditions to existing loans are made. Floating interest rates for long-
term loans are hedged by interest-rate swap agreements and
accounted for as loans with fixed interest rates. The fair value of
those long-term loans is based on the present value of the total of
principals, interests and net cash flows of swap agreements dis-
counted by the interest rates, estimated reasonably, applicable to
new loans under similar conditions.
Derivative transactions
Please refer to Note 16.
The carrying value of financial instruments without determinable market value at March 31, 2019 and 2018 is presented as follows:
Millions of yenThousands ofU.S. dollars
2019 2018 2019
Unlisted equity securities ¥ 4,714 ¥ 3,275 $ 42,472Investments in unconsolidated subsidiaries and affiliates 9,556 8,116 86,098
Total ¥14,271 ¥11,391 $128,579
The redemption schedule for time deposits and notes and accounts receivable with maturity dates at March 31, 2019 is summarized as follows:
Millions of yen
Within 1 yearOver 1 year and less than 5 years
Time deposits ¥ 44,028 ¥—
Notes and accounts receivable 230,459 —
Total ¥274,488 ¥—

Financial and Corporate Information
Introduction SustainabilityFoundation for Value Creation
Strategy Business Portfolio
NAGASE Group Integrated Report 201988 89NAGASE Group Integrated Report 2019
Thousands of U.S. dollars
Within 1 yearOver 1 year and less than 5 years
Time deposits $ 396,684 $—
Notes and accounts receivable 2,076,394 —
Total $2,473,088 $—
With respect to the redemption schedule of bonds, long-term loans and finance lease obligations, please refer to Note 9.
16. DERIVATIVES AND HEDGING ACTIVITIESThe currency-related derivatives positions outstanding for which hedge accounting has not been applied at March 31, 2019 and 2018 are as follows:
Millions of yen
2019
Classification Transaction
Contract value (notional principal
amount)
Contract value (notional principal
amount over one year) Fair value
Valuation gain (loss)
Over-the-counter transactions
Foreign currency forward exchange contracts:
Selling:
U.S. dollars ¥4,802 ¥— ¥(21) ¥(21)
Yen 1,851 — (15) (15)
Euro 775 — 12 12
RMB 957 — (18) (18)
Others 130 — (2) (2)
Buying:
U.S. dollars 1,591 — 2 2
Yen 1,009 — 8 8
Euro 96 — 1 1
Others 129 — 2 2
Total ¥11,342 ¥— ¥30 ¥30
Millions of yen
2018
Classification Transaction
Contract value (notional principal
amount)
Contract value (notional principal
amount over one year) Fair value
Valuation gain (loss)
Over-the-counter transactions
Foreign currency forward exchange contracts:
Selling:
U.S. dollars ¥4,707 ¥— ¥46 ¥46
Yen 2,062 — (3) (3)
Euro 845 — 12 12
RMB 740 — (6) (6)
Others 105 — (0) (0)
Buying:
U.S. dollars 2,019 — (18) (18)
Yen 966 — 1 1
Euro 86 — (0) (0)
Others 93 — (0) (0)
Total ¥11,627 ¥— ¥29 ¥29
Thousands of U.S. dollars
2019
Classification Transaction
Contract value (notional principal
amount)
Contract value (notional principal
amount over one year) Fair value
Valuation gain (loss)
Over-the-counter transactions
Foreign currency forward exchange contracts:
Selling:
U.S. dollars $ 43,265 $— $(189) $(189)
Yen 16,677 — (135) (135)
Euro 6,983 — 108 108
RMB 8,622 — (162) (162)
Others 1,171 — (18) (18)
Buying:
U.S. dollars 14,335 — 18 18
Yen 9,091 — 72 72
Euro 865 — 9 9
Others 1,162 — 18 18
Total $102,189 $— $(270) $(270)
The fair value of foreign currency forward exchange contracts is mainly computed using the prices provided by counterparty financial institutions.
The currency-related derivatives positions outstanding for which hedge accounting has been applied at March 31, 2019 and 2018 are as follows:
Millions of yen
2019
Method for hedge accounting Transaction Major hedged item
Contract value (notional principal
amount)
Contract value (notional principal
amount over one year) Fair value
Deferral hedge accounting
Foreign currency forward exchange contracts:
Selling:
U.S. dollars
Accounts receivable
¥ 16 ¥— ¥ (0)
Euro 191 — 3
RMB 759 — (14)
Others 17 — (0)
Buying:
U.S. dollars
Accounts payable
200 — 0
Euro 72 — (1)
RMB 56 10 (0)
Others 9 — 0
Allocation method for foreign currency forward exchange contracts (Note 2(o))
Foreign currency forward exchange contracts:
Selling:
Accounts receivable Euro 56 — (*)
Others 4 — (*)
Buying:
Euro
Accounts payable
85 — (*)
THB 47 — (*)
Others 23 — (*)
Total ¥1,540 ¥10 ¥(12)

Financial and Corporate Information
Introduction SustainabilityFoundation for Value Creation
Strategy Business Portfolio
NAGASE Group Integrated Report 201990 91NAGASE Group Integrated Report 2019
Millions of yen
2018
Method for hedge accounting Transaction Major hedged item
Contract value (notional principal
amount)
Contract value (notional principal
amount over one year) Fair value
Deferral hedge accounting
Foreign currency forward exchange contracts:
Selling:
U.S. dollars
Accounts receivable
¥ 1 ¥— ¥(0)
Euro 360 — 5
RMB 657 — (5)
Others 26 — 0
Buying:
U.S. dollars
Accounts payable
30 — (0)
Euro 160 — (1)
RMB 37 22 (0)
Others 7 — (0)
Allocation method for foreign currency forward exchange contracts (Note 2(o))
Foreign currency forward exchange contracts:
Selling:
Euro Accounts receivable 2 — (*)
Buying:
Euro
Accounts payable
63 — (*)
THB 30 — (*)
Others 0 — (*)
Total ¥1,379 ¥22 ¥(3)
Thousands of U.S. dollars
2019
Method for hedge accounting Transaction Major hedged item
Contract value (notional principal
amount)
Contract value (notional principal
amount over one year) Fair value
Deferral hedge accounting
Foreign currency forward exchange contracts:
Selling:
U.S. dollars
Accounts receivable
$ 144 $— $ (0)
Euro 1,721 — 27
RMB 6,838 — (126)
Others 153 — (2)
Buying:
U.S. dollars
Accounts payable
1,802 — 5
Euro 649 — (9)
RMB 505 90 (0)
Others 81 — 0
Allocation method for foreign currency forward exchange contracts (Note 2(p))
Foreign currency forward exchange contracts:
Selling:
Euro Accounts receivable 505 — (*)
Buying:
Euro
Accounts payable
766 — (*)
THB 423 — (*)
Others 207 — (*)
Total $13,875 $90 $(108)
The fair value of foreign currency forward exchange contracts is mainly computed using the prices provided by counterparty financial institutions.(*): The fair value of foreign currency forward exchange contracts that qualify for the allocation method is included in the fair value of the underlying accounts receivable and payable.
The interest-related derivatives positions outstanding for which hedge accounting has been applied at March 31, 2019 and 2018 are as follows.
Millions of yen
2019
Method for hedge accounting Transaction Hedged item
Contract value (notional principal
amount)
Contract value (notional principal
amount over one year) Fair value
Swap rates applied to underlying long-term loans
Interest-rate swap transactions (pay-fixed, receive-variable) Long-term loans ¥8,000 ¥8,000 (**)
Millions of yen
2018
Method for hedge accounting Transaction Hedged item
Contract value (notional principal
amount)
Contract value (notional principal
amount over one year) Fair value
Swap rates applied to underlying long-term loans
Interest-rate swap transactions (pay-fixed, receive-variable) Long-term loans ¥18,000 ¥8,000 (**)
Thousands of U.S. dollars
2019
Method for hedge accounting Transaction Hedged item
Contract value (notional principal
amount)
Contract value (notional principal
amount over one year) Fair value
Swap rates applied to underlying long-term loans
Interest-rate swap transactions (pay-fixed, receive-variable) Long-term loans $72,079 $72,079 (**)
(**): Since interest-rate swap agreements are accounted for as if the interest rates applied to the swaps had originally applied to the underlying long-term loans, their fair values were included in the fair value of the long-term loans.
17. RESEARCH AND DEVELOPMENT COSTSResearch and development costs included in selling, general and administrative expenses for the years ended March 31, 2019 and 2018 totaled
¥6,493 million ($58,501 thousand) and ¥6,009 million, respectively.
18. OPERATING LEASESFuture minimum lease payments subsequent to March 31, 2019 under noncancelable operating leases are as follows:
Millions of yenThousands ofU.S. dollars
Year ending March 31, 2019 2019
2020 ¥543 $4,8922025 and thereafter 510 4,595
Total ¥1,054 $9,496
19. CONTINGENT LIABILITIES
At March 31, 2019, the Company and its consolidated subsidiaries
were contingently liable as guarantors of loans of customers and
other in the aggregate amount of ¥490 million ($4,415 thousand),
and as guarantors of loans of employees in the amount of ¥0 million
($0 thousand).
In addition, at March 31, 2019, the Company and its consolidated
subsidiaries had contingent liabilities arising from notes discounted
with banks and notes endorsed in the amount of ¥142 million
($1,279 thousand).
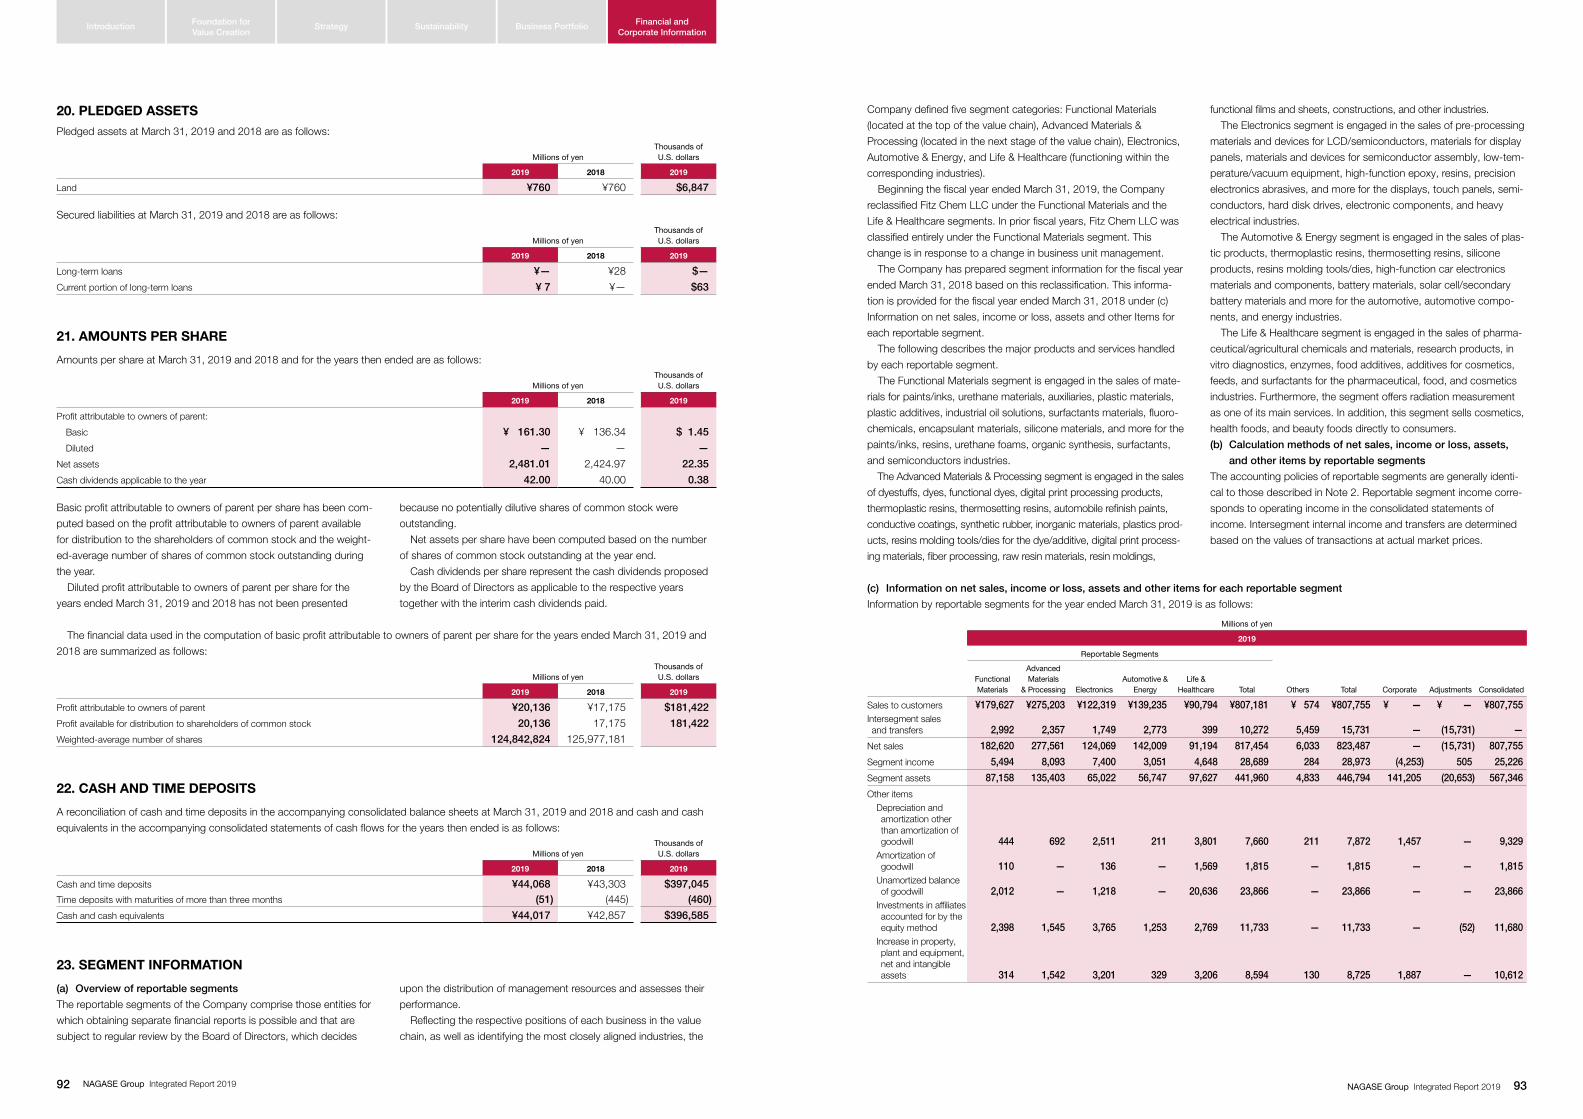
Financial and Corporate Information
Introduction SustainabilityFoundation for Value Creation
Strategy Business Portfolio
NAGASE Group Integrated Report 201992 93NAGASE Group Integrated Report 2019
Company defined five segment categories: Functional Materials
(located at the top of the value chain), Advanced Materials &
Processing (located in the next stage of the value chain), Electronics,
Automotive & Energy, and Life & Healthcare (functioning within the
corresponding industries).
Beginning the fiscal year ended March 31, 2019, the Company
reclassified Fitz Chem LLC under the Functional Materials and the
Life & Healthcare segments. In prior fiscal years, Fitz Chem LLC was
classified entirely under the Functional Materials segment. This
change is in response to a change in business unit management.
The Company has prepared segment information for the fiscal year
ended March 31, 2018 based on this reclassification. This informa-
tion is provided for the fiscal year ended March 31, 2018 under (c)
Information on net sales, income or loss, assets and other Items for
each reportable segment.
The following describes the major products and services handled
by each reportable segment.
The Functional Materials segment is engaged in the sales of mate-
rials for paints/inks, urethane materials, auxiliaries, plastic materials,
plastic additives, industrial oil solutions, surfactants materials, fluoro-
chemicals, encapsulant materials, silicone materials, and more for the
paints/inks, resins, urethane foams, organic synthesis, surfactants,
and semiconductors industries.
The Advanced Materials & Processing segment is engaged in the sales
of dyestuffs, dyes, functional dyes, digital print processing products,
thermoplastic resins, thermosetting resins, automobile refinish paints,
conductive coatings, synthetic rubber, inorganic materials, plastics prod-
ucts, resins molding tools/dies for the dye/additive, digital print process-
ing materials, fiber processing, raw resin materials, resin moldings,
functional films and sheets, constructions, and other industries.
The Electronics segment is engaged in the sales of pre-processing
materials and devices for LCD/semiconductors, materials for display
panels, materials and devices for semiconductor assembly, low-tem-
perature/vacuum equipment, high-function epoxy, resins, precision
electronics abrasives, and more for the displays, touch panels, semi-
conductors, hard disk drives, electronic components, and heavy
electrical industries.
The Automotive & Energy segment is engaged in the sales of plas-
tic products, thermoplastic resins, thermosetting resins, silicone
products, resins molding tools/dies, high-function car electronics
materials and components, battery materials, solar cell/secondary
battery materials and more for the automotive, automotive compo-
nents, and energy industries.
The Life & Healthcare segment is engaged in the sales of pharma-
ceutical/agricultural chemicals and materials, research products, in
vitro diagnostics, enzymes, food additives, additives for cosmetics,
feeds, and surfactants for the pharmaceutical, food, and cosmetics
industries. Furthermore, the segment offers radiation measurement
as one of its main services. In addition, this segment sells cosmetics,
health foods, and beauty foods directly to consumers.
(b) Calculation methods of net sales, income or loss, assets,
and other items by reportable segments
The accounting policies of reportable segments are generally identi-
cal to those described in Note 2. Reportable segment income corre-
sponds to operating income in the consolidated statements of
income. Intersegment internal income and transfers are determined
based on the values of transactions at actual market prices.
(c) Information on net sales, income or loss, assets and other items for each reportable segment
Information by reportable segments for the year ended March 31, 2019 is as follows:
Millions of yen
2019
Reportable Segments
Functional Materials
Advanced Materials
& Processing ElectronicsAutomotive &
EnergyLife &
Healthcare Total Others Total Corporate Adjustments Consolidated
Sales to customers ¥179,627 ¥275,203 ¥122,319 ¥139,235 ¥90,794 ¥807,181 ¥ 574 ¥807,755 ¥ — ¥ — ¥807,755Intersegment sales and transfers 2,992 2,357 1,749 2,773 399 10,272 5,459 15,731 — (15,731) —
Net sales 182,620 277,561 124,069 142,009 91,194 817,454 6,033 823,487 — (15,731) 807,755
Segment income 5,494 8,093 7,400 3,051 4,648 28,689 284 28,973 (4,253) 505 25,226
Segment assets 87,158 135,403 65,022 56,747 97,627 441,960 4,833 446,794 141,205 (20,653) 567,346
Other items Depreciation and
amortization other than amortization of goodwill 444 692 2,511 211 3,801 7,660 211 7,872 1,457 — 9,329
Amortization of goodwill 110 — 136 — 1,569 1,815 — 1,815 — — 1,815
Unamortized balance of goodwill 2,012 — 1,218 — 20,636 23,866 — 23,866 — — 23,866
Investments in affiliates accounted for by the equity method 2,398 1,545 3,765 1,253 2,769 11,733 — 11,733 — (52) 11,680
Increase in property, plant and equipment, net and intangible assets 314 1,542 3,201 329 3,206 8,594 130 8,725 1,887 — 10,612
20. PLEDGED ASSETSPledged assets at March 31, 2019 and 2018 are as follows:
Millions of yenThousands ofU.S. dollars
2019 2018 2019
Land ¥760 ¥760 $6,847
Secured liabilities at March 31, 2019 and 2018 are as follows:
Millions of yenThousands ofU.S. dollars
2019 2018 2019
Long-term loans ¥— ¥28 $—
Current portion of long-term loans ¥ 7 ¥— $63
21. AMOUNTS PER SHARE
Amounts per share at March 31, 2019 and 2018 and for the years then ended are as follows:
Millions of yenThousands ofU.S. dollars
2019 2018 2019
Profit attributable to owners of parent:
Basic ¥ 161.30 ¥ 136.34 $ 1.45
Diluted — — —
Net assets 2,481.01 2,424.97 22.35
Cash dividends applicable to the year 42.00 40.00 0.38
Basic profit attributable to owners of parent per share has been com-
puted based on the profit attributable to owners of parent available
for distribution to the shareholders of common stock and the weight-
ed-average number of shares of common stock outstanding during
the year.
Diluted profit attributable to owners of parent per share for the
years ended March 31, 2019 and 2018 has not been presented
because no potentially dilutive shares of common stock were
outstanding.
Net assets per share have been computed based on the number
of shares of common stock outstanding at the year end.
Cash dividends per share represent the cash dividends proposed
by the Board of Directors as applicable to the respective years
together with the interim cash dividends paid.
The financial data used in the computation of basic profit attributable to owners of parent per share for the years ended March 31, 2019 and
2018 are summarized as follows:
Millions of yenThousands ofU.S. dollars
2019 2018 2019
Profit attributable to owners of parent ¥20,136 ¥17,175 $181,422
Profit available for distribution to shareholders of common stock 20,136 17,175 181,422
Weighted-average number of shares 124,842,824 125,977,181
22. CASH AND TIME DEPOSITS
A reconciliation of cash and time deposits in the accompanying consolidated balance sheets at March 31, 2019 and 2018 and cash and cash
equivalents in the accompanying consolidated statements of cash flows for the years then ended is as follows:
Millions of yenThousands ofU.S. dollars
2019 2018 2019
Cash and time deposits ¥44,068 ¥43,303 $397,045Time deposits with maturities of more than three months (51) (445) (460)
Cash and cash equivalents ¥44,017 ¥42,857 $396,585
23. SEGMENT INFORMATION
(a) Overview of reportable segments
The reportable segments of the Company comprise those entities for
which obtaining separate financial reports is possible and that are
subject to regular review by the Board of Directors, which decides
upon the distribution of management resources and assesses their
performance.
Reflecting the respective positions of each business in the value
chain, as well as identifying the most closely aligned industries, the

Financial and Corporate Information
Introduction SustainabilityFoundation for Value Creation
Strategy Business Portfolio
NAGASE Group Integrated Report 201994 95NAGASE Group Integrated Report 2019
(d) Geographical information
Net sales by country or region for the years ended March 31, 2019 and 2018 are summarized as follows:
Millions of yenThousands ofU.S. dollars
2019 2018 2019
Japan ¥412,617 ¥395,428 $3,717,605
Greater China 205,408 207,437 1,850,689
ASEAN 118,113 110,380 1,064,177
Americas 39,451 36,564 355,446
Europe 15,272 14,178 137,598
Other 16,892 19,943 152,194
Total ¥807,755 ¥783,933 $7,277,728
Notes: 1. Net sales are categorized by country or region based on the locations of customers.
2. Country or region is determined by geographical proximity.
3. Major countries in each region
(1) Greater China China, Hong Kong, and Taiwan
(2) ASEAN Thailand, and Singapore
(3) Americas U.S.A., and Mexico
(4) Europe Germany
(5) Other Korea
Property, plant and equipment by country or region as of March 31, 2019 and 2018 are summarized as follows:
Millions of yenThousands ofU.S. dollars
2019 2018 2019
Japan ¥60,344 ¥61,686 $543,689
Other 6,123 5,539 55,167
Total ¥66,467 ¥67,225 $598,856
(e) Information on loss on impairment of fixed assets per reportable segments
Loss on impairment of fixed assets for the years ended March 31, 2019 and 2018 is as follows:
Millions of yen
2019
Reportable Segments
Functional Materials
Advanced Materials
& Processing ElectronicsAutomotive &
EnergyLife &
Healthcare Total OthersEliminations or
corporate Total
Loss on impairment of fixed assets ¥— ¥221 ¥— ¥58 ¥1,999 ¥2,279 ¥— ¥15 ¥2,294
Millions of yen
2018
Reportable Segments
Functional Materials
Advanced Materials
& Processing ElectronicsAutomotive &
EnergyLife &
Healthcare Total OthersEliminations or
corporate Total
Loss on impairment of fixed assets ¥— ¥528 ¥221 ¥4 ¥— ¥754 ¥— ¥92 ¥847
Thousands of U.S. dollars
2019
Reportable Segments
Functional Materials
Advanced Materials
& Processing ElectronicsAutomotive &
EnergyLife &
Healthcare Total OthersEliminations or
corporate Total
Loss on impairment of fixed assets $— $1,991 $— $523 $18,011 $20,533 $— $135 $20,669
Millions of yen
2018
Reportable Segments
Functional Materials
Advanced Materials
& Processing ElectronicsAutomotive &
EnergyLife &
Healthcare Total Others Total Corporate Adjustments Consolidated
Sales to customers ¥174,922 ¥262,831 ¥129,324 ¥129,708 ¥86,517 ¥783,303 ¥ 629 ¥783,933 ¥ — ¥ — ¥783,933Intersegment sales and transfers 2,543 2,234 2,108 2,817 508 10,213 4,783 14,997 — (14,997) —
Net sales 177,466 265,065 131,433 132,526 87,026 793,517 5,413 798,931 — (14,997) 783,933
Segment income 5,185 6,700 8,917 2,415 4,201 27,420 207 27,628 (3,954) 445 24,118
Segment assets 86,176 134,977 70,149 51,109 99,396 441,809 5,304 447,113 151,605 (29,262) 569,456
Other items Depreciation and
amortization other than amortization of goodwill 456 645 2,454 249 3,552 7,359 218 7,577 1,717 — 9,295
Amortization of goodwill 82 — 112 — 1,552 1,748 — 1,748 — — 1,748
Unamortized balance of goodwill 2,031 — 1,296 — 22,150 25,478 — 25,478 — — 25,478
Investments in affiliates accounted for by the equity method 2,478 1,482 2,751 1,231 2,601 10,545 — 10,545 — (2) 10,542
Increase in property, plant and equipment, net and intangible assets 243 2,817 1,834 191 2,369 7,458 68 7,527 1,896 — 9,423
Thousands of U.S. dollars
2019
Reportable Segments
Functional Materials
Advanced Materials
& Processing ElectronicsAutomotive &
EnergyLife &
Healthcare Total Others Total Corporate Adjustments Consolidated
Sales to customers $1,618,407 $2,479,530 $1,102,072 $1,254,482 $818,038 $7,272,556 $ 5,172 $7,277,728 $ — $ — $7,277,728Intersegment sales and transfers 26,957 21,236 15,758 24,984 3,595 92,549 49,185 141,733 — (141,733) —
Net sales 1,645,373 2,500,775 1,117,839 1,279,476 821,642 7,365,114 54,356 7,419,470 — (141,733) 7,277,728
Segment income 49,500 72,916 66,673 27,489 41,878 258,483 2,559 261,042 (38,319) 4,550 227,282
Segment assets 785,278 1,219,957 585,837 511,280 879,602 3,981,980 43,544 4,025,534 1,272,232 (186,080) 5,111,686
Other items Depreciation and
amortization other than amortization of goodwill 4,000 6,235 22,624 1,901 34,246 69,015 1,901 70,925 13,127 — 84,053
Amortization of goodwill 991 — 1,225 — 14,136 16,353 — 16,353 — — 16,353
Unamortized balance of goodwill 18,128 — 10,974 — 185,927 215,028 — 215,028 — — 215,028
Investments in affiliates accounted for by the equity method 21,606 13,920 33,922 11,289 24,948 105,712 — 105,712 — (469) 105,235
Increase in property, plant and equipment, net and intangible assets 2,829 13,893 28,840 2,964 28,885 77,430 1,171 78,611 17,002 — 95,612

Financial and Corporate Information
Introduction SustainabilityFoundation for Value Creation
Strategy Business Portfolio
NAGASE Group Integrated Report 201996 97NAGASE Group Integrated Report 2019
24. SUBSEQUENT EVENTS
The following distribution of retained earnings of the Company, which has not been reflected in the accompanying consolidated financial state-
ments for the year ended March 31, 2019, was approved at a meeting of the shareholders held on June 21, 2019:
Millions of yenThousands ofU.S. dollars
Cash dividends (¥24.0 = U.S.$0.22 per share) ¥2,976 $26,813
Business combination through acquisition
At the Board of Directors meeting held on June 3, 2019, the
Company resolved to acquire a majority of shares of Prinova Group,
LLC through the Company’s wholly owned subsidiary Nagase
Holdings America Corporation (established on April 1, 2019), making
Prinova Group, LLC and its subsidiaries consolidated subsidiaries,
and entered into a share transfer agreement.
(a) Outline of business combination
(1) Name and business description of the acquiree
Name: Prinova Group, LLC
Business description: Sales of food ingredients, processing and
contract manufacturing
(2) Main reason for the business combination
Prinova, one of the leading distributors of food ingredients and
a provider of integrated solutions for global food, beverage and
wellness brands, will serve as a strategic base for further
expanding NAGASE’s food business in the United States and
Europe. Going forward, NAGASE expects to expand its market
presence by providing further added value to consumers in
North America, Europe and Asia, through synergies created by
combining Prinova’s vertically integrated capabilities of ingredi-
ents procurement, processing and contract manufacturing, and
the strong R&D expertise of NAGASE’s Group company
Hayashibara, which specializes in manufacturing functional
food products.
This transaction marks a key milestone for NAGASE in realiz-
ing its mid-term management strategy (ACE-2020) as it focuses
on reforming its profit structure, representing a major step
towards significantly expanding sales and market presence in
North America and globally in the lifestyle and healthcare space.
Prinova will continue to be led by the current management
maintaining its facilities, brands and practices, reporting to the
board of NAGASE to work towards further maximizing syner-
gies within the Group.
(3) Date of the business combination
July 2019 (as planned)
(4) Legal form of the business combination
Acquisition of equity interests for a cash consideration
(5) Ratio of equity interests acquired
93.6%
(6) Basis for determination for the acquirer
NHAC, a subsidiary of the Company, is regarded as the acquir-
ing company since NHAC acquires the equity interests of
Prinova for a cash consideration.
(b) Acquisition cost of the acquired company and related detailsMillions of
U.S. dollars
2019
Consideration for acquisition $621
Acquisition cost $621
Note: Acquisition cost is based on the enterprise value of Prinova. In addition the actual acquisition cost will be finalized after adjusting variances related to net debt with interest, non-controlling interest, and others. The ratio of equity to be acquired will be adjusted accordingly based on the adjusted acquisition cost.
Independent Auditor’s Report

Financial and Corporate Information
Introduction SustainabilityFoundation for Value Creation
Strategy Business Portfolio
NAGASE Group Integrated Report 201998 99NAGASE Group Integrated Report 2019
Consolidated Subsidiaries, Affiliates and Offices
P Consolidated subsidiary P Company accounted for under the equity method
Category Company name Description of business Location Year of establishment
Japan
Manufacturing and Processing
P Nagase ChemteX Corporation
Research, manufacture, and sale of enzymes, fermented products, pharmaceutical intermediates, disinfecting agents, functional polymers, epichlorohydrine derivatives, electronics materials, etc.
Osaka Pref. 1970
P Hayashibara Co., Ltd.Development, manufacture, and sale of food raw materials, pharmaceutical raw materials, cosmetics raw materials, health foods raw materials, functional dyes, etc.
Okayama Pref. 1932
P DAITAI KAKO CO., LTD.Manufacture and sale of special pattern paint, polyester resin related products and FRP waterproof/anticorrosion related products
Osaka Pref. 1949
P Nagase Filter Co., Ltd.Planning, production, processing, quality testing and sale of metal filters
Osaka Pref. 2006
P Fukui Yamada Chemical Co., Ltd. Manufacture of color former Fukui Pref. 1985
P Kotobuki Kasei Corporation Molding, processing and sale of plastic products Tochigi Pref. 1972
P Totaku Industries, Inc. Manufacture and sale of plastic products Osaka Pref. 1952
P Setsunan Kasei Co., Ltd. Coloring and sale of plastics Osaka Pref. 1966
P Nagase Techno-Engineering Co., Ltd.
Manufacture, sale and maintenance of low-temperature vacuum equipment, systems for chemical supply management and recycling processes, inspection systems, and the peripheral equipment for each of these
Tokyo Pref. 1989
P CAPTEX Co., Ltd.Manufacture and development of battery power source controllers, battery power sources and power source peripheral equipment
Aichi Pref. 2004
P Nagase Medicals Co., Ltd.Manufacture and sale of pharmaceuticals, animal drugs, health foods, and cosmetics
Hyogo Pref. 1972
P Honshu Rheem Co., Ltd.Manufacture and sale of fiber drums, import and sale of food processing machines and materials
Kanagawa Pref. 1968
P eX. Grade Co., Ltd.Development, manufacture and sale of components for electronic equipment
Osaka Pref. 2003
P SN Tech Corporation Manufacture of developer, recycling business Osaka Pref. 2008
P Xenomax-Japan Co., Ltd.Manufacture and sales of high heat-resistant polyimide film XENOMAX®
Fukui Pref. 2018
P Sun Delta CorporationDevelopment of applications for synthetic plastic products and manufacture and sale of processed products
Tokyo Pref. 2005
P Nissei Technology CorporationDesign, development, and manufacture of ultra-precision plastic lenses and optical units; manufacture of precision mechanical components and units
Hyogo Pref. 1953
P Toyo Beauty Supply Corporation Contract manufacture of cosmetics and health foods Tokyo Pref. 1964
Sales and Servicing
P Nagase Chemical Co., Ltd.Sale of dyestuffs, industrial chemicals, chemicals for manufacturing paper, plastics and machinery
Tokyo Pref. 1995
P Nagase Chemspec Co., Ltd. Sale and technical servicing of chemicals Tokyo Pref. 1976
P Nagase Plastics Co., Ltd. Sale of raw materials for plastics and plastic products Osaka Pref. 1975
P Nagase Techno Service Co., Ltd.Sales of kitting/logistics services, online catalog sales, recordable media, and RFID
Chiba Pref. 1991
P Nagase Elex Co., Ltd. Sale of raw materials for plastics and plastic products Tokyo Pref. 1979
P Nagase Tool Matex Co., Ltd.Sale of auto models, test production materials, and carbon fiber composites
Tokyo Pref. 1965
P Nagase Abrasive Materials Co., Ltd. Sale of abrasives, inorganic materials and related equipment Osaka Pref. 1955
P Nishinihon Nagase Co., Ltd. Sale of dyestuffs, auxiliaries, industrial chemicals and plastics Fukuoka Pref. 1969
P Nagase Sanbio Co., Ltd.Sales of medicine for agriculture and additives for fertilizers, feed and food
Tokyo Pref. 1987
Category Company name Description of business Location Year of establishment
P Nagase Beauty Care Co., Ltd. Sale of cosmetics and health foods Tokyo Pref. 1991
P Nagase Business Expert Co., Ltd.Office administration services, import/export administration services
Tokyo Pref. 1996
P Nagase Logistics Co., Ltd. Warehousing and distribution Hyogo Pref. 1982
P Nagase Information Development, Ltd. Software development and maintenance Tokyo Pref. 1987
P Nagase-OG Colors & Chemicals Co., Ltd.Purchasing and information services related to dyes, industrial chemicals, etc.
Osaka Pref. 1957
P Nagase Landauer, Ltd. Radiation measuring services Ibaraki Pref. 1974
Nagase Logistics Support Co., Ltd. An exclusive stevedore for Nagase Logistics Co., Ltd. Hyogo Pref. 1954
Choko Co., Ltd. Insurance agency Osaka Pref. 1971
Greater China and Korea
Manufacturing and Processing
P Nagase ChemteX (Wuxi) CorporationPlastic manufacture and sale of adhesives and high-tech chemical products for electronics, technology services
China 2002
P Nagase Engineering Service Korea Co., Ltd. Equipment maintenance service and engineering Korea 1997
PNagase Electronics Technology (Xiamen) Co., Ltd.
Chemical etching of liquid crystal glass panel units China 2010
P Guangzhou Kurabo Chemicals Co., Ltd. Manufacture of molded urethane products for automobiles China 2001
P Toyo Quality One (Guangzhou) Co., Ltd.Research and development, manufacturing, processing, sale, technology consulting, and after-sale service for major automotive parts
China 2004
P Toyo Quality One Ningbo Co., Ltd. Manufacture and sale of polyurethane foam China 1993
P Wuxi Chenghong Electronic Chemicals Co., Ltd.Research, development, manufacture, and sales of electronics chemicals including semiconductors and flat panel displays (FPDs)
China 2013
P Tokai Spring Mfg. (Foshan) Co., Ltd.Development, manufacture, and sale of precision press products, spring, and standard molds
China 2005
ON Textile Chemicals (Shanghai) Co., LTD.Manufacture, sales, and export/import of textile-related products, dyeing processing agents
China 2003
Mianyang Chenghong Electronic Chemicals Co., Ltd.
Research, development, manufacture, and sales of electronics chemicals for the electronics industry
China 2017
Huizhou Sanli Three Synergy Precision Co., Ltd.Manufacture of precise metal insert molding parts for automotive, new energy and power industries
China 2018
Sales and Servicing
P Nagase (China) Co., Ltd.Investment, trade, import/export, processing, logistics,R&D, IT development, and various services
China 2019
P Nagase (Hong Kong) Ltd. Import/export, domestic sales, marketing China 1971
P Shenzhen Nagase Trading Ltd. Import/export, domestic sales, marketing China 2006
P Guangzhou Nagase Trading Co., Ltd. Import/export, domestic sales, marketing China 2002
Wuhan Branch Office / Chongqing Branch Office China
Zhengzhou Branch Office China
P Shanghai Nagase Trading Co., Ltd. Import/export, domestic sales, marketing China 1997
P Tianjin Nagase International Trading Co., Ltd. Import/export, domestic sales, marketing China 2003
Dalian Branch Office / Qingdao Branch Office China
Changchun Branch Office China
P Nagase (Taiwan) Co., Ltd. Import/export, domestic sales, marketing Taiwan 1988
P Nagase Korea CorporationGeneral import/export trading, retailing/wholesaling, import/export trade agency
Korea 2001
Datai (Shanghai) Chemical Trading Co., Ltd. Sales of paints China 2013
P Nagase Wahlee Plastics Corporation Sale of resins and related products Taiwan 1990
Taichung Office Taiwan
Gangshan Office Taiwan
As of April, 2019
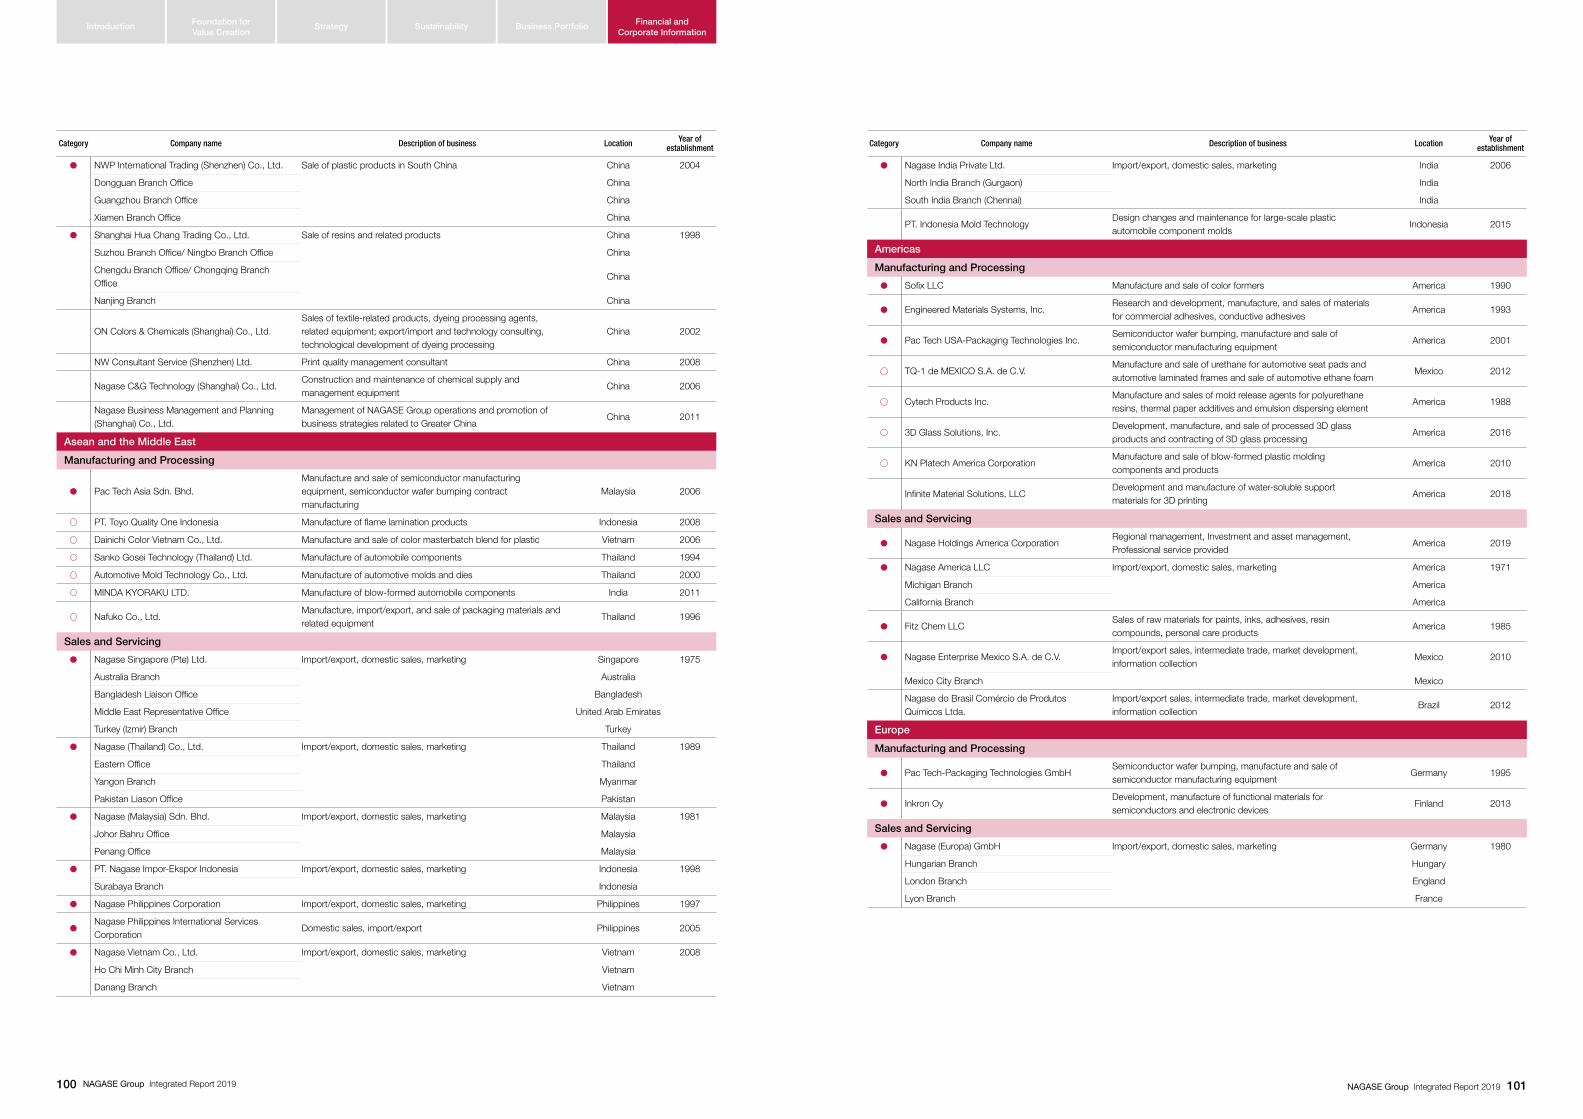
Financial and Corporate Information
Introduction SustainabilityFoundation for Value Creation
Strategy Business Portfolio
NAGASE Group Integrated Report 2019100 101NAGASE Group Integrated Report 2019
Category Company name Description of business Location Year of establishment
P NWP International Trading (Shenzhen) Co., Ltd. Sale of plastic products in South China China 2004
Dongguan Branch Office China
Guangzhou Branch Office China
Xiamen Branch Office China
P Shanghai Hua Chang Trading Co., Ltd. Sale of resins and related products China 1998
Suzhou Branch Office/ Ningbo Branch Office China
Chengdu Branch Office/ Chongqing Branch Office
China
Nanjing Branch China
ON Colors & Chemicals (Shanghai) Co., Ltd.Sales of textile-related products, dyeing processing agents, related equipment; export/import and technology consulting, technological development of dyeing processing
China 2002
NW Consultant Service (Shenzhen) Ltd. Print quality management consultant China 2008
Nagase C&G Technology (Shanghai) Co., Ltd.Construction and maintenance of chemical supply and management equipment
China 2006
Nagase Business Management and Planning (Shanghai) Co., Ltd.
Management of NAGASE Group operations and promotion of business strategies related to Greater China
China 2011
Asean and the Middle East
Manufacturing and Processing
P Pac Tech Asia Sdn. Bhd.Manufacture and sale of semiconductor manufacturing equipment, semiconductor wafer bumping contract manufacturing
Malaysia 2006
P PT. Toyo Quality One Indonesia Manufacture of flame lamination products Indonesia 2008
P Dainichi Color Vietnam Co., Ltd. Manufacture and sale of color masterbatch blend for plastic Vietnam 2006
P Sanko Gosei Technology (Thailand) Ltd. Manufacture of automobile components Thailand 1994
P Automotive Mold Technology Co., Ltd. Manufacture of automotive molds and dies Thailand 2000
P MINDA KYORAKU LTD. Manufacture of blow-formed automobile components India 2011
P Nafuko Co., Ltd.Manufacture, import/export, and sale of packaging materials and related equipment
Thailand 1996
Sales and Servicing
P Nagase Singapore (Pte) Ltd. Import/export, domestic sales, marketing Singapore 1975
Australia Branch Australia
Bangladesh Liaison Office Bangladesh
Middle East Representative Office United Arab Emirates
Turkey (Izmir) Branch Turkey
P Nagase (Thailand) Co., Ltd. Import/export, domestic sales, marketing Thailand 1989
Eastern Office Thailand
Yangon Branch Myanmar
Pakistan Liason Office Pakistan
P Nagase (Malaysia) Sdn. Bhd. Import/export, domestic sales, marketing Malaysia 1981
Johor Bahru Office Malaysia
Penang Office Malaysia
P PT. Nagase Impor-Ekspor Indonesia Import/export, domestic sales, marketing Indonesia 1998
Surabaya Branch Indonesia
P Nagase Philippines Corporation Import/export, domestic sales, marketing Philippines 1997
PNagase Philippines International Services Corporation
Domestic sales, import/export Philippines 2005
P Nagase Vietnam Co., Ltd. Import/export, domestic sales, marketing Vietnam 2008
Ho Chi Minh City Branch Vietnam
Danang Branch Vietnam
Category Company name Description of business Location Year of establishment
P Nagase India Private Ltd. Import/export, domestic sales, marketing India 2006
North India Branch (Gurgaon) India
South India Branch (Chennai) India
PT. Indonesia Mold TechnologyDesign changes and maintenance for large-scale plastic automobile component molds
Indonesia 2015
Americas
Manufacturing and Processing
P Sofix LLC Manufacture and sale of color formers America 1990
P Engineered Materials Systems, Inc.Research and development, manufacture, and sales of materials for commercial adhesives, conductive adhesives
America 1993
P Pac Tech USA-Packaging Technologies Inc.Semiconductor wafer bumping, manufacture and sale of semiconductor manufacturing equipment
America 2001
P TQ-1 de MEXICO S.A. de C.V.Manufacture and sale of urethane for automotive seat pads and automotive laminated frames and sale of automotive ethane foam
Mexico 2012
P Cytech Products Inc.Manufacture and sales of mold release agents for polyurethane resins, thermal paper additives and emulsion dispersing element
America 1988
P 3D Glass Solutions, Inc.Development, manufacture, and sale of processed 3D glass products and contracting of 3D glass processing
America 2016
P KN Platech America CorporationManufacture and sale of blow-formed plastic molding components and products
America 2010
Infinite Material Solutions, LLCDevelopment and manufacture of water-soluble support materials for 3D printing
America 2018
Sales and Servicing
P Nagase Holdings America CorporationRegional management, Investment and asset management, Professional service provided
America 2019
P Nagase America LLC Import/export, domestic sales, marketing America 1971
Michigan Branch America
California Branch America
P Fitz Chem LLCSales of raw materials for paints, inks, adhesives, resin compounds, personal care products
America 1985
P Nagase Enterprise Mexico S.A. de C.V.Import/export sales, intermediate trade, market development, information collection
Mexico 2010
Mexico City Branch Mexico
Nagase do Brasil Comércio de Produtos Químicos Ltda.
Import/export sales, intermediate trade, market development, information collection
Brazil 2012
Europe
Manufacturing and Processing
P Pac Tech-Packaging Technologies GmbHSemiconductor wafer bumping, manufacture and sale of semiconductor manufacturing equipment
Germany 1995
P Inkron OyDevelopment, manufacture of functional materials for semiconductors and electronic devices
Finland 2013
Sales and Servicing
P Nagase (Europa) GmbH Import/export, domestic sales, marketing Germany 1980
Hungarian Branch Hungary
London Branch England
Lyon Branch France
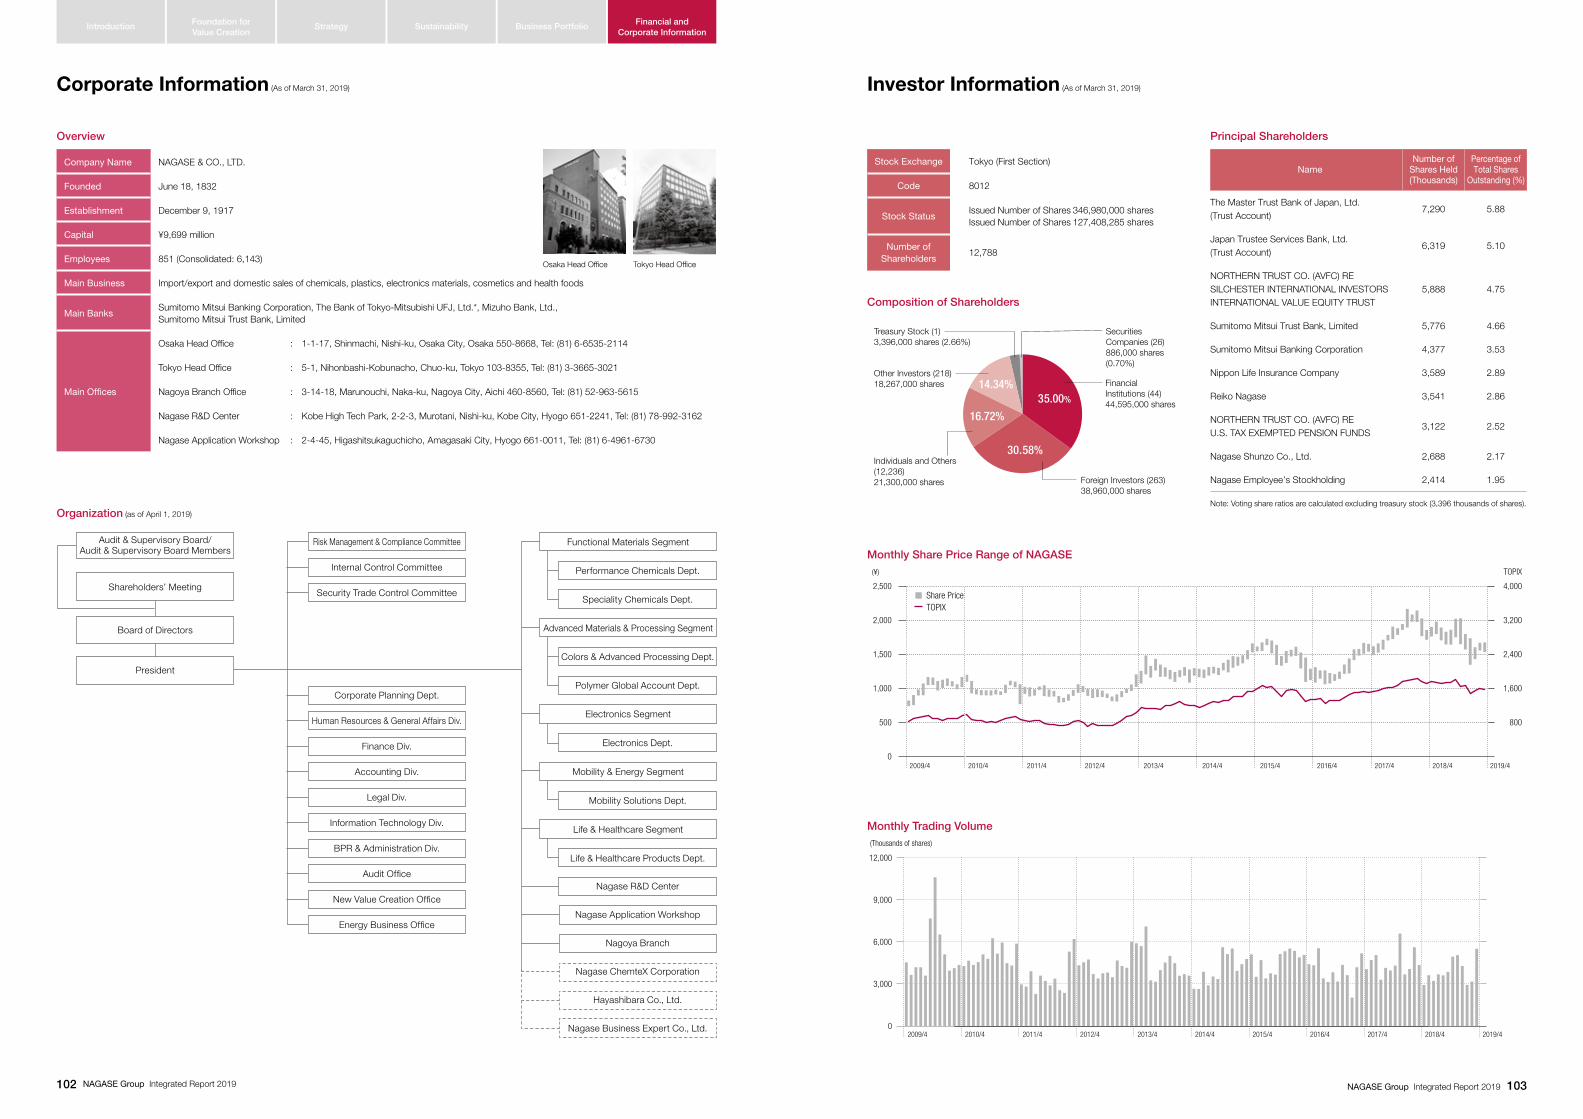
Financial and Corporate Information
Introduction SustainabilityFoundation for Value Creation
Strategy Business Portfolio
NAGASE Group Integrated Report 2019102 103NAGASE Group Integrated Report 2019
Corporate Information (As of March 31, 2019)
Overview
Company Name NAGASE & CO., LTD.
Founded June 18, 1832
Establishment December 9, 1917
Capital ¥9,699 million
Employees 851 (Consolidated: 6,143)
Main Business Import/export and domestic sales of chemicals, plastics, electronics materials, cosmetics and health foods
Main BanksSumitomo Mitsui Banking Corporation, The Bank of Tokyo-Mitsubishi UFJ, Ltd.*, Mizuho Bank, Ltd., Sumitomo Mitsui Trust Bank, Limited
Main Offices
Osaka Head Office : 1-1-17, Shinmachi, Nishi-ku, Osaka City, Osaka 550-8668, Tel: (81) 6-6535-2114
Tokyo Head Office : 5-1, Nihonbashi-Kobunacho, Chuo-ku, Tokyo 103-8355, Tel: (81) 3-3665-3021
Nagoya Branch Office : 3-14-18, Marunouchi, Naka-ku, Nagoya City, Aichi 460-8560, Tel: (81) 52-963-5615
Nagase R&D Center : Kobe High Tech Park, 2-2-3, Murotani, Nishi-ku, Kobe City, Hyogo 651-2241, Tel: (81) 78-992-3162
Nagase Application Workshop : 2-4-45, Higashitsukaguchicho, Amagasaki City, Hyogo 661-0011, Tel: (81) 6-4961-6730
Audit & Supervisory Board/Audit & Supervisory Board Members
Risk Management & Compliance Committee
Internal Control Committee
Functional Materials Segment
Performance Chemicals Dept.
Advanced Materials & Processing Segment
Colors & Advanced Processing Dept.
Speciality Chemicals Dept.
Electronics Segment
Polymer Global Account Dept.
Mobility & Energy Segment
Mobility Solutions Dept.
Electronics Dept.
Life & Healthcare Products Dept.
Life & Healthcare Segment
Nagase Application Workshop
Nagoya Branch
Nagase ChemteX Corporation
Hayashibara Co., Ltd.
Nagase Business Expert Co., Ltd.
Nagase R&D Center
Security Trade Control CommitteeShareholders’ Meeting
Board of Directors
Corporate Planning Dept.
Human Resources & General Affairs Div.
Finance Div.
Accounting Div.
Legal Div.
Information Technology Div.
BPR & Administration Div.
Audit Office
New Value Creation Office
Energy Business Office
President
Osaka Head Office Tokyo Head Office
Organization (as of April 1, 2019)
(¥) TOPIX
2,500
2,000
1,500
1,000
500
0
4,000
3,200
2,400
1,600
800
Share PriceTOPIX
2010/42009/4 2011/4 2012/4 2013/4 2014/4 2015/4 2016/4 2017/4 2018/4 2019/4
Stock Exchange Tokyo (First Section)
Code 8012
Stock StatusIssued Number of Shares 346,980,000 sharesIssued Number of Shares 127,408,285 shares
Number of Shareholders
12,788
Composition of Shareholders
Other Investors (218)18,267,000 shares
Individuals and Others(12,236)21,300,000 shares
Treasury Stock (1)3,396,000 shares (2.66%)
Foreign Investors (263)38,960,000 shares
Financial Institutions (44)44,595,000 shares
Securities Companies (26)886,000 shares(0.70%)
14.34%35.00%
16.72%
30.58%
Monthly Share Price Range of NAGASE
Monthly Trading Volume(Thousands of shares)
12,000
9,000
6,000
3,000
02009/4 2010/4 2011/4 2012/4 2013/4 2014/4 2015/4 2016/4 2017/4 2018/4 2019/4
Principal Shareholders
NameNumber of
Shares Held (Thousands)
Percentage of Total Shares
Outstanding (%)
The Master Trust Bank of Japan, Ltd. (Trust Account)
7,290 5.88
Japan Trustee Services Bank, Ltd. (Trust Account)
6,319 5.10
NORTHERN TRUST CO. (AVFC) RE SILCHESTER INTERNATIONAL INVESTORS INTERNATIONAL VALUE EQUITY TRUST
5,888 4.75
Sumitomo Mitsui Trust Bank, Limited 5,776 4.66
Sumitomo Mitsui Banking Corporation 4,377 3.53
Nippon Life Insurance Company 3,589 2.89
Reiko Nagase 3,541 2.86
NORTHERN TRUST CO. (AVFC) RE U.S. TAX EXEMPTED PENSION FUNDS
3,122 2.52
Nagase Shunzo Co., Ltd. 2,688 2.17
Nagase Employee’s Stockholding 2,414 1.95
Note: Voting share ratios are calculated excluding treasury stock (3,396 thousands of shares).
Investor Information (As of March 31, 2019)