integrated report 2016 — 2017 - wcbs
TRANSCRIPT

FROM ONE HEART TO ANOTHER
INTEGRATED REPORT 2016 — 2017

18
79
5 | STAKEHOLDER LANDSCAPE
10 | ABBREVIATIONS AND ACRONYMS
17
49
4 | BUSINESS MODEL
9 | FINANCIAL STATEMENTS
11
39
3 | MESSAGES FROM LEADERSHIP
8 | GOVERNANCE
5
32
2 | OUR ORGANISATION
7 | PERFORMANCE REVIEW
4
29
1 | ABOUT OUR REPORT
6 | RISKS AND OPPORTUNITIES
CONTENTS
Telephone021 507 6300
Websitewww.wpblood.org.za
SMS SMS the word ‘Blood’ to 33507
FacebookLike us on WP Blood
TwitterFollow us @WPBlood
InstagramFollow us @WP_Blood
WP Blood AppDownload our app
GET IN TOUCH

FROM ONE HEART TO ANOTHER
Blood is collected from volunteer donors.
Blood is spun down and seperated into its different components.
Every unit is blood grouped and tested for HIV, hepatitis B & C and syphilis.
Blood and blood products are sent to blood banks and emergency blood fridges.
Blood is transfused to the recipient. Just one donation can save three lives.
Units are transported to the nearest WPBTS offices for testing and processing.

This 2017 integrated report of the Western Province Blood Transfusion Service (WPBTS) covers the year 1 April 2016 to 31 March 2017. This is the Service’s first integrated report and the report was prepared using the International Integrated Reporting <IR> Framework as a guideline.
The report focuses on providing WPBTS members and key stakeholders with a holistic view of the Service’s operations, performance, risks and opportunities.
Ernst and Young (EY) conducted an independent audit of the Service’s annual financial statements, which are included in detail in this report.
The Board of Directors has strived to ensure that all material matters are presented and that the report fairly represents the performance and practices of WPBTS for the 2016/17 financial year.
PAUL SLACKChairman 1 September 2017
ABOUT OUR REPORT
GREG BELLAIRSChief Executive Officer/Medical Director1 September 2017
1
WP Blood Transfusion Service | Integrated Report 2016 - 2017 | 4
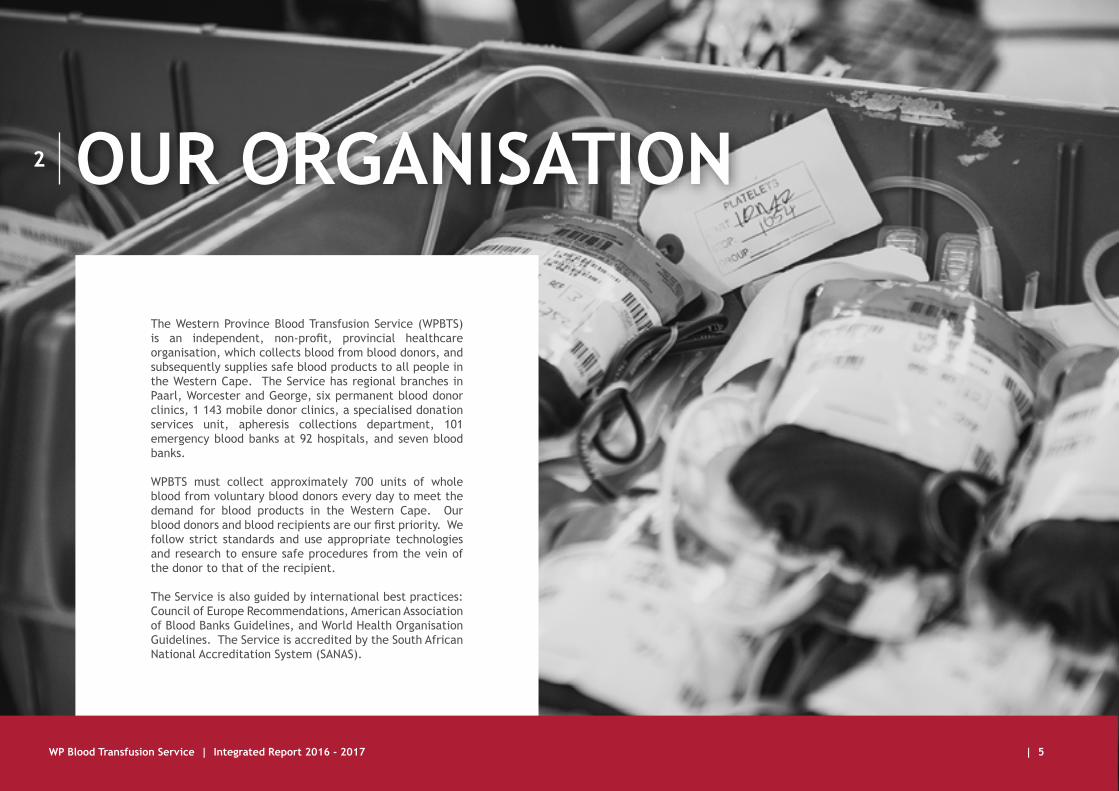
The Western Province Blood Transfusion Service (WPBTS) is an independent, non-profit, provincial healthcare organisation, which collects blood from blood donors, and subsequently supplies safe blood products to all people in the Western Cape. The Service has regional branches in Paarl, Worcester and George, six permanent blood donor clinics, 1 143 mobile donor clinics, a specialised donation services unit, apheresis collections department, 101 emergency blood banks at 92 hospitals, and seven blood banks.
WPBTS must collect approximately 700 units of whole blood from voluntary blood donors every day to meet the demand for blood products in the Western Cape. Our blood donors and blood recipients are our first priority. We follow strict standards and use appropriate technologies and research to ensure safe procedures from the vein of the donor to that of the recipient.
The Service is also guided by international best practices: Council of Europe Recommendations, American Association of Blood Banks Guidelines, and World Health Organisation Guidelines. The Service is accredited by the South African National Accreditation System (SANAS).
OUR ORGANISATION2
WP Blood Transfusion Service | Integrated Report 2016 - 2017 | 5

MISSION
VISION
Western Province Blood Transfusion Service is a community based regional health care organisation formed by an association of voluntary blood donors, dedicated to providing the safest blood products and efficient service to the community, while operating at the highest professional and ethical standards and remaining a viable organisation.
To maintain a Blood Transfusion Service that is appropriate to the needs of the South African community; to be prepared for wider Regional and National needs and to provide leadership in Transfusion Practice.

VALUES
BOARD OF DIRECTORS
COMPANY SECRETARY
REGISTERED OFFICE REGISTERED NUMBERS
AUDITORS
MANAGERSPaul Slack (Chairman) Greg Bellairs (Chief Executive Officer/Medical Director)Nicky du Toit (Corporate Services Director/Chief Financial Officer)Arthur Bird Mervyn Burton Brian FigajiAndrea Huggett Vernon LouwDumisani Ndebele Nazir Parker Roger Ramsbottom (Vice Chairman)PJ Veldhuizen
Irene van Schalkwyk
Southern House, Old Mill Road, Pinelands, 7405P.O. Box 79, Howard Place, 7450
Ernst & Young
Michelle Breuninger (Professional Development and Training)Rishaad Buckroodeen (Information Technology)Lesley Bust/Glynis Bowie (Quality Assurance) Ashleigh Button (Human Resources)Ronald Davids (George Region)Karen Dramat (Blood Banks)Vincent Erasmus (Materials - Maintenance/Purchasing/Transport)Helen Ferris (Donor Collections)Caroline Hilton (Transfusion Medical Specialist)Ebrahiema Jacobs (Worcester Region) Imtiaz Kaprey (Finances)Yasin Khan (Scientific Division – Fractionation) Bev Mitchell (Technical Services) Delizia Montgomery (Paarl Region)Debbie Smith (Processing)Irene van Schalkwyk (Promotions/Public Relations and Planning)
Registration Number: 1943/016692/08NPO Registration Number: 031-336-NPOPBO Reference Number: 93000 4391
SENIOR LEADERSHIP
WP Blood Transfusion Service | Integrated Report 2016 - 2017 | 8

FROM ONE HEART TO ANOTHER
Blood is collected from
volunteer donors into a sterile blood bag using an automated
mixer.

BLOOD DONATION PROCESS
1.Fill in the confidential
donor questionnaire (personal details, health and lifestyle)
completely and honestly.
6.Your blood pressure and
pulse are checked.
9.Enjoy some refreshments – you are remarkable and
deserve it!
7.Donate your unit (approximately 475ml) of lifesaving blood. New,
sterile equipment is used for every donation.
8.Samples are taken for testing.
We test your blood group, and for HIV, hepatitis B & C and syphilis
with every donation.
2.Your details are captured (on our computer system).
5.Collect your blood bag
and proceed to the donation bed.
3.Confidential interview – for new donors and
when required.
4.A finger prick test is done to check your haemoglobin level. We require a Hb level for women of 12.5 g/dl
and 13.5g/dl for men.

MESSAGES FROM LEADERSHIP
Greg BellairsCEO/Medical Director
Ms Nicky Du ToitCFO/Corporate Services Director
WPBTS performed well in the 2016/17 financial year, despite challenging economic conditions. Through the remarkable efforts of blood donors and staff, sufficient safe blood was collected and subsequently issued to patients in healthcare facilities throughout the Province.
3
DIRECTORS’ REPORT 2016/17
WP Blood Transfusion Service | Integrated Report 2016 - 2017 | 11
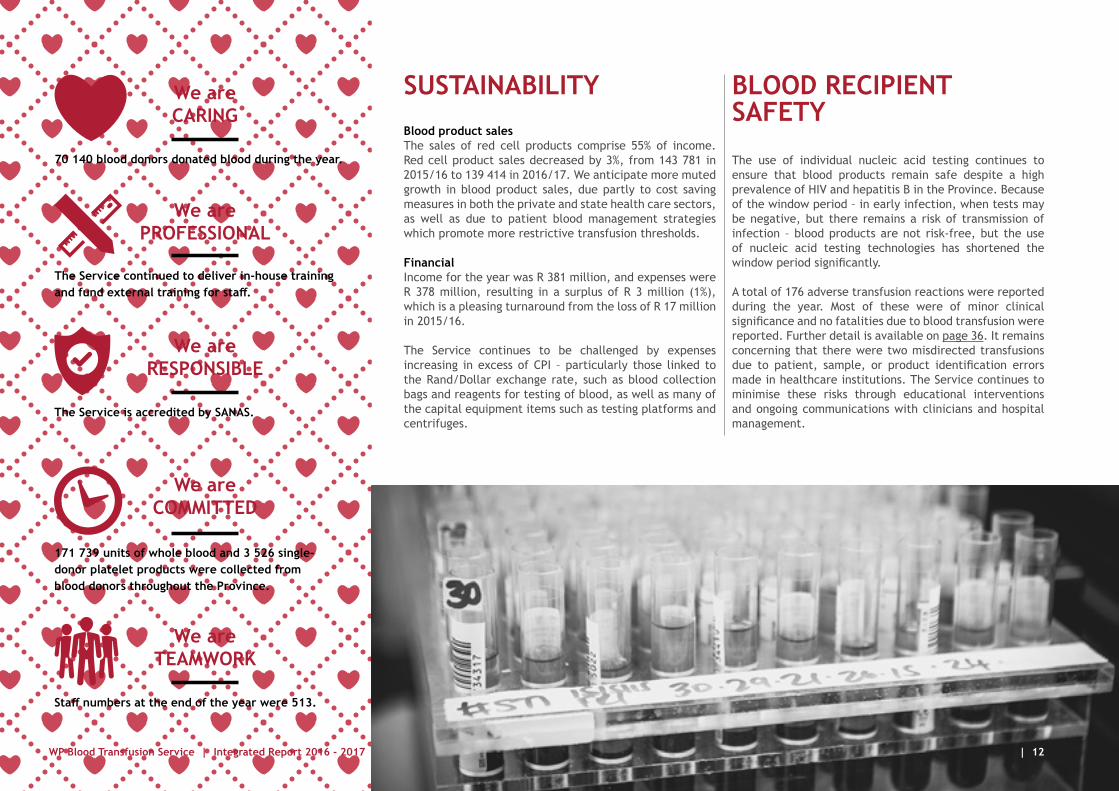
SUSTAINABILITYBlood product salesThe sales of red cell products comprise 55% of income. Red cell product sales decreased by 3%, from 143 781 in 2015/16 to 139 414 in 2016/17. We anticipate more muted growth in blood product sales, due partly to cost saving measures in both the private and state health care sectors, as well as due to patient blood management strategies which promote more restrictive transfusion thresholds.
FinancialIncome for the year was R 381 million, and expenses were R 378 million, resulting in a surplus of R 3 million (1%), which is a pleasing turnaround from the loss of R 17 million in 2015/16.
The Service continues to be challenged by expenses increasing in excess of CPI – particularly those linked to the Rand/Dollar exchange rate, such as blood collection bags and reagents for testing of blood, as well as many of the capital equipment items such as testing platforms and centrifuges.
BLOOD RECIPIENT SAFETY
The use of individual nucleic acid testing continues to ensure that blood products remain safe despite a high prevalence of HIV and hepatitis B in the Province. Because of the window period – in early infection, when tests may be negative, but there remains a risk of transmission of infection – blood products are not risk-free, but the use of nucleic acid testing technologies has shortened the window period significantly.
A total of 176 adverse transfusion reactions were reported during the year. Most of these were of minor clinical significance and no fatalities due to blood transfusion were reported. Further detail is available on page 36. It remains concerning that there were two misdirected transfusions due to patient, sample, or product identification errors made in healthcare institutions. The Service continues to minimise these risks through educational interventions and ongoing communications with clinicians and hospital management.
We are CARING
We are RESPONSIBLE
We are TEAMWORK
We are PROFESSIONAL
We are COMMITTED
70 140 blood donors donated blood during the year.
The Service is accredited by SANAS.
Staff numbers at the end of the year were 513.
The Service continued to deliver in-house training and fund external training for staff.
171 739 units of whole blood and 3 526 single-donor platelet products were collected from blood donors throughout the Province.
WP Blood Transfusion Service | Integrated Report 2016 - 2017 | 12

BLOOD DONOR SAFETY70 140 blood donors donated blood during the year. Of these, approximately 1.1% had adverse donor reactions, most of which were vasovagal episodes (commonly known as faints). Donor safety is managed by the self-completion of a health questionnaire to detect any medical condition which may preclude safe donation, pulse and blood pressure checks, and measurement of donor haemoglobin levels to ensure they exceed a predefined minimum level. A total of 36 380 donors were deferred from donating - mainly due to low haemoglobin levels. To minimise the risk of iron deficiency or anaemia, donors at risk are given oral iron therapy to replace the iron lost through donation – in total 7 269 patient-ready packs of iron tablets were issued to donors most at risk.
SUFFICIENT BLOOD SUPPLY152 447 units of whole blood and 3 812 adult single-donor platelet products were collected from blood donors throughout the Province. These were processed into various blood products which were issued to patients in 140 healthcare institutions in the Western Cape. The Service strives to maintain 5-day stocks of each blood type, in order to have a buffer stock available should usage exceed supply (e.g. in mass casualty situations) or should supply be temporarily compromised (e.g. during holiday periods). Adequate stocks of all blood types were maintained for the year, and during times of a relative excess, some products were supplied to SANBS to mitigate a critical shortage in Kwazulu-Natal.
Platelet stocks were included as a key performance indicator for 2016/17 which ensured that the Service was able to supply platelets throughout the Province at any given time.
EFFICIENT OPERATIONS AND CONSOLIDATIONStaff numbers at the beginning of the year were 533, reducing to 513 at the end of the year (18 staff were retrenched following the closure of the Fractionation Plant).
Various approaches are being considered for measuring ‘efficiency’. One of these is red cell products issued per staff member which was 251 for 2016/17 versus 252 in the previous year. Another measure of efficiency is the proportion salaries comprise of expenses – currently 46% (45% in the previous year).
The Service formally introduced Lean Methodologies at the beginning of 2017. A structured program has been followed and Lean is expected to improve efficiencies and reduce waste of resources, ultimately contributing positively to the bottom line.
FRACTIONATION PLANTThe operations of the WPBTS have for many years included the manufacturing of plasma derived medicinal products under the regulation of the Medicines Control Council (MCC). The pharmaceutical plant (also known as the Fractionation Plant, named after the manufacturing process used) had always placed a strong emphasis on meeting good manufacturing practice standards and over the years a number of costly refurbishments and upgrades were undertaken to meet MCC requirements.
In February 2016 the MCC conducted the first inspection in 14 years of the Fractionation Plant. Based on some of the findings of the inspection, a decision was made to
voluntarily cease manufacturing plasma derived medical products, despite a long track record of product safety. One of the important adverse findings was the layout of the facility (which is in an old building), which could not be changed without costly and lengthy building works, or a complete rebuild of the facility.
To correct the deficiencies would have required major capital expenditure and after careful consideration of the investment required against the long-term sustainability of the Plant, a decision was made by the Board to close the Fractionation Plant. As a result of the closure, 19 187 litres of excess plasma (which would have been processed into plasma derived medical products by WPBTS) was instead sold to National Bioproducts Institute (NBI) for processing, contributing R 15 million to income.
PEOPLE DEVELOPMENT AND STAFF RETENTIONThe Service continued to deliver in-house training and fund staff receiving external training. In addition, several staff attended conferences and educational opportunities offered by technical partners. A new offering was that of leadership development provided by way of the Supervisors Development Program.
Staff turnover for the year was 8.6% overall – including departures due to retirements. The Service remains stretched at times due to the challenge of filling certain posts, but strategies are in place to train, retain and attract talented staff in certain specialised areas.
THANKSWe would like to thank all blood donors, staff, customers and suppliers for their support during the year.
WP Blood Transfusion Service | Integrated Report 2016 - 2017 | 13

Paul Slack Chairman of the Board
CHAIRMAN’S REPORT
During the year under review the Board once again critically evaluated its role in providing strategic guidance to the Service and confirmed that it would continue to focus on the material aspects which could promote the continued sustainability and growth of the Service.
WP Blood Transfusion Service | Integrated Report 2016 - 2017 | 14

We understand that all WPBTS team members, including the Board, are merely custodians of the organisation and have been given the responsibility of operating sustainably, in order to hand over the business to future generations in a better state than it was when we received it from past generations. We believe that it is critical for our organisation to have a sustainability-oriented culture, and structures and processes for the governance of sustainability. Key indicators and material sustainability issues and risks are monitored on an ongoing basis.
Following a period of evaluation of methods by the Board, performance management was implemented and in July 2017, for the first time in the company’s 79 year existence, annual salary increases was calculated and implemented on individual performance-based scores.
I would like to thank my fellow Board members - thank you for your support, devotion and maintaining open, transparent, honest and robust participation throughout the year. Your contributions are of great value.
On behalf of the Board I would like to thank our donors, partners, suppliers and the community for continued support, loyalty and friendship. WPBTS is well positioned for future growth but without these cornerstones in our business, success will not be possible.
I would also like to thank our employees on behalf of the Board of Directors for their loyalty and hard work during the year. Thank you to the management team for the bold manner in which they lead the team. May WPBTS be a Service which ‘makes things happen’ for the future and may each one of you strive towards gaining the knowledge required to realise your dreams for the present and the future.
Paul Slack Chairman of the Board14 August 2017
WP Blood Transfusion Service | Integrated Report 2016 - 2017 | 15

FROM ONE HEART TO ANOTHER
Units are transported to the
nearest WPBTS offices (in Cape Town, Paarl,
Worcester and George) for testing
and processing.

BUSINESS MODEL4
Blood collection cost and pricing strategyClause 6.1.1 of the draft National Blood Policy for South Africa (August 2010) states that “to ensure sustainability and appropriate development of the national blood programme, fees will be levied for all blood, blood components and blood products provided by the licence holders in the National Blood Programme on a cost recovery basis. Fee for service will be the main source of funding and will provide for recurrent expenditure and ongoing, sustainable development”. In South Africa most patients treated within the State sector are funded by the State (Provincial
Departments of Health), while those treated in the Private sector are funded by medical insurance or their own funds.
WPBTS has an array of approximately 70 products and 40 services with annual price increases implemented across the full product range as per the WPBTS published price list. Approximately 87% of income is contributed by red cell concentrate, fresh frozen plasma and platelets.
Because individual product input costs are not computed, the cost per unit of blood needs to be viewed by dividing total
expenses into various categories. This allows a reasonable allocation of costs to the “generic” blood product.
Recent allocations of expenses are summarised in the following table:
Expense 2016/17 %
Personnel 174 874 456 46.3%
Collections 34 354 637 9.1%
Testing 68 064 391 18.0%
Product costs 53 674 742 14.2%
Administration 28 670 075 7.6%
Repairs/Maintenance 8 318 382 2.2%
Depreciation 10 139 412 2.7%
Total 378 096 095 100%
Annually WPBTS projects future demand (with reference to recent trends) and then targets blood collections to meet these demands. In determining blood product price increases, the following key factors are taken into account:
• Sales volume forecasts for the following year.
• Budget to achieve sufficient collections to meet the projected demand, including factors such as inflation, discard rates, exchange rates, salary increases, projects and efficiency gains.
• Achieving a cash surplus to fund capital purchases, maintenance and expansion of existing facilities, and to implement appropriate new technologies.
A question often asked of Blood Services is “why do blood products cost what they do, if blood is given free-of-charge by blood donors?” The expense categories in the above table indicate the proportion of expenses incurred to convert the “free” raw material into a safe end-product suitable for transfusion – and the overall expenses dictate the income required to cover these expenses, to ensure the long-term sustainability of WPBTS and the Service therefore employs a cost-recovery model in determining the selling price of blood.
It must be noted that Blood Service provision in South Africa is on par with that of most first-world countries – with the result that most of the processing and testing technologies used are imported, and thus subject to global pricing and exchange rate fluctuations. In spite of this, red cell products cost significantly less in South Africa than they do in the USA and UK – possibly due to certain locally incurred costs such as staff salaries being lower, or operational efficiencies in the South African Blood Services, or different degrees of beneficiation, or a combination of these and other factors.
The Western Province Blood Transfusion Service (WPBTS) has been in existence since 1938, and is a non-profit company incorporated in terms of the Companies Act, 71 of 2008. The main activity of the Service is the collection, testing, processing, storing, distribution and issuing of blood products within the greater Western Cape region (an area approximately bordered by Plettenberg Bay, Springbok, and Beaufort West) to approximately 6.5 million people.
WP Blood Transfusion Service | Integrated Report 2016 - 2017 | 17

STAKEHOLDER LANDSCAPE
5
WPBTS recognises that building and maintaining relationships with our stakeholders is a key priority. The Service actively engages with these stakeholders and their feedback informs and influences our activities and initiatives.
WP Blood Transfusion Service | Integrated Report 2016 - 2017 | 18

CURRENT AND POTENTIAL BLOOD DONORS
Male Female
51% 49%
Asian Black Coloured White
1% 4% 31% 64%
Age
16-18 19-25 26-29 30-39 40-49 50-59 60+
4% 12% 8% 20% 23% 20% 13%
How we engage: Our 2016/17 activities:Interactions at blood donor clinics and drives, recruitment calls, recruitment SMSs, “The Blood Buzz” quarterly printed newsletter, annual donor survey, social media, donor awards function, feedback mechanisms, website with donor portal, educational and motivational talks, marketing and advertising campaigns, research and surveys.
78 donor registration sessions
Commitment campaign
20 142 donor awards Electronic Donor Survey
Website donor registration portal
Instagram launch with competition
1 117 Facebook growth
253 total Instagram growth
1 949 total Twitter followers
Increased digital marketing presence
Sponsorship of refreshment stations at big sporting events
YouthTube campaign
ABO
178 005 website sessions, with 53 650 users
50 blood grouping sessions
30 wellness days
WP Blood Transfusion Service | Integrated Report 2016 - 2017 | 19

MEMBERS WPBTS Members consist of: • 12 Board directors
(2 x Executive directors and 10 x Independent non-executive directors)
• 670 Donor Representatives• 23 Honorary members
How we engage:
Our 2016/17 activities:
Donor representative function
• Developed a Board Charter, a Board Code of Ethics and Board Code of Conduct.
• Developed Terms of Reference for the Social and Ethics Committee.
• Director Development: King IV training.• Board evaluation/self-appraisal.• Compliance management through Lexis Nexis alerts.• Donor representative challenge.
AGM
WP Blood Transfusion Service | Integrated Report 2016 - 2017 | 20

EMPLOYEES
How we engage:
Our 2016/17 activities:
New employee induction, annual employee wellness day, formalised performance appraisal process, daily meetings with visual management boards, Directorate road shows, high performance team meetings, Gemba walks, “From the Heart” e-mail notices, “Remarkable Chronicles”quarterly internal newsletter, Journal Clubs (sharing experiences from congresses attended and research).
• Lean Management Programme.• Supervisory Development Programme.• Health Professions Council of South Africa (HPCSA)
national board exams.• In-house training.• Bursaries.• WPBTS staff members contributed R5170 to Casual Day,
Slipper Day and Tekkie Tax Day, + 272 non-perishable products for the Worcester We Care Project.
• Knowledge sharing: 11 staff members attended international conferences.
WP Blood Transfusion Service | Integrated Report 2016 - 2017 | 21

UNIONS i.e. PSA (Public Servants
Association of South Africa)
SUPPLIERS AND VENDORS
THE MEDIA
How we engage: How we engage:
How we engage:
Our 2016/17 activities:
Our 2016/17 activities:
Ongoing labour forum meetings and discussions regarding workplace issues
and annual wage negotiations.
Supplier registration process, Service Level Agreements (SLAs).
Targeted media releases and direct communication to build public awareness.
• Vendor audits.• Tariff negotiations and agreements.
• The total advertising value equivalent (AVE) for the period, measured as an equivalent of advertising rates, was valued at R3 900 968.60.
• 147 interviews.• 2 052 items of editorial media coverage
across print, online and radio channels.
Our 2016/17 activities:• Bi-monthly labour forum meetings.
• Quarterly Employment Equity Committee meetings.
WP Blood Transfusion Service | Integrated Report 2016 - 2017 | 22

BLOOD USERSProvincial government, public hospitals, medical aid schemes, hospital management and clinicians.
How we engage:
Our 2016/17 activities:
Annual meetings to discuss price increases, Blood users committee meetings, training of 8 haematology and 2 clinical pathology registrars,Service Level Agreements (SLAs).
• Blood user customer satisfaction survey.• 40% private vs 60% state use.• CPD seminars.• Clinical usage reports and audit.
WP Blood Transfusion Service | Integrated Report 2016 - 2017 | 23
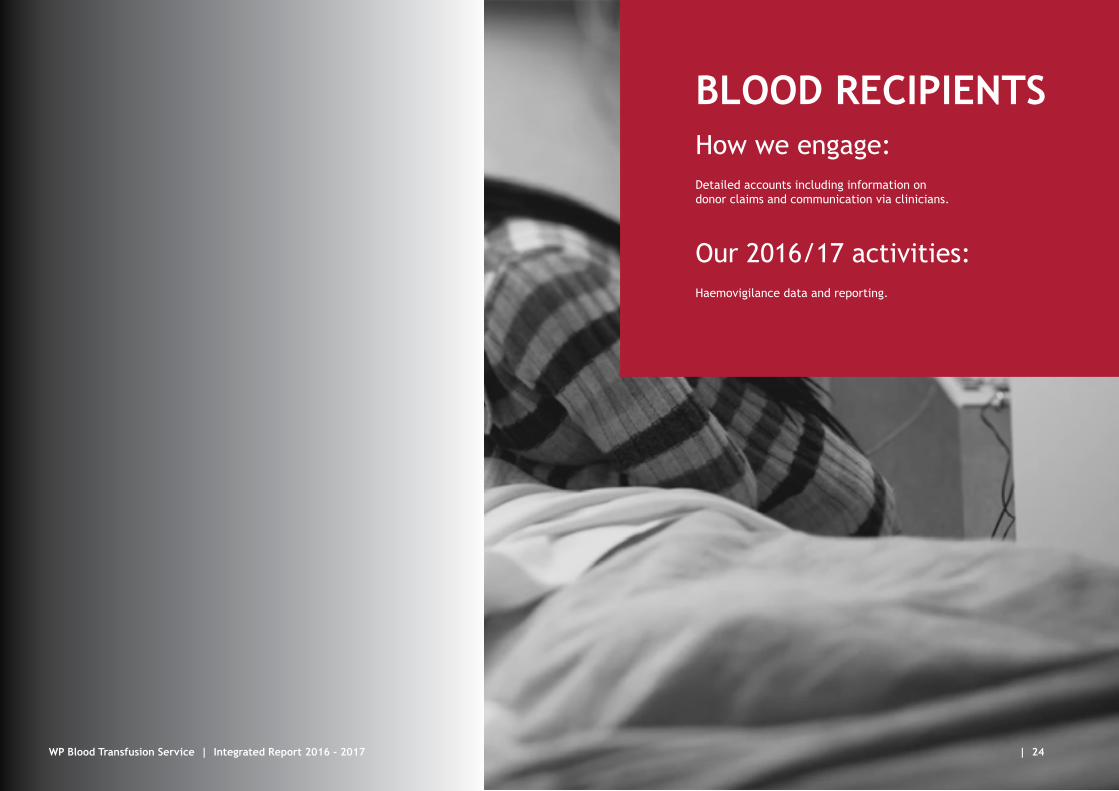
BLOOD RECIPIENTSHow we engage:
Our 2016/17 activities:
Detailed accounts including information on donor claims and communication via clinicians.
Haemovigilance data and reporting.
WP Blood Transfusion Service | Integrated Report 2016 - 2017 | 24

REGULATORS AND POLICY MAKERSIncluding the Department of health
Our 2016/17 activities:Department of Health: Revised Regulation - parental consent no longer required for 16 and 17 year old blood donors.
How we engage:Relationship and contact channels via Director General of Health with direct access to the Minister.
SOUTH AFRICAN NATIONAL BLOOD SERVICE (SANBS)
Our 2016/17 activities:• Supplied 1 272 units to SANBS.• Standards updated.• Co-organisation of SANBTC 2017.• IT department interactions
working towards a shared donor and recipient database.
How we engage:National Blood Safety meetings,National Haemovigilance Report,sharing of blood stocks,bi-annual SA National Blood Transfusion Congress (SANBTC),South African Society for Blood Transfusion (SASBT).
NATIONAL BIOPRODUCTS INSTITUTE (NBI)
Our 2016/17 activities:Supply of 19 187 litres of plasma from which medicinal products are manufactured.
How we engage:Regular meetings and audits.
RELATED ORGANISATIONS Including The Sunflower Fund, The South African Bone Marrow Registry, Organ Donor Foundation, Safe blood for Africa Foundation, African Society of Blood Transfusion (AfSBT), International Society of Blood Transfusion (ISBT), WHO, AABB, Namibian Blood Transfusion Service (NBTS), SA Haemophilia Foundation, CHOC, CANSA
How we engage:Collaboration,promotional campaigns,congress attendance. • Africa Society for Blood Transfusion congress
– Kigali, Rwanda.• ISBT Congress, Bali, Indonesia.• SABMR 25th Anniversary function.• Global Database for Blood Safety (GDBS)
report submitted to WHO.
Our 2016/17 activities:
WP Blood Transfusion Service | Integrated Report 2016 - 2017 | 25
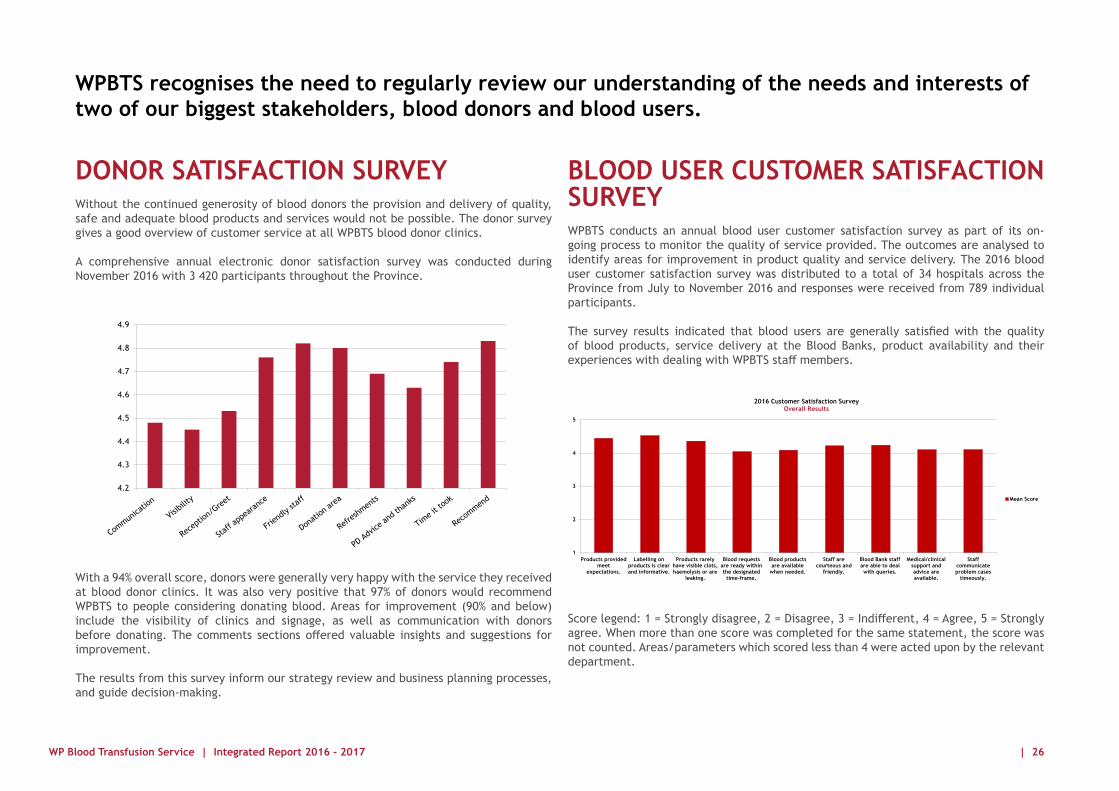
DONOR SATISFACTION SURVEYWithout the continued generosity of blood donors the provision and delivery of quality, safe and adequate blood products and services would not be possible. The donor survey gives a good overview of customer service at all WPBTS blood donor clinics.
A comprehensive annual electronic donor satisfaction survey was conducted during November 2016 with 3 420 participants throughout the Province.
With a 94% overall score, donors were generally very happy with the service they received at blood donor clinics. It was also very positive that 97% of donors would recommend WPBTS to people considering donating blood. Areas for improvement (90% and below) include the visibility of clinics and signage, as well as communication with donors before donating. The comments sections offered valuable insights and suggestions for improvement.
The results from this survey inform our strategy review and business planning processes, and guide decision-making.
BLOOD USER CUSTOMER SATISFACTION SURVEYWPBTS conducts an annual blood user customer satisfaction survey as part of its on-going process to monitor the quality of service provided. The outcomes are analysed to identify areas for improvement in product quality and service delivery. The 2016 blood user customer satisfaction survey was distributed to a total of 34 hospitals across the Province from July to November 2016 and responses were received from 789 individual participants.
The survey results indicated that blood users are generally satisfied with the quality of blood products, service delivery at the Blood Banks, product availability and their experiences with dealing with WPBTS staff members.
Score legend: 1 = Strongly disagree, 2 = Disagree, 3 = Indifferent, 4 = Agree, 5 = Strongly agree. When more than one score was completed for the same statement, the score was not counted. Areas/parameters which scored less than 4 were acted upon by the relevant department.
WPBTS recognises the need to regularly review our understanding of the needs and interests of two of our biggest stakeholders, blood donors and blood users.
1
2
3
4
5
Products providedmeet
expectations.
Labelling onproducts is clearand informative.
Products rarelyhave visible clots,haemolysis or are
leaking.
Blood requestsare ready withinthe designated
time-frame.
Blood productsare available
when needed.
Staff arecourteous and
friendly.
Blood Bank staffare able to dealwith queries.
Medical/clinicalsupport andadvice areavailable.
Staffcommunicateproblem cases
timeously.
2016 Customer Satisfaction Survey Overall Results
Mean Score
4.2
4.3
4.4
4.5
4.6
4.7
4.8
4.9
WPBTS
WP Blood Transfusion Service | Integrated Report 2016 - 2017 | 26

FROM ONE HEART TO ANOTHER
Blood is spun down in a centrifuge and separated into its different components: red blood cells, buffy
coat and plasma.

BLOOD PRODUCTS
WHOLE BLOOD
PLATELETS
RED BLOOD CELLS
PLASMA

RISKS AND OPPORTUNITIES6
A comprehensive high-level strategic risk assessment (SRA), including workshops with senior management and interviews with key committee members, was conducted in 2014, with the outcome being a detailed Risk Register. A total of 23 significant risks were identified, with 13 having “high” or “critical” inherent risk ratings. All risks were reviewed and control measures were identified to mitigate each. After the application of preventative and corrective measures, the residual risks were categorised as “acceptable” and “to be monitored”.
STRATEGIC RISKSRisk Inherent
Risk RatingResidual
Risk Rating Risk Owner
Donor Risk • Limited• No blood supply• Donor fatigue
High Acceptable CEO/Medical Director
Recipient Risk• Safety of blood products• Transmission of infection
High Monitor CEO/Medical Director
Transfusion Risk• Safety of blood products• Incompatible blood
transfusions
Critical Monitor CEO/Medical Director
Medical risk to the donor• Iron deficiency• Taking donations from
donors with underlying disorders
High Acceptable CEO/Medical Director
Decrease in sales due to decline in use of blood High Monitor CEO/Medical Director
Look-back and
haemovigilance
Rational (restrictive) clinical usage
Blood donation testing - including NAT
Self-exclusion questionnaire to identify risk behaviour
Voluntary, non-remunerated (repeat) blood donors
WP Blood Transfusion Service | Integrated Report 2016 - 2017 | 29

OPERATIONAL RISKSRisk
Inherent Risk
Rating
Residual Risk
RatingRisk Owner
Damage to/failure of key technical/specialised equipment• Loss of product• Downtime on automated testing of
samples
High Monitor CFO/Operations Director
Security and safety risk• Damage to infrastructure/assets• Safety to staff/clinics with civil
unrest, protest action/crime – limitations to operate within areas/cancelling clinics
High Monitor CEO/Medical Director
Inadequate IT infrastructure, processes and resources High Monitor CFO/Operations
Director
Medical risk to staff safety Needle stick injury with exposure to infectious/untested tissues/safety hazards
High Monitor CEO/Medical Director
Inadequate staffing/attraction and retention of specialists/scarcity of specialist skills
High Monitor CFO/Operations Director
Inability to find compatible blood in sub-groups of multi-transfused recipients
High Monitor CEO/Operations Director
The Board reviews the risk register and risk management processes regularly. The risk management process identifies all risks that relate to the core business of WPBTS (mission statement) and that will impact our ability to meet strategic objectives. The existing control measures identified to mitigate the residual risk ratings were reviewed to ensure that they are maintained and to establish whether new or additional controls should be applied to the relevant risks to ensure that these risks do not escalate in the future.
FINANCIAL RISKRisk Inherent
Risk RatingResidual
Risk Rating Risk Owner
Financial sustainability • Insufficient cash flow• Exchange rate risk• Emerging risk of debt
collections from private individuals in state institutions
High Monitor CFO/Operations Director
COMPLIANCE RISKRisk Inherent
Risk RatingResidual
Risk Rating Risk Owner
Non-compliance with key legislation • National Health Act (NHA)• HR and Financial
Legislation• Protection of Personal
Information Act (POPIA)
High Monitor CEO/Medical Director
WP Blood Transfusion Service | Integrated Report 2016 - 2017 | 30

FROM ONE HEART TO ANOTHER
Every unit is blood grouped and
tested for HIV, hepatitis B & C
and syphilis in our laboratories.

PERFORMANCE REVIEW
7
WPBTS’s mission statement is fulfilled by remaining dedicated to providing the safest blood products, efficient service to the community, operating at the highest professional and ethical standards, yet remaining a viable organisation. The following form the basis of the Service’s Key Performance Indicators (KPIs) and strategic targets:
• Maintaining SANAS accreditation and minimising deviations from the Standards of Practice for Blood transfusion in South Africa
• Ensuring a safe working environment and 5-star OHSA accreditation.• Maintaining sufficient blood product stock levels.• Safe and appropriate procedures and products for donors and patients respectively.• Achievement of specific strategic objectives – e.g. increasing the blood donor base.• Reaching defined employment equity objectives.• Improving the financial position and ensuring long-term sustainability.
Due to the effects of some targets being “stretch goals” – which were achieved – the score for 2016/17 was a well-deserved 102%.
WP Blood Transfusion Service | Integrated Report 2016 - 2017 | 32

FACTS AND FIGURESBLOOD DONATIONS COLLECTED AT CLINICS
Cape Peninsula Worcester
Paarl
2015/2016 2016/20172014/2015
96 306102 401
2015/2016 2016/20172014/2015
18 75318 365
2015/2016 2016/20172014/2015
23 17722 484
2014/2015 2014/20152014/2015
14 21113 517
George
WP Blood Transfusion Service | Integrated Report 2016 - 2017 | 33

TOTAL BLOOD DONATIONS COLLECTED AT CLINICS
2014/2015 2015/2016
156 767154 451
2016/2017
152 447
Number of first time (new) donors 23 660 15 187 20 869Number of donors who donated including new donors 71 620 70 695 70 140New clinics opened 53 20 21Average donation frequency (donation/year/donor) 2.16 donations 2.22 donations 2.17 donations
• Note 1: Donation registered at clinics excludes not bled, insufficient, test only, dry pack, blood groupIng, low HB, mailing list donors and underweight.
2014/2015 2015/2016 2016/2017
WP Blood Transfusion Service | Integrated Report 2016 - 2017 | 34

To
tal 1
56 9
69
To
tal 1
53 5
91
To
tal 1
57 8
79
• Note 1: The totals units indicate all donations tested through the analyser, including apheresis and autologous units.
TOTAL UNITS TESTED CONFIRMED POSITIVE TEST RESULTS
SPECIALISED DONOR SERVICES INFORMATION
NUMBER OF APHERESIS PLATELETS ISSUED FOR THIS PERIOD
2014/2015 2015/2016 2016/2017
Hepatitis B 119 73 63Hepatitis C 7 1 5HIV 74 51 52Syphilis 94 82 74
Autologous donations 29 16 6Designated donations 45 37 36Therapeutic donations 2 404 2 793 3 348
Adult apheresis platelets 3 603 3 595 3 812Infant apheresis platelets 1 522 1 284 722
2014/2015
2014/2015
2014/2015
2015/2016
2015/2016
2015/2016
2016/2017
2016/2017
2016/2017
WP Blood Transfusion Service | Integrated Report 2016 - 2017 | 35

Allergic
Febrile
Anaphylactic
Hypotensive
Misdirected transfusion
Acute haemolytic reaction
Delayed haemolytic reaction
TRALI (transfusion related acute lung injury)
TACO (transfusion associated circulatory overload)
Total
82
59
17
6
1
1
0
1
0
167
79
57
13
2
6
1
0
1
0
159
93
65
10
4
2
0
0
0
2
176
2014/2015 2015/2016 2016/2017
ADVERSE TRANSFUSION REACTIONS BLOOD BANK INFORMATION: ISSUED PRODUCTS
QUALITY & SAFETY
Red cell concentrates 140 290 133 796 130 028Platelets 4 956 5 287 5 174Fresh frozen plasma 25 238 23 726 22 880Whole blood 174 219 248Emergency blood 9 440 10 170 9 628After hours requests 57 565 57 641 52 512
2014/2015
2014/2015
2015/2016
2015/2016
2016/2017
2016/2017
• Note 1: Fresh frozen plasma includes both infant and adult fresh frozen plasma.• Note 2: Emergency blood includes blood issued by Stock Control, as well as those
issued from the Blood Banks.• Note 3: The figures include those of the whole Western Cape region.
• Note 1: Since February 2016 Safe Working Practice has conducted the OHSA Compliance Audits.
SANAS Accreditation Full Full Full status
Technilaw n/a n/a
Safe Working Practice: N1 City Blood Donation Clinic n/a
Red Cross Blood Bank n/a
George Regional Office n/a
Pinelands Head Office n/a
WP Blood Transfusion Service | Integrated Report 2016 - 2017 | 36

EQUITY FIGURES
Employment equity targets are one of the Service’s KPIs and are monitored and reviewed regularly. Once again WPBTS met its targets for the period under review.
Currently 79.45% of staff are from the black designated group and 62.23% of staff are females.
WPBTS EMPLOYEE RACIAL PROFILE COMPARED WITH WESTERN CAPE DEMOGRAPHICS
African / Black 14.1% 14.6% 14.1% 36.0%Coloured 61.2% 63.0% 63.2% 48.7%Indian / Asian 0.7% 1.1% 1.2% 0.5%White 23.8% 21.7% 20.6% 14.9%
2014/2015 2015/2016 2016/2017 Western Cape
HUMAN RESOURCES
Resignations 28 35 31New appointments 59 51 54
2014/2015 2015/2016 2016/2017
WP Blood Transfusion Service | Integrated Report 2016 - 2017 | 37

FROM ONE HEART TO ANOTHER
Blood and blood products are sent to seven blood
banks and 101 emeregncy blood fridges at 92
hospitals throughout the Western Cape
GOVERNANCE8The WPBTS Board of Directors are made up of ten independent non-executive directors and two executive directors.
WP Blood Transfusion Service | Integrated Report 2016 - 2017 | 39

OU
R BO
ARD
Dr Arthur Bird (70)NON-EXECUTIVE DIRECTOR
BOARD TENURE IN YEARS: 24*
COMMITTEE:Social & Ethics
QUALIFICATIONS:Executive leadership, Transfusion Medicine [MBChB (UCT), M.Med. (Path) (Haem) (UCT), F.C.Path (Haem) (SA)]
* Includes period as CEO/Medical Director.
Mr Mervyn Burton (59)NON-EXECUTIVE DIRECTOR
BOARD TENURE IN YEARS: 6
COMMITTEES:Risk & GovernanceAudit (Chair)Finance & IT
QUALIFICATIONS:Chartered Accountant [B Compt., B Compt. (HONS), CA (SA)]
Prof Brian Figaji (73)NON-EXECUTIVE DIRECTOR
BOARD TENURE IN YEARS: 12
COMMITTEES:AuditRemuneration & Nominations (Chair)
QUALIFICATIONS:Education / Management / Engineering [B Sc (UWC), B Sc (Eng) (UCT), GDE (UCT), DTE (UNISA), M Ed (Harvard), D Litt (hc) (Cal State), D Ed (hc) (Coventry)]
Mr Dumisane Ndebele (50)NON-EXECUTIVE DIRECTOR
BOARD TENURE IN YEARS: 4
COMMITTEE:Remuneration & Nominations
QUALIFICATIONS:Human Resources Director, Pathcare [BA degree, BSoc Sc (Hons), PDM (Post Graduate Diploma in Management), Certificate in Strategic HR Planning and CEDR Mediator]
Dr Andrea Huggett (43)NON-EXECUTIVE DIRECTOR
BOARD TENURE IN YEARS: 3
COMMITTEES:Social & EthicsFinance & IT
QUALIFICATIONS:Medical Doctor [MBChB (UCT), Diploma in Emergency Care, MBA (UCT), Post Graduate Diploma in Financial Planning (UOFS)]
Prof Vernon Louw (48)NON-EXECUTIVE DIRECTOR
BOARD TENURE IN YEARS: 2
COMMITTEES:Risk & GovernanceSocial & Ethics
QUALIFICATIONS:Clinical Haematologist [MBChB (Stell), MMed (Int.Med) (Stell), FCP (SA), PhD (HPE) (UFS), Registered Specialist Physician and Clinical Haematologist]
Mr Nazir Parker (54)NON-EXECUTIVE DIRECTOR
BOARD TENURE IN YEARS: 15
COMMITTEES:Remuneration & NominationsFinance & IT
QUALIFICATIONS:Attorney, Parker Holt Attorneys [B.Proc, MBL, Admitted attorney, Conveyancer and Notary]
Mr Roger Ramsbottom (70)NON-EXECUTIVE DIRECTOR
BOARD TENURE IN YEARS: 25
COMMITTEES:AuditFinance & IT (Chair)
QUALIFICATIONS:Business Management / Chartered Accountant [CA (SA) (retired), CTA (UCT), BComm (Hons) (UCT)]
Mr Paul Slack (60)NON-EXECUTIVE DIRECTOR
BOARD TENURE IN YEARS: 13
COMMITTEES:Risk & GovernanceRemuneration & NominationsFinance & IT
QUALIFICATIONS:Chartered Accountant [B Comm (Hons) Financial Management, CA (SA)]
Mr PJ Veldhuizen (45)NON-EXECUTIVE DIRECTOR
BOARD TENURE IN YEARS: 2
COMMITTEES:Risk & Governance (Chair)Social & EthicsFinance & IT
QUALIFICATIONS:Lawyer [B Proc., Cert. Tax, LLM, MBA, Adv. Corp Law & Securities]
WP Blood Transfusion Service | Integrated Report 2016 - 2017 | 40

Dr Greg Bellairs (53)EXECUTIVE DIRECTOR
BOARD TENURE IN YEARS: 9
COMMITTEES:All committees
QUALIFICATIONS:WPBTS CEO & Medical Director [BSc, MBChB, MBA (UCT), Postgraduate Diploma in Tfn Med (UFS)]
OU
R BO
ARD
Ms Nicky du Toit (53)EXECUTIVE DIRECTOR
BOARD TENURE IN YEARS: 5
COMMITTEES:All committees
QUALIFICATIONS:WPBTS CFO and Corporate Services Director [B.Compt & Advanced Certificate in Tax]
Ms Irene van Schalkwyk (39)COMPANY SECRETARY
BOARD TENURE IN YEARS: 2
QUALIFICATIONS:WPBTS Manager: PR, Promotions and Planning; Company Secretary [B.Tech Language Practice (TUT), MBA (UFS), Company Secretarial and Governance Practice (ICSSA)]
WP Blood Transfusion Service | Integrated Report 2016 - 2017 | 41

BOARD COMMITTEES 2016/2017AUDIT COMMITTEEThe Audit Committee is required to report in terms of section 94(7)(f) of the Companies Act, Act 71 of 2008 on: • How the Committee carried out its functions;• The independence of the auditor of the company; and • Commenting on the financial statements, the accounting practices and internal
control of the company.
The Committee considers that it has adequately performed its duties in terms of its mandate, King III and the Companies Act 2008, as amended.
In line with the International Financial Reporting Standards and Corporate Governance, this Committee must ensure Risk Management Oversight and responsible and transparent assurance processes. It meets several times a year to review company financial statements, and monitor the mechanisms of financial reporting.
CompositionThe Audit Committee is comprised of three non-executive directors. The senior management dealing with the financial affairs of the company have no voting powers. Three meetings were held during the year and was also attended by the auditors, currently Ernst and Young (EY).
Mandate and responsibilitiesIn terms of its mandate, this Committee is required inter alia to:
• Review the annual financial statements of the Service.• Ensure that the financial statements are prepared in accordance with International
Financial Reporting Standards.• Review the accounting policies adopted by the Service and any changes thereto.• Consider the going concern principles and reasons for recommendation to the Board.• Make recommendations on the appointment of the external auditors and their fees.• Evaluate the independence and effectiveness of the external auditors, consider any
non-audit services by such auditors; and whether the rendering of such services would substantially affect their independence.
• Agree the annual audit plan and audit budget with External Auditors.• Review the effectiveness of management information, the annual audit and the
internal system of controls.• Monitor compliance with applicable legislation and regulatory aspects.• The Board has assessed the need for a separate Internal Audit Function. The Board’s
decision is that the organisation does not currently require this function as it mitigates its risks through a rigorous Enterprise Risk Management System and the utilisation of Combined Assurance Principles which includes the work of our External Auditors, Management Controls and Third Party and Internal operations and quality audits which are compulsory for this type of Entity.
• In addition, members of this Committee recommend the payment of the performance bonus which is based on several key performance indicators.
The Committee performed all its duties as set out above.
The external auditors have unlimited access to the chairperson of the Committee and the monthly management reports received by the executives on day-to-day matters.
The Committee is satisfied that the 2017 audit conducted by the external auditors was independent and concurs with the audit report. The auditors’ report is included in the annual financial statements which can be viewed here.
Mervyn BurtonChairman: Audit Committee
WP Blood Transfusion Service | Integrated Report 2016 - 2017 | 42

REMUNERATION AND NOMINATIONS COMMITTEEThis Committee ensures that the general remuneration strategy of the organisation is in line with industry standards. WPBTS continues to provide market-related salaries and a comprehensive benefits package, enabling us to attract and retain skilled staff. Wherever and whenever possible, we strive to appoint demographically representative staff with the appropriate skill sets. The current remuneration policy at WPBTS includes individual performance measurement and reward.
CompositionThe Remuneration Committee is comprised of four non-executive directors and the two executive directors. The executive management however, is recused from the meeting during discussions regarding their remuneration. The Committee had three meetings during the year. Issues relating to remuneration were however comprehensively addressed at full Board meetings.
Mandate and responsibilitiesThe Committee is responsible for the following:
• Determining and maintaining the remuneration philosophies of the Company.
• Approving and maintaining appropriate human resources and remuneration policies.
• Executive management succession planning.• Monitoring the implementation of relevant
labour legislation.• Monitoring transformation policies in terms
of employment equity and reporting to the Department of Labour.
• Making recommendations regarding executive directors’ remuneration to the Board.
• Approving annual mandates for salary increases.• Approving annual bonus payments in terms of
pre-approved incentive schemes.
• The Committee also recommends the remuneration of non-executive directors to the Board. Non-executive directors are remunerated for their membership of the Board and Board appointed committees.
The remuneration levels reflect the size and complexity of the company as well as the time spent in dealing with the affairs of the company. Market practices and remuneration surveys are taken into account in the determination of directors’ remuneration.
The elements of non-executive directors’ remuneration are:
• A monthly retainer.• A meeting attendance fee.• Travelling and actual expenses where applicable.
The remuneration of the directors for the year under review can be viewed here.
WPBTS’ approach is to set remuneration levels that attract, retain and motivate the appropriate calibre of directors and staff. In pursuit of the remuneration objectives the Service regularly benchmarks the existing salary bands against appropriate external remuneration levels. Further, the WPBTS requires each employee to be appraised annually against a clear set of key performance indicators (KPIs). All of the above is aimed at creating a happy yet efficient working environment in which the Service delivers safe, reliable and appropriate products into the health system.
Brian FigajiChairman: Remuneration and Nominations Committee
WP Blood Transfusion Service | Integrated Report 2016 - 2017 | 43

RISK AND GOVERNANCE COMMITTEEAcceptance and the taking on of risk is an inherent part of doing business as a company. This is not peculiar to profit companies but similarly affects not-for-profit companies. The Risk and Governance Committee is responsible for the governance of risk, for the identification of potential risk issues, compliance with good corporate governance, applicable legislation and for communication of identified risk areas to the Board.
CompositionThe Risk Committee comprises of three non-executive directors and the two executive directors. Notwithstanding the composition of the committee risks identified by executive management are frequently considered at the main Board meetings or by a round robin email and debated immediately rather than delaying decision-making by first having to serve the committee level. This, in my view, is particularly efficient.
Mandate & ResponsibilitiesKing IV defines Risk as follows:
“Risk is about the uncertainty of events; including the likelihood of such events occurring and their effect, both positive and negative, on the achievement of the organisation’s objectives. Risk includes uncertain events with a potential positive effect on the organisation (i.e. opportunities) not been captured or not materialising.”
King IV has reduced the over 70 principles in the previous King code to 17 basic principles. Part 6.3 of the King IV which should be read together with the balance of the King IV Report provides a supplement for non-profit organisations and identifies how Principles 1 – 16 should be applied in the not-for-profit company context.
Principle 11 requires that – “The governing body should govern risk in a way that supports the organisation in setting and achieving its strategic objectives.”
The Committee and, in turn, the Board considers the risk factors in the external and internal business environments and the options for meeting the risks include, but are not limited to: avoiding the risk, treating or reducing the risk, transferring the risk, tolerating the risk, exploiting the risk or terminating the activity that causes the risk. This has been specifically demonstrated in the consideration and/or decisions taken in relation to:
• The closing of the Fractionation Plant.• The age of consent for blood donors.• Training of directors and Board appraisal.• The National Blood Programme.• Rotation of directors.• The OHSA accreditation audit.• Possible transfusion transmitted infection and
medicolegal issues.
Additional Ongoing Risks• The ongoing risk in relation to the National
Health Act’s requirement for a single license transfusion service continues to pose a significant risk to the Service but ongoing communications are being held between the Service and the National Department of Health.
• Recipient risk – blood product safety.• Donor risk – regularity of donations and donor
fatigue.• Pricing pressures – cost which market will accept.• Exchange rate risk.• Blood Management System – the Service is
investigating potential suppliers.
PJ VeldhuizenChairman: Risk and Governance Committee
WP Blood Transfusion Service | Integrated Report 2016 - 2017 | 44

FINANCE AND IT STEERING COMMITTEECompositionThe Committee comprises six non-executive directors, and two executive directors. Other members are co-opted to attend meetings when required.
Mandate and responsibilitiesThe Finance and IT Committee reports to the Board on a number of matters and is therefore directly involved in the following:
• Ensuring the Service’s accountability for the proper use of funds.
• Supervising the financial position of the Service.• Financial supervision of the Service’s assets• Providing information to the Board, Risk Committee
and Audit Committee to support the overall management of IT Governance.
• Overseeing monitoring the execution of the IT strategy.
• Monitoring the execution of the IT governance arrangements as well as ensuring compliance to applicable laws, regulations, policies and standards.
• Approving and monitoring compliance to security standards and policies.
• Ensuring that all significant IT initiatives are driven to completion within time and budget and to scope.
• Ensuring that the IT strategy is updated on a regular basis and is aligned to the business strategy.
• Monitoring service levels and service improvement.
Roger RamsbottomChairman: Finance and IT Steering Committee
SOCIAL AND ETHICS COMMITTEEIn the previous Annual Report it was reported that the sub-committee was in the process of formalising the Terms of Reference/Mandate of this body, as per recommendations following an audit of the governance structures at WPBTS. The committee met in October 2016 and made recommendations which were circulated to the Board and accepted and signed off by the Chairman.
The fundamental principles of biomedical ethics should be the pillars which underpin the ethical values of the Service, namely:
• Autonomy.• Non-maleficence (at first do no harm); beneficence.• Justice - all patients to be treated justly, fairly and
equally.
Other Terms of Reference agreed were:• Monitoring Patient Blood Management programmes.• Monitoring Social & Economic development (e.g.
Employment Equity).• Promoting good corporate citizenship.• Monitoring environmental health and public safety –
specifically to investigate possible certification to ISO 1400 standards.
• Consumer relationships and compliance with Consumer Protection legislation.
• Monitor labour and employment practice.
The committee also has an important role in terms of research ethics. It was agreed that the Committee acts as a gatekeeper; referring projects for ethical approval by local institutional bioethics committees, but can also approve research projects in some circumstances.
Dr Arthur BirdChairman: Social and Ethics Committee
WP Blood Transfusion Service | Integrated Report 2016 - 2017 | 45

BOARD MEETINGSBoard meeting attendance:
Name Social & Ethics Board MeetingsAudit
Committee Meetings
Finance and IT Steering Committee
Meetings
Remuneration & Nominations
Committee Meetings
Risk & Governance Committee Meeting
Number of meetings 1 8 3 2 3 1
Non-executive directors
Dr A Bird 1 4
Mr M Burton 8 3 2 1
Mr PJ Veldhuizen 1 8 1 1
Prof V Louw 4
Prof B Figaji 8 3 3
Mr N Parker 7 1 2
Mr D Ndebele 5 2
Mr R Ramsbottom 6 2 1
Mr P Slack 6 2 3
Dr A Huggett 1 7 2
Executive directors
Dr G Bellairs 1 8 3 2 3 1
Ms N du Toit 1 8 3 2 3 1
WP Blood Transfusion Service | Integrated Report 2016 - 2017 | 46

Directors’ remuneration can be viewed in the annual financial statements and is broken down as follows:
Board Member Rates Meeting Monthly Retainer Committee Meeting
July 2016 - June 2017 R 2 233 R 446 R 1 116
Board Chair Rate Meeting Monthly Retainer Committee Meeting
July 2016 - June 2017 R 2 679 R 536 R 1 116
NON-EXECUTIVE DIRECTORS’ REMUNERATION
During this financial year, a Board Charter and Board Terms of Reference was formulated and adopted. Board self-evaluations were also conducted for the first time. The Board believes the self-assessment survey tool will identify points of improvement in order to help the Service and Board members discover their full potential.
WP Blood Transfusion Service | Integrated Report 2016 - 2017 | 47

FROM ONE HEART TO ANOTHER
Blood is transfused to the
recipient. Just one donation can save more than three
lives.

FINANCIAL STATEMENTS
9
WESTERN PROVINCE BLOOD TRANSFUSION SERVICE
Non-Profit Company Incorporated in Terms of theSouth African Companies Act 71 of 2008
(Registration Number 1943/016692/08)
ANNUAL FINANCIAL STATEMENTSFOR THE YEAR ENDED
31 MARCH 2017
APPROVAL OF ANNUAL FINANCIAL STATEMENTSThe annual financial statements set out on pages 50 to 78 were approved by the
board of directors on 24 July 2017 and are signed on its behalf on 15 August 2017 by:
.......................................... .......................................... CHAIRMAN DIRECTOR

INDEPENDENT AUDITORS’ REPORTINDEPENDENT AUDITORS’ REPORT TO THE COMMITTEE MEMBERS OF WESTERN PROVINCE BLOOD TRANSFUSION SERVICENon-Profit Company Incorporated in Terms of the South African Companies Act 71 of 2008 (Registration Number 1943/016692/08)
OPINION
We have audited the financial statements of Western Province Blood Transfusion Service set out on pages 53 to 78, which comprise the statement of financial position as at 31 March 2017, and the statement of profit or loss and other comprehensive income, statement of changes in equity and statement of cash flows for the year then ended, and notes to the financial statements, including a summary of significant accounting policies.
In our opinion, the financial statements present fairly, in all material respects, the financial position of Western Province Blood Transfusion Service as at 31 March 2017, and its financial performance and cash flows for the year then ended in accordance with International Financial Reporting Standards and the requirements of the Companies Act of South Africa.
BASIS FOR OPINION
We conducted our audit in accordance with International Standards on Auditing (ISAs). Our responsibilities under those standards are further described in the Auditor’s Responsibilities for the Audit of the Financial Statements section of our report. We are independent of the company in accordance with the Independent Regulatory Board for Auditors Code of Professional Conduct for Registered Auditors (IRBA Code), the International Ethics Standards Board for Accountants Code of Ethics for Professional Accountants (IESBA code) and other independence requirements applicable to performing the audit of Western Province Blood Transfusion Service. We have fulfilled our other ethical responsibilities in accordance with the IRBA Code, IESBA Code, and in accordance with other ethical requirements applicable to performing the audit of Western Province Blood Transfusion Service. We believe that the audit evidence we have obtained is sufficient and appropriate to provide a basis for our opinion.
OTHER INFORMATION
The directors are responsible for the other information. The other information comprises the Company Secretary’s Certificate and the Directors’ Report as required by the Companies Act of South Africa. The other information does not include the financial statements and our auditor’s report thereon.
Our opinion on the financial statements does not cover the other information and we do not express an audit opinion or any form of assurance conclusion thereon.
In connection with our audit of the financial statements, our responsibility is to read the other information and, in doing so, consider whether the other information is materially inconsistent with the financial statements or our knowledge obtained in the audit, or otherwise
appears to be materially misstated. If, based on the work we have performed, we conclude that there is a material misstatement of this other information, we are required to report that fact. We have nothing to report in this regard. RESPONSIBILITIES OF THE DIRECTORS FOR THE FINANCIAL STATEMENTS
The directors are responsible for the preparation and fair presentation of the financial statements in accordance with International Financial Reporting Standards and the requirements of the Companies Act of South Africa, and for such internal control as the directors determine is necessary to enable the preparation of financial statements that are free from material misstatement, whether due to fraud or error.
In preparing the financial statements, the directors are responsible for assessing the company’s ability to continue as a going concern, disclosing, as applicable, matters related to going concern and using the going concern basis of accounting unless the directors either intend to liquidate the company or to cease operations, or have no realistic alternative but to do so.
AUDITOR’S RESPONSIBILITIES FOR THE AUDIT OF THE FINANCIAL STATEMENTS
Our objectives are to obtain reasonable assurance about whether the financial statements as a whole are free from material misstatement, whether due to fraud or error, and to issue an auditor’s report that includes our opinion. Reasonable assurance is a high level of assurance, but is not a guarantee that an audit conducted in accordance with ISAs will always detect a material misstatement when it exists. Misstatements can arise from fraud or error and are considered material if, individually or in the aggregate, they could reasonably be expected to influence the economic decisions of users taken on the basis of these financial statements.
As part of an audit in accordance with ISAs, we exercise professional judgement and maintain professional scepticism throughout the audit. We also:
• Identify and assess the risks of material misstatement of the financial statements, whether due to fraud or error, design and perform audit procedures responsive to those risks, and obtain audit evidence that is sufficient and appropriate to provide a basis for our opinion. The risk of not detecting a material misstatement resulting from fraud is higher than for one resulting from error, as fraud may involve collusion, forgery, intentional omissions, misrepresentations, or the override of internal control.
• Obtain an understanding of internal control relevant to the audit in order to design audit procedures that
WP Blood Transfusion Service | Integrated Report 2016 - 2017 | 50
are appropriate in the circumstances, but not for the purpose of expressing an opinion on the effectiveness of the company’s internal control.
• Evaluate the appropriateness of accounting policies used and the reasonableness of accounting estimates and related disclosures made by the directors.
• Conclude on the appropriateness of the directors’ use of the going concern basis of accounting and based on the audit evidence obtained, whether a material uncertainty exists related to events or conditions that may cast significant doubt on the company’s ability to continue as a going concern. If we conclude that a material uncertainty exists, we are required to draw attention in our auditor’s report to the related disclosures in the financial statements or, if such disclosures are inadequate, to modify our opinion. Our conclusions are based on the audit evidence obtained up to the date of our auditor’s report. However, future events or conditions may cause the company to cease to continue as a going concern.
• Evaluate the overall presentation, structure and content of the financial statements, including the disclosures, and whether the financial statements represent the underlying transactions and events in a manner that achieves fair presentation.
We communicate with the directors regarding, among other matters, the planned scope and timing of the audit and significant audit findings, including any significant deficiencies in internal control that we identify during our audit.
Ernst & Young Inc.Director: Pierre du PlessisRegistered AuditorChartered Accountant (SA)Cape Town
15 August 2017
WP Blood Transfusion Service | Integrated Report 2016 - 2017 | 51
BUSINESS AND OPERATIONS
The principal activity of the Western Province Blood Transfusion Service is the collection, testing, processing and distribution of blood products and services.
CORPORATE STRUCTURE
Western Province Blood Transfusion Service was incorporated as an association not for gain in 1943 in terms of Section 21 of the previous Companies Act, 1973. The company continues to exist and in terms of Schedule Transitional Arrangement of the Companies Act, 2008, the company is deemed to have been incorporated and registered under Section 8 of the said Act as a non-profit company, with at least one of its objects being a public benefit social activities, or communal interests.
RESULTS FOR THE YEAR
The results of operations for the year are set out in the attached Statement of Comprehensive Income which reflects a profit of R2.9 million for the year ended 31 March 2017 (2016: R17.3 million loss).
CAPITAL COMMITMENTS
In keeping with the Western Province Blood Transfusion Service’s mission statement, the company continues investing in technical equipment to maintain its standards. Expected total capital expenditure for the next year is R24.1 million.
DIRECTORS AND COMPANY SECRETARY
Particulars of the present directors and secretary are given on page 8.
EMPLOYMENT EQUITY
The employment equity plan was originally developed in consultation with Protusa and is currently being monitored in consultation with Public Servants Association of South Africa, the Union which now represents the majority of the workforce. The action over the past three years has focused on maintaining or improving the ratios which have been achieved.
As at 1 October 2016, the date of the last employment equity submission, the Service employed 511 permanent and 10 casual/temporary employees. As at the date of the last submission, 79% of permanent employees were from the black designated group and 62% were female. Of the 17 employees in management, 35% were from the black designated group and 65% were female.
NATIONAL BLOOD TRANSFUSION LICENCE
Section 53 of the National Health Act was signed by the Office of the Presidency in June 2009. The Act makes
provision for a single licence for a single blood transfusion service in South Africa.
Draft regulations for blood and blood products were published for comment during 2011. SANBS, NBI and WPBTS submitted recommendations in June 2011. The regulations published in early 2012 did not include several of our recommendations, and a response was subsequently sent to the National Department of Health. Official feedback is awaited.
Legal opinion remains that the Act cannot be currently enforced, and that WPBTS is currently operating legally based on pre-existing licensing under the Human Tissues Act. WPBTS continues to cooperate with SANBS and the National Department of Health and remains committed to a solution that best serves regional and national blood transfusion requirements.
EVENTS SUBSEQUENT TO THE YEAR END
During December 2016, with the approval of the Board, the property situated at Connaught Road, Beaconvale, Parow, was placed on the open market for sale. Subsequent to financial year-end of 31 March 2017 and prior to the approval of the financial statements the directors received a binding offer on 16 May 2017 for the sale of the Fractionation Plant amounting to R7 million, which includes the land, building and related assets. The board carefully considered the impact of this offer on the valuation of the property at year end. This is a non-adjusting post balance sheet event as at balance sheet date the directors believed that the Property Plant and Equipment was appropriately valued. The rationale for accepting this offer on 29 May 2017 was based mainly on the fact that the prospective purchaser has committed to renting a portion of the premises at a favourable rate per square metre for the following 36 months. Although the sale results in a loss to the Service, the directors deemed this a reasonable offer considering the given soft rental offer from the prospective purchaser.
COMPANY SECRETARY’S CERTIFICATE
In my capacity as Company Secretary, I hereby certify, in terms of the Companies Act, that for the period ended 31 March 2017, the company has lodged with the Registrar of Companies all such returns as are required of a private company in terms of this Act, and that all such returns are, to the best of my knowledge and belief, true, correct and up to date.
…………………………………….Irene van Schalkwyk15 August 2017
DIRECTORS’ REPORTDIRECTORS’ REPORT FOR THE YEAR ENDED 31 MARCH 2017Non-Profit Company Incorporated in Terms of the South African Companies Act 71 of 2008 (Registration Number 1943/016692/08)
WP Blood Transfusion Service | Integrated Report 2016 - 2017 | 52

Note 2017R
2016R
ASSETS
Non-current assets
Property, plant and equipment 8 90 075 684 103 997 617
Investments 9 15 784 978 15 534 933
105 860 662 119 532 550
Current assets
Inventory 11 38 076 122 33 334 719
Trade and other receivables 12 47 940 519 39 632 860
Cash and cash equivalents 13 30 862 049 21 427 616
116 878 690 94 395 195
Non-current assets held for sale
Assets held-for-sale 10 10 471 981 -
10 471 981 -
Total assets 233 211 333 213 927 745
EQUITY AND LIABILITIES
Accumulated funds 111 473 527 109 395 718
Revaluation reserve 14 34 545 173 43 626 973
Non-current asset held for sale 10 9 081 800 -Non-distributable reserves 15 2 282 262 2 224 787
Product liability reserve 16 6 940 271 6 144 890
Actuarial gain/loss reserve 22 (64 000) (64 000)
164 259 033 161 328 368
Non-current liabilities
Post-retirement medical benefits 22 2 069 000 2 015 000
Interest bearing liabilities 23 765 134 -2 834 134 2 015 000
Current liabilities
Interest bearing liabilities 23 243 330 -FEC liability 24.5 2 535 330 4 301 378
Operating lease liability 24.4 260 070 265 350
Trade and other payables 17 37 817 205 29 198 223
Provisions 18 25 262 231 16 819 426
66 118 166 50 584 377
Total equity and liabilities 233 211 333 213 927 745
STATEMENT OF FINANCIAL POSITIONAT 31 MARCH 2017
WP Blood Transfusion Service | Integrated Report 2016 - 2017 | 53
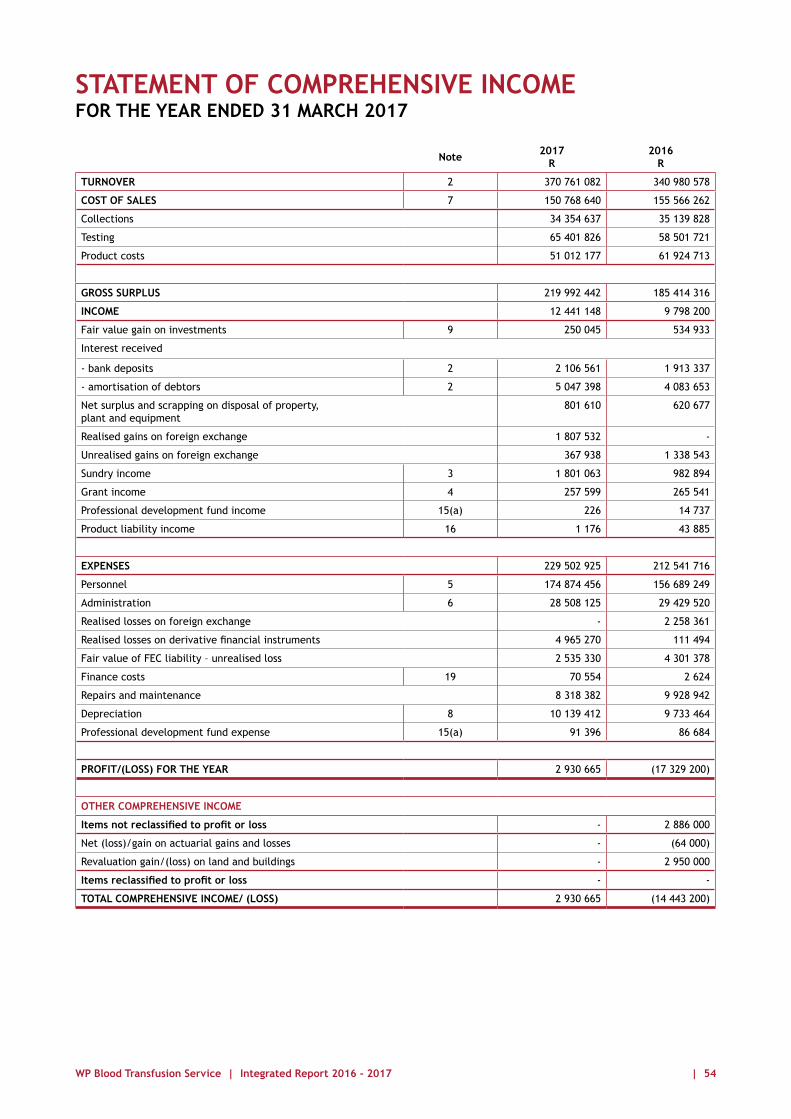
STATEMENT OF COMPREHENSIVE INCOMEFOR THE YEAR ENDED 31 MARCH 2017
Note 2017R
2016R
TURNOVER 2 370 761 082 340 980 578
COST OF SALES 7 150 768 640 155 566 262
Collections 34 354 637 35 139 828
Testing 65 401 826 58 501 721
Product costs 51 012 177 61 924 713
GROSS SURPLUS 219 992 442 185 414 316
INCOME 12 441 148 9 798 200
Fair value gain on investments 9 250 045 534 933
Interest received
- bank deposits 2 2 106 561 1 913 337
- amortisation of debtors 2 5 047 398 4 083 653
Net surplus and scrapping on disposal of property, plant and equipment
801 610 620 677
Realised gains on foreign exchange 1 807 532 -
Unrealised gains on foreign exchange 367 938 1 338 543
Sundry income 3 1 801 063 982 894
Grant income 4 257 599 265 541
Professional development fund income 15(a) 226 14 737
Product liability income 16 1 176 43 885
EXPENSES 229 502 925 212 541 716
Personnel 5 174 874 456 156 689 249
Administration 6 28 508 125 29 429 520
Realised losses on foreign exchange - 2 258 361
Realised losses on derivative financial instruments 4 965 270 111 494
Fair value of FEC liability – unrealised loss 2 535 330 4 301 378
Finance costs 19 70 554 2 624
Repairs and maintenance 8 318 382 9 928 942
Depreciation 8 10 139 412 9 733 464
Professional development fund expense 15(a) 91 396 86 684
PROFIT/(LOSS) FOR THE YEAR 2 930 665 (17 329 200)
OTHER COMPREHENSIVE INCOME
Items not reclassified to profit or loss - 2 886 000
Net (loss)/gain on actuarial gains and losses - (64 000)
Revaluation gain/(loss) on land and buildings - 2 950 000
Items reclassified to profit or loss - -
TOTAL COMPREHENSIVE INCOME/ (LOSS) 2 930 665 (14 443 200)
WP Blood Transfusion Service | Integrated Report 2016 - 2017 | 54

STATEMENT OF CHANGES IN EQUITYFOR THE YEAR ENDED 31 MARCH 2017
Note
Non-distributable
reservesR
Revaluation reserve
R
Non-current asset held
for saleR
Product liability reserve
R
Actuarial gains/losses
reserveR
Accumulatedfunds
RTotal
R
Balance at 31 March 2015 2 296 734 40 676 973 - 6 101 005 - 126 696 856 175 771 568
Profit/(loss) for the year - - - - - (17 329 200) (17 329 200)
Other comprehensive income 14/22 - 2 950 000 - - (64 000) - 2 886 000
Transfer to/from non- distributable reserves 15(a) (71 947) - - - - 71 947 -
Transfer to product liability reserve
16 - - - 43 885 - (43 885) -
Balance at 31 March 2016 2 224 787 43 626 973 - 6 144 890 (64 000) 109 395 718 161 328 368
Profit for the year - - - - - 2 930 665 2 930 665
Other comprehensive income 14/22 - - - - - - -
Transfer to non-distributable reserves 15(a) 57 475 - - - - (57 475) -
Transfer to product liability reserve 16 - - - 795 381 - (795 381) -
Transfer from revaluation reserve - (9 081 800) 9 081 800 - - - -
Balance at 31 March 2017 2 282 262 34 545 173 9 081 800 6 940 271 (64 000) 111 473 527 164 258 033
Note 2017R
2016R
CASH FLOWS FROM OPERATING ACTIVITIES
Cash generated by operations (i) 5 997 481 1 210 922Interest received 5 047 398 4 083 653Working capital movements (ii) 2 241 397 (4 156 958)Cash generated by operating activities 13 286 276 1 137 617Finance Cost (70 554) (2 624)Net cash inflow from operating activities 13 215 722 1 134 993
CASH FLOWS FROM INVESTING ACTIVITIES
Acquisition of property, plant and equipment (iii) (8 064 884) (10 976 051)Acquisition of investments - (15 534 933)Proceeds on disposal of property, plant and equipment (iv) 2 177 034 1 398 687Interest received 2 106 561 2 448 270Net cash outflow from investing activities (3 781 289) (22 664 027)
Net movement in cash and cash equivalents for the year 9 434 433 (21 529 034)Cash and cash equivalents at beginning of year (v) 21 427 616 42 956 650Cash and cash equivalents at end of year (v) 30 862 049 21 427 616
STATEMENT OF CASH FLOWSFOR THE YEAR ENDED 31 MARCH 2017
WP Blood Transfusion Service | Integrated Report 2016 - 2017 | 55

2017R
2016R
(i) Cash generated by operations
Profit/(loss) for the year 2 930 665 (17 329 200)
Adjustment for:
Impairment of inventory - 15 931 634
Finance costs 70 554 2 624
Depreciation 10 139 412 9 733 464
Post-retirement medical benefits 54 000 25 000
Interest bearing liabilities 1 008 464 -
Surplus on disposal of property, plant and equipment (801 610) (620 677)
Interest received (7 153 959) (6 531 923)
Fair value gain on investments (250 045) -
5 997 481 1 210 922
(ii) Working capital movements
Inventory (4 741 403) (498 564)
Trade and other receivables (8 307 659) (1 855 136)
Trade and other payables 8 618 982 (837 304)
Movement in FEC liability/(asset) (1 766 048) 4 436 705
Movement in operating lease liability (5 280) 265 350
Movement in provisions 8 442 805 (5 668 009)
2 241 397 (4 156 958)
(iii) Acquisition of property, plant and equipment
Land and buildings - 513 907
Technical equipment 2 895 564 4 900 406
Computer equipment and software 1 722 605 593 510
Office furniture and equipment 591 068 892 108
Motor vehicles 2 855 647 4 076 120
8 064 884 10 976 051
(iv) Proceeds on disposal of property, plant and equipment
Book value of assets disposed of 1 375 424 778 010
Surplus on disposal 801 610 620 677
2 177 034 1 398 687
(v) Cash and cash equivalents comprise:
Cash at bank and on hand 30 862 049 21 427 616
NOTES TO THE STATEMENT OF CASH FLOWSFOR THE YEAR ENDED 31 MARCH 2017
WP Blood Transfusion Service | Integrated Report 2016 - 2017 | 56

1.1 BASIS OF PREPARATION
The financial statements for the year ended 31 March 2017 are prepared in accordance with International Financial Reporting Standards (“IFRS”).
The company’s presentation currency is South African Rands.
1.2 PROPERTY, PLANT AND EQUIPMENT
Technical equipment, motor vehicles, office furniture and equipment are stated at cost and are depreciated on a straight line basis at rates considered appropriate to write down each asset to its estimated residual value over the term of its expected useful life at the following rates:
Buildings 2% per annum
Technical equipment 2,56% -33,33%% per annum
Motor vehicles
- Administration 16,67% - 25% with 20% residual value
- Service 16,67% with 10% residual value
Office furniture and equipment 3,33% - 33,33% per annum
Owner-occupied property is stated at revalued amount and is depreciated on the straight line basis at rates considered appropriate to write down each asset to its estimated residual value over the term of its expected useful life. Property is revalued externally to open market value every three years or more regularly if required so that the carrying value is not materially different from the fair value. Any surplus on valuation, in excess of net book value, is recognised as a revaluation gain in other comprehensive income. Deficits on revaluation are charged against OCI only to the extent that the deficit is less than the amount held in the revaluation reserve in respect of that same asset. Any accumulated depreciation on buildings is eliminated on revaluation. Any balance in the revaluation reserve is not released to the accumulated surplus as the underlying asset is depreciated. Instead, the balance in the revaluation reserve is transferred to accumulated funds on de-recognition of the underlying asset. Land is not depreciated.
Surpluses and losses on disposal of property, plant and equipment are recorded in the statement of comprehensive income.
The carrying values of property, plant and equipment are reviewed for impairment when events or changes in circumstances indicate the carrying value may not be recoverable. If any such indication exists and where the carrying values exceed the estimated recoverable amount, the assets or cash-generating units are written down to
their recoverable amount. The recoverable amount of property, plant and equipment is the greater of fair value less costs to sell and value in use.
The estimated useful lives, residual values and depreciation methods are reviewed at each year end with the effect of any changes in estimate accounted for on a prospective basis.
1.3 LEASES
A lease is classified at the inception date as a finance lease or an operating lease. A lease that transfers substantially all the risks and rewards incidental to ownership to the Service is classified as a finance lease.
Finance leases are capitalised at the commencement of the lease at the inception date fair value of the leased property or, if lower, at the present value of the minimum lease payments. Lease payments are apportioned between finance charges and reduction of the lease liability so as to achieve a constant rate of interest on the remaining balance of the liability. Finance charges are recognised in finance costs in the statement of comprehensive income.
A leased asset is depreciated over the useful life of the asset. However, if there is no reasonable certainty that the Service will obtain ownership by the end of the lease term, the asset is depreciated over the shorter of the estimated useful life of the asset and the lease term.
An operating lease is a lease other than a finance lease. Operating lease payments are recognised as an operating expense in the statement of comprehensive income on a straight-line basis over the lease term.
LessorLeases in which the Service does not transfer substantially all the risks and rewards of ownership of an asset are classified as operating leases. Initial direct costs incurred in negotiating and arranging an operating lease are added to the carrying amount of the leased asset and recognised over the lease term on the same basis as rental income. Contingent rents are recognised as revenue in the period in which they are earned.
1.4 PROVISIONS
Provisions are recognised where the Service has a present legal or constructive obligation as a result of a past event, a reliable estimate of the obligation can be made and it is probable that an outflow of resources embodying economic benefits will be required to settle the obligation.
NOTES TO THE FINANCIAL STATEMENTSAT 31 MARCH 2017
1 ACCOUNTING POLICIES
WP Blood Transfusion Service | Integrated Report 2016 - 2017 | 57

1.5 INVENTORY
Inventory is valued at the lower of cost and net realisable value.
Cost is determined as follows:• Blood packs, accessories, packaging materials,
filtration stocks, chemicals, reagents, testing kits, raw materials and consumables on the weighted average cost basis.
• Blood stocks, fractionated plasma, in process products and finished goods on the weighted average cost basis.
• Obsolete or slow moving inventory is identified and provision made where appropriate.
Net realisable value is the estimated selling price in the ordinary course of business, less estimated costs of completion and the estimated costs necessary to make the sale.
1.6 REVENUE RECOGNITION
Revenue is recognised to the extent that it is probable that the economic benefits will flow to the Service and the revenue can be reliably measured, regardless of when payment is being made. Revenue is measured at the fair value of the consideration received or receivable and represents the amounts receivable for goods and services provided in the normal course of business, net of trade discounts and volume rebates, and value added tax.
Sales of goodsRevenue from the sale of goods is recognised when the significant risks and rewards of ownership of the goods have passed to the buyer, usually on delivery of the goods.
Revenue from the sale of goods is recognised when all the following conditions have been satisfied:• the Service has transferred to the buyer the significant
risks and rewards of ownership of the goods;• the Service retains neither continuing managerial
involvement to the degree usually associated with ownership nor effective control over the goods sold;
• it is probable that the economic benefits associated with the transaction will flow to the Service; and
• the costs incurred or to be incurred in respect of the transaction can be measured reliably.
Finance incomeInterest is recognised, in profit or loss, using the effective interest rate method.
Project specific funding including Grant incomeProject specific funding including Grant income is recognised when probable that receipt will occur at the fair value of what is received. These funds are received for specific purposes and require WPBTS to comply with specific conditions attached to the funding.
The only income that the Training Department potentially receives, is the return on the Skills levy.
As per legislation, the Service pays a 1% levy on the total monthly salary bill. In order to receive a partial refund, the Skills Development Facilitator has to develop a work place skills plan. If this plan is approved by the Health
& Welfare Seta, WPBTS potentially receives 20% of the annual levy back which is payable in quarterly payments.
1.7 RETIREMENT BENEFITS
Defined contribution and benefit plansThe Service provides retirement benefits for its employees through a defined contribution plan.
Contributions by the Service to the defined contribution plan are recognised as an expense in the year in which the related services are rendered by employees.
Post-retirement medical benefitsThe cost arising in respect of post-retirement medical aid benefits is charged to profit or loss as incurred. The Service has an obligation to provide certain post-retirement medical aid benefits to certain employees and pensioners. The present value of future medical aid subsidies for past service is actuarially determined in accordance with IAS 19 – Employee benefits. The cost of provided benefits under the plan is determined using the projected unit credit valuation method. Actuarial gains and losses are recognised immediately and are taken directly to other comprehensive income in the year in which they arose. Any curtailment benefits or settlement amounts are recognised against income as incurred.
1.8 SIGNIFICANT ACCOUNTING JUDGMENTS, ESTIMATES AND ASSUMPTIONS
JudgementsIn the process of applying the Service accounting policies, management has made the following judgments, apart from those involving estimations, which have the most significant effect on the amounts recognised in the financial statements.
Depreciation rates and useful lifeProperty, plant and equipment are depreciated on a straight line basis over the expected useful lives of the various classes of assets, after taking into account residual values.
Estimation and assumptionsThe key assumptions concerning the future and other key sources of estimation uncertainty at the reporting date, that have a significant risk of causing a material adjustment to the carrying amounts of assets and liabilities within the next financial year are discussed below.
Revaluation of property, plant and equipmentThe Service engaged an independent valuation specialist to assess fair value as at 31 March 2016 for revalued land and buildings. It measures land and buildings at revalued amounts with changes in fair value being recognised in OCI. Land and buildings were valued by reference to market-based evidence, using comparable prices adjusted for specific market factors such as nature, location and condition of the property. The key assumptions used to determine the fair value of the properties and sensitivity analyses are provided in Note 23.
Fair value measurement of financial instrumentsWhen the fair values of financial assets and financial liabilities recorded in the statement of financial position
NOTES TO THE FINANCIAL STATEMENTS AT 31 MARCH 2017 (CONTINUED)
WP Blood Transfusion Service | Integrated Report 2016 - 2017 | 58

cannot be measured based on quoted prices in active markets, their fair value is measured using valuation techniques including the discounted cash flow (DCF) model. The inputs to these models are taken from observable markets where possible, but where this is not feasible, a degree of judgement is required in establishing fair values. Judgements include considerations of inputs such as liquidity risk, credit risk and volatility. Changes in assumptions relating to these factors could affect the reported fair value of financial instruments. See Note 24 for further disclosures.
Impairment of financial assetsAn allowance for the impairment loss is made against trade receivable accounts that in the estimation of management may be impaired. The impairment is assessed monthly with a detailed review of balances conducted at the reporting date. Determining the recoverability of an account involves estimation as to the likely financial condition of the customer and their ability to make payment.
Impairment of non-financial assetsThe carrying value of the company’s assets is reviewed at each statement of financial position date to determine whether there is any indication of impairment. If any such indication exists, the asset’s recoverable amount is estimated. The recoverable amount is the greater of the fair value less costs to sell and the value in use. An impairment loss is recognised whenever the carrying amount of an asset or its cash-generating unit exceeds its recoverable amount. Impairment losses are recognised in the statement of profit or loss.
1.9 FINANCIAL INSTRUMENTS
Classification
The Service classifies its financial instruments into the following categories:• Financial assets or liabilities at fair value through
profit or loss• Loans and receivables/loans and borrowings
Classification depends on the purpose for which the financial instruments were obtained/incurred and takes place at initial recognition.
Financial assets
Initial recognition and measurementFinancial assets are classified, at initial recognition, as financial assets at fair value through profit or loss or loans and receivables. All financial assets are recognised initially at fair value plus, in the case of financial assets not recorded at fair value through profit or loss, transaction costs that are attributable to the acquisition of the financial asset.
Subsequent measurement
Financial assets at fair value through profit or lossFinancial assets at fair value through profit or loss are carried in the statement of financial position at fair value with net changes in fair value presented as fair value gain or fair value loss in the statement of profit or loss.
Loans and receivablesLoans and receivables are non-derivative financial assets with fixed or determinable payments that are not quoted in an active market. After initial measurement, such financial assets are subsequently measured at amortised cost using the effective interest rate (EIR) method, less impairment. Impairment of financial assets
At each reporting date the company assesses all financial assets, other than those at fair value through profit or loss, to determine whether there is objective evidence that a financial asset or group of financial assets has been impaired. An impairment exists if one or more events that has occurred since the initial recognition of the asset (an incurred ‘loss event’), has an impact on the estimated future cash flows of the financial asset or the group of financial assets that can be reliably estimated.
Evidence of impairment may include indications that the debtors or a group of debtors is experiencing significant financial difficulty, default or delinquency in interest or principal payments, the probability that they will enter bankruptcy or other financial reorganisation and observable data indicating that there is a measurable decrease in the estimated future cash flows, such as changes in arrears or economic conditions that correlate with defaults.
Impairment losses are recognised in the statement of profit or loss.
Impairment losses are reversed when an increase in the financial asset’s recoverable amount can be related objectively to an event occurring after the impairment was recognised, subject to the restriction that the carrying amount of the financial asset at the date that the impairment is reversed shall not exceed what the carrying amount would have been had the impairment not been recognised.
Reversals of impairment losses are recognised in the statement of profit or loss.
Financial assets carried at amortised costFor financial assets carried at amortised cost, the Service first assesses whether impairment exists individually for financial assets that are individually significant, or collectively for financial assets that are not individually significant. If the Service determines that no objective evidence of impairment exists for an individually assessed financial asset, whether significant or not, it includes the asset in a group of financial assets with similar credit risk characteristics and collectively assesses them for impairment. Assets that are individually assessed for impairment and for which an impairment loss is, or continues to be, recognised are not included in a collective assessment of impairment.
For certain categories of financial assets, such as trade receivables, assets that are assessed not to be impaired individually are subsequently assessed for impairment on a collective basis. Objective evidence of impairment for a portfolio of receivables could include the company’s
NOTES TO THE FINANCIAL STATEMENTS AT 31 MARCH 2017 (CONTINUED)
WP Blood Transfusion Service | Integrated Report 2016 - 2017 | 59

past experience of collecting payments, an increase in the number of delayed payments in the portfolio past the average credit year, as well as observable changes in national or local economic conditions that correlate with default on receivables.
For financial assets carried at amortised cost, the amount of the impairment is the difference between the asset’s carrying amount and the present value of estimated future cash flows, discounted at the financial asset’s original effective interest rate. The carrying amount of the financial asset is reduced by the impairment loss directly for all financial assets with the exception of trade receivables, where the carrying amount is reduced through the use of an allowance account.
When a trade receivable is considered uncollectable, it is written off against the allowance account. Subsequent recoveries of amounts previously written off are credited to profit or loss. Changes in the carrying amount of the allowance account are recognised in the statement of profit or loss.
Derecognition
A financial asset (or, where applicable, a part of a financial asset or part of a group of similar financial assets) is primarily derecognised when: • The rights to receive cash flows from the asset have
expired, or• The Service has transferred its rights to receive cash
flows from the asset or has assumed an obligation to pay the received cash flows in full without material delay to a third party under a ‘pass-through’ arrangement; and eithera) the Service has transferred substantially all the
risks and rewards of the asset, or b) the Service has neither transferred nor retained
substantially all the risks and rewards of the asset, but has transferred control of the asset
When the Service has transferred its rights to receive cash flows from an asset or has entered into a pass through arrangement, it evaluates if, and to what extent, it has retained the risks and rewards of ownership. When it has neither transferred nor retained substantially all of the risks and rewards of the asset, nor transferred control of the asset, the Service continues to recognise the transferred asset to the extent of its continuing involvement. In that case, the Service also recognises an associated liability. The transferred asset and the associated liability are measured on a basis that reflects the rights and obligations that the Service has retained.
Financial liabilities
Initial recognition and measurementFinancial liabilities are classified, at initial recognition, as financial liabilities at fair value through profit or loss, loans and borrowings or payables.
All financial liabilities are recognised initially at fair value and, in the case of loans and borrowings and payables, net of directly attributable transaction costs.
The Service’ financial liabilities include trade and other payables, loans and borrowings including bank overdrafts, financial guarantee contracts and derivative financial instruments.
Subsequent measurementThe measurement of financial liabilities depends on their classification, as described below:
Financial liabilities at fair value through profit or lossFinancial liabilities at fair value through profit or loss include financial liabilities held for trading and financial liabilities designated upon initial recognition as at fair value through profit or loss.
Financial liabilities designated upon initial recognition at fair value through profit or loss are designated at the initial date of recognition, and only if the criteria in IAS 39 are satisfied. The Service has not designated any financial liability as at fair value through profit or loss.
Loans and borrowingsAfter initial recognition, interest-bearing loans and borrowings are subsequently measured at amortised cost using the EIR method. Gains and losses are recognised in profit or loss when the liabilities are derecognised as well as through the EIR amortisation process.
Amortised cost is calculated by taking into account any discount or premium on acquisition and fees or costs that are an integral part of the EIR. The EIR amortisation is included as finance costs in the statement of profit or loss.
DerecognitionA financial liability is derecognised when the obligation under the liability is discharged or cancelled or expires. When an existing financial liability is replaced by another from the same lender on substantially different terms, or the terms of an existing liability are substantially modified, such an exchange or modification is treated as the derecognition of the original liability and the recognition of a new liability. The difference in the respective carrying amounts is recognised in the statement of profit or loss.
1.10 TRANSLATION OF FOREIGN CURRENCIES
Transactions in foreign currencies are initially recorded by the Service at the spot rate at the date the transaction first qualifies for recognition. Monetary assets and liabilities denominated in foreign currencies are translated at the spot rate at the reporting date. Differences arising on settlement or translation of monetary items are recognised in profit or loss.
1.11 NON-CURRENT ASSETS HELD FOR SALE
Non-current assets classified as held for sale are measured
NOTES TO THE FINANCIAL STATEMENTS AT 31 MARCH 2017 (CONTINUED)
WP Blood Transfusion Service | Integrated Report 2016 - 2017 | 60

at the lower of their carrying amount and fair value less costs to sell. Non-current assets are classified as held for sale if their carrying amounts will be recovered principally through a sale transaction rather than through continuing use. This condition is regarded as met only when the sale is highly probable and the asset or disposal group is available for immediate sale in its present condition, management has committed to the sale, and the sale is expected to have been completed within one year from the date of classification.
1.12 NEW STANDARDS AND INTERPRETATIONS
1.12.1 Standards and interpretations effective and adopted in the current year
In the current year, the company has adopted the following standards and interpretations that are effective for the current financial year and that are relevant to its operations:
IAS 1 Disclosure Initiative – Amendments to IAS 1Effective for annual periods beginning on or after 1 January 2016.
The amendments to IAS 1 Presentation of Financial Statements clarify, rather than significantly change, the existing IAS 1 requirements.
The amendments clarify:• The materiality requirements in IAS 1• That specific line items in the statement(s) of profit
or loss and OCI and the statement of financial position may be disaggregated
• That entities have flexibility as to the order in which they present the notes to financial statements
• That the share of OCI of associates and joint ventures accounted for using the equity method must be presented in aggregate as a single line item, and classified between those items that will or will not be subsequently reclassified to profit or loss
Furthermore, the amendments clarify the requirements that apply when additional subtotals are presented in the statement of financial position and the statement(s) of profit or loss and OCI.
This amendment was considered however did not have an impact on the company’s audited financial statements.
IAS 16 and IAS 38 Clarification of Acceptable methods of Depreciation and Amortisation –Amendments to IAS 16 and IAS 38Effective for annual periods beginning on or after 1 January 2016.
The amendments clarify the principle in IAS 16 Property, Plant and Equipment and IAS 38 Intangible Assets that revenue reflects a pattern of economic benefits that are generated from operating a business (of which the asset is part) rather than the economic benefits that are consumed through use of the asset. As a result, the ratio of revenue generated to total revenue expected to be generated cannot be used to depreciate property, plant and equipment and may only be used in very limited circumstances to amortise intangible assets.
This amendment was considered however did not have an impact on the company’s audited financial statements.
All other amendments did not have a material impact on the entity’s annual financial statements, the Service will adopt these standards and amendment in the first accounting period when they become effective.
1.12.2 Standards and Interpretations not yet effective
The company has chosen not to early adopt the following standards and interpretations, which have been published and are mandatory for the company’s accounting periods beginning on or after 1 April 2016 or later periods.
IFRS 9 Financial InstrumentsEffective for annual periods beginning on or after 1 January 2018.
Classification and measurement of financial assetsAll financial assets are measured at fair value on initial recognition, adjusted for transaction costs, if the instrument is not accounted for at fair value through profit or loss (FVTPL).
Debt instruments are subsequently measured at FVTPL, amortised cost, or fair value through other comprehensive income (FVOCI), on the basis of their contractual cash flows and the business model under which the debt instruments are held. There is a fair value option (FVO) that allows financial assets on initial recognition to be designated as FVTPL if that eliminates or significantly reduces an accounting mismatch.
Equity instruments are generally measured at FVTPL. However, entities have an irrevocable option on an instrument-by instrument basis to present changes in the fair value of non-trading instruments in other comprehensive income (OCI) without subsequent reclassification to profit or loss.
ImpairmentThe impairment requirements are based on an expected credit loss (ECL) model that replaces the IAS 39 incurred loss model.
The standard is expected to have a material impact on the Service’s financial statements, but the exact impact is still to be determined.
IFRS 15 Revenue from Contracts with CustomersEffective for annual periods beginning on or after 1 January 2018.
IFRS 15 replaces all existing revenue requirements in IFRS (IAS 11 Construction Contracts, IAS 18 Revenue, IFRIC 13 Customer Loyalty Programmes, IFRIC 15 Agreements for the Construction of Real Estate, IFRIC 18 Transfers of Assets from Customers and SIC 31 Revenue – Barter Transactions Involving Advertising Services) and applies to all revenue arising from contracts with customers, unless the contracts are in the scope of other standards, such as IAS 17. Its requirements also provide a model for the recognition and measurement of gains and losses on disposal of certain non-financial assets, including property, equipment and intangible assets.
NOTES TO THE FINANCIAL STATEMENTS AT 31 MARCH 2017 (CONTINUED)
WP Blood Transfusion Service | Integrated Report 2016 - 2017 | 61

The standard outlines the principles an entity must apply to measure and recognise revenue. The core principle is that an entity will recognise revenue at an amount that reflects the consideration to which the entity expects to be entitled in exchange for transferring goods or services to a customer.
The principles in IFRS 15 will be applied using a five-step model:1. Identify the contract(s) with a customer2. Identify the performance obligations in the contract3. Determine the transaction price4. Allocate the transaction price to the performance
obligations in the contract5. Recognise revenue when (or as) the entity satisfies a
performance obligation
The standard requires entities to exercise judgement, taking into consideration all of the relevant facts and circumstances when applying each step of the model to contracts with their customers.
The standard also specifies how to account for the incremental costs of obtaining a contract and the costs directly related to fulfilling a contract. Application guidance is provided in IFRS 15 to assist entities in applying its requirements to certain common arrangements, including licences of intellectual property, warranties, rights of return, principal-versus-agent considerations, options for additional goods or services and breakage.
The standard is expected to have a material impact on the Service’s financial statements, but the exact impact is still to be determined.
IFRS 16 LeasesEffective for annual periods beginning on or after 1 January 2019.
The scope of IFRS 16 includes leases of all assets, with certain exceptions. A lease is defined as a contract, or part of a contract, that conveys the right to use an asset (the underlying asset) for a period of time in exchange for consideration.
IFRS 16 requires lessees to account for all leases under a single on-balance sheet model in a similar way to finance leases under IAS 17. The standard includes two recognition exemptions for lessees – leases of ’low-value’ assets (e.g., personal computers) and short-term leases (i.e., leases with a lease term of 12 months or less). At the commencement date of a lease, a lessee will recognise a liability to make lease payments (i.e., the lease liability) and an asset representing the right to use the underlying asset during the lease term (i.e., the right-of-use asset).
Lessees will be required to separately recognise the interest expense on the lease liability and the depreciation expense on the right-of-use asset. Lessees will be required to re-measure the lease liability upon the occurrence of certain events (e.g., a change in the lease term, a change in future lease payments resulting from a change in an index or rate used to determine those payments). The lessee will generally recognise the amount of the re-measurement of the lease liability as an adjustment to the right-of-use asset.
Lessor accounting is substantially unchanged from today’s accounting under IAS 17. Lessors will continue to classify all leases using the same classification principle as in IAS 17 and distinguish between two types of leases: operating and finance leases.
The standard is expected to have a material impact on the Service’s financial statements, but the exact impact is still to be determined.
IAS 7 Disclosure Initiative – Amendments to IAS 7Effective for annual periods beginning on or after 1 January 2017.
The amendments to IAS 7 Statement of Cash Flows are part of the IASB’s Disclosure Initiative and require an entity to provide disclosures that enable users of financial statements to evaluate changes in liabilities arising from financing activities, including both changes arising from cash flows and non-cash changes.
All other amendments and new standards are not expected to have a material impact.
NOTES TO THE FINANCIAL STATEMENTS AT 31 MARCH 2017 (CONTINUED)
2017R
2016R
Revenue 377 915 041 346 977 568
Interest received
- bank deposits (2 106 561) (1 913 337)
- amortisation of debtors (5 047 398) (4 083 653)
Turnover 370 761 082 340 980 578
2 TURNOVER
3 SUNDRY INCOME
Turnover, which is stated net of value added tax, represents amounts invoiced to third parties. It is attributable to the collection, processing and distribution of blood and certain of its derivatives related to the sale of blood.
The amortised cost of trade and other receivables is measured at fair value on initial recognition date plus the cumulative amortisation using the effective interest rate method. The effective interest rate discounts estimated future cash receipts through the expected life of the financial asset. The finance income effect of applying the effective interest rate method amounts to R5 047 398 (2016: R4 083 653).
2017R
2016R
Donation received on computer equipment 294 000 -
ETI Refund from SARS 115 119 -
Other income 1 391 944 982 894
1 801 063 982 894
WP Blood Transfusion Service | Integrated Report 2016 - 2017 | 62
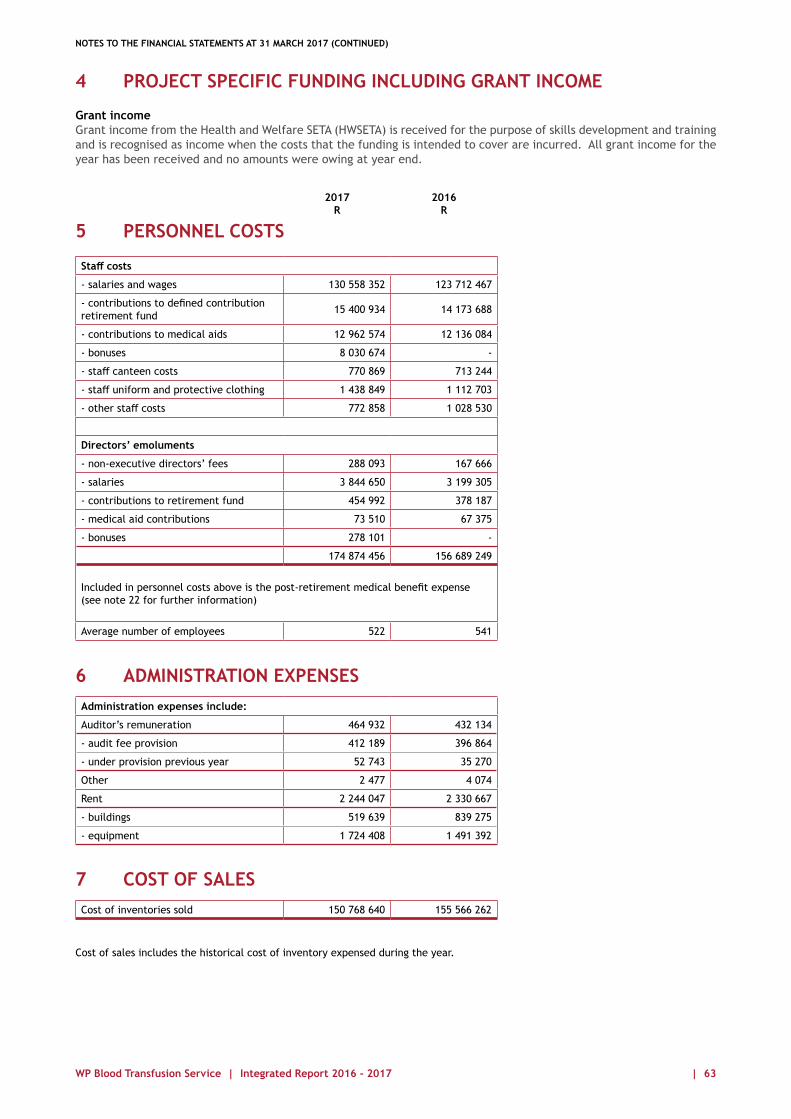
2017R
2016R
Staff costs
- salaries and wages 130 558 352 123 712 467
- contributions to defined contribution retirement fund 15 400 934 14 173 688
- contributions to medical aids 12 962 574 12 136 084
- bonuses 8 030 674 -
- staff canteen costs 770 869 713 244
- staff uniform and protective clothing 1 438 849 1 112 703
- other staff costs 772 858 1 028 530
Directors’ emoluments
- non-executive directors’ fees 288 093 167 666
- salaries 3 844 650 3 199 305
- contributions to retirement fund 454 992 378 187
- medical aid contributions 73 510 67 375
- bonuses 278 101 -
174 874 456 156 689 249
Included in personnel costs above is the post-retirement medical benefit expense (see note 22 for further information)
Average number of employees 522 541
4 PROJECT SPECIFIC FUNDING INCLUDING GRANT INCOME
5 PERSONNEL COSTS
6 ADMINISTRATION EXPENSES
7 COST OF SALES
Grant incomeGrant income from the Health and Welfare SETA (HWSETA) is received for the purpose of skills development and training and is recognised as income when the costs that the funding is intended to cover are incurred. All grant income for the year has been received and no amounts were owing at year end.
Administration expenses include:
Auditor’s remuneration 464 932 432 134
- audit fee provision 412 189 396 864
- under provision previous year 52 743 35 270
Other 2 477 4 074
Rent 2 244 047 2 330 667
- buildings 519 639 839 275
- equipment 1 724 408 1 491 392
Cost of inventories sold 150 768 640 155 566 262
Cost of sales includes the historical cost of inventory expensed during the year.
NOTES TO THE FINANCIAL STATEMENTS AT 31 MARCH 2017 (CONTINUED)
WP Blood Transfusion Service | Integrated Report 2016 - 2017 | 63

2017
(At valuation)Land and buildings
R
Technicalequipment
R
Computerequipment
and softwareR
Office furniture and
equipmentR
Motorvehicles
RTotal
R
Beginning of year
- Gross carrying value 56 181 737 60 445 312 6 708 986 5 602 093 23 156 897 152 095 025
- Accumulated depreciation (373 552) (32 708 797) (2 863 719) (2 374 351) (9 776 989) (48 097 408)
- Net book value 55 808 185 27 736 515 3 845 267 3 227 742 13 379 908 103 997 617
Current year movements
- Additions - 2 895 564 1 722 605 591 068 2 855 647 8 064 884
- Held for sale at net book value (10 471 981) - - - - (10 471 981)
- Disposals at net book value (31 749) (5 360 466) (42 853) (11 500) (1 005 137) (1 375 424)
- Depreciation (31 749) (5 360 466) (1 044 395) (627 393) (3 075 409) (10 139 412)
Balance at end of year 45 304 455 24 955 679 4 480 624 3 179 917 12 155 009 90 075 684
Made up as follows:
- Gross carrying value 45 649 110 62 260 960 8 243 287 6 101 514 22 029 063 144 283 934
- Accumulated depreciation (344 655) (37 305 281) (3 762 663) (2 921 597) (9 874 054) (54 208 250)
- Net book value 45 304 455 24 955 679 4 480 624 3 179 917 12 155 009 90 075 684
2016
(At valuation)Land and buildings
R
Technicalequipment
R
Computerequipment
and softwareR
Office furniture and
equipmentR
Motorvehicles
RTotal
R
Beginning of year
- Gross carrying value 52 717 830 56 286 456 6 450 864 4 844 864 22 087 569 142 387 583
- Accumulated depreciation (341 803) (27 978 845) (2 271 672) (2 015 939) (9 196 284) (41 804 543)
- Net book value 52 376 027 28 307 611 4 179 192 2 828 925 12 891 285 100 583 040
Current year movements
- Additions 513 907 4 900 406 593 510 892 108 4 076 120 10 976 051
- Held for sale at net book value - - - - - -
- Revaluation 2 950 000 - - - - 2 950 000
- Disposals at net book value - (96 183) (54 732) (14 342) (612 753) (778 010)
- Depreciation (31 749) (5 375 319) (872 703) (478 949) (2 974 744) (9 733 464)
Balance at end of year 55 808 185 27 736 515 3 845 267 3 227 742 13 379 908 103 997 617
Made up as follows:
- Gross carrying value 56 181 737 60 445 312 6 708 986 5 602 093 23 156 897 152 095 025
- Accumulated depreciation (373 552) (32 708 797) (2 863 719) (2 374 351) (9 776 989) (48 097 408)
- Net book value 55 808 185 27 736 515 3 845 267 3 227 742 13 379 908 103 997 617
The estimated remaining useful lives of assets were re-evaluated during the financial year. This was done to more accurately reflect the pattern of economic consumption of the assets being used by the organisation.
This change in accounting estimate resulted in a decrease in depreciation amounting to R1 261 655.
In the current year, the Service reclassified certain property, plant and equipment into 5 categories. In the previous period there were 4 categories.
The overall effect of the reclassification has not impacted the values of property, plant and equipment.
8 PROPERTY, PLANT AND EQUIPMENT
NOTES TO THE FINANCIAL STATEMENTS AT 31 MARCH 2017 (CONTINUED)
WP Blood Transfusion Service | Integrated Report 2016 - 2017 | 64

NOTES TO THE FINANCIAL STATEMENTS AT 31 MARCH 2017 (CONTINUED)
Land and buildings consist of:
(i) BeaconvaleA factory situated at Connaught Road, Beaconvale, Parow, erected on freehold erven 12364 and 12367 (in extent 2578 square metres) in the Municipality of Parow, acquired on May 29 1986, under Deed of Transfer No T20026/86.
(ii) PinelandsAn office block situated in Old Mill Road, Pinelands, erected on remainder of freehold erf 24179, Cape Town at Maitland (in extent 1,3093 hectares) in the Municipality of Pinelands, acquired on July 14 1988, under Deed of Transfer No T39826/88.
(iii) PaarlAn office building situated at 263 Main Road, Paarl, erected on remainder of freehold erf 15375 (in extent 1193 square metres) in the Municipality of Paarl, acquired on August 12 1992, under Deed of Transfer No T50274/92.
(iv) GeorgeAn office building situated at Courtenay Street, George, Sections 4,9,10 and 11 of Sectional Plan No 55217/93 of Medical Centre (in extent 354 square metres) in the Municipality of George, acquired on June 28 1993, under Deed of Transfer No T10014/93.
(v) WorcesterAn office building situated at 26 Napier Street, Worcester, erected on freehold Erf 4326, Worcester (in extent 1736 square metres) in the Municipality and Division of Worcester, acquired on June 10 1994, under Deed of Transfer No T38986/94.
The properties were independently valued on an open market basis, as at 31 March 2016 by RA Gibbons, AEI (Zim), FIV (SA), Professional Valuers. Refer to Note 26 for the detail of the fair value information on the revalued land and buildings.
Had Land & Buildings been carried at cost model (excluding depreciation) the value would be R11 077 585. (2016: 12 554 764)
The cost of the properties comprises:
Acquired in Acquisition cost Improvements since acquisition 2017 2016
Beaconvale May 1986 500 000 977 179 1 477 179 1 477 179
Pinelands July 1988 2 811 236 5 503 660 8 314 896 8 314 896
Paarl August 1992 372 633 348 935 721 568 721 568
George June 1993 160 200 234 979 395 179 395 179
Worcester June 1994 505 697 1 140 245 1 645 942 1 645 942
Total cost 4 349 766 8 204 998 12 554 764 12 554 764
Revaluation surplus 43 626 973 43 626 973
Assets Held-for-Sale (10 532 627) -
Total valuation at cost 45 649 110 56 181 737
WP Blood Transfusion Service | Integrated Report 2016 - 2017 | 65

9 INVESTMENTS
NOTES TO THE FINANCIAL STATEMENTS AT 31 MARCH 2017 (CONTINUED)
2017R
2016R
Liberty GateWay Investment 6 784 978 6 534 933
Liberty Investment 9 000 000 9 000 000
15 784 978 15 534 933
Liberty GateWay Investment 2017R
2016R
Opening balance at 1 April 2016 6 534 933 -
Additions - 6 000 000
Fair value movement for the year 250 045 534 933
Closing balance as at 31 March 2017 6 784 978 6 534 933
Liberty Investment 2017R
2016R
Opening balance at 1 April 2016 9 000 000 -
Additions - 9 000 000
Fair value movement for the year - -
Closing balance as at 31 March 2017 9 000 000 9 000 000
Reconciliation of Investments
The current fair value of the Liberty Investment is R 8 562 861, but as per the investment contract terms and conditions, at a minimum the full capital invested at commencement date, R 9 000 000, is guaranteed.
Included in the cost of the Asset Held-For-Sale is revaluation reserve of R 9 081 800.
During December 2016, with the approval of the Board, the property situated at Connaught Road, Beaconvale, Parow, was placed on the open market for sale. Subsequent to financial year-end of 31 March 2017 and prior to the approval of the financial statements the directors received a binding offer on 16 May 2017 for the sale of the Fractionation Plant amounting to R7 million, which includes the land, building and related assets. The board carefully considered the impact of this offer on the valuation of the property at year end. This is a non-adjusting post balance sheet event as at balance sheet date the directors believed that the Property Plant and Equipment was appropriately valued. The rationale for accepting this offer on 29 May 2017 was based mainly on the fact that the prospective purchaser has committed to renting a portion of the premises at a favourable rate per square metre for the following 36 months. Although the sale results in a loss to the Service, the directors deemed this a reasonable offer considering the given soft rental offer from the prospective purchaser.
10 ASSETS HELD-FOR-SALE
2017R
2016R
Cost 10 532 627 -
Accumulated depreciation (60 646) -
10 471 981 -
WP Blood Transfusion Service | Integrated Report 2016 - 2017 | 66
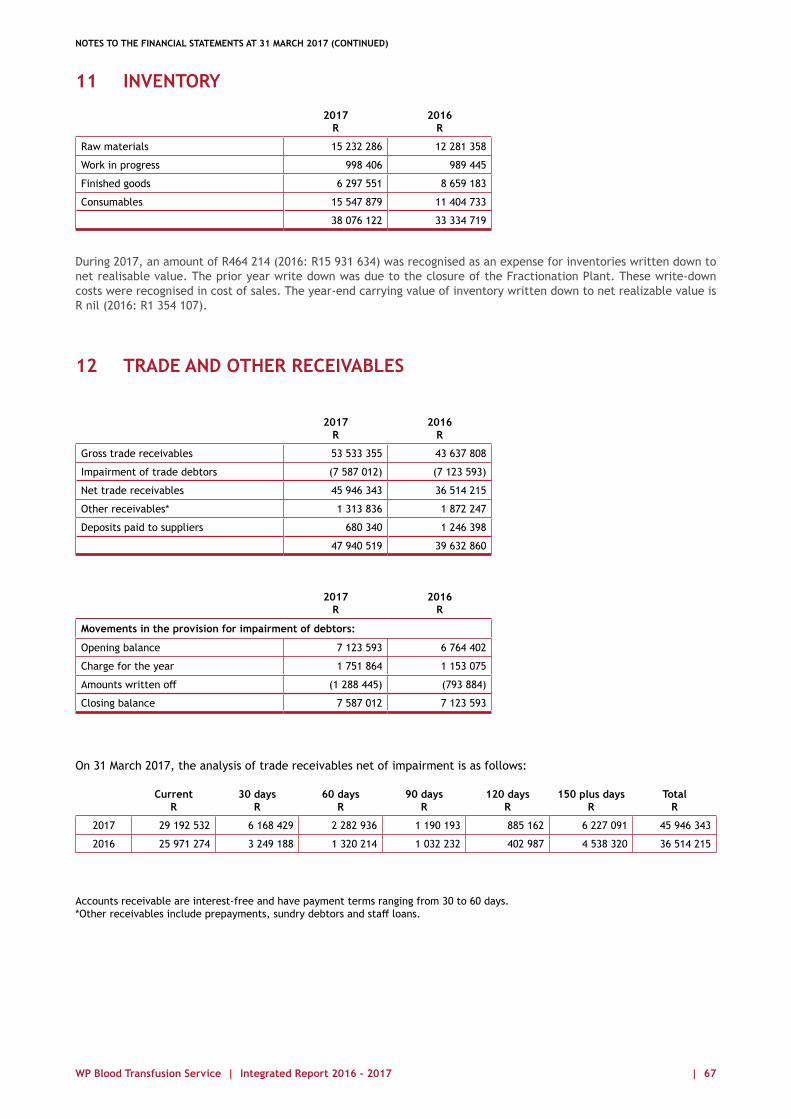
11 INVENTORY
12 TRADE AND OTHER RECEIVABLES
NOTES TO THE FINANCIAL STATEMENTS AT 31 MARCH 2017 (CONTINUED)
2017R
2016R
Raw materials 15 232 286 12 281 358
Work in progress 998 406 989 445
Finished goods 6 297 551 8 659 183
Consumables 15 547 879 11 404 733
38 076 122 33 334 719
During 2017, an amount of R464 214 (2016: R15 931 634) was recognised as an expense for inventories written down to net realisable value. The prior year write down was due to the closure of the Fractionation Plant. These write-down costs were recognised in cost of sales. The year-end carrying value of inventory written down to net realizable value is R nil (2016: R1 354 107).
On 31 March 2017, the analysis of trade receivables net of impairment is as follows:
Accounts receivable are interest-free and have payment terms ranging from 30 to 60 days.*Other receivables include prepayments, sundry debtors and staff loans.
CurrentR
30 daysR
60 daysR
90 daysR
120 daysR
150 plus daysR
TotalR
2017 29 192 532 6 168 429 2 282 936 1 190 193 885 162 6 227 091 45 946 343
2016 25 971 274 3 249 188 1 320 214 1 032 232 402 987 4 538 320 36 514 215
2017R
2016R
Gross trade receivables 53 533 355 43 637 808
Impairment of trade debtors (7 587 012) (7 123 593)
Net trade receivables 45 946 343 36 514 215
Other receivables* 1 313 836 1 872 247
Deposits paid to suppliers 680 340 1 246 398
47 940 519 39 632 860
2017R
2016R
Movements in the provision for impairment of debtors:
Opening balance 7 123 593 6 764 402
Charge for the year 1 751 864 1 153 075
Amounts written off (1 288 445) (793 884)
Closing balance 7 587 012 7 123 593
WP Blood Transfusion Service | Integrated Report 2016 - 2017 | 67

13 CASH AND CASH EQUIVALENTS
14 REVALUATION RESERVE
15 NON-DISTRIBUTABLE RESERVES
16 PRODUCT LIABILITY RESERVE
NOTES TO THE FINANCIAL STATEMENTS AT 31 MARCH 2017 (CONTINUED)
2017R
2016R
Cash at bank and on hand 30 862 049 21 427 616
Standard Bank Limited has issued guarantees to the value of R40 000 (2016: R40 000) in favour of the Service to South African Airways (Pty) Ltd as evidence of the Service’s ability to cover its debt. The service has, in turn, pledged cash to the value of R40 000 (2016: R40 000) in favour of Standard Bank Limited as security for the guarantee.
The Product Liability Reserve has been established as a non-distributable reserve to cover potential uninsurable product liability claims.
2017R
2016R
Revaluation at the beginning of the year 43 626 973 40 676 973
Net gain/(loss) on revalued property through OCI - 2 950 000
Asset Held-for-Sales Transfer (9 081 800) -
Revaluation at the end of the year 34 542 173 43 626 973
2017R
2016R
(a) Professional development fund surplus 1 274 062 1 216 587
Balance at beginning of period 1 216 587 1 288 534
Transfer to retained earnings 57 475 (71 947)
Balance at end of period 1 274 062 1 216 587
The Professional Development Fund was established with surplus funds from hosting the International Society of Blood Transfusion Congress in 2006. The essential purpose of the fund is to support staff in further education and training.
(b) Training development fund 1 008 200 1 008 200
The Training Development fund was established with employer surplus funds received from the Western Province Blood Transfusion Service Retirement Fund in 2012. The surplus is to be utilised for training and leadership development of staff.
Total non-distributable reserves 2 282 262 2 224 787
2017R
2016R
Opening balance 6 144 890 6 101 005
Transfer from retained earnings 795 381 43 885
Balance at end of year 6 940 271 6 144 890
WP Blood Transfusion Service | Integrated Report 2016 - 2017 | 68

17 TRADE AND OTHER PAYABLES
18 PROVISIONS
20 TAXATION
19 FINANCE COSTS
NOTES TO THE FINANCIAL STATEMENTS AT 31 MARCH 2017 (CONTINUED)
2017R
2016R
Trade payables 30 361 827 23 028 776
Other payables* 7 455 378 6 169 447
37 817 205 29 198 223
Trade and other payables are non-interest bearing and are normally settled on 30 day terms.
*Other payables include VAT payable, sundry creditors, accruals and salary creditors.
Other payables
VAT payable 2 397 747 2 071 351
Salary creditors 2 239 706 2 125 879
Sundry payables 2 817 925 1 972 217
7 455 378 6 169 447
2017R
2016R
Leave pay provision
At 1 April 2016 13 518 782 12 487 145
Arising during the year 13 828 413 13 306 148
Utilised (13 675 393) (12 274 511)
At 31 March 2017 13 671 802 13 518 782
Salary related accruals
At 1 April 2016 3 300 644 10 000 290
Arising during the year 11 590 429 3 300 644
Utilised (3 300 644) (10 000 290)
At 31 March 2017 11 590 429 3 300 644
TOTAL 25 262 231 16 819 426
2017R
2016R
Interest expense 70 554 2 624
No provision has been made for taxation as the income of the Service is exempt in terms of Section 10 (cN) of the Income Tax Act, 1962.
Salary related accruals relate to prorata provision of guaranteed pay, performance bonus and accrual of overtime.
WP Blood Transfusion Service | Integrated Report 2016 - 2017 | 69

21 COMMITMENTS
22 RETIREMENT BENEFIT INFORMATION
NOTES TO THE FINANCIAL STATEMENTS AT 31 MARCH 2017 (CONTINUED)
2017R
2016R
21.1 CAPITAL COMMITMENTS
Commitments in respect of capital expenditure
- contracted for 7 420 514 116 829
- not contracted for 16 639 226 12 610 288
24 059 740 12 727 117
The expenditure will be financed from cash generated from normal business operations and covers the replacement and maintenance of technical equipment, motor vehicles, office equipment and furniture and computer equipment and software.
The service has entered into operating leases on certain buildings and machinery, with lease terms between three and five years and inflation based escalation.
Defined contribution plan
The Service continues to contribute to the Western Province Blood Transfusion Service Retirement Fund which is a defined contribution plan.
The fund is registered under and governed by the Pension Funds Act, 1956 as amended.
All of the Service’s permanent employees belong to the fund.
At 31 December 2016, 506 employees (2015: 523 employees) belonged to the defined contribution plan.
Post-retirement medical benefits
The Service offers medical aid schemes for the benefit of permanent employees. Members of the defined benefit retirement plan and certain pensioners are entitled to post-retirement medical benefits consisting of a subsidy of a portion of the medical aid contributions. At the year-end there was 1 employee and 3 pensioners who were entitled to this benefit.
Full actuarial valuations are performed on an annual basis.
The last actuarial valuation was performed as at 31 March 2017, using the projected unit credit valuation method.
Principal actuarial assumptions at the reporting date:
Discount rate 9,80%Health care cost inflation 9,00%Average retirement age 55
Not later than one year
R
Later than one year and not later than
five yearsR
21.2 COMMITMENTS IN RESPECT OF OPERATING LEASES
2017
Operating leases 3 860 631 6 199 631
2016
Operating leases 3 899 101 8 133 037
WP Blood Transfusion Service | Integrated Report 2016 - 2017 | 70
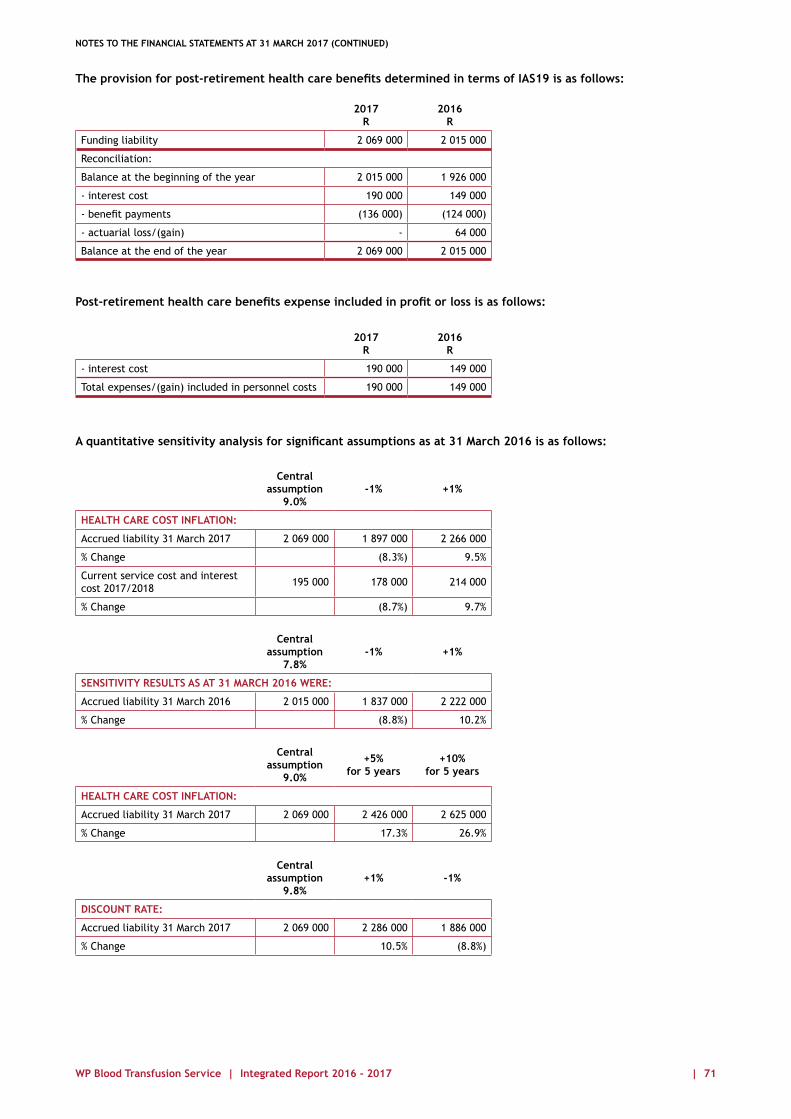
NOTES TO THE FINANCIAL STATEMENTS AT 31 MARCH 2017 (CONTINUED)
2017R
2016R
Funding liability 2 069 000 2 015 000
Reconciliation:
Balance at the beginning of the year 2 015 000 1 926 000
- interest cost 190 000 149 000
- benefit payments (136 000) (124 000)
- actuarial loss/(gain) - 64 000
Balance at the end of the year 2 069 000 2 015 000
2017R
2016R
- interest cost 190 000 149 000
Total expenses/(gain) included in personnel costs 190 000 149 000
The provision for post-retirement health care benefits determined in terms of IAS19 is as follows:
Post-retirement health care benefits expense included in profit or loss is as follows:
Central assumption
9.0%-1% +1%
HEALTH CARE COST INFLATION:
Accrued liability 31 March 2017 2 069 000 1 897 000 2 266 000
% Change (8.3%) 9.5%
Current service cost and interest cost 2017/2018 195 000 178 000 214 000
% Change (8.7%) 9.7%
Central assumption
9.8%+1% -1%
DISCOUNT RATE:
Accrued liability 31 March 2017 2 069 000 2 286 000 1 886 000
% Change 10.5% (8.8%)
Central assumption
9.0%
+5%for 5 years
+10%for 5 years
HEALTH CARE COST INFLATION:
Accrued liability 31 March 2017 2 069 000 2 426 000 2 625 000
% Change 17.3% 26.9%
Central assumption
7.8%-1% +1%
SENSITIVITY RESULTS AS AT 31 MARCH 2016 WERE:
Accrued liability 31 March 2016 2 015 000 1 837 000 2 222 000
% Change (8.8%) 10.2%
A quantitative sensitivity analysis for significant assumptions as at 31 March 2016 is as follows:
WP Blood Transfusion Service | Integrated Report 2016 - 2017 | 71

Central assumption
55 years
1 yearyounger
1 yearolder
EXPECTED RETIREMENT AGE:
Accrued liability 31 March 2017 2 069 000 2 069 000 2 069 000
% Change 0% 0%
Central assumption
9.5%
+5%for 5 years
+10%for 5 years
HEALTH CARE COST INFLATION:
Accrued liability 31 March 2016 2 015 000 2 387 000 2 591 000
% Change 18.5% 28.6%
Central assumption
9.8%+1% -1%
DISCOUNT RATE:
Accrued liability 31 March 2016 2 015 000 2 240 000 1 826 000
% Change 11.1% (9.4%)
Central assumption
55 years
1 yearyounger
1 yearolder
EXPECTED RETIREMENT AGE:
Accrued liability 31 March 2016 2 015 000 2 015 000 2 015 000
% Change 0.0% 0.0%
NOTES TO THE FINANCIAL STATEMENTS AT 31 MARCH 2017 (CONTINUED)
23 INTEREST BEARING LIABILITIES
24 FINANCIAL INSTRUMENTS AND RISK MANAGEMENT
2017R
2016R
Finance lease liabilities 1 008 464 -
Less: portion payable within one year (243 330) -
Balance at end of year 765 134 -
The obligation was secured over computer equipment, bears an average interest of 13.43% and is repayable in quarterly instalments of R90 045.
Market riskMarket risk is the risk that the fair value of future cash flows of a financial instrument will fluctuate because of changes in market prices. Market risk comprises three types of risk: interest rate risk, currency risk and other price risk, such as equity price risk and commodity risk. Financial instruments affected by market risk include loans and borrowings, deposits, and derivative financial instruments.
Interest rate riskInterest rate risk is the risk that the fair value or future cash flows of a financial instrument will fluctuate because of changes in market interest rates.
Foreign currency riskForeign currency risk is the risk that the fair value or future cash flows of an exposure will fluctuate because of changes in foreign exchange rates. The Service’s exposure to the risk of changes in foreign exchange rates relates primarily to the Service’s operating activities (when revenue or expense is denominated in a foreign currency).
Equity price riskThe Service’s equity securities are susceptible to market price risk arising from uncertainties about future values of the investment securities. Reports on the equity portfolio are submitted to the Service’s management on a regular basis. The Service’s Board of Directors reviews and approves all equity investment decisions.
WP Blood Transfusion Service | Integrated Report 2016 - 2017 | 72

Liquidity riskThis is the risk of not meeting contractual liabilities as they fall due. Management monitors current cash position and future cash flow requirements on a routine basis.
Credit riskCredit risk is the risk that a counter party will not meet its obligations under a financial instrument or customer contract, leading to a financial loss. The Service is exposed to credit risk from its operating activities (primarily trade receivables) and from its financing activities, including deposits with banks and financial institutions, foreign exchange transactions and other financial instruments.
24.1 Financial instruments The Service’s financial instruments can be summarised as follows:
2017Financial assets at fair value
through profit and lossR
Loans and receivables
RNon-financial assets
RTotal
R
FINANCIAL ASSETS
Trade and other receivables - 46 048 034 1 892 485 47 940 519
Cash and cash equivalents - 30 862 049 - 30 862 049
Investments 15 784 978 - - 15 784 978
2016Financial assets at fair value
through profit and lossR
Loans and receivables
RNon-financial assets
RTotal
R
FINANCIAL ASSETS
Trade and other receivables - 36 715 147 2 917 713 39 632 860
Cash and cash equivalents - 21 427 616 - 21 427 616
Investments 15 534 933 - - 15 534 933
2017
Financial liabilities measured at
amortised costR
Financial liabilities at fair value through
profit and lossR
Non-financialliabilities
R
Finance lease liabilities
RTotal
R
FINANCIAL LIABILITIES
Trade and other payables 35 149 459 - 2 397 746 - 37 817 205
FEC liability - 2 535 330 - - 2 535 330
Operating lease liability - - 260 070 - 260 070
Interest bearing liabilities - - - 1 008 164 1 008 164
2016
Financial liabilities measured at
amortised costR
Financial liabilities at fair value through
profit and lossR
Non-financialliabilities
R
Finance lease liabilities
RTotal
R
FINANCIAL LIABILITIES
Trade and other payables 27 126 782 - 2 071 351 - 29 128 223
FEC liability - 4 301 378 - - 4 301 378
Operating lease liability - - 265 350 - 265 350
Interest bearing liabilities - - - - -
NOTES TO THE FINANCIAL STATEMENTS AT 31 MARCH 2017 (CONTINUED)
WP Blood Transfusion Service | Integrated Report 2016 - 2017 | 73

24.2 Credit risk management
CATEGORY RISK
LowR
MediumR
HighR
TotalR
2017
Hospitals 17 353 538 - - 17 353 538
Medical aids 24 217 990 - - 24 217 990
Private patients - - 2 847 861 2 847 861
Workman’s compensation claims - 1 522 335 - 1 522 335
Road accident fund - 612 - 612
Estates - 4 007 - 4 007
Other receivables 101 691 - - 101 691
Total 41 673 219 1 526 954 2 847 861 46 048 034
2016
Hospitals 11 903 925 - - 11 903 925
Medical aids 20 932 430 - - 20 932 430
Private patients - - 2 118 373 2 118 373
Workman’s compensation claims - 1 524 359 - 1 524 359
Road accident fund - - -
Estates - 35 128 - 35 128
Other receivables 200 932 - - 200 932
Total 33 037 287 1 559 487 2 118 373 36 715 147
The maximum exposure to credit risk approximates the carrying value.
NOTES TO THE FINANCIAL STATEMENTS AT 31 MARCH 2017 (CONTINUED)
24.3 Interest rate riskThe Service’s exposure to interest rate risk can be quantified as follows:
2017R
2016R
CASH AND BANK BALANCE EXPOSED TO INTEREST RATE RISK
Income statement effect of interest rate risk to above balance:
1% increase in interest rates 308 620 214 276
1% decrease in interest rates (308 620) (214 276)
WP Blood Transfusion Service | Integrated Report 2016 - 2017 | 74

24.4 Liquidity risk
2017 Year 1R
Years 2 – 5R
Over 5 yearsR
TotalR
FINANCIAL ASSETS
Trade and other receivables 46 048 034 - - 46 048 034
Cash and cash equivalents 30 862 04 - - 30 862 049
Investments 15 784 978 - 15 784 978
FINANCIAL LIABILITIES
Trade and other payables 35 419 458 - - 35 419 458
FEC liability 2 535 330 - - 2 535 330
Operating lease liability 260 070 - - 260 070
Interest bearing liabilities 360 180 925 951 - 1 286 132
2016 Year 1R
Years 2 – 5R
Over 5 yearsR
TotalR
FINANCIAL ASSETS
Trade and other receivables 36 715 147 - - 36 715 147
Cash and cash equivalents 21 427 616 - - 21 427 616
Investments 15 534 933 - - 15 534 933
FINANCIAL LIABILITIES
Trade and other payables 27 126 872 - - 27 126 872
FEC liability 4 301 378 - - 4 301 378
Operating lease liability 265 350 - - 265 350
Interest bearing liabilities - - - -
24.5 Foreign currency risk
2017 2016
Fair value of FEC (liability) at year end (2 535 530) (4 301 378)
Current liabilities
2017: USD 1 217 278 16 443 964
2016: USD 831 173 12 326 712
Exchange rates at 31 March used for conversion of foreign items were:
USD 13.5088 14.8305
The spot rate on 31 March was used to revalue foreign currency balances at year end.
At 31 March 2017, if the currency had weakened/strengthened by 10% against the US dollar with all other variables held constant, pre-tax profit for the year would have been R1 644 936 higher/lower (2016: R1 232 671) mainly as a result of foreign exchange gains or losses on translation of US dollar denominated financial liabilities at fair value measured to amortised cost.
24.6 Price risk
The Service is exposed to price risk through their investment holdings.
Sensitivity analysisThe Service’s exposure to price risk can be quantified as follows:
Increase in investment of 10%R1 578 498
Decrease in investment of 10%(R678 498)
The sensitivity of the investment in relation to the decrease as a result of the price risk are related only to the Liberty GateWay Investment of R6 784 978 as there is no downside risk to the Liberty Investment of R9 000 000.
NOTES TO THE FINANCIAL STATEMENTS AT 31 MARCH 2017 (CONTINUED)
WP Blood Transfusion Service | Integrated Report 2016 - 2017 | 75

25 DIRECTORS’ REMUNERATION
NOTES TO THE FINANCIAL STATEMENTS AT 31 MARCH 2017 (CONTINUED)
SalariesR
Contributions to Retirement
FundR
Medical AidR
BonusesR
TotalR
Dr G Bellairs 2 020 499 240 645 46 116 145 328 2 452 588
Ms N du Toit 1 824 151 214 347 27 394 132 773 2 198 665
Total 3 844 650 454 992 73 510 278 101 4 651 253
FeesR
TotalR
Dr A Bird 23 050 23 050
Mr M Burton 36 235 36 235
Prof B Figaji 36 288 36 288
Mr N Parker 24 007 24 007
Mr D Ndebele 26 346 26 346
Mr R Ramsbottom 29 590 29 590
Mr P Slack 38 056 38 056
Prof V Louw 15 288 15 288
Mr P Veldhuizen 29 590 29 590
Dr A Huggett 29 643 29 643
Total 288 093 288 093
Executive Directors
2017
2016
Non-Executive Directors’ fees
Directors fee paid to non-executive directors are the only related party transactions.
Non-executive directors receive fees for attendance of meetings and a monthly retainer.
Directors fee paid to non-executive directors are the only related party transactions.
Non-executive directors receive fees for attendance of meetings and a monthly retainer.
SalariesR
Contributions to Retirement
FundR
Medical AidR
BonusesR
TotalR
Dr G Bellairs 1 727 471 208 958 43 095 - 1 979 524
Ms N du Toit 1 471 834 169 229 24 280 - 1 665 343
Total 3 199 305 378 187 67 375 - 3 644 867
FeesR
TotalR
Dr A Bird 15 434 15 434
Adv G R Bosman 6 502 6 502
Mr M Burton 16 497 16 497
Prof B Figaji 19 618 19 618
Mr N Parker 13 238 13 238
Mr D Ndebele 17 491 17 491
Mr R Ramsbottom 17 561 17 561
Mr P Slack 24 839 24 839
Prof V Louw 6 804 6 804
Mr P Veldhuizen 11 058 11 058
Dr A Huggett 18 624 18 624
Total 167 666 167 666
Executive Directors
Non-Executive Directors’ fees
WP Blood Transfusion Service | Integrated Report 2016 - 2017 | 76

Reconciliation of recurring fair value measurements categorised within Level 3 of the fair value hierarchy:
Reconciliation of recurring fair value measurements categorised within Level 3 of the fair value hierarchy:
2017Opening balance
at fair valueR
AdditionsR
RevaluationR
DisposalsR
DepreciationR
Closing balance at fair value
R
Beaconvale 10 476 669 - - - (4 688) 10 471 981
Pinelands 35 647 689 - - - (18 458) 35 629 231
Paarl 3 665 338 - - - (3 448) 3 661 890
George 2 655 312 - - - (1 698) 2 653 614
Worcester 3 363 177 - - - (3 457) 3 359 720
55 808 195 - - - (31 749) 55 776 436
Assets Held-for-Sale (10 476 669) - - - 4 688 (10 471 981)
45 331 526 - - - (27 061) 45 304 455
2016Opening balance
at fair valueR
AdditionsR
RevaluationR
DisposalsR
DepreciationR
Closing balance at fair value
R
Beaconvale 11 206 357 - (725 000) - (4 688) 10 476 669
Pinelands 31 522 240 513 907 3 630 000 - (18 458) 35 647 689
Paarl 3 293 786 - 375 000 - (3 448) 3 665 338
George 2 507 010 - 150 000 - (1 698) 2 655 312
Worcester 3 846 634 - (480 000) - (3 457) 3 363 177
52 376 027 513 907 2 950 000 - (31 749) 55 808 185
Information about valuation techniques and inputs used to derive level 3 fair values
Owner – Occupied Property – Owner occupied property held at revalued amount
Owner Occupied Property - commercial property for leasing is determined by applying a comparable sales method, using price per square metre for buildings, gross rentals in the market and applying a capitalisation rate.
NOTES TO THE FINANCIAL STATEMENTS AT 31 MARCH 2017 (CONTINUED)
26 FAIR VALUE INFORMATION
Fair value hierarchy
Level 1: Quoted unadjusted prices in active markets for identical assets or liabilities that the company can access at measurement date.
Level 2: Inputs other than quoted prices included in level 1 that are observable for the asset or liability either directly or indirectly.
Level 3: Unobservable inputs for the asset or liability.
Recurring fair value measurements – Level 3 Note 2017R
2016R
ASSETS
Beaconvale – erven 12364 and 12367 8/10 10 471 981 10 476 669
Pinelands – erven 24179 8 35 629 231 35 647 689
Paarl – erven 15375 8 3 661 890 3 665 338
George – Sections 4, 9, 10 and 11 of Sectional Plan No 55217/93 8 2 653 614 2 655 312
Worcester – Erf 4326 8 3 359 720 3 363 177
55 776 436 55 808 185
Property, plant and equipment
WP Blood Transfusion Service | Integrated Report 2016 - 2017 | 77

Beaconvale Actual Inputs
Price per square metre – Rands R36.50
Pinelands Actual Inputs
Price per square metre – Rands R70.00
Paarl Actual Inputs
Price per square metre – Rands R60.00
George Actual Inputs
Price per square metre – Rands R80.00
Worcester Actual Inputs
Price per square metre – Rands R42.50
The higher the price per square metre, the higher the fair value.
The carrying amount of all other financial assets and liabilities not disclosed above approximate fair value.
The carrying value of all other financial assets and liabilities not disclosed in the fair value note approximates fair value.
Note Level Valuation date 2017R
2016R
Liberty GateWay Investment 9 Level 1 31 March 2017 6 784 978 6 534 933
Liberty Investment 9 Level 2 31 March 2017 9 000 000 9 000 000
15 784 978 15 534 933
InvestmentsFair value measurements of Level 1 investments are based on quoted prices and Fair Value Measurement of Level 2 Investments are based on quoted Prices adjusted for guaranteed amounts.
NOTES TO THE FINANCIAL STATEMENTS AT 31 MARCH 2017 (CONTINUED)
WP Blood Transfusion Service | Integrated Report 2016 - 2017 | 78

ABBREVIATIONS AND ACRONYMS
10
AABB American Association of Blood BanksAfSBT African Society for Blood Transfusion AGM Annual General MeetingAVE Advertising Value EquivalentCEO Chief Executive OfficerCFO Chief Financial OfficerCPD Continuing Professional DevelopmentCPI Consumer Price IndexEY Ernst and YoungGDBS Global database on blood safetyHPCSA Health Professions Council of South AfricaISBT International Society of Blood TransfusionKPI Key Performance IndicatorMCC Medicines Control CouncilNHA National Health ActNPO Non-profit organisationOHSA Occupational Health and Safety Act PBO Public benefit organisationPOPIA Protection of Personal Information ActPSA Public Servants Association of South AfricaSABMR South African Bone Marrow RegistrySANAS South African National Accreditation SystemSANBS South African National Blood ServiceSANBTC South African National Blood Transfusion CongressSASBT South African Society for Blood TransfusionSLA Service Level AgreementSRA Strategic risk assessmentTACO Transfusion associated circulatory overloadTRALI Transfusion related acute lung injuryWHO World Health OrganisationWPBTS Western Province Blood Transfusion Service
WP Blood Transfusion Service | Integrated Report 2016 - 2017 | 79