integrated physical and behavioral health results in cost
TRANSCRIPT

136 State Capitol, Denver, CO 80203 | P 303.866.2471 | www.colorado.gov/ltgovernor
January 17, 2020
Greetings:
The Colorado State Innovation Model (SIM) changed the way health care is delivered and paid for in Colorado. And while SIM’s overarching objectives were directed at systemic reforms across the state’s health care landscape, at its core, the initiative was about people- and improving the health of Coloradans by increasing access to “whole person” care.
The final evaluation reports now available on the SIM website – including the SIM Final Report, SIM Final Evaluation Outcomes Report, SIM Final Evaluation Process Report, and SIM Return on Investment (ROI) Analysis – offer a detailed analysis on SIM’s many successes, as well as the challenges and lessons learned.
While SIM officially came to an end on July 31, 2019, its impact will be felt for years to come. As Governor Polis and I continue to work with all of you to help implement our “Roadmap to Saving Coloradans Money on Health Care,” the following SIM lessons and findings will be at the top of our minds:
Integrated physical and behavioral health results in cost savings. Results from the analysesof SIM’s ROI are extremely encouraging, showing an estimated cost savings of $178.6 millionthrough January 1, 2018. In addition, several cost and utilization measures analyzed in theSIM Final Evaluation Outcomes report also showed positive impacts- such as a reduction inemergency department utilization, and lower rates of 30-day hospital readmissions formental health conditions. Evaluators used different methodologies to calculate cost savings(or avoided costs), and the results of their analyses raise questions that merit futureinvestigation and research.
Integrated physical and behavioral health also improves care delivery. SIM’s success inimproving access to the right care, at the right time, in the right place is most powerfullyexpressed through the stories of the patients and the providers who were involved in theinitiative, which can be found on the SIM website. The Evaluation Reports offer furtherevidence of improved care quality, resulting in improved outcomes. This information will becritical in directing future state efforts to strengthen and improve primary care delivery- work that is currently being pursued by the Colorado Primary Care Payment ReformCollaborative.
Systems change requires strong relationships and cross-sector partnerships. Colorado SIMwas unique, among other states who received SIM awards, in its level of stakeholderengagement. The relationship and trust building that occurred over the course of theinitiatives - between payers and providers, care team members working in integratedsetting, state agencies and public partners - were instrumental to SIM’s success.
I encourage you not only to read the wealth of information contained in the reports, but to find new ways to engage in care delivery and payment reform efforts currently underway in Colorado. SIM shows that true reform takes sustained engagement, motivation, and cooperation- it is now up to all of us to take up the reigns and work together to advance the health of all Coloradans.
Sincerely,
Dianne Primavera Lieutenant Governor

The project described was supported by Funding Opportunity Number CMS -1G1-14-001 from the U.S Department of Health and Human Services (HHS), Centers for Medicare & Medicaid Services (CMS). The Colorado State Innovation Model (SIM), a four -year initiative, is funded by up to $65 million from CMS. The content provided is solely the responsibility of the authors and does not necessarily represent the official views of
HHS or any of its agencies.
ROI Submission Cover Letter July 25, 2019
Background: In its initial proposal, the Colorado State Innovation Model (SIM) proposed to in-clude a return-on-investment (ROI) analysis as part of the final evaluation. Milliman, an actuar-ial firm, was contracted to conduct these analyses. At the time of the SIM proposal, Milliman estimated that the model would save or avoid $127 million with the investment of up to $65 million, equaling a ROI of 1.95. The report we are submitting today was conducted in July 2019, just before the conclusion of SIM.
Data Lag Challenges: The analyses are based off claims data from the All-Payer Claims Data-base (APCD), managed by the Center for Improving Value in Health Care (CIVHC). Due to the lag in claims data reporting, this analysis includes data from 2015 through 2017. This limits our ability to measure the impact of the initiative since we have limited data for cohort implemen-tation: Practice transformation support was provided to cohort 1 from February 2016 through March 2018; to cohort 2 from September 2017 through June 2019; and to cohort 3 practices from June 2018 through June 2019. This means that only 11 months of cohort 1 and four months of cohort 2 are included in these analyses and cohort 3 is excluded. Our logic model posits that the initiative will impact cost and uti lization first by increasing utilization of certain upstream services when patients are able to access the integrated physical and behavioral care they need and that this improvement in care will lower utilization of more costly downstream , acute services. Since it might take years to see these effects, future analyses might provide a more accurate measure of the impact that SIM had on cost and utilization.
Assumptions: This is an actuarial ROI that measures the difference between projected and ac-tual costs compared with the SIM investment. The projected costs are meant to model a coun-terfactual situation or what we would have expected the costs to be if SIM had not happened. The difference between projected and actual costs is reported as cost -savings attributed to SIM. These calculated cost-savings are then compared with the SIM investment to measure the ROI. This means that the results are highly dependent on the projected trend rates . Since many factors can influence the trend rates of health care costs, we relied on Milliman to provide best estimates. The SIM office asked for a sensitivity analyses to show the influence of trend varia-bility on results but that was not feasible given the short time frame. Sensitivity analyses would be a valuable component of future analyses.
Medicare Trends: In this report, the Medicare line of business includes Medicare fee-for-ser-vice and Medicare Advantage. Since it is expected that Medicare fee-for-service would have different costs and utilization than Medicare Advantage, the analyses may be skewed if the SIM population has a different percentage in each program than the population for which the pro-jections were based. The SIM office raised this concern with the Milliman team, but Medicare

The project described was supported by Funding Opportunity Number CMS -1G1-14-001 from the U.S Department of Health and Human Services (HHS), Centers for Medicare & Medicaid Services (CMS). The Colorado State Innovation Model (SIM), a four -year initiative, is funded by up to $65 million from CMS. The content provided is solely the responsibility of the authors and does not necessarily represent the official views of
HHS or any of its agencies.
fee-for-service and Medicare Advantage were not split out into separate lines of business for this analysis. Future analyses should treat Medicare fee-for-service and Medicare Advantage as separate lines of business to improve accuracy of results.
Lack of Comparison Group: The SIM office attempted an ROI analysis using a comparison group instead of projections to represent the counterfactual situation. The comparison group is not included in this report due to various data complications that were not resolved in our time frame. The comparison group work is, however, reflected in the final evaluation reports.
Medicaid Adjustments: In early 2019, discrepancies were discovered between Medicaid’s claims data and data in the APCD. Discrepancies were due to changes in HCPF’s and CIVHC’s data management vendors. SIM led efforts to identify the cause, magnitude and time frame of the discrepancies and create adjustment factors to be applied to Medicaid data from the APCD to align it to HCPF’s data. Documentation of this process and results are now included on CIVHC’s website and distributed with data extracts for everyone using their data. For the pur-pose of this ROI report, adjustments used are included in the methodology section. Since we were not able to verify the data of other payers in this manner, we are reliant on the data that Medicare and commercial payers submit to the APCD.
Recommendations: Since health care trend rates are highly variable and influenced by so many different factors, we recommend that future health care initiatives focus more on cost and uti-lization rather than ROI and identify a comparison group before the start of the initiative so that the impact can be more accurately measured.
Various data challenges, including data lags and the short time frame between completion of the initiative and the evaluation, have limited the ability to accurately measure the full impact of SIM.
Although this report represents mixed results, overall findings appear to be positive. Future analyses should work to address the above concerns and try to better explain the impact of SIM to say which service categories saw the highest change in cost and/or utilization through participation in SIM and how those changes feed into the ROI results.

July 22, 2019
Milliman SIM July 2019 ROI Report
Offices in Principal Cities Worldwide
7
SIM Healthcare Cost Savings
and Return-on-Investment Report
July 2019
Prepared by:
Milliman, Inc.
Stephen P. Melek
FSA, MAAA
Ally Weaver
ASA, MAAA
Stoddard Davenport
MPH
1400 Wewatta Street
Suite 300
Denver, CO 80202-5549
USA
Tel +1 303 299 9400
Fax +1 303 299 9018
milliman.com
Milliman SIM 2019 ROI Report
July 22, 2019
Offices in Principal Cities Worldwide
Table of Contents
INTRODUCTION ................................................................................................................................................................... 1
METHODOLOGY .................................................................................................................................................................. 2
Data Reliance ................................................................................................................................................................... 2 Return-on-investment Calculations ................................................................................................................................... 3 Projected Allowed Costs ................................................................................................................................................... 3 Risk Adjustment ................................................................................................................................................................ 5
CAVEATS AND LIMITATIONS ............................................................................................................................................ 7
ROI RESULTS .................................................................................................................................................................... 10
CONCLUSIONS .................................................................................................................................................................. 28

Milliman SIM July 2019 ROI Report
July 19, 2019 1
Offices in Principal Cities Worldwide
INTRODUCTION
The Center for Medicare and Medicaid Innovation (CMMI) awarded the State of Colorado up to $65 million to
test its State Healthcare Innovation Plan, which is the integration of behavioral healthcare services in
approximately 400 primary medical care practices. The initiative also includes the integration of physical
healthcare services in four community mental health centers.
CMMI desires to obtain a positive return on this investment. The State of Colorado projected a healthcare cost
savings (i.e. avoided healthcare costs) of $122.7 million through the end of model test year 3 (the end of the
award period) in its State Innovation Model (SIM) application, which translates to a return-on-investment (ROI)
of 1.89 (assuming the full $65 million gets paid to the SIM office).
Three cohorts of primary care practices are participating in the SIM project. Each cohort has a “base period”
which is the calendar year before implementation of the integrated medical-behavioral initiative, and an
“implementation period” which includes the calendar years after the start of the integration initiative. Cohort 1
practices and community mental health centers have a base period of 2015 and implementation years beginning
in 2016 for ROI determination purposes. Cohort 2 practices have a base period of 2016 and implementation
years beginning in 2017 for ROI determination purposes. The kickoff date for Cohort 2 practices was September
2017, so the choice of 2017 as the first implementation year is conservative in that there was just 4 months of
actual implementation for the Cohort 2 practices in 2017. Cohort 3 practices have a base period of 2017 and
implementation years beginning in 2018 for ROI purposes. The kickoff date for Cohort 3 practices was June
2018, which gives Cohort 3 practices about 7 months of actual implementation in their chosen implementation
year. This ROI analysis presents results for calendar years 2016 and 2017, so Cohort 3 practices are not
included in this report due to incomplete Medicare data in 2018 at the time of this analysis.

Milliman SIM July 2019 ROI Report
July 19, 2019 2
Offices in Principal Cities Worldwide
METHODOLOGY
Data Reliance
We relied on Colorado’s All Payer Claims Database (APCD) received from CIVHC on June 10, 2019 for this
analysis. This version of the APCD extends from 2012 through the following date ranges by line of business:
For medical claims,
- Commercial data extends through February 2019 and looks to be complete through December 2018.
- Medicaid data extends through February 2019 and looks to be complete through December 2018.
- Medicare data extends through February 2019 and looks to be complete through June 2018 due to
slower processing of Medicare fee-for-service claims.
For pharmacy claims,
- Commercial data extends through February 2019 and looks to be complete through December 2018.
- Medicaid data extends through March 2019 and looks to be complete through February 2019.
- Medicare extends through February 2019 and looks to be complete through the end of 2017, due to
slower processing of the Medicare fee-for-service claims.
We were informed by the SIM office that there is an issue with the Medicaid claims data reported in the APCD.
The APCD did not align with values expected by HCPF. This was largely due to both HCPF and CIVHC
changing information system vendors during 2016. In order to correct this issue, adjustment factors were
calculated by year and quarter to be applied to the APCD data to better align the PMPMs with totals expected
by HCPF. These adjustment factors have been applied to all Medicaid costs for this analysis. The factors were
based on differences between CIVHC total PMPMs by incurred month/year and those PMPMs reported by
HCPF systems. The quarterly PMPM adjustments made to the CIVHC reported results are shown in Table 1:
Table 1: Adjustments to CIVHC Reported Medicaid Total PMPM Costs to Balance to HCPF Reports Quarter/Year HCPF PMPM CIVHC PMPM Adjustment Percent
1st Quarter 2015 $ 347.10 $ 360.68 -3.77%
2nd Quarter 2015 $ 343.50 $ 359.17 -4.36%
3rd Quarter 2015 $ 345.08 $ 364.04 -5.21%
4th Quarter 2015 $ 338.00 $ 370.99 -8.89%
1st Quarter 2016 $ 354.71 $ 412.11 -13.93%
2nd Quarter 2016 $ 351.40 $ 372.34 -5.62%
3rd Quarter 2016 $ 353.12 $ 392.10 -9.94%
4th Quarter 2016 $ 344.65 $ 390.96 -11.84%
1st Quarter 2017 $ 353.30 $ 380.95 -7.26%
2nd Quarter 2017 $ 347.89 $ 352.81 -1.40%
3rd Quarter 2017 $ 356.03 $ 360.65 -1.28%
4th Quarter 2017 $ 369.76 $ 375.41 -1.51%
CIVHC informed us that there was an issue with duplicated eligibility and pharmacy claims in the Medicare Part
D data. The commercial payers’ claims include both RESDAC/Payer 300 claims and any other amounts the
commercial payer pays at the time of a given claim. In order to adjust for this, we identified any members that
appeared in both the RESDAC/Payer 300 submissions and the commercial submissions and removed those
associated with RESDAC/Payer 300.

Milliman SIM July 2019 ROI Report
July 19, 2019 3
Offices in Principal Cities Worldwide
Our ROI methodology includes the following:
1. Large Claim Exclusion: Large claimants (members whose claims equal or exceed $250,000 in either
the base year or first two implementation years for Cohort 1 and the base year or first implementation
year for Cohort 2) are excluded.
2. Minimum Eligibility Requirement: Members must have at least 6 months of eligibility in both the base
year and first two implementation years for Cohort 1 and the base year and the first implementation
year for Cohort 2 to be included.
Return-on-investment Calculations
Return-on-investment is calculated as the ratio of healthcare cost savings (avoided costs) to program
investment costs. In order to calculate estimated healthcare cost savings, we projected allowed costs beyond
the base periods and compared these projected results to actual allowed costs by SIM practice. We then
aggregated our healthcare cost savings estimates across the participating SIM PCP practices and CMHCs to
estimate total cost savings for the SIM program to-date. More information about how we calculated healthcare
cost projections is presented in the section below. The SIM office provided us two estimates of investment costs
for the program, representing the total CMMI investment in the SIM program through January 1, 2018, and
through January 1, 2019.
We calculated ROI as the sum of the healthcare cost savings estimates for each SIM practice, determined as
the difference between projected and actual costs, divided by the total CMMI investment cost as follows:
𝑅𝑂𝐼 =∑(𝑃𝑟𝑜𝑗𝑒𝑐𝑡𝑒𝑑 𝑃𝑀𝑃𝑀 − 𝐴𝑐𝑡𝑢𝑎𝑙 𝑃𝑀𝑃𝑀) ∗ 𝑀𝑒𝑚𝑏𝑒𝑟 𝑀𝑜𝑛𝑡ℎ𝑠
𝐶𝑀𝑀𝐼 𝐼𝑛𝑣𝑒𝑠𝑡𝑚𝑒𝑛𝑡 𝐶𝑜𝑠𝑡
Projected Allowed Costs
In order to project allowed costs for the implementation periods, we first calculated total base year allowed per
member per month (PMPM) costs by line of business and service category for each practice. Claims were
assigned service categories using a combination of revenue and procedure codes. We then applied trend rates,
seasonality factors, and risk adjustment to base year allowed costs to estimate quarterly PMPM costs for the
implementation periods.
To determine the trend rates for this analysis, we first examined year-over-year cost trends by broad service
category at the SIM-attributed, state-attributed, and statewide levels in the APCD. We looked at all available
data for calendar years 2013 - 2015 for each line of business. We did not adjust any allowed dollars, paid
dollars, or units in the claim data, nor the member counts that are also included in the APCD. The year-over-
year trends looked somewhat erratic and did not produce rates that were reasonable for future cost projections.
Healthcare trend assumptions can vary significantly depending on several key factors. These factors include
plan type, benefits, and geographic area. These factors also have a tendency to be dynamic, requiring on-going
analysis and evaluation. We reviewed ranges of total annual cost trends from the 2019 Milliman Health Cost
Guidelines for the SIM Commercial population. We chose the low end of the trend ranges for our projections.
The chosen Medicaid trend rates were developed from data from the Medicaid and CHIP Payment and Access
Commission (MACPAC) and the Colorado Department of Health Care Policy and Financing (HCPF), balanced
by service category using 2017 SIM Medicaid allowed cost distributions. The trend rates used in this analysis
are shown in Table 2:
Milliman SIM July 2019 ROI Report
July 19, 2019 4
Offices in Principal Cities Worldwide
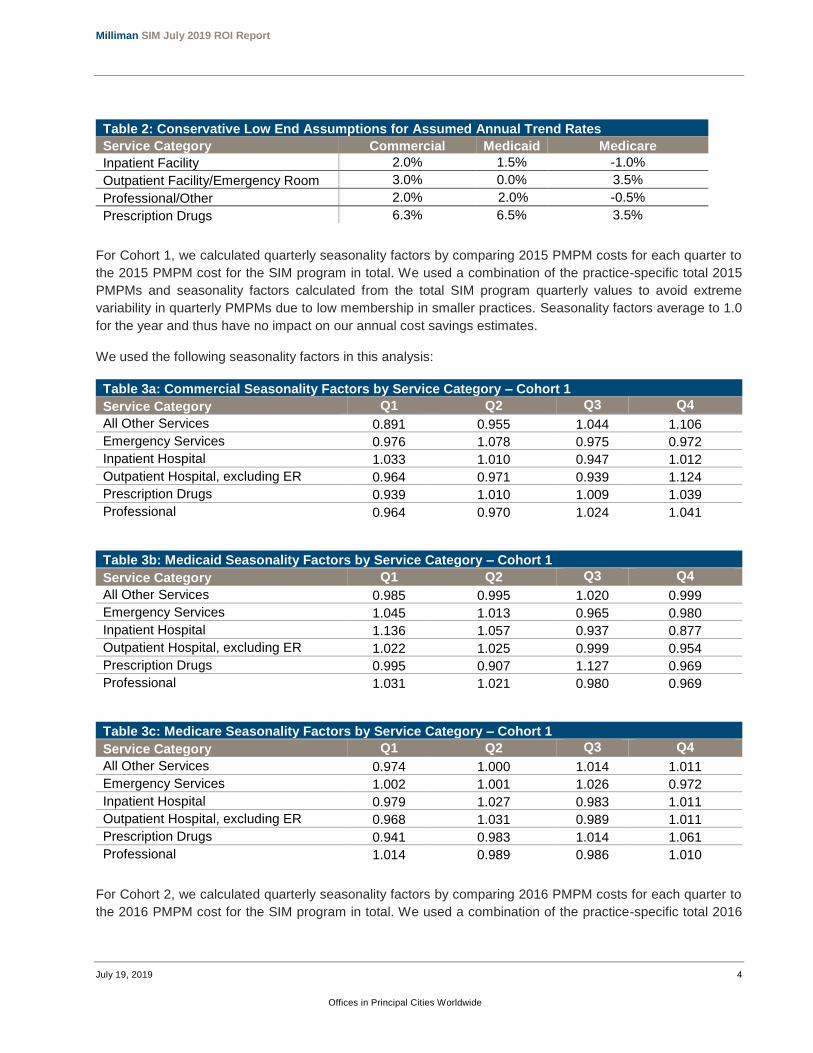
Table 2: Conservative Low End Assumptions for Assumed Annual Trend Rates
Service Category Commercial Medicaid Medicare
Inpatient Facility 2.0% 1.5% -1.0%
Outpatient Facility/Emergency Room 3.0% 0.0% 3.5%
Professional/Other 2.0% 2.0% -0.5%
Prescription Drugs 6.3% 6.5% 3.5%
For Cohort 1, we calculated quarterly seasonality factors by comparing 2015 PMPM costs for each quarter to
the 2015 PMPM cost for the SIM program in total. We used a combination of the practice-specific total 2015
PMPMs and seasonality factors calculated from the total SIM program quarterly values to avoid extreme
variability in quarterly PMPMs due to low membership in smaller practices. Seasonality factors average to 1.0
for the year and thus have no impact on our annual cost savings estimates.
We used the following seasonality factors in this analysis:
Table 3a: Commercial Seasonality Factors by Service Category – Cohort 1
Service Category Q1 Q2 Q3 Q4
All Other Services 0.891 0.955 1.044 1.106
Emergency Services 0.976 1.078 0.975 0.972
Inpatient Hospital 1.033 1.010 0.947 1.012
Outpatient Hospital, excluding ER 0.964 0.971 0.939 1.124
Prescription Drugs 0.939 1.010 1.009 1.039
Professional 0.964 0.970 1.024 1.041
Table 3b: Medicaid Seasonality Factors by Service Category – Cohort 1
Service Category Q1 Q2 Q3 Q4
All Other Services 0.985 0.995 1.020 0.999
Emergency Services 1.045 1.013 0.965 0.980
Inpatient Hospital 1.136 1.057 0.937 0.877
Outpatient Hospital, excluding ER 1.022 1.025 0.999 0.954
Prescription Drugs 0.995 0.907 1.127 0.969
Professional 1.031 1.021 0.980 0.969
Table 3c: Medicare Seasonality Factors by Service Category – Cohort 1
Service Category Q1 Q2 Q3 Q4
All Other Services 0.974 1.000 1.014 1.011
Emergency Services 1.002 1.001 1.026 0.972
Inpatient Hospital 0.979 1.027 0.983 1.011
Outpatient Hospital, excluding ER 0.968 1.031 0.989 1.011
Prescription Drugs 0.941 0.983 1.014 1.061
Professional 1.014 0.989 0.986 1.010
For Cohort 2, we calculated quarterly seasonality factors by comparing 2016 PMPM costs for each quarter to
the 2016 PMPM cost for the SIM program in total. We used a combination of the practice-specific total 2016

Milliman SIM July 2019 ROI Report
July 19, 2019 5
Offices in Principal Cities Worldwide
PMPMs and seasonality factors calculated from the total SIM program quarterly values to avoid extreme
variability in quarterly PMPMs due to low membership in smaller practices. We used the following seasonality
factors in this analysis:
Table 4a: Commercial Seasonality Factors by Service Category – Cohort 2
Service Category Q1 Q2 Q3 Q4
All Other Services 0.987 0.983 0.957 1.073
Emergency Services 0.952 0.965 1.026 1.054
Inpatient Hospital 1.041 1.024 0.932 1.006
Outpatient Hospital, excluding ER 0.941 0.977 0.999 1.080
Prescription Drugs 0.902 0.966 1.054 1.073
Professional 1.012 0.986 1.003 1.000
Table 4b: Medicaid Seasonality Factors by Service Category – Cohort 2
Service Category Q1 Q2 Q3 Q4
All Other Services 0.938 0.986 1.025 1.047
Emergency Services 1.095 0.985 1.006 0.917
Inpatient Hospital 1.197 1.054 0.970 0.787
Outpatient Hospital, excluding ER 0.988 0.978 1.022 1.011
Prescription Drugs 0.901 0.913 1.118 1.061
Professional 1.031 1.025 0.971 0.975
Table 4c: Medicare Seasonality Factors by Service Category – Cohort 2
Service Category Q1 Q2 Q3 Q4
All Other Services 0.983 0.970 1.012 1.035
Emergency Services 1.074 0.995 1.007 0.925
Inpatient Hospital 1.004 0.967 1.002 1.027
Outpatient Hospital, excluding ER 0.973 0.977 1.010 1.040
Prescription Drugs 0.981 1.000 1.016 1.002
Professional 1.037 0.978 0.977 1.008
After trending base period PMPM costs to implementation periods and adjusting costs for seasonality by
quarter, we applied a risk adjustment factor to account for differences between morbidity and demographic mix
in the practice populations between the baseline and experience periods. The risk adjustment factor
development is described in more detail below.
Risk Adjustment
Risk adjustment is the process of aggregating members’ detailed claim data (such as past diagnoses, incurred
medical services and prescription medications) and translating these data into a single risk score to account for
morbidity differences between members. A risk adjuster is a statistical model that predicts (or explains) an
individual’s claim cost using detailed historical claim or other data to make the prediction. Typically, the predictor
variables are binary condition categories (with a value of ‘1’ if there is a presence of a claim with a particular
diagnosis, and ‘0’ otherwise) but could also be more complex in nature. Results from a risk adjuster model are
typically scaled to the average cost of the population such that an average risk score is 1.0 for that population.

Milliman SIM July 2019 ROI Report
July 19, 2019 6
Offices in Principal Cities Worldwide
An age-gender component is also included in the risk score, which reflects an expected morbidity for an average
individual of a particular age and gender without a claim for a relevant medical diagnosis.
Milliman Advanced Risk Adjusters (MARA) were used for this analysis. MARA is a suite of risk adjustment tools
with a variety of predictive modeling applications for the health insurance industry. MARA was developed by
leading actuaries, clinicians, and healthcare business experts at Milliman. The MARA models offer a significant
advancement over traditional risk “groupers,” risk assessment tools, or predictive models. These advancements
are the result of years of healthcare analysis and the application of more sophisticated methods of building
predictions.
Milliman's concurrent commercial risk adjuster model was used to adjust cost data for the commercial and
Medicaid populations in this analysis, and Milliman’s concurrent Medicare risk adjuster model was used for the
Medicare populations. The concurrent commercial risk adjuster model (which has proven effective for both
Medicaid and commercial populations) relies on both medical and pharmacy claims data. The concurrent
Medicare risk adjuster model relies on medical claims data only. A concurrent risk adjuster uses a given year’s
(or assessment period’s) claim data to calculate the individual risk scores for the same time period. Each risk
score is a measurement of what an individual’s assessment period risk typically would be, based on his or her
condition profile, when compared to the average MARA calibration population. The risk scores were then
normalized to the total SIM population separately by line of business. This means that the average risk scores
for the entire commercial, Medicaid, and Medicare blocks of members in any base year are 1.00. For Cohort 1
practices and CMHCs, 2015-2017 risk scores are normalized against total 2015 data (for Cohort 1 practices
and CMHCs combined). For Cohort 2 practices, 2016-2017 risk scores are normalized against total 2016 data
(for Cohort 2 practices combined). The concurrent risk score is used as an explanatory tool to quantify the
expected morbidity level of a given year’s healthcare expenditures, which are known (actual costs).
We calculated risk scores for each attributed member in their base period year and each implementation year.
We then calculated average risk scores by practice and line of business, weighted by individual enrollment
months. The risk adjustment factor applied to projected allowed costs was calculated as follows:
𝑅𝑖𝑠𝑘 𝐴𝑑𝑗𝑢𝑠𝑡𝑚𝑒𝑛𝑡 𝐹𝑎𝑐𝑡𝑜𝑟 =𝐼𝑚𝑝𝑙𝑒𝑚𝑒𝑛𝑡𝑎𝑡𝑖𝑜𝑛 𝑌𝑒𝑎𝑟 𝐴𝑣𝑒𝑟𝑎𝑔𝑒 𝑅𝑖𝑠𝑘 𝑆𝑐𝑜𝑟𝑒
𝐵𝑎𝑠𝑒 𝑌𝑒𝑎𝑟 𝐴𝑣𝑒𝑟𝑎𝑔𝑒 𝑅𝑖𝑠𝑘 𝑆𝑐𝑜𝑟𝑒
Thus, the projected allowed cost PMPM was calculated by practice and line of business as follows:
𝑃𝑟𝑜𝑗𝑒𝑐𝑡𝑒𝑑 𝑃𝑀𝑃𝑀 = 𝐴𝑐𝑡𝑢𝑎𝑙 𝑃𝑀𝑃𝑀 ∗ 𝑇𝑟𝑒𝑛𝑑 ∗ 𝑆𝑒𝑎𝑠𝑜𝑛𝑎𝑙𝑖𝑡𝑦 𝐹𝑎𝑐𝑡𝑜𝑟 ∗ 𝑅𝑖𝑠𝑘 𝐴𝑑𝑗𝑢𝑠𝑡𝑚𝑒𝑛𝑡 𝐹𝑎𝑐𝑡𝑜𝑟
After calculating savings estimates by quarter for the implementation periods for each practice, we aggregated
savings for all SIM PCP practices and CMHCs in total, as well as by practice type. Due to populations in pediatric
practices differing widely from those in internal medicine practices, we summarized PCP practice savings by
pediatric, mixed primary care, and internal medicine practice type, as shown in the results section above. The
SIM office provided these classifications for all participating practices.

Milliman SIM July 2019 ROI Report
July 19, 2019 7
Offices in Principal Cities Worldwide
CAVEATS AND LIMITATIONS
We relied on the All Payer Claim Database (APCD) provided by CIVHC on June 10, 2019, for this analysis. We
also relied on the SIM multi-year attribution file provided by CIVHC in March 2019, the CMHC attribution file
received on June 24, 2019, and the de-duplicated provider and practice NPI lists for aggregate reporting
provided by the SIM office and TriWest on July 3 and July 7, 2019. We have not audited the data but have
reviewed this version of the APCD for reasonability and have made adjustments to interpolate or exclude erratic
or missing data accordingly. We relied on the Medicaid BHO data provided by the Colorado Department of
Health Care Policy and Financing (HCPF) on April 5, 2019. Due to 42 CFR Part 2, substance use claims are
restricted in this data, meaning behavioral healthcare claims may be underreported. No adjustments have been
made to supplement potentially underreported behavioral healthcare claims. This applies to both the baseline
years and the projection years. If there are any errors or omissions in the provided data, our results may be
impacted.
We also relied on estimates of SIM expenses to-date provided by the SIM office on June 11, 2019 for the
calculation of return-on-investment (ROI) in this report. To the extent that SIM expense estimates are
understated, ROI may be overstated, and vice versa.
This analysis is intended for the use of the SIM office and CMMI in evaluating the program’s ROI in July 2019.
Other uses may be inappropriate. No portion of this information may be provided to any other party without
Milliman's prior written consent. Milliman does not intend to benefit or create a legal duty to any third party
recipient of its work.
There are several considerations to note that may affect the results of this analysis:
The APCD includes data from public payers, private payers, and several self-insurers across the state.
The APCD does not include BHO encounter data, TRICARE data, or all self-insured data in Colorado.
As noted above, we exclude or interpolate data for payers with erratic or missing submissions to avoid
skewing the average costs per member per month calculated for this analysis. To the extent that
missing data in the APCD causes actual costs for the SIM attributed population to emerge differently
than the data that is currently being included in this analysis, savings and ROI calculations will be
affected.
We received a file with Medicaid BHO encounter data for fiscal years 2015 through 2018 from the SIM
office on April 5, 2019. This data was used for the first time in this analysis. In the data set, there are
fee-for-service (FFS) payments and payments made through subcapitation. For those made under
subcapitation, some BHOs populate this cost value based on the previous year’s base unit cost, while
others might provide a 1 or a 0. FFS costs were used as provided, as well as subcapitated claim
amounts that were populated with a prior year base cost. For the subcapitated claims populated with a
1 or 0, we assigned the average cost per unit by calendar year in the data.
Data for community mental health centers is included in this analysis. We have assumed the same
baseline and model test years for the CMHCs as for the Cohort 1 SIM primary care physician (PCP)
practices (2015 and 2016+ respectively). To the extent that SIM implementation for any of the CMHCs
did not line up with these time periods, savings and ROI calculations may be affected.
Attribution of SIM PCP practices is performed by CIVHC at the National Provider Identifier (NPI) level.
We are aware that multiple sites in a provider system may bill to one practice site. To the extent that
multiple sites (both participating and not participating in the SIM program) use the same NPI, member
attribution and projected savings may be skewed.

Milliman SIM July 2019 ROI Report
July 19, 2019 8
Offices in Principal Cities Worldwide
We relied on CIVHC’s multi-year attribution file to develop these results, where members are attributed
to Cohort 1 NPIs using 2015 attribution and Cohort 2 NPIs using 2016 attribution. Any members that
were attributed to more than one cohort were attributed to the Cohort 1 NPI to avoid duplication.
Additionally, any members attributed to both a CMHC and a primary care practice were attributed to
the CMHC.
A number of factors can affect healthcare costs in any measurement period. In this analysis, we
compare actual costs to projected costs and consider the differences as “savings” or avoided costs
when actual costs are lower than projected costs. These differences can be caused by random
fluctuation, changes in health technology, inflation, demographic changes, personal care changes,
accident rates, and a number of other factors. We made adjustments for expected morbidity levels
using MARA risk scores between the baseline period and each implementation period. We consider
any savings relative to projected costs to be correlated with the SIM practice care patterns and, thus,
relate these SIM practice healthcare cost savings to the CMMI SIM investment.
The healthcare cost savings reflected in this report were estimated using risk-adjusted APCD claims
data, as differences in costs between time periods incorporate differences in morbidity and
demographic mix of the populations within each practice during the two comparison periods.
Concurrent risk scores were used in this analysis. Risk scores are not perfect representations of actual
claims costs; however, risk scores are commonly used to quantify member and population morbidity
and are useful in comparing healthcare costs over time. Risk scores tend to show greater variations
over time for small sample sizes. As noted below, we aggregated projected costs across each
participating SIM practice in this analysis without making any adjustments for credibility of small practice
sizes. More information about risk adjustment is provided in the “Methodology” section of this report.
While many of the clinical features that impact risk scores tend to be persistent over time, in some
cases the improvements in care management achieved through integration could lead some patients
to experience decreases in disease severity over time. To the extent that this occurs, risk-adjusted
costs may understate the true savings achieved through the program.
We made adjustments to remove members with large claims, at or exceeding $250,000 during the base
year or first two implementation years for Cohort 1 and base year or first implementation year for Cohort
2, from this analysis. Large claims are typically generated by very expensive acute events that include
significant hospital care. They may come from accidents, premature babies, or high cost surgeries and
treatments. This adjustment dampens the impact of large claim prevalence and amounts differing
between the baseline periods and first implementation periods. To the extent that the impact of other
fairly large claims (e.g. those between $200,000 and $250,000) is skewed between the baseline and
implementation periods, our projected results may be affected and not representative of the true
savings.
In addition to the large claim adjustments, we also incorporated criteria requiring minimum eligibility for
member inclusion in the analysis, described in the “ROI Results” section below. The purpose of the
criteria is to establish a stable patient base between the baselines and experience periods so that
projections are not unreasonably skewed by patients in one period and not the other. A potential side-
effect of applying exclusion criteria to the analysis is introducing bias in the ROI calculations. While the
goal of the criteria is to reduce noise in the projections while limiting potential biases, results may be
impacted by the selected criteria.

Milliman SIM July 2019 ROI Report
July 19, 2019 9
Offices in Principal Cities Worldwide
In setting trend rates, we calculated trends in the APCD over the past several years by service category.
The trend rates implied in the APCD fluctuated widely year over year. This significant variation did not
produce stable trend rates that could be applied within our calculations, and thus we relied primarily on
Milliman proprietary data, Colorado HCPF trend data, and national Medicaid data to select trends. We
used the low end of Milliman published trend ranges for the Commercial and Medicare lines of business
in these calculations in order to be conservative. To the extent that these trend rates do not reflect the
SIM population, our projected costs and savings estimates may be affected and not representative of
the true savings. The impact of increasing or decreasing trend assumptions is further evaluated in the
Methodology section and the ROI Results section.
Total savings attributed to the SIM program were calculated by aggregating the savings estimates
across each participating practice. Several SIM practices do not have enough attributed membership
to be considered credible. For the purposes of this analysis, we did not make any adjustments for
credibility.
Guidelines issued by the American Academy of Actuaries require actuaries to include their professional
qualifications in all actuarial communications. Stephen P. Melek and Alexandra (Ally) Weaver are members of
the American Academy of Actuaries, and meet the qualification standards for performing the analyses in this
report.

Milliman SIM July 2019 ROI Report
July 19, 2019 10
Offices in Principal Cities Worldwide
ROI RESULTS
We report healthcare cost savings (i.e. avoided costs) by line of business (Commercial, Medicaid, and
Medicare) and calendar quarter. These results rely on data from the APCD and from BHO encounter data for
Medicaid members.
Cost savings occur when actual emerging healthcare costs are lower than those we projected for the experience
periods (please see the following section for more detail regarding our methodology).
Table 5 shows our projected healthcare cost savings estimates for all Cohort 1 SIM PCP practices combined
by line of business and quarter for calendar years 2016 and 2017. Table 6 shows these savings for all CMHCs
combined. Tables 7 through 9 show PCP results broken out further for all Mixed Primary Care practice sites
combined, all Internal Medicine practice sites combined, and all Pediatric practice sites combined, respectively.
Table 10 shows our projected healthcare cost savings estimates for all Cohort 2 SIM PCP practices combined
by line of business and quarter for calendar year 2017. Tables 11 through 13 show these SIM PCP results
broken out further for all Mixed Primary Care practice sites combined, all Internal Medicine practice sites
combined, and all Pediatric practice sites combined, respectively.
Table 14 shows a summary of projected healthcare cost savings estimates by year for all Cohort 1 SIM PCP
practices, Cohort 2 SIM PCP practices, and CMHCs combined.

Milliman SIM July 2019 ROI Report
July 19, 2019 11
Offices in Principal Cities Worldwide
Table 5: Total Projected Healthcare Cost Savings Estimates – PCP Practices – Cohort 1
Line of Business
Calendar Period
Projected PMPM
Actual PMPM
Savings PMPM
Member Months
Total Savings
Commercial 1Q 2016 $386.10 $392.95 ($6.86) 136,543 ($936,647)
Medicaid 1Q 2016 $293.88 $275.51 $18.37 484,987 $8,907,982
Medicare 1Q 2016 $1,055.63 $1,031.68 $23.95 114,500 $2,742,207
Total 1Q 2016 $429.49 $414.93 $14.56 736,030 $10,713,543
Commercial 2Q 2016 $396.08 $383.04 $13.04 137,442 $1,792,337
Medicaid 2Q 2016 $285.89 $272.45 $13.43 485,486 $6,521,850
Medicare 2Q 2016 $1,097.28 $999.78 $97.50 114,641 $11,177,094
Total 2Q 2016 $432.53 $406.11 $26.43 737,569 $19,491,281
Commercial 3Q 2016 $391.81 $375.43 $16.39 137,449 $2,252,237
Medicaid 3Q 2016 $291.87 $297.93 ($6.06) 484,194 ($2,932,673)
Medicare 3Q 2016 $1,085.92 $1,021.13 $64.79 114,737 $7,434,128
Total 3Q 2016 $434.25 $425.08 $9.17 736,380 $6,753,692
Commercial 4Q 2016 $429.00 $408.75 $20.26 136,885 $2,772,779
Medicaid 4Q 2016 $276.60 $294.23 ($17.63) 481,758 ($8,495,674)
Medicare 4Q 2016 $1,109.78 $1,025.51 $84.27 114,720 $9,667,714
Total 4Q 2016 $435.38 $430.00 $5.38 733,363 $3,944,819
Commercial 2016 $400.74 $390.02 $10.72 548,319 $5,880,706
Medicaid 2016 $287.07 $285.01 $2.07 1,936,425 $4,001,485
Medicare 2016 $1,087.16 $1,019.52 $67.64 458,598 $31,021,143
Total 2016 $432.91 $419.01 $13.90 2,943,342 $40,903,334

Milliman SIM July 2019 ROI Report
July 19, 2019 12
Offices in Principal Cities Worldwide
Table 5 (continued): Total Projected Healthcare Cost Savings Estimates – PCP Practices – Cohort 1
Line of Business
Calendar Period
Projected PMPM
Actual PMPM
Savings PMPM
Member Months
Total Savings
Commercial 1Q 2017 $407.27 $371.17 $36.10 136,901 $4,942,751
Medicaid 1Q 2017 $324.65 $312.10 $12.56 479,030 $6,014,723
Medicare 1Q 2017 $1,209.85 $1,051.23 $158.62 117,877 $18,697,596
Total 1Q 2017 $482.26 $441.85 $40.41 733,808 $29,655,070
Commercial 2Q 2017 $418.43 $386.79 $31.64 137,861 $4,361,895
Medicaid 2Q 2017 $316.08 $316.66 ($0.58) 481,321 ($279,080)
Medicare 2Q 2017 $1,258.29 $1,035.86 $222.43 117,990 $26,244,515
Total 2Q 2017 $486.03 $444.89 $41.14 737,172 $30,327,330
Commercial 3Q 2017 $413.52 $395.62 $17.90 134,624 $2,409,275
Medicaid 3Q 2017 $323.70 $326.09 ($2.39) 472,295 ($1,127,941)
Medicare 3Q 2017 $1,245.23 $1,040.50 $204.73 117,270 $24,008,821
Total 3Q 2017 $489.62 $454.70 $34.92 724,189 $25,290,156
Commercial 4Q 2017 $452.29 $429.11 $23.18 128,721 $2,984,056
Medicaid 4Q 2017 $306.02 $339.87 ($33.84) 451,500 ($15,281,001)
Medicare 4Q 2017 $1,272.55 $1,074.35 $198.20 115,906 $22,972,984
Total 4Q 2017 $494.00 $478.66 $15.34 696,127 $10,676,040
Commercial 2017 $422.46 $395.15 $27.31 538,107 $14,697,978
Medicaid 2017 $317.76 $323.42 ($5.66) 1,884,146 ($10,673,299)
Medicare 2017 $1,246.37 $1,050.39 $195.98 469,043 $91,923,916
Total 2017 $487.89 $454.71 $33.19 2,891,296 $95,948,596

Milliman SIM July 2019 ROI Report
July 19, 2019 13
Offices in Principal Cities Worldwide
Table 6: Total Projected Healthcare Cost Savings Estimates – CMHCs
Line of Business
Calendar Period
Projected PMPM
Actual PMPM
Savings PMPM
Member Months
Total Savings
Commercial 1Q 2016 $441.27 $335.79 $105.48 2,379 $250,930
Medicaid 1Q 2016 $700.38 $606.24 $94.15 42,404 $3,992,205
Medicare 1Q 2016 $1,830.15 $1,681.34 $148.81 6,471 $962,948
Total 1Q 2016 $830.99 $729.42 $101.57 51,254 $5,206,083
Commercial 2Q 2016 $456.05 $375.68 $80.37 2,455 $197,312
Medicaid 2Q 2016 $680.13 $677.91 $2.22 42,473 $94,308
Medicare 2Q 2016 $1,894.09 $1,724.91 $169.18 6,480 $1,096,305
Total 2Q 2016 $822.45 $795.45 $27.00 51,408 $1,387,926
Commercial 3Q 2016 $449.51 $482.89 ($33.39) 2,412 ($80,533)
Medicaid 3Q 2016 $694.79 $687.92 $6.87 42,463 $291,911
Medicare 3Q 2016 $1,884.52 $1,831.95 $52.57 6,484 $340,854
Total 3Q 2016 $833.47 $822.72 $10.75 51,359 $552,232
Commercial 4Q 2016 $485.06 $597.12 ($112.06) 2,378 ($266,489)
Medicaid 4Q 2016 $657.53 $673.71 ($16.18) 42,176 ($682,402)
Medicare 4Q 2016 $1,922.66 $1,845.35 $77.31 6,480 $500,958
Total 4Q 2016 $810.13 $818.91 ($8.78) 51,034 ($447,933)
Commercial 2016 $457.92 $447.41 $10.52 9,624 $101,220
Medicaid 2016 $683.25 $661.44 $21.80 169,516 $3,696,023
Medicare 2016 $1,882.88 $1,770.93 $111.95 25,915 $2,901,065
Total 2016 $824.28 $791.62 $32.67 205,055 $6,698,308

Milliman SIM July 2019 ROI Report
July 19, 2019 14
Offices in Principal Cities Worldwide
Table 6 (continued): Total Projected Healthcare Cost Savings Estimates – CMHCs
Line of Business
Calendar Period
Projected PMPM
Actual PMPM
Savings PMPM
Member Months
Total Savings
Commercial 1Q 2017 $527.35 $453.69 $73.66 2,279 $167,874
Medicaid 1Q 2017 $721.54 $645.77 $75.77 41,729 $3,161,977
Medicare 1Q 2017 $2,074.39 $1,852.08 $222.31 7,069 $1,571,493
Total 1Q 2017 $900.11 $804.15 $95.96 51,077 $4,901,344
Commercial 2Q 2017 $548.82 $492.05 $56.77 2,316 $131,474
Medicaid 2Q 2017 $700.62 $663.93 $36.70 41,993 $1,541,056
Medicare 2Q 2017 $2,147.49 $1,783.74 $363.75 7,075 $2,573,520
Total 2Q 2017 $893.00 $810.37 $82.63 51,384 $4,246,049
Commercial 3Q 2017 $542.10 $467.87 $74.23 2,270 $168,498
Medicaid 3Q 2017 $718.60 $637.03 $81.57 41,286 $3,367,751
Medicare 3Q 2017 $2,138.06 $1,798.60 $339.46 7,022 $2,383,693
Total 3Q 2017 $907.75 $790.71 $117.05 50,578 $5,919,942
Commercial 4Q 2017 $581.75 $553.27 $28.48 2,127 $60,580
Medicaid 4Q 2017 $681.77 $677.03 $4.75 39,456 $187,331
Medicare 4Q 2017 $2,183.53 $1,745.00 $438.53 6,961 $3,052,616
Total 4Q 2017 $892.74 $824.75 $67.99 48,544 $3,300,527
Commercial 2017 $549.47 $490.70 $58.77 8,992 $528,427
Medicaid 2017 $705.92 $655.71 $50.21 164,464 $8,258,115
Medicare 2017 $2,135.68 $1,795.04 $340.64 28,127 $9,581,321
Total 2017 $898.44 $807.32 $91.12 201,583 $18,367,863

Milliman SIM July 2019 ROI Report
July 19, 2019 15
Offices in Principal Cities Worldwide
Table 7: Total Projected Healthcare Cost Savings Estimates – Mixed Primary Care – Cohort 1
Line of Business
Calendar Period
Projected PMPM
Actual PMPM
Savings PMPM
Member Months
Total Savings
Commercial 1Q 2016 $424.25 $427.78 ($3.53) 99,979 ($353,380)
Medicaid 1Q 2016 $382.27 $347.41 $34.86 263,651 $9,191,614
Medicare 1Q 2016 $1,045.64 $1,027.39 $18.25 95,619 $1,744,944
Total 1Q 2016 $529.53 $506.48 $23.04 459,249 $10,583,178
Commercial 2Q 2016 $435.25 $418.26 $16.99 100,719 $1,710,728
Medicaid 2Q 2016 $371.33 $346.93 $24.40 263,827 $6,436,560
Medicare 2Q 2016 $1,086.56 $988.11 $98.44 95,748 $9,425,854
Total 2Q 2016 $534.09 $495.92 $38.18 460,294 $17,573,142
Commercial 3Q 2016 $430.08 $412.80 $17.28 100,740 $1,740,347
Medicaid 3Q 2016 $382.10 $391.04 ($8.94) 262,841 ($2,349,715)
Medicare 3Q 2016 $1,075.67 $1,010.62 $65.05 95,844 $6,234,722
Total 3Q 2016 $537.31 $525.07 $12.24 459,425 $5,625,354
Commercial 4Q 2016 $472.11 $449.71 $22.40 100,299 $2,246,472
Medicaid 4Q 2016 $361.07 $375.81 ($14.74) 261,233 ($3,850,454)
Medicare 4Q 2016 $1,099.17 $1,014.81 $84.36 95,844 $8,085,113
Total 4Q 2016 $540.09 $525.92 $14.17 457,376 $6,481,132
Commercial 2016 $440.42 $427.11 $13.30 401,737 $5,344,167
Medicaid 2016 $374.22 $365.25 $8.97 1,051,552 $9,428,005
Medicare 2016 $1,076.77 $1,010.23 $66.55 383,055 $25,490,632
Total 2016 $535.25 $513.33 $21.93 1,836,344 $40,262,805

Milliman SIM July 2019 ROI Report
July 19, 2019 16
Offices in Principal Cities Worldwide
Table 7 (continued): Total Projected Healthcare Cost Savings Estimates – Mixed Primary Care – Cohort 1 Line of Business
Calendar Period
Projected PMPM
Actual PMPM
Savings PMPM
Member Months
Total Savings
Commercial 1Q 2017 $448.26 $408.76 $39.50 99,750 $3,940,348
Medicaid 1Q 2017 $419.29 $397.98 $21.31 259,271 $5,525,339
Medicare 1Q 2017 $1,192.86 $1,042.22 $150.64 98,691 $14,866,542
Total 1Q 2017 $592.40 $539.24 $53.16 457,712 $24,332,230
Commercial 2Q 2017 $460.38 $423.20 $37.18 100,490 $3,736,690
Medicaid 2Q 2017 $407.43 $401.23 $6.20 260,923 $1,617,161
Medicare 2Q 2017 $1,240.29 $1,018.72 $221.58 98,803 $21,892,700
Total 2Q 2017 $597.80 $538.59 $59.20 460,216 $27,246,551
Commercial 3Q 2017 $454.81 $437.83 $16.98 98,072 $1,665,551
Medicaid 3Q 2017 $420.16 $416.37 $3.78 256,122 $968,482
Medicare 3Q 2017 $1,227.81 $1,022.30 $205.50 98,158 $20,171,620
Total 3Q 2017 $602.92 $552.51 $50.42 452,352 $22,805,653
Commercial 4Q 2017 $499.10 $481.70 $17.39 93,627 $1,628,218
Medicaid 4Q 2017 $396.97 $431.56 ($34.59) 243,089 ($8,408,030)
Medicare 4Q 2017 $1,254.92 $1,052.67 $202.25 97,034 $19,625,507
Total 4Q 2017 $610.95 $581.33 $29.62 433,750 $12,845,695
Commercial 2017 $465.15 $437.16 $27.99 391,939 $10,970,808
Medicaid 2017 $411.15 $411.44 ($0.29) 1,019,405 ($297,048)
Medicare 2017 $1,228.86 $1,033.91 $194.96 392,686 $76,556,369
Total 2017 $600.88 $552.52 $48.35 1,804,030 $87,230,129

Milliman SIM July 2019 ROI Report
July 19, 2019 17
Offices in Principal Cities Worldwide
Table 8: Total Projected Healthcare Cost Savings Estimates – Internal Medicine Practices – Cohort 1
Line of Business
Calendar Period
Projected PMPM
Actual PMPM
Savings PMPM
Member Months
Total Savings
Commercial 1Q 2016 $673.66 $710.12 ($36.46) 7,378 ($269,029)
Medicaid 1Q 2016 $376.23 $322.07 $54.16 27,486 $1,488,545
Medicare 1Q 2016 $1,169.14 $1,119.01 $50.13 17,177 $861,154
Total 1Q 2016 $680.11 $640.13 $39.98 52,041 $2,080,671
Commercial 2Q 2016 $692.41 $667.48 $24.93 7,404 $184,609
Medicaid 2Q 2016 $367.26 $321.39 $45.87 27,507 $1,261,768
Medicare 2Q 2016 $1,217.46 $1,120.55 $96.91 17,183 $1,665,207
Total 2Q 2016 $693.91 $634.18 $59.73 52,094 $3,111,583
Commercial 3Q 2016 $685.46 $667.40 $18.06 7,401 $133,660
Medicaid 3Q 2016 $372.12 $339.67 $32.44 27,391 $888,675
Medicare 3Q 2016 $1,202.19 $1,141.44 $60.75 17,189 $1,044,274
Total 3Q 2016 $691.22 $651.46 $39.76 51,981 $2,066,608
Commercial 4Q 2016 $753.25 $750.96 $2.30 7,382 $16,946
Medicaid 4Q 2016 $353.10 $369.14 ($16.04) 27,269 ($437,329)
Medicare 4Q 2016 $1,229.26 $1,141.70 $87.56 17,177 $1,504,086
Total 4Q 2016 $700.48 $679.57 $20.91 51,828 $1,083,703
Commercial 2016 $701.18 $698.94 $2.24 29,565 $66,185
Medicaid 2016 $367.20 $338.00 $29.20 109,653 $3,201,659
Medicare 2016 $1,204.51 $1,130.67 $73.84 68,726 $5,074,721
Total 2016 $691.42 $651.30 $40.12 207,944 $8,342,565

Milliman SIM July 2019 ROI Report
July 19, 2019 18
Offices in Principal Cities Worldwide
Table 8 (continued): Total Projected Healthcare Cost Savings Estimates – Internal Medicine Practices – Cohort 1 Line of Business
Calendar Period
Projected PMPM
Actual PMPM
Savings PMPM
Member Months
Total Savings
Commercial 1Q 2017 $754.94 $667.20 $87.74 7,139 $626,365
Medicaid 1Q 2017 $460.32 $355.94 $104.37 27,317 $2,851,207
Medicare 1Q 2017 $1,363.97 $1,158.97 $205.01 17,351 $3,557,072
Total 1Q 2017 $803.57 $667.78 $135.79 51,807 $7,034,644
Commercial 2Q 2017 $777.55 $796.57 ($19.02) 7,235 ($137,587)
Medicaid 2Q 2017 $448.45 $399.15 $49.29 27,453 $1,353,284
Medicare 2Q 2017 $1,420.89 $1,196.86 $224.03 17,352 $3,887,321
Total 2Q 2017 $818.45 $720.39 $98.06 52,040 $5,103,018
Commercial 3Q 2017 $769.17 $697.78 $71.39 7,034 $502,164
Medicaid 3Q 2017 $455.76 $372.75 $83.01 27,138 $2,252,614
Medicare 3Q 2017 $1,402.27 $1,211.10 $191.17 17,290 $3,305,245
Total 3Q 2017 $816.60 $698.84 $117.76 51,462 $6,060,023
Commercial 4Q 2017 $845.71 $755.54 $90.17 6,716 $605,608
Medicaid 4Q 2017 $432.46 $395.39 $37.07 26,070 $966,341
Medicare 4Q 2017 $1,432.03 $1,268.47 $163.56 17,089 $2,795,071
Total 4Q 2017 $830.59 $743.03 $87.56 49,875 $4,367,021
Commercial 2017 $785.99 $729.22 $56.77 28,124 $1,596,550
Medicaid 2017 $449.43 $380.68 $68.75 107,978 $7,423,446
Medicare 2017 $1,404.69 $1,208.62 $196.07 69,082 $13,544,709
Total 2017 $817.18 $707.21 $109.97 205,184 $22,564,705

Milliman SIM July 2019 ROI Report
July 19, 2019 19
Offices in Principal Cities Worldwide
Table 9: Total Projected Healthcare Cost Savings Estimates – Pediatric Practices – Cohort 1
Line of Business
Calendar Period
Projected PMPM
Actual PMPM
Savings PMPM
Member Months
Total Savings
Commercial 1Q 2016 $182.71 $193.48 ($10.77) 29,186 ($314,237)
Medicaid 1Q 2016 $161.99 $171.13 ($9.14) 193,850 ($1,772,177)
Medicare 1Q 2016 $471.82 $391.95 $79.88 1,704 $136,109
Total 1Q 2016 $167.03 $175.70 ($8.68) 224,740 ($1,950,306)
Commercial 2Q 2016 $186.70 $190.21 ($3.51) 29,319 ($103,000)
Medicaid 2Q 2016 $158.25 $164.31 ($6.06) 194,152 ($1,176,478)
Medicare 2Q 2016 $489.82 $439.51 $50.31 1,710 $86,033
Total 2Q 2016 $164.47 $169.77 ($5.30) 225,181 ($1,193,444)
Commercial 3Q 2016 $186.14 $173.23 $12.91 29,308 $378,230
Medicaid 3Q 2016 $158.27 $165.85 ($7.59) 193,962 ($1,471,632)
Medicare 3Q 2016 $489.32 $398.28 $91.04 1,704 $155,133
Total 3Q 2016 $164.40 $168.57 ($4.17) 224,974 ($938,270)
Commercial 4Q 2016 $199.01 $181.57 $17.44 29,204 $509,361
Medicaid 4Q 2016 $151.62 $173.39 ($21.77) 193,256 ($4,207,892)
Medicare 4Q 2016 $500.57 $454.36 $46.21 1,699 $78,515
Total 4Q 2016 $160.44 $176.59 ($16.15) 224,159 ($3,620,016)
Commercial 2016 $188.64 $184.62 $4.02 117,017 $470,354
Medicaid 2016 $157.53 $168.66 ($11.13) 775,220 ($8,628,179)
Medicare 2016 $487.88 $421.01 $66.86 6,817 $455,790
Total 2016 $164.09 $172.65 ($8.57) 899,054 ($7,702,036)

Milliman SIM July 2019 ROI Report
July 19, 2019 20
Offices in Principal Cities Worldwide
Table 9 (continued): Total Projected Healthcare Cost Savings Estimates – Pediatric Practices – Cohort 1 Line of Business
Calendar Period
Projected PMPM
Actual PMPM
Savings PMPM
Member Months
Total Savings
Commercial 1Q 2017 $188.32 $175.79 $12.53 30,012 $376,038
Medicaid 1Q 2017 $177.89 $190.16 ($12.27) 192,442 ($2,361,823)
Medicare 1Q 2017 $666.34 $517.03 $149.31 1,835 $273,981
Total 1Q 2017 $183.28 $190.91 ($7.63) 224,289 ($1,711,804)
Commercial 2Q 2017 $192.34 $167.03 $25.31 30,136 $762,792
Medicaid 2Q 2017 $173.72 $190.57 ($16.84) 192,945 ($3,249,525)
Medicare 2Q 2017 $689.47 $436.34 $253.13 1,835 $464,493
Total 2Q 2017 $180.43 $189.42 ($8.99) 224,916 ($2,022,239)
Commercial 3Q 2017 $191.58 $183.39 $8.18 29,518 $241,560
Medicaid 3Q 2017 $174.05 $197.06 ($23.01) 189,035 ($4,349,037)
Medicare 3Q 2017 $693.53 $401.57 $291.96 1,822 $531,957
Total 3Q 2017 $180.69 $196.92 ($16.22) 220,375 ($3,575,520)
Commercial 4Q 2017 $204.76 $178.33 $26.44 28,378 $750,230
Medicaid 4Q 2017 $166.69 $209.68 ($42.99) 182,341 ($7,839,312)
Medicare 4Q 2017 $703.53 $393.72 $309.82 1,783 $552,405
Total 4Q 2017 $176.28 $207.04 ($30.76) 212,502 ($6,536,676)
Commercial 2017 $194.11 $176.06 $18.05 118,044 $2,130,621
Medicaid 2017 $173.17 $196.69 ($23.52) 756,763 ($17,799,697)
Medicare 2017 $688.10 $437.54 $250.56 7,275 $1,822,837
Total 2017 $180.22 $195.92 ($15.70) 882,082 ($13,846,239)

Milliman SIM July 2019 ROI Report
July 19, 2019 21
Offices in Principal Cities Worldwide
Table 10: Total Projected Healthcare Cost Savings Estimates – PCP Practices – Cohort 2
Line of Business
Calendar Period
Projected PMPM
Actual PMPM
Savings PMPM
Member Months
Total Savings
Commercial 1Q 2017 $385.68 $357.17 $28.52 144,166 $4,111,402
Medicaid 1Q 2017 $333.18 $358.50 ($25.32) 269,508 ($6,824,131)
Medicare 1Q 2017 $1,014.84 $910.21 $104.63 85,428 $8,938,282
Total 1Q 2017 $465.02 $452.55 $12.47 499,102 $6,225,554
Commercial 2Q 2017 $394.46 $376.92 $17.54 145,464 $2,552,028
Medicaid 2Q 2017 $329.29 $359.90 ($30.60) 270,666 ($8,283,707)
Medicare 2Q 2017 $1,005.85 $908.47 $97.38 85,584 $8,334,281
Total 2Q 2017 $463.59 $458.41 $5.19 501,714 $2,602,603
Commercial 3Q 2017 $402.49 $386.28 $16.21 141,670 $2,297,112
Medicaid 3Q 2017 $343.42 $354.14 ($10.72) 264,356 ($2,835,073)
Medicare 3Q 2017 $1,033.54 $929.30 $104.24 85,078 $8,868,665
Total 3Q 2017 $480.01 $463.05 $16.96 491,104 $8,330,703
Commercial 4Q 2017 $423.81 $412.34 $11.47 136,050 $1,560,807
Medicaid 4Q 2017 $333.79 $373.05 ($39.26) 250,282 ($9,825,054)
Medicare 4Q 2017 $1,051.55 $959.51 $92.04 84,135 $7,743,469
Total 4Q 2017 $488.18 $489.29 ($1.11) 470,467 ($520,779)
Commercial 2017 $401.27 $382.73 $18.54 567,350 $10,521,349
Medicaid 2017 $334.89 $361.22 ($26.33) 1,054,812 ($27,767,965)
Medicare 2017 $1,026.33 $926.74 $99.59 340,225 $33,884,697
Total 2017 $473.96 $465.48 $8.48 1,962,387 $16,638,081

Milliman SIM July 2019 ROI Report
July 19, 2019 22
Offices in Principal Cities Worldwide
Table 11: Total Projected Healthcare Cost Savings Estimates–Mixed Primary Care Practices–Cohort 2
Line of Business
Calendar Period
Projected PMPM
Actual PMPM
Savings PMPM
Member Months
Total Savings
Commercial 1Q 2017 $425.07 $397.90 $27.17 110,986 $3,015,187
Medicaid 1Q 2017 $334.06 $345.71 ($11.66) 181,417 ($2,114,565)
Medicare 1Q 2017 $970.50 $873.61 $96.89 75,621 $7,327,069
Total 1Q 2017 $492.28 $469.92 $22.36 368,024 $8,227,692
Commercial 2Q 2017 $435.10 $417.30 $17.81 111,997 $1,994,370
Medicaid 2Q 2017 $329.51 $348.99 ($19.47) 182,483 ($3,553,425)
Medicare 2Q 2017 $961.05 $870.58 $90.47 75,767 $6,854,640
Total 2Q 2017 $490.69 $476.39 $14.30 370,247 $5,295,586
Commercial 3Q 2017 $444.75 $416.92 $27.83 109,005 $3,033,608
Medicaid 3Q 2017 $344.88 $343.85 $1.03 177,993 $183,235
Medicare 3Q 2017 $987.61 $894.46 $93.15 75,329 $7,016,980
Total 3Q 2017 $508.55 $480.31 $28.24 362,327 $10,233,823
Commercial 4Q 2017 $469.02 $457.84 $11.18 104,604 $1,169,459
Medicaid 4Q 2017 $334.13 $356.01 ($21.88) 167,378 ($3,661,738)
Medicare 4Q 2017 $1,004.49 $917.87 $86.62 74,483 $6,451,828
Total 4Q 2017 $518.97 $507.54 $11.43 346,465 $3,959,549
Commercial 2017 $443.09 $421.99 $21.10 436,592 $9,212,625
Medicaid 2017 $335.62 $348.52 ($12.90) 709,271 ($9,146,493)
Medicare 2017 $980.81 $889.01 $91.80 301,200 $27,650,518
Total 2017 $502.34 $483.18 $19.15 1,447,063 $27,716,649

Milliman SIM July 2019 ROI Report
July 19, 2019 23
Offices in Principal Cities Worldwide
Table 12: Total Projected Healthcare Cost Savings Estimates – Internal Medicine Practices – Cohort 2
Line of Business
Calendar Period
Projected PMPM
Actual PMPM
Savings PMPM
Member Months
Total Savings
Commercial 1Q 2017 $678.18 $641.63 $36.55 3,758 $137,351
Medicaid 1Q 2017 $1,329.99 $1,247.61 $82.37 3,080 $253,712
Medicare 1Q 2017 $1,327.78 $1,154.16 $173.63 8,982 $1,559,502
Total 1Q 2017 $1,173.90 $1,050.60 $123.30 15,820 $1,950,565
Commercial 2Q 2017 $698.24 $607.26 $90.98 3,816 $347,192
Medicaid 2Q 2017 $1,322.03 $1,349.42 ($27.40) 3,108 ($85,147)
Medicare 2Q 2017 $1,319.24 $1,189.49 $129.75 8,986 $1,165,938
Total 2Q 2017 $1,170.84 $1,081.09 $89.75 15,910 $1,427,982
Commercial 3Q 2017 $712.64 $827.46 ($114.82) 3,645 ($418,533)
Medicaid 3Q 2017 $1,393.21 $1,313.32 $79.88 3,047 $243,404
Medicare 3Q 2017 $1,357.81 $1,195.24 $162.57 8,926 $1,451,096
Total 3Q 2017 $1,214.14 $1,132.45 $81.70 15,618 $1,275,966
Commercial 4Q 2017 $755.71 $678.05 $77.66 3,478 $270,094
Medicaid 4Q 2017 $1,353.18 $1,357.69 ($4.51) 2,903 ($13,081)
Medicare 4Q 2017 $1,383.70 $1,276.96 $106.75 8,839 $943,524
Total 4Q 2017 $1,234.37 $1,155.50 $78.88 15,220 $1,200,537
Commercial 2017 $710.28 $687.41 $22.87 14,697 $336,103
Medicaid 2017 $1,349.37 $1,316.50 $32.86 12,138 $398,887
Medicare 2017 $1,346.97 $1,203.68 $143.29 35,733 $5,120,059
Total 2017 $1,197.88 $1,104.30 $93.58 62,568 $5,855,050

Milliman SIM July 2019 ROI Report
July 19, 2019 24
Offices in Principal Cities Worldwide
Table 13: Total Projected Healthcare Cost Savings Estimates – Pediatric Practices – Cohort 2
Line of Business
Calendar Period
Projected PMPM
Actual PMPM
Savings PMPM
Member Months
Total Savings
Commercial 1Q 2017 $199.96 $167.37 $32.59 29,422 $958,864
Medicaid 1Q 2017 $295.18 $353.56 ($58.38) 85,011 ($4,963,278)
Medicare 1Q 2017 $1,674.30 $1,611.62 $62.68 825 $51,711
Total 1Q 2017 $280.74 $315.04 ($34.29) 115,258 ($3,952,702)
Commercial 2Q 2017 $202.06 $194.96 $7.10 29,651 $210,466
Medicaid 2Q 2017 $292.51 $347.11 ($54.60) 85,075 ($4,645,135)
Medicare 2Q 2017 $1,662.98 $1,285.48 $377.50 831 $313,704
Total 2Q 2017 $279.16 $314.82 ($35.66) 115,557 ($4,120,965)
Commercial 3Q 2017 $205.14 $216.09 ($10.96) 29,020 ($317,964)
Medicaid 3Q 2017 $301.84 $340.99 ($39.15) 83,316 ($3,261,712)
Medicare 3Q 2017 $1,719.85 $1,233.11 $486.74 823 $400,589
Total 3Q 2017 $287.36 $315.45 ($28.09) 113,159 ($3,179,086)
Commercial 4Q 2017 $213.85 $209.52 $4.34 27,968 $121,254
Medicaid 4Q 2017 $295.99 $372.86 ($76.88) 80,001 ($6,150,235)
Medicare 4Q 2017 $1,752.81 $1,324.62 $428.19 813 $348,117
Total 4Q 2017 $285.76 $337.98 ($52.22) 108,782 ($5,680,864)
Commercial 2017 $205.14 $196.76 $8.38 116,061 $972,621
Medicaid 2017 $296.36 $353.41 ($57.05) 333,403 ($19,020,359)
Medicare 2017 $1,702.22 $1,363.79 $338.43 3,292 $1,114,121
Total 2017 $283.20 $320.60 ($37.40) 452,756 ($16,933,618)

Milliman SIM July 2019 ROI Report
July 19, 2019 25
Offices in Principal Cities Worldwide
Table 14: Summary of Cost Savings Estimates – Cohort 1, Cohort 2, CMHCs
Line of Business Calendar Period Savings PMPM Member Months Total Savings
Commercial 2016* $10.72 557,943 $5,981,926
Medicaid 2016* $3.66 2,105,941 $7,697,508
Medicare 2016* $70.01 484,513 $33,922,208
Total 2016* $15.12 3,148,397 $47,601,642
Commercial 2017 $23.10 1,114,449 $25,747,754
Medicaid 2017 ($9.73) 3,103,422 ($30,183,148)
Medicare 2017 $161.68 837,395 $135,389,934
Total 2017 $25.90 5,055,266 $130,954,539
Commercial 2016-2017* $18.97 1,672,392 $31,729,680
Medicaid 2016-2017* ($4.32) 5,209,363 ($22,485,640)
Medicare 2016-2017* $128.08 1,321,908 $169,312,142
Total 2016-2017* $21.77 8,203,663 $178,556,181
*Note that only Cohort 1 and CMHC results are included in 2016.

Milliman SIM July 2019 ROI Report
July 19, 2019 26
Offices in Principal Cities Worldwide
The estimated healthcare cost savings for all SIM Cohort 1 PCP practices in 2016 is approximately $40.9
million, which represents 3.2% of projected healthcare cost levels during 2016. The estimated healthcare cost
savings for all SIM Cohort 1 and Cohort 2 PCP practices combined in 2017 is approximately $112.6 million,
which represents 4.8% of projected healthcare cost levels during 2017. Combined, the projected savings for all
PCP practices through 2017 is $153.5 million, or approximately 4.2% of projected healthcare costs.
The estimated healthcare cost savings for all CMHCs in 2016 is approximately $6.7 million, which represents
4.0% of projected healthcare cost levels during 2016. The estimated healthcare cost savings for CMHCs in
2017 is approximately $18.4 million, which represents 10.1% of projected healthcare cost levels during 2017.
Combined, the projected savings for all CMHCs through 2017 is $25.1 million, or approximately 7.2% of
projected healthcare costs.
For all SIM Cohort 1 and 2 PCP practices and CMHCs combined, the projected savings through 2017 is $178.6
million, or approximately 4.5% of projected healthcare costs. There are many different factors that can affect or
contribute to these results, as noted in the caveats section.
These results are based on the low end of the ranges of trend rates that are published in our Milliman Health
Cost Guidelines (HCGs), including the Commercial HCGs and the Over 65 HCGs, as well as those observed
for the Colorado Medicaid program as reported by HCPF. To be conservative, we chose the lower ends of these
rate ranges and apply the trend assumptions as shown in Table 15:
Table 15: Conservative Low End Assumptions for Assumed Annual Trend Rates
Service Category Commercial Medicaid Medicare
Inpatient Facility 2.0% 1.5% -1.0%
Outpatient Facility/Emergency Room 3.0% 0.0% 3.5%
Professional/Other 2.0% 2.0% -0.5%
Prescription Drugs 6.3% 6.5% 3.5%
We also tested the sensitivity of trend assumptions on projected savings. Starting with the projected savings
produced above, we adjusted each of the trend rates shown in Table 15 by +/-1% (e.g. change from 2% to 3%
or from 2% to 1%). The projected healthcare cost savings for Cohort 1 practices in 2016 changed by +/- $12.5
million, or by 30.5%, and in 2017 changed by +/- $27.6 million, or by +/- 28.8%, of the ROI projected savings.
The projected healthcare cost savings for CMHCs in 2016 changed by +/- $1.7 million, or by 24.7%, and in
2017 changed by +/- $3.6 million, or by +/- 19.3%, of the ROI projected savings. The projected healthcare cost
savings for Cohort 2 practices 2017 changed by +/- $9.1 million, or by 54.6%, of the ROI projected savings.
According to the SIM office, $23.9 million of CMMI funding has been released for the SIM work in the pre-
implementation year (2015) and the first two model test years (2016 and 2017) as of 1/1/18, while $42.9 million
has been released through 1/1/19. This investment combined with the projected healthcare cost savings of
$178.6 million through 2017 results in a projected ROI of 7.47 using funds released through 1/1/18, and 4.16
using funds released through 1/1/19 (please note that additional projected savings may accumulate during 2018
which are not yet included in the $178.6 million projected through 2017), which are both significantly above our
target ratio of 1.89. This result reflects just two years of projected savings (2016-2017) compared to three-four
years of costs (2015-2017/2018).
The average normalized risk scores by practice type, line of business, and year are provided in Table 16 (for
Cohort 1 and CMHCs) and Table 17 (for Cohort 2) below. For Cohort 1 practices and CMHCs, 2015-2017 risk
scores are normalized against total 2015 data. For Cohort 2 practices, 2016-2017 risk scores are normalized
against total 2016 data.

Milliman SIM July 2019 ROI Report
July 19, 2019 27
Offices in Principal Cities Worldwide
Table 16: Average Normalized Risk Scores by Practice Type, Line of Business, and Year for Cohort 1
2015 Risk Score 2016 Risk Score 2017 Risk Score
Practice Type Commercial Medicaid Medicare Commercial Medicaid Medicare Commercial Medicaid Medicare
Mixed Primary Care
1.057 1.133 0.952 1.069 1.163 1.062 1.100 1.248 1.194
Pediatric 0.551 0.613 0.686 0.491 0.520 0.517 0.493 0.562 0.711
Internal Medicine
1.813 1.013 1.150 1.594 1.086 1.340 1.751 1.296 1.525
CMHC 1.446 1.919 1.364 1.426 2.204 1.542 1.648 2.220 1.710
Table 17: Average Normalized Risk Scores by Practice Type, Line of Business, and Year for Cohort 2
2016 Risk Score 2017 Risk Score
Practice Type Commercial Medicaid Medicare Commercial Medicaid Medicare
Mixed Primary Care 1.064 1.010 0.954 1.096 1.022 1.065
Pediatric 0.658 0.893 1.349 0.581 0.783 1.458
Internal Medicine 1.694 3.407 1.347 1.653 3.661 1.538
Note that the risk scores for lines of business and practice types with low attributed membership may appear
unreasonable due to low sample sizes. For example, there are few Medicare members attributed to pediatric
practices.
More information about the assumed trend rates used in this analysis is provided in the “Methodology” section
below.

Milliman SIM July 2019 ROI Report
July 19, 2019 28
Offices in Principal Cities Worldwide
CONCLUSIONS
The Colorado SIM program has been very successful through 2017 with achieving one important element of
the quadruple aim – reducing per-capita healthcare spending. The $23.9 million investment of CMMI in the
Colorado SIM through 1/1/18, combined with the projected healthcare cost savings of $178.6 million, results in
a projected ROI of 7.47, which is significantly above our target ratio of 1.89. Including the additional $19 million
of CMMI funding that has been released through 1/1/19 results in a projected ROI of 4.16, also above our 1.89
target. These savings are also far above the initial projected healthcare cost savings of $123 million for the
entire program period.
This analysis only includes cost projections for the first two years following implementation for Cohort 1
practices, and less than a year following implementation for Cohort 2 practices. Cost savings for Cohort 2
practices in particular are likely conservative, given that their implementation dates occurred on in the third
quarter of 2017, while their baseline for this report was developed based on calendar year 2016 data. It is
possible that costs increase in the short-term due to increased utilization of preventive services as well as
follow-up on newly diagnosed patients as a result of behavioral healthcare screening and other types of
interventions. We may see more cost savings emerge in later years as the health of impacted populations
improve and future high cost services are avoided.
Projected savings have been the highest for the Medicare line of business, followed by the CMHCs and the
Commercial line of business. The Medicaid line of business has projected losses under the Colorado SIM
program. The population that has most struggled to achieve projected savings is the pediatric population, both
within the Commercial line of business, but especially within the Medicaid line of business.
The pediatric population may experience the delayed cost savings that follow heightened utilization of
preventive care, as noted above. It may be that “early return” savings of integrated medical-behavioral
healthcare may be more easily obtained within the Medicare population, whereas the pediatric population needs
additional healthcare services in the short term that will, hopefully, lead to overall savings down the road. Further
research could shed more light on which medical and behavioral conditions are the most challenging for cost
containment efforts for the pediatric populations and which types of services are being most utilized in the
Pediatric SIM cohorts.