integrated pest management for grain elevators that...
TRANSCRIPT

1
Integrated Pest Management for Grain Elevators that Supply the Breakfast Cereal Industry: Case Studies and Economic Analysis
By
Thomas W. Phillips1, Ronald T. Noyes2 and Brian D. Adam3
1Department of Entomology and Plant Pathology, 2Department of Biosystems and Agricultural Engineering
3Department of Agricultural Economics Oklahoma State University
Stillwater, OK
Final Report June 2002
Sponsored by the Grocery Manufacturers of America, Washing ton. D.C. and funded through the National Foundation for Integrated Pest Management Education, Austin, TX
Corresponding author: Thomas W. Phillips Dept. of Entomology and Plant Pathology 127 Noble Research Center Oklahoma State University Stillwater, OK 74078 Phone (405) 744-9408 FAX (405) 744-6039 e-mail: [email protected]

2
Preface
This report marks the culmination of a project that spanned several years and involved numerous individuals. Prior to 1998 the Stored Grain IPM Committee of Oklahoma State University, under the direction of Dr. Gerrit Cuperus, joined with the Grocery Manufacturers of America and the Foundation for Integrated Pest Management Education to deliver educational programs on integrated pest management IPM to grain elevators throughout the grain-growing regions of the U.S. That educational program resulted in the concept for the current project to document IPM practices at grain elevators, and was initially led by Dr. Phil Kenkel of the Department of Agricultural Economics at Oklahoma State University. Direction of the project since 2000 was by Drs. Phillips, Noyes and Adam, the current report authors. The authors are grateful to their co-investigators, Gerrit Cuperus and Phil Kenkel, for providing significant inputs throughout the course of the project. Dirk Maier and Linda Mason, co-investigators at Purdue University, helped in designing the project and in making valuable contacts with industry participants. Ronda Danley and Tamara Lukens, both graduate students in the Department of Agricultural Economics, provided valuable information on fumigation practices and costs of IPM used in this report. The authors are very grateful to the companies and elevator managers who participated in this study and allowed us to use their valuable time to collect information. We particularly appreciate Mr. Fred Hegele, General Mills, Inc., who shared his knowledge of the food industry and was a steady source of help and encouragement throughout this work. Financial support of the National Foundation of IPM Education during the course of this study was greatly appreciated.
3
Table of Contents
Preface 2 Introduction 4 Approach and Methods 5 Findings and Recommendations from Facility Visits 7 Elevator 1: Wheat, Corn and Barley 7 Elevator 2: Oats 19 Elevator 3: Oats, Corn and Wheat 34 Elevator 4: Corn 40 Elevator 5: Corn 43 Elevator 6: Wheat 45 Elevator 7: Wheat 49 Elevator 8: Wheat 52 Costs and Benefits of IPM 54 Conclusions 68 References 69 Appendices
A. Ideal Elevator Checklist and Audit Form 70 B. IPM Characterization Survey for Grain Elevators 75 C. Procedures for Cost Analysis 81 D. Costs and Evaluation of Fumigation Monitoring Equipment 86 E. Template for Fumigation Management Plan 87
4
Introduction Safety of food products in the United States relies in part on effective pest management and cautious use of chemical pesticides during storage and processing of post-harvest commodities. The breakfast cereal industry is particularly sensitive to both insect contamination and pesticide residues, and thus is faced with serious challenges for effective pest control in raw commodities and in finished products. Integrated pest management (IPM) is a process whereby information about the pest, the environment and the infested crop (or commodity in this case) are assessed and decisions made about use of one or more pest control methods (cultural, biological, genetic, chemical, etc.) to prevent or reduce unacceptable levels of pest damage by the most economical means and with the least negative impacts to human health, safety, property or the environment (Phillips et al. 2000). Management of stored grain has the potential for excessive use of chemical insecticides at one extreme, and proactive use of preventive measures with no use of chemicals at the other extreme. Principals of IPM can be applied to grain storage through vigilant preventive measures, regular monitoring for pests and product quality loss, and targeted controls when needed.
This project investigated current practices and potential for use of IPM in grain elevators that provide raw commodities to the breakfast cereal industry. The general objectives of this project were as follows.
1. Assess the present knowledge of IPM by managers and determine the use of ecologically-based IPM at a minimum of six demonstration facilities, two each that store corn, oats and wheat.
2. Make recommendations for these facilities, where needed, on methods to improve IPM practices.
3. Determine the costs incurred and benefits obtained for the adoption of post-harvest IPM practices in representative facilities.
This report summarizes work conducted between 1998 and 2001 in which eight grain elevator facilities meeting project criteria were visited by a team of researchers and information was collected on IPM-related practices at each. In some cases there were substantial engineering recommendations made for resolving IPM problems as well as general elevator problems. Data from other facilities were used directly in development of an economic model for implementation of IPM at grain elevators. The model provides a conceptual basis for understanding costs and benefits of IPM, and how implementation of IPM may impact facilities with given characteristics. The breadth of variation among facilities assessed in this study, including differences in geography, commodity stored and production activities, allows for the results of this work to be broadly applied to the North American grain and food industry.
5
Approach and Methods Criteria for selection of grain elevators to study were well defined at the outset. Elevators needed to receive and store grain that would ultimately be used in the production of breakfast cereals. The project targeted three cereal grains: oats, wheat and corn. Our goal was to observe and characterize a total of six elevators comprised of two for each of the targeted cereal grains. Eight elevators were ultimately used because one “wheat” company had two separate elevator facilities that each provided different operations (giving a total of three for wheat) and one elevator in the western U.S. had a mixture of several grains, none of which predominated, and thus did not fit the “norm” for the other facilities. Six of the facilities were co-located with their mills that generated a specific product for manufacture of breakfast cereal. We adhered strictly to the breakfast cereal requirement; none of the elevators studied would be considered to be in the marketing chain for bread-making, desert products or snack foods. We hoped for, and succeeded in, sampling elevators from a broad geographic range. Thus we visited companies from the great Lakes to the Rocky Mountains, and from the northern to southern parts of the mid-west. Securing the few participants we had in the study proved challenging. Not surprisingly, many companies we contacted were reluctant to openly discuss pest infestation or other sanitation issues that may point to their product as being less than wholesome. GMA members were helpful in securing study sites in some cases, and in others we were fortunate to acquire study sites through past professional contacts. Data for this project were collected through personal interviews conducted during site visits by two or three PIs to a participating elevator. A typical visit would last a half-day to 1 and half days and was usually hosted by a facility manager who was knowledgeable in commodity handling, storage and conveying equipment, sanitation and pest control carried out at his company. Typically, other company staff members with expertise in one or more of these areas would join the interview. Interviews and data-gathering were facilitated by administration of the survey instrument titled “Ideal Elevator Checklist and Audit Form” (Appendix A). The IPM checklist presented the facility manager with a series of practices organized under broad categories of grain elevator IPM, and required that the manager perform a self-assessment of how important the practice (e.g. critical vs non-critical) was to his/her company, and report their level of accomplishment on that practice (e.g., on a 1-10 scale, with 10 being a high level of accomplishment). The IPM checklist was roughly modeled after a HACCP (hazard analysis critical control point) document such that each facility needed to determine for themselves how important, or critical, specific IPM “points” were to their operation. The IPM practices were grouped under the following categories: sanitation, in which cleaning spilled product or empty bins is done to prevent residual pest build-up; receiving, referring to decisions regarding how grain is received and handled upon receipt; aeration, the use of ambient air to cool grain masses and inhibit pest population growth; monitoring, by which managers sample or inspect grain and structures for insects, temperatures, grain quality, or other features; pesticide use, in which managers were surveyed about chemicals used for pest control; and safety and education opportunities for workers and managers that relate to pest control and IPM practices. On a few occasions an additional survey vehicle, the “IPM Characterization Survey for Grain
6
Elevators,” (Appendix B) was completed that collected technical details of facility beyond those generally known to the manager being interviewed
The quantity and quality of information collected among facilities was not consistent throughout the study. The IPM checklist was quantitatively completed in some of the cases, and was more descriptively addressed in others. Thus some reports below have numerical scores for IPM practices while others have more thorough verbal descriptions of the company’s practice. Through the course of administering surveys the managers would generally share information of particular concern that we documented. Sharing of specific problems and concerns varied greatly among elevators, perhaps reflecting the “comfort level” of the manager in revealing such concern. Hence certain reports address problems and proposed solutions at length while others reveal few problems and are more directly related just to the survey vehicles. Site visits always included a tour of the physical plant along with the office interview. Plant tours focused on grain storage structures, conveying equipment, monitoring equipment, grounds in general, and occasionally mills and other processing and storage areas. An economic model for partial budgeting of IPM in grain elevators was developed and elaborated during this study. Costs of several IPM strategies, with and without certain levels of insecticide use, were calculated. Economic data at various levels of detail were collected at participating facilities throughout the study, and data from two companies in particular were subjected to the model to determine the actual costs of their IPM systems.
7
Findings and Recommendations from Facility Visits
Elevator 1: Wheat, Corn and Barley
Three principal investigators visited this facility in Idaho in May, 1998 and again in March, 1999. Meetings were with the facility manager and the company’s regional manager. During the initial meeting, the OSU team discussed the physical facilities, methods of operation and IPM practices, and filled in the OSU IPM Checklist and Facility Audit with the manager. The checklist allows the manager to decide if each item is critical to his operation or a good management practice (GMP). Facility Description This facility was formerly used for processing sugar beets, so the large welded steel tanks were converted sugar storage tanks. One attribute of the welded steel tanks are that the roofs have less slope than bolted corrugated grain bins so there is more headspace in all these bins. One elevator leg and dump pit station serviced two 100,000 bu concrete silos. Another large elevator leg and a small leg plus several drag conveyors were used to fill and unload ten welded steel bins which give the Lincoln Elevator a combined storage capacity of 1.8 million bushels. The breakdown of the to welded steel storage tanks and silos are as follows: Tank #1 = 400,000 bu Tank #2 = 270,000 bu Tank #3 = 200,000 bu Tanks #8 & #9 = 35,000 bu/tank Tank # 10 = 5,000 bu Tanks #11& #12 = Two 100,000 bu concrete silos Commodities Stored This part of the northern Rocky Mountains is an excellent agricultural production area, with a relatively mild climate with sufficient moisture for dry land farming. Irrigation is responsible for much grain production. The combination of the six welded steel storage tanks of variable size and the two silos with four elevator legs at three separate grain receiving and shipping locations is ideal for handling a variety of grain types. Grain crops handled were hard red winter and hard red spring wheat, malting barley, feed grade barley, and corn. IPM grain storage practices The facility provides an excellent example of a commercial grain facility that manages a diverse range of stored grain products with virtually no pesticides and very low pest
8
related losses. In general, no pesticides were used at this elevator due excellent sanitation, short storage to aeration time period and cold winters. Overview of Stored Grain Management System Sanitation Two men worked full time at this elevator. Both times we visited the facility there was very little spilled grain lying around. The grounds were relatively bare of vegetation. Tank roof vent louvers on some tanks were crusted up and were not closing completely, but these were not an insect proof seal, just a weather shield of vent outlets. No insects were detected around bin entry points during May, 1998 or March, 1999 visits. Initially, aeration ducts were trenches in the floor with flush-floor perforated duct covers. They filled in the duct trenches and replaced the in-floor ducts with round on-floor ducts. During grain shipping, after gravity flow of grain from tanks is complete, bobcat loaders are used to move grain to unload drag conveyor or U-trough auger hoppers in the floor. Duct sections are removed as unloading progresses, cleaned and stacked outside. After all grain is removed, grain dust and fines are swept up, vacuumed and hauled to the dump. Bin floors and walls (up approximately 20 ft from the floor) are treated inside and outside with Reldan residual pesticide spray. The outside of the bin bases are sealed with a rubberized or elastomeric sealing paint annually, as needed. Bins are carefully checked for water leaks as part of pre-filling inspection. Then the round floor aeration ducts are then repositioned and anchored with grain in preparation for filling bins with new harvest grain. Leg boot pits are cleaned prior to harvest and periodically as needed during the year. In the concrete silo facility, the hopper bottom self-unloading floors in the two 100,000 bu silos are swept out when emptied. Aeration ducts are vacuumed to remove residual fine and grain particles. All spilled grain in and around the facility is swept up any time there is a spill or leak. The elevator leg boot pits are cleaned once monthly. Standing water that forms pools on the relatively flat ground across the facility are pumped out to ditches to minimize ground water leaks into bin bases. Weekly sanitation inspections are conducted. All grain spillage and other sanitation problems are noted and corrected. Signs of rodent activity are also monitored during these facility walk-arounds. Rodent traps are monitored weekly and trap catches are recorded.
Receiving and Handling Incoming grain is received by truck. All loads are probe-sampled at the elevator for insects, moisture, dockage and protein. In-house grading is used on all in-bound truckloads. Federal Grain Inspection Service (FGIS) grades are checked on all out-bound truck and rail shipments. Any loads with marginally high moisture is transferred to holding bins at a nearby company elevator for blending or shipping. No grain above 13

9
% is stored at the study facility. A truck-load is rejected if 1 live insect is found. For outbound shipments, a probe sample from each truck-load is submitted to a grain inspection service near the elevator for official FGIS grades. The grain peaks are also pulled down by "coring" the center of the bin to lower the peak for improved aeration. Grain quality of outbound truck and rail shipments is controlled through samples tested at a local testing laboratory. Grain from this facility to be rail shipped is dumped at the main company elevator nearby and then loaded directly on rail cars or held temporarily in silos. Aeration All grain tanks and the two silos are equipped with aeration fans, on-floor round perforated aeration ducts, and roof vents. The aeration systems in the three large steel tanks consisted of several centrifugal fans (fan HP proportional to tank size) per tank positioned symmetrically around each tank. Tank #1 had a total of 110 HP in eight base fans plus a 20 HP roof exhauster. Tank #2 and Tank #3 had six 10-HP base fans and one 10 HP roof exhauster. Base fans are connected to round perforated steel ducts positioned radially toward the center of the tank. Each of these tanks had louvered exhaust vents and one roof exhaust fan that appeared to be adequate to provide satisfactory exhaust air. The roof exhauster was operated for a period of time after the aeration fans were shut off to expel high humidity air. Airflow rates is approximately 1/10th cfm/bu on Tanks #1, #2, #3, at or near full depth for wheat and barley and about 1/6th cfm/bu fully loaded with corn, and when 2/3 full of wheat and barley. At 1/10th cfm/bu airflow rates, wheat and barley could be cooled in about 150-175 hours of cumulative fan operation in peaked grain. Tanks filled with corn were cooled in 90-100 hours. The concrete silo aeration is powered by two 30-HP high pressure centrifugal fans each, with an airflow rate of about 1/12th cfm/bu when filled with wheat or 1/7th cfm/bu with corn. Aeration is started as soon as air temperatures are 15-20oF below grain temperatures in mid-to-late-September. All tanks have pressure, or up-flow aeration systems. Large tanks have four louvered vents located symmetrically around the roof about 6-8 feet from the edge of the roof with a powered roof exhaust fan near the center. Because of the local power company restriction of a high peak demand charge on electric power, not all tanks and silos could be aerated simultaneously. When elevator legs and drag conveyors were being used for grain transfers, aeration fans were not operated. To avoid increased peak power load charges, only about 1/3 of the tanks and silos could have been aerated per day when grain handling was in progress, or half of the aeration operated on alternate days when grain was not being transferred. In actual practice, all aeration fans are manually operated at night by the two elevator grain managers who typically turn part or most of the fans on as they leave work at 5:00 PM and turn them off when the return to the elevator at 8:00 AM. So, aeration had to be scheduled when (pending suitable weather) grain was not being handled, and then cooling was still limited to half of the tanks being aerated at night during the workers off-

10
duty hours. At best, each of the large tanks could only receive about two days of aeration per week. This system of manually operated alternate night aeration was able to lower the temperature of the grain mass in the warmest grain below 70oF by the end of October. The goal of the aeration program was to cool the grain of 40oF in all bins by December. Once cooled, all grain is left at these cool temperatures until load-out. The aeration systems on Tanks #8, 9 and 10 were poorly designed. Each tank had only one old 5-HP 30-inch diameter Buffalo Forge axial fan. The transition consisted of a flat steel back plate with an 18-inch diameter hole cut at the bottom of the plate to blow air into an 18-inch diameter transition and aeration duct on each tank. This system was totally ineffective on all crops. It is doubtful that this fan would deliver more than 30-40% of its potential air delivery when aerating full tanks of corn, and far less on wheat. Roof venting was also poorly designed. These aeration systems on Tanks #8 and #9 should be replaced immediately using a 10-HP low speed centrifugal fan similar to those used on Tanks #2 and #3. The aeration duct system for these tanks, estimated at about 42 ft dia x 30 ft grain depth should be patterned similar to the same size bolted steel bin ducts. A 1-2 HP vane axial fan with proper floor duct and roof vent should be suitable for Tank #10. Monitoring This facility was used for sugar beet processing and to store liquid sugar until about 1994, so the welded steel tanks were originally liquid tight from roof to base. The site around the tanks was relatively bare of vegetation and natural habitat. Thus, stored grain insect populations had not built up in the surrounding fields and creeks around the elevator site. Probe samples from in-bound trucks are checked in-house for insects, moisture, dockage and protein when processed at the neaby company headquarters. Loads are rejected for moisture above 13% or if 1 or more live insects are found. The average moisture content of grain received was bout 11%. If probe samples are found acceptable at the headquarters, then trucks are routed to the subject facility for dumping. Grain between 12-13% and/or marginal dockage is diverted to concrete storage where it can be shipped out easier. Grain is dumped into the various tanks according to type, grade and moisture. Grain is visually inspected in tanks at the surface about every two to three weeks. Although all tanks have thermocouple cables, which are read through a Rolfes Hot Spot manual temperature instrument, grain temperature monitoring was erratic. However, due to the excellent climate, short time between harvest and cooling, and excellent sanitation, few insect problems were encountered at this elevator. Individual tanks were fumigated if an insect problem was detected in them, but only one or a few cases were reported t ooccur in the four years of grain storage. Anytime grain is removed form storage, samples are pulled at 2-minute intervals from the moving grain stream. All samples are sieved and checked for insect activity. Periodically during the season, a 400-500 bu truck load is transferred from each tank or silo and sampled intensively. By taking numerous samples from each truck load and
11
sieving all of the sampled grain for insect presence and damage, a good representation of the center core of each grain mass is obtained. The grain surface is also inspected monthly for roof leaks and insect or mold problems. Shallow trier probe samples from various locations across the grain surface are obtained and carefully inspected for insect presence or damage. These surface inspections are discontinued for safety reasons when enough grain has been removed to form a substantial inverted cone in the center. All outbound loads are officially sampled and graded. Quality specifications on out-bound loads are no live insects and less than 3 IDK (insect damaged kernels) per 100 gram sample. Grain temperatures are monitored weekly. Temperature readings in all bins are recorded weekly until all the grain mass in each bin reaches the target temperature (approximately 40F). A log of aeration timing and outside air temperatures is maintained during aeration. If a hot spot is detected, the bin is inspected for leaks, insect activity or mold problems. The bin is sampled by probing the surface, deep cup probing and power probing the grain mass, and core samples are pulled using the unload system. Maintenance and Safety A full preventive maintenance program is in place at this elevator. All bearings are greased and gearbox oil levels and quality are checked at pre-scheduled time and usage intervals. A walk-around inspection of bearings on equipment located inside structures is conducted at the end of each day's operation. An outside company is contracted to make regular inspections of fire extinguishers. Outside resources are also used to conduct fit-testing of personal protective equipment (PPE) and specialized safety training annually. Results For the four year period in which the facility has been under current management for grain storage, approximately 1.5-2.0 million bushels of grain have been handled each year without fumigation. Grain quality has been maintained with low shrinkage (less than 1/4 percent). Out-bound loads have consistently met high quality standards of below 3 IDK and zero live insects. Facility Modifications When this elevator came under current management only 50% of the thermocouples on cables in all grain bins were functional. Some bins had aeration fans connected to bins, but no ducts were installed inside the bins. In addition to resolving these facility temperature monitoring and aeration duct deficiencies, all bin foundations were sealed with a flexible rubberized material, roof exhaust fans were install on the three largest steel tanks to provide positive exhaust of headspace moisture. Subfloor aeration duct trenches were filled in and removable perforated tubular aeration ducts were install on the bin floor surface in all steel bins.

12
Critical IPM Factors The facility manager participated in filling out the OSU Critical IPM Check-Point Management Audit. As indicated above, grain managers identify two levels of grain management practices related to IPM, those that they designate to be "Critical IPM management factors" (CIPM) for their elevator storage, and another group that are considered to be just "Good management practices" (GMP). GMPs are activities that are part of their grain storage management system, but are not considered absolutely critical to success or a corner-stone of their program. The Critical IPM Practices identified at this facility were: Sanitation * Complete clean-out prior to filling * Spraying down empty bins prior to filling * Cleaning spilled grain and fines around bins, dump pits and drive * Sealing bin bases and openings to prevent moisture leaks Receiving/Handling * Sampling incoming grain for moisture, insects and other factors * Rejecting infested grain * Leveling bins prior to aeration by removing center core Aeration * Bins equipped with adequate airflow * Lowering grain temperatures below 60 degrees as soon as possible * Monitoring temperature forecasts and operating fans to take advantage of cool nights Monitoring * Checking grain temperature weekly * Sampling center-core of each bin at least monthly by removing a truck load of grain
and intensively sampling the load Costs of IPM Practices Pesticide Cost The major pesticide cost is the cost of spraying empty bins with residual pesticide (Reldan) to eliminate potential carry-over insect populations. An outside contractor was used for the treatment at a total cost of approximately $700 (about 0.1c/bu). Temperature management was achieved with an average of 100 fan hours/year with electrical cost of about 0.5c/bu for aeration. Sanitation and monitoring activities involves 2 employees with an average time spent of 10 hours each, or 20 man-hours/week. Labor costs were
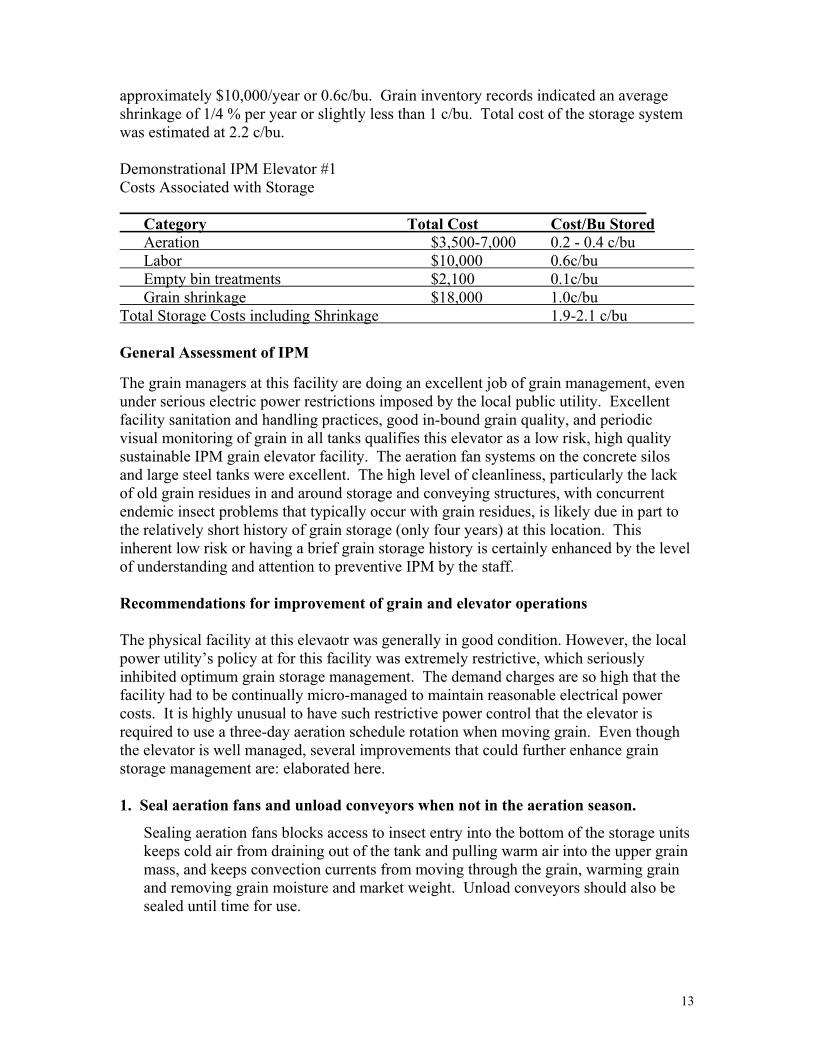
13
approximately $10,000/year or 0.6c/bu. Grain inventory records indicated an average shrinkage of 1/4 % per year or slightly less than 1 c/bu. Total cost of the storage system was estimated at 2.2 c/bu. Demonstrational IPM Elevator #1 Costs Associated with Storage Category Total Cost Cost/Bu Stored Aeration $3,500-7,000 0.2 - 0.4 c/bu Labor $10,000 0.6c/bu Empty bin treatments $2,100 0.1c/bu Grain shrinkage $18,000 1.0c/bu Total Storage Costs including Shrinkage 1.9-2.1 c/bu General Assessment of IPM The grain managers at this facility are doing an excellent job of grain management, even under serious electric power restrictions imposed by the local public utility. Excellent facility sanitation and handling practices, good in-bound grain quality, and periodic visual monitoring of grain in all tanks qualifies this elevator as a low risk, high quality sustainable IPM grain elevator facility. The aeration fan systems on the concrete silos and large steel tanks were excellent. The high level of cleanliness, particularly the lack of old grain residues in and around storage and conveying structures, with concurrent endemic insect problems that typically occur with grain residues, is likely due in part to the relatively short history of grain storage (only four years) at this location. This inherent low risk or having a brief grain storage history is certainly enhanced by the level of understanding and attention to preventive IPM by the staff. Recommendations for improvement of grain and elevator operations The physical facility at this elevaotr was generally in good condition. However, the local power utility’s policy at for this facility was extremely restrictive, which seriously inhibited optimum grain storage management. The demand charges are so high that the facility had to be continually micro-managed to maintain reasonable electrical power costs. It is highly unusual to have such restrictive power control that the elevator is required to use a three-day aeration schedule rotation when moving grain. Even though the elevator is well managed, several improvements that could further enhance grain storage management are: elaborated here. 1. Seal aeration fans and unload conveyors when not in the aeration season.
Sealing aeration fans blocks access to insect entry into the bottom of the storage units keeps cold air from draining out of the tank and pulling warm air into the upper grain mass, and keeps convection currents from moving through the grain, warming grain and removing grain moisture and market weight. Unload conveyors should also be sealed until time for use.
14
2. Core tanks for improved cooling uniformity and reduced aeration time.
Even though aeration was cooling the grain, it was a slow process due to power company limitations on peak power load. Coring the steel tanks and concrete silos to reduce the peak height by 1/4 to 1/3 shortens the air path, removes some fines and foreign material from the core of fines that forms under fill spouts and lowers static pressure. The aeration fans move more air with lower static pressure and shorter air paths. Not cooling the peak will shorten aeration time by 10-15%, reducing the power bills and minimizing marketable moisture removal due to longer cooling times. Lower static pressures will lower pressure fan "heat of compression" which increases the cooling air temperature by 5oF to 10oF.
3. Install an automatic aeration controller to pinpoint desired cooling air
temperatures.
Note that aeration controllers should be set lower to account for pressure fan "heat of compression" temperature rise to cool the grain to a desired temperature such as 60oF initially, and 50oF by end of the aeration period for winter storage. If the target grain temperature is 50oF, and a thermometer stuck through a hole drilled in fan transition ducts shows an air temperature rise of 7oF, the automatic aeration controller temperature set point should be 43oF.
4. Monitor grain temperature at 2 week intervals.
Grain temperature monitoring is a similar practice to that of a physician checking a patient's temperature and blood pressure. Grain temperatures give the elevator manager a continuous picture of what's happening inside the grain mass. Grain should be monitored at 2-week intervals so the elevator manager has a continuous record from year to year of grain conditions for each tank. Reviewing temperatures twice monthly will allow the manager to spot spontaneous heating problems that indicate a moisture or insect problem before it becomes excessively costly.
5. Change aeration fans, ducts and vents on tanks #8, 9, 10
The 5-HP Buffalo Forge fans on tanks #8, 9, and 10 are poorly designed and should be replaced with Tiernan fans (or similar) like those used on the other tanks and silos. Check roof vents and perforated aeration ducts for adequate capacity.
6. Check all louvered roof vents on large steel tanks and silos.
At least two of the four-roof edge exhaust louvers on the very large Tank #1 were sticking closed or partially closed when we inspected the tanks in May, 1998. Sticking louvers minimize exhaust area, increase static pressure in the head space placing and on the fans, reducing airflow and increasing "heat of compression" temperature rise of the cooling air. Check exhaust louvers on other tanks for free movement of gravity louvers. Headspace static pressures should not exceed 1/16 to 1/8 inch water column on pressure aeration systems. Exhaust louver air velocities of 1,000 fpm are desired but should not exceed 1,500 fpm. This is a function of total

15
roof duct cross-section area. Example: Tank #2 at 270,000 bu. with an airflow of 27,000 cfm at 0.1 cfm/bu should have 27,000/1,000 = 27 sq. ft of vent exhaust area. Thus, each of the four vents should have a cross-section area of about 7 sq ft x 4 = 28 sq ft, or about 2 ft 8 inches square.
7. Heat of compression temperature rise on pressure aeration fans
Check heat of compression temperature rise on fans of all large tanks, and especially Tanks #11 and #12 (two tall silos). To check temperature rise, drill a small hole (3/16 to 1/4 inch) in the transition between the fan and the tank just large enough to insert a grain thermometer or digital thermometer thermocouple. Check the fan inlet air temperature, then the fan outlet air temperature; the difference is the heat from the fan compressing the air. Seal hole in fan transition with metal screw, bolt or duct tape. All pressure fans add heat to cooling air. The 30 HP fans on silo #11 and silo #12 will have the highest temperature rise, probably 10-12oF, with big steel tank aeration fan temperature increases of 6-8oF.
8. Develop an automatic controller aeration fan start-up sequence control system
Aeration fans and roof exhausters on Tanks #1, 2, 3, 8, 9, 10, 11, 12 should be started using an automatic aeration controller using an 8-10 second time delay between fans to allow each fan to reach full speed before another fan is energized. This will minimize locked rotor amperage of all fans starting simultaneously. Motors should be started in a selected sequence to minimize startup inrush current. A sequence starting system could also be designed to minimize shutoff voltage spikes on shutdown but let's concentrate on inrush control initially. (See Power Management Schedule (Draft) Options at Lincoln Elevator below.)
9. Check with local power utility about getting the excessive peak demand charges
changed.
Because of the unreasonably high peak demand charges, in which the utility charged for the entire year based on the highest monthly peak load, the aeration system operation was very fragmented. Aeration fans on all tanks should have been operated simultaneously to cool the grain. Dr. Noyes discussed this situation several times with the maanger, urging him to contact the utility company and ask them to review their peak demand policy for this elevaotr. The manager made a successful contact with the power company and discovered that his elevator should have been on a commercial account without a demand charge, instead of an industrial account with peak demand charges. The power utility switched the electrical policy, dropping the peak power demand charge. The power company made the change retroactive for several months previous to the correction. This resulted in a reimbursement of $3-4,000 and an electric power savings of about $9-10,000 annually.
Before the power utility corrected their error for the power account of this elevaotr, several options were developed by Dr. Noyes to help reduce the excessive peak
16
demand power costs and improve operational efficiency of the elevator. The following recommendations, now a moot issue, were developed as initial recommendations for this elevator and presented here as examples of alternative approaches to improving efficiency of power use.
10. Study motor operating times to minimize peak demand load
If the power company had not changed the type of power account for this elevaotr, it would have been beneficial to develop a history of motor operation sequences (time and date when motors are turned ON and OFF) by tracking motor on/off events to gain a better understanding of the peak demand problem here. A simple, economical method of tracking motor stop/start sequence data is by attaching a small electro-magnetic field sensor ("HOBO" is one brand) to each conveyor motor and one aeration fan motor on each bin. Studying the pattern of running motors by date and time could be used to fine tune grain handling and aeration operations.
11. Reducing motor starting inrush loads to improve critical power situations
When a peak load demand charge is assessed to elevators like this one, management should consider installing reduced current starters on motors that are 20-25 HP and larger to minimize peak load locked-rotor amperage on large motors. Ronk Electric Company, Nokomis, IL is a leading manufacturer of reduced current starters (RCS). RCS reduce inrush current by about 40% through capacitor banks, while maintaining normal line voltage, which keeps starting torque higher for RCS than reduced voltage starters (RVS). While Dr. Noyes was Chief Engineer at Beard Industries, Frankfort, IN, Ronk prototyped several RCS's for 50 to 200 HP blower motors for them in the 1970's. The RCS capacitor kit is installed on the existing motor starter, at substantially lower costs than major brand RVS's.
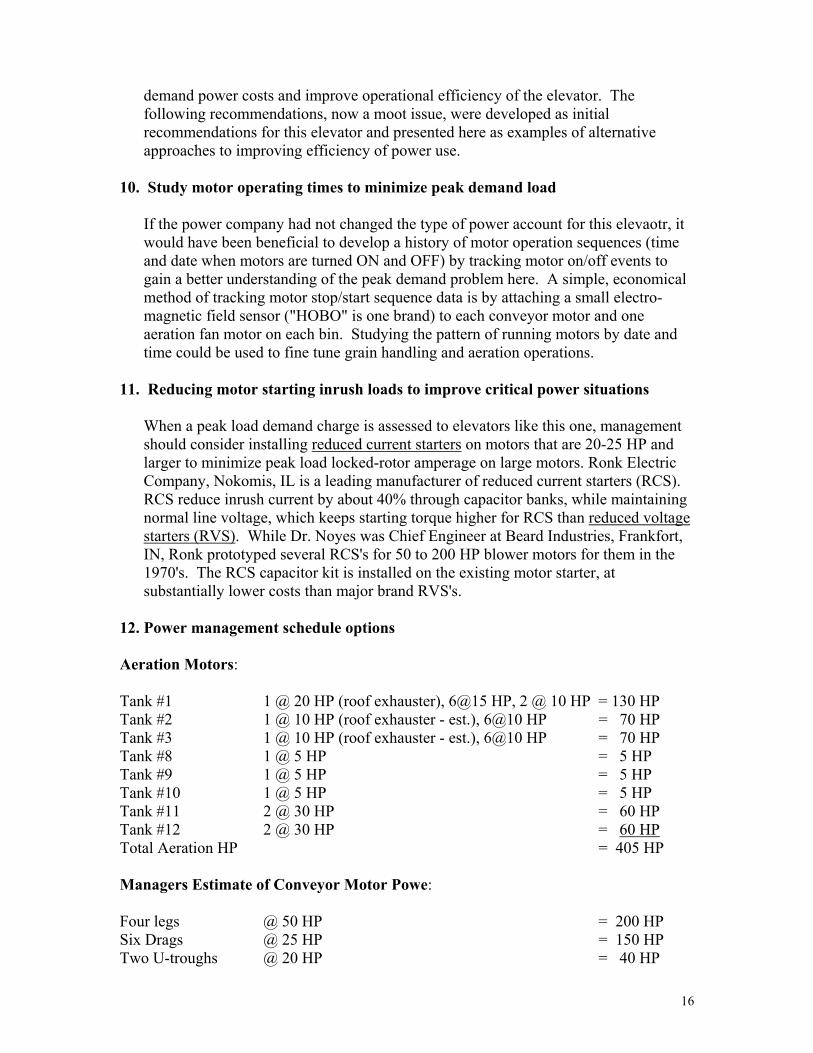
12. Power management schedule options Aeration Motors: Tank #1 1 @ 20 HP (roof exhauster), 6@15 HP, 2 @ 10 HP = 130 HP Tank #2 1 @ 10 HP (roof exhauster - est.), 6@10 HP = 70 HP Tank #3 1 @ 10 HP (roof exhauster - est.), 6@10 HP = 70 HP Tank #8 1 @ 5 HP = 5 HP Tank #9 1 @ 5 HP = 5 HP Tank #10 1 @ 5 HP = 5 HP Tank #11 2 @ 30 HP = 60 HP Tank #12 2 @ 30 HP = 60 HP Total Aeration HP = 405 HP Managers Estimate of Conveyor Motor Powe: Four legs @ 50 HP = 200 HP Six Drags @ 25 HP = 150 HP Two U-troughs @ 20 HP = 40 HP

17
Nine Augers @ 15 HP = 90 HP Total Conveyor HP = 480 HP Total HP = 885 HP Start-up: If possible, always start largest motors first, then the next larger, etc in descending size sequence (if possible) to minimize peak demand power. Demand Meter System: We recommend that the manager discuss how the demand meter works with a power company service representative. From a peak demand situation, it might be less expensive to let elevator legs run continuously during grain handling months, rather than shut them off daily. However, this may not be acceptable when the site is unattended. Power Sequencing There appears to be as much potential for power to be used at a particular time during the day when transferring grain as during aeration, based on the power table above with 480 HP on conveyors and 405 HP on aeration fans. Although there are four legs, it is likely that only two legs and their associated conveyors would be operating at one time, such as receiving grain at two pits, or receiving grain at one pit and loading out trucks or cars at another leg site. So, 200-250 HP could be operating in grain movement. That is as much as half the aeration system, but due to peak loading, usually no more than half the aeration capacity was operated at one time when transferring grain. Alternative grain handling vs aeration motor operating recommendations: To minimize peak electrical current demand, several alternative motor power operating schedules were outlined as recommendations. Four Day Schedule (Grain Transfer + Aeration) Day 1: (Grain Transfer + Aeration) Leg @ 50 HP, drag @ 25 HP, u-trough @ 20 HP, auger @ 15 HP = 110 HP Tank #11 @ 60 HP; Tank #12 @ 60 HP = 120 HP Total Day 1 = 230 HP Day 2: (Grain Transfer + Aeration) Leg @ 50 HP, drag @ 25 HP, u-trough @ 20 HP, auger @ 15 HP = 110 HP Tank #2 @ 70 HP; Tank #3 @ 70 HP; Tank #8, #9 & #10 @ 15 HP = 155 HP Total Day 2 = 265 HP Day 3: (Heavy Grain Transfer- - no aeration) Leg @ 50 HP, drag @ 25 HP, u-trough @ 20 HP, auger @ 15 HP = 110 HP Leg @ 50 HP, 2 drags @ 50 HP, 2 augers @ 30 HP = 130 HP Total Day 3 = 240 HP Day 4: (Grain Transfer + Aeration) Leg @ 50 HP, drag @ 25 HP, u-trough @ 20 HP, auger @ 15 HP = 110 HP Tank #1 @ 130 HP = 130 HP

18
Total Day 4 = 240 HP Three Day Schedule (Light Aeration) Day 1: Tank #11 @ 60 HP; Tank #12 @ 60 HP =120 HP Day 2: Tank #2 @ 70 HP; Tank #3 @ 70 HP =140 HP Day 3: Tank #1 @ 130 HP; Tank #8, #9 & # 10 @15 HP= 145 HP Two Day Schedule (Heavy Aeration) Day 1: Tank #2 @ 70 HP; Tank #11 @ 60 HP; Tank #12 @ 60 HP; Tank #10 @ 5 HP = 195 HP Day 2: Tank #1 @ 130 HP; Tank #3 @ 70 HP; Tank #8 & #9 @10 HP = 210 HP
19
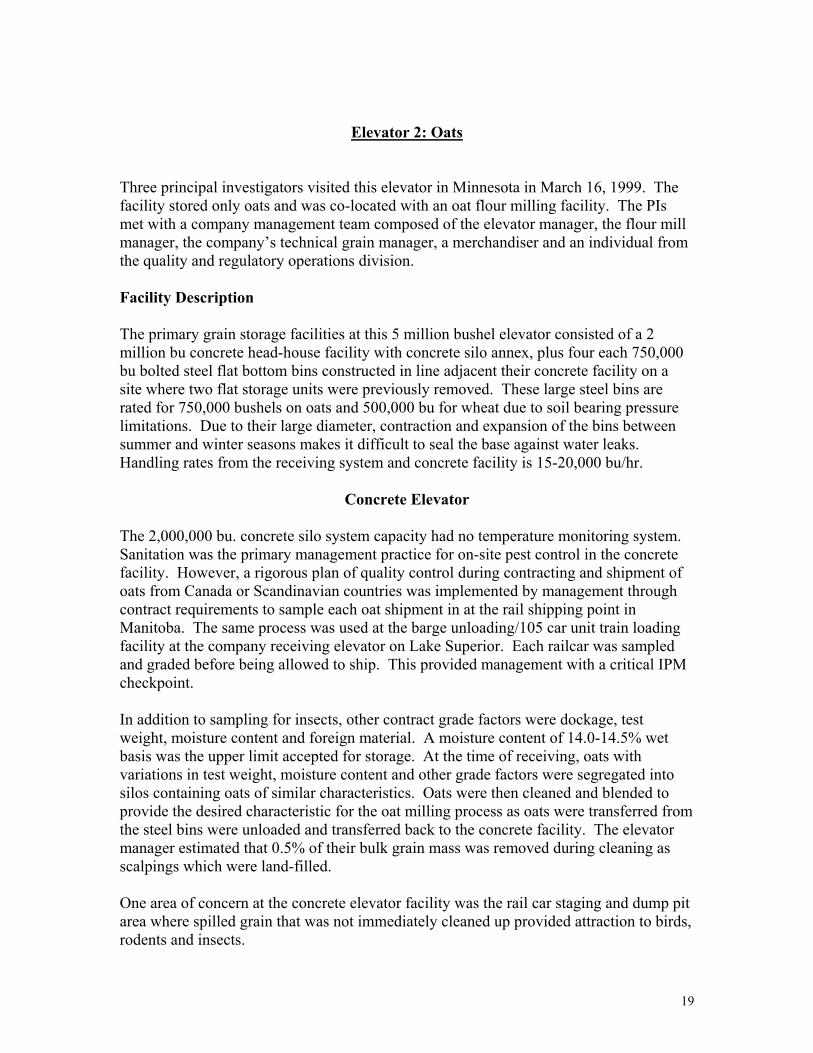
Elevator 2: Oats Three principal investigators visited this elevator in Minnesota in March 16, 1999. The facility stored only oats and was co-located with an oat flour milling facility. The PIs met with a company management team composed of the elevator manager, the flour mill manager, the company’s technical grain manager, a merchandiser and an individual from the quality and regulatory operations division. Facility Description The primary grain storage facilities at this 5 million bushel elevator consisted of a 2 million bu concrete head-house facility with concrete silo annex, plus four each 750,000 bu bolted steel flat bottom bins constructed in line adjacent their concrete facility on a site where two flat storage units were previously removed. These large steel bins are rated for 750,000 bushels on oats and 500,000 bu for wheat due to soil bearing pressure limitations. Due to their large diameter, contraction and expansion of the bins between summer and winter seasons makes it difficult to seal the base against water leaks. Handling rates from the receiving system and concrete facility is 15-20,000 bu/hr.
Concrete Elevator The 2,000,000 bu. concrete silo system capacity had no temperature monitoring system. Sanitation was the primary management practice for on-site pest control in the concrete facility. However, a rigorous plan of quality control during contracting and shipment of oats from Canada or Scandinavian countries was implemented by management through contract requirements to sample each oat shipment in at the rail shipping point in Manitoba. The same process was used at the barge unloading/105 car unit train loading facility at the company receiving elevator on Lake Superior. Each railcar was sampled and graded before being allowed to ship. This provided management with a critical IPM checkpoint. In addition to sampling for insects, other contract grade factors were dockage, test weight, moisture content and foreign material. A moisture content of 14.0-14.5% wet basis was the upper limit accepted for storage. At the time of receiving, oats with variations in test weight, moisture content and other grade factors were segregated into silos containing oats of similar characteristics. Oats were then cleaned and blended to provide the desired characteristic for the oat milling process as oats were transferred from the steel bins were unloaded and transferred back to the concrete facility. The elevator manager estimated that 0.5% of their bulk grain mass was removed during cleaning as scalpings which were land-filled. One area of concern at the concrete elevator facility was the rail car staging and dump pit area where spilled grain that was not immediately cleaned up provided attraction to birds, rodents and insects.

20
Steel Bins The four 750,000 bushel bolted steel oat Butler bins, constructed in 1990, were built in-line perpendicular to the concrete silos and rail tracks. The steel bins were 105 ft. diameter with 60 feet sidewalls and 90 ft. peak height. Filling was done by a 15-20,000 bph elevator leg from the truck or rail dump pit receiving leg to horizontal drag conveyors across the top which discharged into the four steel bins. A second horizontal drag conveyor from the concrete facility was designed to discharge into the drag conveyors that filled the four steel bins allowed transfer of grain from the rail dump pit in the concrete facility train receiving station to the steel bins. Return flow from the steel bins to the concrete facility was achieved by elevating grain from the under floor drag conveyors, elevating via bucket elevator, then transfer to the concrete house by discharging the grain into the drag conveyor which was reversed to carry the grain to the drag conveyor across the top of the concrete facility which distributed the grain to the selected silo(s). Lower moisture (12-13%) grain was placed in the steel bins for long term storage while grain with higher moisture (13.5-14.5%) was stored in the short-term storage concrete facilities and was used first. Although the company preferred to receive oats at 13-14%, Canadian oats received in 1998 typically ranged from 10.5-12.0%. Grain transferred into the steel bins was not cleaned during receiving before loading into bins. No distributors or spreaders were used in the bins, therefore a core of fines and trash that accumulated under the fill point down the center of the bins was a serious problem when aerating the bins in fall and winter. According to the elevator manager, the drier particles and light weight trash tended to slide along the surface to the outside, while wet, heavier broken kernels and fines formed a core near the middle of the bin. This is the pattern found often in most steel storage bins in the U.S. when grain spreaders or distributors are not used. No distributors or grain spreaders are used due to the high receiving rate, thus the oats, which have 2-3% beginning foreign material (FM), are difficult to aerate due to high concentration of FM in the center. Coring was attempted but caused a short circuit of air through the center. The entire concrete and steel elevator facility was operated by just 7 men due to a high level of automation of conveying systems. Overview of Stored Grain Management System
Sanitation After gravity flow of grain unloaded from bins is complete, sweep augers are used to finish loadout of the steel bins. Then bins are swept out and any wet or moldy grain remaining on floors and lower walls are removed. The bins are inspected inside and outside for moisture problems around the base. Then floors and the bottom 10 ft of sidewalls are sprayed with the residual insecticide TempoTM.
21
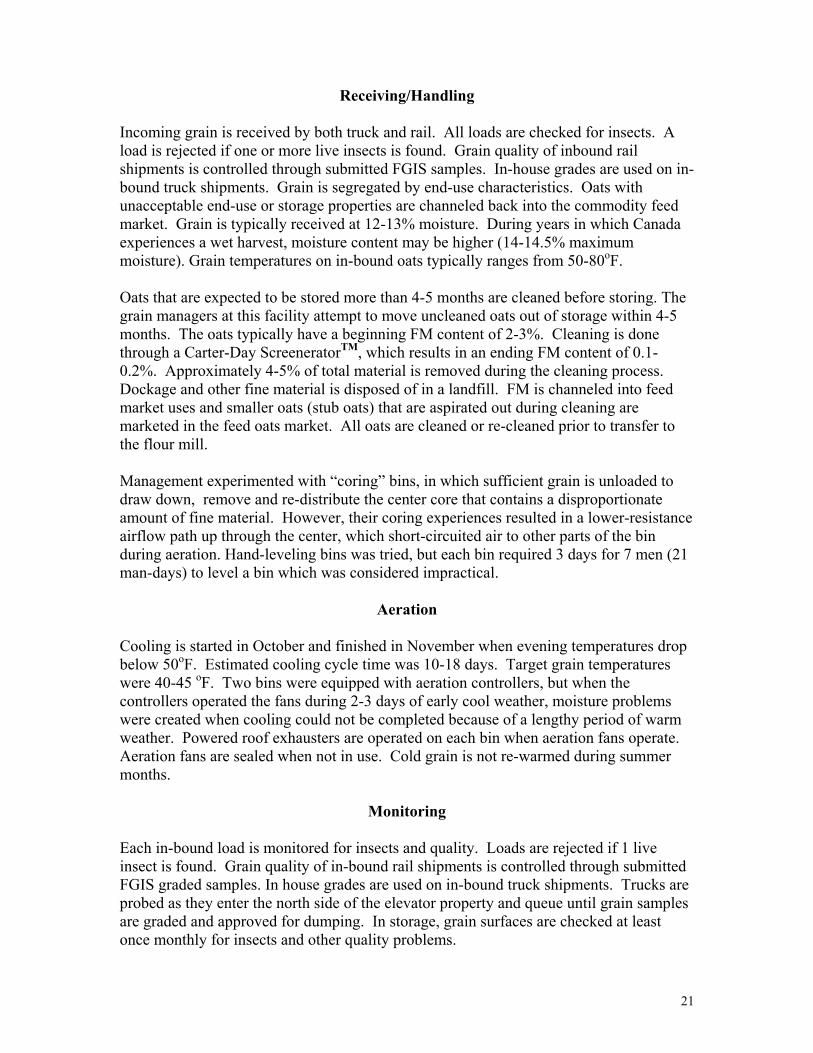
Receiving/Handling Incoming grain is received by both truck and rail. All loads are checked for insects. A load is rejected if one or more live insects is found. Grain quality of inbound rail shipments is controlled through submitted FGIS samples. In-house grades are used on in-bound truck shipments. Grain is segregated by end-use characteristics. Oats with unacceptable end-use or storage properties are channeled back into the commodity feed market. Grain is typically received at 12-13% moisture. During years in which Canada experiences a wet harvest, moisture content may be higher (14-14.5% maximum moisture). Grain temperatures on in-bound oats typically ranges from 50-80oF. Oats that are expected to be stored more than 4-5 months are cleaned before storing. The grain managers at this facility attempt to move uncleaned oats out of storage within 4-5 months. The oats typically have a beginning FM content of 2-3%. Cleaning is done through a Carter-Day ScreeneratorTM, which results in an ending FM content of 0.1-0.2%. Approximately 4-5% of total material is removed during the cleaning process. Dockage and other fine material is disposed of in a landfill. FM is channeled into feed market uses and smaller oats (stub oats) that are aspirated out during cleaning are marketed in the feed oats market. All oats are cleaned or re-cleaned prior to transfer to the flour mill. Management experimented with “coring” bins, in which sufficient grain is unloaded to draw down, remove and re-distribute the center core that contains a disproportionate amount of fine material. However, their coring experiences resulted in a lower-resistance airflow path up through the center, which short-circuited air to other parts of the bin during aeration. Hand-leveling bins was tried, but each bin required 3 days for 7 men (21 man-days) to level a bin which was considered impractical.
Aeration Cooling is started in October and finished in November when evening temperatures drop below 50oF. Estimated cooling cycle time was 10-18 days. Target grain temperatures were 40-45 oF. Two bins were equipped with aeration controllers, but when the controllers operated the fans during 2-3 days of early cool weather, moisture problems were created when cooling could not be completed because of a lengthy period of warm weather. Powered roof exhausters are operated on each bin when aeration fans operate. Aeration fans are sealed when not in use. Cold grain is not re-warmed during summer months.
Monitoring Each in-bound load is monitored for insects and quality. Loads are rejected if 1 live insect is found. Grain quality of in-bound rail shipments is controlled through submitted FGIS graded samples. In house grades are used on in-bound truck shipments. Trucks are probed as they enter the north side of the elevator property and queue until grain samples are graded and approved for dumping. In storage, grain surfaces are checked at least once monthly for insects and other quality problems.

22
Vacuum and pneumatic drill samples are also used to check grain condition in the top 25 ft of the grain mass. (Note: Deep probe technology now available at the time of this report should allow easy sampling of the entire grain mass, surface to floor, including the 90 ft depth at peaks.) Grain is also sampled for insects and quality each time grain is transferred from bins. Quick withdrawal samples by short operating the unload conveyors for a few minutes allow sampling of grain quality near the floor as well as the surface. These samples provide a periodic profile of grain conditions in bins.
Accomplishments Grain managers have successfully eliminated the practice of or need for direct residual pesticide application to bulk grain in storage. During the 8 years prior to OSU Team’s visit, no infested loads of outbound grain were detected. This management system provides an excellent example of how an increased emphasis on facility sanitation, grain cleaning, monitoring and aeration can facilitate the elimination of chemical inputs to grain. Their use of grain cleaning as a final safeguard against insect presence in grain used in flour processing is particularly important to recognize.
Major Grain Storage Problems Reported in Steel Bins: The facility storage structure and surrounding environment and weather conditions present several management challenges. Itemized in the list below are the most serious physical problems that were related to grain management. Many of these problems are related to the extremely large bin sizes of the steel tanks, both in bin diameter and grain depth. Each problem group is then analyzed from an engineering standpoint with recommended solutions listed.
1. Moisture leaking into the bins at the floor level along the south side of the walls. 2. Fines, trash and dockage in center core of bin under spout line blocks aeration. 3. Fines and foreign material cause 60-65 degree grain slope on unload cone after
gravity flow stops during unloading. 4. Aeration fans inadequate - -cooling too slow and irregular. 5. Aeration floor duct system inadequate. 6. Roof venting system inadequate - - 6 x 0.5 HP roof exhausters vs 80 HP pressure
aeration fans at base - - moisture condensation on surface grain. 7. No automatic control of aeration fan system on bins 53 and 54. 8. Roof exhausters create nuisance noise problems – need to be muffled. 9. Temperature cable breakage and lack of center thermocouple cable.
10. Sweep unloader wall clearance leaves grain around wall. Problem #1 - - Moisture leakage into bin at bases The elevator manager said the four 105 ft. diameter, 750,000 bu bins were too large. Large temperature fluctuations from summer to winter are extreme. South and north sidewall temperatures varied 30-40oF at mid-day in winter. Air temperatures vary from over 100oF in mid-summer to –35oF in mid-winter. With solar absorption on southern exposure galvanized sidewalls, steel base rings varied by 150oF from summer to winter. Between summer and winter, the diameter of the steel base ring contracted by about 12

23
inches on the concrete base. With this amount of movement, the bin wall to base junction could not be kept sealed. Snow drifts 4 to 6 feet deep around the bins. Solar radiation on the steel sidewalls on southern exposures melts snow around the base during the day. The water from snow-melt freezes at night. This cyclic condition plus the movement of the steel base ring causes water to seep under the wall into the grain causing spoilage along 30-40% of the base along east, south and southwest sides of the bins. Recommendations to help resolve problem: 1. Use wall steel base ring to concrete base “L” shaped anchor brackets mounted
about 2 ft up the base ring sidewall sheet with an I-bolt type turnbuckle connected to the concrete base anchor bolt. The purpose of bin-base anchor systems are to hold the bin on the concrete base against wind forces when bins are empty and to keep the bin “centered” on the concrete base.
2. The base anchor bolts circle should be 8-10 inches from the bin wall flange during cold weather so there is adequate room for the bin diameter to expand during hot weather. This long anchor bolt assembly will allow the steel base ring to slide on the concrete base as it expands and contracts without inducing shear forces to anchor bolts.
3. Seal the wall/foundation joint with flexible elastomeric roofing paint using a nylon mesh filler to bridge gaps of more than 1/8 inch. Seal in mid-summer, then re-seal late in the fall before first snowfall or after clearing the first snow away from the base and concrete is dry.
4. Clean snow away from southern exposed walls ASAP the snowfall or drift buildup to avoid ice-dams against the wall on sides exposed to the sun.
5. Two or three times (monthly) during the winter, remove a small volume (3-5,000 bushels) of grain from each of the bin unload gates across the bin width and recycle the grain back to the same bin to relieve compression stresses or pressure on the sidewall steel caused by contraction of steel wall rings due to extreme temperature drops during the winter.
Problem #2 - - Core of fines and dockage in cylindrical column in center of each bin A buildup of grain fines, FM and trash as grain is discharged from the overhead drag conveyor during filling creates serious problems when the bins are unloaded. During filling, dockage, grain fines and trash segregate. Broken kernels, dockage, weed seeds and other small material settle between the larger kernels within a few feet of the fill point, plugging the kernel interstice air gap between kernels, forming a dense vertical cylindrical column that restricts or blocks aeration airflow. This dense column can be eliminated by mechanically spreading the fines.

24
These bins were too large and fill rate too high for low powered commercial grain spreaders. Powered slingers used to fill ship holds or build large bulk piles of grain or bunkers could handle the flow rate and distribute the fines fairly well across the 52.5 ft radius, but these units are very heavy. They’re too expensive to install in each bin and too bulky to transfer from bin to bin. Recommendations to help resolve problem: 1. Fabricate and install a simple, large inverted cone shaped spreader constructed of
abrasion resistant (AR) steel or cold rolled steel, such as that depicted in Figure 1. This spreader is light weight and will break up the fines pattern and reduce peak height for improved aeration.
2. As an alternative to Item 1., “core” bins to reduce peak height for improved aeration by operating the unload conveyor using the center unload gate after each days fill or after complete filling of bin, to form an inverted cone about 1/4 for daily coring and 1/3 of the bin diameter for the final cone. Coring removes fines which restrict airflow and reduces airflow distance from floor to grain surface for more uniform air velocities to all parts of the bin. The surface slope or angle of repose for clean oats ranges from 32 to 35 degrees. Oats with foreign material, dockage and trash may have a surface angle of repose of 40 to 45 degrees. The elevator manager reported inverted cone surface slopes of 60 to 65 degrees. Because of steeper slopes and deeper cone bottoms than other grain, smaller cones must be used for oats. Assuming 35 degree grain surface slope with a 55 ft grain depth at sidewalls, peak height is 35-36 ft; center grain depth is about 90 ft. To avoid short-circuiting of airflow, the bottom of the inverted cone should not extend below the sidewall intercept of the grain slope. If the inverted cone surface slope is 45 degrees, the inverted cone with base diameter of 1/3 the bin diameter (35 ft.) has a ridge height of 24 ft. above the sidewall and depth of 17.5 ft. The bottom is 6.5 ft above the sidewall intercept. This is acceptable. When slopes of the grain peak and inverted cone surfaces are not known, use a drawdown cone of about 25-30 ft. A 30 ft cone requires unloading 5,000 bu. from each bin. Although coring the bin once after complete filling is beneficial, coring daily will remove more fines. Daily coring of 3-4,000 bu (10-15 minutes of unloading daily) is especially beneficial if the cored grain can be cleaned and cycled back into the bin as it fills. An alternative is to transfer the grain to a bin for clean grain.

25
Bin RoofStructure
Spreader SupportRod
Grain CollectorFunnel Suspended
from ConveyorDischarge
Adjustable HeightSecondary Grain
Spreader
45 degree 8 ft. diam.
Figure 1. Gravity Grain Spreader for Large Bins

26
Problem #3 - - Fines and foreign material cause 60-65 degree grain slope on unload cone
when gravity flow stops during unloading. Dockage and foreign material tends to sift down through the surface layer of oats as it flows down the inverted cone during unloading. This gradually causes an increased surface resistance to sliding friction, causing the cone surface angle of repose to increase as the grain cone enlarges and the grain draws down. Recommendation to help resolve problem: 1. Core bins once per day during loading to remove and clean the oats from the peak
by drawing out grain to about 1/3 of the bin diameter, or 35 ft. Assuming a grain surface slope for oats of 35 degrees and a draw-down cone grain slope of 45 degrees, the grain volume on a 35 ft diameter cone would be about 9,000-10,000 bu/day or 25-30 minutes unloading.
2. If each bin receives 150,000 bu/day, and is loaded in 7 days, this would involve unloading about 5-6% of the grain per day, but would recycle grain and capture an estimated 30-40% of the f.m. and dockage in the entire bin, which could be transferred and cleaned out during night, and transferred back into an empty bin, placing cleaner grain in the last bin to be filled. This process should sharply reduce the steep slopes of grain remaining in the bin after gravity flow stops.
Problem #4 - - Aeration fans inadequate -- cooling slow and irregular The aeration fans on these bins were designed with either two 40-HP Chicago Blower Corp. Model SQB or two 40-HP Rolfes C3D40 BH discharge low speed (1750 RPM) centrifugal fans supplying air to two 750,000 bu. oat bins. Two sets of blower specification sheets were supplied by the company, so the fan source is not certain, but both fans have similar performance. This was a poor aeration design and practice as grain in all four bins should be aerated simultaneously with a minimum of 1/10th cfm/bu in all bins. Management modified the aeration fan system by installing two of the four 40 HP fans each on Bins 51 and 52. They installed two 50 HP on each of Bins 53 and 54. Continuous aeration of all bins is much better, but is still underpowered with two 40-HP fans servicing Bin 51 and 52. The two 40-HP fans will provide only about 1/17th cfm/bu when both 40-HP fans are applied to one bin - - 21,500 cfm x 2 = 43,000 cfm/750,000 bu = 0.057 (1/17.4) cfm/bu. The two 50 HP fans should deliver about 15% more airflow or about 50,000 cfm at about 8 inches static pressure, compared to the 40 HP fans operating at 6-7 inches static pressure. This would provide approximately 50,000/750,000 = 0.067 (1/15th) cfm/bu. The elevator manager said the current 80-HP fan system cools the grain 20 oF in 10-18 days, or about 240-430 hours of continuous fan time. He said he would like to cool 20 oF in 4-5 days using two 75-HP fans delivering for a total to deliver about 75,000 cfm (0.1 cfm/bu).
27
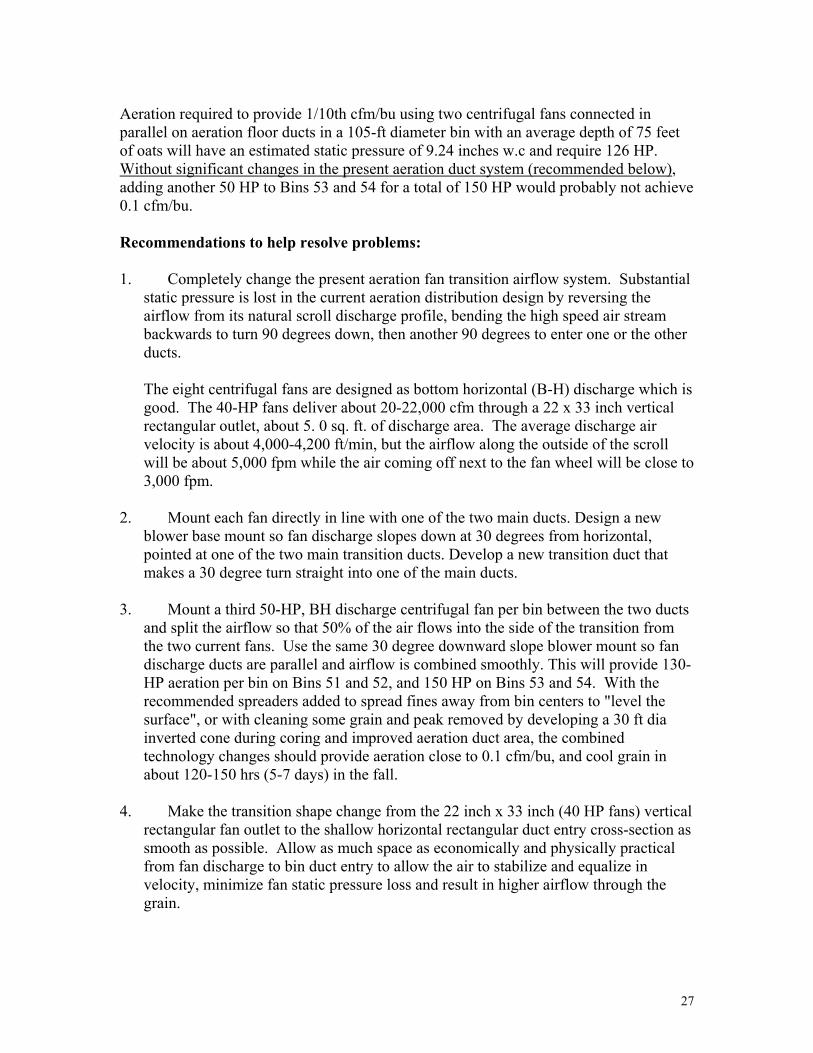
Aeration required to provide 1/10th cfm/bu using two centrifugal fans connected in parallel on aeration floor ducts in a 105-ft diameter bin with an average depth of 75 feet of oats will have an estimated static pressure of 9.24 inches w.c and require 126 HP. Without significant changes in the present aeration duct system (recommended below), adding another 50 HP to Bins 53 and 54 for a total of 150 HP would probably not achieve 0.1 cfm/bu. Recommendations to help resolve problems: 1. Completely change the present aeration fan transition airflow system. Substantial
static pressure is lost in the current aeration distribution design by reversing the airflow from its natural scroll discharge profile, bending the high speed air stream backwards to turn 90 degrees down, then another 90 degrees to enter one or the other ducts. The eight centrifugal fans are designed as bottom horizontal (B-H) discharge which is good. The 40-HP fans deliver about 20-22,000 cfm through a 22 x 33 inch vertical rectangular outlet, about 5. 0 sq. ft. of discharge area. The average discharge air velocity is about 4,000-4,200 ft/min, but the airflow along the outside of the scroll will be about 5,000 fpm while the air coming off next to the fan wheel will be close to 3,000 fpm.
2. Mount each fan directly in line with one of the two main ducts. Design a new blower base mount so fan discharge slopes down at 30 degrees from horizontal, pointed at one of the two main transition ducts. Develop a new transition duct that makes a 30 degree turn straight into one of the main ducts.
3. Mount a third 50-HP, BH discharge centrifugal fan per bin between the two ducts and split the airflow so that 50% of the air flows into the side of the transition from the two current fans. Use the same 30 degree downward slope blower mount so fan discharge ducts are parallel and airflow is combined smoothly. This will provide 130-HP aeration per bin on Bins 51 and 52, and 150 HP on Bins 53 and 54. With the recommended spreaders added to spread fines away from bin centers to "level the surface", or with cleaning some grain and peak removed by developing a 30 ft dia inverted cone during coring and improved aeration duct area, the combined technology changes should provide aeration close to 0.1 cfm/bu, and cool grain in about 120-150 hrs (5-7 days) in the fall.
4. Make the transition shape change from the 22 inch x 33 inch (40 HP fans) vertical rectangular fan outlet to the shallow horizontal rectangular duct entry cross-section as smooth as possible. Allow as much space as economically and physically practical from fan discharge to bin duct entry to allow the air to stabilize and equalize in velocity, minimize fan static pressure loss and result in higher airflow through the grain.
28
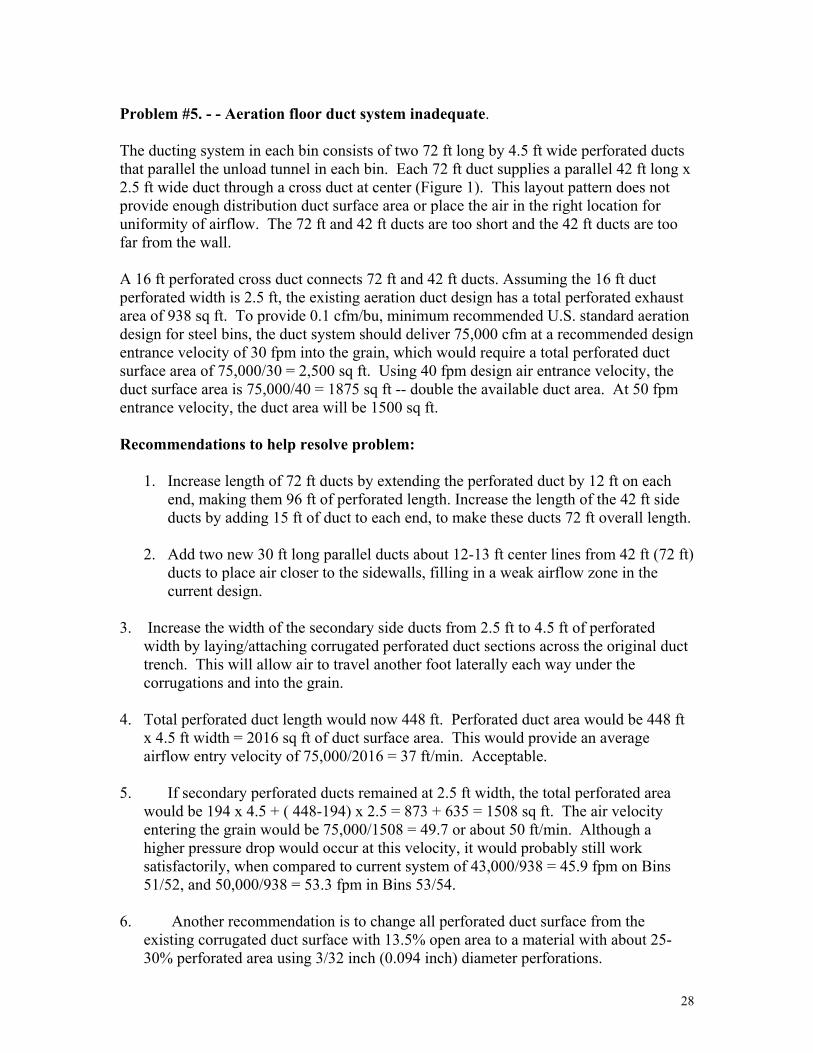
Problem #5. - - Aeration floor duct system inadequate. The ducting system in each bin consists of two 72 ft long by 4.5 ft wide perforated ducts that parallel the unload tunnel in each bin. Each 72 ft duct supplies a parallel 42 ft long x 2.5 ft wide duct through a cross duct at center (Figure 1). This layout pattern does not provide enough distribution duct surface area or place the air in the right location for uniformity of airflow. The 72 ft and 42 ft ducts are too short and the 42 ft ducts are too far from the wall. A 16 ft perforated cross duct connects 72 ft and 42 ft ducts. Assuming the 16 ft duct perforated width is 2.5 ft, the existing aeration duct design has a total perforated exhaust area of 938 sq ft. To provide 0.1 cfm/bu, minimum recommended U.S. standard aeration design for steel bins, the duct system should deliver 75,000 cfm at a recommended design entrance velocity of 30 fpm into the grain, which would require a total perforated duct surface area of 75,000/30 = 2,500 sq ft. Using 40 fpm design air entrance velocity, the duct surface area is 75,000/40 = 1875 sq ft -- double the available duct area. At 50 fpm entrance velocity, the duct area will be 1500 sq ft. Recommendations to help resolve problem:
1. Increase length of 72 ft ducts by extending the perforated duct by 12 ft on each end, making them 96 ft of perforated length. Increase the length of the 42 ft side ducts by adding 15 ft of duct to each end, to make these ducts 72 ft overall length.
2. Add two new 30 ft long parallel ducts about 12-13 ft center lines from 42 ft (72 ft)
ducts to place air closer to the sidewalls, filling in a weak airflow zone in the current design.
3. Increase the width of the secondary side ducts from 2.5 ft to 4.5 ft of perforated
width by laying/attaching corrugated perforated duct sections across the original duct trench. This will allow air to travel another foot laterally each way under the corrugations and into the grain.
4. Total perforated duct length would now 448 ft. Perforated duct area would be 448 ft
x 4.5 ft width = 2016 sq ft of duct surface area. This would provide an average airflow entry velocity of 75,000/2016 = 37 ft/min. Acceptable.
5. If secondary perforated ducts remained at 2.5 ft width, the total perforated area
would be 194 x 4.5 + ( 448-194) x 2.5 = 873 + 635 = 1508 sq ft. The air velocity entering the grain would be 75,000/1508 = 49.7 or about 50 ft/min. Although a higher pressure drop would occur at this velocity, it would probably still work satisfactorily, when compared to current system of 43,000/938 = 45.9 fpm on Bins 51/52, and 50,000/938 = 53.3 fpm in Bins 53/54.
6. Another recommendation is to change all perforated duct surface from the existing corrugated duct surface with 13.5% open area to a material with about 25-30% perforated area using 3/32 inch (0.094 inch) diameter perforations.

29
7. Cutting aeration duct planks (typically at 25-30% perforated area with 0.094 ID
perforations) from formed interlocking drying floor materials such as SUKUP or GSI drying bin flooring is recommended. This will allow easy removal for vacuuming fines from aeration duct trenches for improved IPM and sanitation.
Problem #6. - - Roof venting system with six 0.5 HP roof exhausters/bin inadequate. The roof venting system is totally inadequate to keep warm moist air from condensing on the cold under side of the steel roof where it condenses moisture on the grain, causing high moisture zones, surface crusting, mold and heating. This condition is very conducive to insect infestation since several secondary grain insects are mold feeders. Each bin has fifteen (15) roof vents, each with a cross-section area of 1.78 sq ft. This provides a total of 26.7 sq ft. Bins 51 and 52, vent air velocity is 43,000/26.7 = 1610 ft/min, 61% higher than recommended vent velocities of 1,000 ft/min for pressure exhaust Bins 53 and 54 roof exhaust velocity without roof exhausters is now about 50,000/26.7 = 1872 fpm, 87% higher than recommended. Existing roof exhausters provide some additional powered venting area, which helps reduce the exhaust velocity of the vents, but they are not performing as they should be. Roof exhausters should be sized to exhaust all air coming through the grain plus at least the same amount of air being pulled in through the roof vents. These should probably be six 5 HP units, not 0.5 HP exhausters and the number of roof vents should be increased as outlined below. Recommendations to help resolve problem: 1. There was no data provided on the handling capacity of the six 0.5 HP exhausters per
roof but 3 HP per bin is totally ineffective. Roof exhaust fans should deliver at least twice as much airflow as the aeration fans. At present, with two 40-HP fans delivering about 43,000 cfm, and the recommendation to add a third 40 HP fan to each of the two west bins, or a total of about 65,000 cfm, roof exhausters should be installed that can deliver 130,000 cfm (Bins 51 and 52) to 150,000 cfm (Bins 53 and 54) to provide double the airflow for blending of dry ambient air with warm moist exhaust air.
2. Since the roof exhausters should draw fresh air into the roof cavity to blend with high
humidity air exiting the grain, the vents will be handling suction or inflow of air, so the vents should be designed with a total area that would provide about 800 ft/min, or 65,000/800 = 81 sq ft of vent space for Bins 51 and 52. At present the vent area is 26.7 sq ft. so the roof vent area should be increased by 54 sq ft for Bins 51 and 52. Bins 53 and 54 need 75,000/800 = 93.7 sq ft. so another 67 sq ft of vent area is needed. .
30
3. Larger vents with cross-section areas of 4 to 8 sq ft can be used to reduce the number of vents as long as the required amount of total vent area is provided.
4. An alternative to minimize cost of roof venting would be to retain the existing roof
exhausters, but oversize the roof vent area as outlined in Item 2, operate the present underpowered roof exhausters anytime the aeration fans run, but develop a time delay system to continue their operation for an hour or two after the aeration fans are shut off to remove moist air from the headspace and dry the under bin roof surfaces to minimize dripping and condensation.
Problem #7. - - No automatic control of aeration fan system on Bins 53 and 54 Automatic aeration control is a must for large commercial storage. Busy managers cannot begin to compete with a preset temperature sensing thermostat that is properly set to start the large fans in sequence and control the temperature within a bracketed temperature range, such as 60 oF upper setpoint and 35 oF lower set point. The aeration controller should also be set to operate the roof exhausters to run 1-2 hours after aeration fans stop to exhaust moist air from the bin headspace and dry the grain surface. Recommendations to help resolve problem: 1. Design and install a “slave” control box to operate the aeration fans and roof
exhausters on Bins 53 and 54. Connect the “slave” controls to the automatic aeration control system that operates the aeration system on Bins 51 and 52. Roof exhausters should be set to run 1-2 hours after aeration fans shut off to evacuate excess moisture from bin head space.
Problem #8. - - Roof exhausters create nuisance noise problems – need to be muffled. Although this problem may not seem like an IPM related problem, the roof exhaust fan system is in fact an integral part of the overall IPM through its use during aeration. The noisy aeration roof exhaust fan on Bin 54 was high above ground level pointing southeastward toward a residual area. An attempt had been made to redirect or turn the sound by putting a sheet metal extension on the roof exhaust fan outlet, but this did not appear to resolve the customer complaint. Recommendations to help resolve problem: 1. Take sound level readings (dBA scale is closest to the sound received by human
ears) at the property boundary on line with the complainers home, and at the complainers property boundary in line between the noisy bin roof exhauster and the home before any further changes.
2. Invite the complainer to listen to the sound level with the fan running and have
them observe the dBA meter reading as it is being recorded on a data sheet.

31
3. Have someone turn off just the noisy bin roof exhauster and take another
“background” sound reading of all other fans operating except the noisy roof exhauster. Have the complainer listen and observe the reduced sound level as it is recorded on the data sheet.
4. Remove the noisy/offending roof exhaust fan and install a new roof vent in place of
the roof exhaust fan.
5. Move the roof exhauster to the north side of the bin, as directly opposite of the home of the complainer as possible, but not pointing toward the adjacent bin roof. If the fan exhaust is point toward Bin 53 roof, move the bin a few degrees farther around the roof and point it toward the grain probe station to avoid bouncing sound waves from the adjacent bin back toward the complainers home.
6. Take a new set of dBA sound level readings at property boundary and complainers
property boundaries with all fans operating. Make sure the person complaining observes the new dBA readings with the offending noisy fan operating on the opposite side and pointing away from the complainers location. The sound levels at this time should be very close to the background sound reading, Step 3.
7. If the sound level is still higher than the baseline background sound reading in Step
3, add a duct from the exhaust of the noisy fan (still high in the air and bouncing sound off of other structures) down the bin roof slope to the edge of the roof and aim the sound diagonally toward the ground near the truck probe station.
8. The noisy roof exhaust fan noise maybe a function of roof vibration due to an
unbalanced exhaust fan rotor that is shaking the fan and increasing noise due to roof vibration. Check all roof exhausters and aeration fan wheels and blades for mud dobber wasp deposits that can cause an unbalance and vibration in fans at high speed.
Problem #9 - - Temperature cable breakage and lack of center thermocouple cable. One thermocouple (T/C) temperature cable problem observed that was causing cables to break was that the cables had a formed loop of about 2 inches length secured by a small saddle clamp. The cable end was frayed. These loops had twine tied to them used to anchor the cable temporarily to a bolt anchored in the floor to hold the cables in position until the grain was around the bottom of the cable to keep the cable hanging straight down. Any bulky object clamped to a temperature cable will cause a very large increase in grain loading and tension in the cable. This is due to the diagonal shearing forces of the grain against the clamped object as grain settles.

32
Recommendations to help resolve problem:
1. Remove all turnbuckles and straighten cable ends. Overlap the twine on the last 2 feet of the smooth end of the temperature cable. Tape the twine to the smooth end of the cable with high quality air conditioning tape or duct tape to form a strong connection, which will allow a few feet of grain to build up and anchor the cable. Smooth taped ends add far less bulk to the cable than the doubled cable with frayed end and saddle clamp. This will reduce the tension on cables by 3-4 X or more, and should eliminate cable breakage.
2. Add a center cable to each bin, or move one of the four inner circle cables to the
center and form a triangular pattern on the existing inner cable circle. 3. If the cable system needs to be replaced due to many faulty or broken
thermocouples, consider replacing the entire thermocouple temperature monitoring system with the OPI GIMAC temperature monitoring and fan control system. OPI uses thermistors which are more accurate and require only a 4-wire transfer cable system from the bins to the computer in the office. Thus, one does not have to run hundreds of T/C wires through junction and switch boxes several hundred feet back to the office - - only 4 wires. OPI GIMAC can also be instrumented to sense humidity, insect movement through the USDA developed EGPIK system, and other functions. If part of the thermocouple system is in good condition, OPI GIMAC can adapt to current T/Cs, handling a blend of thermistors and T/Cs.
Problem #10 - - Sweep unloader wall clearance leaves grain around wall. The bin sweep system was a gear reducer driven unit that used a cogged wheel running in a matching circular floor track for positive movement around the bin. Because of the bin base ring movement between temperature extremes of summer and winter, and the possible “ob-round” configuration of the bin, the powered bin sweep drive wheel was spaced away from the wall. Thus, when the bin was swept, a ring of grain approximately 12 to 18 inches from the wall remained, requiring bin-entry by a work crew to move this volume of grain to the unload conveyor slide gates along the unload tunnel. Recommendations to help resolve problem:
1. Operate the sweep unloader with the bin empty, just after normal cleanout. Monitor the minimum distance to the wall from the end of the loader shaft or support wheel. Modify the sweep unloader by adding a short extension to close the gap to within 2-3 inches of the closest point. Repeat for all four bins as this minimum clearance distance will likely vary between bins.
2. After checking the closest distance from end of sweep unloader for each bin,
develop an attachment to mount on the end of the sweep by brackets that will “plow” the grain over to the sweep. This blade should extend forward of the end mounting of the sweep at a 45 to 60 degree angle to minimize loading. This
33
“grain plow” should be made of 3/16 inch or heavier steel with a floor clearance of 1 inch. A stiff rubber belting material may be added to extend closer to “sweep” the floor and the wall, but should have enough flexibility that it will bend back or deform over bolt heads and other projections.

34
Elevator 3: Oats; Corn and Wheat
Two PIs traveled to this elevator and its co-located oat mill in Missouri in February 2000. The OSU team met with the site manager of the elevator, the facility sanitarian who was in charge of pest control, and an individual from the company’s main office who was involved with product safety and scientific affair. Facility Description There was a total of 4.25 million bu. capacity at the site. The largest storage capacity is in 4 ea 500 bu., 107 ft. diameter round bolted steel bins, two of which have standard in-floor aeration duct designs at approximately 0.1 cfm/bu and two of which have PM-Luft pneumatic clean-out floor and aeration systems, each with two 60HP high pressure centrifugal fans. The remaining 2.25 million bu are in a concrete elevator with 48 ea 97 ft tall by 25 ft diam. silos at 37,000 bu each and 32 interstice bins making up the balance. The 800,000 bu concrete storage annex is equipped with high speed push-pull aeration at about 0.1 cfm/bu. Raw commodity for the mill is always available from the elevator. All grain cleaning took place in the mill, not in the elevator. No spreading or leveling equipment was used in the steel bins at the facility. This created problems with aeration, especially cooling grain peaks that contain proportionally higher levels of dockage and fine material than the outer portions of the grain mass. Commodities The objective of our visit was to study a primary oat storage facility, but other grains were handled in this elevator in addition to oats. The sequence of grains, based on harvest times, and amounts handled in a year are as follows: wheat (2 M bu), oats (8 M bu) and white corn (3 M bu). So, this 4.35 million bu facility handled about 13 million bu of grain annually for a turn-over rate of about 3:1. All incoming grain had to have official grades provided by the shipper. Additionally, the company performed their own grading thorough grain inspections. The company does not accept grain shipments with live insects, though we were lead to believe they would tolerate the presence of dead insects (i.e. those from a recent fumigation). The minimum test weight the company accepted for oats was 38 lbs/bu, although the FGIS standard is 32 lbs/bu. Oats in some loads were as high as 47 lbs/bu. The company would tolerate only 2 insect damaged kernals (IDK) per 100 g or less. They reported using X-ray analysis to determine internal infesting insect load if IDK is high. The company was very concerned about aflatoxin contamination and subjected samples of all incoming corn to the simple black-light test followed the wet chemistry “mini-table” analysis for suspect samples. The company had a threshold for acceptance of 10 ppm on aflatoxin, even though the government threshold is 20 ppm. Oats were stored up to 12 months (to accommodate year-round milling), wheat was stored for 60 days and white corn was stored up to 6 months. A protocol was in place to perform pesticide screenings on certain samples as part of the company quality assurance.
35
Accomplishments The manager successfully developed an IPM program that essentially eliminated direct residual insecticide application to bulk grain in storage. Some top dressing is still practiced on certain type of grain at specific high risk times of the year. During the past decade, several key improvements were put in place to enhance grain management and elevator operation. Two of the 500,000 bu bin aeration systems were modified to include self cleaning floors using fluidized ducts in shallow hoppers between floor ridges. Prior to this, one man worked two weeks with the sweep unloader system to finish cleanout of the 100,000 bu inverted cone remaining in the bin after gravity cleanout. With the fluidized grain unloading system, two men can cleanup the residual dust in less than 1-day. This greatly reduces risks from insect pests. Fro at least the past eight years there were no infestations detected loads of outbound grain. This management system provides an excellent example of how an increased emphasis on facility sanitation, grain cleaning, monitoring and aeration can facilitate the elimination of chemical inputs to grain. Their use of grain cleaning as a final safeguard against insect presence in grain used in flour processing is particularly important to recognize. Sanitation The company used a regular (weekly or bi-weekly) sanitation checklist, and indicated this was a critical IPM point for them (score=10). They felt empty bin cleaning was critical, but admitted to not doing as much as they would like to do (score=7). Workers were sometimes sent into bins on boatswain’s chairs to sweep down or blow down the walls of empty bins. Although considered critical, walls of empty bins were not sprayed with residuals; only fogging (probably of pyrethroids) was done in bins (score=7). Cleaning spilled grain was considered critical, but was not performed at the best level in the company’s opinion (score=8). Weed control was also critical, but performed at a minimal level (score=6). Rodent and bird control programs were considered critical and done at high levels (scores=9 for each, birds and rodents). Sealing of side walls and bin bases was considered a good management practice, but was performed minimally (score=5). Sealing of fan and conveyor inlets and outlets was considered a good management practice, but the company indicated as “Not Applicable” for the facility. The overall sanitation score for CIPM points was 8.0. The company sanitarian said that Indianmeal moth laid eggs behind and inside electrical boxes. She wanted to install screens over open man-holes to exclude insects when manholes were open during bin loading. She checks grain from silos monthly by opening R&P slide gates to drop just enough grain on the belt to clear spouts of existing grain before pulling samples. Receiving and Handling Grain
When the manager started work at this facility the truck-receiving rate was 100-150 truck per 12 hour day. After adding remote controlled hydraulic probe stations which reduced total time to grade samples and other grain receiving improvements, the
36
receiving rate increased to 300-400 trucks per day. Unit train sizes from 27 to 54 cars can now be loaded at the facility.
All grain was received on contract from “preferred suppliers”, except for some
amounts of locally-produced corn (CIPM=10). The company reported that sampling incoming grain for insects and moisture, as well as the policy to reject or fumigate infested loads, were critical points that they performed very well (CIPM=10 for each). Maintenance of safe moisture for long-term storage was listed as a good management practice, and the company reported good adherence (GMP=8). Moisture was probably most important for corn, which they dried to at least 15.5% mc before storage, and presumably would dry slightly during aeration after binning. Neither spreading, leveling, nor coring were practiced by the company (GMP=NA). The average CIPM score for loading and receiving was 10.0; the average GMP score was 8.0.
Two of the 500,000 bu bin aeration systems were modified to include self
cleaning floors using fluidized ducts in shallow hoppers between floor ridges to eliminate a serious handling problem. Prior to this, one man worked two weeks with the sweep unloader system to finish cleanout of the 100,000 bu inverted cone remaining in each 500,000 bu bin after gravity cleanout was completed.
With the fluidized grain unloading system, two men can clean up residual grain
and dust , which is only around the center unload hopper in less than 1 hour. This system greatly reduces risks of working in a confined space while unloading oats, which have a much higher surface angle of repose (45-60 degrees from horizontal, depending on dockage and f.m.) in inverted cones than most other grains. High cost of the self-cleaning aeration floors prevented installing them in the other two 500,000 bu bins. Aeration The four steel bins and some of the concrete structures were equipped with aeration. The company made a point of storing all their corn in aerated silos, presumably because of its higher purchase and storage moisture content, so it could be cooled with some additional moisture loss during aeration for safe storage. Steel bin aeration in the two conventional aeration systems was approximately 01. cfm/bu. The two bins with PM-Luft Kanal System floors had two 60 HP fans with 6 manifold valves/fan for cleanout of the bin in 12 sections of the floor. For aeration, all valves are opened for uniform distribution of air. The aeration airflow rate for this system is about 1/7-1/8 cfm/bu. Twenty five concrete silos have excellent aeration systems. A variety of fan HP and arrangements are used. Five bins have a roof mounted 35 HP suction fan for upflow suction aeration. Four silos have a 25 HP centrifugal base mounted pressure fan plus a 10 HP centrifugal roof mounted suction fan on each silo. Sixteen silos each have a 15 HP centrifugal base mounted pressure fan plus a 10 HP centrifugal roof mounted suction fan. So, between 25 and 35 HP per 37,000 bu silo is used to produce about 1/5-1/6 cfm/bu, which provides excellent cooling rates.

37
While completing in the Ideal IPM Elevator Checklist and Facility Audit form, the manager indicated it was critical to use proper aeration when available (CIPM=10), cool below 65 oF for storage from winter through April (CIPM=10), and check the cooling zone with thermocouples (CIPM=10). These three aeration section factors were reportedly done as often as possible. Roof exhausters (CIPM=8), adequate roof venting (CIPM=10), and other means to reduce condensation during aeration were considered critical and were rated by the company as a good score. Use of aeration controllers was considered a critical management practice (CIPM=8), although they did not report having them. The company reported operating fans for 4-8 hrs a night during cool weather when aerating. Average CIPM score for aeration was 9.6; the average GMP score was 8.0 Monitoring All concrete bins had one temperature cable each and the large steel bins each had seven cables. Grain temperature monitoring was considered critical and was reportedly performed at the highest level by recording thermocouple readings of all stored grain temperatures weekly or bi-weekly (CIPM=10).
Monitoring activities for insects and structural problems were not considered critical, but were practiced to some degree (GMP=NA). The company sanitarian reported taking bin-bottom samples of grain from every bin between July and December and inspecting them for insects (GMP=NA). She also reported opening the tops of all bins and looking inside for any obvious pest problems. Multiple bottom samples were taken if initial samples revealed insects. The company reported using pheromone-baited sticky traps for Indianmeal moth in both the basement and tops of the concrete silos; they also trapped for dermestid beetles (e.g. the warehouse beetle).
Traps for many other insects were used in the milling sections. The company was
familiar with grain probe traps, but did not use them (GMP=NA). Storage structures were checked regularly for leaks (GMP=9), and walls and other water sources were monitored for rodent activity regularly (GMP=9). The average CIPM score for monitoring was 10.0; the average GMP score was 9.0.
Overall IPM Score CIPM=9.4, GMP=7.5 (Note: numerical scores were not recorded for the practices below.) Pesticide Use and Practices Although the company allowed receipt of grain with residual pesticides below tolerance levels, they reported that they did not add any residual grain protectants directly on the grain. Top dressing of grain bulks with materials such as ReldanTM, ActellicTM or DE (diatomaceous earth) was practiced on occasion. Crack and crevice spray treatments outside and near bins was performed with TempoTM. Fogging with VaponaTM and pyrethroids (product not specified) was performed in bin headspaces to control Indianmeal moths. Fumigation with phosphine was performed 1-2 times a year on corn, “sometimes” on oats and never (or rarely) on wheat. Aluminum phosphide pellets were

38
applied at the rate of one flask per interstice bin and four flasks per round concrete bin; rates on the large steel bins were not recorded, but were expected to be between the middle and maximum label rate for steel bins. Application methods of pellets included probing in from the top, “coring down” the pellets while withdrawing and recycling grain to the same bin. Pellets were applied to concrete silos by automatic pellet dispenser for uniform distribution in the grain while turning. Dosage levels in 37,000 bu concrete silos were 4 flasks, or 180 pellets per 1,000 bu. Their target was to maintain 200-400 ppm during the fumigaton. Safety and Education The company reported having 2-3 certified fumigators on staff and reported “yes” to all questions about safety procedures. Phosphine detection tubes were used regularly for worker safety and to test concentrations for levels to sustain efficacy during fumigation. Both face mask with canisters and SCBA respirators were available for worker safety use, especially when retrieving phosphide sachets. Managers and key employees attend at least one pesticide training workshop a year and hold regular in-house safety meetings at monthly intervals. The company maintained their own written standard operating procedures for using pesticides. The company had staff specifically trained in grain grading and sampling. The company reported that some training was provided to producers and suppliers on the subjects of stored grain management and IPM.
Grain Storage Problem in Steel Bins: The facility storage structure was well organized and maintained. The primary problem observed at this elevator was the long cleanout time of these huge steel bins after gravity flow of grain stopped. Two of the four 500,000 bu, 107 ft diameter bolted steel bins were converted from flush floor aeration with sweep unloaders to pneumatic powered self-cleaning floors using PM-Luft Kanal System floors. These floor systems worked very well at this plant but were too expensive to install in all four steel bins at the same time. The manager would like to convert the other two bins, but would prefer a much less expensive alternative, which is not available at this time. Major Problem The primary problem experienced by the manager at this time is the 20% of the bin volume in the 107 ft. diameter bins that does not drain out. This requires operating the bin sweep to make 4-5 passes around the bin, followed by two men working 2 weeks to do the final cleanout of the large floor in each bin (no access for bobcat unloader). The problem is exacerbated by fines, trash and dockage in center core of bin under spout line, and additional dockage and fines in the grain that sifts down below the slope during gravity unloading. This material causes the inverted cone grain surface to become steeper than the peak surface of the grain (about 35 degrees) as the bin was filled.

39
Possible Partial Solution to Problem 1. Cleaning the grain before loading the two conventional aeration and sweep cleanout bins may reduce the slope angle of the remaining grain, reducing the volume of grain that remains in the bin after gravity cleanout through the multiple floor hoppers that create a V shaped grain slope. Cleaning will also improve aeration and storability for oats which is held for up to 6 months. 2. The true solution is to install pneumatic self-cleaning aeration floors in these two bins so they perform like the two bins with the PM-Luft Kanal Systems. A plan might be developed with PM-Luft to install one floor each year for two years, or set up a plan to pay the cost of the floors out over multiple years.

40
Elevator 4: Corn
Two PIs visited this elevator in Illinois in March 10, 2000. The individual hosting our visit was very familiar with commodity handling and pest management at this facility. We also met with the company sanitarian who is in charge of the day-to-day pest control and fumigation when needed. Facility Description This facility is committed entirely to corn dry milling and has approximately 1 million bushels of total storage capacity, all in 24 concrete silos that are up to 110 feet tall; 12 of which with a capacity of 75,000 bu each and the remainder ranging from 2500 to 27,000 bu.. The silos are served by 4 interior elevator legs. Areas around the silos are paved; all driveways are paved and is one set of railroad tracks serving the facility. This location is one of two main processing plants for the company, the other being in a neighboring state. The company owns 10 country elevators across two states that supply the processing plants. Commodities Stored Corn is the only commodity stored. The firm takes in corn of unconfirmed varieties, but also maintains a list of 12 (at the time of our survey) specific varieties for identity preserved (IP) storage and use. Growers are fully educated on the IP varieties by the company and are stewarded by the company through production to delivery. IP varieties can be worth $0.20 to $0.25 more per bushel to producers than regular corn. Only country elevators with more than one elevator leg will receive IP corn for the company. The company has a strict no-GMO (genetically modified organisms) policy, thus none of the IP varieties used were GMO. At the time of this survey the company was aware that 19% of all corn in Indiana and 43% of corn in Illinois was genetically modified for containing the gene for the insecticidal protein of the B.t. bacterium. The company performed immunological and genetic (PCR) testing on IP varieties taken in to confirm they were GMO-free. The company indicated that although they historically provided most of their products to the breakfast cereal industry, that snack and convenience food uses were beginning to dominate the end-uses of their products. Sanitation The company decided that use of a sanitation checklist was their only critical IPM point, and that other sanitation factors were considered good manufacturing practices. The company maintained weekly use of a sanitation/housekeeping checklist, which was based on a master sanitation schedule that was developed for them by AIB (American Institute of Baking); they assigned a CIPM=9 on use of a checklist. They reported doing regular empty bin cleaning prior to filling (GMP=9); cleaning spilled trash and grain from around bins (GMP=8); controlling weeds around silos where applicable (GMP=9); repairing water leaks and other structural defects regularly (GMP=7); and sealing fan and conveyor outlets when not in use (GMP=7). Blow-down and sweeping (not vacuuming) of dust
41
and debris around machinery and structures was practiced regularly as part of housekeeping. There was no use of residual insecticidal sprays or fumigant application to empty bins before loading, but such practices were done at their country locations. A rodent control program was operated by an outside contractor (GMP=10) and some attention was given to bird and rodent-proofing of the facility (GMP=5). Average GMP score for sanitation was 7.9 and the one CIPM score was 9.0. Loading and Receiving Receiving grain from preferred supplier was considered a key factor in controlling product quality, and indirectly for preventing pest problems, (CIPM=10). As indicated above, all or nearly all grain delivered was from contract growers who were delivering specified varieties that were fully documented. All grain is sampled upon receipt for insects, moisture and other factors (CIPM=10). The company maintained a zero tolerance policy for any insect found in a grain sample, whether dead or alive, and reject (rather than fumigate) any shipment found to have an insect (CIPM=10). Long-term storage of grain at safe moisture levels was considered simply a good manufacturing practice (GMP=9) because grain was not stored very long at this site due to the rapid turnover with the mill. High moisture grain was always used first, and that stored longer was usually at 13% mc. Coring and leveling of grain bins at time of filling was not practiced by this facility, but many of the country locations reportedly do this (GMP=7). Average scores for loading and receiving were 10.0 for CIPM points and 8.0 for GMP points. Aeration Aeration is used at all the facilities; down-flow aeration is used on the concrete silos in this location and up-flow aeration was used on steel structures in the country elevators. The company claimed that aeration was important, but placed airflow requirements (0.1 cfm/bu) in the good management practices and gave this point GMP=7. Cooling grain to below 40 F (rather than 65 F) was a company goal, and progress of the cooling front is checked with thermocouples (CIPM=10 for each). Automatic aeration controllers were not used and the company reported that they achieved the target temperature by using fans only at night. Engineering bins for minimization of condensation was considered and important practice (GMP=7), as was the use of adequate roof venting (GMP=9). The average scores for aeration were CIPM=10.0 and GMP=7.6. Monitoring The company put a high priority on checking grain temperatures in bins on a regular basis (CIPM=9). There was no active monitoring for insects, either through simple observations or through trapping, in stored grain. Grain samples were taken bi-weekly in May from every bin to check for moisture and insects (GMP=9). All storage structures are checked regularly for leaks (GMP=7) and areas were monitored for rodent activity (GMP=8). Indian meal moth pheromone traps are deployed in the basement and gallery of the concrete silo system to monitor this insect in the summer time (GMP=8). Average score for monitoring was GMP=8.6 and CIPM=9 (for temperature cables only).
42
Overall IPM Score: The average overall score given by the company for critical IPM points (CIPM) was 9.5, though this was based on only a few points. The average self-assessment for good management practices (GMP) was 7.9. Pesticide Use Practices The company had a strong policy against the use of residual pesticides on grain, and they also rejected or refused receipt of grain that had any known chemical residue. They claimed a GMP sore of 10 for each of these practices. The respondents gave themselves a GMP=2 for use of DE applied as an empty bin or crack and crevice treatment. They claimed to be very judicious in the use of fumigation in the grain, with a GMP=9 and purportedly no more than one fumigation per year. Re-circulation or closed-loop fumigation was not used. The company reported using fogging treatments of pyrethrins and Gentrol (an insect growth regulator) in the basement and gallery sections of the concrete elevator, and they gave themselves a GMP=10 for this. Safety and Education Safety was a very high priority for this company. They responded with a score of “10” to all GMP points related to safety (certified applicators on staff, air samples taken before re-entry to a fumigated area, PPE available for any worker needing it, fit-testing for respirators done, written safety plan implemented, written emergency action plan in place, and use of a contractor orientation program for safety education). The company reported that key employees attended at least one grain management or IPM workshop each year (GMP=9) an he company reported giving such workshops to suppliers (GMP=9). Company grain graders were trained in sampling and grading (GMP=9). Employees reportedly received monthly safety and/or pesticide handling training (GMP=10) and the managers and supervisors were required to attend such classes for their performance review (GMP=10). The overall score for pesticide use, safety and education was an average GMP=9.3.

43
Elevator 5: Corn
Two PIs visited Lauhoff Grain Co. this second corn milling company in March, 2000. Our host was the company’s director of technical services. We were joined at times by the manager of grain storage, and by his assistant manager. Reportedly one third of the company’s products go into breakfast cereals, one third into the brewing industry, and the remaining third into numerous food products or specialty material uses. Facility Description The main elevator facility is concrete with 5 interior elevator legs serving 114 concrete silos. The large concrete silos were 32 ft in diameter and 129 ft tall with a capacity of 48,117 bushels of corn. A unique rhombohedron flat storage with a capacity of 4,000,000 bu was on site, but reportedly was used just for beans and it was not considered in this analysis There were several interstice bins of various dimensions. There were two very large round steel bins on site that were used mostly for beans. Each of these was 133 ft in diameter and 113 feet tall for a capacity of 1 million bushels. All roads and driveways were paved, some had gravel on top and others in the truck staging lot were oiled. The bucket elevators operated at 7500 bu/hr and all had accessible boot clean-outs. One large drag conveyor was used for horizontal movement. Commodities The primary commodity of interest is white or yellow dent corn. Soybeans are also taken and stored, but beans are strictly segregated from corn to avoid soy protein contamination of corn products. Soy products can cause allergies in some people and also affect oganoleptic characteristics of corn products. Sanitation Three practices were considered critical IPM points. They were the use of a weekly or biweekly sanitation/housekeeping checklist (CIPM=8), attending to spilled grain and accumulation of fines around the facility (CIPM=7), and having a rodent-control program (CIPM=9). Self-assessments on good management practices were: empty bin clean-out prior to filling, GMP=5; empty bin spray or fumigation prior to filling, GMP=7; weed control, GMP=9; seal bin bases and side-walls for leaks, GMP=9; sealing aeration fans when not in use, GMP=8; bird and rodent control practiced in facility, GMP=9. The company reported the additional sanitation activity of using a central vacuum cleaning system to clean the gallery floor every 2-3 days (GMP=8). Average score for critical IPM points in sanitation was 8.0, and the average score for good management practices was 7.7. Loading and Receiving This company did not use preferred or contracted suppliers. However, most suppliers were local and known to the company. The company placed a high priority on sampling incoming grain (CIPM=9). No incoming grain was fumigated. The company rejected
44
grain that had more than one live insect or more than two dead insects found in any sample (CIPM=9). All grain for long-term storage was stored at 14-15% moisture content (GMP=9). The company was attendant to formation of spout lines in bin cores and routinely practiced coring of bins; no spreaders were used (GMP=8). The company also reported using rare-earth magnets on incoming grain. Overall scores for receiving were CIPM=9.0 and GMP=8.5. Aeration All bins reportedly had aeration fans. The large round steel bins each had a single large at 75 hp that was connected to a sub-floor system of aeration ducts. Concrete silos were equipped with down-flow aeration. The company scored itself as GMP=9 for adequate aeration. The company’s objective was to cool grain to below 50 F as soon as possible after loading (CIPM=9) and the cooling zone was always monitored with thermocouples (CIPM=10). The two large steel bins each had 26 thermocouple cables that each had 17 sensing points. The concrete silos had one cable in the center of each that had 17 thermocouples at 7-foot spacing. The manager did not consider condensation at roof spouts a big issue, so engineering to minimize this was not stressed (GMP=4). Nevertheless, adequate roof venting was provided for all bins (GMP=9). Automatic fan controllers were not used. Overall scores for aeration were CIPM=9.5 and GMP=7.3. Monitoring The company reported that monitoring grain temperatures, reportedly daily (presumably with electronic data acquisition) was extremely important, and they gave themselves a CIPM=10 for this practice. Bin cores were not checked for insects or moisture, and grain probe traps were not used. Grain surfaces and the insides of bins were apparently checked on some periodic basis for moisture or pest problems, but the company assessed themselves at only GMP=6 for each of these. Inspections for rodents were considered critical, but the company reported only a CIP=7 for this. Pesticide Use The company reported that fumigants were rarely used, thus no re-circulation systems were not in place; only emergency situations would elicit the use of phosphine. The only residual insecticide reported was the use of Actellic on the inside surface of empty bins following a yearly cleaning of the bin tops. Safety and Education The company gave themselves a score of “10” for all safety practices and safety training queried. Managers and key employees would attempt to attend at least one IPM workshop a year; grain graders were routinely trained in sampling and grading, and the company was religious in having monthly safety training for employees. Although no formal training in IPM and storage methods were given to grain suppliers, the company has regular contact with all suppliers and transfers relevant information on a regular, though informal, basis.
45
Elevator 6: Wheat
Three PIs visited this wheat storage and milling facility in western Michigan. Much of this flour is sold for use in breakfast cereal products. The firm consists of two major operations, a grain receiving and storage facility and a flour mill. Our interview with the senior vice president focused primarily on the grain receiving and storage part of the business. Facility Description. Grain storage capacity currently is approximately 2.8M bushels. A concrete elevator holds 1M bu. and the remaining 1.8 M bu is in round steel bins. The steel bins are composed of 4 ea. 35K bu. bins (w/1 leg), 6 ea. 150K bu. bins (w/ 3 legs), and 2 ea. 500K bu. bins (w/one leg). Commodities Stored All grain purchased and stored is wheat, mostly soft white and soft red. Some hard red (e.g. from Nebraska and Kansas) and dark northern spring (or the equivalent) from Canada is railed in on the basis of federal grades to blend in to meet buyers’ protein specifications. All of the firm’s facilities are at this location. Sanitation A full-time staff person is in charge of sanitation at the facility. All bins are cleaned before the new crop is stored at harvest time (CIPM=9). In most years, most of the bins are empty before the next harvest. This permits cleaning the bins before harvest, and also means that only a small amount of grain is carried over, and this small amount may be stored up to 15 months. Each of the 250K bu bins requires 3 people about 1 week to clean and to do normal repair/maintenance prior to storage. The company brings scaffolding into each bin to be able to sweep down the sides. Steel bins are cleaned more thoroughly since the sides are corrugated and bottoms are not sloped as the concrete tanks are. The manager reported using a regular housekeeping checklist (CIPM=8). In the early to mid-1980s the company made an explicit decision to avoid pesticides to the extent possible, presumably even if non-pesticide practices were more expensive. Thus spray-down of empty bins with residual insecticides was not routinely practiced, though the manager indicated it occurs in some instances. Cleaning of spills, control of grass and weeds, repair of bin leaks and security of fan an conveyor transitions were all regarded as critical IPM points by the manager (CIPM=9 for each). The company uses a contracted rodent control service for inside and outside treatment (CIPM=9), but admitted that bird and rodent-proofing the facility was a concern, but not always achievable (GMP=9). The company reported and additional practice of cleaning elevator boots on a monthly schedule (CIPM=9). Average CIPM score was 8.9 and GMP was 9.0.
46
Loading and Receiving The firm religiously samples all incoming grain for insects moisture and other factors (CIPM=10). All incoming truck-loads are sampled with a minimum of 5 manual probe samples. Samples are tested for dockage, moisture, insects, and other grade factors. The company rejects any truck in which one or more insects, whether dead or alive, is found (CIPM=10). All received grain must be a safe storage moisture levels (CIPM=10). They reject grain that is more than 18% moisture, and pay on a 13.5% moisture basis and charge a drying fee. Wet grain is consequently dried down to about 13.5% moisture. This company does not have preferred suppliers because they find that most suppliers know that the load will be rejected if it doesn’t meet standards. However, they have identified a small number of producers/elevators who have not been reliable suppliers and would probably not purchase grain from them. The company specifies in purchase contracts that no residual pesticides are to be used on grain. This is checked randomly by sending samples out to a lab. The company reportedly uses no grain spreading, leveling or coring methods to reduce fine material in spout lines. The average CIPM score for loading and receiving was 10.0. Aeration All bins but one are equipped with down-flow aeration systems; the company reported adequate aeration on the whole facility and considered this a critical point (CIPM=10). Aeration fans run from mid-August to mid November with a target for grain cooling of 60 F as soon as possible after storage (CIPM=10). They don’t cool much below 60 F because colder wheat will not mill as well (tempering doesn’t work as well with grain cooler than this). Automatic aeration controllers are not used. The fans run continuously in the fall unless the weather becomes warm. The manager estimated 2.5 months of fan use at 30 days/month and 24 hours/day. Thermocouples are checked regularly to monitoring the cooling front (CIPM=10). All bin roofs have adequate venting (CIPM=10). Average CIPM score was 10.0. Monitoring Grain temperatures are monitoring bi-weekly during the aeration cooling period in the fall, and then temperatures are given spot checks after that (CIPM=9). The company reported doing no sampling, trapping or other kinds of monitoring for insects. The manager reported monitoring grain quality (e.g., grade factors) on a regular basis throughout the year. Overall IPM Score: The average score for critical IPM (CIPM) points by this company was 9.5. Only bird and rodent-proofing was a GMP (9.0), and this was due to do a concern, but inability, to follow through as a critical point. The company prides itself in storing and producing high quality products, and clearly puts a lot of effort into preventive IPM practices such as sanitation, receipt of high quality grain and attention to rapid and effective grain cooling.
47
Pesticide Use Practices As indicated above, the company maintains an essentially insecticide-free policy for grain management. The do not use residual insecticide sprays except in one old bin that is not sealed as well as it should be because of structural problems. The company reports never using fumigants on their stored grain. Methyl bromide was used in the flour mill approximately 3-4 times in the last 8-9 years. Prior to 1984 the company used methyl bromide on a regular basis, as many mills do presently. At one time the facility was certified organic, but the market was too small to be worth it, and they couldn’t guarantee supplier practices. Nevertheless, they strive for chemical and residue-free commodity with effective insect suppression through preventive IPM. Safety and Education Pesticide safety issues reported were all related to the flour mill and not the grain storage department. Two certified fumigant applicators are on staff in the mill (GMP=10). They report obtaining safe air samples prior to entry following a fumigation (GMP=10), and they have all appropriate personal protection equipment; an SCBA (self-contained breathing apparatus) is on site (GMP=10). Fit testing for respiratory equipment is conducting annually and appropriate safety plans and emergency action plans are in place. Managers and key employees reportedly attend two grain management or pesticide training workshops a year, such as those offered by private educators like Association of Operative Millers or Fumigation Services and Supply. In-house safety meetings for employees are conducted two or more times a year. The company does not provide any formal educational programs to its grain suppliers. Company grain graders are professionally trained. Observations and Additional Comments 1) Cleanliness around steel bins was good, but the manager admitted it could be
improved. Workers were cleaning out one 250K bin at the time of the interview. Grain in this bin smelled sour, perhaps because of water leak. That part of the state had received a lot of rain recently. Puddles were observed around base of bins, and water was observed in below ground areas such as loading pits.
2) This year and last year vomitoxin has been a problem. This facility tests each source
of grain for vomitoxin. Testing required that a truck wait to unload for the 20-45 minutes the test takes; after a pattern of low vomitoxin levels is established by a particular supplier the company may allow truck to unload before test is completed until another load tests positive.
3) Aeration systems are not cleaned every year before the new harvest unless problems
are obvious, such as a buildup of grain under the floor.
48
4) Some savings in electricity would likely be possible if fan capacity was increased, and if automatic temperature controllers were used to only run fans when outside air is cooler than grain.
5) Electricity provider bases prices for year on peak load at any time in previous year.
To save electricity costs the facility keeps aeration fans off until harvest-time electricity loads are over.
6) Cost data on labor, overall sanitation, and electricity were generously provided by the
manager and used in the economic analysis below.

49
Elevator 7: Wheat
Three PIs conducted this IPM assessment at two locations owned by one company in eastern Michigan. The first location (Elevator 7) was the grain elevator and flour mill at the company headquarters. The second location (Elevator 8, described below) was a country elevator located just 4-5 miles north of the main office. We learned that the company owns several mills and supplies food grade wheat flour to several breakfast cereal and pastry manufacturers. Specific wheat components such as bran and germ are isolated and sold to specialty markets. The mill also cleans and prepares whole wheat (unmilled) berries to sell for breakfast cereal use, such as for flakes. We met with the head miller and worked through the IPM checklist with him. Facility Description The total storage capacity was approximately 450,000 bu. All storage is in concrete silos comprised of one large silo at 260,000 bu, 9 silos of medium size at about 15,000 bu each and a series of eight small silos totaling 60,000 bu. All the storage serves the mill operation and no grain stays in storage longer than one to a few months. Thus no bins at this location were considered to be “long-term” storage. The mill was planning on not taking in harvest wheat this year (and typically took in very little at past harvests) and they relied on nearby elevators for obtaining wheat throughout the year. The large silo could supply the mill operation for about one month. Most wheat received would go to the big silo, though it seemed that some wheat with special qualities, either good (e.g., size or protein) or bad (presence of vomitoxin) was segregated into the complex of nine 15K bu concrete silos. Wheat from the large silo moved to a preliminary cleaning process and then was stored in the small silos for a period of a few days before it was further cleaned then tempered and milled. Commodities Stored All grain stored and milled by this company is winter wheat, with 95% being soft white and about 5% soft red. The flour that is not sent to their major customers is packaged and sold for pastries, cake flour, etc. Sanitation The manager reported that they did a weekly sanitation inspection as part of a SOP and that the results of an inspection were recorded monthly (CIPM=7). They have a company-wide food safety committee composed of 5 people that inspect the 5 mills in the U.S. on a rotating schedule. He reported doing an annual clean-out of all bins (CIPM=9) and a clean-out of the aeration systems every other year. This cleaning requires 20 man-hours for cleaning in off-year for the big silo, but only 10 man-hours during alternate years when they don’t pull gratings up. Residual sprays were used in empty bins prior to loading (CIPM=9). Bin floors at 4 feet from the sides, and walls 4 feet from the floor were treated with a residual spray of Tempo. Clean-ups are made of trash spills as they occur (CIPM=8). Most areas around bins are paved, but grass and weed control is done
50
in all cases that apply (CIPM=10). Leaks in bins and in transitions for fans and conveyors are repaired following regular inspection (CIPM=9 for each). An in-house rodent control program is in place that uses approximately 100 traps and bait stations (CIPM=9). The company attends to bird and rodent-proofing with screens, hardware cloth and door seals (CIPM=9). The company reported cleaning elevator boots monthly and sprays then with a mold inhibitor (CIPM=7). Dump pits are cleaned as needed and dust control is used. The average IPM score for sanitation was 8.5. Loading and Receiving The company does not have a formal system of using preferred suppliers, but they plan to start doing inspections of bigger suppliers due partly to pressure from their customers to have preferred supplier list (GMP=5). Thus they are working toward a guaranteed suppliers list. Incoming wheat is inspected for various factors (CIPM=9). Approximately 5 min. is needed to take a sample and conduct the inspection. The company is beginning a program of holding a sample for 13 months so that they can trace any problems that show up later. They don’t tell farmers who supply them what to grow or how to grow, but they do know which producers supply consistently high quality or consistently low quality wheat. If 1 live or 2 dead insects are detected, the load is rejected (CIPM=10). No fumigation is done at this mill-elevator facility, so they can not accept any grain with insects. All grain taken for storage must be at 13.8% moisture content or less (CIPM=10). Cleaning with a clipper device is done at load-out to the mill, but the company did not report any special methods to avoid fines in spout-lines of storage bins (GMP=7). The overall loading and receiving scores were CIPM=9.7 and GMP=6.0. Aeration The company reported that all bins have adequate aeration and that fans are used to cool grain appropriately (CIPM=8). At country elevator receiving sites the incoming grain after harvest is cooled down to 65-70 degrees F initially, then fumigated, and then cool down to 50 degrees F for longer term storage (CIPM=9). Thermocouples are checked every two weeks to monitoring the cooling zone movement (CIPM=9). Bins are properly engineered for avoiding condensation, but this is rarely an issue because they use down-flow aeration (CIPM=10). Bin roofs are adequately vented (CIPM-9) and automatic aeration controllers are in use on only some of the bins (GMP=6). Average scores for loading a receiving were CIPM=9.7 and GMP=6.0. Monitoring Grain temperatures in all bins are checked every two weeks throughout the whole year (CIPM=8). Grain samples are taken from the tops of the small bins each month to check for insects (CIPM=7). No other grain sampling or trapping is conducted for insect monitoring. Monitoring for rodents is done on a regular basis by inspection of traps (CIPM=9). Bins are checked monthly for water leaks (GMP=7). Samples of grain are pulled from each bin every quarter and sent to a lab for analysis; presumably this is for grain quality, but specific details of analysis were not obtained. Overall scores for monitoring were CIPM=8.0 and GMP=7.0.

51
Overall IPM Score: The overall IPM scores for this facility were CIPM=8.8 and GMP=6.3. The company seemed very attentive to important preventive IPM measures, but it was clear that grain was not stored here very long before milling, so pest problems rarely had time to manifest themselves. Pesticide Use Practices The company reported no use of residual pesticides on grain (CIPM=10) and they would reject loads of incoming grain with known pesticide residues (CIPM=9). Fumigation is done primarily at country elevators, but at this mill site the small silos are fumigated once per year simply because the grain in them is stored for a longer time than in other silos (CIPM=10). This fumigation is done by an outside contractor who uses a closed-loop fumigation method (CIPM=10). DE is not used in any cases, and no top-dressing of any kind is ever applied to any grain bins (GMP=10). Rail cars of outbound product are fumigated only if this is specified by the customer; flour cars are typically well-sealed for this purpose. When the small bins and the mill are fumigated the entire facility is closed for 36 hrs. Grain fumigation reportedly cost less than 2 cents/bu from an outside contractor. Although mill IPM was not the focus of this study, the manager volunteered that they are considering the use of fogging (aerosol treatments) and targeted use of ECO2FUME (cylinder-based phosphine) as alternative to methyl bromide in the future. The manager indicated that (in the mill) the red flour beetle was the worst insect, with some trouble from Indian meal moth. Safety and Education The company reported having four certified pesticide applicators on site (GMP=10). Air samples during fumigation are monitored with Draeger tubes (CIPM=10). An SCBA and other required personal protective equipment are available on site (CIPM=10). Respiratory equipment fit testing and PPE training are conducted on some regular basis (GMP=6). Written safety and emergency action plans are in use and available (GMP=8 for each). Managers and employees attend some outside education programs for either grain management or pesticide use, but generally cannot obtain continuing education credits and thus must re-take their certification tests every 3 years (GMP=5). The elevator provides some sort of educational programs to their suppliers (GMP=7) and company grain graders receive some training throughout the year (GMP=5). Regular safety meetings for employees are offered (GMP=7).

52
Elevator 8: Wheat This facility is the country elevator located 5 miles north of Elevator 7 that supplies that elevator with most of its wheat needed for milling throughout the year. Elevators 7 and 8 are owned by the same milling company and were visited by the same team of three PIs. Facility Description Total storage capacity is about 1 million bushels, with 250,000 bu in a concrete elevator and the remainder in 5 steel bins at capacities of 150,000 bu each. The facility goes through about 2.5 complete volumes of grain a year. A 15-car train loading facility is on site. Commodities Stored Of the 2.5 million bushels stored, 1 million bu are corn, 850,000 bu are wheat and the remainder are soybeans and navy beans. The facility houses a small navy bean processing plant with a throughput of 3,500 bu/hr. All the stored wheat stays with the company (i.e., moved to the nearby Elevator 7), while the corn and soybeans are sold outside to an ethanol plant in Canada, a feed mill in Canada and for livestock feed in the U.S. Processed navy beans go primarily for export to the U.K. Sanitation For this section and others the manager of this facility chose to evaluate all practices as Good Management Practices and did not feel that any practice could be considered a critical point. A monthly sanitation inspection if conducted of the facility (GMP=8). All empty bins are cleaned out prior to loading new grain (GMP=9). Empty steel bins are given a spray with Tempo for residual insect control, and some concrete silos are treated (GMP=9). Spilled grain is cleaned up and grass and weeds are controlled around bins (GMP=9 for each). Holes in bins are sealed to prevent water and insect entry (GMP=9). A monthly rodent control program is in place that uses traps and bait stations (GMP=7), and the facility is protected from entry by birds and rodents (GMP=8). The company also reported that they clean the elevator boots and dump bits, and wash these out with a Chlorox solution. Average score for sanitation was GMP=8.5. Loading and Receiving Most grain is received from preferred supplies (GMP=9). Wheat is received at harvest during the first week of July and most of it is moved out by October. Al incoming grain is sampled and evaluated for grade factors at a rate of 2 minutes pre load (GMP=10). Any load containing one or more live insects or two or more dead insects will be rejected or treated before storage (GMP=10). Grain is stored only at safe moisture levels (GMP=9). Wheat is segregated by moisture and will be dried dry if it is greater than 14.2%. Supplier will be charged for shrink plus a drying charge if over a particular level (not specified in the interview). About 10% of all loads received need some drying.

53
Testing for vomitoxin is conducted in some cases. All bins are cored as part of a standard practice after loading to reduce the fines in the spout line (GMP=9). Average score for loading receiving was GMP=9.5. Aeration All bins are aerated to cool grain using down-flow aeration (GMP=10). Grain is cooled to temperatures between 60 and 45 F (GMP=10) and the cooling zones are checked with thermocouples (GMP=10). Cooling cycles take approximately 120 hours using 3 HP motors. The company reported that bins are engineered to minimize condensation (GMP=6), roof venting is adequate (GMP=7) and the automatic aeration controllers are used (GMP=7) to some extent. However, a separate statement was made that no aeration controllers are available. Average score for aeration was GMP=8.3. Monitoring Grain temperature in all bins are checked weekly throughout the entire year (GMP=10). The surface of grain bins are checked monthly for insects and leaks (GMP=10). No bin cores, trap or other forms of monitoring are used for insect detection. Grain is routinely sampled upon load-out to check quality. Average score for monitoring was GMP=8.2. Overall IPM Score: The average IPM score for this facility was GMP=8.6. This elevator is typical of many northern grain elevators that keep their facility clean in that they can prevent insect problems by routine sanitation and effective cooling of grain after storage. Pesticide Use and Practices No residual insecticides are ever applied to grain (GMP=10) and no grain is received with residues (GMP=10), though the company reported that they did not test for residues. Fumigation is not conducted on a routine basis, but any carryover wheat is fumigated by a contractor using re-circulation when needed (GMP=10). No DE or top-dresses of any kind are used (GMP=10. Aside from empty bin sprays with Tempo, insecticide use is minimal to non-existent at this facility. Safety and Education One employee, the manager, is certified in fumigation (GMP=10). No air samples are taken due to the virtual non-use of fumigants. The company reported that all necessary PPE is available on site (GMP=10) and that fit-testing of respiratory equipment is done regularly (GMP=8). Written safety and emergency action plans are in use and available (GMP=10). The company reported that employees attend outside training programs (GMP=5) and that company grain graders receive specialized training (GMP=10). Safety meetings are provided for employees approximately 14-18 times a year (GMP=10). The elevator does not provide much training to suppliers regarding grain IPM (GMP=3).

54
Costs and Benefits of IPM in Grain Elevators
Businesses that handle stored grain products have economic incentives to control
insects. Traditional control measures, such as pesticides, have been cost-effective. However, insect adaptation and resistance have reduced effectiveness of some pesticides, and regulatory constraints have eliminated entire classes of pesticides. Also, consumers are increasingly sensitive to the possibility of pesticide residues in food products. Alternative Integrated Pest Management (IPM) measures that reduce use of pesticides are being developed, but businesses often are reluctant to invest in the facilities and training necessary to use new technology without better information on whether the expected payoff will cover the costs of the investment.
A key factor in the adoption of IPM or any change in management systems is the costs and benefits associated with the change. Cost-benefit analysis refers to the formal process of comparing the costs and benefits of a proposed change. Simply put, a cost reduces a decision-maker’s objective and a benefit contributes to the objective. In the case of agribusiness managers, a major objective is to maximize net income. For this reason, most cost-benefit analyses concentrate on how a proposed management change will impact revenues and costs. Decision makers also have other objectives, such as minimizing risks. These objectives can also be considered within the context of cost-benefit analysis, although they often are more difficult to quantify.
Studies on the economic evaluation of IPM strategies and practices have been reviewed by Norton and Mullen (1994). In general, implementing stored grain IPM programs typically involves increased costs for sanitation, monitoring and, in some cases, facility modifications to improve sanitation and grain temperature monitoring and to facilitate effective fumigations when needed. Benefits include: potentially lower pest damage costs, particularly where insects have developed resistance to traditional pesticides or where some pesticides have been eliminated by regulatory authorities; reduced costs for grain turning and pesticides; reduced risk of pesticide residues; reduced risk of worker injury; and reduced environmental damage. IPM systems may also open up market opportunities and/or maintain access to existing market outlets which are increasingly concerned about grain quality, insect presence and pesticide residues. In addition, IPM strategies are more management intensive and require more information. They may also require more labor for monitoring and sanitation. Also, some decision makers may believe that use of IPM strategies may have greater risk of failing to control insects, compared to conventional strategies such as routine fumigation.
Reduced Insect Damage and “Infested” Grain
One of the major objectives of a manger is to reduce insect damage costs and loads rejected for infestation. Insects reduce grain value by lowering grade and triggering discounts or rejected loads. U.S. Grade standards for wheat include the percentage of damaged kernels that include insect damaged kernels (IDK) as well as other types of storage and field damage. Wheat with more than 32 IDK per 100-gram sample does not meet the standards for any of the numerical grades and is designated “U.S. Sample

55
Grade”. Sample grade wheat must be used for non-food uses at substantially lower value. Domestic and international buyers typically include much more stringent standards for IDK on grain contracts.
Wheat containing two or more insects injurious to stored grain per sample
receives the special designation of “infested”. In addition to examining for insects the grain samples that are obtained for grain grading purposes, many buyers are initiating separate samples for insects. One common practice is to “crack” the hopper slide gates of grain carriers over top of a tarp. Many food processors reject loads if a single live insect is detected in the grain from the hopper bottom. Terminal elevators and export elevators are rapidly moving toward a zero tolerance. In the past, country elevators often accepted infested grain with a market discount; often the discount was essentially a charge for fumigating the grain. Historically, market penalties for delivering “infested” wheat to Kansas elevators ranged from $0.00 to $0.60 per bushel (Reed et al., 1989). Anecdotal evidence suggests that penalties may have increased in recent years.
The cost of a rejected load can be a substantial percentage (10-20%) of the value
of a lot of grain. A single insect-infested sample can cause rejection of an entire truckload, trainload or barge of grain. If rejected, the grain must be either transported to another market outlet with less stringent standards or to a location where it can be legally fumigated. The economic impact depends on the relative price at other market outlets and the transportation and fumigation costs involved. The cost of rejected loads are the single most important pest risk factor for most elevator grain managers. A well-designed IPM program can reduce the occurrence of rejected loads without the high cost of routine “preventive” fumigations.
Reduced Pesticide Costs Fumigation costs can often be reduced or, in some cases, even eliminated by using nonchemical pest management methods. The total cost of fumigation includes the cost of the actual fumigant, materials used to seal the bins, safety placards, air monitoring tubes and other materials. The labor costs for sealing, applying fumigant, air monitoring, unsealing and deplacarding are also major costs of fumigation. Overhead costs such as the ownership costs of respiratory protection and other personal protection equipment should also be considered as a cost of fumigation. Fumigation costs can be 8–13% of an elevator’s total grain handling and storage income. Other Benefits Other benefits are more subjective and difficult to quantify for an individual manager. Increased adoption of IPM practices likely will lead to less resistance by insects to remaining pesticides, increased worker safety, and lower risk of insect damage and infestation in the long run. Also, there is a lower likelihood of detectable pesticide residues. Substantial proportions of grain exported from the U.S. contain detectable levels of insecticides such as Malathion and Reldan (e.g. over 50-70% of wheat samples with these, USDA AMS 1998), thus foreign buyers may pay premiums for residue-free grain.
56
IPM Implementation Costs Implementing stored grain IPM often requires facility modifications to improve sanitation, grain temperature monitoring and control, and to improve the effectiveness of fumigation. The adoption of an IPM-based management system also involves increased costs for sanitation, labor and/or electricity to level bins after filling, labor and material costs for more intensive insect monitoring and the energy costs of grain aeration. In most cases elevators have adopted IPM without hiring additional personnel, but rather have redirected existing personnel. Recurring costs that tend to decrease as the degree of IPM adoption increases include the costs of fumigation and grain turning. Facility Modification In some cases, adopting IPM will require facility modification to improve sanitation, measurement and control of grain temperature and the effectiveness of fumigation. Modifications that enhance sanitation would include the replacement of open belts with enclosed conveyors for dust control, addition of dust control systems for some enclosed areas of the facility and modification of aeration floors to allow removal and cleaning.
Modifications related to temperature control include the installation of
thermocouple and remote read-outs, installation and upgrading of aeration systems, use of automatic aeration controllers, and when appropriate, the use of grain chillers. Modifications to improve fumigation include bin sealing, modifications to roof vents, aeration ducts, and grain distributors to facilitate easy sealing or removal and the installation of re-circulation fumigation systems. The adoption of re-circulation fumigation systems can be particularly important for concrete storage facilities. Although they typically are fumigated using pellet dispensers while turning grain, the re-circulation system allows the manager to separate the timing of the fumigation from the timing of grain turning. Economic Analysis of IPM Strategies for Insects in Stored Products
This section describes calculation of costs of alternative strategies for control of insects in the grain storage section of food processing facilities. In particular, costs of IPM strategies are compared with those of conventional pest control strategies, including routine fumigation. Components of the strategies considered include sampling, monitoring, aeration, fumigation, sanitation, and use of protectants (e.g., Malathion, Reldan). Specific costs considered include electricity (for aeration and turning), labor (for sampling, monitoring, fumigation, and sanitation), material costs for fumigant and/or protectant, equipment (for sampling, fumigation monitoring, and fumigation), and management costs.
The approach used here is a versatile one that can be adapted to a variety of firm situations by changing model parameters. Data used are those assumed to represent conditions applicable to a typical firm. Two implications of this are: first, since the analysis calculates costs for firm-level practices, societal costs of pesticide residues or societal benefits of reducing pesticide applications are not considered here, except to the

57
extent that they affect the firm. For example, costs of EPA monitoring requirements for phosphine fumigations are included in the cost of fumigation. Or, if a regulatory agency imposed a tax on fumigants for societal goals (reducing insect resistance, for example), the effect on the firm would be reflected in this approach by raising the cost of the fumigant in the calculations. Second, because benefits of reducing pesticide use vary greatly by firms, benefit calculations are not included here. Each firm should estimate the benefits it would receive from a particular strategy that reduces pesticide use, and subtract the costs for that strategy calculated here to get an estimated net benefit.
A later section applies this general methodology of calculating costs to two specific firms, using empirical data gathered from the firms themselves and considering only strategies actually employed by the firms. These firms did not provide data on benefits to their firms of reducing chemical use, but had made the business decision to pursue chemical-reducing strategies. For the general approach, the particular strategies considered are: (1) Routine fumigation (fumigation at a fixed period of time after receipt of grain),
assuming that grain must be turned for effective fumigation (2) Routine fumigation as in (1), but with a closed-loop system (3) Controlled aeration of grain (aeration only when outside temperatures are cooler than
grain), plus sanitation. (assumes that # of fan hours can be reduced by half to achieve same level of cooling – benefits of lower shrinkage than with manual aeration are not included in calculations because it is assumed that the grain is processed in house rather than sold)
(4) Controlled aeration, plus sanitation, plus 1 sampling in which 10 samples are drawn from various depths of each bin in which grain is stored using a PowerVac.
(5) Strategy (4), assuming that the insect sampling indicates that ½ of the bins need to be fumigated
(6) Routine manual aeration in evening hours plus grain protectant (Reldan, at a cost of $0.022/bu. as per Kenkel et al.)
(7) Strategy (6), except that fan hours are reduced through temperature controllers (controlled aeration)
(8) Controlled aeration plus sanitation, plus two insect samplings several months apart (9) Controlled aeration plus sanitation, plus one insect sampling, assuming that insect
sampling indicates that ½ of the bins need to be fumigated (using closed-loop) (10) Controlled aeration plus sanitation, closed-loop fumigation of all bins, plus
application of a protectant. (11) Mechanical cleaning for better aeration and insect control (in place of protectants),
plus aeration, plus sanitation
For those strategies involving fumigation, cost of sealing bins is included in labor costs of fumigation. The cost of empty bin treatment is very low relative to other costs (e.g. $0.000009/bu. for Malathion and $0.000076/bu. for Reldan), so it is not included here.

58
Cost-Benefit Analysis Figure 1 shows the annual cost of several IPM and conventional strategies in a storage system with total capacity of 250,000 bushels. Costs considered include equipment, chemicals, sanitation, turning, aeration, and labor. Pest control strategies considered are the eleven strategies listed above. The lower portion of each bar (strategy) measures labor cost. Since a significant portion of IPM costs are related to sampling, the sampling-based IPM strategies have the highest labor costs. However, if sampling is done upon receipt of grain, and grain is stored for less than one year (as was the case in all subject elevators studied) much of this cost can be avoided. The second component is aeration costs, composed primarily of electricity costs. Aerating upon receipt of grain is less effective than aerating after outside temperatures drop, so electricity cost is higher for the same amount of cooling. Savings can be achieved if aeration fans are shut off when outside temperatures are higher than the grain temperature, and turned on only when outside temperatures are lower than grain temperature. This can be done manually, but perhaps more economically and effectively using temperature controllers. The third component is turning cost, composed of electricity, labor, and shrink. Grain is emptied from one silo and transported on a moving belt to another silo within the facility. Fumigation can be done while turning by inserting phosphine pellets or tablets into the moving grain flow. Turning is often done in concrete silos in order to fumigate when closed loop fumigation is not used. Turning may also be done as part of other management practices such as blending for particular quality characteristics, to break up sections of “fines” or “hot spots” to prevent grain infestation or spoilage. The fourth component is sanitation, composed primarily of labor costs. This practice includes cleaning out empty bins, elevator legs and boots, and areas surrounding bins.
The fifth component is cost of chemicals. For both an IPM sampling strategy in which not all of the bins are fumigated, and a closed loop fumigation which requires less fumigant for the same level of effectiveness, fumigant costs are lower than with routine fumigation. Closed loop fumigation would typically require 1/3 less fumigant to achieve the same level of effectiveness, and would not require turning of the grain. Also included in chemical costs is the cost of protectant used. Here, Reldan is assumed to be the protectant used, at a cost of $.022/bu. The sixth component is equipment. It is assumed for IPM strategies that sampling equipment is required (a Power-Vac sampler is specified here), and for fumigation strategies that fumigation equipment is needed. For closed loop fumigation, amortized installation costs of the closed loop system are included in this cost. For IPM strategies that do not require additional sampling while grain is in storage, this cost could be reduced. However, both fumigation and sampling equipment costs are included where Power-Vac sampling has determined that fumigation is needed. Also, note that once the choice is made to acquire fumigation or sampling equipment, this cost should not be considered when choosing among strategies.
59
It is assumed here that all strategies considered are equally effective. However,
firm managers should recognize that some strategies may be more effective than others in their particular situations. (Little published research is available that compares effectiveness of IPM and chemical-based strategies under a range of environmental conditions. Work in progress by this report’s authors together with colleagues from other institutions is evaluating effectiveness and economic risk of these and other insect management practices.) Also, firm managers should consider and evaluate any subjective costs. For example, fumigation may be associated with worker safety concerns, while use of protectants may have associated concerns about residues on food products. Other benefits of IPM strategies not quantified here include worker health safety, improved environmental conditions, and a decline of insect resistance due to excessive use of fumigants.
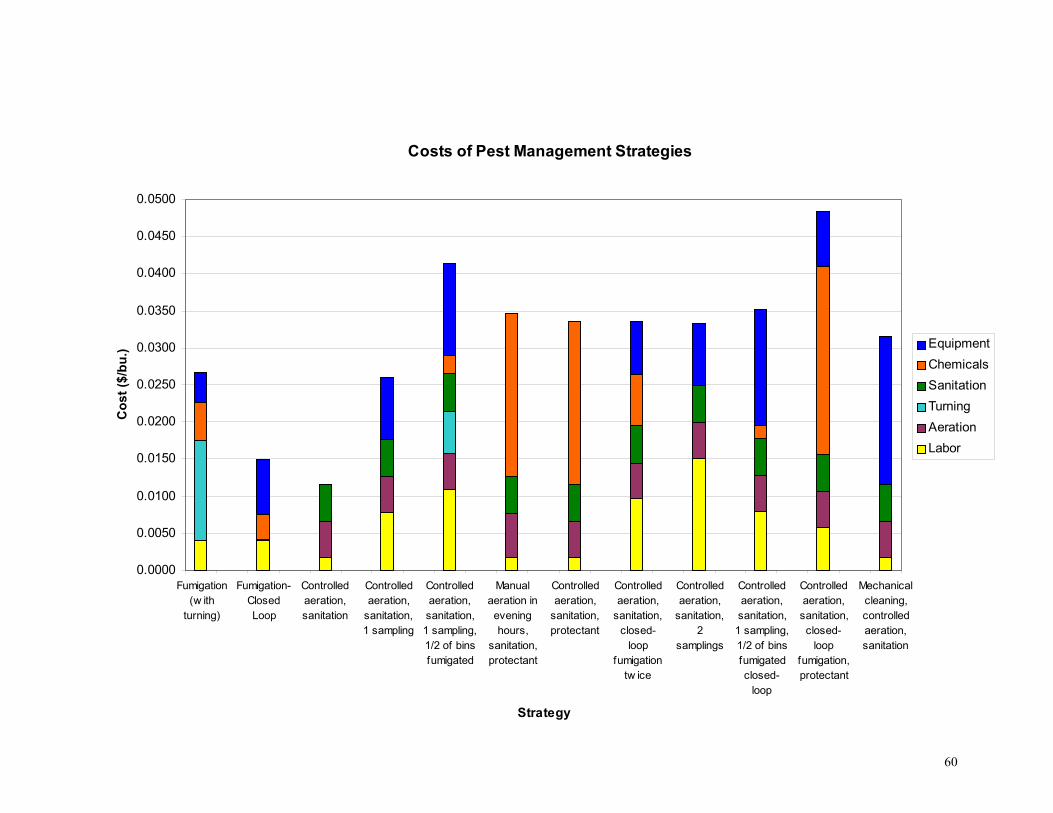
60
Costs of Pest Management Strategies
0.0000
0.0050
0.0100
0.0150
0.0200
0.0250
0.0300
0.0350
0.0400
0.0450
0.0500
Fumigation(w ith
turning)
Fumigation-ClosedLoop
Controlledaeration,sanitation
Controlledaeration,
sanitation,1 sampling
Controlledaeration,sanitation,1 sampling,1/2 of binsfumigated
Manualaeration ineveninghours,
sanitation,protectant
Controlledaeration,
sanitation,protectant
Controlledaeration,
sanitation,closed-
loopfumigation
tw ice
Controlledaeration,
sanitation,2
samplings
Controlledaeration,sanitation,1 sampling,1/2 of binsfumigatedclosed-
loop
Controlledaeration,sanitation,closed-
loopfumigation,protectant
Mechanicalcleaning,controlledaeration,sanitation
Strategy
Cos
t ($/
bu.) Equipment
ChemicalsSanitationTurningAerationLabor
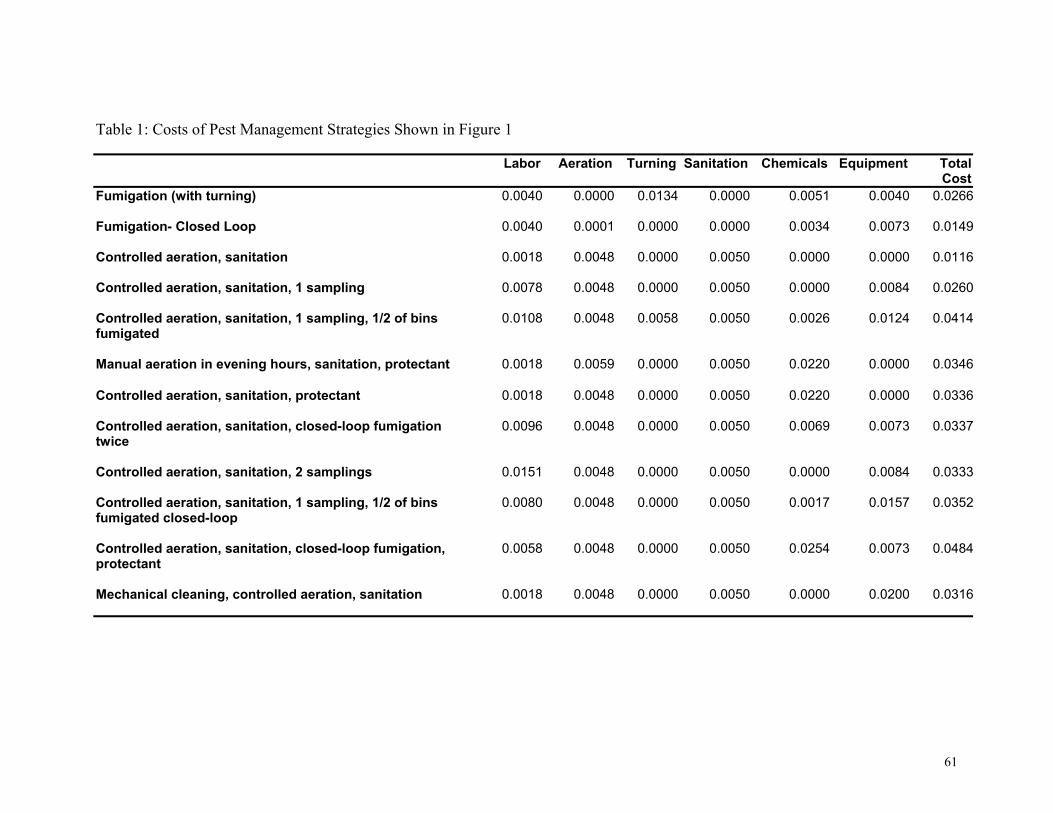
61
Table 1: Costs of Pest Management Strategies Shown in Figure 1
Labor Aeration Turning Sanitation Chemicals Equipment Total Cost
Fumigation (with turning) 0.0040 0.0000 0.0134 0.0000 0.0051 0.0040 0.0266
Fumigation- Closed Loop 0.0040 0.0001 0.0000 0.0000 0.0034 0.0073 0.0149
Controlled aeration, sanitation 0.0018 0.0048 0.0000 0.0050 0.0000 0.0000 0.0116
Controlled aeration, sanitation, 1 sampling 0.0078 0.0048 0.0000 0.0050 0.0000 0.0084 0.0260
Controlled aeration, sanitation, 1 sampling, 1/2 of bins fumigated
0.0108 0.0048 0.0058 0.0050 0.0026 0.0124 0.0414
Manual aeration in evening hours, sanitation, protectant 0.0018 0.0059 0.0000 0.0050 0.0220 0.0000 0.0346
Controlled aeration, sanitation, protectant 0.0018 0.0048 0.0000 0.0050 0.0220 0.0000 0.0336
Controlled aeration, sanitation, closed-loop fumigation twice
0.0096 0.0048 0.0000 0.0050 0.0069 0.0073 0.0337
Controlled aeration, sanitation, 2 samplings 0.0151 0.0048 0.0000 0.0050 0.0000 0.0084 0.0333
Controlled aeration, sanitation, 1 sampling, 1/2 of bins fumigated closed-loop
0.0080 0.0048 0.0000 0.0050 0.0017 0.0157 0.0352
Controlled aeration, sanitation, closed-loop fumigation, protectant
0.0058 0.0048 0.0000 0.0050 0.0254 0.0073 0.0484
Mechanical cleaning, controlled aeration, sanitation 0.0018 0.0048 0.0000 0.0050 0.0000 0.0200 0.0316
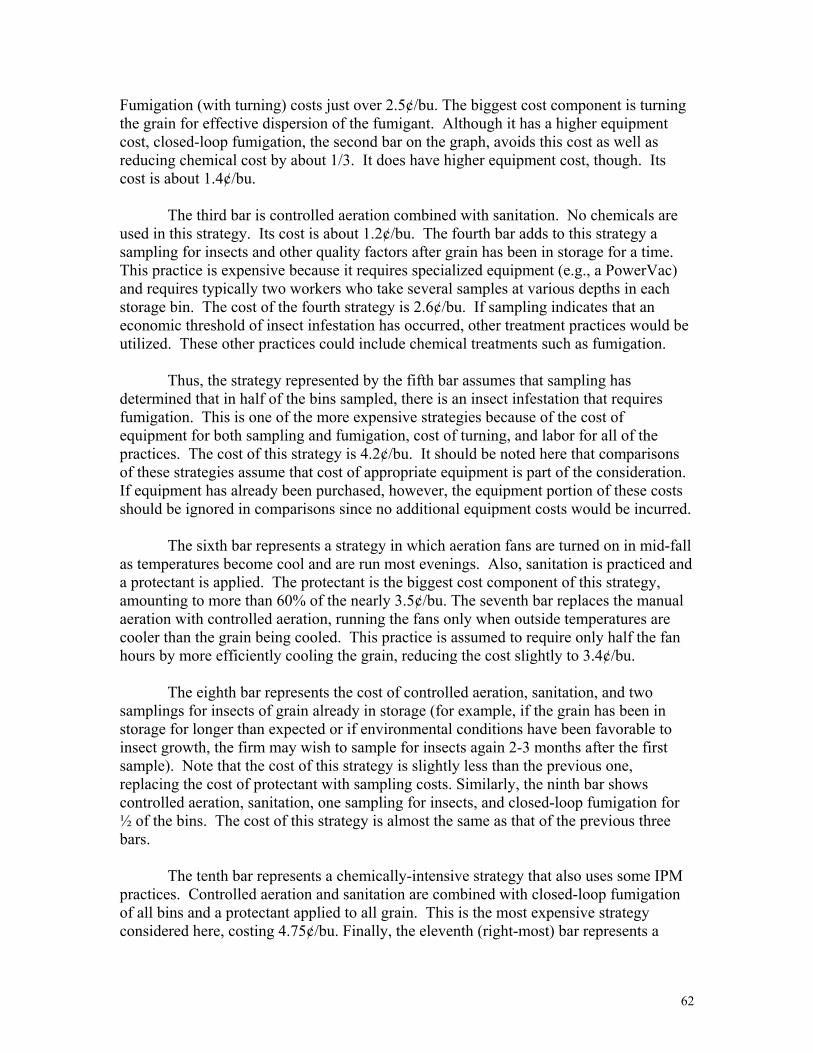
62
Fumigation (with turning) costs just over 2.5¢/bu. The biggest cost component is turning the grain for effective dispersion of the fumigant. Although it has a higher equipment cost, closed-loop fumigation, the second bar on the graph, avoids this cost as well as reducing chemical cost by about 1/3. It does have higher equipment cost, though. Its cost is about 1.4¢/bu. The third bar is controlled aeration combined with sanitation. No chemicals are used in this strategy. Its cost is about 1.2¢/bu. The fourth bar adds to this strategy a sampling for insects and other quality factors after grain has been in storage for a time. This practice is expensive because it requires specialized equipment (e.g., a PowerVac) and requires typically two workers who take several samples at various depths in each storage bin. The cost of the fourth strategy is 2.6¢/bu. If sampling indicates that an economic threshold of insect infestation has occurred, other treatment practices would be utilized. These other practices could include chemical treatments such as fumigation. Thus, the strategy represented by the fifth bar assumes that sampling has determined that in half of the bins sampled, there is an insect infestation that requires fumigation. This is one of the more expensive strategies because of the cost of equipment for both sampling and fumigation, cost of turning, and labor for all of the practices. The cost of this strategy is 4.2¢/bu. It should be noted here that comparisons of these strategies assume that cost of appropriate equipment is part of the consideration. If equipment has already been purchased, however, the equipment portion of these costs should be ignored in comparisons since no additional equipment costs would be incurred. The sixth bar represents a strategy in which aeration fans are turned on in mid-fall as temperatures become cool and are run most evenings. Also, sanitation is practiced and a protectant is applied. The protectant is the biggest cost component of this strategy, amounting to more than 60% of the nearly 3.5¢/bu. The seventh bar replaces the manual aeration with controlled aeration, running the fans only when outside temperatures are cooler than the grain being cooled. This practice is assumed to require only half the fan hours by more efficiently cooling the grain, reducing the cost slightly to 3.4¢/bu. The eighth bar represents the cost of controlled aeration, sanitation, and two samplings for insects of grain already in storage (for example, if the grain has been in storage for longer than expected or if environmental conditions have been favorable to insect growth, the firm may wish to sample for insects again 2-3 months after the first sample). Note that the cost of this strategy is slightly less than the previous one, replacing the cost of protectant with sampling costs. Similarly, the ninth bar shows controlled aeration, sanitation, one sampling for insects, and closed-loop fumigation for ½ of the bins. The cost of this strategy is almost the same as that of the previous three bars. The tenth bar represents a chemically-intensive strategy that also uses some IPM practices. Controlled aeration and sanitation are combined with closed-loop fumigation of all bins and a protectant applied to all grain. This is the most expensive strategy considered here, costing 4.75¢/bu. Finally, the eleventh (right-most) bar represents a

63
strategy in which the firm mechanically cleans grain before storing it, removing fines and most foreign material in which insects thrive in an attempt to avoid use of chemicals, and conducts controlled aeration and sanitation practices. This strategy costs 3.2¢/bu. Observations It is clear that a wide range of stored product management strategies is available. Even the large number considered here does not represent all that are available. However, several patterns emerge. First, comparing the first bar with the second bar, it is clear that for firms that fumigate, closed-loop fumigation is more economical than non-closed-loop fumigation, even after accounting for installation costs. Because less fumigant is needed (about 1/3 less), chemical costs are lower, and any environmental effects will be reduced. The biggest cost savings with closed-loop fumigation compared with conventional fumigation is that closed-loop fumigation does not require turning of grain, saving energy and labor costs. Moreover, because workers do not need to be in the facility while fumigant is applied, worker safety is greatly enhanced. Also, closed-loop fumigation is likely more effective in controlling insects because of the sustained concentration of gas in the facility. Second, strategies using grain protectant (bars 6, 7, and 10) are among the more expensive strategies, since protectant itself (assuming Reldan is used) costs about 2.2¢/bu (Kenkel et al.). Costs of IPM strategies compare quite favorably with those of strategies using a protectant, even in a situation where insect infestation reaches the point where partial fumigation is needed to supplement the IPM practices. For example, the seventh strategy – Controlled aeration, sanitation, protectant – costs about the same as the ninth strategy – Controlled aeration, sanitation, 1 sampling, ½ of bins fumigated using closed-loop. Using a grain protectant also has potential to leave chemical residue, though this cost is not considered here.
Third, effective, accurate sampling is labor-intensive, making it the most costly of IPM practices considered. However, if grain is not to be stored long and if other IPM practices such as sanitation and aeration for cooling are followed, sampling may not be required as part of an effective IPM strategy. If in-storage sampling is not required, sampling equipment and labor for sampling is not required, so costs of IPM strategies are likely to be lower than those of conventional strategies. For many IPM strategies, however, it is important that effective monitoring be implemented as a part of the grain management program. As noted earlier, a major cost of managing stored grain is the potential rejection of a load because of insect infestation. Effective monitoring can detect problems before they become severe. This monitoring does not necessarily require the extensive sampling included in the cost calculations here. Labor costs may range from 50% to 100% of those calculated here, and sampling equipment cost would be much lower. Of the eight elevators evaluated from site visits, none utilized extensive sampling of grain in bins, yet had very successful IPM programs through rigorous prevention and sanitation practices.
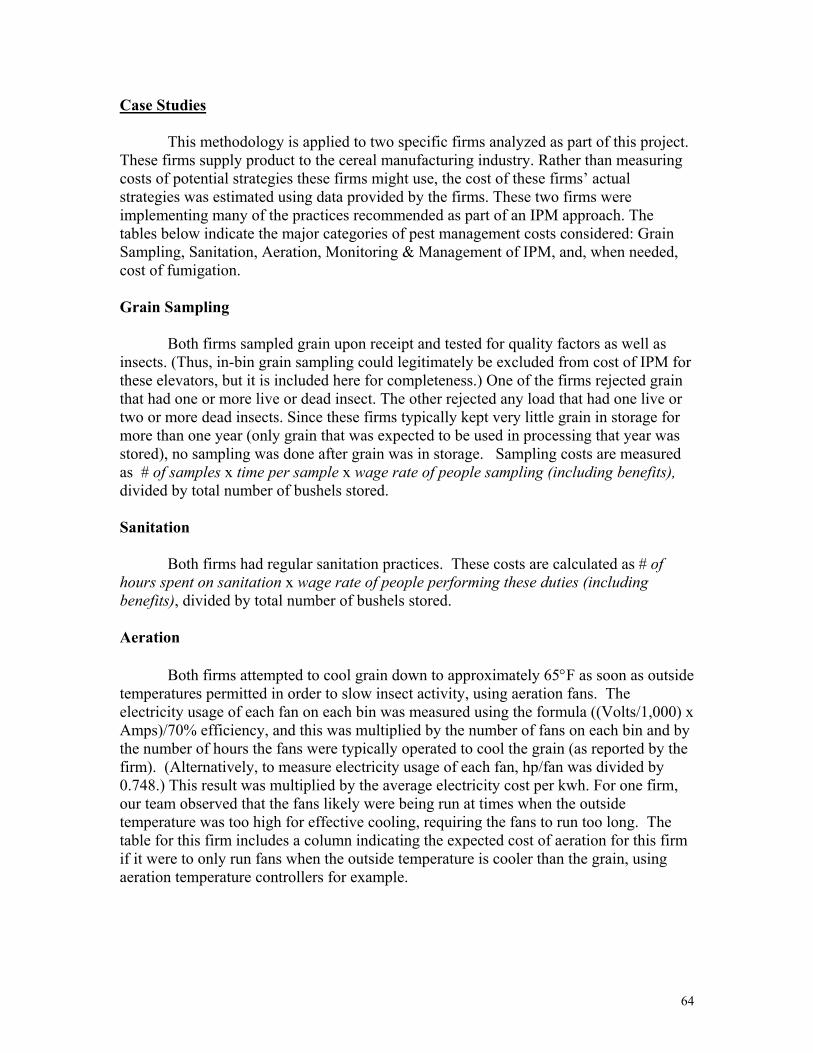
64
Case Studies
This methodology is applied to two specific firms analyzed as part of this project. These firms supply product to the cereal manufacturing industry. Rather than measuring costs of potential strategies these firms might use, the cost of these firms’ actual strategies was estimated using data provided by the firms. These two firms were implementing many of the practices recommended as part of an IPM approach. The tables below indicate the major categories of pest management costs considered: Grain Sampling, Sanitation, Aeration, Monitoring & Management of IPM, and, when needed, cost of fumigation. Grain Sampling Both firms sampled grain upon receipt and tested for quality factors as well as insects. (Thus, in-bin grain sampling could legitimately be excluded from cost of IPM for these elevators, but it is included here for completeness.) One of the firms rejected grain that had one or more live or dead insect. The other rejected any load that had one live or two or more dead insects. Since these firms typically kept very little grain in storage for more than one year (only grain that was expected to be used in processing that year was stored), no sampling was done after grain was in storage. Sampling costs are measured as # of samples x time per sample x wage rate of people sampling (including benefits), divided by total number of bushels stored. Sanitation Both firms had regular sanitation practices. These costs are calculated as # of hours spent on sanitation x wage rate of people performing these duties (including benefits), divided by total number of bushels stored. Aeration Both firms attempted to cool grain down to approximately 65°F as soon as outside temperatures permitted in order to slow insect activity, using aeration fans. The electricity usage of each fan on each bin was measured using the formula ((Volts/1,000) x Amps)/70% efficiency, and this was multiplied by the number of fans on each bin and by the number of hours the fans were typically operated to cool the grain (as reported by the firm). (Alternatively, to measure electricity usage of each fan, hp/fan was divided by 0.748.) This result was multiplied by the average electricity cost per kwh. For one firm, our team observed that the fans likely were being run at times when the outside temperature was too high for effective cooling, requiring the fans to run too long. The table for this firm includes a column indicating the expected cost of aeration for this firm if it were to only run fans when the outside temperature is cooler than the grain, using aeration temperature controllers for example.
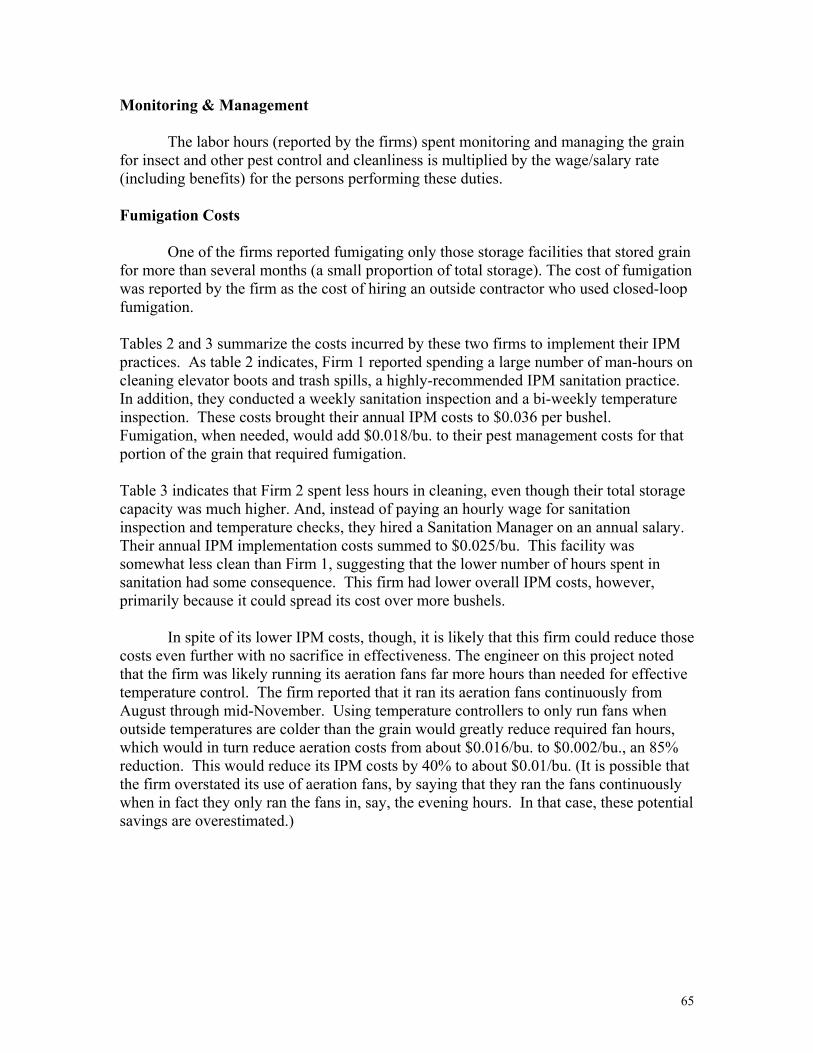
65
Monitoring & Management The labor hours (reported by the firms) spent monitoring and managing the grain for insect and other pest control and cleanliness is multiplied by the wage/salary rate (including benefits) for the persons performing these duties. Fumigation Costs One of the firms reported fumigating only those storage facilities that stored grain for more than several months (a small proportion of total storage). The cost of fumigation was reported by the firm as the cost of hiring an outside contractor who used closed-loop fumigation. Tables 2 and 3 summarize the costs incurred by these two firms to implement their IPM practices. As table 2 indicates, Firm 1 reported spending a large number of man-hours on cleaning elevator boots and trash spills, a highly-recommended IPM sanitation practice. In addition, they conducted a weekly sanitation inspection and a bi-weekly temperature inspection. These costs brought their annual IPM costs to $0.036 per bushel. Fumigation, when needed, would add $0.018/bu. to their pest management costs for that portion of the grain that required fumigation. Table 3 indicates that Firm 2 spent less hours in cleaning, even though their total storage capacity was much higher. And, instead of paying an hourly wage for sanitation inspection and temperature checks, they hired a Sanitation Manager on an annual salary. Their annual IPM implementation costs summed to $0.025/bu. This facility was somewhat less clean than Firm 1, suggesting that the lower number of hours spent in sanitation had some consequence. This firm had lower overall IPM costs, however, primarily because it could spread its cost over more bushels.
In spite of its lower IPM costs, though, it is likely that this firm could reduce those costs even further with no sacrifice in effectiveness. The engineer on this project noted that the firm was likely running its aeration fans far more hours than needed for effective temperature control. The firm reported that it ran its aeration fans continuously from August through mid-November. Using temperature controllers to only run fans when outside temperatures are colder than the grain would greatly reduce required fan hours, which would in turn reduce aeration costs from about $0.016/bu. to $0.002/bu., an 85% reduction. This would reduce its IPM costs by 40% to about $0.01/bu. (It is possible that the firm overstated its use of aeration fans, by saying that they ran the fans continuously when in fact they only ran the fans in, say, the evening hours. In that case, these potential savings are overestimated.)
66
Table 2: Costs of IPM Practices Currently Used by Firm #1 Cost Category Man-hours Bin Size
(bu) Cooling hours
# fans
Volts/ fan
Amps/fan
hp/ fan
Annual Cost ($/bu)
Sanitation Cleaning Bins 20 160,000 $0.0028 Cleaning elevator boots, trash spills 160 $0.0078 Aeration electricity 260,000 200 1 100 $0.0123
15,000 150
Grain Sampling 5 minutes per load x 2 samples per load 0.167 $0.0041
Monitoring & Management of IPM weekly sanitation inspection 104 $0.0051 check temperature every 2 weeks 78 $0.0038
IPM Cost/bu $0.0359
Fumigation (when needed) 0.018
Parameters Electricity Cost ($/kwh) $0.12 Labor Cost ($/hr) $22.00 Total Capacity (bu) 450,000
truckload (bu.) 900

67
Table 3: Costs of IPM Practices Currently Used by Firm 2 Cost Category Man-hours Bin Size
(bu) Cooling hours
# fans
Volts/fan
Amps/ fan
hp/ fan
Annual Cost ($/bu)
Potential Cost ($/bu)
Sanitation Cleaning Bins 40 250,000 $0.00352 60 500,000 $0.00264 Cleaning elevator boots, trash spills 0 $0.00000
Aeration could be Electricity 150,000 1,800 2 460 12.8 10 $0.01615 $0.0022
500,000 1,800 4 460 21.6 20 $0.01635 $0.0027
Grain Sampling 3 minutes per load x 2 samples per load 0.1000 $0.00244 Monitoring & Management of IPM Sanitation Manager $0.00218
($47K/yr + benefits)
IPM Cost ($/bu) $0.02450
Parameters Electricity Cost ($/kwh) $0.08 Labor Cost ($/hr) $22.00 (for sanitation) Total Capacity (bu) 28,000,000 truckload (bu) 900
68
Conclusions
• All facilities studied were considered very good to excellent in current pest management practices. Therefore, they provided excellent case studies for general U.S. elevator adoption and use of IPM.
• Prevention–based IPM was practiced almost exclusively, with very little
monitoring for pests. However, most elevators maintained an excellent surveillance program for insect and moisture problems, using temperature monitoring and aeration as major IPM tools.
• Essentially all facilities rejected incoming grain that contained either live or dead
stored grain insects. Most received grain from providers of known reliable quality, or in some cases from contracted providers.
• Very little chemical insecticide use was recorded throughout the study, typically
only as a surface treatment to empty bins. No direct admixture of grain protectants was reported. Fumigants were used more in southern locations (Illinois and Missouri) compared to very little fumigant use in the north (Michigan, Minnesota and Idaho).
• Cooling grain with aeration was key to successful grain storage at all facilities,
and was easier to effectively practice at more northern locations. Effective aeration of extremely large bins proved problematic due to inadequate grain spreading (avoiding the “spout-line” of fines) and aeration capacity, and should be addressed with given engineering recommendations from the case studies of two sites.
• The cost of using IPM can be relatively low or high depending on the given
situation. For example, sanitation plus aeration was the cheapest scenario, but this may not be effective given a poorly engineered facility in a southern location. In the south, more attention to insect monitoring and timely fumigation followed by controlled aeration will be needed.
• The tangible benefits of IPM are clearly the avoidance of costs that might occur
with insect infestation and the resulting loss of grain quality. Since such benefits may be on an economic par with chemical-based pest controls, the more intangible and perhaps greater benefits of IPM accrue from low chemical input in some market advantage, improved consumer perception, or potential societal benefits, which are beyond the scope if this study.
• Successful elevators that directly supply the breakfast food industry clearly are
maintaining a very high level of sanitation and pest management to deliver high quality product and maintain market presence.
69
References Danley, Ronda. Choosing Among Phosphine Monitoring Devices: An Economic and
Qualitative Analysis, M.S. Thesis in progress, Oklahoma State University. Kenkel, P., J. T. Criswell, G. Cuperus, R. T. Noyes, K. Anderson, W.S> Fargo, K.
Shelton, W. P. Morrison and B. Adam. 1994. Current Managemetn Practices and Impact on Pesticide Loss in the Hard Red Winter Wheat Post-harvest System. Oklhoma Cooperative Extension Service Publ. E-930. Stilwlater, OK.
Krischik, V., G. Cuperus and D. Galliart. 1995. Stored Product Management.
Oklahoma Cooperative Extension Service Publ. E-912. Stillwater, OK. Norton, G. W. and J. Mullen. 1994. Economic evaluation of integrated pest management
programs. Virginia Cooperative Extension Publication 448-120, Virginia Tech, Blacksburg, VA.
Phillips, T. W., R. C. Berberet and G. W. Cuperus. 2000. Post-Harvest Integrated Pest
Management. pp. 2690-2701 In: Francis, F. J., ed. “Encyclopedia of Food Science and Technology, 2nd Edition.” John Wiley and Sons, Inc. New York
Rulon, Rodney A., Dirk E. Maier, and Mike D. Boehlje. “A post-harvest economic
model to evaluate grain chilling as an IPM technology.” Journal of Stored Product Research 35(1999):369-83.
Rulon, Rodney Alexander. In-Bin Conditioning and Pest Management of Popcorn Using
Chilled Aeration, M.S.Thesis, Purdue University, May 1996. USDA Agricultural Marketing Service. 1998. Pesticide Data Program, Annual
Summary Calendar Year 1997.

70
Appendices
Appendix A. Following is the “Ideal IPM Elevator Checklist and Facility Audit” form that was used as the primary data gathering vehicle at all study elevators. Additional information was gathered through personal interviews that initially centered around the checklist
71
IPM Checklist and Facility Audit Instructions: For each management area decide whether it is a Critical IPM Point or a Good Management Practice. Critical IPM Points are the key aspects of your stored grain system. Most facilities will have 3-5 Critical IPM points per management category. Good Management Practices are the areas which may be important but are not the cornerstone of successful grain management in your storage environment. For each practice rate your elevator on a scale of 1 to 10 (with 1 being poor and 10 being ideal) in the appropriate column. If the practice or management area does not apply to your situation, leave it blank. When you are finished, average your scores for each column. You may also want to calculate your average score for each sub-category (Sanitation, Loading, Aeration, Monitoring, Pesticide Use, and Education). Date:
Location
Storage Volume
Steel
Concrete
Flat
Practice
Score 1 to 10 (10=ideal)
Critical IPM Point
Good Management Practice
Sanitation
Weekly/Biweekly Sanitation/housekeeping checklist
Complete bin/silo clean out prior to filing (at least annually)
Control residual insect populations in empty bins prior to filling (spray down or fumigate)
Keep trash/spilled grain and fines accumulation cleaned around bins/dumps/drives--overall facility clean
Control grass/weeds around bins/silos
Base and sidewall openings sealed for water leaks
Aeration fans sealed when not in use
Rodent control program in place
Facility bird and rodent proofed to eliminate grain contamination

72
Other (specify)
Average Score for Sanitation
Receiving
Receive from a preferred supplier
Sample incoming grain for insect, moisture and other factors
Policy to Reject or Fumigate Infested Grain
All grain for long-term storage is at safe moisture levels.
Fines in spout lines eliminated through Acoring@, leveling or use of grain spreader.
Other (specify):
Average Score for Receiving
Aeration
Bins have aeration with adequate airflow (at least .1 cfm/bu for steel bins. .05 cfm/bu for concrete)
Grain cooled to below 65oF within 120 days
Cooling zone movement checked with thermocouples
Bins engineered to minimize condensation (spouts temporarily sealed or gravity flap valves installed, or roof exhausters)
Adequate roof venting (1.5 sq. Ft./fan HP installed)
Automatic controllers installed and used
Other (specify):
Average Score for Aeration
Monitoring
Grain temperature checked every week until cooled, (bi-weekly thereafter)
Grain surface in bins sampled for insects every 2-4 weeks

73
Bin cores checked monthly for insects and moisture (deep cup probes, sampling moving grain etc.)
Insect probe traps in surface grain monitored weekly
Bin checked monthly for leaks, condensation, etc.
Walls and sources of water monitored for rodent sign monthly
Other (specify):
Average Score for Monitoring
OVERALL AVERAGE SCORE FOR IPM
Pesticide Use
No residual pesticides applied to grain
Fumigation based on insect action thresholds (not calender based)
Grain quality maintained with no more than one fumigation/year
Recirculation fumigation used to achieve maximum control with minimum dosage
Other (specify):
Average Score for Pesticide Use
Safety
At least two fumigant applicators trained and certified
Safe air samples obtained prior to de-placarding and bin/facility entry
Appropriate personal respiratory protection available/maintained
Annual fit-testing and training for respiratory protection
Written safety plan in use (hot work, lock-out, tag-out, bin entry etc.)
Written emergency action program in place
74
Other (specify):
Average Score for Safety
Education
Managers and key employees attend two grain management, fumigation or IPM workshops per year
Grain graders trained in sampling and grading
Elevator provides IPM/Stored grain training to producers/suppliers
Monthly safety training of employees
Other (specify):
Average Score for Education

75
Appendix B. The following survey instrument was used infrequently for information gathering at study elevators. It is included here to indicate the breadth if information that can be collected about an elevator facility that is relevant to IPM.
IPM CHARACTERIZATION SURVEY FOR GRAIN ELEVATORS
by Ronald T. Noyes, Ext. Agricultural Engineer
Philip A. Kenkel, Extension Economist Tom Phillips, Stored Grain Research Entomologist
Oklahoma State University
Integrated pest management (IPM) is a sustainable approach to pest control that integrates biological, cultural, physical and chemical control into systems which minimize economic, environmental, and social risks. While elevator practices may vary by geographic location, certain facility and equipment components are generally common to most country and terminal grain elevators. Goals of an IPM program typically include reducing pesticide input, reducing insect pest numbers and maintaining high grain quality.
The purpose of this checklist is to provide a standardized method of documenting the facilities, equipment and practices that are in place or in use at an elevator at a specific time. This listing will allow this elevator to be compared with other elevators based on use and location for comparison of capacities, functions and management practices. An elevator's characterization can be useful as a tool when evaluating the IPM practices and IPM qualifications of an elevator.
The following survey lists major functions of a grain elevator. Some sections, such as grain drying, aeration systems or grain cleaning, may not be applicable to all elevators. Other sections, like storage structures, conveying equipment, sanitation/housekeeping should be applicable to all elevators that are interested in using IPM.
While all elevator functions and practices are not "IPM" activities, their use may affect or support IPM. Since the overall goal of this program is to evaluate costs vs benefits of IPM, any key elevator function that has a major cost/benefit impact will be reviewed and listed. Since the purpose of this sheet involves appraising a food grain elevator for use in IPM evaluation, significant portions of this checklist and outline were adapted from Appraising an Existing Elevator, Jan/Feb 1998 Grain Journal.
MAJOR PHYSICAL ACTIVITIES/DIVISIONS OF GRAIN ELEVATORS
Physical IPM functions of grain elevators that will be reviewed in the Elevator IPM Characterization Survey form are:
Overall Facility Transportation Conveying/Blending Cleaning/Aspiration
76
Drying/Moisture Control Storage Systems Temperature Control/Management Insect Control/Management Fumigation Systems Sanitation/Housekeeping IPM Record Keeping
ELEVATOR IPM CHARACTERIZATION SURVEY Name of elevator or mill _________________________________ Date ________ Location of facility _____________________________________________________ Evaluators ____________________________________________________________ OVERALL FACILITY The primary activity of this elevator facility is (what the elevator does):________________ Main elevator facility headhouse concrete or steel? _________________________________ _____ No. of interior elevator legs and pits? _____ No. of exterior elevator legs and pits? Drives paved _____ or gravel _____ ? Weeds/grass mowed _____ ft from bins, silos, flats? Area around bins, silos, flats paved or graveled ______ ft for insect habitat barrier. Trash or moldy grain laying around the facility? ________ Fumigation supplies maintained stored in facility under lock/key_______________________ Fumigation equipment well maintained and serviceable?_____________________________ Written Sanitation/Housekeeping Plan posted for employee use?_________________ Grain sample power probe system?________________________________________ TRANSPORTATION Rail System No. of tracks ________ Tracks paved so spilt grain can be easily cleaned up? ________________________ Loadout sidings clean and no weeds or trash? _____________________________ Dump pits clean? _____ Pit conveyors clean? ____ General track, loading and pit areas clean ?_______ Trash and spilled grain cleaned up? ____________________________________ Road/Driveway System Roads/Drives Paved ______ Gravel ________ Dusty _____ Oiled _________ Dump pits clean? _____ Pit conveyors clean? ____ General truck loading and pit areas clean ? _____________________

77
Surrounding area, grass and weeds mowed or graveled? ________________ Trash and spilled grain cleaned up? ____________________________________ CONVEYING Bucket elevators -- No. of Legs _______
Leg #1 Ht.____ ft., ____ bu/hr, ____ HP; Leg #2 Ht. ____ ft., _____ bu/hr, ___ HP;
Leg #3 Ht.____ ft., _____ bu/hr; Leg #4 Ht. ___ ft., _____bu/hr , ____ HP;
Leg boot cleanouts accessible ________________________________________ Boots cleaned between different grains __________________________________ Conveyors -- No. U-Troughs ________; No. Augers ______; No. Drags _______ Do conveyors clean out? _______ Can conveyors be cleaned? ___________
CLEANING No. Grain cleaners _______; Type/brand of cleaners _________________________________________________
Are cleaners cleaned out between grains? ________________________________ DUST ASPIRATION SYSTEMS (DAS) No. of Dust Aspiration systems ___; DAS#1 ___ HP ; DAS#2 ___ HP; DAS#3 __ HP How often are DAS cleaned? _________________________________________
Drying/Moisture Control No. Grain Dryers ______; make/model/type of grain dryers ___________________ _______________________________________________________________; Dryer #1 ____ HP ;Dryer #2 ____ HP ; Dryer #3 ____ HP ; _____________________________________________ Are dryers/conveyors cleaned out between drying operations? ________________ No. wet holding tanks (WHT) feeding dryers? _____________________
WHT cleaned between grains? _____________________ Is grain dried below 13% MC before storing? ____; If NO, what MC? _____ STORAGE SYSTEMS Round Storage No. round units -- Steel ___________________ Concrete __________________ Diameter _______________________________________________ Sidewall height_______________________________________________ Overall height _______________________________________________ Bushel volume_______________________________________________ Type bottom _______________________________________________ Year built _______________________________________________

78
Aeration systems _______________________________________________ Thermocouples _______________________________________________ Clean? _______________________________________________ Other description ___________________________________________________ STEEL TANKS: Exterior: Down spouts sealable during fumigation? __________ Eaves sealed? ______; Roof fans vibrate? _____ Roof leaks? ______ Base/sidewall junction caulked/sealed with flexible, UV resistant material? _____________ Aeration fans, blowers, transition ducts sealed except during use? ___________________ Base doors, sample points, bolt openings sealed to exclude moisture and insects? ________ Conveyors clean? ____________ Conveyor exteriors sealed to exclude insects? _______ Recirculation or closed loop fumigation (CLF) system installed/used? ____ Blower; ___HP?
Interior: Moldy grain evidence of base moisture leaks? __________________________ Galvanizing corroded on interior walls? _____ Holes visible through roof panels during daylight? ______ Down spout condensation from aeration? ________ Grain "cored" to lower peak/level surface? _____ Aeration ducts cleaned yearly? _____ Interior vertical wall stiffeners cleaned during or after bin unloading? _________________ Grain dust cleaned out of bin roof corrugations at fill cap, openings foam sealed? ________
CONCRETE SILOS AND TANKS:
Exterior: Cracks in sidewalls? ________ Down spouts sealable during fumigation? ____ Aeration ? __________ What HP? _______ Airflow rate? _________ Upflow or down flow aeration? _________________________ Aeration fans, blowers, transition ducts sealed base manhole doors, sealed to exclude moisture and insects except during use? ____ Aeration fans on roof (upflow system)? ______ Recirculation or closed loop fumigation (CLF) system installed/used? ____; Blower ___HP? Discharge spout outlets cleaned out each time after silo unloaded? __________________
FLAT STORAGE: Size: Length _____ ft; width _____ft; sidewall height _____ ft., Peak height _____ ft. Fill: Leg/down spout ____; U-trough ___ or drag ___ conveyor in peak @ ____ ft.; Unload: Tunnel belt ___ ft. ; In-floor u-trough ___ ft.; front loader ___; Other _________

79
Aeration fans: ___ No. of ____ HP ___ axial; ___ centrifugal blowers @ _____ ft centers Aeration ducts: ____ No. ducts ___ in-floor; ____ on-floor; ___ round; ____ half round. Duct pattern ___________________________________________________________ Head space ventilation fans/louvered vents in gables? _____ Fan size ___ x ___ inches; Fan _____ HP ; Louver size ___ x ___ inches; TEMPERATURE CONTROL/MANAGEMENT Grain Temperature Management Grain storage thermocouple system in place,? _____ ; maintained/used? __________ Type of thermocouple system? ____ plugin/readout; _____ computerized to office? Temperatures read ___ weekly; ___ bi-weekly; ___ monthly; ____________ other. Target grain temperatures: steel tanks ____ oF; concrete silos ____ oF; flats ____ oF; Other critical temperature points monitored? _____________________________ Aeration Systems No. fans on steel tanks ______ ; HP/fan ______; Total fan HP _____ No. roof vents on steel tanks ___ ; Size/vent ______; Total vent area _____ sq ft No. fans on concrete silos ______ ; HP/fan ______; Total fan HP _____ No. roof vents on concrete silos ___ ; Size/vent ______; Total vent area _____ sq ft No. fans on flat storage ______ ; HP/fan ______; Total fan HP _____ No. roof vents on flat storage ___ ; Size/vent ______; Total vent area _____ sq ft Aeration duct plan, steel tanks (Lgth/ area) _______________________________ Aeration duct plan, concrete silos (Lgth/ area) _____________________________ Aeration duct plan, flat storage (Lgth/ area) ______________________________ Aeration controller type/model?

80
_______________________________________ HOUSEKEEPING/SANITATION Written housekeeping plan posted ________ Shop vacs used in open drives and well ventilated floors? ______________________ Adequate housekeeping tools? _____ IPM RECORD KEEPING IPM Files/Record System in Place covering: Insect monitoring program ______________________________________________ Fumigation program ___________________________________________________ Aeration operation details ______________________________________________ Grain temperature management __________________________________________ Residual pesticide use, where/when/what/amounts ____________________________ Oil dust control ______________________________________________________ Aspiration dust control _________________________________________________ Electrical utilities -- cost/benefit of IPM management changes ____________________ Other ______________________________________________________________

81
Appendix C. Protocol for estimating and assigning costs to various practices
The cost analysis is based on a framework provided by Rulon’s study on pest management in popcorn (Rulon; Rulon et al.). A spreadsheet is used to calculate the costs of managing stored grain for alternative insect control strategies. The spreadsheet is divided into six worksheets. In the first worksheet, the user specifies information about the facility. Worksheets two through five calculate insect sampling costs, aeration costs, fumigation costs and turning costs. The sixth worksheet computes the annual operating cost of each scenario in dollars per bushel. The first column of each worksheet contains field names, the second column contains the numbers and costs associated with the field names, and the third column contains an explanation of the number entered or the formula used.
The base model computes costs for an elevator with 10 concrete silos, each with a
capacity of 26,000 bushels of grain. Each silo currently contains 25,000 bushels, totaling 250,000 bushels. The base model assumes a wheat price of $3.75/bu.
Costs are calculated on a per-bushel basis. Specific costs considered are
electricity, labor, fumigant and other insecticides, and capital costs for equipment. Electricity costs are calculated as cooling hours per fan x number of fans used x (horsepower per fan / efficiency of the fans) x electricity cost in $/kwh, all divided by the number of bushels cooled.
Labor costs per task are calculated as hourly labor cost (including employee wages, taxes and benefits paid by employer) x employee hours per task. For the base case, a labor cost of $16/hr. (including benefits) was assumed for full- time employees with minimal management responsibilities.
Fumigant costs are calculated as cost per tablet (pellet) x number of tablets (pellets) used. There are 500 tablets (1,660 pellets) per flask, and 14 flasks per case (21 flasks of pellets per case), for a total of 7,000 tablets (34,860 pellets) per case. The base price is $300 per case of tablets or pellets, or $0.043 per tablet ($0.0086 per pellet). A minimum dosage consistent with the label would be 40 tablets (200 pellets) per 1,000 bushels of grain; a more reasonable dosage of 120 tablets (600 pellets) per 1,000 bushels for typical bulk storage facilities, also consistent with the label, is used here. However, if closed loop fumigation is used, the base dosage is set at 80 tablets (400 pellets) per 1000 bushels.
Capital costs for equipment are calculated by dividing the total investment cost by
a present value interest factor, PVIFA1, to amortize the equipment cost over its useful
1 The Present Value Interest Factor, or PVIFA, for an annuity of n years at i
percent interest, and is calculated as:

82
life, assumed to be 10 years. In addition, an annual insurance cost of 15% of the initial equipment cost, and an annual maintenance cost of 10% of the initial equipment costs are assumed.
Cost of fumigation monitoring devices are included in equipment costs for all
strategies using fumigation. The highest-ranking instrument (based on costs as well as other considerations) from Danley’s study is assumed to be used here. This particular device is an electronic monitor, and requires at least annual recalibration. That cost is also included. Labor costs for fumigation monitoring are considered separately.
Calculation Details
In the first worksheet (Facility Description), initial equipment costs are entered, along with their expected life, maintenance, insurance, and salvage values. The equipment used includes the PowerVac, a machine used to sample stored grain for insects; fumigation equipment, which includes safety and application devices; and the closed loop fumigation equipment, if applicable, in the elevator bin. As noted above, a fumigation monitoring device is included in equipment costs. All equipment is assumed to have a life of 10 years with a salvage value of zero.
This sheet also contains the fan horsepower for the fans used during aeration; the
centrifugal fan horsepower for facilities with closed loop systems; the fan efficiency, which is assumed to be 80 percent; electricity costs expressed in dollars per kilowatt hours; and hourly labor costs. The fumigant type and costs are specified in this worksheet. The fumigant cost is calculated by using an if-statement in the cell containing the formula for the calculation of the final cost of fumigant. Grain protectant costs can also be entered, if the facility uses it.
The second worksheet (Insect Sampling) contains the number of samples typically
required to effectively monitor the insects in stored product; labor hours, which are the amount of time required to go to a bin, probe for the required samples, sieve the grain, remove the insects and count and identify the insects; the time it takes to set up and take down the vacuum probe and inclined sieves; and the number of people it takes to do the job. The equipment setup step is done only once for each elevator. Our base model assumes 3 samplers taking 10 insect samples, using 0.08 labor hours each, and a total of 3 hours in setting up the sampling equipment. Insect sampling labor charges and sampling equipment costs are expressed in dollars per bushel, and calculated as
( )( )
oredbushels str costourly labosamplers*h*setup timempleshours*# saaborsampling lr Charges pling LaboInsect Sam # +
=
i
n
iPVIFA
−−
=1
11
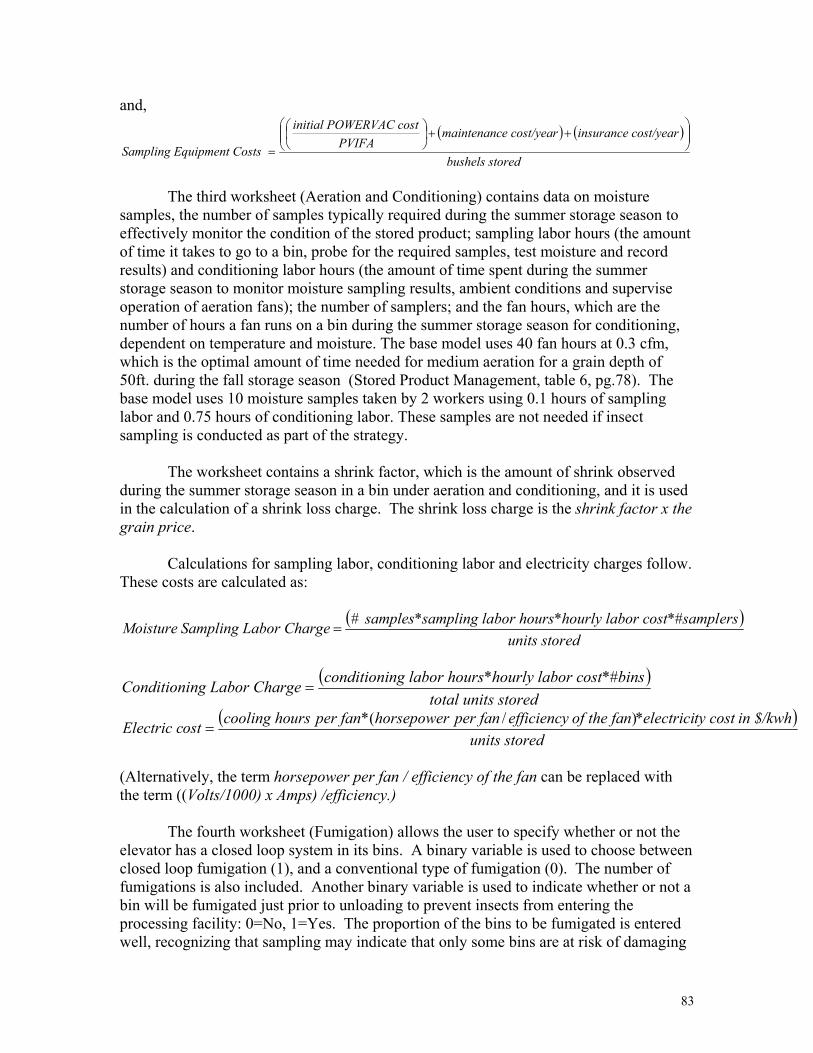
83
and,
( ) ( )
oredbushels st
cost/yearinsurance re cost/yeamaintenancPVIFA
tWERVAC cosinitial PO
osts quipment CSampling E
++
=
The third worksheet (Aeration and Conditioning) contains data on moisture
samples, the number of samples typically required during the summer storage season to effectively monitor the condition of the stored product; sampling labor hours (the amount of time it takes to go to a bin, probe for the required samples, test moisture and record results) and conditioning labor hours (the amount of time spent during the summer storage season to monitor moisture sampling results, ambient conditions and supervise operation of aeration fans); the number of samplers; and the fan hours, which are the number of hours a fan runs on a bin during the summer storage season for conditioning, dependent on temperature and moisture. The base model uses 40 fan hours at 0.3 cfm, which is the optimal amount of time needed for medium aeration for a grain depth of 50ft. during the fall storage season (Stored Product Management, table 6, pg.78). The base model uses 10 moisture samples taken by 2 workers using 0.1 hours of sampling labor and 0.75 hours of conditioning labor. These samples are not needed if insect sampling is conducted as part of the strategy.
The worksheet contains a shrink factor, which is the amount of shrink observed
during the summer storage season in a bin under aeration and conditioning, and it is used in the calculation of a shrink loss charge. The shrink loss charge is the shrink factor x the grain price.
Calculations for sampling labor, conditioning labor and electricity charges follow. These costs are calculated as:
( )edunits stor
ersost*#samplly labor chours*hourborampling la samples*seabor ChargSampling LMoisture # =
( )
s storedtotal unitost*#binsly labor chours*hourng laborconditionihargeng Labor CConditioni
=
( )edunits stor
in $/kwhty cost*electricin of the faefficiencyper fanhorsepowerper fan*urscooling hoostElectric c )/ ( =
(Alternatively, the term horsepower per fan / efficiency of the fan can be replaced with the term ((Volts/1000) x Amps) /efficiency.) The fourth worksheet (Fumigation) allows the user to specify whether or not the elevator has a closed loop system in its bins. A binary variable is used to choose between closed loop fumigation (1), and a conventional type of fumigation (0). The number of fumigations is also included. Another binary variable is used to indicate whether or not a bin will be fumigated just prior to unloading to prevent insects from entering the processing facility: 0=No, 1=Yes. The proportion of the bins to be fumigated is entered well, recognizing that sampling may indicate that only some bins are at risk of damaging

84
infestation. This is important because IPM strategies use fumigation only when sampling indicates it is needed. The fumigant cost is recalled from the facility sheet for calculation purposes. The base model uses 3 employees per crew, each requiring an hour of training. The number of training hours represents the hours required per employee on a fumigation crew per year for certification, continuing education, and safety training. Two crew hours per fumigation are required to seal bin, administer fumigant, check concentrations, and aerate the bin. A liability insurance cost expressed in dollars per bushel is included in this worksheet, which is associated with fumigation and includes worker and environmental safety. The base model uses a liability insurance cost of $0.0001/bu. The amount of blower hours to distribute fumigant gas evenly throughout the bin can be specified in this worksheet if the facility uses closed loop systems. For this case, 48 blower hours are considered. This number is used in the calculation of the closed loop system blower charge, expressed in dollars per bushel. The formula is as follows:
edunits storionsof fumigatty cost*# *electriciefficiencyblower HPrs*blower hou )/( chargeblower .L.C =
An if–statement is used in the cell containing the formula to let the program know whether to calculate the blower charge: if there is a closed loop system in the facility, the program calculates the charge using the formula above. Otherwise, the program enters a zero in the cell. If a chemical grain protectant is used, its cost calculated in dollars per bushel is included in the cost of chemicals. The worksheet specifies Actellic for corn and allows selection of either Malathion or Reldan for wheat. The cost for Malathion is $0.002/bu. and for Reldan/Actellic is $0.022/bu. (Kenkel et al.).
Calculations for fumigation labor, fumigation training, fumigant charges, and fumigation equipment follow. Costs for closed loop facilities are also included. All costs are expressed in dollars per bushel. The cost formulas are:
oredbushels stscost*# binrly labor n crew*hou fumigatioloyees peration* emp per fumigcrew hours gelabor char Fumigation =
storedbushels costurly labormployee*hotraining/e charge training fumigation =
( ) ( )
oredbushels st
cost/yearinsurance re cost/yeamaintenancPVIFA
stuipment coinitial eq
Costs EquipmentFumigation
++
=
( ) ( )
oredbushels st
cost/yearinsurance re cost/yeamaintenancPVIFA
stuipment coinitial eq
Costs Equipment pClosed Loo
++
=
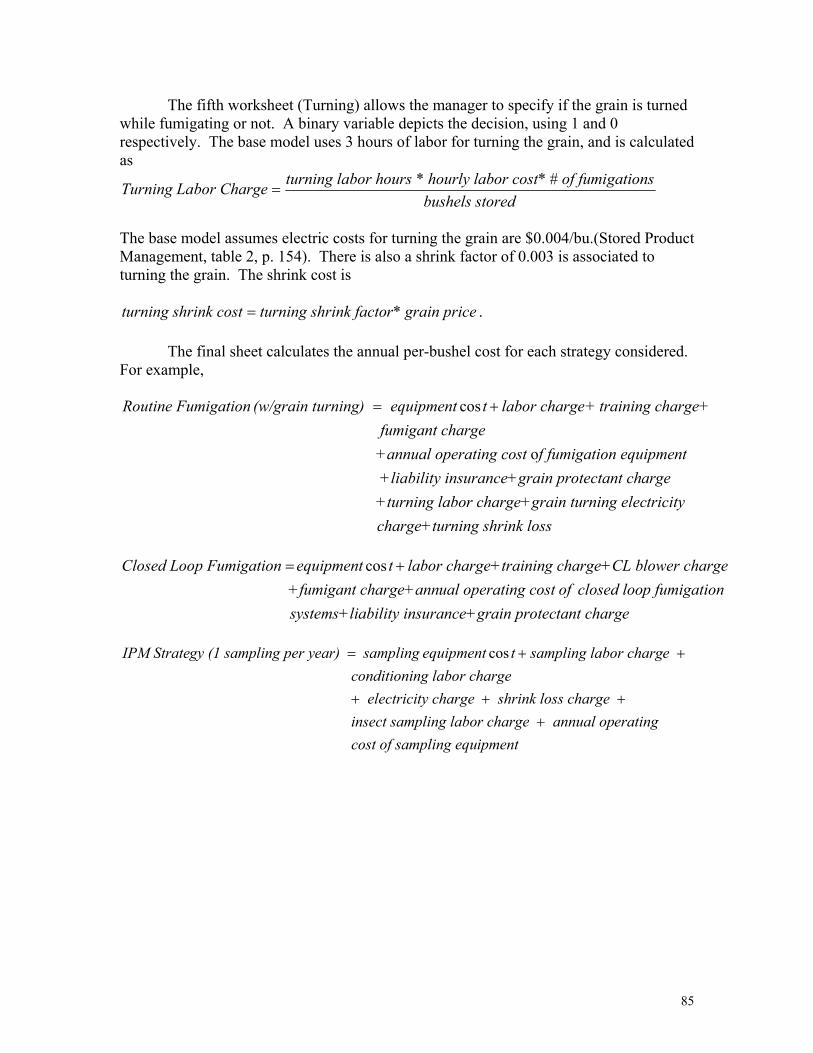
85
The fifth worksheet (Turning) allows the manager to specify if the grain is turned while fumigating or not. A binary variable depicts the decision, using 1 and 0 respectively. The base model uses 3 hours of labor for turning the grain, and is calculated as
oredbushels stgations # of fumiabor cost** hourly lbor hours turning labor ChargeTurning La =
The base model assumes electric costs for turning the grain are $0.004/bu.(Stored Product Management, table 2, p. 154). There is also a shrink factor of 0.003 is associated to turning the grain. The shrink cost is
ricer* grain prink factoturning shrink costturning sh = .
The final sheet calculates the annual per-bushel cost for each strategy considered. For example,
k lossning shrincharge+turtricity rning elece+grain tuabor charg+turning l
argetectant ch+grain pro insurance+liabilitynton equipmef fumigatisterating co+annual op
hargefumigant charge+training c+gelabor chart equipmenturning) (w/grain tmigationRoutine Fu
o
cos +=
etant chargain protecsurance+grability insystems+lionp fumigaticlosed looofing costual operatcharge+ann+fumigant
harge L blower cg charge+Cge+traininlabor chartequipmentonp FumigatiClosed Loo
cos +=
cos
ipmentmpling equcost of saerating annual opr charge pling laboinsect sam
ss charge shrink loty charge electriciharge ng labor cconditioni
e abor chargsampling ltequipment samplingear) ling per ygy (1 sampIPM Strate
++++
++=

86
Appendix D. Costs and Evaluation of Fumigation Monitoring Equipment
abstracted from Ronda Danley’s MS thesis Summary Aluminum/magnesium phosphide is an important tool in keeping commodity grain free of insects. This fumigant is important to many Oklahoma grain elevators. However, there is a lack of knowledge about whether or not their facilities are gas-tight. The only way to know for sure if a facility is gas-tight is by monitoring areas around the facility while it is under fumigation. This is accomplished by a phosphine gas monitoring device. These devices are expensive and require training so it is important for each facility to pick a device that is optimal for them. A way to determine which is optimal is to list all costs and benefits of each device that they are considering. This study lists the costs and benefits for five phosphine gas monitoring devices. A Multiple Criteria Decision Model is then used to evaluate each of the costs and benefits (both quantitative and subjective) in order of importance. For example, one weighting scheme used was to weight the costs at 80% (35% initial equipment cost, 25% additional equipment cost, and 10% recalibration costs) and the subjective attributes at 20% (5% for user-friendliness, 5% for convenience, 5% for ruggedness, and 5% for worker safety). Assuming a labor cost of $8/hr. and a fumigation length of 24 days, the results showed that the devices ranked 1) Draeger Pac III; 2) Lumidor MicroMax; 3) ATI PortaSensII; 4) Draeger MiniWarn; 5) MSA Tube. This scenario shows that the tube-type devices, represented by the MSA Tube, ranked below the electronic-type devices when costs are weighted more heavily than benefits. When costs are instead weighted at 35% (20% for initial equipment costs, 5% for additional equipment costs, 5% for recalibration costs, and 5% for labor costs) and the subjective attributes are weighted at 65% (50% for worker safety, 5% for ruggedness, 5% for convenience, and 5% for user-friendliness), the results change somewhat. Valuing worker safety at the higher level leads to a ranking of: 1) Draeger Pac III; 2) Lumidor MicroMax; 3) MSA Tube; 4) ATI PortaSensII; 5) Draeger MiniWarn. The tube-type device ranks near the middle of the group when worker safety and other benefits are weighted more heavily than costs.
87
Appendix E.
Guidance for Preparation of a Fumigation Management Plan The following are the required parts in creating a Fumigation Management Plan Purpose A Checklist Guide Preliminary Planning and Preparation Personnel Monitoring Sealing Procedures Application Procedures and Fumigation Period Post-Application Operations FUMIGATION MANAGEMENT PLAN
The certified applicator is responsible for working with the owners and/or responsible employees of the site to be fumigated to develop a Fumigation Management Plan (FMP). The FMP is intended to ensure a safety and effective fumigation. The FMP must address characterization of the site, and include appropriate monitoring and notification requirements, consistent with, but not limited to, the following:
1. Inspect the site to determine its suitability for fumigation.
2. When sealing is required, consult previous records for any changes to the structure, seal leaks, and monitor any occupied adjacent buildings to ensure safety.
3. Prior to each fumigation, review any existing FMP, MSDS, Applicators Manual and other relevant safety procedures with company officials and appropriate employees.
4. Consult company officials in the development of procedures and appropriate safety measures for nearby workers that will be in and around the area during application and aeration.
5. Consult with company officials to develop an appropriate monitoring plan that will confirm that nearby workers and bystanders are not exposed to levels above the allowed limits during application/aeration. This plan must also demonstrate that nearby residents will not be exposed to concentrations above the allowable limits.
6. Consult with company officials to develop procedures for local authorities to notify nearby residents in the event of an emergency.
7. Confirm the placement of placards to secure entrance into any area under fumigation.
8. Confirm the required safety equipment is in place and the necessary manpower is available to complete a safety effective fumigation.
88
These factors should be considered in putting a FMP together. It is important to note that some plans will be more comprehensive than others. All plans should reflect the experience and expertise of the applicator and circumstances at and around the site.
In addition to the plan, the applicator must read the entire label and follow its directions carefully. If the applicator has any questions about the development of a FMP, contact DEGESCH AMERICA, INC. for further assistance.
The FMP and related documentation, including monitoring records, must be maintained for a minimum of 2 years.
GUIDANCE FOR PREPARATION OF A FUMIGATION MANAGEMENT PLAN
Purpose
A Fumigation Management Plan (FMP) is an organized, written description of the required steps involved to help ensure a safe, legal, and effective fumigation. It will also assist you and others in complying with pesticide product label requirements. The guidance that follows is designed to help assist you in addressing all the necessary factors involved in preparing for and fumigating a site.
This guidance is intended to help you organize any fumigation that you might perform PRIOR TO ACTUAL TREATMENT. It is meant to be somewhat prescriptive, yet flexible enough to allow the experience and expertise of the fumigator to make changes based on circumstances which may exist in the field. By following a step-by-step procedure, yet allowing for flexibility, safe and effective fumigation can be performed.
Before any fumigation begins, carefully read and review the label and the Applicator's Manual. This information must also be given to the appropriate company officials (supervisors, foreman, safety officer, etc.) in charge of the site. Preparation is the key to any successful fumigation. If the type of fumigation that you are to perform is not listed in this Guidance Document you will want to construct a similar set of procedures. Finally, before any fumigation begins you must be familiar with and comply with all applicable state and local laws. The success and future of fumigation are not only dependent on your ability to do your job but also by carefully following all rules, regulations, and procedures required by governmental agencies.
A CHECKLIST GUIDE FOR A FUMIGATION MANAGEMENT PLAN
This checklist is provided to help you take into account factors that must be addressed prior to performing all fumigations. It emphasizes safety steps to protect people and property. The checklist is general in nature and cannot be expected to apply to all types of fumigation situations. It is to be used as a guide to prepare the required plan. Each item must be considered, however, it is understood that each fumigation is different and not all items will be necessary for each fumigation site.
A. PRELIMINARY PLANNING AND PREPARATION

89
1. Determine the purpose of the fumigation.
a. Elimination of insect infestation
b. Elimination of rodent infestation
c. Plant pest quarantine
2. Determine the type of fumigation, for example
a. Space; tarp, mill, warehouse, food plant
b. Vehicle; railcar, truck, van, container
c. Commodity; raw agricultural or processed foods
d. Grain; vertical silo, farm storage, flat storage
e. Vessels; ship or barge. In addition to the Applicator's Manual, read the U.S. Coast Guard Regulations 46CFR 147A.
3. Fully acquaint yourself with the site and commodity to be fumigated, including
a. The general structure layout, construction (materials, design, age, maintenance) of the structure, fire or combustibility hazards, connecting structures and escape routes, above and below ground, and other unique hazards or structure characteristics. Prepare, with the owner/operator/person in charge. Draw or have a drawing or sketch of structure to be fumigated, delineating features, hazards, and other structural issues.
b. The number and identification of persons who routinely enter the area to be fumigated (i.e. Employees, visitors,customers, etc.)
c. The specific commodity to be fumigated, its mode of storage, and its condition.
d. The previous treatment history of the commodity, if available.
e. Accessibility of utility service connections.
f. Nearest telephone or other means of communication, and mark the location of these items on the drawing/sketch.
g. Emergency shut-off stations for electricity water and gas. Mark the location of these items on the drawing/sketch.
h. Current emergency telephone numbers of local Health, Fire, Police, Hospital, and Physician responders.
i. Name and phone number (both day and night) of appropriate company officials.
90
j. Check, mark and prepare the points of fumigation application locations if the job involves entry into the
structure for fumigation.
k. Review labeling
l. Exposure time considerations.
1. Fumigant to be used.
2. Minimum fumigation period, as defined and described by the label use directions.
3. Down time required to be available
4. Aeration requirements
5. Cleanup requirements, including dry or wet deactivation methods, equipment, and personnel needs,
if necessary.
6. Measured and recorded commodity temperature and moisture.
m. Determination of dosage
1. Cubic footage or other appropriate space/location calculations.
2. Structure sealing capability and methods.
3. Label recommendations
4. Temperature, humidity, wind
5. Commodity/space volume
6. Past history of fumigation of structure
7. Exposure time
B. PERSONNEL
1. Confirm in writing that all personnel in and around the area to be fumigated have been notified prior to application of the fumigant. Consider using a checklist each one initials indicating they have been notified.
2. Instruct all fumigation personnel about the hazards that may be encountered; and about the selection of personal protection devices, including detection equipment.
3. Confirm that all personnel are aware of and know how to proceed in case of an emergency situation.

91
4. Instruct all personnel on how to report any accident and/or incidents related to fumigant exposure. Provide a telephone number for emergency response reporting.
5. Instruct all personnel to report to proper authorities any theft of fumigant and/or equipment related to fumigation.
6. Establish a meeting area for all personnel in case of emergency.
C. MONITORING
1. Safety
a. Monitoring must be conducted in areas to prevent excessive exposure and to determine where exposure may occur. Document where monitoring will occur.
b. Keep a log or manual of monitoring records for each fumigation site. This log must, at a minimum, contain the timing, number of readings taken and level of concentrations found in each location.
c. When monitoring log records, document there is no phosphine present above the safe levels, subsequent monitoring is not routinely required. However, spot checks should be made occasionally, especially if conditions significantly change.
d. Monitoring must be conducted during aeration and corrective action taken if gas levels exceed the allowed levels in an area where bystanders and/or nearby residents may be exposed.
2. Efficacy
a. Gas readings should be taken from within the fumigated structure to insure proper gas concentrations. If the phosphine levels have fallen below the targeted level the fumigators, following proper entry procedures, may reenter the structure and add additional product.
b. Document readings.
D. NOTIFICATION
1. Confirm all local authorities (fire departments, police departments, etc.) have been notified as per label instructions, local ordinances if applicable, or instructions of the client.
2. Prepare written procedure ("Emergency Response Plan") which contains explicit instructions, names, and telephone numbers so as to be able to notify local authorities if phosphine levels are exceeded in an area that could be dangerous to bystanders.
E. SEALING PROCEDURES
1. Sealing must be complete.

92
2. If the site has been fumigated before, review the previous FMP for previous sealing information.
3. Make sure that construction/remodeling has not changed the building.
4. Warning placards must be placed on every possible entrance to the fumigation site.
F. APPLICATION PROCEDURES & FUMIGATION PERIOD
1. Plan carefully and apply all fumigants in accordance with the registrants label requirements.
2. When entering into the area under fumigation, always work with two or more people under the direct supervision of a certified applicator wearing appropriate respirators.
3. Apply fumigant from the outside where appropriate.
4. Provide watchmen when a fumigation site cannot otherwise be made secure from entry by unauthorized persons.
5. When entering structures, always follow OSHA rules for confined spaces.
6. Document that the receiver of in-transit fumigation has been notified and is trained to receive commodity under fumigation.
G. POST-APPLICATION OPERATIONS
1. Provide watchmen when you cannot secure the fumigation site from entry by unauthorized persons during the aeration process.
2. Ventilate and aerate in accordance with structural limitations.
3. Turn on ventilating or aerating fans where appropriate.
4. Use a suitable gas detector before reentry to determine fumigant concentration.
5. Keep written records of monitoring to document completion of aeration.
6. Consider temperature when aerating.
7. Insure aeration is complete before moving vehicle into public roads.
8. Remove warning placards when aeration is complete.
9. Inform business/client that employees/other persons may return to work or otherwise be allowed to reenter.
APPLICATION PROCEDURES
A FMP must be devised for application, aeration and disposal of the fumigant so as to keep to a minimum any exposures to hydrogen phosphide and to help assure adequate control of the insect pests.
93
The following instructions are intended to provide general guidelines for typical fumigations. These instructions are not intended to cover every type of situation nor are they meant to be restrictive. Other procedures may be used if they are safe, effective and consistent with the properties of aluminum phosphide products.
FLAT STORAGES
Treatment of these types of storages often require considerable physical effort. Therefore, sufficient manpower should be available to complete the work rapidly enough to prevent excessive exposure to hydrogen phosphide gas. Vent flasks outside the storage, conduct fumigations during cooler periods, and employ other work practices to minimize exposures. It is likely that respiratory protection will be required during application of fumigant to flat storages. Refer to the sections on Applicator and Worker Exposure and Respiratory Protection.
1. Inspect the site to determine its suitability for fumigation.
2. Determine if the structure is in an area where leakage during fumigation or aeration would adversely effect nearby workers or bystanders if concentrations were above the permitted exposure levels.
3. Develop an appropriate Fumigation Management Plan. (Refer to FMP guidelines.)
4. Consult previous records for any changes to the structure. Seal vents, cracks and other sources of leaks.
5. Apply tablets or pellets by surface application, shallow probing, deep probing or uniform addition as the bin is filled. Storages requiring more than 24 hours to fill should not be treated by addition of fumigant to the commodity stream as large quantities of hydrogen phosphide may escape before the bin is completely sealed.
Probes should be inserted vertically at intervals along the length and width of the flat storage. Pellets or tablets may be dropped into the probe at intervals as it is withdrawn.
Surface application may be used if the bin can be made sufficiently gas tight to contain the fumigant gas long enough for it to penetrate the commodity. In this instance, it is advisable to place about 25 percent of the dosage in the floor level aeration ducts. Check the ducts prior to addition of PHOSTOXIN® to make sure that they contain no liquid water.
6. Placement of plastic tarp over the surface of the commodity is often advisable, particularly if the overhead of the storage cannot be well sealed.
7. Lock all entrances to the storage and post fumigation warning placards.
VERTICAL STORAGES (concrete upright bins and other silos in which grain can be rapidly transferred)
1. Inspect the site to determine its suitability for fumigation.
94
2. Determine if the structure is in an area where leakage during fumigation or aeration would expose nearby workers or bystanders to concentrations above the permitted levels.
3. Develop an appropriate Fumigation Management Plan. (Refer to FMP guidelines.)
4. Consult previous records for any changes to the structure. Close openings and seal cracks to make the structure as airtight as possible. Prior to the fumigation, seal the vents near the bin top which connect to adjacent bins.
5. Pellets or tablets may be applied continuously by hand or by an automatic dispenser on the headhouse/gallery belt or into the fill opening as the commodity is loaded into the bin. An automatic dispenser may also be used to add PHOSTOXIN® into the commodity stream in the up leg of the elevator.
6. Seal the bin deck openings after the fumigation has been completed.
7. Bins requiring more than 24 hours to fill should not be fumigated by continuous addition into the commodity stream. These bins may be fumigated by probing, surface application, or other appropriate means. Exposure periods should be lengthened to allow for diffusion of gas to all parts of the bin if PHOSTOXIN® has not been applied uniformly throughout the commodity mass.
8. Place warning placards on the discharge gate and on all entrances.