integrated oil companies - duke university investment … oil companies ... small section of net...
TRANSCRIPT

Integrated Oil Companies
Loretta Bu Patrick He
Zhou Fang Artur Shikhaleev
Suvayan Roy Yang Zeng
1

Key Questions
2

THE OIL SUPPLY CHAIN
3
Upstream, Midstream, Downstream, Equipment and Services Companies

The Oil Supply Chain
4
Upstream
• Explore for hydrocarbons
• Production – take hydrocarbons from the ground and selling them
• Examples: Devon Energy, Anadrako Petroleum, Apache
Midstream
• Process, transport, and store via ships, pipes and other ways
• Examples: TransCanada, Williams Companies, Enbridge
Downstream
• Refining oil and natural gas into petroleum products for sale
• Examples: Valero Energy, Sunoco, Tesoro

Upstream Activities
5
Upstream Midstream Downstream
Conventional Oil Source:
• Oil between sedimentary layers
• Least costly to obtain
• 1.3 tn barrels oil world wide
• 6,182 tn cubic feet of natural gas
Unconventional Source:
• Oil within rocks
• Examples are shale or sand
• North America estimate reserves 2.6tn barrels
• Costly to extract

Upstream Activities
6
Upstream Midstream Downstream
Six steps of Upstream process:
1. Acquire rights to explore and develop from
reserve holder
2. Conduct geological, geophysical, and seismic
surveys to find deposits
3. Perform exploration drilling to test for deposits
4. Conduct appraisal to determine if field contain
commercially viable deposits
5. Begin oil and gas production
6. Pay reserve holders via royalties or
production sharing arrangements (PSAs)
Midstream Activities
7
Upstream Midstream Downstream
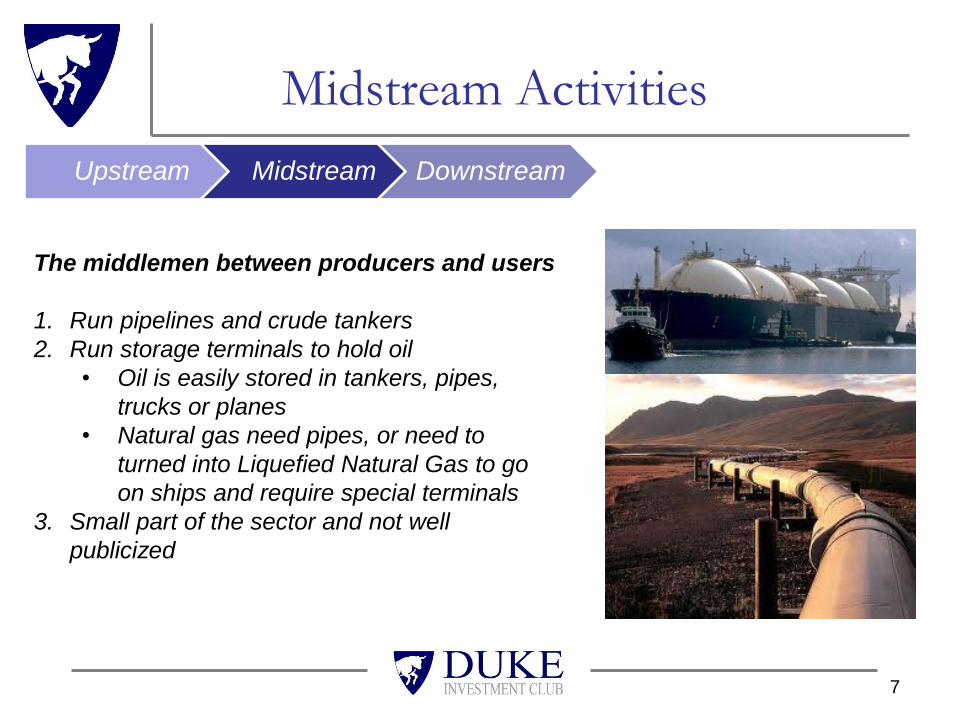
The middlemen between producers and users
1. Run pipelines and crude tankers
2. Run storage terminals to hold oil
• Oil is easily stored in tankers, pipes,
trucks or planes
• Natural gas need pipes, or need to
turned into Liquefied Natural Gas to go
on ships and require special terminals
3. Small part of the sector and not well
publicized

Downstream Activities
8
Upstream Midstream Downstream
Refine crude into petroleum products & retail
1. Produce gas, diesel, heating oil, propane, jet
fuel for transportation and industry
2. Refinery produce products on local demand
• Texas & Cali mostly gas, diesel b/c cars
• Hawaii produces mostly jet fuel
3. Differences in Crude Oil
• Light v Heavy crude: density set by
American Petroleum Institute gravity
ex: Light 38º & heavy 22º
• Sweet v Sour: sulfur content of oil
ex: sweet contains less sulfur

Downstream Activities
9
Upstream Midstream Downstream

Other Players
10
Oil & Gas Drilling
Equipment & Services

Oil & Gas Drilling
• Rent oil rigs to other firms under
short or long term contracts –
charging by day
• Producers find it cost effective to
contract rigs than own them due to
cyclicality of rig demand
• May types of rigs:
– Commodity: oil or gas
– Trajectory: vertical, horizontal,
directional
– Type of well: exploration,
development, infill
11

Oil & Gas Drilling
Equipment, services, expertise
for
Exploration, development, production:
• Drilling equipment: drill bits, fluids,
pumps, pipes, wellhead
• Pressure pumping: cementing or
enhancing wells
• Wire line services: record electronic
data on wells
• Directional drilling tools & advice
• Seismic imaging and analysis
• Engineering & design infrastructure
• Helicopters and boats
12

KEY DRIVERS OF THE
ENERGY SECTOR
Commodity Prices, Production Growth, F&D costs, E&P capital
expenditures, Refining margins, M&A, Sentiment, Regulation
13
Oil Demand Drivers
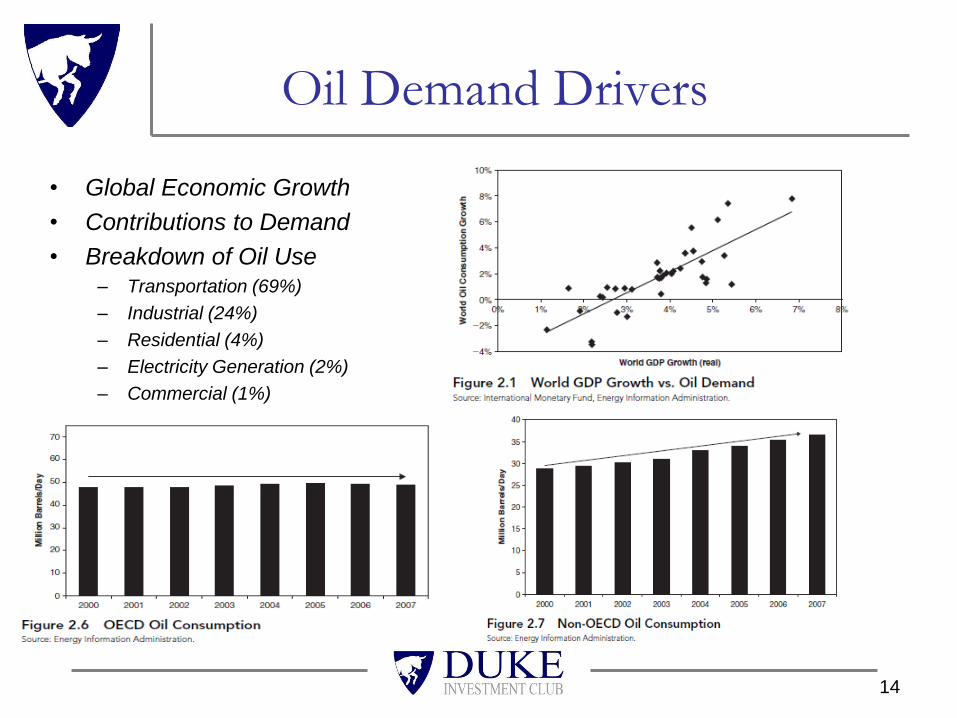
• Global Economic Growth
• Contributions to Demand
• Breakdown of Oil Use – Transportation (69%)
– Industrial (24%)
– Residential (4%)
– Electricity Generation (2%)
– Commercial (1%)
14

Oil Supply Drivers
• World Oil Production
– OPEC
– Non-OPEC
• Crude Oil Reserves
• Spare Capacity
• Oil Inventories
• Geopolitics
15

World Oil Production
16

OPEC
17

Crude Oil Reserves
18
Crude Oil Reserves:
• Conventional
• Easy to extract
• Unconventional
• Difficult to extract

Spare Capacity
19
• Definition: “the amount of oil
currently not being produced, but
could be produced if needed”
• OPEC – largest spare capacity
• Quotas
• To keep oil prices high

Oil Inventories
20
• A change in oil inventories
indicates how oil supply
balances with oil demand
• Growing inventories => Excess
supply => Falling prices
• Shrinking inventories => Higher
Prices

Geopolitics
21
• Political conflicts
• Arab Oil Embargo (1973)
• Labor Strikes
• Weather
• Civil Unrest
• Terrorism
• Wars
• Iraq invasion of Kuwait (1990)
• Iran-Iraq War (1980)
• Iran production nearly halt

Margin Determinants
• Most net margins determined in upstream. Very
small section of net margin from distribution.
• Crude oil prices the main factor
• Refining capacity and capability (volatility
between firms)
• Regulatory environment (nationalized
companies and OPEC)
• Average Industry Net Profit Margin: 7.3%
22

Margin Determinants
23

Marginal Analysis
24

Refining Margins
25

Foreign Exchange Risk
• Euro-dominated oil shares were penalized
due to:
– Currency volatility
– Stocks traded in crisis-heavy French and
Italian markets
• Pricing gap between European and US oil
companies:
– All else equal, i.e. ROE, leverage, etc.
– Traded at a discount to US rivals since 2009.
26

Oil Market is Regional
27

Major European oil stocks vs
EUR/USD for past 5 years
28
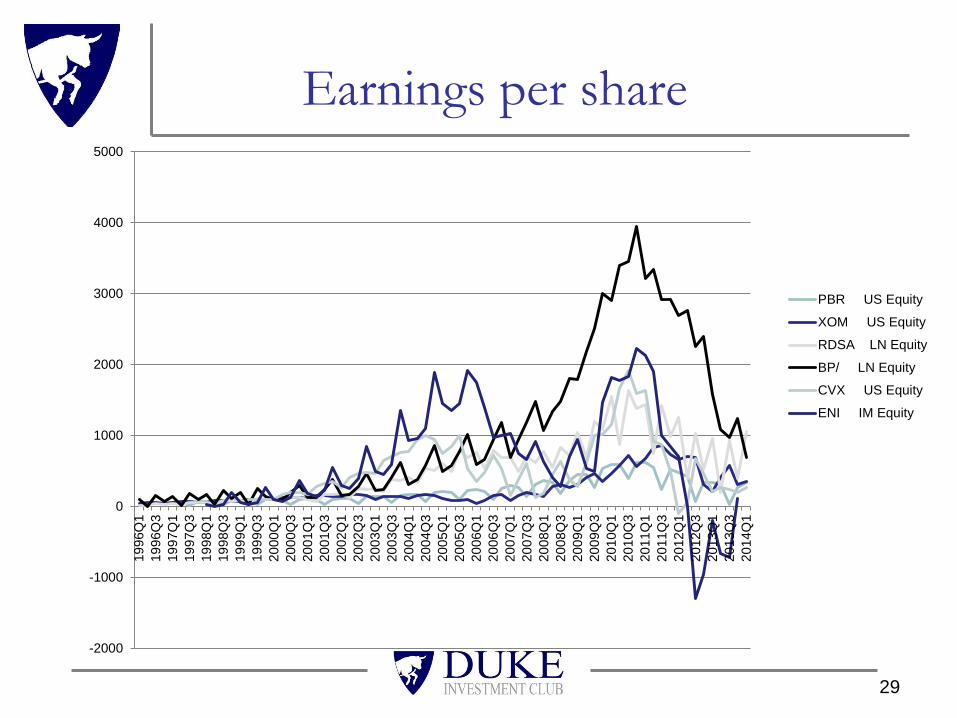
Earnings per share
29
-2000
-1000
0
1000
2000
3000
4000
500019
96Q
1
19
96Q
3
19
97Q
1
19
97Q
3
19
98Q
1
19
98Q
3
19
99Q
1
19
99Q
3
20
00Q
1
20
00Q
3
20
01Q
1
20
01Q
3
20
02Q
1
20
02Q
3
20
03Q
1
20
03Q
3
20
04Q
1
20
04Q
3
20
05Q
1
20
05Q
3
20
06Q
1
20
06Q
3
20
07Q
1
20
07Q
3
20
08Q
1
20
08Q
3
20
09Q
1
20
09Q
3
20
10Q
1
20
10Q
3
20
11Q
1
20
11Q
3
20
12Q
1
20
12Q
3
20
13Q
1
20
13Q
3
20
14Q
1
PBR US Equity
XOM US Equity
RDSA LN Equity
BP/ LN Equity
CVX US Equity
ENI IM Equity

PE Ratios
30
0
10
20
30
40
50
60
PBR US Equity
XOM US Equity
RDSA LN Equity
BP/ LN Equity
CVX US Equity
ENI IM Equity
Debt Levels
• ADRs dropped 2.3% on February 11, sixth
day in a row
• Warning government that debt ratios may
rise - projected to increase from 2.8 to 3.5
• Selling products at a loss because of
Brazilian price ceiling, high interest rates,
complicated tax structure
– Eight year low for 2012 profits – 36.6% drop

Growth
• Doubled gas output at Argentina project
• Overconsumption rather than undersupply
• Importing 190,000 barrels of diesel and
110,000 barrels of gasoline daily
• Continuing expansion with production of
rigs and refineries
• Expects to increase its production by 27%
by 2016, growing 6% annually
32
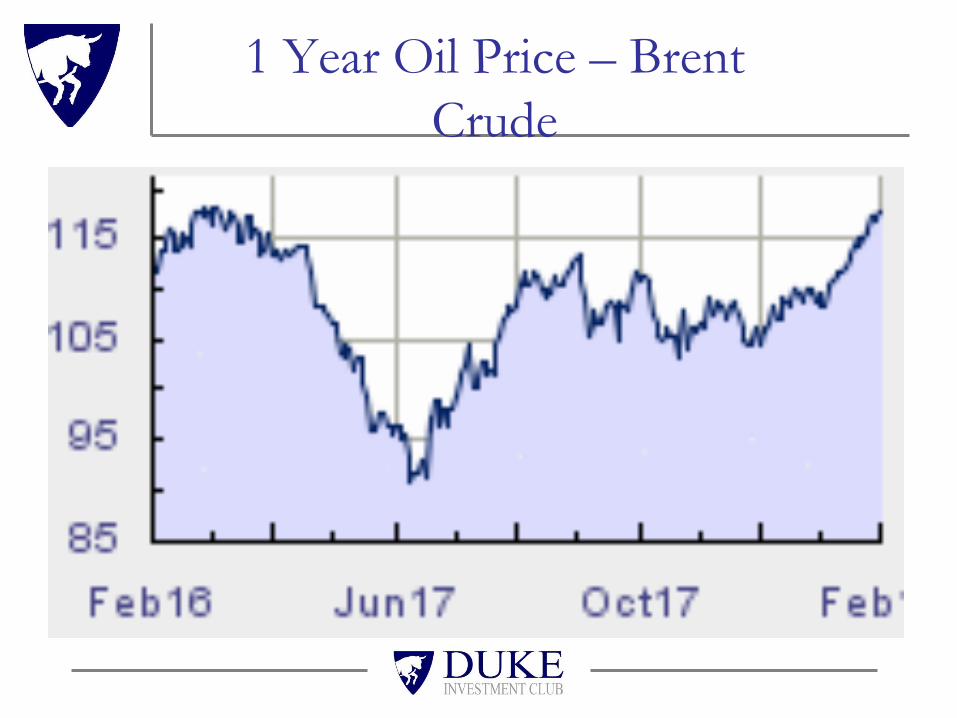
1 Year Oil Price – Brent
Crude

Base Costs
Lifting Costs
Finding Costs
Total Upstream Costs
United States – Average $12.18 $21.58 $33.76
On-shore $12.73 $18.65 $31.38
Off-shore $10.09 $41.51 $51.60
All Other Countries –
Average
$9.95 $15.13 $25.08
Canada $12.69 $12.07 $24.76
Africa $10.31 $35.01 $45.32
Middle East $9.89 $6.99 $16.88
Central & South America $6.21 $20.43 $26.64

Constraints
• In times of economic growth, IOCs in the US
can’t produce enough oil to meet demand, so
they make a high profit on the oil they
produce, and take some of that to buy more
oil and refine it and take only the refining
profits.
• Periods of high oil prices are also tempered
by alternative energy sources and un-
conventional drilling, making a “cap” on oil
prices

Peak Oil Myth
• People are trying to predict “Peak Oil” or the time when we are going to extract the most oil, after which production will fall
• This would mark the end of “cheap” oil as we know it
• However, this still hasn’t happened, mainly because as the price of oil increases, more and more oil become economically viable to extract, even through unconventional methods, making our theoretical reserves greater and greater.

Conclusion
• IOCs are tied to the price of oil through both volume and price
• IOCs, on average, make about 7.9 cents on every dollar of business.
• Extraction, transportation, and
• Additionally, they benefit from the time lag from drilling customer, because during periods of oil price increases, this means the oil becomes more valuable