integrated ocean drilling program expedition 310 ...core.ac.uk/download/pdf/9697777.pdf ·...
TRANSCRIPT

Integrated Ocean Drilling ProgramExpedition 310 Preliminary Report
Tahiti Sea Level
The last deglacial sea level rise in the South Pacific: offshore drilling in Tahiti (French Polynesia)
Cruise dates:6 October–16 November 2005
Onshore Science Party:13 February–4 March 2006
Expedition 310 Scientists
PUBLISHER'S NOTES
Material in this publication may be copied without restraint for library, abstract service,educational, or personal research purposes; however, this source should be appropriatelyacknowledged.
Citation:Expedition 310 Scientists, 2006. Tahiti Sea Level: the last deglacial sea level rise in the SouthPacific: offshore drilling in Tahiti (French Polynesia). IODP Prel. Rept. , 310.doi:10.2204/iodp.pr.310.2006
Distribution:Electronic copies of this series may be obtained from the ECORD Web site on the WorldWide Web at ecord.org/exp/pubs.html.
This publication was prepared by the Integrated Ocean Drilling Program ECORD ScienceOperator, as an account of work performed under the international Integrated Ocean DrillingProgram, which is managed by IODP Management International (IODP-MI), Inc. Funding forthe program is provided by the following agencies:
European Consortium for Ocean Research Drilling (ECORD)
Ministry of Education, Culture, Sports, Science and Technology (MEXT) of Japan
Ministry of Science and Technology (MOST), People’s Republic of China
U.S. National Science Foundation (NSF)
DISCLAIMER
Any opinions, fndings, and conclusions or recommendations expressed in this publication arethose of the author(s) and do not necessarily refect the views of the participating agencies,IODP Management International, Inc., or ECORD Management Agency.
May 26, 2006

Expedition 310 Preliminary Report
The following scientists and personnel participated in Expedition 310 of the Integrated Ocean Drilling Pro-gram.
EXPEDITION 310 PARTICIPANTS
Expedition 310 Scientists
Gilbert F. Camoin†
Co-Chief ScientistEuropôle Méditerranéen de l’ArboisCentre Européen de Recherche et d’Enseignement
des Geosciences de l’EnvironnementCentre National de la Recherche ScientifiqueUMR 6635BP 8013545 Aix-en-Provence Cedex [email protected]
Yasufumi Iryu†
Co-Chief ScientistInstitute of Geology and PaleontologyGraduate School of ScienceTohoku UniversityAobayamaSendai [email protected]
David McInroy†
Staff ScientistBritish Geological SurveyMurchison HouseWest Mains RoadEdinburgh EH9 3LAUnited [email protected]
Ryuji AsamiInorganic GeochemistInstitute of Geology and PaleontologyGraduate School of ScienceTohoku UniversityAobayamaSendai [email protected]
Hendrik Braaksma†
Petrophysics Staff ScientistLaboratoire de Géophysique et Hydrodynamique
en ForageUniversité Montpellier IIISTEEM 056 - Place Eugène Bataillon34095 Montpellier Cedex [email protected]
Guy CabiochCarbonate SedimentologistResearch Unit “Paleotropique”Institut de Recherche pour le DéveloppementBP A598848 Nouméa CedexNew [email protected]
Paterno CastilloIgneous PetrologistScripps Institution of OceanographyUniversity of California, San Diego9500 Gilman DriveLa Jolla CA [email protected]
Anne L. CohenInorganic GeochemistGeology and GeophysicsWoods Hole Oceanographic InstitutionClark 118Mailstop 23Woods Hole MA [email protected]
Julia E. ColeInorganic GeochemistGeosciences DepartmentUniversity of Arizona1040 East 4th StreetTucson AZ [email protected]
†
3
Participated in shipboard operations.

Expedition 310 Preliminary Report
Pierre DeschampsInorganic GeochemistEuropole Mediterraneen de l’ArboisCentre Européen de Recherche et d’Enseignement
des Geosciences de l’EnvironnementCentre National de la Recherche ScientifiqueUMR 6635BP 8013545 Aix-en-Provence Cedex [email protected]
Richard G. FairbanksInorganic GeochemistEarth and Environmental SciencesLamont-Doherty Earth Observatory
of Columbia University210 Isotope LaboratoryPO Box 1000, 61 Route 9WPalisades NY [email protected]
Thomas FelisInorganic GeochemistDeutsche Forschungsgemeinschaft–Research
Center Ocean MarginsUniversity of BremenPostfach 33044028334 [email protected]
Kazuhiko FujitaPaleontologist (foraminifers)Department of Physics and Earth SciencesUniversity of the RyukyusSenbaru 1, Nishihara-choOkinawa [email protected]
Ed C. HathorneInorganic GeochemistDepartment of Earth Sciences The Open University Walton Hall Milton Keynes MK7 6AAUnited [email protected]
Steve P. LundPaleomagnetistDepartment of Earth SciencesUniversity of Southern California3651 University AvenueLos Angeles CA [email protected]
Hideaki MachiyamaCore PetrophysicistKochi Institute for Core Sample ResearchJapan Agency for Marine-Earth Science
and Technology (JAMSTEC)200 Monobe-otsu, NankokuKochi [email protected]
Hiroki Matsuda†
Carbonate SedimentologistDepartment of Earth Sciences, Faculty of ScienceKumamoto University2-39-1, KurokamiKumamoto [email protected]
Terrence M. QuinnInorganic GeochemistCollege of Marine ScienceUniversity of South Florida140 7th Avenue SouthMSL 119St. Petersburg FL [email protected]
Kaoru Sugihara†
Coral SpecialistEarth System Science, Faculty of ScienceFukuoka University8-19-1, NanakumaJonan-ku, [email protected]
Alexander Thomas Inorganic GeochemistDepartment of Earth ScienceUniversity of OxfordParks RoadOxford OX1 3PRUnited [email protected]
4

Expedition 310 Preliminary Report
Crisogono de Olivera Vasconcelos†
MicrobiologistDepartment of Earth Sciences, Geological InstituteSwiss Federal Institute of TechnologyUniversität Strasse 68092 Zü[email protected]
Klaas Verwer†
Core Petrophysicist/Logging ScientistFaculty of Earth and Life SciencesDepartment of Sedimentology and Marine GeologyVrije Universiteitde Boelelaan 10851081 AmsterdamThe [email protected]
Jody M. Webster†
Coral SpecialistSchool of Earth SciencesJames Cook University of North QueenslandTownsville QLD [email protected]
Hildegard WestphalCarbonate SedimentologistDepartment of GeosciencesUniversität BremenLeobener Strasse28359 [email protected]
Kyung Sik WooCarbonate Sedimentologist (observer)Department of GeologyKangwon National University192-1, Hyoja2-DongChunchonKangwon-Do [email protected]
Tsutomu Yamada†
Carbonate SedimentologistInstitute of Geology and PaleontologyGraduate School of ScienceTohoku UniversityAobayamaSendai [email protected]
Yusuke YokoyamaInorganic GeochemistDepartment of Earth and Planetary SciencesUniversity of Tokyo7-3-1 HongoBuilding 1Tokyo [email protected]
Operational and Technical Staff
ECORD Science Operator Personnel and Technical Representatives
Alister Skinner†
Operations ManagerBritish Geological SurveyMarine OperationsEngineering and Core Store2a Nivensknowe RoadLoanhead EH20 9AUUnited [email protected]
Ursula RöhlLaboratory and Curation ManagerBremen Core Repository (BCR)Institute for Marine Environmental Research
(MARUM)Universität BremenLeobener Strasse28359 [email protected]
5

Expedition 310 Preliminary Report
Davie Baxter†
Drilling Supervisor/EngineerBritish Geological SurveyMarine OperationsEngineering and Core Store2a Nivensknowe RoadLoanhead EH20 9AUUnited [email protected]
Peter BouteloupCore TechnicianBritish Geological SurveyKingsley Dunham CentreKeyworthNottingham HG12 5GGUnited [email protected]
Florence Einaudi†
Logging ServicesLaboratoire de Géophysique et d’Hydrodynamique
en ForageUniversité Montpellier IIISTEEM 05634095 Montpellier Cedex [email protected]
Eileen Gillespe†
Drilling Engineer/YeopersonBritish Geological SurveyMurchison HouseWest Mains RoadEdinburgh EH9 3LAUnited [email protected]
Colin GrahamDatabase OperatorBritish Geological SurveyMurchison HouseWest Mains RoadEdinburgh EH9 3LAUnited [email protected]
Walter HaleCore CuratorBremen Core Repository (BCR)Institute for Marine Environmental Research
(MARUM)Universität BremenLeobener Strasse28359 [email protected]
Gilles Henry†
Logging ServicesLaboratoire de Géophysique et Hydrodynamique
en ForageUniversité Montpellier IIISTEEM 056 - Place Eugène Bataillon 34095 Montpellier Cedex [email protected]
Jenny Inwood†
ESO PetrophysicistLeicester University Borehole ResearchGeology DepartmentLeicester UniversityUniversity RoadLeicester LE1 7RHUnited [email protected]
Martin Kölling†
ESO GeochemistDepartment of GeosciencesUniversity of BremenFB 5, Postfach 330440 28334 Bremen Germany
Holger Kuhlmann†
Core Curator†/Assistant Laboratory Man-agerBremen Core Repository (BCR)Institute for Marine Environmental Research
(MARUM)Universität BremenLeobener Strasse28359 [email protected]
Iain Pheasant†
Drilling Supervisor/EngineerBritish Geological SurveyMarine OperationsEngineering and Core Store2a Nivensknowe RoadLoanhead EH20 9AUUnited [email protected]
Scott RenshawCore TechnicianBritish Geological SurveyKingsley Dunham CentreKeyworthNottingham HG12 5GGUnited Kingdom
6

Expedition 310 Preliminary Report
Dave Smith†
Electronics EngineerBritish Geological SurveyMarine OperationsEngineering and Core Store2a Nivensknowe RoadLoanhead EH20 9AUUnited [email protected]
Hans-Joachim Wallrabe-Adams†
Database OperatorInstitute for Marine Environmental SciencesWDC-MARE/PANGAEAUniversity of BremenLeobener StrasseD-28359 [email protected]
Rolf Warthmann†
ESO MicrobiologistDepartment of Earth SciencesSwiss Federal Institute of TechnologyGeological InstituteSonneggstrasse 58092 ZürichSwitzerland
Christian Wilson†
Staff Scientist in TrainingBritish Geological SurveyMurchison HouseWest Mains RoadEdinburgh EH9 3LAUnited [email protected]
Alex Wülbers†
Core Curator†/Curatorial SpecialistBremen Core Repository (BCR)Institute for Marine Environmental Research
(MARUM)Universität BremenLeobener Strasse28359 [email protected]
SeaCore Personnel
Gary JagoOffshore Manager
Stewart FrazerDrill Superintendent
Andy NesbitDrill Superintendent
Martin BarnettElectrician
Danny BennettsDrill Supervisor
Mike CourtLead Driller
Terry EvansFitter
Rob GrenfellWelder
Allan PopeDrill Supervisor
Lee PopeDriller
Simon TrewinDrill Supervisor
University of Bremen Laboratory Staff
Vera LukiesESO Petrophysics Technician
Jens GrütznerESO Petrophysics Support
Volker DiekampPhotographer
Silvana HesslerChemistry Laboratory Technician
7

Expedition 310 Preliminary Report
Karsten EnnekingChemistry Laboratory Technician
Stefan FeilCore Laboratory Technician (student)
Christian MayerCore Laboratory Technician (student)
Christiane FrenzCore Laboratory Technician (student)
Hiederose MüllerCore Laboratory Technician (student)
Nike Fuchs Core Laboratory Technician (student)
Susanne SchüllerCore Laboratory Technician (student)
Lena RöderCore Laboratory Technician (student)
Susanne SchüllerCore Laboratory Technician (student)
Carola SchulzCore Laboratory Technician (student)
Isabelle Schulz Core Laboratory Technician (student)
Andrea SchwandtCore Laboratory Technician (student)
Julia WosniokCore Laboratory Technician (student)
8

Expedition 310 Preliminary Report
ABSTRACT
Integrated Ocean Drilling Program (IODP) Expedition 310 to the reef terraces aroundTahiti, French Polynesia, was the second expedition to utilize a mission-specific plat-form (MSP) and was conducted by the European Consortium for Ocean ResearchDrilling (ECORD) Science Operator (ESO). The objectives of Expedition 310 are to es-tablish the course of postglacial sea level rise at Tahiti, to define sea-surface tempera-ture (SST) variations for the region over the period 20–10 ka, and to analyze theimpact of sea level changes on reef growth and geometry. To meet these objectives,the postglacial reef sequence, which consists of successive reef terraces seaward of theliving barrier reef, was cored from a dynamically positioned vessel during Octoberand November 2005. A total of 37 boreholes across 22 sites were cored in water depthsranging from 41.65 to 117.54 m. Borehole logging operations in 10 boreholes pro-vided continuous geophysical information about the drilled strata. The cores were de-scribed during the Onshore Science Party at the IODP Bremen Core Repository duringFebruary and March 2006, where minimum and some standard measurements weremade. Further postcruise research on samples taken during the Onshore Science Partyare expected to fulfill the objectives of the expedition.
9

Expedition 310 Preliminary Report
INTRODUCTION
The timing and course of the last deglaciation is generally considered to be an essen-tial component for understanding the dynamics of large ice sheets (Lindstrom andMacAyeal, 1993) and their effects on Earth’s isostasy (Lambeck, 1993; Peltier, 1994).Moreover, the disappearance of glacial ice sheets was responsible for dramaticchanges in the freshwater fluxes to the oceans, which disturbed the general thermo-haline circulation and, hence, global climate (e.g., Stocker and Wright, 1991). Coralreefs, like the one that surrounds Tahiti, are excellent sea level indicators, and theiraccurate dating by mass spectrometry is of prime importance for determining thetiming of deglaciation events and thus for understanding of the mechanisms drivingglacial–interglacial cycles. Furthermore, scleractinian coral colonies can monitor andrecord past sea-surface temperatures (SSTs).
BACKGROUND
Sea Level Changes as a Global Climate Indicator
Only three deglaciation curves based on coral reef records have been accurately datedfor times reaching the Pleistocene/Holocene boundary: in Barbados between 19.00and 8.00 ka (Fairbanks, 1989; Bard et al., 1990a, 1990b), in New Guinea between13.00 and 6.00 ka (Chappell and Polach, 1991; Edwards et al., 1993), and in Tahitibetween 13.75 ka and 2380 14C y before present (BP) (Bard et al., 1996) (Fig F1). Sofar, the Barbados curve is the only one to encompass the whole deglaciation becauseit is based on offshore drilling. However, this site, like New Guinea, is located in anactive subduction zone where tectonic movements can be large and discontinuous sothat the apparent sea level records may be biased by variations in the rates of tectonicuplift. Hence, there is a clear need to study past sea level changes in tectonically stableregions or in areas where the vertical movements are slow and/or regular.
The Barbados record suggested that the last deglaciation was characterized by twobrief periods of accelerated melting superimposed on a smooth and continuous riseof sea level with no reversals (Fig F1). These so-called meltwater pulse (MWP) events(MWP-1A and MWP-1B at ~13.80 and 11.30 ka, respectively) are thought to corre-spond to massive inputs of continental ice (i.e., ~50–40 mm/y, roughly equivalent toannual discharge rates of 16,000 km3 for MWP-1A). MWP-1A corresponds to a shortand intense cooling period between 14.10 and 13.90 ka in Greenland records(Johnsen et al., 1992; Grootes et al., 1993) and therefore postdates initiation of the
10

Expedition 310 Preliminary Report
Bölling-Alleröd warm period at ~14.90–14.70 ka (Broecker, 1992). The sea level jumpevidenced in New Guinea at 11.00 ka (Edwards et al., 1993) is delayed by a few cen-turies when compared to that observed at Barbados. These two meltwater pulses arethought to have induced reef-drowning events (Blanchon and Shaw, 1995). Two“give-up” reef levels have been reported at 90–100 and 55–65 m water depth on theMayotte foreslopes (Comoro Islands) and have been related to the Bölling and thepost-Younger Dryas meltwater pulses (Dullo et al., 1998); similar features are recordedin the southern Great Barrier Reef (GBR) (Troedson and Davies, 2001) and in the Car-ibbean (MacIntyre et al., 1991; Grammer and Ginsburg, 1992). A third Acropora reef-drowning event at ~7.60 ka has been assumed by Blanchon and Shaw (1995).
However, there are still some doubts concerning the general pattern of sea level riseduring the last deglaciation events, including the amplitude of the maximum low-stand during the Last Glacial Maximum (LGM) and the occurrence of increased gla-cial meltwater with resultant accelerated sea level rise (Broecker, 1990). Furthermore,sawtooth sea level fluctuations between 19.00 and 15.28 ka (Locker et al., 1996) anda sea level fall coeval with climatic changes at ~11 ka are still controversial topics.
Worldwide sea level compilations indicate that local sea level histories varied consid-erably around the world in relation to both postglacial redistribution of water massesand a combination of local processes (Lambeck, 1993; Peltier, 1994), although signif-icant deviations between model predictions and field data have been noted in severalregions (Camoin et al., 1997). The post–last glacial sea level changes at sites locatedfar away from glaciated regions (“far field”) provide basic information regarding themelting history of continental ice sheets and the rheological structure of Earth. Theeffect of hydroisostasy depends on the size of the islands: for very small islands, theaddition of meltwater produces a small differential response between the island andthe seafloor, whereas the meltwater load produces significant differential verticalmovement between larger islands or continental margins and the seafloor (Lambeck,1993). There is therefore a need to establish the validity of such effects at two idealsites located at a considerable distance from the major former ice sheets: (1) on asmall oceanic island and (2) on a continental margin. In both cases, it is essential forthe sites chosen that the tectonic signal is small or regular within the short time pe-riod proposed for investigation so that rigorous tests of proposed northern and south-ern hemisphere deglaciation curves from Barbados and New Guinea can be made.Two such places were proposed: Tahiti and GBR. This expedition conducted investi-gations at the Tahiti sites only.
11

Expedition 310 Preliminary Report
Climatic and Oceanographic Changes during Last Deglaciation Events
During latest Pleistocene and early Holocene, climatic variability was primarily re-lated to the effects of seasonality and solar radiation. The results of the Long-RangeInvestigation, Mapping, and Prediction (CLIMAP) program suggested that LGM trop-ical SSTs were similar to modern ones. However, this interpretation is not consistentwith snowline reconstructions and paleobotanic data (Rind and Peteet, 1985; Ander-son and Web, 1994).
The available Sr/Ca and U/Ca data from coral reef areas report SSTs 5˚C colder thanthose of today during the LGM and 2˚C lower at ~10–9 ka at Barbados (Guilderson etal., 1994), whereas studies in the west Pacific indicate that the full amplitude of theglacial Holocene temperature change may have ranged between 3˚ and 6˚C (McCul-loch et al., 1996; Beck et al., 1997; Gagan et al., 1998) (Fig F1). Troedson and Davies(2001) define SSTs immediately south of the GBR some 4.5˚C colder during the LGMand 1˚C colder at 10 ka. This casts doubt upon the phase shift of 3000 y for climatechanges between the two hemispheres that was assumed by Beck et al. (1997), in cleardistinction to the apparent synchronism of the last deglaciation, inferred from vari-ous sources (i.e., coral records, ice cores, snowline reconstructions, vegetationrecords, and alkenone palaeothermometry) (Bard et al., 1997).
Recent studies have documented Holocene climatic variations. SSTs warmer by 1˚C,monsoonal rainfall, and possibly weaker El Niño–Southern Oscillation (ENSO) at~5.80 ka in eastern Australia have been deduced from isotopic and Sr/Ca high-resolu-tion measurements on corals from the central GBR (Gagan et al., 1998). An ENSO-likecyclic climatic variation with a return period of 3–5 y has been evidenced in a 4150y old coral from the Seychelles, although the intensity of the annual decrease in SSTcaused by monsoonal cooling was lower than that of today (Zinke et al., 2005).
Additional information is required for better knowledge of climatic conditions intropical regions during the last deglaciation. In these areas, the most debated pointsare twofold: (1) the quantification of SSTs and the identification of related climaticvariations during the last deglaciation events and (2) the timing of the relevant post-glacial warming in the two hemispheres.
12
Expedition 310 Preliminary Report
SCIENTIFIC OBJECTIVES
1. Establish the course of postglacial sea level rise at Tahiti (i.e., define the exact shape of the deglaciation curve for the period 20.00—10.00 ka.
In establishing the deglaciation curve, we hope to assess the validity, timing, and am-plitude of the MWP-1A event, assess the maximum sea level drop during the LGM toprove or disprove the sawtooth pattern of sea level rise during the last deglaciation(Locker et al., 1996), and test predictions based on different ice and rheological mod-els.
Reconstruction of sea level curves relies on absolute dating of in situ corals by radio-metric methods (230Th/234U by thermal ionization mass spectrometry [TIMS] and 14Cby accelerator mass spectrometry [AMS]) and paleobathymetric information deducedfrom biological communities (corals, algae, and mollusks) that live in a sufficientlynarrow or specific depth range to be useful as absolute sea level indicators.
2. Define SST variations for the region over the period 20.00—10.00 ka
This information is needed to gain better knowledge of regional variation of SSTs inthe South Pacific, climatic variability and identification of specific phenomena suchas ENSO, and global variation and relative timing of postglacial climate change in thesouthern and northern hemispheres.
Methods include stable isotope (δ18O) and trace element (Sr/Ca ratios by TIMS) anal-yses on high-resolution (i.e., at the monthly scale) sampling of massive coral colo-nies. Coupled analyses of δ18O and Sr/Ca on the same sample may yield estimates ofboth temperature and salinity (McCulloch et al., 1996). Stable isotope δ18O measure-ments, systematically coupled with those of δ18O in coral skeletons, will provide in-formation on other parameters (e.g., solar variations or metabolism processes).Geochemical methods will be coupled with measurements and analyses of the band-widths and microstructural variations in the coral skeletons.
3. Analyze the impact of sea level changes on reef growth and geometry.
Assessments will be made of the impact of glacial meltwater phases (identification ofreef drowning events) and the morphological and sedimentological evolution of theforeslopes (highstand versus lowstand processes). In addition, modeling of reef build-ing and analyses of environmental changes during reef development will be under-taken.
13

Expedition 310 Preliminary Report
A numerical model simulating reef building will be used to study the effect of a sealevel jump on reef geometry and to qualitatively assess the effect of sea level fluctua-tions on the reef shape and age-depth relationships.
Expedition 310 may provide the opportunity to better constrain deglacial history (seePeltier, 1994; Fleming et al., 1998; Okuno and Nakada, 1999) by documenting, for thefirst time, the LGM lowstand in well-studied cores in the far field and by comparingthe MWP-1A event in the Pacific and Atlantic Oceans. Furthermore, study of veryearly deglacial coral material should provide the first Sr/Ca SSTs for the LGM in thePacific, which could then supplement Barbados sample data (Guilderson et al., 1994)and the recent study of Stage 6 corals (McCulloch et al., 1999).
OPERATIONAL STRATEGY
Drilling offshore Barbados (Fairbanks, 1989) demonstrated that the reef sequence cor-responding to the last deglaciation developed only on slopes and therefore forms dis-continuous successive terraces of various lateral extent.
At Tahiti, recovery of the postglacial reef sequence required drilling successive reefterraces that occur seaward of the living barrier reef. Studies and surveys around Ta-hiti have demonstrated the occurrence of successive reef terraces at various depths,100, 90, 60, and 40–50 m, which therefore correspond to drilling targets. Thus, ateach site, we cored several boreholes along transects to attempt to recover the entirepostglacial reef sequence.
Based on the results of previous scientific drilling and bathymetric and seismic dataacquired during the SISMITA cruise, we drilled a transect of holes in three areasaround Tahiti: offshore Papeete-Faaa (proposed Site TAH-01A), Tiarei (proposed SiteTAH-02A), and Maraa (proposed Site TAH-03A) (Fig. F2). The involved water depthsranged from 41.65 to 117.54 m.
The exact location of the drill holes was determined during the cruise by checking thenature and morphology of the seafloor with a through-pipe underwater camera. Allholes were sited within a circle of radius 150 m around the proposed drilling sites ap-proved by the Environmental Pollution and Safety Panel (EPSP), or within the mid-cruise EPSP-approved 200 m extension of the circle around proposed Site TAH-02A-4(to 350 m radius). Figures F3, F4, and F5 show the locations of the holes at Faaa, Tia-rei, and Maraa, respectively.
14

Expedition 310 Preliminary Report
SITE RESULTS
Cores were recovered from 37 holes across 22 sites (M0005 to M0026) (Table T1), witha conventionally calculated recovery of 57.47%. Water depths at the sites rangedfrom 41.6 to 117.5 m, and cores were recovered from 41.6 to 161.8 meters below sealevel (mbsl). Because of difficulties locating and operating at some the proposed drillsites (see Operations), the original strategy of coring along profiles was abandonedand new sites were chosen on the basis of water depth. Thus six drilling “areas” weretargeted: Faaa, Tiarei inner ridge, Tiarei outer ridge, Tiarei marginal sites, Maraa west-ern transect, and Maraa eastern transect. All new sites were drilled within areas ap-proved by EPSP. Borehole geophysical wireline logging was conducted at seven sites(in ten holes).
Because of space limitations on the DP Hunter, only limited analysis of cores was con-ducted offshore, with the bulk of description and measurement conducted at the On-shore Science Party at the Bremen Core Repository. Table T2 shows whichmeasurements were conducted offshore and at the Onshore Science Party.
Sedimentology and Biological Assemblages
The cored material shows that the reefs around Tahiti are composed of two majorlithological units: a postglacial carbonate sequence (Unit I) and an older Pleistocenesequence (Unit II). Modern sediments were often recovered above Unit I. WithinUnits I and II, the lithostratigraphy can be divided into subunits (e.g., Subunit IA, IB,IC, and so on), based on coral assemblages and internal structure. It is important tonote that subunits of the same designation at separate sites are not correlative. Cor-relation of subunits between sites will not be possible until ages are obtained frompostcruise research.
Maraa Western Transect: Sites M0005, M0006, and M0007
The western transect drilled in the Maraa area (southwest Tahiti) includes SitesM0007, M0005, and M0006 (landward to oceanward) in water depths between 43and 82 m. Figure F6 summarizes the major lithologic units, lithology, and recoveryfor all holes on the Maraa western transect.
15
Expedition 310 Preliminary Report
Modern Sediments
Modern sediments were recovered at all sites along this transect. They consist of a fewdecimeter-thick beds comprising rhodoliths, skeletal sands, and gravels rich in Hal-imeda segments, mollusk fragments, benthic foraminifers, and nongeniculate coral-line algae along with clasts of Halimeda packstone and coral clasts.
Lithologic Unit I (Postglacial Carbonate Sequence)
The thickness of Unit I ranges from 33 to 42 m at Sites M0005 and M0007, respec-tively.
The top of Unit I is characterized by an abundance of thin crusts of nongeniculatecoralline algae and extensive bioerosion. This sequence is primarily composed of co-ralgal-microbialite frameworks commonly interlayered with loose skeletal sedimentsincluding coral and algal rubble and skeletal sand and with skeletal limestone.
The coralgal-microbialite frameworks that form the bulk of this unit are characterizedby widespread development of microbialites which locally represent the major struc-tural and volumetric component of the reef rock. They develop within the primarycavities of the reef framework, where they generally overlie crusts of noneniculatecoralline algae. The microbialites generally comprise a suite of fabrics including twoend-members represented by laminated fabrics and thrombolitic accretions; the lam-inated fabrics generally correspond to the most abundant fabric.
The reef sequence is characterized by a general succession of distinctive coral assem-blages, although many of them are intergradational, both laterally and vertically. Twosuccessive subunits (Subunits IA and IB) displaying distinctive coral assemblages andinternal structure were recognized:
• Subunit IA, up to 20 m thick, primarily comprises coralgal-microbialite frameworksdominated by encrusting coral colonies.
• Subunit IB, up to 25 m thick, comprises coralgal-microbialite frameworks made oftabular and branching coral colonies that are usually heavily encrusted by nonen-iculate coralline algae, locally associated with vermetid gastropods, overlain byvery thick and massive microbialite crusts. Large primary cavities are partially filledwith skeletal sand rich in Halimeda segments and coral fragments.
16

Expedition 310 Preliminary Report
At Site M0007, the base of Subunit IB corresponds to poorly lithified skeletal grain-stone that contains fine sand-sized volcanic grains and a 30 cm thick interval com-posed of branching coralline algae in Core 310-M0007B-34R.
Lithologic Unit II (Older Pleistocene Sequence)
The top of Unit II was recovered at 86 and 92 mbsl at Sites M0005 and M0007, respec-tively. This sequence was drilled to 161.56 mbsl in Hole M0005D.
The older Pleistocene sequence is composed of eight distinctive lithologic subunits:
• Subunit IIA is a beige to gray well-lithified limestone comprising coralgal frame-works associated with rudstone-floatstone beds.
• Subunit IIB is a well-lithified skeletal floatstone-rudstone rich in rhodoliths, frag-ments of corals and mollusks, and Halimeda segments, associated with volcanicgrains.
• Subunit IIC is a poorly sorted and ungraded unlithified volcaniclastic silt to sandincluding scattered skeletal grains reworked pebbles of Halimeda floatstone and an-gular clasts of siltstones of the same composition.
• Subunit IID is a beige to brownish coralgal framework in which corals are thinlycoated by nongeniculate coralline algae and then heavily encrusted by microbi-alites with laminar and thromboltic fabrics.
• Subunit IIE is a sandy skeletal grainstone rich in volcanic grains, large coral clasts(massive Porites), and skeletal fragments (coralline algae and corals).
• Subunit IIF is a coral and algal rudstone to floatstone comprising fragments of cor-als (massive, encrusting, and branching corals), coralline algae, echinoids and mol-lusks, rhodoliths, and lithoclasts in a coarse sandstone matrix rich in volcanic andskeletal grains.
• Subunit IIG is a coralgal framework interbedded with skeletal grainstone to pack-stone rich in volcanic grains.
• Subunit IIH is a skeletal grainstone to floatstone rich in fragments of corals(branching Pavona and encrusting Montipora), echinoids and coralline algae, andvolcanic grains.
Maraa Eastern Transect: Sites M0015, M0016, M0017, and M0018
The eastern transect drilled in the region of Maraa (southwest Tahiti) includes SitesM0017, M0015, M0018, and M0016 (landward to oceanward) in water depths from
17

Expedition 310 Preliminary Report
56.45 to 97.35 mbsl. Figure F7 summarizes the major lithologic units, lithology, andrecovery for all holes on the Maraa eastern transect.
Lithologic Unit I (Postglacial Sequence)
The thickness of Unit I ranges from 24 m in the deepest hole (Hole M0016B at 97.35mbsl) to 40 m in Hole M0018A. The base the unit has been recovered from 94 mbslat the inner sites to 121 mbsl at the outer sites.
This unit is primarily composed of coralgal-microbialite frameworks commonly inter-layered with loose skeletal sediments including coral and algal rubble. Coral and algalrubble are mostly composed of accumulations of fragments of corals (mostly encrust-ing Acropora and Montipora and branching Pocillopora and Porites), microbialites andmollusks, Halimeda segments, and rounded lithoclasts (e.g., skeletal sandstone rich involcanic grains). Benthic foraminifers are usually scarce. Pebbles of basalt and sand-sized volcanic grains occur locally. Skeletal sand corresponds to Halimeda sand rich infragments of corals (e.g., branching Porites) echinoids and mollusks.
The frameworks that form the bulk of Unit I include three subunits (Subunits IA–IC)displaying distinctive coral assemblages and internal structure. Corals are usuallythinly encrusted by nongeniculate coralline algae, except in Subunit IC, where thecrusts are significantly thicker (up to 2 cm thick) and include vermetid gastropods.The last stage of encrustation over coral colonies corresponds to thick microbialitecrusts dominated by massive laminated fabrics.
• Subunit IA primarily comprises locally well lithified coralgal bindstone that formsthe upper part of Unit I in all holes. In Holes M0015B and M0018A, the top of thesubunit is characterized by the occurrence of a hardground and a yellow-reddishstaining of the rock surface. The coral assemblages are dominated by encrusting(Montipora, Pavona, Porites, Leptoseris, and Leptastrea) and foliaceous coral colonies(Pachyseris). Associated corals include massive Porites and branching colonies ofPorites, Pavona, and Pocillopora (including robust branching colonies). Tabular col-onies of Acropora occur in the lower part of the subunit.
• Subunit IB is mostly composed of coralgal-microbialite frameworks in which thecoral assemblages are dominated by tabular colonies of Acropora. Associated coralsinclude encrusting colonies of Montipora (locally dominant), Porites, Leptastrea,Montastrea, and agaricids, massive colonies of Porites and Montastrea, branchingcolonies of Porites, Pocillopora, and Acropora. Robust branching colonies of Acropora
18

Expedition 310 Preliminary Report
and Pocillopora occur in the lower part of the subunit, where they are locally dom-inant.
• Subunit IC comprises coralgal-microbialite frameworks dominated by branchingcolonies of Porites. The coral assemblage associated with the branching colonies ofPorites is well diversified and includes branching colonies of Pocillopora andAcropora, robust branching colonies that are locally dominant, encrusting coloniesof Porites, Montipora, Leptastrea, Millepora, Pavona, Leptoseris, and Psammocora, andtabular colonies of Acropora.
Lithologic Unit II (Older Pleistocene Sequence)
Unit II is primarily composed of irregular alternations of yellow and gray to beigepoorly sorted skeletal limestone (grainstone to rudstone-floatstone) and coralgalframeworks with local intercalations of coral and algal rubble that display conspicu-ous alteration.
Subaerial diagenetic processes are indicated by recrystallization of coral skeletons andthe occurrence of large solution cavities that display yellow and brown to red-brownstaining. Some solution cavities are partly filled with sediments.
The grainstones, rudstones, and floatstones are rich in fragments of corals (e.g., ro-bust branching Pocillopora, branching and massive Porites, branching Acropora, andencrusting Montipora), coralline algae, echinoids and mollusks, and Halimeda seg-ments. Sand-sized volcanic grains are commonly associated with the skeletal grains.
The coralgal frameworks comprise encrusting and branching colonies of Porites, tab-ular colonies of Acropora, encrusting and massive colonies of Montipora, and encrust-ing colonies of agaricids; massive colonies of Porites occur locally.
Tiarei Inner Ridge: Site M0023
Figure F8 summarizes the major lithologic units, lithology, and recovery for all holeson the Tiarei inner ridge.
Lithologic Unit I (Postglacial Sequence)
Unit I is primarily composed of coralgal-microbialite frameworks. Manganese(?) im-pregnation and dark staining of corals is reported at the top of the unit. Basalt pebblesand volcanic grains are abundant toward the base of the unit.
19

Expedition 310 Preliminary Report
Unit I is characterized by three successive coral assemblages (Subunits IA–IC):
• Subunit IA consists of encrusting colonies of Montipora, Pavona, Porites, andacroporids, foliaceous colonies of Pachyseris associated with branching colonies ofPorites, and, to a less extent, robust branching colonies of Pocillopora.
• Subunit IB consists of massive and encrusting colonies of Porites and faviids (Lep-tastrea) and, to a less extent, branching colonies of Porites that occur locally.
• Subunit IC consists of branching and encrusting colonies of Porites associated withencrusting colonies of Millepora, Montipora, Psammocora, and Pavona, massive col-onies of Leptastrea and Porites, branching colonies of Pocillopora (including robustbranching colonies), and tabular colonies of Acropora (A. humilis?).
Lithologic Unit II (Older Pleistocene Sequence)
Unit II comprises brown algal bindstone, microbialites, and coralgal frameworks thatexhibit evidence of diagenetic alteration including the neomorphic transformationof coral skeletons and the occurrence of solution cavities. Basalt pebbles and litho-clasts occur throughout this unit.
Solution cavities present throughout this interval are filled with multigenerationalinfillings including well-lithified pale brownish limestone and poorly lithified darkbrown sandy sediments including skeletal grains.
The coral assemblage includes massive and encrusting colonies of faviids, robustbranching and tabular colonies of Acropora, encrusting colonies of agaricids, andbranching colonies of Porites.
Tiarei Outer Ridge: Sites M0009, M0021, M0024, M0025, and M0026
Figure F9 summarizes the major lithologic units, lithology, and recovery for all holeson the Tiarei outer ridge.
Lithologic Unit I (Postglacial Sequence)
On the outer ridge of Tiarei, Unit I was recovered from 82 to 122 mbsl. The thickestcontinuous sequence was recovered from Holes M0021A and M0021B, in which itsthickness reaches 29 m.
Unit I mostly comprises coralgal-microbialite frameworks that are locally interlayeredwith volcaniclastic sediments including coarse sand displaying skeletal elements (for-aminifers, Halimeda segments, fragments of mollusks, bryozoans, corals, and espe-
20

Expedition 310 Preliminary Report
cially branching Porites), rubble and sand composed mostly of coral fragments(mostly branching colonies and, to a lesser extent, tabular colonies), and skeletalpackstone to floatstone rich in Halimeda segments and coral and mollusk fragments.
The top of Unit I is characterized by widespread development of micritic microbialcrusts that display laminar and knobby morphologies. Extensive bioerosion, dark tobrown staining within the uppermost 2–3 m of the unit, and hardgrounds are fea-tures that have been locally observed.
Coralgal-microbialite frameworks are characterized by distinctive internal structureand coral assemblages. Five lithologic and coral assemblages (Subunits IA–IE) displaya general consistent trend:
• Subunit IA, the uppermost assemblage, is dominated by encrusting colonies ofMontipora, Montastrea, Leptastrea, Pavona, and Porites and encrusting foliaceous col-onies of Pachyseris and Leptoseris.
• Subunit IIA is dominated by branching and encrusting colonies of Porites and Mon-tipora; associated corals include encrusting and branching colonies of Pavona and,to a lesser extent, branching colonies of Pocillopora, tabular colonies of Acropora,and encrusting colonies of agaricids.
• Subunit IC is dominated by massive colonies of Porites; some colonies display tracesof bioerosion.
• Subunit ID is dominated by colonies of robust branching Pocillopora and encrustingcolonies of favids and encrusting and branching colonies of Montipora.
• Subunit IE, the bottommost assemblage, is composed of encrusting and massivecolonies of favids (Favia and Leptastrea) locally associated with encrusting coloniesof Montipora. Associated coral rubble comprises mostly fragments of branchingPorites, Acropora, and Pocillopora.
The development and morphologies of the microbial crusts are closely related to themorphology and size of the cavities in which they developed. In bindstone formedby encrusting coral assemblages, the microbialites are dominated by thromboliticfabrics, whereas in frameworks made of branching and massive coral colonies theydisplay greater development and are characterized by the development of compoundcrusts, up to 15 cm thick, formed by a succession of laminated and thrombolitic fab-rics, where the thrombolites usually represent the last stage of encrustation. Thethrombolites consist of closely spaced and vertically and laterally intergradationalmicritic masses that range from narrow millimeter-sized upward-radiating shrubs to
21

Expedition 310 Preliminary Report
broader dendritic clusters as high as 1 cm. Multiple generations may be closely packedand merge into micritic crusts as thick as several centimeters.
Lithologic Unit II (Older Pleistocene Sequence)
The contact between Units I and II is characterized by an irregular unconformity typ-ified by an abundance of large solution cavities partly filled with unconsolidated skel-etal and volcanic sand including coralline algal branches and Halimeda segments andcoral gravels (Pocillopora branches and fragments of Montipora colonies). Some cavi-ties are partly filled with skeletal and volcanic sands and gravels and stalagmite crusts.Several unconformities occur in the upper part of Unit II.
Unit II comprises four lithologic subunits (Subunits IIA–IID) that are locally interlay-ered:
• Subunit IIA is composed of well-lithified gray to brown coralgal frameworks withcoral assemblages dominated by encrusting colonies of Leptastrea, Pachyseris, Mon-tipora, and Psammocora, locally associated with robust branching colonies of Acro-pora and Pocillopora, tabular colonies of Acropora, and massive colonies of Poritesassociated with coral rudstone-floatstone and skeletal limestone.
• Subunit IIB comprises coral clasts, limestone clasts, basalt pebbles, and reworkedcoral colonies (Porites and robust branching Acropora).
• Subunit IIC is a sandy packstone/grainstone with coral clasts (branching Acroporaand Pocillopora) overlying a coral boundstone consisting mainly of massive Poritesand encrusting unidentified corals associated with clasts of robust branchingAcropora.
• Subunit IID is a massive weakly consolidated and cemented dark gray to brownishvolcaniclastic siltstone to sandstone that includes pieces of corals (branching Pocil-lopora and encrusting Montipora) and coralline algal crusts and skeletal fragments(tiny mollusk shells and Halimeda segments) interlayered with sandy limestoneand granule- to pebble-sized pieces of aphanitic dense basalt.
Tiarei Marginal Sites: Sites M0008, M0010, M0011, M0012, M0013, M0014, and M0022
Sequences Dominated by Volcaniclastic Sediments
Hole M0008A exhibits a 36 m thick sequence (64.15–100.05 mbsl) composed of twolithological units:
• Unit I is a black uncemented to weakly consolidated volcaniclastic sand, silt, andclay interlayered with beds comprising basalt pebbles, cobbles, and boulders.
22

Expedition 310 Preliminary Report
• Unit II is a orange, dark brown, to reddish brown volcaniclastic siltstone to sand-stone interlayered with volcaniclastic sand and silt, volcaniclastic cobble, and rub-ble.
The boundary between the two units is marked by a change from silts/sands to silt-stone/sandstone and a color change from gray to orange-brown. Coincidentally, inHole M0021B, a similar color change coincides with the Unit II/I boundary. FigureF10 summarizes the major lithologic units, lithology, and recovery for all holes of theTiarei marginal sites.
Lithologic Unit I (Postglacial Sequence)
In holes located close to the outer ridge (Holes M0010A through M0014A), Unit Icomprises three successive subunits (Subunits IA–IC) that were recovered from 78.85to 117 mbsl:
• Subunit IA was recovered only at Site M0012 from 78.85 to 107 mbsl. It is mostlycomposed of loose sediments (coral rubbles and skeletal silt and sand) locally inter-layered with volcaniclastic sand rich in skeletal grains.
• Subunit IB, recovered in an interval ranging generally from 90 to 100–105 mbsl, isdominated by volcaniclastic sediments that are locally interlayered with beds com-prising carbonate elements and coral colonies.
• Subunit IC, ranging generally from 100 to 115 mbsl, is primarily comprised of co-ralgal-microbialite frameworks interlayered with beds composed of (1) coral rubble,fragments of coralline algal crusts, and microbialites mixed with sand- to pebble-sized volcanic elements; (2) skeletal sand rich in Halimeda segments, foraminifers,and fragments of mollusks and coralline algae mixed with volcanic grains; and (3)volcaniclastic and skeletal sand and silt. The frameworks comprise two distinctivecoral assemblages:
1. The first assemblage is dominated by encrusting Montipora, agaricids, and faviidsand thin branching colonies of Porites.
2.The second assemblage consists of massive colonies of Porites and faviids locallyassociated with branching Pocillopora and Montipora.
Lithologic Unit II (Older Pleistocene Sequence)
The boundary between Units I and II is sharp. Unit II is composed mainly of well-lith-ified gray to light brown coralgal boundstone, coral rudstone, and skeletal sandylimestone, interlayered locally with horizons of gravels and rubble made of that ma-
23

Expedition 310 Preliminary Report
terial. The coral assemblage is dominated by foliaceous colonies of Pachyseris, tabularand branching colonies of Acropora, robust branching Pocillopora, encrusting andbranching colonies of Montipora, and branching and massive colonies of Porites. Mi-crobialites are abundant and include laminated and thrombolithic fabrics. The ma-trix of the limestone is rich in Halimeda segments; volcanic grains are locallyabundant. Subaerial diagenetic processes are indicated by the alteration of coral skel-etons and the occurrence of large solution cavities that are filled with volcaniclasticand skeletal sandstone and by gravels and rubble including branches of Pocilloporaand basalt pebbles at the top of the unit.
Faaa: Sites M0019 and M0020
The following description concerns Sites M0019 and M0020, which were drilled at59.9 and 83.7 mbsl, respectively. The location of the boundary between Units I andII in the two holes was defined on the basis of lithologic and diagenetic features; itoccurs at 82 m in Hole M0019A and at 92 m in Hole M0020A. Figure F11 summarizesthe major lithologic units, lithology, and recovery for all holes of the Faaa sites.
Lithologic Unit I (Postglacial Sequence)
Unit I at Sites M0019 and M0020 is 21 and 8 m thick, respectively, and displays a verysimilar composition in the two holes. It primarily comprises loose coralgal-microbi-alite frameworks (bindstone) interlayered with beds of coral rubble. The beds of coralrubble are composed of reworked and rounded fragments of corals (branching agari-cids and Porites), coralline algal crusts, and microbialites that are extensively boredand stained.
The coralgal-microbialite frameworks are dominated by encrusting colonies of Mon-tipora, agaricids (Pavona?), Acropora, Psammopora, and Echinophyllia associated locallywith massive colonies of Porites, Montastrea, Cyphastrea, and Leptastrea and encrustingcolonies of Leptoseris and fragments of robust branching colonies of Pocillopora, tab-ular colonies of Acropora, and branching Porites in addition to the coral colonies listedbefore. Microbialites consist of dark gray laminated dense and thrombolitic fabrics;the latter are usually dominant. Large cavities, partly to fully filled with skeletal sandrich in Halimeda segments (Halimeda packstone), commonly occur. Reddish brown todark staining on the surface of reef rocks is conspicuous in some cores.
24
Expedition 310 Preliminary Report
Lithologic Unit II (Older Pleistocene Sequence)
Unit II at Sites M0019 and M0020 is 43 and 33 m thick, respectively, and displays adistinctive composition in the two holes. The coralgal-microbialite frameworks in thebulk of this unit are characterized by the widespread development of microbialites.
In Hole M0019A, Unit II includes three subunits (Subunits IIA–IIC), characterized bytheir distinctive lithology and composition and separated by unconformities at 106.2and 121.12 mbsl, respectively:
• Subunit IIA is 24 m thick and comprises irregular alternations of beige coralgal andskeletal limestone bearing in situ coral colonies and beds of coral rubble. The coralassemblages forming the coralgal frameworks consist of massive colonies of Porites,branching and encrusting colonies of Porites, and, to a lesser extent, encrusting col-onies of agaricids, Montipora and Millepora, massive colonies of Leptastrea and Mon-tastrea, and tabular colonies of Acropora. Fragments of branching colonies ofPocillopora occasionally occur. The skeletal limestone consists of a well-lithifiedrudstone including subrounded coral fragments (branching and massive Porites, ro-bust branching Pocillopora, and tabular Acropora) often encrusted by coralline algaeand locally surrounded by cement fringes. Other skeletal grains include Halimedasegments and fragments of echinoids, coralline algae, and mollusks.
• Subunit IIB is 15 m thick and comprises yellowish brown skeletal floatstone tograinstone including rhodoliths, foraminifers, and fragments of corals (branchingand encrusting Porites, robust branching Pocillopora, and tabular Acropora) and cor-alline algae, echinoids, and mollusks; sand-sized volcanic grains occur in the lowerpart of the subunit and their abundance increases downhole.
• Subunit IIC is 11 m thick and comprises irregular alternations of coralgal frame-works, skeletal limestone, and rubble beds. The coralgal frameworks are dominatedby tabular colonies of Acropora, massive colonies of Porites (e.g., Cores 310-M0019A-27R and 28R), encrusting colonies of Porites and Montipora, and robustbranching colonies of Acropora. The skeletal limestone consists of a very poorlysorted rudstone rich in large coral fragments (tabular Acropora, robust branchingPocillopora, branching Porites, and encrusting agaricids), rhodoliths, Halimeda seg-ments and fragments of coralline algal crusts, mollusks, and echinoids.
In Hole M0020A, Unit II is primarily composed of coralgal frameworks locally inter-layered with skeletal limestone and rubble beds. The coralgal frameworks are domi-nated by branching and encrusting Porites, locally associated with encrustingMontipora and Pavona, and robust branching colonies of Pocillopora. The interlayered
25

Expedition 310 Preliminary Report
skeletal limestone consists of Halimeda wackestone and poorly sorted coral rudstoneincluding fragments of branching and encrusting Porites, robust branching Pocilloporaand Acropora, and encrusting Montipora. Other skeletal grains include Halimeda seg-ments and fragments of mollusks and echinoids; volcanic silt to sand grains are lo-cally abundant.
Physical Properties
Carbonates are major constituents of the sedimentary rock record. Because coralgalreefs develop in shallow water, they are interesting systems to study. These kinds ofsedimentary systems are most sensitive to climate and sea level fluctuations but alsohave great aquifer and reservoir potential. From a rock physics point of view, Expedi-tion 310 was particularly interesting because it provided the unique opportunity to(petro)physically quantify modern reef development before pronounced overprint-ing by diagenetic processes (including mechanical compaction), which usually re-sults in irresolvable complexities as very often encountered in aquifer and reservoircharacterization.
A crossplot of velocity versus porosity for all sites shows a negative inverse relation-ship (Fig. F12) between acoustic velocity (VP) and porosity. Instead of showing indi-vidual data points for the bulky multisensor core logger (MSCL) data (15,191 datapoints), data density was contoured. MSCL data were acquired cross core (over ~6.5cm), whereas core plugs were never longer than 3 cm and could only be drilled in ap-propriate core sections. The scale dependency of petrophysical measurements, alongwith the (inevitable) difference in “selective” sampling of core as opposed to bulkMSCL measurements is beautifully illustrated in Fig. F12: for a given porosity value,discrete measurements have higher VP values than MSCL measurements. Further-more, in the comparison of velocity modeled using widely used velocity models andthe real data, the modified (to improve relationships observed in larger-scale investi-gation of downhole wireline logging data) Raymer time average equation (Raymer etal., 1980) gives the best fit (smallest error) with MSCL data, whereas the Wyllie equa-tion (Wyllie et al., 1958) shows the best fit for discrete samples. However, the differ-ence between both velocity transforms and the real data points is still high. On thehigh end of the range in velocity for a given porosity, these differences can be inter-preted as the added effect of pore characteristics like pore shape and connectivity andtextural properties of the (overall coralgal) framework. The differences on the low endof the range in velocity for a given porosity may very well originate from lack of burialcompaction and/or pronounced diagenesis.
26

Expedition 310 Preliminary Report
Downhole Logging
Downhole geophysical logs provide continuous information on physical, chemical,textural, and structural properties of geological formations penetrated by a borehole.In intervals of low or disturbed core recovery, downhole geophysical logs provide theonly way to characterize the borehole section. This is especially true when recoveryis poor and when comparable measurements or observations are obtained from core,as downhole geophysical logging allows precise depth positioning of core pieces byvisual (borehole images) or petrophysical correlation.
Borehole Geophysical Instruments
The set of borehole geophysical instruments utilized during Expedition 310 was con-strained by the scientific objectives and the geological setting of the expedition. Asuite of downhole geophysical methods was chosen to obtain high-resolution imagesof the borehole wall, to characterize the fluid nature in the borehole, to measure bore-hole size, and to measure or derive petrophysical or geochemical properties of the for-mation such as porosity, electrical resistivity, acoustic velocities, and natural gammaradioactivity. Because of environmental constraints, no nuclear tools were deployedduring Expedition 310.
The slimline suite comprised the following tools:
• Optical Borehole Televiewer (OBI 40) produces a millimeter-scale, high-resolutionimage of the borehole wall, similar to a subsurface endoscope.
• Acoustic Borehole Televiewer (ABI 40) produces millimeter-scale, high-resolutionimages of the borehole surface using acoustic pulse and echo techniques.
• Hydrogeological probe (IDRONAUT) measures hydrogeological properties of theborehole fluid only.
• Spectral Natural Gamma Probe (ASGR) allows identification of the individual ele-ments that emit gamma rays (potassium, uranium, and thorium).
• Induction Resistivity Probe (DIL 45) provides measurements of electrical conduc-tivity. The output of the tool comprises two logs: ILM (induction electrical conduc-tivity of medium investigation depth, 0.57 m) and ILD (induction electricalconductivity of greater investigation depth, 0.83 m). The measured conductivity isfinally converted into electrical resistivity.
27

Expedition 310 Preliminary Report
• Full Waveform Sonic Probe (SONIC). The 2PSA-1000 sonic probe measures com-pressional wave velocities of the formation. In addition, analysis of surface wavesin the borehole (i.e., Stoneley waves) can be indicative of formation permeability.
• Caliper Probe (CAL). The 2PCA-100 is a three-arm (mechanical) caliper tool thatmeasures the borehole diameter.
A total of 10 boreholes were prepared for downhole geophysical measurements. Allmeasurements were performed under open borehole conditions (no casing) with theexception of a few of spectral gamma ray logs. After completion of coring, the drillstring was pulled and the coring bit was changed for an open shoe casing to provideborehole stability in unstable sections and a smooth exit and entry of logging tools.In addition, a wiper trip was performed with fresh seawater (no drilling mud wasused). Borehole conditions were extremely hostile, and very often the boreholes hadto be logged in intervals where the HQ drill string was used as temporary casing, re-sulting in a nominally 100 mm diameter borehole. In order to record ultra-high-res-olution geophysical downhole logging data, the acquisition was done in the roosterbox, which, in the used piggy-back drilling system, is heave-compensated. Because ofthese difficult borehole conditions and time constraints it was not possible to log alltools in every borehole.
Preliminary Results
Wireline logging operations at the Tiarei sites produced nearly complete downholecoverage of lithologic Unit I from 72 to 122 m below present-day sea level (Fig. F13).Because of very hostile borehole conditions around the Unit II/I boundary, it was notpossible to image this boundary properly, with the exception of Hole M0023B.
The measured geophysical parameters, including optical and acoustic borehole wallimages, provided the only source of continuous information of the drilled sequencesduring Expedition 310. Furthermore, by “unrolling” the images of the borehole wall(360˚), into a two-dimensional view, a cross section ~31 cm is obtained as comparedto a 6.54 cm cross section of a split core obtained by HQ-diameter drill bit. It wastherefore possible to identify a typical stacking of lithofacies from the continuousdownhole geophysical logs. A typical stacking of facies is grouped into a subsequence.
A subsequence consists of three lithofacies: a basal lithofacies, middle lithofacies, andan uppermost lithofacies:
28

Expedition 310 Preliminary Report
• The basal lithofacies of a typical subsequence consists of fragments of branchingcoral colonies in a sandy/muddy matrix at proximal locations, has elevated valuesin natural radioactivity, low electrical resistivity values, and lowest acoustic veloc-ities. At distal locations, this facies is characterized by extremely open coral frame-work or medium-sized cavities.
• The middle lithofacies of a subsequence consists of branching coral colonies (Fig.F13) in which framework density usually increases toward the top. It is character-ized by upsection decreases in natural radioactivity and increases in electrical resis-tivity and acoustic velocities.
• The uppermost lithofacies of a typical subsequence consists of foliaceous to tabularand encrusting coral species and minor massive corals (Porites). It is characterizedby intermediate to lower acoustic velocities, decreasing resistivity values upsection,and increasing natural radioactivity values.
In Figure F13, borehole images and natural radioactivity logs (total counts only) areplotted in meters below present-day sea level. In each of the logged boreholes, theboundary between lithologic Unit II and Unit I is indicated. In the Tiarei transect, thebasal unit directly overlying the above-mentioned boundary consists of a semicon-solidated rubble interval having elevated natural gamma radioactivity values in prox-imal locations. Distal locations do not show this higher gamma ray signature and,although poorly recovered in downhole logging data, it usually consists of very openframework branching corals that are heavily encrusted.
In Figure F14, borehole images and formation electrical resistivity (resistivity) areplotted in meters below present-day sea level. At this larger scale of observation andby correlating the boreholes from the outer ridge to the inner ridge, it becomes clearthat, although evolved on a relatively steep and irregular paleomorphology, the gen-eral resistivity pattern and absolute values of lithologic Unit I along this transect areessentially the same and comparable. In each borehole the basal interval has lowestresistivity values, values increase gradually to a maximum value, after which a moresharp negative excursion to lower values can be observed. The interval of increasingresistivity values is interrupted by a subtle but clear decrease in the middle of litho-logic Unit I. The absolute values of this decrease are higher in distal boreholes thanin the proximal boreholes.
Wireline logging operations at the Maraa sites produced nearly complete downholecoverage of lithologic Unit I from 102 to 41.65 m below present-day sea level (Fig.F15). Very hostile borehole conditions are caused by open framework coral morphol-
29
Expedition 310 Preliminary Report
ogies and relatively soft microbialite encrusting along and over coral colonies. Over-all, acoustic reflectivity values in the ABI-40 image logs are lower than those at Tiarei.These conditions did not allow image “recovery” as high as that for the Tiarei transectand, similar to Tiarei, the boundary between lithologic Units I and II could not be im-aged. Spectral gamma ray logs through the steel casing do, however, indicate signifi-cant count increases in lithologic Unit II. In Figure F15, borehole images, naturalradioactivity logs (total counts only), and electrical resistivity logs are plotted inmeters below present-day sea level. In each of the logged boreholes, the boundary be-tween lithologic Units I and II is indicated. The depth below present-day sea level ofthe Pleistocene boundary depends on paleoseafloor morphology at the time of theLGM. Although the quality and meters covered in imaging lithologic Unit I is less atMaraa than at Tiarei, a similar stacking of lithofacies can be identified.
Microbiology
Drill core samples from Tahiti reefal environments were analyzed for evidence of mi-crobial activity, possibly related to formation of microbialites. To date, onboard mea-surements have shown a certain degree of microbial activity, directly attached tomineral surfaces, which could be involved in microbialite formation. According tothe activity measurements along the drill cores, the uppermost part, 0–4 meters belowseafloor (mbsf) of the Tahiti reef environment, is the most active zone. This is a com-mon trend in reef environments due the closeness to the photic zone inhabited byprimary producing eukaryotes, such as algae. Pure microbiological activity was onlyobserved in reef cavities where prokaryotic biofilms have appropriate conditions todevelop (Figs. F16, F17).
Preliminary results show that the biofilms are diverse in structure and color. FigureF16 shows an association between a brown iron/manganese crust and biofilm,whereas Figure F17 shows an unusual a blue biofilm, which exhibited the highest de-gree of adenosine triphosphate (ATP) activity (20’600 RLU [relative light units]). Inthis sample, it was possible to define spherical assemblies of carbonate minerals em-bedded in the microbial exopolymeric substances (EPS). Figure F18 shows 4,6-dia-mindino-2-phenylindole (DAPI)-stained cells in high densities in this biofilm inconjunction with mineral precipitation, which is most probably carbonate.
The biofilms appear to have high diversity in macroscale observations, and they areequally diverse and heterogenic in microscale resolution, as observed by scanningelectron microscopy (SEM). Carbonate minerals appear in close relation with claylike
30

Expedition 310 Preliminary Report
minerals (Fig. F19; Hole M0007C), carbonaceous microfossils (Fig. F20; HoleM0015B), and oxidized and reduced Fe minerals such as pyrite (Fig. F21; HoleM0023A). The metabolic processes responsible for the precipitation of this variety ofminerals could not, as yet, be defined because of the complex and diverse conditionsof the microenvironments where these biofilm were found.
Some evidence for heterotrophic metabolic activities is shown by exoenzyme mea-surements, which vary in the different biofilm samples. For instance, the samplesfrom Holes M0020A (4.51 mbsf) and M0009D (3.64 mbsf) showed high phosphotaseactivity, suggesting a heterotrophic community that preferentially degrades organicbound phosphate compounds such as phospholipids or nucleic acids. In contrast,Hole M0007B (6.28 mbsf) showed only glucosidase and aminopeptidase activity,which is evidence for degradation and metabolization of polysaccharides and pro-teins.
Isolation of microorganisms from biofilm samples was performed on agar plates usinga medium that is selective for heterotrophic bacteria. After 2 weeks incubation time,10 different heterotrophic colonies could be isolated (Fig. F22). From anaerobic ex-periments, only one isolation was successful. Distinct groups of microorganisms areassociated in the biofilm that could range from aerobic to anaerobic metabolism. SEMinvestigation of microbialite samples shows evidence that anaerobic conditions musthave prevailed at times. The occurrence of framboidal pyrite well distributed in thesediment supports a certain degree of anoxia in the environment. Some sedimentsamples also show a close spatial association between the mineral phase and microbes(e.g., Figs. F20, F23).
As a biogeographical summary of microbial activity in the Tahiti reef, northwesternFaaa Hole M0020A and southwestern Maraa Holes M0005C, M0007B, M0007C,M0015B, and M0018A were more active than the northeastern Tiarei sites, where of-ten no living biofilm could be detected in cavities along the core.
Geochemistry
Most importantly, interstitial water (IW) data from Expedition 310 demonstrate theability to obtain geochemical signals (significant deviations from seawater chemistry)from fossil reef material. Rhizon sampling enabled IW samples to be taken where tra-ditional whole-round squeezing was not possible and undesirable. For these reasonsalone, the IW results from Expedition 310 are successful. The IW data indicate that
31

Expedition 310 Preliminary Report
no significant contamination resulted from using seawater as the drilling fluidthrough the lack of ubiquitous metallic enrichments compared to Tahitian seawater.However, storage of samples in sealed glass vials following IODP tradition resulted inserious B and Si contamination of the samples upon opening of the vials. In the fu-ture, acid cleaned plastic bottles should be used to store IW samples.
General Remarks about Site M0008 Interstitial Water Data
Hole M0008A was drilled much more proximal to the island of Tahiti than any othersites and recovered volcanoclastic sediments. This made Hole M0008A unique com-pared to the other holes and offered opportunities to sample and analyze pore waters.In all the IW profiles, a barrier to diffusion is evident at ~18 mbsf, which correspondsto the position of a large basalt boulder recovered in Section 310-M0008A-8R-1. Thelack of a chilled margin at the top and bottom of this basalt suggests it is not a con-tinuous layer of basalt providing an impervious layer. However, the seismic profileused for site selection indicates a strong continuous reflector at approximately thesame depth, suggesting the basalt may represent a continuous layer. Ultimately, withno recovery of Core 310-M0008A-7R above the basalt, the nature of the diffusion bar-rier will remain uncertain.
pH, Alkalinity, Ammonia, Chloride, and Sulfate
Above ~18 mbsf the pH of IW samples is similar to ambient seawater, but below thediffusion barrier pH decreases sharply with depth until the pore waters are slightlyacidic (Fig. F24A). The IW alkalinity profile essentially traces that of pH (Fig. F24B).This increase in free H+ ions results in an undersaturation of aragonite and calcite ascalculated using PHREEQC (Parkhurst and Appelo, 1999) and shown in Figure F24A.Just below ~18 mbsf, significant amounts of ammonia are detected (Fig. F24C) indi-cating microbial activity. The ammonia appears to diffuse downward from this sourcejust below the diffusion barrier. Chloride in the pore waters is essentially similar sea-water with a slight depletion at the bottom of the section, precluding the influenceof significant amounts of freshwater in these sediments. Sulfate concentrations donot significantly deviate from seawater values at any depth.
Mg, K, Ca, and Sr
There is no significant deviation of IW Mg concentration from that of seawater,whereas K becomes depleted with depth below the diffusion barrier at ~18 mbsf (Fig.F24D). Both Ca and Sr concentrations become highly elevated with depth below the
32
Expedition 310 Preliminary Report
diffusion barrier (Fig. F24E, F24F), indicating dissolution of carbonate debris and/orweathering of the silicate material. The calculated undersaturation of calcite and ara-gonite in these pore waters suggests that carbonate dissolution must be contributingto these enrichments.
Li, P, Mn, Fe, and Ba
Li is depleted from seawater value (~174 µg/L) at all depths in Hole M0008A, suggest-ing Li uptake by clays in the siliclastic sediments (e.g., Zhang et al., 1998). P displayslittle variability with depth. Enrichment of the pore waters in Mn is observed in allsamples from Hole M0008A, but there is an important source at ~20 mbsf below thediffusion barrier (Fig. F24G). Fe is greatly elevated in the IW samples from above thediffusion barrier at ~18 mbsf but was below detection in the samples from below thediffusion barrier (Fig. F24H). This pattern is interesting because conventional wis-dom suggests that Mn oxide reduction occurs above the zone of Fe oxide reductionin marine sediments (e.g., Berner, 1980). One possible explanation for this pattern isthat most Fe has already been lost from the older sediments below the diffusion bar-rier. However, iron oxide–rich sediments containing small root fragments indicativeof a laterite soil were recovered in this interval of Fe-free pore waters. It is very inter-esting that Mn can be mobile in these sediments below the diffusion barrier and Fe isnot. Ba is highly enriched in the pore waters below the diffusion barrier at ~18 mbsf,leading to a calculated barite oversaturation.
X-Ray Fluorescence
Five samples of volcanic sand/silt units and nine individual basalt samples were se-lected for bulk rock analysis by energy dispersive polarized X-ray fluorescence (EDP-XRF) analysis. All the samples analyzed by this technique were taken from HoleM0008A. Analytical results are shown in Table T3. The low SiO2 but fairly high K2O,P2O5, and TiO2 contents (Na2O was not analyzed) suggest that the volcanic rock sam-ples belong to the alkalic basalt clan (i.e., alkalic basalt, basanite, tephrite, and nephe-linite). The two texturally similar samples that apparently come from a single bouldershow many compositional similarities, but they also have differences, especially withrespect to MgO contents. The differences may be due to flow differentiation, whichis known to create compositional variation within a lava flow, or to instrumental er-ror. Two samples are fairly primitive (>14.0 wt% MgO and >350 ppm Ni), but one ishighly olivine-pyroxene phyric, and thus its composition may have been compro-mised by crystal accumulation of the olivine and pyroxene. Despite their small num-ber, the rock samples apparently show downhole compositional variation (Fig. F25).
33

Expedition 310 Preliminary Report
Samples from the upper part of the hole have slightly higher incompatible elementcontents (e.g., K and Rb) but lower SiO2 than those from the lower part of the hole,indicating that the shallow basalt samples are compositionally more alkalic than thedeeper samples.
The volcaniclastic sand/silt samples are compositionally different from the wholerock basalt samples in that they have lower SiO2 contents, which translates to lowertotal weight percent of all major oxides, obviously due to higher volatile contents,mainly seawater, as evidenced by their high Cl contents. Sulfur is also high in thesand/silt samples, particularly in the upper samples. The only rock sample that is highin both S and Cl is a scoriaceous pebble that probably contains a lot of pore water.Nevertheless, the upper sand/silt samples show many compositional similarities withthe basalts, but the lower samples do not. The upper and lower sand/silt samplesshow apparent compositional differences (Fig. F26). Downhole compositional varia-tions are observed in pore water chemistry, and thus the compositional differencesbetween the upper and lower sand/silt units are probably real. Unlike the downholecompositional variation of the basalts, the sand/silt compositional differences aremost probably due to differences in the depositional environment between the upperand lower volcanic sand/silt units.
Both Tahiti-Nui and Tahiti-Iti are composed predominantly of lava flows of moder-ately alkalic to strongly alkalic basalts; plutonic rocks are subordinate in amount andonly exposed near their eroded centers (e.g., McBirney and Aoki, 1968; Cheng et al.,1993; Duncan et al., 1994). Differentiated rocks occur in subordinate amounts andwere erupted mostly in the waning stages of volcanic activity. Thus, the lithologiccomposition of the volcaniclastic sediments drilled during Expedition 310, particu-larly the preponderance of lithic basalt clasts, unsurprisingly, is a direct reflection ofthe geology of the island. Compositionally, the rock samples and two upper sand/siltunits plot with the rest of the igneous samples from Tahiti (Fig. F27). The two prim-itive basalts plot with the relatively fewer high-MgO basalts from Tahiti, whereas theother basalt samples plot with the more abundant, lower-MgO basalts. Many of thelower-MgO basalts in Tahiti can be modeled as crystal fractionation daughters of thehigher-MgO parents (e.g., Cheng et al., 1993; Duncan et al., 1994). The two uppervolcaniclastic sand/silt samples plot between the two basalt groups, either becausetheir lithic basalt components are less fractionated than the lower-MgO basalts orthey are similar to the latter but contain additional pyroxene mineral components.The three lower sand/silt samples generally plot outside the Tahiti lava field, suggest-ing that their compositions have been modified or altered.
34

Expedition 310 Preliminary Report
PRELIMINARY SCIENTIFIC ASSESSMENT
During the Expedition 310 Onshore Science Party, emphasis was placed on visual de-scription, measurement of physical properties, and sampling of the cores. Thus, theExpedition Report, scheduled to be published in March 2007, will contain a descrip-tive framework for the subsequent postcruise research.
The primary objectives of Expedition 310 require the use of specialized geochemicaltechniques, paleomagnetic analyses, and detailed investigation of lithological and bi-ological assemblages. These types of analyses were not conducted during the OnshoreScience Party but will be conducted over the coming months at the institutions of theExpedition Scientists as part of their postcruise research.
Fulfillment of the Expedition 310 scientific objectives is as follows:
1. Establish the course of postglacial sea level rise at Tahiti (i.e., define the exact shape of the deglaciation curve for the period 20.00—10.00 ka.
During the offshore phase, cores were recovered from the postglacial reef sequencefrom 40 to 121 m below current sea level. Therefore, most if not all of the postglacialsequence from the LGM to the present day was recovered. During the Onshore Sci-ence Party, high-quality coral samples were taken for dating and sea level change in-vestigations, the results of which are expected to fulfill the first objective.
2. Define SST variations for the region over the period 20.00—10.00 ka.
During the offshore phase, massive coral colonies suitable for paleoclimate studiesand spanning most of the postglacial sequence were recovered in the cores. Duringthe Onshore Science Party, these massive coral colonies were slab-sampled for paleo-climate studies, the results of which are expected to fulfil the second objective.
3. Analyze the impact of sea level changes on reef growth and geometry.
During the offshore phase, cores were recovered from holes in various water depthsand situated on transects in three different areas around Tahiti. Therefore, results ofanalyses of samples taken during the Onshore Science Party will be interpreted inbroad temporal and spacial contexts, which will allow better understanding of the de-velopment of the Tahiti reef.
35

Expedition 310 Preliminary Report
OPERATIONS
Mobilization of the Hunter
Tampa, Florida
Mobilization of the drilling platform Hunter took place in two stages: the first stagewas in Tampa, Florida (28 August–5 September 2005) and the second stage during theport call in Papeete, Tahiti (5–6 October 2005).
The first mobilization stage involved shipping of contractor drilling equipment andESO laboratory and ancillary equipment to Tampa from Europe. After all the equip-ment had arrived and cleared customs, the vessel came on charter and was convertedinto a drilling vessel in just over 6 days. The Tampa Bay Shipyard Company providedport services, welders, and crane drivers. Seacore engineers carried out all engineeringwork, rig building, and certified the load testing of key structures. During the periodof rig construction, ESO staff from the British Geological Survey (BGS) unloadedequipment from containers, set up a shipboard computer network, and connectedpower and water services to laboratories. They also made safe the walkways and coreinspection areas on board with the drilling contractor. The ESO Operations Superin-tendent was also responsible for overseeing the entire load testing of key structuralcomponents of the rig. Verification of these milestone points was required to triggercontract stage payments. During this period of mobilization, we were pleased to re-ceive a visit from Dr. Manik Talwani, President of IODP Management InternationalInc. (IODP-MI) and Dr. Jamie Allan of the U.S. National Science Foundation.
Transit to Papeete, Tahiti, with Brief Port Call in Panama
Mobilization work continued on passage to Panama (5–13 September 2005), whereESO personnel disembarked. Some Seacore personnel continued on the passage to Ta-hiti, completing mobilization activities en route (13 September–5 October).
Port Call in Papeete, Tahiti
The second stage of mobilization took place on 5–6 October 2005 during the port callin Papeete. Some air freight items for the expedition were taken on board during theport call; winches for logging and some equipment for the microbiology laboratorywere loaded on deck. For this stage of mobilization, the complete ESO team was avail-able. All laboratories and office spaces were networked with computers, the Drilling
36

Expedition 310 Preliminary Report
Information System (DIS) database system was set up, onboard equipment was laidout, and a satellite-based e-mail system was installed.
At 0900 h on 6 October, the Expedition 310 Scientists joined the Hunter. A visit to theHunter was arranged for local schoolchildren and the press for 1 h in the morning. By1830 h, mobilization was complete and the vessel commenced day rate operations.The Hunter departed for the first site at 1930 h on 6 October, after spending 36 h inport.
Transit to Site M0005, Maraa
The Hunter arrived at Site M0005 at 2330 h on 6 October 2005 and immediately con-ducted dynamic positioning calibration tests ~250 m south of the first hole, M0005A.By 0250 h on 7 October, the vessel was positioned above Hole M0005A.
Site M0005
Hole M0005A
After overcoming problems with a hydraulic ram which caused the moonpool doorsto fail to open, Seacore’s Drilling and Reentry Template (DART) was deployed onAmerican Petroleum Institute (API) drill string (used as conductor pipe for this expe-dition) to just above the seabed. From 1335 h on 6 October, a seabed survey aroundthe position of the first site was conducted using the downpipe underwater camera.A suitable site was located ~2 m from the planned position, and the DART was placedon the seabed with 8 tonnes of weight. After removing the camera, the HQ (piggy-back) drill string was run through the API conductor to the seabed, and coring oper-ations in Hole M0005A commenced. The first core arrived on deck at 2000 h.Thereafter, coring continued with difficult barrel latching, and short core runs wereused to avoid drilling rather than coring until the best coring parameters were estab-lished. The first cores displayed large cavities, and recovery was poor. Core barrel jamsand problems with blocked bit–related mislatching led to slow progress in this hole.When reentering the hole after one particular drill string trip to remove a core block-age from the bit, coring appeared to recommence at 10.4 m. Good core was obtained,and it appeared that the borehole may have been restarted in a deviation or hadavoided a previous deviation. This was taken as the start of a new hole, M0005B, at1840 h on the 8 October.
37

Expedition 310 Preliminary Report
Hole M0005B
At 0140 h on 9 October 2005 at 20 m depth, the core barrel failed to latch in. A re-placement barrel also failed to latch. The hole was verified clear by the chisel tool. Itwas suspected that the HQ pipe was bent, and the string was tripped. On deck, thethird and second pipe stands (four joints) of the HQ drill string were bent. The deci-sion was made by all to terminate Hole M0005B, not to log, and make modificationsto the DART before continuing with a new hole. The downpipe camera was prepared,and an environmental impact inspection of the coring area was carried out by raisingthe DART from the seabed and lowering the camera through the DART. There was dif-ficulty in identifying the drilling area due to minimal impact of the DART on the sea-bed. The camera was recovered and the inspection was completed by 0615 h on 9October.
Starting at 0615 h on 9 October, the API string was tripped and the DART was broughton deck and secured above moonpool. The vessel departed Site M0005 and headedfor a nearby sheltered bay to carry out work on the DART. The DART feet were re-moved and a stinger was installed. The vessel departed the sheltered bay and was backat Site M0005 by 1330 h.
Hole M0005C
The Hunter took position above Hole M0005C, ~10 m east-southeast alongslope fromHoles M0005A and M0005B, and was ready for operations by 1510 h on 9 October2005. When lowering the DART on the API string, a burst hydraulic union on the righydraulics caused an operational shutdown until the oil spill on the deck was con-tained and repairs were made. At 1835 h, the downpipe underwater camera was de-ployed for a predrilling site check, and the stinger was engaged with the seabed undercamera observation. The DART was drilled 1.3 m into seabed and stabilized ready forthe coring string. The HQ coring string was run at 2000 h, and coring operations com-menced in Hole M0005C. At 0545 h on 10 October, sand in the drill string caused thecore barrel to jam and the string had to be tripped to free it. At 1110 h, the vessel re-quested a heading change, which was carried out with the HQ string off bottom butstill in the hole. After the heading change, the core barrel was unable to be run intothe HQ string and it was observed that the API pipe was not central in moonpool. TheHQ string was tripped, and nine stands were removed with bends. A problem withthe dynamic positioning system analyzed and resolved before resetting the DP to av-erage the previous drilling position. At that position, the downpipe camera was runat 1515 h to see if the HQ hole was still in the stinger. No HQ hole was apparent, but
38

Expedition 310 Preliminary Report
the decision was made to trip the HQ string with an insert bit and drill down to theprevious depth. Reentry into the earlier borehole was not confirmed, even though thetemplate had not moved, so a new hole (Hole M0005D) was started.
Hole M0005D
Coring commenced in Hole M0005D at 2330 h on 10 October 2005. Coring wassteady and recovery moderate to good throughout the day on 11 October. At 0510 hon 12 October, the decision was made to stop coring in Hole M0005D after reaching102 mbsf and without reaching the basaltic basement. The HQ string was pulled andthe logging tools were prepared.
At 0750 h on 12 October, the DIL45 (electrical resistivity) tool was lowered but gotstuck just below the seabed. It was suspected that the top of the hole was unstable,within a zone of low recovery noted while drilling. The top 5 m of the hole was casedwith HQ pipe. The DIL45 tool was lowered but was still unable to enter the hole fromthe pipe. The HQ pipe was run all the way to the base of the hole, a spectral gammalog was run inside the HQ pipe, and then, after ensuring that the pipe was free fromobstruction, the HQ pipe was pulled back in 25 m increments and logging was con-ducted in the open hole below the pipe.
Logging operations in Hole M0005D continued with excellent logs being obtaineduntil the hole finally collapsed after pulling back the HQ pipe to 17 m below the sea-bed. The logging tools were in danger of becoming stuck in the top-hole section andwere retrieved. After a heading change, the remaining HQ pipe was pulled, the DARTwas lifted, and operations in Hole M0005D ceased at 1310 h on 13 October. A post-drilling seabed survey using the downpipe camera was conducted before leaving thehole.
Hole M0005E
Before departing Site M0005, four hammer samples were taken in Hole M0005E (~5m alongslope from Hole M0005D in 61.34 m water depth). Four samples were takento a depth of 2 m below seabed, with typically 80% recovery. After curation, thesesamples were handed to the microbiologists to sample at will, before the remainderwas passed to the sedimentologists and coral specialists for description. Operations inHole M0005E were concluded by 1635 h on 13 October 2005. Before progressing tothe next site, the Hunter conducted a 360˚ maneuver to verify that positioning offsetsat the drill string were zero.
39
Expedition 310 Preliminary Report
Site M0006
A move to deeper water (~80 m) was undertaken, and the Hunter was repositionedabove Hole M0006A in 81.58 m water depth. Another four hammer samples were col-lected, primarily for microbiology, before the drill string was lowered onto what ap-peared to be a very steep slope. Both the ship’s transponder and tautwire indicatedthat they were sliding downslope and suggested that the bathymetric data were in-sufficient to allow a reasonable picture of the seabed. Any slope instability may haveled to the DART sliding away downslope, and the decision was made to avoid theouter reef edge until either more seabed information was obtained or modificationswere made to the DART to allow greater stability on steep slopes. Site M0006 was de-parted at 2300 h on 13 October 2005.
Site M0007
Hole M0007A
Hole M0007A was located farther back from the reef edge than Sites M0005 andM0006, in 44.45 m water depth. The seabed was surveyed using the downpipe cam-era, and at 0330 h on 14 October 2005, four hammer samples were taken. After ham-mer sampling, the HQ string was run and rotary coring commenced in the same hole.Coring continued with good recovery for the rest of the day. Total depth (TD; 44.4 m)was reached at 0120 h on 15 October.
Prior to tripping the HQ pipe, the gamma tool was run inside the pipe. Logging resultsfrom Hole M0005D indicated that the shape of the gamma trace through the pipe,when scaled accordingly, did not differ significantly when compared to the open holetrace, although statistically the results are less useful. After gamma logging, the HQpipe was tripped, the core barrel removed, and the string rerun with a casing shoe to7.5 m below seabed. Open hole logging commenced from TD to the casing shoe. Afterrunning the resistivity and hydrochemical tools in the open hole section, the acous-tic imaging tool would not progress much beyond the casing shoe, despite being runwith a sinker bar. Logging was terminated in Hole M0007A at 0700 h on 15 October.
Hole M0007B
After a postdrilling seabed survey using the downpipe camera, the Hunter moved 50m alongslope to Hole M0007B. Two hammer samples were collected before rotarycoring commenced in the same hole. Core recovery was poor in the top part of the
40

Expedition 310 Preliminary Report
hole, and the coring parameters were checked for any changes that may have beenresponsible. Zero bit weight and high rates of penetration confirmed that an openstructure was being drilled. The formation became more compact with depth, and re-covery improved accordingly. Coring continued until 0630 h on 16 October 2005.
The HQ pipe was tripped and a casing shoe fitted before the pipe was rerun to the baseof the hole for in-pipe gamma logging. After gamma logging, the HQ pipe was pulledto 24.6 m below seabed, and resistivity, hydrochemical, acoustic imaging, and opticalimaging tools were run. It was not possible to log the entire bottom-hole section dueto hole blockage (below 30 m below seabed). Logging in Hole M0007B was completedby 1410 h on 16 October. The remainder of the HQ pipe was pulled, and a seabed sur-vey using the downpipe camera was conducted. The survey showed that the DARThad been drilled well into the seabed (1.5 m) and had left a shallow debris-filled de-pression. However, the surrounding seabed showed minimal disturbance from thedrilling. The DART was then lifted onto the deck through the moonpool and secured.
Transit from Site M0007 (Maraa) to Site M0008 (Tiarei)
At 1700 h on 16 October 2005, the vessel departed Site M0007 and headed for SiteM0008, located on transect TAH-02A off the northeast coast of Tahiti, arriving at 2400h.
Site M0008
Shortly after arrival at 2400 h, a seabed survey using the downpipe camera was con-ducted. At 0400 h on 17 October 2005, coring operations began in Hole M0008A.This hole was to serve as a reference hole for the other holes on the transect. However,the material recovered consisted of river deposits of unconsolidated basalt gravel andpebbles mixed with volcaniclastic sediments. As a result, recovery was poor through-out (24.5%). TD was reached at 40.2 m below seabed, and operations ended in HoleM0008A at 1720 h on 17 October.
Site M0009
Hole M0009A
An assessment was made of where to drill next, in light of the results obtained in HoleM0008A. It was decided to attempt to drill the pinnacle at proposed Site TAH-02A, #4on seismic Profile SISM 079. Acknowledging that the feature imaged on the seismic
41
Expedition 310 Preliminary Report
line may be the result of sideswipe and may possibly be located off the seismic line,a localized search was made for a suitable drilling location using the ship’s echosounder and the tautwire to detect a shallower than expected water depth. No suit-able position was located, and at 2100 h on 17 October 2005, the vessel was posi-tioned above a flat terrace (Hole M0009A) nearby and drilling operations commencedand continued until 1915 h on 18 October. Recovery was moderate to poor (43.1%)to TD of 23.04 m below seabed. However, promising coral material was recovered andit was decided to attempt to recover the same section in a new hole nearby. By 2000h, the HQ pipe had been recovered and the DART lifted off the seabed, and by 2015h the vessel was positioned above Hole M0009B, ~5 m downslope from HoleM0009A. Coring operations commenced and continued until 1200 h on 19 October,with an improved recovery of 66.26%.
Hole M0009B
Prior to logging Hole M0009B, the hole was reamed. Logging began at 1530 h on 19October 2005 with the resistivity and hydrochemical tools run in open hole over theinterval 6–21 m below seabed. A hole blockage near the postglacial/Pleistoceneboundary, which resisted attempts to clear with the chisel tool, prevented the toolsfrom being run below ~21 m below seabed. Optical image logs were collected from 6to 18.1 m below seabed, and acoustic image logs were collected between 6 and 13.8m below seabed. Logging of Hole M0009B was concluded by 2320 h on 19 October.
Hole M0009C
Just before 0000 h on 20 October 2005, the Hunter moved to Hole M0009C, ~9 mwest-northwest of Hole M0009B in 99.85 m water depth. Coring commenced andcontinued until 1935 h that day, reaching a TD of 25.66 m. Coring in Hole M0009Cproved very difficult, with many bit blockages and crushed liners resulting frompieces of the formation breaking off and entering the core barrel, having not beenproperly cored. The lattice drilled was not strong enough to core and, in many cases,had to be crushed for progress to be made. Recovery improved toward the base of thehole, and the total core recovery was 51.86%. At 1935 h, the hole was completed andpreparations made to move to Hole M0009D.
Hole M0009D
The Hunter was positioned above Hole M0009D, 5.5 m east of Hole M0009B in 103.18m water depth, and coring began at 2210 h on 20 October 2005. Coring in Hole
42

Expedition 310 Preliminary Report
M0009D continued until 2230 h on 21 October to a TD of 44.59 m. Progress wassteady, but core runs were short and bit blocking common. After TD was reached,preparations were made to log the hole.
Prior to logging the hole, the hole was reamed and flushed for 30 min. The HQ stringwas pulled and set with a casing shoe at 19 m below seabed to run the logging toolsthrough the open hole section. Logging commenced at 2230 h on 21 October in verywet and windy conditions. This, combined with very poor hole conditions, led to adifficult logging period. Nevertheless, good logs were obtained in sections of openhole where it was possible to log. A hole blockage prevented the resistivity tool fromreaching the base of the hole, and the chisel tool was used to clear the blockage. Theresistivity, spectral gamma ray, and acoustic tools were run. However, large, meter-scale cavities in the formation created sticking points for some of the tools; thus, onlysome of the open bottom-hole interval was logged. The first optical image tool runwas affected by power failures on the drill rig, possibly caused by very heavy rainfall.Logging was temporarily interrupted while the cause of the power failures was inves-tigated. After these runs, the casing was pulled to 5 m below seabed. The top-hole sec-tion was logged with the resistivity and optical image tools, with cavities causingproblems for the optical tool. While logging uphole, the optical image tool becamestuck many times and needed to be pulled through obstructions by hand. Loggingoperations were completed by 1000 h on 22 October, and preparations were made tomove to Hole M0010A.
Site M0010
The Hunter was positioned above Hole M0010A by 1400 h on 22 October 2005, ~140m east-southeast of proposed Site TAH-02A, #4 in 89.53 m water depth. The DARTwas drilled into the seabed, and coring operations began at 1635 h. Coring continueduntil 1000 h on 23 October to a TD of 34.6 m below seabed. During the coring period,an HQ string trip was made to clear a continually blocking bit.
Site M0011
Hole M0011A was located ~140 m east of proposed Site TAH-02A, #4 in 101.34 m wa-ter depth. After running the API pipe, drilling the DART into the seabed, and runningthe HQ pipe, coring operations began at 1330 h on 23 October 2005. Coring com-menced in very soft silts with poor recovery, but this improved when the river depos-
43

Expedition 310 Preliminary Report
its gave way to a carbonate framework. At 0030 h on 24 October, coring operationswere completed in Hole M0011A at a depth of 17.65 m below seabed.
Site M0012
Hole M0012A was the first of three holes to be located within the new EPSP-approvedzone southeast of proposed Site TAH-02A, #4. Before the DART was lowered onto theseabed, a downpipe camera survey was run which showed a live coral colony at thefirst location. The ship was repositioned 25 m downslope in 77.05 m water depth, andthe DART drilled in. Coring operations began om Hole M0012A at 0900 h on 24 Oc-tober 2005. Recovery was generally poor, although it did improve in the more com-petent material at the base of the hole. Coring was completed at 2040 h on 24October at a TD of 34.1 m.
Site M0013
Hole M0013A was located 30 m downslope from Hole M0012A, in 90.95 m waterdepth. The Hunter was positioned above the hole at 2300 h on 24 October 2005. Afterthe API pipe and DART were lowered to the seabed, a seabed camera survey was con-ducted. Coring operations began at 0100 h on 25 October. At 0415 h, coring wasabandoned due to the lack of suitable coral material. TD of the hole was 11.7 m.
Site M0014
Hole M0014A was spudded ~70 m north-northwest of Hole M0013A in 99.25 m waterdepth. Coring operations began at 0610 h on 25 October 2005 and were completedat 1615 h at a TD of 15.43 m. The HQ string, API pipe, and DART were lifted ontodeck and secured for the transit to previous Site M0007 at the south end of the island.
Transit from Site M0014 (Tiarei) to Site M0007 (Maraa)
Poor weather was forecast for north of the island, and so the decision was made torevisit promising sites in the south. The transit commenced at 1930 h, and SiteM0007 reached at 0200 h on 26 October 2005.
44

Expedition 310 Preliminary Report
Site M0007
Hole M0007C
Prior to coring Hole M0007C, a seabed camera survey was conducted which revealeda surprisingly barren sloping seabed in 43.35 m water depth. Coring operations beganat 0315 h and continued until 2215 h. The hole progressed quickly, with core recov-ery generally poor and little formation resistance being evident on the bit. At ~30 mbelow seabed, the hole started to become sticky and then collapsed during a wirelinetrip, filling the outer core barrel with cuttings. The string was tripped, the barrelcleaned out (2 m of coral cuttings), and the HQ string rerun with an insert bit as theinner core barrel. The base of the hole was reached with difficulty, where rotation alsobecame difficult. The string stuck a few times, and the hole was abandoned at a TDof 32.25 m.
Site M0015
After completing Hole M0007C, ~300 m to the northwest, the Hunter moved to SiteM0015 in 72.15 m of water. After a short bathymetry traverse to locate a site for thehole, drilling operations began at 0030 h on 27 October 2005 and continued until0325 h on 28 October. TD was 42.28 mbsf. There was generally good core recovery,with usually <1 m core runs between bit blocking and 72.71% average recovery forthe hole.
Prior to logging, Hole M0015A was reamed and flushed for 1 h, after which the corebarrel was removed and the drill string rerun with a casing shoe. Logging commencedat 0630 h on 28 October. Initially, the casing depth was set at 7 m but the loggingtools would not pass downhole beyond 20 m, so they were removed and the casingrun to the base of the hole then pulled back to 20 m. Logging then was possible inthe bottom part of the borehole, but one tool was stuck for a while and had to beeased free with the downhole hammer. Thereafter, logging continued successfully,the casing was pulled back to 7 m, and the remainder of the hole logged with overlap.Logging operations in Hole M0015A were completed by 1930 h on 28 October. Thestring was then tripped to deck and the DART lifted off seabed.
45

Expedition 310 Preliminary Report
Site M0016
Hole M0016A
After moving to new Site M0016, a tautwire bathymetry traverse was conducted tolocate a site for Hole M0016A. By 2400 h on 28 October 2005, the Hunter was posi-tioned above Hole M0016A in 80 m water depth. Shortly after midnight on 29 Octo-ber, coring operations began. Throughout the day, coring continued with fairly poorrecovery, and drilling indicated that the formation had many cavities. Coring in HoleM0016A was terminated at 0620 h on 30 October at a TD of 38.31 m. This was due todifficulty in overcoming bit blocking and, after a string trip to clean the whole corebarrel system, the HQ inner barrel could not reenter the outer pipe because to thestring was bending. It is most likely that the DART had moved on the seabed, possiblythrough subsidence.
Hole M0016B
Hole M0016B was located 5 m east of Hole M0016A. Initially, the noncoring insertbit was used to drill to 17 m below seabed and then coring continued with variablebut generally good core recovery. Coring operations ended at 0230 h on 31 October2005 at a TD of 44.62 m.
Site M0006 (Survey)
After moving to previous Site M0006, a tautwire site survey was conducted along ashort transect. This survey was abandoned after the DART touched down on the sea-bed unexpectedly, indicating that the bathymetry for this area was not accurate. Afterrunning the downpipe camera to check for stinger damage and lifting the DARThigher from the seabed, a new tautwire survey was conducted 10 m east of the previ-ous transect. A suitable site was found, but when the DART was lowered it touchedthe seabed 2 m deeper than indicated by the tautwire. The topography of the seafloorwas suspected to be very uneven at this survey location, so a new survey transect wasinitiated 10 m to the east. During this survey, the DART unexpectedly touched seabedagain. The seabed depth at Site M0006 appeared to change rapidly, and the changeswere not evident on the bathymetry data. Therefore the search for a new site wasabandoned, the DART lifted into the moonpool, and the Hunter returned to previousSite M0015.
46

Expedition 310 Preliminary Report
Site M0015
Hole M0015B
The Hunter moved back to previous Site M0015 to start new Hole M0015B in 71.53 mwater depth. Coring operations began at 1330 h on 31 October 2005 and were com-pleted by 1730 h on 1 November at a TD of 40.12 m. Because very short core runswere being achieved in the lower part of the hole and most liners were being crushed,the last four or five runs were made using the split chromed steel liners commonlyused elsewhere for this type of coring. The immediate result was longer core runs be-fore jamming, better core recovery, and improved preservation of delicate structures.Some horizons which would previously have been crushed were kept intact or keptin their correct cored position.
Site M0017
Hole M0017A was located ~60 m north of Hole M0015B in 56.5 m water depth. Beforetouching down with the DART, a seabed camera survey was run to check for livingcorals. None were observed, and so coring operations began at 2300 h on 1 November2005. A faster penetration rate was achieved using the steel split liners, giving thedrillers a much more sensitive indicator of bit blocking. As a consequence, they wereable to detect bit blocking much quicker and were sometimes able to avoid it. Thismeant that the core runs were longer and the number of wireline trips reduced. Corerecovery also improved. No problems were encountered with the subsequent cura-tion or science through the use of steel split liners. Coring was completed by 1600 hon 2 November at a TD of 40.56 m.
Prior to logging Hole M0017A, the hole was flushed. There was some difficulty witha stuck HQ pipe while trying to trip the drill string, which could be rotated but notuplifted. The string eventually came free. A casing shoe was fitted for the logging op-eration. Logging commenced in Hole M0017A at 2130 h on 2 November and wascompleted by 0350 h on 3 November. Resistivity, acoustic imaging, optical imaging,hydrochemical, caliper, and sonic tools were run. The starting depth of the tools var-ied because the tools caught in cavities (between 31.55 and 23.23 mbsf) and thedepth of the casing pipe was 13.35 mbsf. The core barrel fishing cable was used onone occasion to pull the sonic tool, which was stuck just below the casing, up to thesurface. This process damaged a portion of the logging winch cable, which was cut at~85 m. Reheading of the winch cable was completed well before the next logging op-eration.
47

Expedition 310 Preliminary Report
Site M0018
A short echo sounder survey (30 m × 20 m grid) was conducted ~120 m south-south-east of proposed Site TAH-03A-1 to locate a suitable site for Hole M0018A. At 0915 hon 3 November 2005, the DART was lowered at the chosen site and touched the sea-bed 14 m deeper than suggested by the echo sounder survey. The specific site was re-surveyed using the lead-line, and a new site chosen nearby. The DART was unable tobe drilled-in at this site at first (a solid carbonate crust was evident on the camera sur-vey) but was successfully drilled in on the second attempt (after the crust was brokenby the stinger?). At 1640 h on 3 November, coring operations began in Hole M0018Aand continued until 1200 h on 4 November. TD of the hole was 40.05 mbsf, with atotal recovery of 61.50%. The nature and quality of the material collected indicatedthat most of the coreable material was being collected. A camera survey was con-ducted after withdrawing the drilling equipment from the hole. No undue distur-bance was observed, although there was a significant mound where the DART wassituated with a slight “tail” of (?)cuttings coming from it and going down the pre-sumed slope.
Transit from SIte M0018 (Maraa) to Site M0019 (Faaa)
Prior to departing the Maraa area, the tautwire was respooled and the DART liftedonto the deck of the Hunter and secured. Once on deck, the stinger below the DARTwas found to be missing, and a new stinger was fitted. The vessel departed the Maraaarea at 1750 h on 4 November 2005 and arrived at the Faaa area at 2030 h.
Site M0019
On arrival at Faaa, the Hunter was positioned above Hole M0019A (~31 m south ofproposed Site TAH-01A, #3) in 58 m water depth. All clearances with airport and sea-port authorities were double-checked before occupying the new location, which wasclosest to the visible reef so far. A seabed camera survey was run, and no live coralswere observed. The DART was lowered and drilled in, and coring operations in HoleM0019A began at 2320 h on 4 November 2005. Coring was completed at 2400 h on5 November at a TD of 66.96 mbsf and with a total recovery of 41.12%. Penetrationwas rapid but recovery was poor. Checks of the Jean Lutz automatic drilling recorderdata confirmed the driller’s view that there were significant void spaces throughout.When penetration rate reduced to below 10 m/h, indicating more solid material, corewas usually obtained.
48

Expedition 310 Preliminary Report
Site M0020
Prior to coring Hole M0020A, the DART was retrieved and a short echo sounder sur-vey was conducted 50 m north of Hole M0019A to locate a site for Hole M0020A. Thechosen site was checked using the tautwire, and the DART and drill pipe were de-ployed in 83 m water depth. Coring operations began in Hole M0020A at 1200 h on6 November 2005 and continued until 1220 h on 7 November to a TD of 42.16 m.Total recovery was 70.45%.
Transit from Site M0020 (Faaa area) to Site M0021 (Tiarei area)
The vessel departed the Faaa area at 1320 h on 7 November 2005 and arrived in theTiarei area at 1610 h.
Site M0021
An echo sounder survey (five profiles) was conducted over suspected drowned reefsnear to the foreslope imaged on the bathymetry. The water depth was confirmed attwo locations using the tautwire. After a seabed camera survey, the DART was drilledin at one of these locations, ~115 m southeast of proposed Site TAH-02A, #5 in 82 mwater depth. Coring operations began in Hole M0021A at 2200 h on 7 November2005 and continued until 1640 h on 8 November. TD was 34.23 mbsf and total recov-ery was 74.87%. Good core recovery confirmed that the submerged pinnacle is adrowned reef.
Site M0009
Hole M0009E
After coring in Hole M0021A was completed, the HQ pipe was lifted and the DARTraised to 45 mbsl. The vessel moved 90 m northwest to previous Site M0009, where asite for Hole M0009E was chosen in a water depth of 93 m. The DART was loweredand drilled in, and coring operations in Hole M0009E began at 2030 h on 8 Novem-ber 2005. Coring was completed at 0550 h on 9 November at a TD of 20.61 m andwith a total recovery of 72.73%.
Prior to logging, the hole was flushed and the HQ pipe pulled and rerun with a casingshoe. From 0715 h on 9 November, Hole M0009E was logged between ~2 and 15 mbelow the seabed. The chisel tool was deployed once to clear a blockage at 6 mbsf.
49
Expedition 310 Preliminary Report
After logging was completed at 1440 h, the HQ pipe was tripped and the DART raisedinto mid-water.
Site M0022
The Hunter was positioned above Hole M0022A, ~175 m north-northwest of proposedSite TAH-02A-4 in 115 m water depth. After checking the depth with the tautwire, theDART was drilled in and coring commenced at 1750 h on 9 November 2005. It washoped that the hole would penetrate a Pleistocene gulley which may been subse-quently accreted by postglacial corals. Basalt gravel and volcaniclastic sand of Pleis-tocene affinity were recovered from a shallow depth, and so Hole M0022A wasabandoned after 8.8 m penetration at 2310 h on 9 November. By midnight, prepara-tions were being made to trip the API pipe and DART.
Site M0023
Hole M0023A
From 0000 h on 10 November 2005, the DART was raised to the moonpool after aban-doning coring in Hole M0022A. The Hunter moved to a new area over a drowned reefto conduct an echo sounder survey, ~100 m southwest of proposed Site TAH-02A, #4.From 0200 h on 10 November, 9 m × ~110 m echo sounder traverses were made overthe drowned reef pinnacle, from which a site for Hole M0023A was chosen in 67 mwater depth. After a short camera survey, coring operations in Hole M0023A startedat 0635 h on 10 November and ended at 2245 h that day after reaching a TD of 31.36mbsf with a total recovery of 77.20%.
Hole M0023B
After raising the DART a short distance from the seabed, the Hunter was positionedabove Hole M0023B, 5 m southwest of the previous hole in 67 m water depth. Coringoperations in Hole M0023B began at 0120 h on 11 November 2005 and ended at 1540h that day at a TD of 31.12 mbsf with a total recovery of 67.90%. The coring operationproceeded smoothly, with excellent core recovery in long core runs in often very po-rous formation.
Prior to logging, the drill pipe was pulled and the hole flushed to 30 min before thedrill pipe was run-in with a casing shoe to ~6 mbsf. Logging commenced at 1700 hon 11 November. Initially, the tools would not pass below the casing shoe, even after
50

Expedition 310 Preliminary Report
the chisel tool was worked in the hole. The casing shoe was run to the base of the holeand back before the chisel tool was deployed to check that the casing shoe was clear.Logging operations restarted at 2000 h, with the tools reaching a maximum depth of28.5 mbsf. A DP malfunction caused the vessel to move off location during logging,but the situation was recovered and the hole and equipment remained intact. The op-tical and acoustic log preview indicated that there were many cavities in the forma-tion. Logging was completed in Hole M0023B at 0310 h on 12 November.
Site M0024
After clearing away the logging tools and lifting the DART back into the moonpool,the vessel moved to conduct an echo sounder survey in an area over a drowned reefpinnacle ~100 m east of proposed Site TAH-02A, #5. From 0515 h on 12 November2005, 14 m × 50 m echo sounder traverses were made, from which a site for HoleM0024A was chosen in 90 m water depth. Coring operations in Hole M0024A beganat 1010 h on 12 November and finished at 0400 h on 13 November at a TD of 32.3mbsf. Total recovery was 83.74%.
Site M0025
Hole M0025A
A site for Hole M0025A was chosen from the echo sounder survey conducted on 12November 2005, 25 m north-northwest of Hole M0024A. The DART touched downin a water depth of 105.4 m and coring began at 0530 h on 13 November and finishedat 1645 h that day at a TD of 20.93 mbsf. Total recovery was 74.23%.
Site M0026
Following another echo sounder survey over a 50 m × 35 m area ~180 m east of pro-posed Site TAH-02A, #4 over a drowned reef pinnacle, a site for Hole M0026A waschosen. It proved difficult to interpret the results of the echo sounder survey (threestrong seabed echoes and widely differing water depths over a few meters), and it tooksome time before identifying a suitable site in 105 m water depth. Coring operationsin Hole M0026A started at 0920 h on 14 November 2005 and were completed by 1105h that day at a TD of 12.4 mbsf. Total recovery was 58.45%.
51

Expedition 310 Preliminary Report
Site M0025
Hole M0025B
After lifting the DART from Hole M0026A, the Hunter moved to previous Site M0025to core Hole M0025B. After taking a tautwire depth of 95 m, the DART was loweredand coring began at 1215 h on 14 November 2005. Coring finished at 0100 h on 15November at a TD of 20.5 mbsf with a total recovery of 71.19%.
Site M0021
Hole M0021B
After raising the DART to 50 m above seabed, the vessel was moved back to SiteM0021 to core Hole M0021B. Once on position, the tautwire depth was taken as 80m. The DART and drill pipe were lowered, and coring in Hole M0021B commencedat 0630 h on 15 November 2005 and continued until 2210 h that day. TD was 32.81mbsf and the total recovery was 65.57%.
Prior to logging, the hole was flushed before the HQ pipe was run back into the holewith a casing shoe. Logging of Hole M0021B commenced at 0030 h on 16 Novemberand was competed by 0645 h that day. All tools were run to 15 mbsf. Once loggingwas completed, the DART was lifted onto deck and secured for the transit back to thePort of Papeete.
Transit to Port of Papeete
The Hunter departed the last site at 0815 h on 16 November 2005 and arrived at thePort of Papeete at 1145 h. Demobilization of the vessel took place on 16–17 Novem-ber 2005.
Onshore Science Party, Bremen
The cores collected offshore Tahiti were transported under refrigeration to the newIODP Bremen Core Repository and Laboratories in the MARUM building on the cam-pus of Bremen University. Further analytical laboratories were accessed through theDepartment of Geosciences (geochemistry laboratories), the Research Center forOcean Margins (RCOM) (physical property laboratories), and the Centre for MarineEnvironmental Research (MARUM) of Bremen University. During the Expedition 310
52

Expedition 310 Preliminary Report
onshore science party (13 February–4 March 2006), the cores were described in detailad minimum and some standard measurements were made (Table T2).
53
Expedition 310 Preliminary Report
REFERENCES
Anderson, D.M., and Webb, R.S., 1994. Ice-age tropics revisited. Nature (London, U. K.),367:23–24. doi:10.1038/367023a0
Bard, E., Hamelin, B., Arnold, M., Montaggioni, L., Cabioch, G., Faure, G., and Rougerie, F.,1996. Deglacial sea-level record from Tahiti corals and the timing of global meltwater dis-charge. Nature (London, U. K.), 382:241–244. doi:10.1038/382241a0
Bard, E., Hamelin, B., and Fairbanks, R.G., 1990a. U-Th ages obtained by mass spectrometryin corals from Barbados: sea level during the past 130,000 years. Nature (London, U. K.),346:456–458. doi:10.1038/346456a0
Bard, E., Hamelin, B., Fairbanks, R.G., and Zindler, A., 1990b. Calibration of the 14C timescaleover the past 30,000 years using mass spectrometric U-Th ages from Barbados corals.Nature (London, U. K.), 345:405–410. doi:10.1038/345405a0
Bard, E., Rostek, F., and Sonzogni, C., 1997. Interhemispheric synchrony of the last deglacia-tion inferred from alkenone palaeothermometry. Nature (London, U. K.), 385:707–710.doi:10.1038/385707a0
Beck, J.W., Récy, J., Taylor, F., Edwards, R.L., and Cabioch, G., 1997. Abrupt changes in earlyHolocene tropical sea surface temperature derived from coral records. Nature (London, U.K.), 385:705–707. doi:10.1038/385705a0
Berner, R.A., 1980. Early Diagenesis: A Theoretical Approach: Princeton, NJ (Princeton Univ.Press).
Blanchon, P., and Shaw, J., 1995. Reef drowning during the last deglaciation: evidence for cat-astrophic sea-level rise and ice-sheet collapse. Geology, 23(1):4–8. doi: 10.1130/0091-7613(1995)023<0004:RDDTLD>2.3.CO;2
Broecker, W.S., 1990. Salinity history of the Northern Atlantic during the last deglaciation.Paleoceanography, 5:459–467.
Broecker, W.S., 1992. Defining the boundaries of the late glacial isotope episodes. Quat. Res.,38:135.
Camoin, G.F., Colonna, M., Montaggioni, L.F., Casanova, J., Faure, G., and Thomassin, B.A.,1997. Holocene sea level changes and reef development in the southwestern IndianOcean. Coral Reefs, 16(4):247–259. doi:10.1007/s003380050080
Chappell, J., and Polach, H., 1991. Post-glacial sea-level rise from a coral record at Huon Pen-insula, Papua New Guinea. Nature (London, U. K.), 349:147–149. doi:10.1038/349147a0
Cheng, Q.C., Macdougall, J.D., and Lugmair, G.W., 1993. Geochemical studies of Tahiti, Tea-hitia and Mehetia, Society Island chain. J. Volcanol. Geotherm. Res., 55(1–2):155–184.doi:10.1016/0377-0273(93)90096-A
Dullo, W.C., Camoin, G.F., Blomeier, D., Colonna, M., Eisenhauer, A., Faure, G., Casanova, J.,and Thomassin, B.A., 1998. Morphology and sediments of the fore-slopes of Mayotte,Comoro Islands: direct observations from a submersible. In Camoin, G.F., and Davies, P.J.,Reefs and Carbonate Platforms in the Pacific and Indian Oceans: Oxford (Blackwell), 219–236.
Duncan, R.A., Fisk, M.R., White, W.M., and Neilsen, R.L., 1994. Tahiti: geochemical evolu-tion of a French Polynesian volcano. J. Geophys. Res., 99(B12):24341–24358.doi:10.1029/94JB00991
Edwards, R.L., Beck, J.W., Burr, G.S., Donahue, D.J., Chappell, J.M.A., Bloom, A.L., Druffel,E.R.M., and Taylor, F.W., 1993. A large drop in atmospheric 14C/12C and reduced meltingin the Younger Dryas, documented with 230Th ages of coral. Science, 260:962–968.
54

Expedition 310 Preliminary Report
Fairbanks, R.G., 1989. A 17,000-year glacio-eustatic sea level record: influence of glacial melt-ing rates on the Younger Dryas event and deep-ocean circulation. Nature (London, U. K.),342:637–642. doi:10.1038/342637a0
Fleming, K., Johnston, P., Zwartz, D., Yoyoyama, Y., Lambeck, K., and Chapell, J., 1998. Refin-ing the eustatic sea-level curve since the Last Glacial Maximum using far-and intermedi-ate-field sites. Earth Planet. Sci. Lett., 163(1–4):327–342. doi:10.1016/S0012-821X(98)00198-8
Gagan, M.K., Ayliffe, L.K., Hopley, D., Cali, J.A., Mortimer, G.E., Chappell, J., McCulloch,M.T., and Head, M.J., 1998. Temperature and surface-ocean water balance of the mid-Holocene tropical western Pacific. Science, 279:1014–1018. doi:10.1126/sci-ence.279.5353.1014
Grammer, G.M., and Ginsburg, R.N., 1992. Highstand versus lowstand deposition on carbon-ate platform margins: insight from Quaternary foreslopes in the Bahamas. Mar. Geol.,103(1–3):125–136. doi:10.1016/0025-3227(92)90012-7
Grootes, P.M., Stuiver, M., White, J.W.C., Johnsen, S., and Jouzel, J., 1993. Comparison ofoxygen isotope records from the GISP2 and GRIP Greenland ice cores. Nature (London, U.K.), 366:552–554. doi:10.1038/366552a0
Guilderson, T.P., Fairbanks, R.G., and Rubenstone, J.L., 1994. Tropical temperature variationssince 20,000 years ago: modulating interhemispheric climate change. Science, 263:663–665.
Johnsen, S.J., Clausen, H.B., Dansgaard, W., Fuhrer, K., Gundestrup, N., Hammer, C.U.,Iversen, P., Jouzel, J., Stauffer, B., and Steffensen, J.P., 1992. Irregular glacial interstadialsrecorded in a new Greenland ice core. Nature (London, U. K.), 359:311–313. doi:10.1038/359311a0
Lambeck, K., 1993. Glacial rebound and sea-level change: an example of a relationshipbetween mantle and surface processes. In Wortel, M.J.R., Hansen, U., and Sabadini, R.(Eds.), Relationships between Mantle Processes and Geologic Processes at or near the Earth’s Sur-face: Amsterdam (Elsevier), 15–37.
Lindstrom, D.R., and MacAyeal, D.R., 1993. Death of an ice sheet. Nature (London, U. K.),365:214–215. doi:10.1038/365214a0
Locker, S.D., Hine, A.C., Tedesco, L.P., and Shinn, E.A., 1996. Magnitude and timing of epi-sodic sea-level rise during the last deglaciation. Geology, 24:827–830. doi:10.1130/0091-7613(1996)024<0827:MATOES>2.3.CO;2
Macintyre, I.G., Rützler, K., Norris, J.N., Smith, K.P., Cairns, S.D., Bucher, K.E., and Steneck,R.S., 1991. An early Holocene reef in the western Atlantic: submersible investigations of adeep relict reef off the west coast of Barbados, W.I. Coral Reefs, 10(3):167–174.doi:10.1007/BF00572177
McBirney, A.R., and Aoki, K., 1968. Petrology of the island of Tahiti. Mem.—Geol. Soc. Am.,116:523–556.
McCulloch, M., Mortimer, G., Esat, T., Xianhua, L., Pillans, B., and Chappell, J., 1996. Highresolution windows into early Holocene climate: Sr/Ca coral records from the Huon Pen-insula: Earth Planet. Sci. Lett., 138(1–4):169–178. doi:10.1016/0012-821X(95)00230-A
McCulloch, M.T., Tudhope, A.W., Esat, T.M., Mortimer, G.E., Chappell, J., Pillans, B., Chivas,A.R., and Omura, A., 1999. Coral record of equatorial sea-surface temperatures during thepenultimate deglaciation at Huon Peninsula. Science, 283:202–204. doi:10.1126/sci-ence.283.5399.202
Okuno, J., and Nakada, M., 1999. Total volume and temporal variation of meltwater fromLast Glacial Maximum inferred from sea-level observations at Barbados and Tahiti.Palaeogeogr., Palaeoclimatol., Palaeoecol., 146(1–4):283–293. doi:10.1016/S0031-0182(98)00136-9
55

Expedition 310 Preliminary Report
Parkhurst, D.L., and Appelo, C.A.J., 1999. User's guide to PHREEQC (version 2)—a computerprogram for speciation, batch-reaction, one-dimensional transport and inverse geochem-ical calculations. Water-Resour. Invest. Rep. (U.S. Geol. Surv.), 99–259.
Peltier, W.R., 1994. Ice age paleotopography. Science, 265:195–201.Raymer, L.L., Hunt, E.R., and Gardner, J.S., 1980. An improved transit-to-porosity transform.
SPWLA 21 Ann. Logging Symp.: 1–12.Rind, D., and Peteet, D., 1985. Terrestrial conditions at the Last Glacial Maximum and CLI-
MAP sea-surface temperature estimates: are they consistent? Quat. Res., 24:1–22.doi:10.1016/0033-5894(85)90080-8
Stocker, T.F., and Wright, D.G., 1991. Rapid transitions of the ocean’s deep circulationinduced by changes in surface water fluxes. Nature (London, U. K.), 351:729–732.doi:10.1038/351729a0
Troedson, A.L., and Davies, P.J., 2001. Contrasting facies patterns in subtropical and temper-ate continental slope sediments: inferences from east Australian late Quaternary records.Mar. Geol., 172(3–4):265–285. doi:10.1016/S0025-3227(00)00132-8
Wyllie, M.R.J., Gregory, A.R., and Gardner, G.H.F., 1958. An experimental investigation offactors affecting elastic wave velocities in porous media. Geophysics, 23:459–493.
Zhang, L., Chan, L.-H., and Gieskes, J.M., 1998. Lithium isotope geochemistry of pore watersfrom Ocean Drilling Program Sites 918 and 919, Irminger Basin. Geochim. Cosmochim.Acta, 62(14):2437–2450. doi:10.1016/S0016-7037(98)00178-1
Zinke, J., Pfeiffer, M., Davies, G.R., Dullo, W.-C., and Camoin, G.F., 2005. First evidence ofmid-Holocene and last interglacial seasonality in the tropical western Indian Ocean fromcorals [European Geosciences Union General Assembly 2005, Vienna, 24–29 April 2005].
56

Expedition 310 Preliminary Report
Table T1. Expedition 310 coring summary.
HoleNumber of cores
Cored(m)
Recovered(m)
Recovery(%)
M0005A 12 16.35 5.37 32.84
M0005B 8 12.35 9.24 74.82
M0005C 16 27.91 14.81 53.06
M0005D 36 79.17 51.35 64.86
M0005E 4 2 1.6 80.00
M0006A 4 2 1.55 77.50
M0007A 36 44.4 30.74 69.23
M0007B 36 47.93 27.02 56.37
M0007C 22 30.75 11.13 36.20
M0008A 19 38.7 9.49 24.52
M0009A 18 21.54 9.29 43.13
M0009B 18 26.29 17.42 66.26
M0009C 21 24.41 12.66 51.86
M0009D 25 43.31 23.62 54.54
M0009E 12 19.4 14.11 72.73
M0010A 20 33.25 10.02 30.14
M0011A 12 16.08 7.89 49.07
M0012A 19 32.3 8.37 25.91
M0013A 5 9.55 1.1 11.52
M0014A 14 18.61 8.65 46.48
M0015A 41 41.08 29.87 72.71
M0015B 38 40.12 28.83 71.86
M0016A 36 37.91 21.58 56.92
M0016B 24 27.62 14.31 51.81
M0017A 21 40.56 22.94 56.56
M0018A 22 40.05 24.63 61.50
M0019A 34 65.81 27.06 41.12
M0020A 25 41.83 29.47 70.45
M0021A 22 33.58 25.14 74.87
M0021B 20 32.21 21.12 65.57
M0022A 4 7.7 4.4 57.14
M0023A 16 31.36 24.21 77.20
M0023B 16 31.12 21.13 67.90
M0024A 16 31.85 26.67 83.74
M0025A 13 20.33 15.09 74.23
M0025B 13 19.4 13.81 71.19
M0026A 8 11 6.43 58.45
Totals: 726 1099.83 632.12 57.47
57

Expedition 310 Preliminary Report
Table T2. Location of description and measurements made during Expedition 310.
Note: * = Analyses conducted at the Swiss Federal Institute of Technology (ETH) Zurich, Switzerland, between the end of the offshorephase and the beginning of the Onshore Science Party. ATP = adenosine triphosphate, DAPI = 4’,6-diamindino-2-phenylindole,SEM = scanning electron microscopy, EDAX = X-ray energy dispersive analyzer.
Shipboard Hunter, offshore Tahiti Onshore Science Party, Bremen
Core description:• Core catcher description
Core description:• Split-core visual core description
Core photography:• Core catcher photography
Core photography:• Full-core and close-up photography
Whole-core multisensor core logging:• Density• Velocity• Magnetic susceptibility• Electrical resistivity
Discrete sample index physical properties: • Compressional P-wave velocity• Bulk, dry, and grain density• Water content• Porosity and void ratio
Inorganic geochemistry:• pH• Alkalinity• Ammonia concentration chlorinity
Inorganic geochemistry: • Dissolved cations• Bromide, chloride, and sulfate• Dissolved phosphate• Chlorinity
Microbiology: • Activity testing by ATP monitoring• Exoenzymes activity• Microscopy (DAPI staining)
Microbiology*:• SEM analysis (including SEM-EDAX analysis)• Cultivation of microorganisms• Culturing
Downhole logging • Optical imaging• Acoustic imaging• Borehole fluid temperature and pressure• Electrical conductivity• pH• Oxydo-reduction potential (Eh)• Spectral natural gamma ray• Induction resistivity• Full waveform sonic • Caliper
Other:• Thermal conductivity (where possible)• Color reflectance of split-core surface at discrete points• Continuous digital line-scanning of split-core surface• X-ray fluorescence (14 samples from Hole M0008A)
58

Expeditio
n 3
10 P
relim
inary
Report
59
17R-1 10–15
17R-1 18–23
Pebble Pebble
45.15 47.06
3.69 3.64
14.96 16.66
11.68 11.39
0.16 0.16
4.48 5.08
7.63 9.98
2.04 1.81
0.88 0.88
808 722
523 480
56.8 40.5
72.7 69.0
30.8 73.3
120 116
107 333
163 327
< 1.7 < 1.8
Table T3. Major and trace element analyses of representative volcaniclastic sediments.
Core, section, Interval (cm):
310-M0008A-
4R-1, 22–28
5R-1, 15–20
7R-CC, 4–13
8R-1, 42–51
8R-1, 61–80
9R-CC, 0–5
10R-1, 27–30
14R-1, 0–10
14R-1, 24–28
16R-1, 55–60
16R-1,115–120
17R-1,0–5
Description: Gray
sand/siltGray
sand/silt Boulder 1 Boulder 2 Cobble Pebble Pebble PebbleBrown
sand/siltBrown
sand/siltBrown
clay/sand Pebble
Major element oxide (wt%):
SiO2 32.79 29.86 42.15 42.68 42.32 41.01 37.80 44.03 41.44 38.90 31.37 43.59
TiO2 2.97 2.83 3.15 3.13 1.77 3.46 2.90 4.07 3.22 3.39 3.84 3.33
Al2O3 13.22 11.92 15.56 15.83 8.51 15.87 9.69 16.50 12.04 14.80 13.88 14.85
Fe2O3 13.02 12.13 12.16 12.26 10.84 12.38 12.90 10.33 15.78 16.05 16.59 12.18
MnO 0.15 0.14 0.16 0.17 0.17 0.18 0.17 0.13 0.16 0.21 0.36 0.15
MgO 9.99 9.67 4.98 6.04 16.76 4.33 14.22 3.07 4.96 5.15 2.95 5.59
CaO 7.63 9.12 9.58 9.98 12.02 8.96 9.12 8.89 1.36 1.60 1.44 9.37
K2O 0.81 0.71 1.21 1.07 0.44 1.45 0.95 2.01 0.73 0.76 0.84 1.48
P2O5 0.30 0.26 0.69 0.66 0.14 0.51 0.25 0.90 0.05 0.23 0.32 0.58
Trace element (ppm):
Sr 432 544 675 662 258 646 414 754 287 370 422 609
Ba 100 211 398 319 125 503 320 750 288 279 324 361
Rb 23.2 21.4 22.8 22.5 11.1 30.9 23.2 40.1 35.8 29.6 37.5 31.2
Cu 54.1 61.2 93.9 88.2 45.2 113 67.8 51.1 51.3 66.0 70.6 69.1
Ni 241 248 50.9 54.1 381 66.1 453 90.9 230 305 286 100
Zn 104 97.0 95.3 93.6 67.7 99.3 98.0 89.3 113 124 122 103
S 13,250 15,180 204 160 155 2,496 176 423 468 538 407 125
Cl 8,394 7,903 158 230 < 2.0 5,305 737 4,873 10,210 9,140 8,032 293
Br 24.6 19.7 1.1 1.6 < 1.4 10.3 < 1.6 10.9 37.1 29.7 28.4 1.0

Expedition 310 Preliminary Report
60
Figure F1. Sea-level history reconstructed for long drill cores from Tahiti (squares), Barbados (circles), andNew Guinea (triangles) (from Bard et al., 1996). Reconstructed sea-surface temperatures for various time win-dows on corals from the Vanuatu (Beck et al., 1997). MWP = meltwater pulse.

Expedition 310 Preliminary Report
61
Figure F2. Location of Expedition 310 operations areas around Tahiti.
"
"
"
149°40' 149°30' 149°20' 149°10'
17°50'
17°40'
17°30'S
0 5
km
Tahiti
Moorea
TiareiSite M0008Site M0009Site M0010Site M0011Site M0012Site M0013Faaa
Site M0019Site M0020
MaraaSite M0005Site M0006Site M0007Site M0015Site M0016Site M0017Site M0018
Site M0014Site M0021Site M0022Site M0023Site M0024Site M0025Site M0026
149°50'W
10 20

Expedition 310 Preliminary Report
62
Figure F3. Location of Expedition 310 holes in the Faaa area (see Fig. F2 for location with respect to Tahiti).
200180
300
220
500
320
480
280
340
260
380
240
360
400
420
540
520
460
440
560
160
580
600
140
120
160
160
200
180
140
120
120
140
120
140
140 120
140
140
160
140
160
160
120
160120
140
180
160
160
180
140
160
160
120
120
120
160
120
160
160
120120120
140
160
140
120
Hole M0020A
Hole M0019A
14936'15"W 14936'0" 14935'45"
1732'0"
1731'45"S
0 200 400100
Meters

Expedition 310 Preliminary Report
63
Figure F4. Location of Expedition 310 Holes in the Tiarei area (see Fig. F2 for location with respect to Tahiti).
240
220
80
180
260140
160
280
120
100
300
320
60
340
100
100
Hole M0021B
Hole M0025B
Hole M0026A
Hole M0024A
Hole M0023BHole M0023A
Hole M0022A
Hole M0009E
Hole M0021AHole M0014A
Hole M0013A
Hole M0011A
Hole M0012A
Hole M0010A
Hole M0009DHole M0009C
Hole M0008A
14924'30"W 14924'15" 14924'0"
1729'30"
1729'15"S
0 200 400100
Meters

Expedition 310 Preliminary Report
64
Figure F5. Location of Expedition 310 Holes in the Maraa area (see Fig. F2 for location with respect to Tahiti).
280
400
200
300
220
320
180260
240
380
340
360
420
440
460
480
160
500
520
540560
140
580
160
120140
160
120
160
120
580
140
140
140
420
Hole M0018A
Hole M0017A
Hole M0015BHole M0016B
Hole M0016A
Hole M0015A
Hole M0007CHole M0007B
Hole M0007A
Hole M0006A
Hole M0005EHole M0005DHole M0005CHole M0005B
149°33'15"W 149°33'0" 149°32'45"
17°46'15"
17°46'0"S
0 200 400100
Meters

Expedition 310 Preliminary Report
65
Figure F6. Lithostratigraphic summary of holes on the Maraa western transect. (Continued on next page.)
Hole M0007A Hole M0007CHole M0007B
45
40
35
30
25
20
15
10
5
0
50
1R2R3R4R5R6R7R
8R
9R
10R
11R12R13R
14R15R
16R
17R
18R
19R
20R
21R
22R23R24R
25R
26R27R
28R
29R
30R
31R
32R
33R
34R
35R
36R
1R2R
3R
4R
5R
6R7R8R
9R
10R11R
12R
13R
14R
15R
16R17R18R19R
20R21R
22R
23R
24R
25R
26R
27R
28R29R
30R
31R
32R33R
34R
35R
36R
1R
2R
3R
4R
5R6R
7R
8R
9R
10R
11R
12R
13R
14R
15R
16R
17R
18R
19R
20R21R22R
Dep
th (
mbs
f)
Core recoveryAge Age AgeCore recovery Core recovery
Rubble
Bindstone
Grainstone
Microbialite
Boundstone
Rudstone
Packstone
Sand
Floatstone
Sandy mud
Silt
Cobble
Gravel
Wackestone
Conglomerate
Coral framework
Coral rudstone
Maraa western transect: Sites M0005, M0006, and M0007
Unit I
Unit I
Unit I
Unit 2
Unit 2

Expeditio
n 3
10 P
relim
inary
Report
66
) Hole M0005D (cont.)
36R
105
5
0 1R2R3R4R
Hole M0005E
5
0 1R2R3R4R
Hole M0006E
Pg.
Pg.
Age Core recovery
Age Core recovery
Age Core recovery
Ple
ist.
Figure F6 (continued).
Hole M0005A Hole M0005C Hole M0005D Hole M0005D (cont.Hole M0005B
1R
2R3R
4R
5R
6R7R8R
9R
10R11R12R
1R
2R3R
4R
5R6R
7R
8R
1R
2R
3R
4R
5R
6R
7R
8R
9R
10R
11R12R
13R
14R
15R
16R
1R
2R
3R
4R
5R
6R
7R
8R
9R
10R
11R
12R13R14R
15R
16R
45
40
35
30
25
20
15
10
5
0
50
17R
18R
19R
20R
21R
22R
23R
24R
25R
26R
27R
28R
29R
30R
31R
32R
33R
34R
35R100
95
90
85
80
75
70
65
60
55
50
Dep
th (
mbs
f)
Ple
isto
cene
Age Core recoveryAge Age AgeCore recovery Core recoveryCore recovery Age Core recovery
Rubble
Bindstone
Grainstone
Microbialite
Boundstone
Rudstone
Packstone
Sand
Floatstone
Sandy mud
Silt
Cobble
Gravel
Wackestone
Conglomerate
Coral framework
Coral rudstone
Unit 1
Unit 2
Unit 1
Unit 1
Unit 1

Expeditio
n 3
10 P
relim
inary
Report
67
1R
2R
3R
4R5R
6R
7R
8R
9R
10R
11R
12R
13R
14R
15R
16R
17R
18R
19R
20R
21R
22R
ole M0018A
anward
Core recovery
Rubble
Bindstone
Grainstone
Microbialite
Boundstone
Rudstone
Packstone
Sand
Floatstone
Sandy mud
Silt
Cobble
Gravel
Wackestone
Conglomerate
Coral framework
Coral rudstone
Figure F7. Lithostratigraphic summary of holes on the Maraa eastern transect.
1R2R
3R
4R
5R
6R7R8R9R10R11R12R13R14R15R16R17R
18R
19R20R21R22R23R24R
25R
26R
27R
28R29R30R31R32R
33R
34R
35R
36R
37R
38R
Hole M0015B
1R
2R
3R
4R
5R
6R
7R
8R
9R
10R
11R
12R
13R
14R
15R
16R
17R
18R
19R
20R
21R
Hole M0017A Hole M0015A
1R
2R
3R
4R5R6R7R
8R
9R
10R
11R
12R
13R14R15R16R17R18R19R20R21R22R23R
24R25R26R27R28R29R30R
31R
32R33R34R
35R
36R
37R
38R
39R40R
41R
Maraa eastern transect: Sites M00015, M00016, M00017 and M00018
45
40
35
30
25
20
15
10
5
0
50
Hole M0016A
1R
2R
3R4R5R6R
7R8R
9R10R
11R
12R
13R
14R15R
16R17R18R19R20R21R22R23R
24R25R26R
27R28R
29R
30R
31R
32R
33R
34R
35R
36R
1R2R3R4R
5R
6R
7R8R9R10R11R
12R
13R
14R
15R
16R
17R
18R
19R
20R
21R
22R
23R
24R
Hole M0016B H
Dep
th (
mbs
f)
Reefward Oce
Age Core recovery Age Core recovery Age Core recovery Age Core recovery Age Core recovery Age
Unit 2
Unit 1
Unit 2 Unit 2
Unit 1
Unit 1
Unit 2
Unit 1
Unit 2
Unit 1 Unit 1
Unit 2
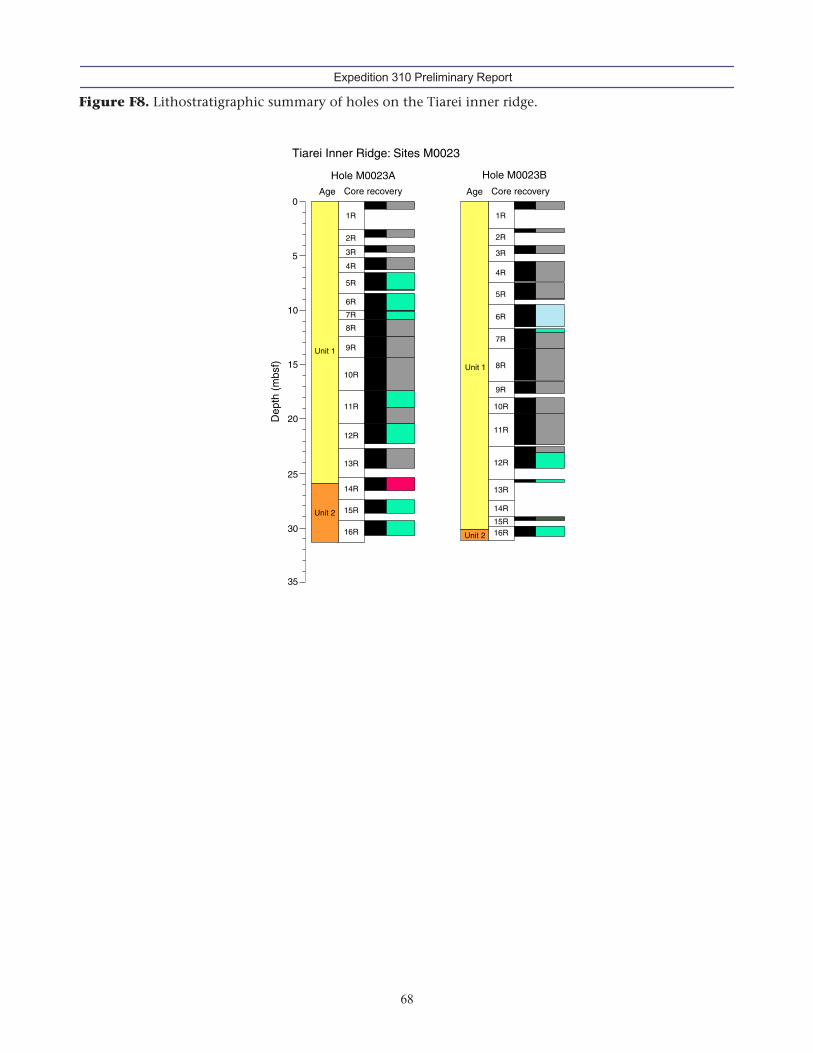
Expedition 310 Preliminary Report
68
Figure F8. Lithostratigraphic summary of holes on the Tiarei inner ridge.
Tiarei Inner Ridge: Sites M0023
35
30
25
20
15
10
5
0
1R
2R
3R
4R
5R
6R
7R
8R
9R
10R
11R
12R
13R
14R
15R
16R
Hole M0023A
1R
2R
3R
4R
5R
6R
7R
8R
9R
10R
11R
12R
13R
14R
15R16R
Hole M0023B
Dep
th (
mbs
f)
Age Core recovery Age Core recovery
Unit 2
Unit 2
Unit 1
Unit 1

Expedition 310 Preliminary Report
69
Figure F9. Lithostratigraphic summary of Holes on the Tiarei outer ridge. (Continued on next page.)
Tiarei outer ridge: Sites M0009, M0021, M0024, M0025 and M0026
1R2R3R4R5R
6R
7R
8R
9R
10R
11R
12R
13R
14R
15R16R
17R
18R
19R
20R
21R
22R23R24R
25R
1R
2R
3R
4R
5R
6R
7R
8R
9R
10R
11R
12R
Hole M0009D Hole M0009E
50
45
40
35
30
25
20
15
10
5
0
Hole M0024A Hole M0025A Hole M0025B
1R2R3R
4R
5R
6R
7R
8R
9R
10R
11R
12R
13R
14R
15R
16R
1R
2R
3R
4R
5R
6R7R8R
9R
10R
11R
12R
13R
1R
2R3R4R
5R
6R
7R
8R
9R
10R
11R
12R
13R
SE NW
Dep
th (
mbs
f)
Age Core recovery Age Core recovery Age Core recovery Age Core recovery Age Core recovery
Rubble
Bindstone
Grainstone
Microbialite
Boundstone
Rudstone
Packstone
Sand
Floatstone
Sandy mud
Silt
Cobble
Gravel
Wackestone
Conglomerate
Coral framework
Coral rudstone
Unit 1
Unit 2
Unit 1
Unit 1
Unit 2
Unit 1
Unit 2
Unit 1
Unit 1
Unit 2

Expeditio
n 3
10 P
relim
inary
Report
70
1R
2R3R4R5R
6R7R8R
9R
10R11R
12R
13R
14R
15R
16R
17R
18R19R
20R
21R
Hole M0009C NWAge Core recovery
Unit 2
Unit 1
Figure F9 (continued).
Hole M0021A
50
45
40
35
30
25
20
15
10
5
01R
2R
3R
4R
5R
6R
7R
8R
9R
10R
11R
12R
13R
14R
15R
16R
17R
18R
19R
20R
21R
22R
1R
2R
3R
4R
5R
6R
7R
8R
9R
10R
11R
12R
13R
14R
15R
16R
17R
18R19R
20R
1R
2R
3R
4R
5R
6R
7R8R
Hole M0021BHole M0026A Hole M0009A Hole M0009B
1R
2R
3R4R5R6R7R
8R
9R
10R
11R12R13R14R15R
16R
17R
18R
1R
2R3R4R5R6R7R8R
9R
10R
11R
12R
13R
14R
15R
16R
17R
18R
SE
Dep
th (
mbs
f)
Age Core recovery Age Core recovery Age Core recovery Age Core recovery Age Core recovery
Rubble
Bindstone
Grainstone
Microbialite
Boundstone
Rudstone
Packstone
Sand
Floatstone
Sandy mud
Silt
Cobble
Gravel
Wackestone
Conglomerate
Coral framework
Coral rudstone
Unit 1U
nit 2
Unit 1Unit 1
Unit 2 Unit 2
Unit 2
Unit 1
Unit 1
Unit 2

Expeditio
n 3
10 P
relim
inary
Report
71
le M0014A
1R
2R
3R
4R
5R6R
7R
8R9R10R11R12R
13R
14R
1R
2R
3R
4R
le M0022A
rd
Core recovery
Core recovery
Rubble
Bindstone
Grainstone
Microbialite
Boundstone
Rudstone
Packstone
Sand
Floatstone
Sandy mud
Silt
Cobble
Gravel
Wackestone
Conglomerate
Coral framework
Coral rudstone
Figure F10. Lithostratigraphic summary of holes of the Tiarei marginal sites
Hole M0011A
1R2R3R
4R
5R
6R
7R8R9R
10R
11R12R
Hole M0012A
1R
2R
3R
4R
5R
6R
7R
8R
9R
10R
11R
12R
13R
14R15R16R
17R
18R19R
Tiarei Marginal Sites: Sites M0008, M0010, M0011, M0012, M0013,M0014 and M0022
Hole M0008A
50
45
40
35
30
25
20
15
10
5
0
1R
2R
3R
4R
5R
6R
7R
8R
9R10R
11R12R13R
14R
15R
16R
17R
18R
19R
Hole M0013A
1R
2R
3R
4R
5R
Ho
10
5
0
Hole M0010A
2R
3R
4R
5R
6R
7R
8R
9R
10R
11R
12R
13R14R
15R
16R17R18R19R20R
1R
Ho
Dep
th (
mbs
f)
Reefward Oceanwa
Age Core recovery Age Core recovery Age Core recovery Age Core recovery Age Core recovery Age
Age
Unit 1
Unit 1
Unit 1
Unit 2
Unit 2
Unit 1
Unit 1 Unit 1
Unit 1
Unit 2
Unit 2
Unit 2

Expedition 310 Preliminary Report
72
Figure F11. Lithostratigraphic summary of holes in the Faaa area.
Faaa: Sites M0019 and M0020
Hole M0019A
45
40
35
30
25
20
15
10
5
0
50
Hole M0019A (cont.)
1R
2R
3R
4R
5R
6R
7R
8R
9R
10R
11R
12R
13R
14R
15R
16R
17R
18R
19R
20R
21R
22R
5023R
24R
25R
26R
27R
28R
29R30R31R32R
33R
34R
65
60
55
1R
2R
3R
4R
5R6R
7R
8R
9R
10R
11R
12R
13R
14R
15R
16R
17R
18R
19R
20R
21R
22R
23R
24R
25R
40
35
30
25
20
15
10
5
0
Hole M0020A
Reefward Oceanward
Dep
th (
mbs
f)
Age Core recovery Age Core recovery Age Core recovery
Rubble
Bindstone
Grainstone
Microbialite
Boundstone
Rudstone
Packstone
Sand
Floatstone
Sandy mud
Silt
Cobble
Gravel
Wackestone
Conglomerate
Coral framework
Coral rudstone
Unit 2
Unit 1
Unit 2
Unit 2
Unit 1

Expedition 310 Preliminary Report
73
Figure F12. Cross plot showing all physical property data in the porosity and P-wave velocity domain. Insteadof showing individual data points for the bulky MSCL data (15,191 data points), data density was contouredby moving a bin size of 0.200 km/s by 0.02 porosity units diagonally with increments of 1/30 of one bin size.Data density increases from blue to red. Purple = discrete sample properties (N = 355). In addition, commonlyused velocity transforms, like those by Raymer (1980) and Wyllie (1956), are superimposed.
1500
2500
3500
4500
5500
Porosity (%)
VP (
m/s
)
N = 15191
Raymer
Wyllie
0 10 20 30 40 50 60

Expedition 310 Preliminary Report
74
Figure F13. Composite of optical image (OBI), acoustic image (ABI), and total gamma ray (TGR) downholelogging data for holes in the Tiarei area (see Fig. F4 for locations).
Dep
th (
mbs
f)
1:300
ABI 9EABI 9BABI 9D OBI 9D OBI 9B
TGR 9E
0 70(cps)
TGR 9B
0 70(cps)
TGR open
0 70(cps)
ABI 23B OBI 23B
TGR 23B
0 70(cps)
ABI 21B OBI 21B
TGR 21B
0 70(cps)
75
80
85
90
95
100
105
110
115
120
125
130
135
Pleistocene
Pleistocene
?
Pleistocene
PleistocenePleistocene

Expedition 310 Preliminary Report
75
Figure F14. Composite of optical image (OBI), acoustic image (ABI), and resistivity downhole logging data forholes in the Tiarei area (see Fig. F4 for locations). ILD = induction resistivity deeper investigation depth, ILM= induction resistivity medium investigation depth.
h
1:300
ABI 9EABI 9BABI 9D OBI 9D OBI 9B ABI 23B OBI 23BABI 21B OBI 21B
ILD 9D
0.2 20(Ωm)
ILM 9D
0.2 20
ILD 9B
0.2 20
ILM 9B
0.2 20(Ωm)
ILD 9E
0.2 20(Ωm)
ILM 9E
0.2 20(Ωm)
ILD 21B
0.2 20(Ωm)
ILM 21B
0.2 20(Ωm)
ILD 23B
0.2 20(Ωm)
ILM 23B
0.2 20(Ωm)
75
80
85
90
95
100
105
110
115
120
125
130
Pleistocene
Pleistocene
Pleistocene
Pleistocene
Pleistocene
Dep
th (
mbs
f)
(Ωm)
(Ωm)

Expedition 310 Preliminary Report
76
Figure F15. Composite of optical image (OBI), acoustic image (ABI), and total gamma ray (TGR), and resistiv-ity downhole logging data for holes in the Maraa area (see Fig. F5 for locations). ILD = induction resistivitydeeper investigation depth, ILM = induction resistivity medium investigation depth.
Dep
th (
mbs
f)
1:320
ABI 7BABI 15A
ABI 15b
OBI 15A ABI 17A OBI 17A ILD 5D
0.2 20(Ωm)
ILM 5D
0.2 20(Ωm)
TGR pipe 5D
0 70(cps)
TGR open 5D
0 70(cps)
ILD 15A
0.2 20(Ωm)
ILM 15A
0.2 20(Ωm)
ILD 17A
0.2 20(Ωm)
ILM 17A
0.2 20(Ωm)
TGR pipe 7B
0 70(cps)
ILD 7B
0.2 20(Ωm)
ILM 7B
0.2 20(Ωm)
7A TGR pipe
0 70(cps)
ILD 7A
0.2 20(Ωm)
ILM 7A
0.2 20(Ωm)
40
45
50
55
60
65
70
75
80
85
90
95
100
Pleistocene
Pleistocene
Pleistocene
Pleistocene

Expedition 310 Preliminary Report
77
Figure F16. Brown iron/manganese crust and cavity (Hole M0016B; 23.68 mbsf).
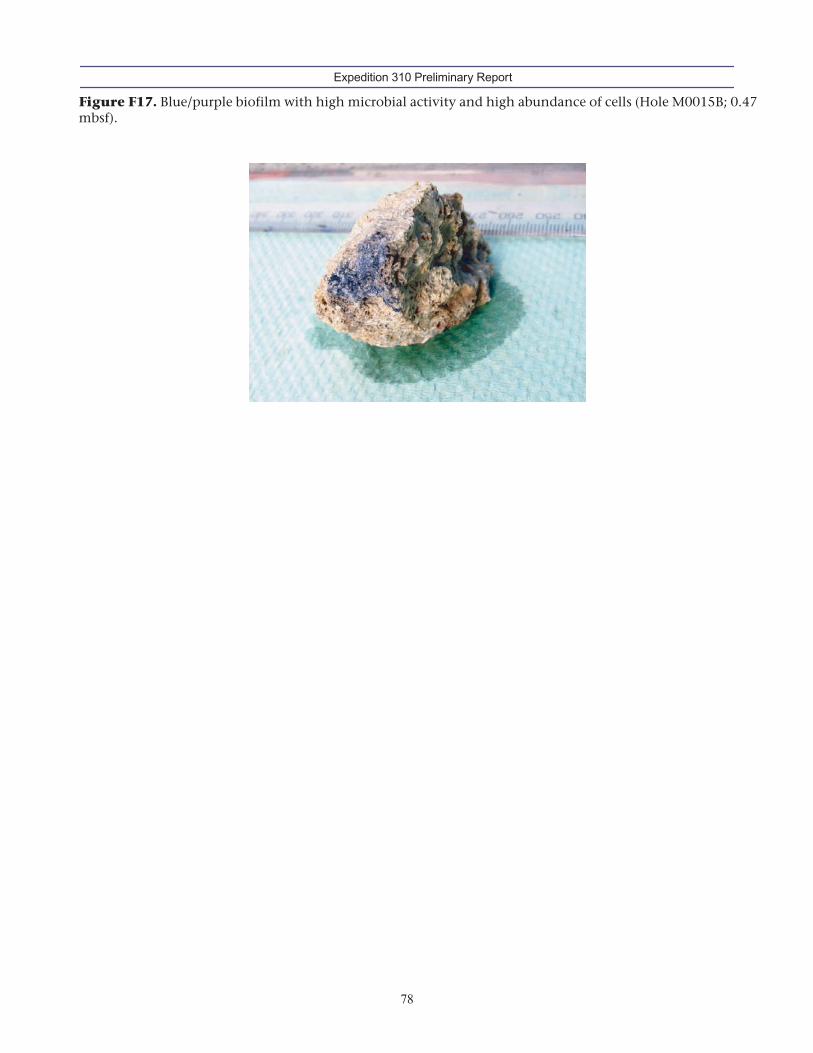
Expedition 310 Preliminary Report
78
Figure F17. Blue/purple biofilm with high microbial activity and high abundance of cells (Hole M0015B; 0.47mbsf).

Expedition 310 Preliminary Report
79
Figure F18. High abundance of cells in a biofilm (Hole M0015B; 0.47 mbsf; DAPI-stained fluorescence micros-copy).
20 µm
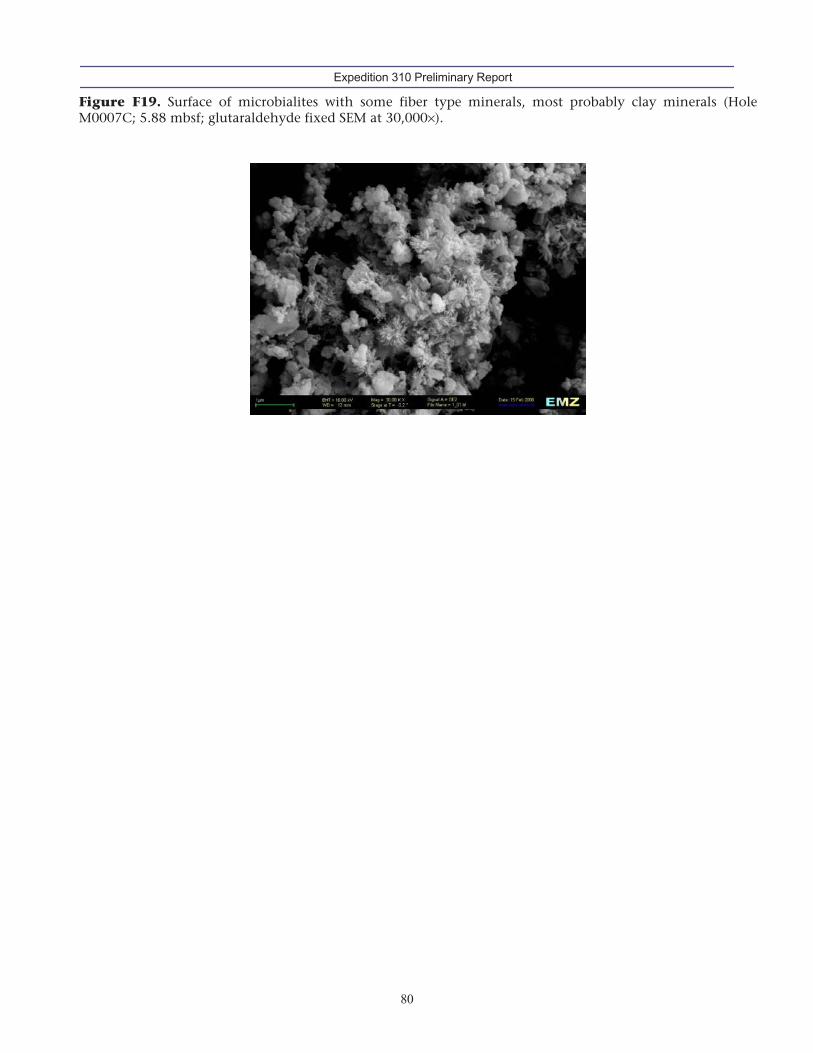
Expedition 310 Preliminary Report
80
Figure F19. Surface of microbialites with some fiber type minerals, most probably clay minerals (HoleM0007C; 5.88 mbsf; glutaraldehyde fixed SEM at 30,000×).

Expedition 310 Preliminary Report
81
Figure F20. Surface of blue biofilm covered with a network of desiccated exopolymeric substances, minerals,probably carbonates, and microorganisms (Hole M0015B; 0.47 mbsf; glutaraldehyde fixed SEM at 19,200×).

Expedition 310 Preliminary Report
82
Figure F21. Surface of microbialites with framboidal pyrite crystals (Hole M0023A; 0.12 mbsf; glutaraldehydefixed SEM at 9550×).

Expedition 310 Preliminary Report
83
Figure F22. Aerobic pure cultures of microorganisms. The different colors originate from the different pig-mentation by carotenoids.

Expedition 310 Preliminary Report
84
Figure F23. Rather high diversity of cell morphologies. Cells were common in this sample (Hole M0007C;5.88 mbsf; DAPI-stained fluorescence microscopy).

Expedition 310 Preliminary Report
85
Figure F24. Interstitial water chemistry for Hole M0008A, showing depth profiles for (A) pH, (B) alkalinity,(C) ammonia, (D) potassium, (E) calcium, (F) strontium), (G) manganese, and (H) iron.
0
5
10
15
20
25
30
35
0
Dep
th (
mbs
f)
0
5
10
15
20
25
30
35
6.5 7.0 7.5 8.0
Dep
th (
mbs
f)
0 100 200
NH4 [uM]
10 15
10 15 200 100 200 300 400
0 1 2 3 0 5
402010 30 20 40 600 50
pH Alkalinity (mM) Ammonia (µM) K (mM)
Ca (mM) Sr (µM) Mn (µM) Fe (µM)
A B C D
E F G H

Expedition 310 Preliminary Report
86
Figure F25. (A) SiO2, (B) K2O, (C) Rb for whole-rock samples from Hole M0008A. Note the systematic increasein values with depth.
96
94
92
90
88
86
84
82
80
78
Dep
th (
mbs
f)
37 42 47 0 1.0 2.0 0 20 40 60
SiO2 (wt%) Rb (ppm)A B CK2O (wt%)

Expedition 310 Preliminary Report
87
Figure F26. (A) CaO, (B) total Fe as FeO*, and (C) Rb volcanic sand/silt samples from Hole M0008A. Solidsquares = upper gray unit, open squares = lower orange and brown units.
96
92
88
84
80
76
72
68
FeO* (wt%) Rb (ppm)
Dep
th (
mbs
f)
CaO (wt%)0 4 8 10 12 14 20 30
A B C40

Expedition 310 Preliminary Report
88
Figure F27. MgO versus (A) total Fe as FeO*, (B) K2O, and (C) SiO2 for whole-rock and volcanic sand/silt sam-ples from Hole M0008A. Almost all the rock and gray volcanic sand/silt samples plot inside the Tahiti volcanicrock field, but the orange volcanic sand/silt samples plot farther away from the field, or in the case of C, out ofthe diagram. The Society volcano field in C includes samples from Tahiti and other volcanoes that belong tothe Society Islands volcanic chain. Dark solid and light dashed lines in A represent model fractionation linesshowing the change in magma composition with ~80% crystallization of a parent magma at two different ox-ygen fugacities using the model of Nielsen (1990). The dark solid line is for higher oxygen fugacity. Backgrounddata and figures are from Duncan et al. (1994) and Devey et al. (2003)
2
4
6
0
K2O
(w
t%)
2
6
10
14
FeO
* (
wt%
)
0 5 10 15 2035
45
55
65
Pitcairn large volcanoes
Society volcanoes
MgO (wt%)
SiO
2 (w
t%)
C
Tahiti volcanoes
Tahiti volcanoes
Gray sand/silt
Rock samples
Orange sand/silt/clay
B
A