integrated nanosystems for monitoring cell-signaling...
TRANSCRIPT

SANDIA REPORT SAND2007-7984Unlimited Release Printed December 2007
Integrated Nanosystems for Monitoring Cell-Signaling Proteins Bruce C. Bunker, Matthew Farrow, Kevin R. Zavadil, William G. Yelton, Murat Okandan, Roberto Rebeil, George D. Bachand, Judy Hendricks, Jun Liu Prepared by Sandia National Laboratories Albuquerque, New Mexico 87185 and Livermore, California 94550 Sandia is a multiprogram laboratory operated by Sandia Corporation, a Lockheed Martin Company, for the United States Department of Energy’s National Nuclear Security Administration under Contract DE-AC04-94AL85000. Approved for public release; further dissemination unlimited.
Issued by Sandia National Laboratories, operated for the United States Department of Energy by Sandia Corporation. NOTICE: This report was prepared as an account of work sponsored by an agency of the United States Government. Neither the United States Government, nor any agency thereof, nor any of their employees, nor any of their contractors, subcontractors, or their employees, make any warranty, express or implied, or assume any legal liability or responsibility for the accuracy, completeness, or usefulness of any information, apparatus, product, or process disclosed, or represent that its use would not infringe privately owned rights. Reference herein to any specific commercial product, process, or service by trade name, trademark, manufacturer, or otherwise, does not necessarily constitute or imply its endorsement, recommendation, or favoring by the United States Government, any agency thereof, or any of their contractors or subcontractors. The views and opinions expressed herein do not necessarily state or reflect those of the United States Government, any agency thereof, or any of their contractors. Printed in the United States of America. This report has been reproduced directly from the best available copy. Available to DOE and DOE contractors from U.S. Department of Energy Office of Scientific and Technical Information P.O. Box 62 Oak Ridge, TN 37831 Telephone: (865) 576-8401 Facsimile: (865) 576-5728 E-Mail: [email protected] Online ordering: http://www.osti.gov/bridge Available to the public from U.S. Department of Commerce National Technical Information Service 5285 Port Royal Rd. Springfield, VA 22161 Telephone: (800) 553-6847 Facsimile: (703) 605-6900 E-Mail: [email protected] Online order: http://www.ntis.gov/help/ordermethods.asp?loc=7-4-0#online

3
SAND200X-XXXX Unlimited Release
Printed November 2007
Integrated Nanosystems for Monitoring Cell-Signaling Proteins
Bruce C. Bunker, Electronic Materials & Nanostructures Matthew Farrow, Energetics Characterization
Kevin R. Zavadil, Materials Liability William G. Yelton, Photonic Systems Technology
Murat Okandan, Advanced MEMS Roberto Rebeil, Biomolecular Analysis & Imaging
George D. Bachand, Biomolecular Interfaces & Systems Judy Hendricks, Electronic Materials & Nanostructures
Sandia National Laboratories Albuquerque, New Mexico 87185
Jun Liu
Pacific Northwest National Laboratory Richland, WA 99352
Abstract
Components were developed for an integrated “lab-on-a-chip” that is intended to monitor how single cells respond to external stimuli such as toxins. At the largest length scale (of microns), the system contains a microfluidics platform that can capture single cells, provide them with nutrients, and expose them to toxins. At nanometer length scales, the system contains nanoporous electrodes that can be used to detect the proteins expressed by the captured cells when they are exposed to toxins. Capacitance changes induced on these electrodes can detect as few as four protein molecules per square micron of sensor electrode surface with a dynamic range for protein detection of around three orders of magnitude. At a molecular level, the sensor electrodes are coated with programmable self-assembled monolayers of the molecular host cyclodextrin. This film can be programmed using electrochemical signals to grab or release ferrocene molecules that are functionalized with antibodies. The antibodies are highly selective for adsorbing only those proteins of interest on the sensor surface. While the integration of the films, sensors, and fluidic systems was not completed, it is shown how these components could be used to follow the cell-signaling cascade in white blood cells that is critical to the inner workings of the human immune system. Monitoring the appearance of cytokines and other cell-signaling proteins is relevant to applications ranging from detecting pathogens for Homeland Defense to cellular-level studies that impact human health.

4
ACKNOWLEDGMENTS The authors wish to thank Jessica Weber (University of South Florida) and Dmitri Brevnov (University of New Mexico) for their contributions toward the development of our anodized aluminum oxide sensors. The authors would also like to thank Susan Brozik for suggesting the use of impedimetric sensors. The authors are highly appreciative of the support provided by Laboratory Directed Research and Development program at Sandia National Laboratories that made this project possible.

5
TABLE OF CONTENTS Introduction..........................................................................................................................7 Switchable Films for Protein Capture..................................................................................7 Capacitive Sensor Devices.................................................................................................14 Microfluidics Platforms .....................................................................................................18 Biocompatibility Studies....................................................................................................20 System Integration Studies and Protein Assays...............................................................224 Summary ............................................................................................................................26 References..........................................................................................................................27 TABLES
Table 1: Results of the RAW Cell Viability ..........................................................23 FIGURES
Figure 1 Components of the “on-chip” cell-signaling laboratory............................8 Figure 2 Switchable films for protein capture .........................................................9 Figure 3 Electrochemistry of switchable films ......................................................10 Figure 4 AFM images of protein capture and release............................................11 Figure 5 Fluorescence microscopy of quantum dot capture and release ...............11 Figure 6 Equilibrium constant measurement for ferrocene binding ......................13 Figure 7 Tri-ferrocene structure and enhanced binding.........................................13 Figure 8 QCM mass loading results for protein assay components.......................14 Figure 9 Mesoporous sensor layers........................................................................15 Figure 10 Anodized aluminum sensor layers and complex impedence.................17 Figure 11 Capacitance and resistance of anodized aluminum...............................18 Figure 12 Single-cell lab-on-a-chip .......................................................................19 Figure 13 Capture of single white blood cells .......................................................20 Figure 14 TNF alpha expression on system surfaces.............................................22 Figure 15 Cell viability on system surfaces...........................................................22 Figure 16 Reversible impedimetric protein assay on cyclodextrin films ..............25

6
APPENDICES Appendix 1: Synthesis of β-cyclodextrin derivatives for surface modification ................28 Appendix 2: Fabrication and Characterization of Anodized Aluminum Oxide Films ......33

7
INTRODUCTION The Department of Homeland Defense has critical needs in terms of being able to detect and respond to a wide range of chemical and biological pathogens. The innate human immune system performs such functions on a routine basis1. Pathogens are first recognized through Toll-like receptors (TLRs) that reside in external cell membranes as well as by intracellular nucleotide-binding oligomerization domain proteins (NODs) in infection-fighting cells such as macrophages (white blood cells). Binding of pathogen components to TLRs and NODs activates a cascading network of gene transcription, protein production, and enzymatic reactions that directly attack pathogens, as well as a secondary cascade of proteins such as cytokines that signal other cells to cooperate in an acute immune response. To cope with emerging pathogens, we need to understand more about how these components of immunity respond to the threat of infection, trigger a host inflammatory response, and coordinate in battling pathogenesis. As most of these responses occur soon after (within a half hour) of the exposure of the cells to pathogens, the ability to “fingerprint” the cell-signaling cascade could provide an early warning signal for exposure to pathogens, as well as provided us with enhanced understanding of the human immune system. The ultimate goal of the work described here is to develop an integrated “on-chip” laboratory that can be used to monitor the cell-signaling cascade in single cells. In particular, a chip-based device is desired that can capture single white blood cells (macrophages), expose the cells to potential pathogens, and then detect the resulting cascades of cytokines or other cell-signaling proteins using on-chip sensor devices. Given the complexities associated with developing such a multi-functional integrated system, resources were not available for developing and testing the ultimate integrated on-chip laboratory system. However, the work reported here lays the groundwork for such a system. This report summarizes critical research activities that were performed to develop and test critical components that can be utilized in the final integrated system, including (Fig. 1): 1) programmable surfaces for the reversible capture and release of specific proteins such as cytokines, 2) capacitive sensor films that can be used to detect the cytokines, and 3) the microfluidic platforms that can be used to delivering and holding cells, providing cells with nutrients and life-support functions, delivering toxins and other stimulants at known times, and extracting cell contents for analysis via on-chip sensors. In the ultimate deployment scheme, the programmable surfaces need to be integrated into the sensor elements. The active surfaces need to be anti-fouling to all proteins except specific proteins of interest such as cytokines. The surfaces are intended to capture the cytokines directly on the sensor for analysis, and then release the cytokines to refresh the sensor surface for the next measurement. The sensor elements, in turn, need to be integrated into the fluidics platform so that the environment right next to cells of interest can be probed for the cell-signaling proteins. All components of the system need to be biocompatible, so that normal cell functions can be probed without killing the cells or biasing cell responses. In addition to documenting progress made on individual components, this report also highlights the biocompatibility and integration studies that were performed to explore the feasibility of the overall “lab-on-a-chip” approach to monitoring cell-signaling proteins from single cells in real time.
8
S S
Au
Fe
S S
Au
Fe+
S S
Au
Fe+
e-
S S
Au
Fee-
S S
Au
Fe
S S
Au
S S
Au
FeFeFeFeFe
S S
Au
Fe+
S S
Au
S S
Au
S S
Au
Fe+FeFeFe+
S S
Au
Fe+
e-
S S
Au
Fe+
S S
Au
S S
Au
S S
Au
Fe+FeFeFeFe+
e-
S S
Au
Fee-
S S
Au
S S
Au
S S
Au
FeFeFee-
PDMS module
sample inlet
cell capture port
vacuum electrodesoptical access
Molecular Scale
Reversible protein grabbers
Nanometer Scale
Micron Scale
Ultracapacitor sensor elements
Cell-handling microfluidics
S S
Au
Fe
S S
Au
Fe+
S S
Au
Fe+
e-
S S
Au
Fee-
S S
Au
Fe
S S
Au
S S
Au
FeFeFeFeFe
S S
Au
Fe+
S S
Au
S S
Au
S S
Au
Fe+FeFeFe+
S S
Au
Fe+
e-
S S
Au
Fe+
S S
Au
S S
Au
S S
Au
Fe+FeFeFeFe+
e-
S S
Au
Fee-
S S
Au
S S
Au
S S
Au
FeFeFee-
PDMS module
sample inlet
cell capture port
vacuum electrodesoptical access
PDMS module
sample inlet
cell capture port
vacuum electrodesoptical access
Molecular Scale
Reversible protein grabbers
Nanometer Scale
Micron Scale
Ultracapacitor sensor elements
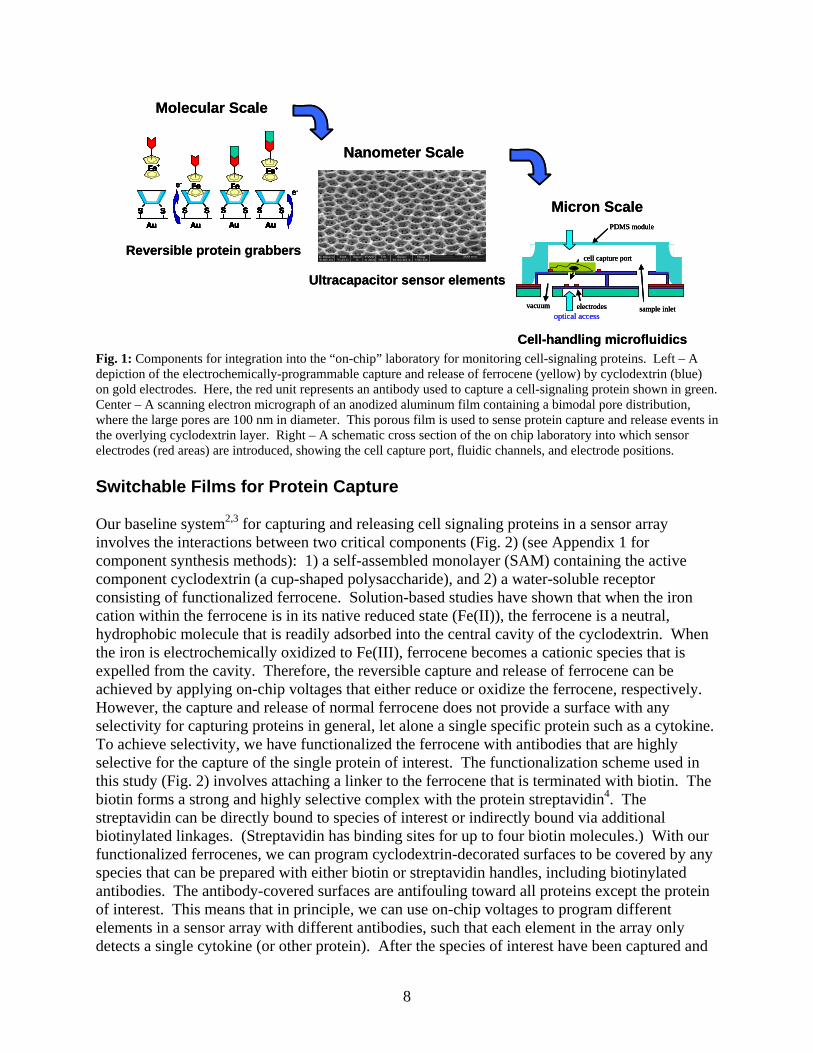
Cell-handling microfluidics Fig. 1: Components for integration into the “on-chip” laboratory for monitoring cell-signaling proteins. Left – A depiction of the electrochemically-programmable capture and release of ferrocene (yellow) by cyclodextrin (blue) on gold electrodes. Here, the red unit represents an antibody used to capture a cell-signaling protein shown in green. Center – A scanning electron micrograph of an anodized aluminum film containing a bimodal pore distribution, where the large pores are 100 nm in diameter. This porous film is used to sense protein capture and release events in the overlying cyclodextrin layer. Right – A schematic cross section of the on chip laboratory into which sensor electrodes (red areas) are introduced, showing the cell capture port, fluidic channels, and electrode positions. Switchable Films for Protein Capture Our baseline system2,3 for capturing and releasing cell signaling proteins in a sensor array involves the interactions between two critical components (Fig. 2) (see Appendix 1 for component synthesis methods): 1) a self-assembled monolayer (SAM) containing the active component cyclodextrin (a cup-shaped polysaccharide), and 2) a water-soluble receptor consisting of functionalized ferrocene. Solution-based studies have shown that when the iron cation within the ferrocene is in its native reduced state (Fe(II)), the ferrocene is a neutral, hydrophobic molecule that is readily adsorbed into the central cavity of the cyclodextrin. When the iron is electrochemically oxidized to Fe(III), ferrocene becomes a cationic species that is expelled from the cavity. Therefore, the reversible capture and release of ferrocene can be achieved by applying on-chip voltages that either reduce or oxidize the ferrocene, respectively. However, the capture and release of normal ferrocene does not provide a surface with any selectivity for capturing proteins in general, let alone a single specific protein such as a cytokine. To achieve selectivity, we have functionalized the ferrocene with antibodies that are highly selective for the capture of the single protein of interest. The functionalization scheme used in this study (Fig. 2) involves attaching a linker to the ferrocene that is terminated with biotin. The biotin forms a strong and highly selective complex with the protein streptavidin4. The streptavidin can be directly bound to species of interest or indirectly bound via additional biotinylated linkages. (Streptavidin has binding sites for up to four biotin molecules.) With our functionalized ferrocenes, we can program cyclodextrin-decorated surfaces to be covered by any species that can be prepared with either biotin or streptavidin handles, including biotinylated antibodies. The antibody-covered surfaces are antifouling toward all proteins except the protein of interest. This means that in principle, we can use on-chip voltages to program different elements in a sensor array with different antibodies, such that each element in the array only detects a single cytokine (or other protein). After the species of interest have been captured and

9
analyzed, the ferrocene-antibody constructs can be released, refreshing the sensor surface for the next experiment. All of the above depends on the ability to tether the cyclodextrin molecule to sensor surfaces. In our experiments, we either used gold electrodes or porous capacitors coated with gold. The cyclodextrin was tethered to the gold using thiol groups that were covalently attached to the cyclodextrin. The thiol groups promote adsorption of the cyclodextrin onto the gold to form a relatively dense self-assembled monolayer (SAM)5.
Fe
HN
O
OO
OHN
O
S
HN
NH
O
biotinylated ferrocene
streptavidin
biotinylated QD
biotinylated antibody (IgG)
tetheredcyclodextrin
S S
Au
Fe
S S
Au
Fe+
S S
Au
Fe+
e-
S S
Au
Fee-
S S
Au
Fe
S S
Au
S S
Au
FeFeFeFeFe
S S
Au
Fe+
S S
Au
S S
Au
S S
Au
Fe+FeFeFe+
S S
Au
Fe+
e-
S S
Au
Fe+
S S
Au
S S
Au
S S
Au
Fe+FeFeFeFe+
e-
S S
Au
Fee-
S S
Au
S S
Au
S S
Au
FeFeFee-
β-cyclodextrin (βCD)
OO
OHHO
OH
7
15 Å
~7 Å
Fe
HN
O
OO
OHN
O
S
HN
NH
O
biotinylated ferrocene
streptavidin
biotinylated QD
biotinylated antibody (IgG)
tetheredcyclodextrin
Fe
HN
O
OO
OHN
O
S
HN
NH
O
biotinylated ferroceneFe
HN
O
OO
OHN
O
S
HN
NH
O
biotinylated ferrocene
streptavidinstreptavidin
biotinylated QD
biotinylated antibody (IgG)
tetheredcyclodextrin
S S
Au
Fe
S S
Au
Fe+
S S
Au
Fe+
e-
S S
Au
Fee-
S S
Au
Fe
S S
Au
S S
Au
FeFeFeFeFe
S S
Au
Fe+
S S
Au
S S
Au
S S
Au
Fe+FeFeFe+
S S
Au
Fe+
e-
S S
Au
Fe+
S S
Au
S S
Au
S S
Au
Fe+FeFeFeFe+
e-
S S
Au
Fee-
S S
Au
S S
Au
S S
Au
FeFeFee-
β-cyclodextrin (βCD)
OO
OHHO
OH
7
15 Å
~7 Å
β-cyclodextrin (βCD)
OO
OHHO
OH
7
15 Å
~7 Å
Fig. 2: Critical components of the switchable films used for protein capture. Top – A depiction of the cyclodextrin cup used as the host for adsorption. The narrow rim is tethered to gold using thiols, leaving the wider opening on top to accept the ferrocene guest. Center – The total construct used to capture and release desired proteins. The tethered cyclodextrin (left) captures ferrocene that has been functionalized with biotin (center). The biotin binds to a streptavidin linker, which in turn binds to any desired object that has been biotinylated. If the object is an antibody, the surface is highly selective for grabbing the one single protein that the antibody is designed to recognize. Bottom – The protein capture and release cycle associated with oxidation and reduction of the ferrocene. Extensive characterization and analyses were performed to verify that the cyclodextrin-ferrocene host-guest interactions do indeed lead to surfaces that can capture and release specific proteins on command6-8. First, the presence of biotinylated ferrocene was measured by performing cyclic voltammetry experiments on gold surfaces coated with cyclodextrin. When the Fe(II) in the ferrocene is oxidized to Fe(III), a peak in current is observed at around 0.3 V corresponding the electron transfer event. The total integrated intensity of the peak corresponds to the amount of ferrocene present. For the data shown in Fig. 3, the total observed current leads to a calculated charge density of around 2.5 x 10⁻⁶ C/cm2 corresponding to a surface coverage of the biotinylated ferrocene of 1.5 x 10¹³ ferrocene/cm2. As the maximum possible cyclodextrin coverage (based on the 1.5 nm diameter of the cyclodextrin ring) is 4.4 cyclodextrin/cm2, the site occupancy of the ferrocene guest in the cyclodextrin host for the experiment shown is around 34%. While incomplete, this surface coverage is 120 times greater than that observed on a reference SAM surface terminated with hydroxyl groups, clearly demonstrating that the ferrocene adsorption involves specific interactions with the cyclodextrin host. Once Fe(III) is produced (at any stripping voltage exceeding 0.3 V), the ferrocene leaves the surface as desired. Cyclic voltammegrams obtained during stripping show that the surface concentration decays exponentially with time, and is 90% gone in roughly three minutes (Fig. 3, right). Therefore, the

10
cyclic voltammetry experiments are consistent with rapid and reversible capture and release of our functionalized ferrocene constructs.
Δt = 22 sec
increasing time
Δt = 22 sec
increasing time
Δt = 22 sec
increasing time
Fig. 3: Left – The electrochemical current associated with the oxidation of cyclodextrin-bound ferrocene as a function of applied voltage during cyclic voltammetry (where the voltage is continuously swept back and forth at a rate of 22 seconds per complete cycle). The ferrocene is oxidized at a voltage corresponding to the peak current (around 0.3 V). As the ferrocene is oxidized and desorbs, less remains on the surface to generate a current, so the magnitude of the current peak is less for each successive sweep. Right – A plot of the total charge density (proportional to the surface ferrocene coverage) as a function of time showing the rate at which the ferrocene leaves the surface once it it oxidized. Other techniques that were used to characterize reversible switching include atomic force microscopy (AFM), fluorescence microscopy, and the quartz crystal microbalance (QCM). Selected highlights of these experiments are provided below. In-situ AFM measurements provide visual images of the functionalized surfaces at a resolution of around 10 nm. Representative images (Fig. 4) show that: 1) the native cyclodextrin film is not continuous, but appears to phase separate into domains that are roughly 15 nm in diameter, 2) adsorption of our ferrocene-biotin construct followed by the protein streptavidin changes the morphology of the film, covering up all voids with a continuous protein film, and 3) oxidation of the ferrocene completely and reversibly restores the surface, removing the ferrocene-biotin-streptavadin overlayer. Fluorescence microscopy experiments were performed with materials such as streptavidin-coated quantum dots that can be used as optical tags to visualize adsorption and desorption processes. Optical images indicate that there is negligible quantum dot adsorption on bare cyclodextrin, extensive adsorption on surfaces covered with the Fe(II) form of biotinylated ferrocene (Fig. 5, right), and that oxidation of the Fe(II) to Fe(III) results in complete quantum dot desorption. The quartz crystal microbalance provides highly sensitive information regarding the mass of material deposited on a substrate surface. While our QCM is not configured to perform electrochemical experiments (preventing us from studying desorption), the QCM can be used to quantify the extent of adsorption of our ferrocene-biotin constructs, streptavidin attachment, antibody attachment, the capture of proteins by the antibodies, and the adsorption of other species such as undesired proteins at any stage of potential protein assays on the programmable films. In terms of protein fouling, the QCM results show that while proteins can be adsorbed on both bare cyclodextrin films and films filled with biotinylated ferrocene, once the

11
biotin captures streptavidin or antibodies, the protein-terminated films are completely anti-fouling. In terms of host-guest interactions, the QCM results are consistent with the cyclic voltammetry results indicating incomplete occupancy of the cyclodextrin host by the ferrocene guest (depending on the nature and solution concentration of the guest, see below.) (Representative QCM results for all adsorption stages associated with our protein capture assays are provided in Fig. 8 and related discussions below.)
bare cyclodextrin 1 mg·ml-1 FeCp2-B
70 μg·ml-1 SAv
anodically stripped
FeCp2FeCp2
AFM Images of Cyclodextrin on Gold
bare cyclodextrin 1 mg·ml-1 FeCp2-B
70 μg·ml-1 SAv
anodically stripped
FeCp2FeCp2
AFM Images of Cyclodextrin on Gold
Fig. 4: Atomic force microscopy images of gold surfaces covered with cyclodextrin. Left – The native surface. Center – The surface after the cyclodextrin host has been filled with the biotinylated ferrocene and then used to capture the protein streptavidin (shown in dark green in the cartoon above). Right – The same surface after ferrocene oxidation showing that the streptavidin has been removed.
reducedFe(II)Cp2-B
oxidizedFe(III)Cp2-B +
15nm Q-dot-streptavidin-FeCp2-B complex (5 binding sites/Qdot)
Quantum Dot Capture Quantum Dot Release
reducedFe(II)Cp2-B
oxidizedFe(III)Cp2-B +
15nm Q-dot-streptavidin-FeCp2-B complex (5 binding sites/Qdot)
Quantum Dot Capture Quantum Dot Release
reducedFe(II)Cp2-B
oxidizedFe(III)Cp2-B +
15nm Q-dot-streptavidin-FeCp2-B complex (5 binding sites/Qdot)
Quantum Dot Capture Quantum Dot Release
Fig. 5: Fluorescence microscopy images of the capture and release of biotinylated ferrocene. The biotin on the ferrocene was used to capture light-emitting quantum dots as tags to indicate where the ferrocene was. Left – Light emitted by quantum dots captured by adsorbed Fe(II)-containing ferrocene. Right – The same surface after oxidation of the ferrocene, showing how complete the desorption process is. Adsorption and desorption can be repeated over and over by reducing and oxidizing the ferrocene, respectively.
12
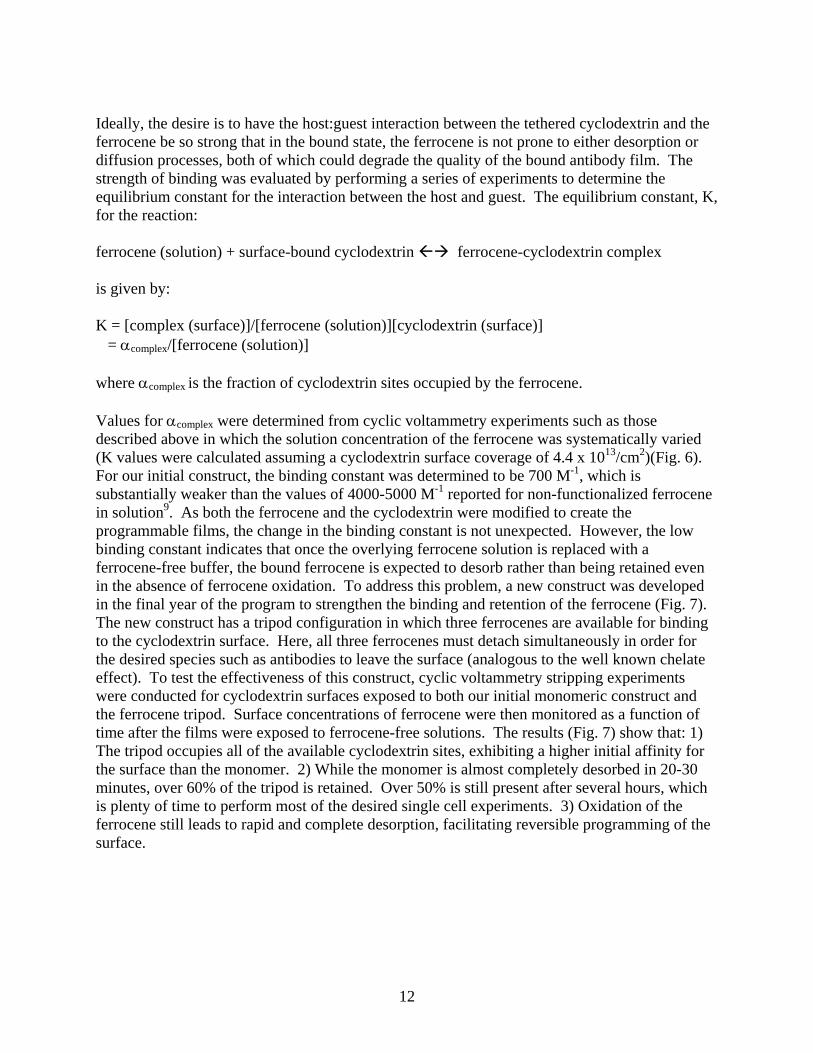
Ideally, the desire is to have the host:guest interaction between the tethered cyclodextrin and the ferrocene be so strong that in the bound state, the ferrocene is not prone to either desorption or diffusion processes, both of which could degrade the quality of the bound antibody film. The strength of binding was evaluated by performing a series of experiments to determine the equilibrium constant for the interaction between the host and guest. The equilibrium constant, K, for the reaction: ferrocene (solution) + surface-bound cyclodextrin ferrocene-cyclodextrin complex is given by: K = [complex (surface)]/[ferrocene (solution)][cyclodextrin (surface)] = αcomplex/[ferrocene (solution)] where αcomplex is the fraction of cyclodextrin sites occupied by the ferrocene. Values for αcomplex were determined from cyclic voltammetry experiments such as those described above in which the solution concentration of the ferrocene was systematically varied (K values were calculated assuming a cyclodextrin surface coverage of 4.4 x 10¹³/cm2)(Fig. 6). For our initial construct, the binding constant was determined to be 700 M-1, which is substantially weaker than the values of 4000-5000 M-1 reported for non-functionalized ferrocene in solution9. As both the ferrocene and the cyclodextrin were modified to create the programmable films, the change in the binding constant is not unexpected. However, the low binding constant indicates that once the overlying ferrocene solution is replaced with a ferrocene-free buffer, the bound ferrocene is expected to desorb rather than being retained even in the absence of ferrocene oxidation. To address this problem, a new construct was developed in the final year of the program to strengthen the binding and retention of the ferrocene (Fig. 7). The new construct has a tripod configuration in which three ferrocenes are available for binding to the cyclodextrin surface. Here, all three ferrocenes must detach simultaneously in order for the desired species such as antibodies to leave the surface (analogous to the well known chelate effect). To test the effectiveness of this construct, cyclic voltammetry stripping experiments were conducted for cyclodextrin surfaces exposed to both our initial monomeric construct and the ferrocene tripod. Surface concentrations of ferrocene were then monitored as a function of time after the films were exposed to ferrocene-free solutions. The results (Fig. 7) show that: 1) The tripod occupies all of the available cyclodextrin sites, exhibiting a higher initial affinity for the surface than the monomer. 2) While the monomer is almost completely desorbed in 20-30 minutes, over 60% of the tripod is retained. Over 50% is still present after several hours, which is plenty of time to perform most of the desired single cell experiments. 3) Oxidation of the ferrocene still leads to rapid and complete desorption, facilitating reversible programming of the surface.

13
FeCp2-B + βCDSurf FeCp2-B:βCDCmplx
α based on 4.4x10¹³ molec·cm-2
KF =αCmplx
[FeCp2-B]
FeCp2 in free solution 4000 to 5000 M-1
60 μM FeCp2 for films indicate 5000 M-1
KF = 700 M-1 for βCD-7(C12)2S on gold surfaces
FeCp2-B + βCDSurf FeCp2-B:βCDCmplxFeCp2-B + βCDSurf FeCp2-B:βCDCmplx
α based on 4.4x10¹³ molec·cm-2
KF =αCmplx
[FeCp2-B]
FeCp2 in free solution 4000 to 5000 M-1
60 μM FeCp2 for films indicate 5000 M-1
KF = 700 M-1 for βCD-7(C12)2S on gold surfaces
KF =αCmplx
[FeCp2-B]KF =
αCmplx
[FeCp2-B]
FeCp2 in free solution 4000 to 5000 M-1
60 μM FeCp2 for films indicate 5000 M-1
KF = 700 M-1 for βCD-7(C12)2S on gold surfaces
Fig. 6: The fraction of cyclodextrin sites occupied by ferrocene (αCmplx) as a function of the concentration of ferrocene in solution. The slope of the curve provides the value for the equilibrium constant for ferrocene binding to the surface.
tri-FeCp2
Fe
O
NH
O
NH
OO
O
Fe
O
NH
O
NH
O
OO
FeO
HNO
NH
OO
O
N NH
R
Binding of Mono- and Tri-ferrocenesTri-ferrocene
tri-FeCp2
Fe
O
NH
O
NH
OO
O
Fe
O
NH
O
NH
O
OO
FeO
HNO
NH
OO
O
N NH
R
Binding of Mono- and Tri-ferrocenesTri-ferrocene
Fig. 7: Right – A representation of the tri-ferrocene construct that was developed to enhance the adsorption and binding of species to the cyclodextrin surface. Left – Comparisons between the amount of ferrocene bound to cyclodextrin as a function of time for both monomeric and trimeric constructs. The results indicate that initial adsorption is higher, and the surface species are bound longer for the triferrocene construct. The effectiveness of all individual components in the programmable film system was verified by QCM experiments in which each “link in the chain” was sequentially added (Fig. 8). Addition of the biotinylated ferrocene tripod results in the formation of a multilayer surface deposit due to the limited solubility of the tripod in water. (Addition of 10% DMSO to the deposition solution is required to make the tripod more soluble.) However, after rinsing in a phosphate buffer, the measured film thickness is 4 nm, which corresponds to the mass loading expected for a fully dense host-guest monolayer. Addition of streptavidin adds 5.5 nm to the film thickness, in agreement with the formation of a fully dense protein overlayer. Addition of a biotinylated species (in this case the protein bovine serum albumin) adds 3 nm of material (4 nm would be expected for a fully dense layer), and addition of the antibody to that protein (anti-BSA) adds 12.5 nm of material (relative to the 14 nm expected for a complete layer). In the actual cytokine assay, the order of the last two steps would be reversed, with the antibody being attached via

14
biotin and then used to capture the protein, but the overall concept is identical. (The order here was dictated by the components that were commercially available.) However, the net conclusion is that one protein molecule should be captured per antibody attached to programmable surfaces that could be deployed in a sensor device.
* 10% DMSO
Tri-FeCp2-Bin 10% DMSO
*
streptavidin
*
BiotinylatedBSA
antiBSA
*
* - phosphate buffer
Time (min)
App
aren
t Film
Thi
ckne
ss (m
)
* 10% DMSO
Tri-FeCp2-Bin 10% DMSO
*
streptavidin
*
BiotinylatedBSA
antiBSA
*
* - phosphate buffer
Time (min)
* 10% DMSO
Tri-FeCp2-Bin 10% DMSO
*
streptavidin
*
BiotinylatedBSA
antiBSA
*
* - phosphate buffer
Time (min)
App
aren
t Film
Thi
ckne
ss (m
)
Fig. 8: Quartz crystal microbalance results showing the apparent film thickness (based on mass loading) during most of the stages of an adsorption-based assay. Clear steps include: 1) addition of the biotinylated tri-ferrocene species (the first major increase), 2) rinsing to remove tri-ferrocene that is not directly bound within cyclodextrin host cavities (the only major decrease), 3) capture of streptavidin by the biotin, 4) capture of a biotinylated protein (albumin, or BSA) by the streptavidin, and 5) capture of the antibody to BSA via interactions with the bound protein. Note that most adsorption steps are relatively rapid, and that the bound species are stable (i.e. do not desorb) on the time scale of our experiments. Note that the QCM is extremely sensitive, and that our programmable films could be used to perform the desired protein assays if the QCM could be configured to do electrochemistry to refresh the sensor surface. (An electrochemical QCM has recently been commercialized that could exploit our films.) Capacitive Sensor Devices For quantitative sensing of cell-signaling proteins, the programmable films described above need to be integrated into sensor devices that can detect low levels of adsorbed proteins. While programmable films could be integrated into a wide range of sensors, including the QCM (as described above), surface acoustic wave devices, cantilever beam sensors, and optical arrays, the sensor concepts explored in this project involve detecting changes in the electrochemical responses of controlled-porosity films. Changes in the current-voltage responses of such films can be extremely sensitive to the presence of adsorbed proteins, arising due to a variety of factors, including changes in interfacial impedance, and the extent to which pores are either blocked or accessible to electrochemically-active species in solution. Two different controlled-porosity materials were fabricated and tested as potential sensor platforms for detecting cell signaling proteins. The first material tested was a thin film of mesoporous silica deposited on conductive gold substrates10. In the synthesis procedure, solutions containing both silicate precursors (based on tetra-ethyl orthosilicate) and ordered

15
surfactant templates were deposited onto conductive metal substrates (gold electrodes). Hydrolysis and condensation reactions in the resulting film led to the production of a porous structure whose pore diameter was twice that of the surfactant chain length. The films studied here had a continuous, open, uniform, but disordered pore structure with a pore diameter of 8 nm (Fig. 9, left). The pores were then functionalized with amine groups by exposing the film to aminopropyltriethoxysilane. To test the response characteristics of the porous film, biotin groups were covalently attached to the surface amine groups. The biotin was used to capture streptavidin as a model protein to demonstrate how protein binding influences the current-voltage characteristics of the porous electrode structure. Streptavidin has a size (5 nm diameter) that is comparable to the dimensions of cell signaling proteins such as cytokines. The streptavidin also has a size that is comparable to that of the pores in the sensor layer. For model studies, current-voltage curves were obtained on solutions containing Fe(phen)3
2+ (tris(1,10-phenanthroline Fe(II)), Co(phen)3
2+, or Ru(NH3)63+ as redox-active indicators. In the absence of
streptavidin, each indicator undergoes redox reactions that generate high currents at voltages corresponding to the redox potential for the given species. However, in the presence of 0.8 nM solutions of streptavidin, no currents associated with redox active species were detected. This observation suggests that when proteins such as streptavidin are present in sufficient concentrations to block pores and pore surfaces, the indicator molecules cannot freely access the conductive surfaces of the electrode.
Streptavidin Concentration (fmole)0.1 10 1000 105
Cur
rent
(μA
/cm
2 )
60
40
20
0
open
blocked
Sensor Current for Streptavidin Adsorption
Detection Limit: 4 molecules/μm2
Dynamic Range: 105
Mesoporous Silica Film
Streptavidin Concentration (fmole)0.1 10 1000 105
Cur
rent
(μA
/cm
2 )
60
40
20
0
open
blocked
Sensor Current for Streptavidin Adsorption
Detection Limit: 4 molecules/μm2
Dynamic Range: 105
Streptavidin Concentration (fmole)0.1 10 1000 105
Cur
rent
(μA
/cm
2 )
60
40
20
0
open
blocked
Sensor Current for Streptavidin Adsorption
Detection Limit: 4 molecules/μm2
Dynamic Range: 105
Mesoporous Silica Film
Fig. 9: Left – Transmission electron micrograph showing the pore distribution in our mesoporous silica sensor layer (average pore size = 8 nm). Right – Current values (triangles) measured on biotinylated mesoporous silica sensor layers in the presence of the redox active indicator Ru(NH3)6
3+ as a function of the quantity of the protein streptavidin in solution. Binding of streptavidin lowers the current by blocking the pores (shown in cartoons). Once all the pores are blocked, no further current changes are observed regardless of how much streptavidin is added. More in depth studies were conducted10 in which the amount of streptavidin in solution was systematically varied from 0.1 to 105 femptomoles (10-7 to 0.1 nanomoles), and the maximum current associated with the redox indicator was monitored. Results on a 1 cm x 1 cm film (Fig. 9, right) show that for exposures from 10 femptomoles to 5 x 10⁴ femptomoles, the maximum film current is proportional to the logarithm of the moles of protein present, indicating that protein concentrations can be determined in a semi-quantitative manner over a dynamic range of
16
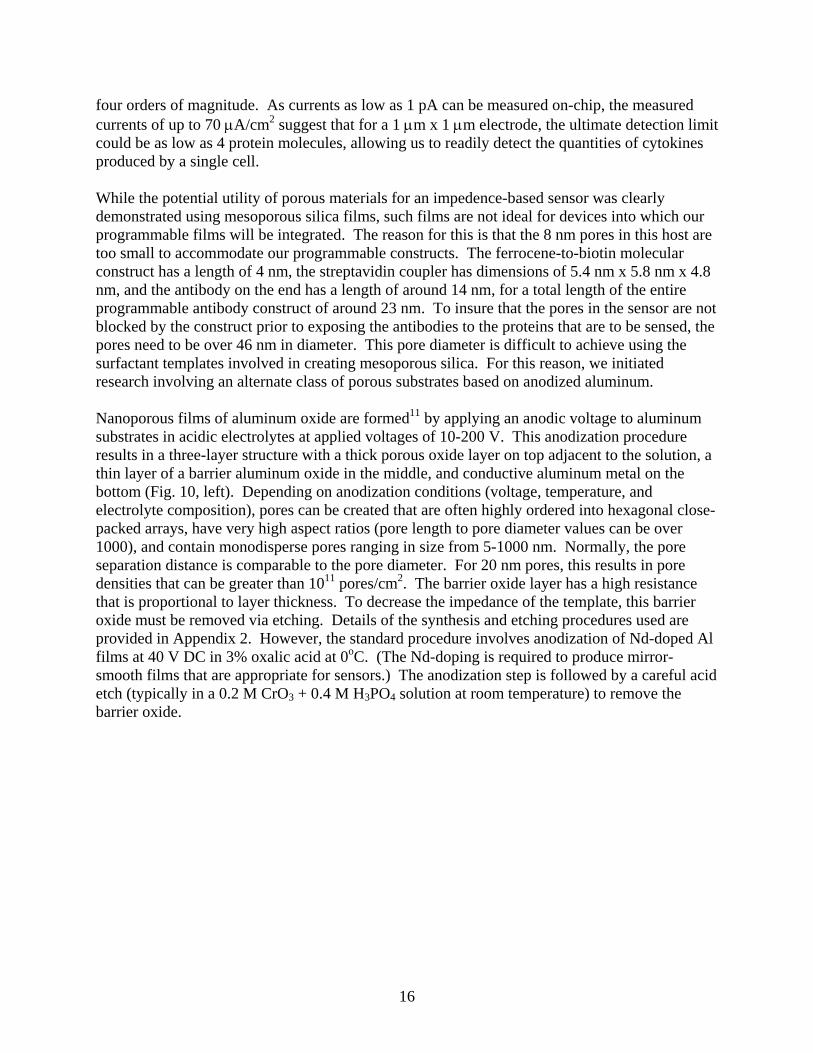
four orders of magnitude. As currents as low as 1 pA can be measured on-chip, the measured currents of up to 70 μA/cm2 suggest that for a 1 μm x 1 μm electrode, the ultimate detection limit could be as low as 4 protein molecules, allowing us to readily detect the quantities of cytokines produced by a single cell. While the potential utility of porous materials for an impedence-based sensor was clearly demonstrated using mesoporous silica films, such films are not ideal for devices into which our programmable films will be integrated. The reason for this is that the 8 nm pores in this host are too small to accommodate our programmable constructs. The ferrocene-to-biotin molecular construct has a length of 4 nm, the streptavidin coupler has dimensions of 5.4 nm x 5.8 nm x 4.8 nm, and the antibody on the end has a length of around 14 nm, for a total length of the entire programmable antibody construct of around 23 nm. To insure that the pores in the sensor are not blocked by the construct prior to exposing the antibodies to the proteins that are to be sensed, the pores need to be over 46 nm in diameter. This pore diameter is difficult to achieve using the surfactant templates involved in creating mesoporous silica. For this reason, we initiated research involving an alternate class of porous substrates based on anodized aluminum. Nanoporous films of aluminum oxide are formed11 by applying an anodic voltage to aluminum substrates in acidic electrolytes at applied voltages of 10-200 V. This anodization procedure results in a three-layer structure with a thick porous oxide layer on top adjacent to the solution, a thin layer of a barrier aluminum oxide in the middle, and conductive aluminum metal on the bottom (Fig. 10, left). Depending on anodization conditions (voltage, temperature, and electrolyte composition), pores can be created that are often highly ordered into hexagonal close-packed arrays, have very high aspect ratios (pore length to pore diameter values can be over 1000), and contain monodisperse pores ranging in size from 5-1000 nm. Normally, the pore separation distance is comparable to the pore diameter. For 20 nm pores, this results in pore densities that can be greater than 1011 pores/cm2. The barrier oxide layer has a high resistance that is proportional to layer thickness. To decrease the impedance of the template, this barrier oxide must be removed via etching. Details of the synthesis and etching procedures used are provided in Appendix 2. However, the standard procedure involves anodization of Nd-doped Al films at 40 V DC in 3% oxalic acid at 0oC. (The Nd-doping is required to produce mirror-smooth films that are appropriate for sensors.) The anodization step is followed by a careful acid etch (typically in a 0.2 M CrO3 + 0.4 M H3PO4 solution at room temperature) to remove the barrier oxide.

17
-2.5e-7 0 2.5e-7 5.0e-7 7.5e-7
-1.0e-6
-7.5e-7
-5.0e-7
-2.5e-7
0
E'
E''
Al2O3 pores (~500 um)Electrodes w/ 100 um gap100 um gap w/10x coverage
Ε”
Ε’
top
cross section
Monodisperse or bimodal porosity.Pore size: 5 - 1000 nm
Pore density: > 1011 pores/cm2
(20 nm pores)
Anodized Aluminum Complex Impedence
-2.5e-7 0 2.5e-7 5.0e-7 7.5e-7
-1.0e-6
-7.5e-7
-5.0e-7
-2.5e-7
0
E'
E''
Al2O3 pores (~500 um)Electrodes w/ 100 um gap100 um gap w/10x coverage
Ε”
Ε’-2.5e-7 0 2.5e-7 5.0e-7 7.5e-7
-1.0e-6
-7.5e-7
-5.0e-7
-2.5e-7
0
E'
E''
Al2O3 pores (~500 um)Electrodes w/ 100 um gap100 um gap w/10x coverage
Ε”
Ε’
top
cross section
top
cross section
Monodisperse or bimodal porosity.Pore size: 5 - 1000 nm
Pore density: > 1011 pores/cm2
(20 nm pores)
Anodized Aluminum Complex Impedence
Fig. 10: Left – Scanning electron micrographs of top views and cross sections of two different anodized aluminum sensor layers showing the size, distribution, and depth of the pores. The top image is for a film with 15 nm pores, while the bottom image is for a 500 nm thick film with 50 nm pores. Right – A plot of the real (E’) vs. the imaginary (E”) impedence measured on both bare gold electrodes (separated by 100 μm with small (2 mm droplets) and large droplet coverage areas) and a sensor sandwich with gold electrodes on the top and bottom of a 500 nm thick film of anodized aluminum (50 nm pores). The electrochemical responses of the nanoporous alumina films were characterized using electrochemical impedence spectroscopy (EIS)12 to determine the permittivity, parallel/serial capacitance, and resistance of the baseline sensor materials. The experiments were conducted on long parallel electrodes that were 100 μm wide. Reference measurements were obtained by applying AC voltages between gold working and counter electrodes that were spaced 100 μm apart. Measurements on the porous materials for the capacitive sensors were obtained by depositing a 500 nm thick layer of anodized aluminum on top of a gold working electrode, and vapor depositing a porous gold counter electrode on the upper surface of the film. (The porous structure in the upper counter electrode is defined by the porous architecture on the upper surface of the anodized alumina.) In all cases, the EIS response was measured for electrodes in contact with a 1 mM ferric/ferrocyanide solution in a phosphate buffer saline (PBS) solution at pH 7 and room temperature. In the standard experiment, a 2 mm diameter droplet (contact area = 0.03 cm2) was in placed on the electrodes. The complex permittivity results obtained via EIS (Fig. 10, right) show that the energy losses associated with charging the porous sensor film (as reflected in ε”, or the imaginary component of the permittivity) are orders of magnitude greater than the losses associated with bare electrodes. A model in which all pores are assumed to interact in series was utilized to extract capacitance and resistance values from the complex permittivity data for our electrode arrays as a function of frequency (Fig. 11). As expected, the results of this analysis show that bare gold electrodes exhibit a very low capacitance (around 10-7 F) that is frequency independent and is probably dominated by the capacitance associated with the electrical double layer. In contrast, the porous alumina film exhibits capacitance values that increase dramatically as the frequency is lowered, reaching values of around 0.1 F at a frequency of 10 Hz. This capacitance is 106 times greater than that exhibited by the bare gold, and represents the extent to which the response

18
characteristics of electrodes can be amplified by the presence of the porous film. The resistance of the porous film appears to be independent of frequency, representing a much smaller contribution to the overall signal than the capacitance at all frequencies. Unfortunately, the porous sandwich structures for the sensor electrodes were not completed in time to perform impedometric measurements on protein adsorption. However, assays that were performed on bare gold (see below) suggest that highly sensitive assays should be possible using the new electrode arrays.
100 101 102 103 104 105 10610-910-810-710-610-510-410-310-210-1100101
Frequency (Hz)
C
Al2O3 pores (~500 um)Electrodes w/ 100 um gap100 um gap w/10x coverage
100 101 102 103 104 105 106
0
100000
200000
300000
400000
Frequency (Hz)
R
C (F)
R (105 ohm)
1
4
3
2
100 101 102 103 104 105 10610-910-810-710-610-510-410-310-210-1100101
Frequency (Hz)
C
Al2O3 pores (~500 um)Electrodes w/ 100 um gap100 um gap w/10x coverage
100 101 102 103 104 105 106
0
100000
200000
300000
400000
Frequency (Hz)
R
C (F)
R (105 ohm)
1
4
3
2
C (F)
R (105 ohm)
1
4
3
2
Fig. 11: Values of both the capacitance (in farads) and resistance (in ohms) as a function of frequency extracted from the complex impedence data in Fig. 10 assuming that the response of each pore is in parallel. Note that while the capacitance of the device is roughly independent of frequency on the bare electrodes, it is inversely proportional to frequency in the porous sensor, reaching values that are up to 107 times those on the bare electrodes at low frequency. The results indicate that high signal amplification factors can be achieved at low frequencies by going to porous electrodes. Microfluidic Platforms A microfluidic platform suitable for studying the cell signaling cascades from single white cells was designed, built, and tested. The chip is shown in Fig. 12. The central region of the chip contains a patch clamp for capturing, retaining, and then releasing single cells. Application of a negative pressure to the patch clamp applies a force that immobilizes a cell within the central ring electrode. The outer central ring has a diameter of 50 μm, which is sufficiently large to accommodate white blood cells (having a diameter of 20-30 μm). The four corners of the platform contain fluidics ports for the introduction of nutrients or toxins to immobilized cells, as well as for collection of extra-cellular fluids. Fluids can also be harvested from underneath the cell through the patch clamp orifice. Electrode arrays are positioned in a variety of locations

19
relative to the patch clamp, primarily as drivers for overlying impedence sensors and their associated programmable films. Components of the microfluidic system that have been tested to date include the electrodes, the fluid ports, and the patch clamp used for the capture and release of single cells.
Micrograph of Sensor Platform
electrodes
patch clamp
fluidic portsVd = 10V
Vg2 = 5V
I in=3pA
Id1 Id2
Ibias = 500μA
-2V
on-chip
Equivalent circuit for on-chipFET amplifier
Micrograph of Sensor Platform
electrodes
patch clamp
fluidic portsVd = 10V
Vg2 = 5V
I in=3pA
Id1 Id2
Ibias = 500μA
-2V
on-chip
Micrograph of Sensor Platform
electrodes
patch clamp
fluidic portsVd = 10V
Vg2 = 5V
I in=3pA
Id1 Id2
Ibias = 500μA
-2V
on-chipVd = 10V
Vg2 = 5V
I in=3pA
Id1 Id2
Ibias = 500μA
-2V
on-chip
Equivalent circuit for on-chipFET amplifier
Fig. 12: Left – An optical micrograph of the “on-chip” laboratory platform for performing experiments on single cells. The large ring electrode in the center has a diameter of 50 μm. The patch clamp for capturing cells is the small dot in the center. Also apparent are electrodes on the top surface (both bars and rings), and fluidic ports. Electrodes are also present underneath the patch clamp orifice. Right – The equivalent circuit for the on-chip signal amplifiers (seen in circled region on left) that takes a 3 pA signal from the sensor and amplifies it into a signal of 500 μA. The primary electronic system that was designed and tested involves the introduction of on-chip field effect transistors to amplify and condition the raw signals generated by the sensor devices. As stated above, detecting a few protein molecules on the sensor device may involve currents as low as a few pA. To generate reliable results, it is necessary to amplify these small currents as close to the source as possible to eliminate the loss of signal due to random noise that is picked up between the chip and signal collection equipment. The locations of the preamplifiers are indicated in Fig. 13b. Current voltage measurements performed with these preamplifiers indicate that a 3 pA input current can be amplified on chip to provide an output current of 500 μA, for an amplification factor of over 108.

20
Fig. 13: A time sequence of images (moving from left to right) from a movie taken to document the capture of a white blood cell (white dots) by the central patch clamp. The cell of interest (red arrow) moves from the top of the frame to the patch clamp where it is captured and held in the third and fourth frames. Images are not evenly spaced in time, but the entire sequence occurred over the span of several seconds. Cell capture and release experiments were conduced using human white blood cells (macrophages)(Fig. 13). Fortunately, macrophages do not adhere strongly to any of the materials on the chip, but remain as free-floating species in solution under most conditions (see Biocompatibility Studies below). However, when a negative pressure is applied to the patch clamp, a single cell is captured within the central ring electrode. When a positive pressure is applied, the cell is released back into solution. Although cell capture and release has been demonstrated, no cell signaling experiments have yet been conducted on the cells, as the integrated sensor arrays around the cell capture zone were not completed before the project was terminated (see System Integration Studies below). Biocompatibility Studies All components in the on-chip laboratory will ultimately be in contact with complex fluids containing a wide range of proteins and the cells of interest. For proper functioning, the integrated device has to be configured to deal with two critical biocompatibility issues. The first issue involves biofouling. If proteins and cells irreversibly stick to channel walls, sensor components, and other functional units such as the patch clamp, the functionality of the device can be seriously compromised. As a preliminary screening test for biofouling, coupons representative of three types of surfaces (cyclodextrin, cylodextrin containing a ferrocene-biotin-streptavidin guest, and porous anodized aluminum) were exposed to a solution containing the fluorescently labeled protein albumin. Observations under a fluorescence microscope indicated

21
that albumin adsorption on all three surfaces was negligible, suggesting that our functionalized sensors should be antifouling under all use conditions. As stated above, the antifouling characteristics of our programmable surfaces relative to proteins (including albumin and casein) was confirmed in QCM experiments.
The second biocompatibility issue investigated involves cell viability. While it has been demonstrated that the patch clamp can capture macrophages, the artificial environment of the on-chip laboratory could be toxic to the cells, either killing the cells or stimulating them in such a way that cell signaling responses would be dominated by the local environment and not by species such as deliberately introduced pathogens. Two types of experiments were performed to determine if system components were harmful to mouse macrophages. Coupons with representative surfaces were added to growing mouse macrophage cell cultures. After 24 hours of incubation the cell solution was tested in the sensitive enzyme-linked immunosorbent assay (ELISA)13 to determine if the components had turned on an immune response. The cell solution was tested for the presence of the cytokine TNF alpha. If components are biocompatible, i.e., not harmful, there should be no TNF alpha response. The cells were also visually inspected. Healthy mouse macrophages will adhere to the surface to grow and produce a uniform monolayer of cells. In addition, propidium iodide was used to determine cell viability, since dead cells readily take up the dye and fluoresce. In a healthy cell culture, about 10% may be dead. If more than 30% are dead, the components are not deemed to be biocompatible. The results of the ELISA experiments demonstrated that the components of the cell platform device do not cause inadvertent cytokine responses. ELISA assays were performed using RAW 264.7 cells (mouse macrophages) to determine the concentrations of the cytokine TNF-alpha expressed after exposing the cells to various surfaces for 20-24 hours incubation at 37oC. Glass, anodized aluminum, streptavidin, tri-biotinylated ferrocine in DMSO, gold, and gold with cyclodextrin all had non-measurable TNF-alpha responses, similar to the negative controls (Fig. 14). The positive controls (such as LPS, lipopolysaccaride from E. coli) had a significant and measurable TNF-alpha response. None of the components of cell signaling system tested caused a TNF-alpha cytokine response in the RAW cells. All the system components tested showed they were biocompatible for the TNF alpha response in mouse macrophages.

22
RAW Cells, TNF alpha 09/22/06
0.0
0.2
0.4
0.6
0.8
1.0
1.2
450 nmAbsorbance
Glass Biotin.FerrDMSO
Streptavidinw/ label
AnodizedAl
TNF StandardsStreptavidin
Fig. 14: Results of the ELISA assay on white blood cells from mice (RAW cells) exposed to a range of different surfaces representative of the on-chip laboratory components investigated in this project. The assay was used to detect the quantity of the cytokine TNF alpha, where the absorbance is proportional to concentration. None of the surfaces, with the possible exception of a biotin surface contaminated with DMSO, generated any measurable cell-signaling response. In all cases, the response was at least an order of magnitude less than that generated by exposing the cells to a known cell-signaling trigger (lipopolysaccaride from E. coli).
RAW CellsControl cells - visual Control cells – Propidium Iodine
Cells with Anodized Al, oxalic acid, not rinsed Cells with Anodized Al, oxalic acid, not rinsed
RAW CellsControl cells - visual Control cells – Propidium Iodine
Cells with Anodized Al, oxalic acid, not rinsed Cells with Anodized Al, oxalic acid, not rinsed Fig. 15: Microscopy studies of cells on one of the few surfaces that had an adverse effect on cell viability (porous anodized aluminum contaminated with oxalic acid). Left - Changes in cell morphology (such as cell spreading) that are associated with apoptisis (programmed cell death) are apparent on anodized aluminum relative to a glass control. Right – Propidium iodine staining shows that a higher fraction of cells have died on the anodized aluminum surface. Neither of these adverse effects is observed if the anodized aluminum is rinsed to remove the oxalic acid. Visual inspection of cells exposed to various system components identified that while most surfaces support cell viability, a limited set of conditions promoted cell death. Three different cell types were tested: human epithelial cells (adherent), mouse macrophages (adherent RAW cells), and human monocytes. The human cell types were viable for at least two days on all

23
surfaces. However, while mouse macrophages were healthy on most surfaces, fluorescence micrographs clearly show that cells were activated and underwent apoptosis (programmed cell death) under certain conditions on anodized aluminum surfaces and on surfaces covered with the tri-biotinylated ferrocene (Fig. 15). Cell death was quantified by counting the percentage of cells that were labeled by the addition of propidium iodide (as living cells do not take up this substance). The summary of results obtained in the propidium iodide experiments (Table 1) confirmed the results of the optical micrographs, and also revealed that the cell deaths observed on anodized aluminum and the tri-biotinylated ferrocene were experimental artifacts not associated with the intrinsic properties of the surfaces. In the case of anodized aluminum, it was found that only those samples anodized in oxalic acid were toxic. The anodized aluminum could be rendered non-toxic either by careful rinsing to remove residual oxalic acid, or by anodizing in phosphoric acid. (In other words, it was the oxalic acid that was toxic and not the anodized aluminum.) For the case of the tri-biotinylated ferrocene, it was discovered that the DMSO used to enhance the solubility of the tripod was the source of the toxicity, and not the ferrocene itself. This was demonstrated by exposing solutions containing DMSO alone to the cells. DMSO concentrations of 3% and 1.5% caused cell death regardless of the presence of the ferrocene, while cells were healthy in the presence of ferrocene at DMSO concentrations of 0.15% and below. DMSO has been known to cause cell death, but at a concentration of 0.15%, DMSO is not lethal to our cells. Therefore, the ultimate conclusion is that all surfaces in our integrated devices can be prepared in such a way as to be non-lethal to cells provided that surface and solution contaminants are carefully controlled. Table 1: Results of the RAW Cell Viability Samples that were biocompatible (no negative effects on cell viability) Visual Inspection Propidium Iodine uptake Control (Media) Confluent Monolayer Less than 10% Glass Confluent Monolayer Less than 10% Gold Confluent Monolayer Less than 10% Gold+cyclodextran Confluent Monolayer Less than 10% Streptavidin Confluent Monolayer Less than 10% Tri Ferrocine in
0.15% DMSO Confluent Monolayer Less than 10% 0.15% DMSO Confluent Monolayer Less than 10%
Anodized Al, Oxalic acid,
rinsed Confluent Monolayer Less than 10%
Anodized Al, Phosphoric acid Confluent Monolayer Less than 10%
Sample that were NOT biocompatible (negative effects on cell viability) Visual Inspection Propidium Iodine uptake DMSO 3% Disrupted Monolayer More than 50% DMSO 1.5% Disrupted Monolayer More than 30% Tri Ferrocine
In 3% DMSO Disrupted Monolayer More than 50% Tri Ferrocine
24
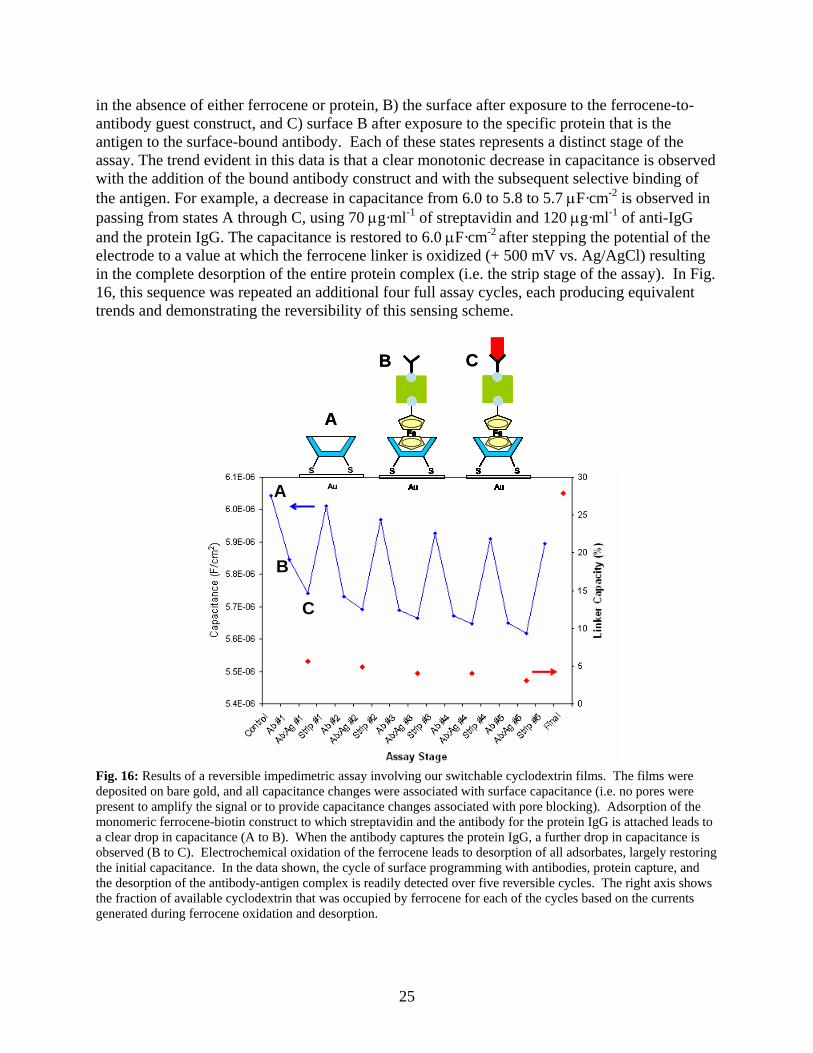
In 1.5% DMSO Disrupted Monolayer More than 30% Anodized Al, Oxalic acid, NOT rinsed Disrupted Monolayer More than 50% System Integration Studies and Protein Assays The key system integration activities required to create a working sensor for the cell signaling platform are: 1) integration of the impedance sensor into electrode arrays, and 2) integration of programmable cyclodextrin-ferrocene films into the impedance sensor. While there was insufficient time to build the completely integrated system, it was demonstrated that: 1) porous alumina electrodes could be incorporated into sensor array sandwich structures similar to those required for the actual platform (see Sensor Devices above), and 2) that the cyclodextrin films could be incorporated into planar, non-porous gold electrodes (see Switchable Films for Protein Capture). As the cyclodextrin films are designed to specifically adsorb from solution onto any gold surface, the presence of porosity should not interfere with this integration step. However, one unanswered integration question was whether or not protein adsorption with a switchable film could be detected using an underlying sensor electrode. While not ideal, the potential of impedimetric sensing was demonstrated in experiments we conducted using non-porous gold electrodes, as the porous alumina sandwich constructs were not available in time. These electrodes were coated with cyclodextrin host films and exposed to solutions containing the ferrocene-antibody guests. In contrast to the ultimate integrated sensor, the capacitance changes observed in these experiments were associated entirely with changes in interfacial capacitance, having no contributions or enhancements associated with a pore-blocking mechanism. The interfacial capacitance is a measure of the distribution of ions at the electrode:electrolyte interface, and is dominated by hydrated sodium and phosphate ions from the electrolyte. From a simple parallel plate capacitor model, the effective thickness of the dielectric layer between the plates is expected to increase from tenths of nanometers (the thickness of the electrical double layer in a 0.1 M phosphate buffer) to tens of nanometers (corresponding to the thickness of a fully-dense ferrocene-to-antibody layer), resulting in over an order of magnitude shift in interfacial capacitance. For tethered antibody films described in the literature (i.e. one use only, in sharp contrast to our reversible constructs), the linear dynamic range for bioanalyte detection via this class of impedimetric sensing is reported to be one to three orders of magnitude14. Interfacial capacitance changes of 0.04 to 1.2 nF have been reported for specific protein sensing with analyte concentrations of μg/ml to mg/ml15. While such responses are expected to be orders of magnitude less than those generated by the porous capacitors described above, the detection of any response could be used to indicate the potential viability of the overall sensor scheme. Figure 16 shows the experimental results for specific capacitance derived from the imaginary component of complex impedance spectra over a frequency range of 10 to 1 Hz. (This frequency range was selected because the interfacial capacitance of the electrode dominates the overall complex impedance response for these frequencies.) The calculated capacitance is plotted as a function of three different states of the sensing surface: A) the β-cyclodextrin terminated surface
25
in the absence of either ferrocene or protein, B) the surface after exposure to the ferrocene-to-antibody guest construct, and C) surface B after exposure to the specific protein that is the antigen to the surface-bound antibody. Each of these states represents a distinct stage of the assay. The trend evident in this data is that a clear monotonic decrease in capacitance is observed with the addition of the bound antibody construct and with the subsequent selective binding of the antigen. For example, a decrease in capacitance from 6.0 to 5.8 to 5.7 μF·cm-2 is observed in passing from states A through C, using 70 μg·ml-1 of streptavidin and 120 μg·ml-1 of anti-IgG and the protein IgG. The capacitance is restored to 6.0 μF·cm-2 after stepping the potential of the electrode to a value at which the ferrocene linker is oxidized (+ 500 mV vs. Ag/AgCl) resulting in the complete desorption of the entire protein complex (i.e. the strip stage of the assay). In Fig. 16, this sequence was repeated an additional four full assay cycles, each producing equivalent trends and demonstrating the reversibility of this sensing scheme.
A
B
C
S S
Au
S S
Au
Fe
S S
Au
Fe
S S
Au
Fe
S S
Au
FeA
B C
A
B
C
S S
Au
S S
Au
Fe
S S
Au
Fe
S S
Au
Fe
S S
Au
Fe
S S
Au
S S
Au
S S
Au
Fe
S S
Au
Fe
S S
Au
Fe
S S
Au
Fe
S S
Au
Fe
S S
Au
Fe
S S
Au
S S
Au
FeFe
S S
Au
Fe
S S
Au
S S
Au
FeFe
S S
Au
Fe
S S
Au
Fe
S S
Au
Fe
S S
Au
Fe
S S
Au
Fe
S S
Au
Fe
S S
Au
Fe
S S
Au
Fe
S S
Au
S S
Au
FeFe
S S
Au
Fe
S S
Au
S S
Au
FeFeA
B C
Fig. 16: Results of a reversible impedimetric assay involving our switchable cyclodextrin films. The films were deposited on bare gold, and all capacitance changes were associated with surface capacitance (i.e. no pores were present to amplify the signal or to provide capacitance changes associated with pore blocking). Adsorption of the monomeric ferrocene-biotin construct to which streptavidin and the antibody for the protein IgG is attached leads to a clear drop in capacitance (A to B). When the antibody captures the protein IgG, a further drop in capacitance is observed (B to C). Electrochemical oxidation of the ferrocene leads to desorption of all adsorbates, largely restoring the initial capacitance. In the data shown, the cycle of surface programming with antibodies, protein capture, and the desorption of the antibody-antigen complex is readily detected over five reversible cycles. The right axis shows the fraction of available cyclodextrin that was occupied by ferrocene for each of the cycles based on the currents generated during ferrocene oxidation and desorption.
26
While the results of the assay are encouraging, indicating that small quantities of protein can be sensed in a reversible fashion, the results also suggest that response characteristics could easily be boosted by orders of magnitude. First, as pointed out above, the capacitance changes that were observed much less than predicted based on simple capacitance models (5-10% instead of factors greater than 10). The primary reason for this is that the experiments were conducted using the mono-ferrocene construct. The monoferrocene has a relatively low affinity for the surface (see Switchable Films). In fact, the currents measured via electrochemical stripping suggest that only 5% of the total cyclodextrin surface was occupied by ferrocene in the experiment shown. The result of incomplete surface coverage and inefficient antibody packing allowed ions from the electrolyte to penetrate the deposited film, decreasing the net capacitance change. Use of the tri-ferrocene construct, with its higher surface affinity, could boost surface coverages and capacitance changes by an order of magnitude relative to experiment shown. Second, the measurements were performed on a flat electrode. Going to the porous constructs would enhance the signal, both by introducing the pore blockage mechanism as well as by simply increasing the net available area of the capacitor. To test the latter boosting mechanism, gold electrodes were anodically roughened prior to cyclodextrin deposition, increasing surface areas 50-60 fold. This roughening produced measured specific capacitance changes of 8 to 12 μF/cm2 (compared with 0.1 μF/cm2 for the flat substrate, for an additional amplification factor of as much as 120 fold). Summary Three distinct components were developed and tested that could be utilized in an “on-chip” laboratory for detecting the expression of cytokines and other proteins by single cells such as white blood cells: 1) active films that can be reversibly programmed with antibodies to capture specific proteins, 2) porous impedimetric sensor layers that can be used to sense low quantities of proteins over a dynamic range of several orders of magnitude, and 3) the on-chip laboratory itself, which contains a patch clamp for capturing single cells, fluidic channels for introducing both nutrients and toxins to those cells, and sensor electrodes for detecting the proteins expressed by cells when the cells are exposed to environmental threats. All major components were tested and shown to meet requirements for both functionality and biocompatibility. Unfortunately, time and resources ran out before the integration of all three components could be achieved so that the integrated system could be used in actual cell-signaling experiments. However, it is hoped that the components developed here will be available for a wide range of future systems aimed at studying cellular responses at the single cell level. Such systems could be used not only for Homeland Security applications, but for the pre-screening of the toxicity of nanomaterials, for fundamental studies of the mechanisms associated with the human immune system, and other problems in cellular biology.

27
References
1. S. K. Dower, Nature Immunol., 5, 367 (2000) 2. B. C. Bunker, “Reversible Switching of Interfacial Interactions,” invited paper submitted
to Materials Science and Engineering Reports 3. A. Harada, Acct. Chem. Res., 34, 465 (2001) 4. P. C. Weber, J. J. Wendoloski, M. W. Pantoliano, and F. R. Salemme, J. Am. Chem.
Soc., 114, 3179 (1992) 5. M. Beulen, J. Bugler, B. Lammerink, F. Geurts, e. Biemond, K. Van Leerdam, F. Veggel,
J. Engbersen, and D. Reinhoudt, Langmuir, 14, 6424 (1998) 6. M. J. Farrow, K. R. Zavadil, D. L. Pile, and B. C. Bunker, “Probing redox controlled
protein desorption of inclusion complexes between b-cyclodextrin and biotinylated ferrocene,” submitted to J. Phys. Chem. B
7. M. J. Farrow, K. R. Zavadil, D. L. Pile, W. B. Yelton, and B. C. Bunker, “Reversible electrochemical patterning of antibodies at self-assembled monolayers of b-cyclodextrin,” submitted to Langmuir
8. K. R. Zavadil, M. J. Farrow, D. L. Pile, and B. C. Bunker, “Electrochemical stability of b-cyclodextrin self-assembled mnolayer films used for redoc controlled protein assays,” submitted to J. Electrochem. Soc.
9. E. Coutouli-Argyropoutou, A. Kelaidopoulou, C. Sideris, and G. Kokkinidis, J. Electroanal. Chem., 477, 130 (1999)
10. J. Liu and Q. Huo, Appl. Phys. Lettl, 87, 133902 (2005) 11. J. De Laet, J. Scheers, H. Terryn, J. Vereecken, Electrochim. Acta, 38, 2103 (1993) 12. J. De Laet, H. Terryn, and J. Vereecken, Electrochim. Acta, 41, 1155 (1996) 13. M. T. Madigan, J. M. Martinko, and J. Parker, Biology of Microorganisms (Ninth
Edition), Prentiss Hall, Upper Saddle River, New Jersey, 2000 14. E. Katz and I.l Willner, Electroanal., 15, 913 (2003) 15. M. Knichel, P. Heiduschka, W. Beck, G. Jung, and W. Gopel, Sensors & Actuators B, 28,
85 (1995)

28
Appendix 1 Synthesis of β-Cyclodextrin Derivatives for Surface Modification. β-cyclodextrin periodo β-cyclodextrin (1)1: 20.05g of triphenylphosphine (TPP) (80 mmol) was added to a 250 ml round bottom flask and purged with Ar (or N2) for 30 minutes. 80 ml of anhydrous dimethylformamide (DMF) was injected and after the TPP had dissolved 20.25 g of iodine (76.5 mmol) was added over the course of 10 minutes. 5.8 g of β-cyclodextrin (5.1 mmol) was then added, a condenser was attached and the resultant solution was heated to 70oC in an oil bath overnight while under Ar. The solution was reduced to half volume by rotary evaporation. 30ml of methanol containing 2.1g of sodium metal (prepared under Ar) was added to the solution. The resulting solution was stirred under Ar for 30 minutes. The solution was concentrated to ~100 ml by rotary evaporation and cooled in an ice bath. The resulting precipitate was collected by filtration and rinsed with cold methanol. The resulting solid was placed in a Soxhlet extractor and extracted overnight using methanol. 3.70g of 1 obtained (65% yield). Good by NMR and MS. periodo β-cyclodextrin (1) perazido β-cyclodextrin(2): 2.1 g of 1 (1.1 mmol) and 0.70g of sodium azide (10.8 mmol) were placed into a 50 ml RB flask along with 35 ml of anhydrous DMF. A condenser was attached; the system was put under N2 and heated to 60oC in an oil bath for 20 hours. The solvent was reduced to ~3 ml by rotary evaporation, 30 ml water added and the resulting precipitate was filtered and rinsed with water. Dried overnight under vacuum to give 1.56 g of 2. Good by NMR and MS. perazido β-cyclodextrin (2) peramino β-cyclodextrin (3): 1.08g of 2 and 3.2g of TPP placed in a round bottom flask and purged with Ar for 30 minutes. 20 ml anhydrous DMF were injected and the solution stirred under Ar for 4 hours until no more N2 gas bubbles were formed. 3 ml of 20% ammonium hydroxide was injected and the solution stirred overnight under Ar. Concentrated to several ml by rotary evaporation. 20 ml ethanol added and the solution was filtered. The filtrate was rinsed with ethanol. 710 mg of 3 (85% yield) was obtained. Good by NMR and MS. Periodo β-cyclodextrin (1) perthio β-cyclodextrin (4)2: 1.0g of 1 (0.53 mmol) and 7.0g of thiourea (90 mmol) were dissolved in 40 ml of DMF and heated to 75oC while stirring under Ar. The solution was cooled after 18 hours and poured into 120 ml of diethylether. The resulting solution was cooled overnight at 4oC. The solution was filtered and rinsed with acetone. The precipitate was dissolved in 30 ml of 1M sodium hydroxide and 280 mg of sodium disulfide and stirred for 30 minutes. The pH was adjusted to 3 using concentrated HCl and then cooled overnight at 4oC. The solution was filtered and the precipitate rinsed with water to 100mg of 4 (15% yield). Good by NMR. Perazido β-cyclodextrin (2) (5) (R= Me, C16H33, EG3) A number of different modifications to the rim of β-cyclodextrin containing the secondary alcohols were conducted. The following is a representative case. 220 mg of 2 (0.17 mmol) and 315 mg (7.9 mmol) of sodium hydroxide

29
(60% by weight) were placed into a 50 ml round bottom flask and purged with N2 for 30 minutes. 30 ml of anhydrous DMF were added and the solution was stirred overnight. The solution was then cooled in an ice bath and the halogen added (2.85 g, 8.0 mmol of iodohexadecane). The solution was stirred under N2 for 4 days. Filtered and rinsed with hexane. Further purification done in subsequent steps. Taken on in the same sequence as 2 3 8. Good by NMR. Perazido β-cyclodextrin (2) (6)3 430 mg of 2 (0.33 mmol), 1.45 g of ethylene carbonate (16.5 mmol), 50 mg of potassium carbonate (3.6 mmol) and 10 ml of tetramethyl urea were placed into a 50 ml round bottom flask and heated to 150oC for 5 hours under N2. Concentrated by rotary evaporation. Column run using lipiphilic sephadex with methanol as the elutant. 490 mg of 6 obtained (76% yield). Good by NMR. Taken on in the same sequence as 2 3 8.
O
OH
O
OHHO7
O
I
O
OHHO7
O
N3
O
OHHO7
O
NH2
O
OHHO7
O
SH
O
OHHO7
O
N3
O
ORHO7
O
N3
O
OHO7
TPPI2
Thiourea
NaN3TPP
NH4OH
NaHRBr
K2CO3Ethylene carbonate
O
OH
1 2 3
4 5 6
Synthesis of disulfide carboxylic acids (7).4 A number of different disulfide carboxylic acids were synthesized. The following is a representative case and the most commonly used material in the synthesis of 8. 50 ml of anhydrous methanol was placed into a 100 ml round bottom flask and N2 was bubbled through the solution for 1 hour. 500 mg of 11-mercaptoundecanoic acid (2.29 mmol) and 0.60 ml of 1-bromododecane (2.52 mmol) were added. After the material had dissolved a chunk of sodium metal (~50-100 mg) was added and the solution stirred overnight under N2. Extreme caution should be used in handling Na metal as it bursts into flame on exposure to water. The material should be added to a cooled solution. The solution was then poured into a beaker containing 300ml of diethylether, 100ml of water, and 5 ml of concentrated HCl. The organic layer was removed and rinsed with water several times. The organic layer was then dried with MgSO4, filtered, and concentrated using rotary evaporation. 747mg of 7 collected (84% yield). Good by NMR. Peramino β-cyclodextrin (3) perdisulfide modified β-cyclodextrin (8)5 a number of different tethering tails were used to modify 3. The following is a representative example. 230 mg of 1-hydroxybenzotriazole (1.7 mmol) (HBT) and 640 mg of 7 (1.65 mmol) were placed into a 100ml round bottom flask and purged with N2 for 30 minutes. 30 ml of anhydrous DMF was injected

30
and the solution was cooled in an ice bath. 1.6 ml of 1.0 M DCC (N,N’-dicyclohexylcarbodiimide) in dichloromethane was injected and the solution was stirred under N2 while cooling for one hour and at ambient temperature for one additional hour. 294 mg of 3 (0.26 mmol) and 0.20 ml of ethyl morpholine (1.58 mmol) were added and the solution stirred under N2 overnight. Solution was concentrated by rotary evaporation. The material was brought up in petroleum ether and water. The organic layer was separated and rinsed with water and brine. A column was run using silica gel and 19:1 chloroform:methanol as an elutant. 404 mg of 8 obtained (47% yield). Good by NMR.
O
NH2
O
ORHO7
O
NH
O
ORHO7
OS
n n
HOSH Br
O
nn
+Na
EtOHHO
S
O
n n
DCCHBTHO
S
O
n n+
7
7
3 8 Synthesis of ferrocene-biotin compounds N-hydroxysuccinimide-biotin EG2-Biotin (9) 235mg of (+)-biotin N-hydroxysuccinimide ester (0.69 mmol) (NHS-biotin) was placed into a 50 ml round bottom flask and purged with N2 for 30 minutes. 10ml of anhydrous DMF was injected and the solution was cooled in an ice bath. 0.47 ml of 4,7,10-trioxa-1,13-tridecane diamine (2.1 mmol) was injected and the solution was stirred overnight under N2 while warming to ambient temperature. The solution was filtered and concentrated by rotary evaporation. Diethyl ether was added and the material was crushed to fine particles and filtered. The particles were rinsed thoroughly using diethyl ether. 300 mg of 9 was obtained (97% yield). Good by NMR. EG2-Biotin (9) mono FeCp2-B (10) 90 mg of ferrocene acetic acid (0.37 mmol), 150 mg of 9 (0.34 mmol), and 50 mg of 1-hydroxybenzotriazole (0.37 mmol) were placed into a 50 ml round bottom flask and purged with N2 for 30 minutes. 10 ml of anhydrous DMF was injected and the solution was cooled in an ice bath. 0.36 ml of 1.0M DCC in dichloromethane was injected and the resulting solution was stirred for 2 days under N2. The solution was filtered and concentrated by rotary evaporation. A column was run on silica gel using a 3:1 1:1 ethylacetate:methanol gradient. 110mg of 10 was obtained (48% yield). Good by NMR.
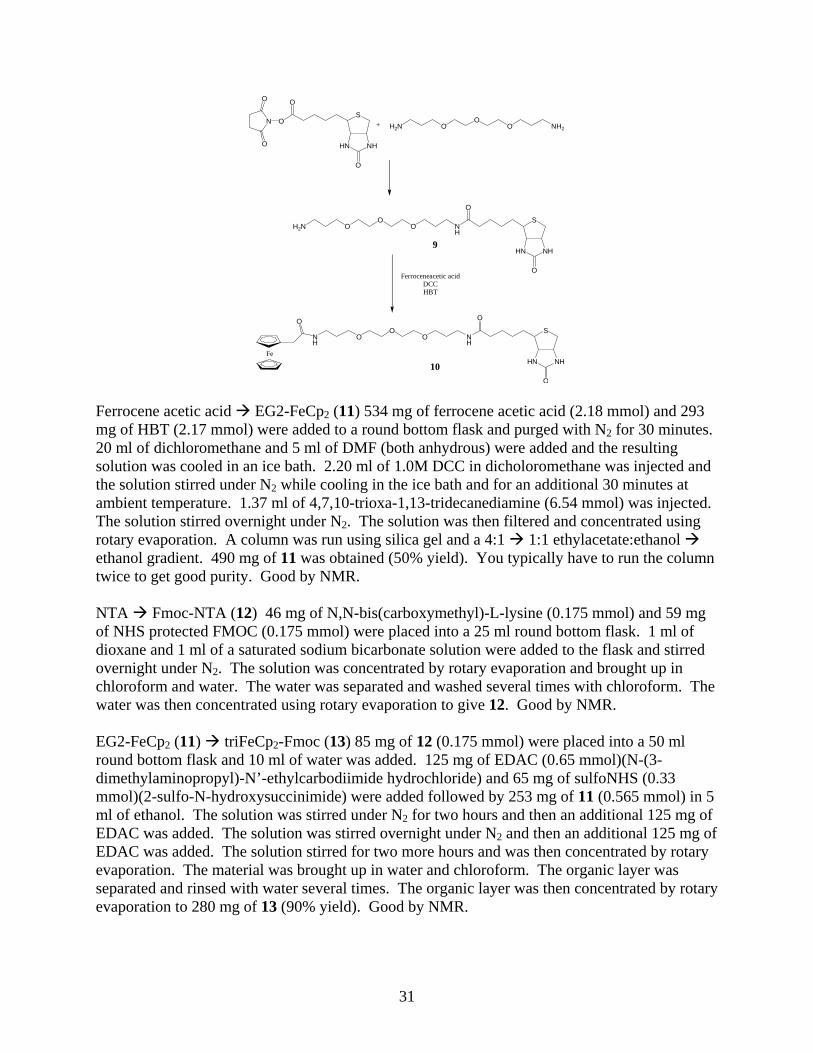
31
Fe
O
O
O
S
HN NH
O
N
O
O
H2N OO
O NH2+
NH
O
S
HN NH
O
H2N OO
O
Ferroceneacetic acidDCCHBT
NH
O
S
HN NH
O
NH
OO
O
9
10
Ferrocene acetic acid EG2-FeCp2 (11) 534 mg of ferrocene acetic acid (2.18 mmol) and 293 mg of HBT (2.17 mmol) were added to a round bottom flask and purged with N2 for 30 minutes. 20 ml of dichloromethane and 5 ml of DMF (both anhydrous) were added and the resulting solution was cooled in an ice bath. 2.20 ml of 1.0M DCC in dicholoromethane was injected and the solution stirred under N2 while cooling in the ice bath and for an additional 30 minutes at ambient temperature. 1.37 ml of 4,7,10-trioxa-1,13-tridecanediamine (6.54 mmol) was injected. The solution stirred overnight under N2. The solution was then filtered and concentrated using rotary evaporation. A column was run using silica gel and a 4:1 1:1 ethylacetate:ethanol ethanol gradient. 490 mg of 11 was obtained (50% yield). You typically have to run the column twice to get good purity. Good by NMR. NTA Fmoc-NTA (12) 46 mg of N,N-bis(carboxymethyl)-L-lysine (0.175 mmol) and 59 mg of NHS protected FMOC (0.175 mmol) were placed into a 25 ml round bottom flask. 1 ml of dioxane and 1 ml of a saturated sodium bicarbonate solution were added to the flask and stirred overnight under N2. The solution was concentrated by rotary evaporation and brought up in chloroform and water. The water was separated and washed several times with chloroform. The water was then concentrated using rotary evaporation to give 12. Good by NMR. EG2-FeCp2 (11) triFeCp2-Fmoc (13) 85 mg of 12 (0.175 mmol) were placed into a 50 ml round bottom flask and 10 ml of water was added. 125 mg of EDAC (0.65 mmol)(N-(3-dimethylaminopropyl)-N’-ethylcarbodiimide hydrochloride) and 65 mg of sulfoNHS (0.33 mmol)(2-sulfo-N-hydroxysuccinimide) were added followed by 253 mg of 11 (0.565 mmol) in 5 ml of ethanol. The solution was stirred under N2 for two hours and then an additional 125 mg of EDAC was added. The solution was stirred overnight under N2 and then an additional 125 mg of EDAC was added. The solution stirred for two more hours and was then concentrated by rotary evaporation. The material was brought up in water and chloroform. The organic layer was separated and rinsed with water several times. The organic layer was then concentrated by rotary evaporation to 280 mg of 13 (90% yield). Good by NMR.
32
triFeCp2-Fmoc (13) triFeCp2-NH2 (14) 140 mg of 13 (.079 mmol) was placed into a 50 ml round bottom flask and purged with N2 for 30 minutes. 19ml of anhydrous DMF and 1 ml of piperidine were injected and the solution stirred overnight under N2. The solution was concentrated using rotary evaporation. A column was run using lipiphilic sephadex with chloroform as the elutant. 72 mg of 14 was obtained (58% yield). Good by NMR. triFeCp2-NH2 (14) triFeCp2-B (15) 72 mg of 14 (0.046 mmol) and 70 mg of NHS-biotin (0.20 mmol) were added to a 25 ml round bottom flask. 5 ml of anhydrous DMF and ~0.01 ml of triethylamine were added and the resulting solution was stirred under N2 for two days. The solution was concentrated by rotary evaporation. A column was run using lipiphilic sephadex with chloroform as the elutant. 46mg of 15 was obtained. Only about 50% 15 and 50% 14 by NMR.
Fe
ONH
ONH
O O O
Fe
O
NHO
NHO
OO
FeO
HNO
NH
OO
O
N NH
FMOC
Fe
ONH2N
HO O O
Fe
OOH NH2H2N O O O
Fe
ONH2N
HO O O HO
O
HOO
HO O
N NH
Fe
O
HN
O
HNOOO
Fe
O
HNO
HNO
OO
FeO
NHO
HN
OO
O
NH2NFe
ONH
ONH
O O O
Fe
O
NHO
NHO
OO
FeO
HNO
NH
OO
O
N NH
OS
HN NHO
OS
NHHNO
ONO
O
FMOC
+
DCC
DMF
+EDAC SulfoNHS
PiperidineDMF
TEA
H2OEtOH
DMF
11 1213
1415
11
HBT
1)J. Org Chem. 1996, 61, 903 2)J. Am. Chem. Soc. 1995, 117,336 3)Langmuir 2003, 4463 4)Langmuir, 1988, 4,365 5)Chem. Eur. J. 2000, 6, 1176 NOTE: Compounds 11 and 14 (and possibly 15) decompose over time (amine reaction w/ amide?) and should be taken to the next step as soon as possible.

33
Appendix 2 Fabrication and Characterization of Anodized Aluminum Oxide Films This appendix includes contributions from Jessica Weber (grad student; summer intern), University of South Florida, Department of Mechanical Engineering, and Dmitri Brevnov (assistant professor), The University of New Mexico, Department of Chemical and Nuclear Engineering. It is clear that the procedure for preparation of AAO membranes is well known and does not require sophisticated instrumentation. In spite of the simplicity of its fabrication method (which can be accomplished with just a power supply), the processes that take place during anodization are complex. The AAO membrane consists of three distinct layers: aluminum metal, a thin barrier oxide layer, and a relatively thick porous oxide layer. The electrochemical reaction (oxidation of Al to produce Al2O3), takes place on the Al metal / barrier oxide layer interface. However, the process that limits the overall rate of oxidation is ionic migration in the barrier oxide layer. The thickness of this layer depends upon the anodization voltage. During anodization at a constant DC voltage, the thickness of the barrier oxide layer remains constant, because the rate of alumina dissolution on the electrolyte side is equal to the rate of alumina production on the metal side. The diameter of the pores and the inter pore distance depend upon the anodization voltage, temperature and solution composition.6, 7 It is of particular importance for design of nano-pore capacitance (the long term objective of this project) to chose the experimental conditions that result into a high ratio of the inter pore distance to the pore diameter and pore length. A two-electrode configuration with a platinum cathode is used to fabricate AAO membranes. Anodization is performed at 40 V DC, in 3% oxalic acid and at 0-1 °C. The solution is constantly and vigorously stirred by bubbling of nitrogen though the solution. DC voltage is provided with a HP 4140 pA Meter / DC Voltage Source. The power supply is controlled via a GPIB interface by custom designed LabWindows software that provides the operator with a friendly Graphical User Interface. The current time data are displayed and recorded to a file for further processing. Figure 1 shows a typical current transient that indicates that pore formation begins approximately 2 minutes after the DC voltage is applied. A steady state current is reached in approximately 5 minutes. The constant, steady state DC current is consistent with the fact that the thickness of the barrier layer (and, as a result, the limiting step of the overall process) does not change during anodization.

34
Figure 1: A typical current-time curve during anodization of an aluminum piece.
A method that provides more information on the dielectric properties of aluminum metal / aluminum oxide / electrolyte interface is Electrochemical Impedance Spectroscopy (EIS). EIS experiments were performed in the reported period with an IM6e Impedance measurements unit and commercial Flink software. Figure 2 shows the EIS data collected with the same working Al electrode as used for anodization, but with a Pt wire reference electrode and a Pt mesh counter electrode, at open circuit potential, a 10 mV AC voltage over a wide frequency range (10 Hz - 100 kHz). The experiments are performed before and after anodization at 40 V for 4 minutes. Respectively, the collected impedance data are fitted to two different equivalent circuits.8,9 The fitting procedure permits us to determine the barrier layer capacitance (Cbl). The geometric electrode area (A) is estimated to be 1.8 cm2 and dielectric constant is assumed to be 9.0.7 The barrier oxide layer thickness (d) can be found according to the following equation.
Figure 2: Electrochemical Impedance Spectroscopy data collected before and after anodization of an aluminum piece.
Cbl = εε0 A / d;

35
The EIS measurements are performed after an aluminum piece has been sequentially anodized at a number of different DC voltages. Figure 3 summarizes the results of these experiments. Under the assumption that the suggested equivalent circuits adequately describe the impedance data, the barrier oxide thickness is found to be a linear function of anodization voltage. The anodizing ratio is determined to be 1.3 nm/V and is consistent with values (1.3 – 1.4 nm/V) available from literature.6,7
Figure 3: Thickness of the barrier oxide layer as a function of anodization voltage.
The two-step anodization procedure is required in order to fabricate highly ordered AAO membranes. A better understanding of the anodization process, obtained by EIS experiments, allows us to judicially choose the experimental conditions. The intermediate step in the two-step procedure is etching of the alumina layer in a mixture of chromic and phosphoric acids. The barrier layer thickness is found to be a good indicator of a time period necessary for etching. As shown in Figure 4, the barrier layer thickness rapidly decreases at elevated temperatures. The etching time must be sufficient in order to almost completely dissolve both porous and barrier oxide layers. The barrier oxide layer after etching is only approximately two times thicker than the native oxide layer. Under these conditions, the second anodization results in highly ordered AAO membranes. AFM (contact mode, in air) and SEM (Figures 5 and 6, respectively) are applied in order to evaluate the nanopore arrangement on the surface of AAO membranes. The ordered hexagonal structures can be readily seen on both images.
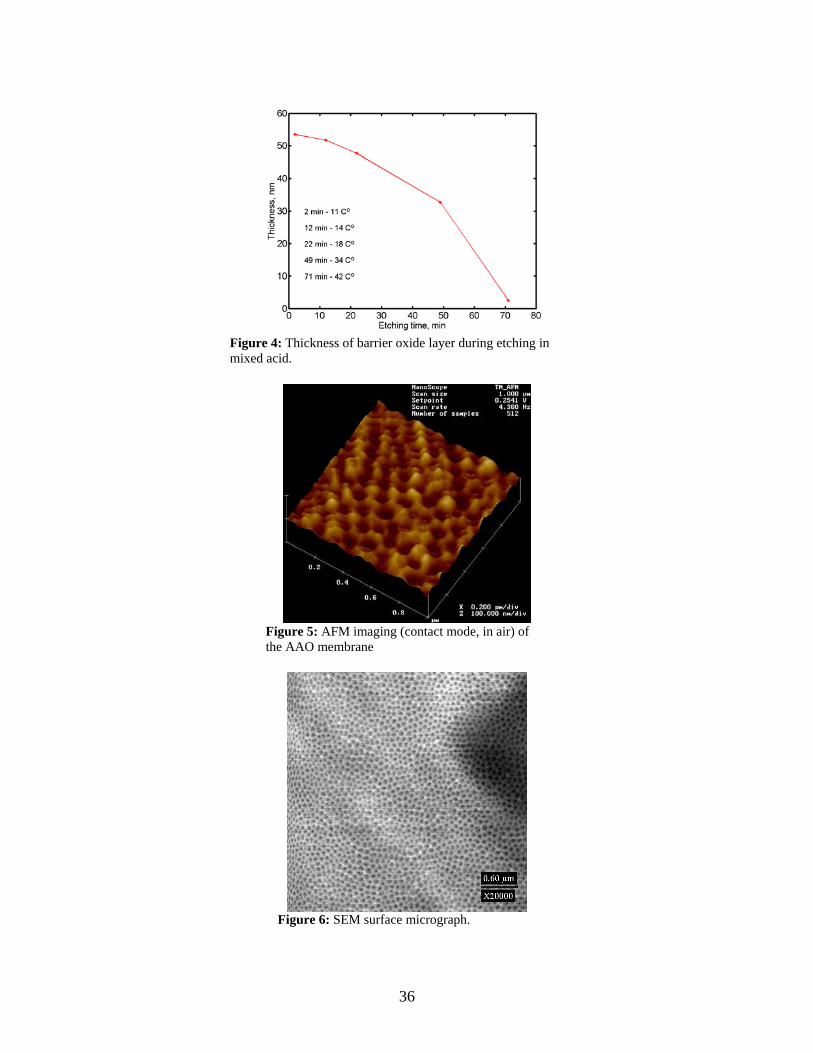
36
Figure 4: Thickness of barrier oxide layer during etching in mixed acid.
Figure 5: AFM imaging (contact mode, in air) of the AAO membrane
Figure 6: SEM surface micrograph.

37
Distribution: 1 MS0123 D. Chavez, LDRD Office (electronic copy) 1 MS0899 Technical Library (electronic copy) 1 MS0889 Kevin Zavadil, 1825 1 MS1411 Bruce Bunker, 1816 1 MS1411 Judy Hendricks, 1816 1 MS1411 Jim Voigt, 1816 1 MS1413 George Bachand, 8331 1 MS1413 Andrew Boal, 8331 1 MS1413 Grant Heffelfinger, 8330 1 MS1413 Roberto Rebeil, 8332 1 MS1425 Graham Yelton, 1725 1 MS1455 Matt Farrow, 2555 1 MS0892 Susan Brozik, 1714 Jun Liu Pacific Northwest National Laboratory PO Box 999 K3-59 Richland, WA 99352
