integrated in vitro and in vivo approaches to drug
TRANSCRIPT

INTEGRATED IN VITRO AND IN VIVO APPROACHES TO DRUG METABOLISM INVESTIGATION - A STUDY CASE
Massimiliano Fonsi
Meet the Experts Transporter Conference Seoul - November 14 2019
EVERY STEP OF THE WAY
Introduction
An ideal in vitro DMPK model should include all the pathways that are relevant for the PK in vivo.Quantitative scaling to whole organ/body is essential for the prediction of exposure of parentdrug and its metabolites in vivo.
The liver is generally considered the organ most involved in metabolic transformations and invitro screening systems are based essentially on liver tissue fractions. More frequently,metabolism in the gut is also considered. Conversely, metabolism in other organs is rarely takeninto consideration.
The case study presented today will offer an example of
1) The experimental evidence that should trigger the investigation of extrahepatic metabolism2) The differences that may exist between preclinical species and humans*3) The impact of extrahepatic metabolism on screening cascades and decisions process in a
drug discovery project.
*Extrahepatic metabolism may complicate the IVIVC in rats.Fonsi M - Drug Metab Lett. 2014;8(1):51-66.
2

Discovery of MK-4827 (Niraparib)
Poly(ADP-ribose)polymerase (PARP) as a context specific anti-cancer target
3

• Most anticancer drugs in use today have a low therapeutic index
Can we selectively kill tumor cells?The Synthetic Lethality approach
• Two strategies to improve high therapeutic index
Target-driven - Target only in cancer cells Context-driven
Inhibitor Inhibitor
Survival Death
4

PARPi as context-specific anti-cancer agents
PARP recruited
and Parylation
Cell Survival
DNA single strand break
PARP1
PARP1X
PARP
inhibition
Unrepaired SSB
collapses to DSB
Repaired by
homologous
recombination (HR)BRCA2
BRCA1
Cell
Death
BRCA
deficient cells
PARP1
Cell Survival
PARP inhibition selectively kills
BRCA deficient cancer cells
Recruitment of
BER machinery
5

PARPi’s in BRCA-deficient cells
Selectively kill BRCA-deficient cells in vitro
L-001758092Log [M]
-10 -9 -8 -7 -6 -5
%C
on
t. G
row
th
0
20
40
60
80
100
120
HeLa wtHeLa shBRCA1
CC50= 10uM
CC50= 7nM
Prevents tumor formation in mice when implanted
with BRCA -/- cells but not WT cells
0
20
40
60
80
0 15 30 45 60 75 90 105
Days
Fre
qu
en
cy o
f
Tu
mo
r F
orm
ati
on
(%
)
BRCA2- / PARPi
BRCA2- / Veh
WT / Veh
WT / PARPi
Farmer, Nature 2005
PARP inhibition selectively blocks
growth of BRCA2-deficient tumors
6

First Generation of PARP inhibitors
• First PARPi were based on the cleavage product -nicotinamide
N
O
N
H
H
HO
H O
N
OH
HO
N
O
NH2
SynEnergetically favoured
but not active
AntiActive conformation
N
NH2
O
NH
O
N
R
InternalH-Bond
NH
O
NH
O
NN
N
N
R
H
R
Place amide in heterocyclic ring
Constrain amidein fixed conformation
Indazole series
7

Initial profiling of the prototype PARP inh: early detection of series releted liabilities
N
N
O NH2
R
Where R= Ph
Permeability (Papp) = 5 (cm*10E-6/s)) (LLC-PK1);
ER (BA/AB in LLC-PK1 humMDR1) = 12
ER (BA/AB in LLC-PK1 mouseMdr1) = 17
Enzyme Inhibition
CYP450 (IC50)
3A4, 2D6, 2C9, 2C19, 1A2 >50 µM
Enzyme Induction
hPXR 74% rifampicin effect @ 25 µM (weak inducer)
No CYP3A4 induction in HH @ 30 µM
Off-Target
hERG 9.7 µM
Nav1.5 (0.2 + 3 Hz) 19µM
Solubility 0.02 mg/mL (water);
LogP = 2.4 – TPSA=61
8

NMe2
N
N
NMe
NHMe
NHiPr
NHMe
NHMe
HN
NH
N° R
PARP-1
IC50/nM
PARylation
EC50/nM
rat liver micr.
CLint
((µl/min)/mgP)
rat CL
((ml/min)/kg)
7 3.7 110 177 >250
8 1.9 180 29 107
9 31 1100 34 8
10 3.8 68 28 220
11 6.7 700 18 131
12 3.7 58 9 58
13 16 110 11 30
14 3.1 31 22 ND
15 3.2 24 11 47
N
N
O NH2
R
Rat liver microsomes
R = 0.09
-1
-0.5
0
0.5
1
1.5
2
2.5
3
0.5 1 1.5 2 2.5 3
log in vivo CL [ml/min]
log
liv
er
uS
CL
int
[ul/
(min
*mg
Pro
t)]
rat liver uS
No better correlation using Hepatocyte
Cpds were stable in rat plasma
No improvements correcting CLp by B-to-P ratio or by renal CL
9
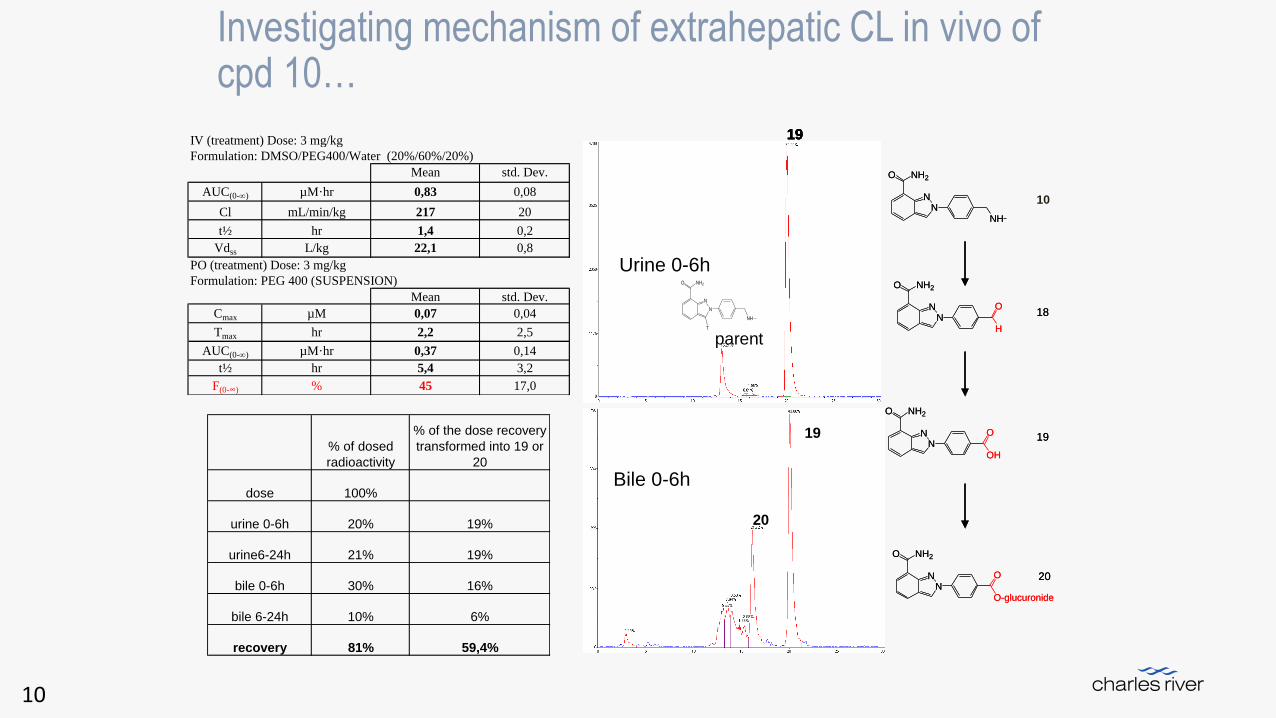
Investigating mechanism of extrahepatic CL in vivo of cpd 10…
NN
NH
O NH2
NN
H
O NH2
O
NN
OH
O NH2
O
NN
O-glucuronide
O NH2
O
parent
19
19
20
Urine 0-6h
Bile 0-6h
10
18
19
20
NN
NH
O NH2
NN
H
O NH2
O
NN
OH
O NH2
O
NN
O-glucuronide
O NH2
O
parent
19
19
20
parent
19
19
20
parent
19
19
20
Urine 0-6h
Bile 0-6h
10
18
19
20
IV (treatment) Dose: 3 mg/kg
Formulation: DMSO/PEG400/Water (20%/60%/20%)
Mean std. Dev.
AUC(0-) µM·hr 0,83 0,08
Cl mL/min/kg 217 20
t½ hr 1,4 0,2
Vdss L/kg 22,1 0,8
PO (treatment) Dose: 3 mg/kg
Formulation: PEG 400 (SUSPENSION)
Mean std. Dev.
Cmax µM 0,07 0,04
Tmax hr 2,2 2,5
AUC(0-) µM·hr 0,37 0,14
t½ hr 5,4 3,2
F(0-∞) % 45 17,0
% of dosed
radioactivity
% of the dose recovery
transformed into 19 or
20
dose 100%
urine 0-6h 20% 19%
urine6-24h 21% 19%
bile 0-6h 30% 16%
bile 6-24h 10% 6%
recovery 81% 59,4%
N
N
NH
O NH2
T
10
10

Trying to establish an in vitro model of extrahepatic metabolism
rat CYP phenotyping for cpd 10
0%
20%
40%
60%
80%
100%
120%
0 10 20 30 40 50 60
min
% p
are
nt
1A1
1A2
2A1
2A2
2B1
2C6
2C11
3A2
2C12
2C13
2D1
2D2
3A1
reductase
Metabolic stability in liver, lung, kidney, intestine microsomes and heart homogenate
in presence of NADPH
0
20
40
60
80
100
120
140
0 20 40 60 80 100
time (min)
Perc
ent
of
initia
lcpd 10
Liver nadph
Liver no cof
Lung nadph
Lung no cof
Kidney nadph
Kidney no cof
Intestine nadph
Intestine no cof
Heart nadph
Heart no cof
rat rCYP1A1
R = 0.75
-2
-1.5
-1
-0.5
0
0.5
1
1.5
2
2.5
0.5 1 1.5 2 2.5 3
log in vivo CL [ml/min]
rCY
P1A
1 lo
g C
Lin
t [u
l/(m
in*n
mo
lPro
t)]
rCYP1A1
rat rCYP1A1
R = 0.75
-2
-1.5
-1
-0.5
0
0.5
1
1.5
2
2.5
0.5 1 1.5 2 2.5 3
log in vivo CL [ml/min]
rCY
P1A
1 lo
g C
Lin
t [u
l/(m
in*n
mo
lPro
t)]
rCYP1A1
11
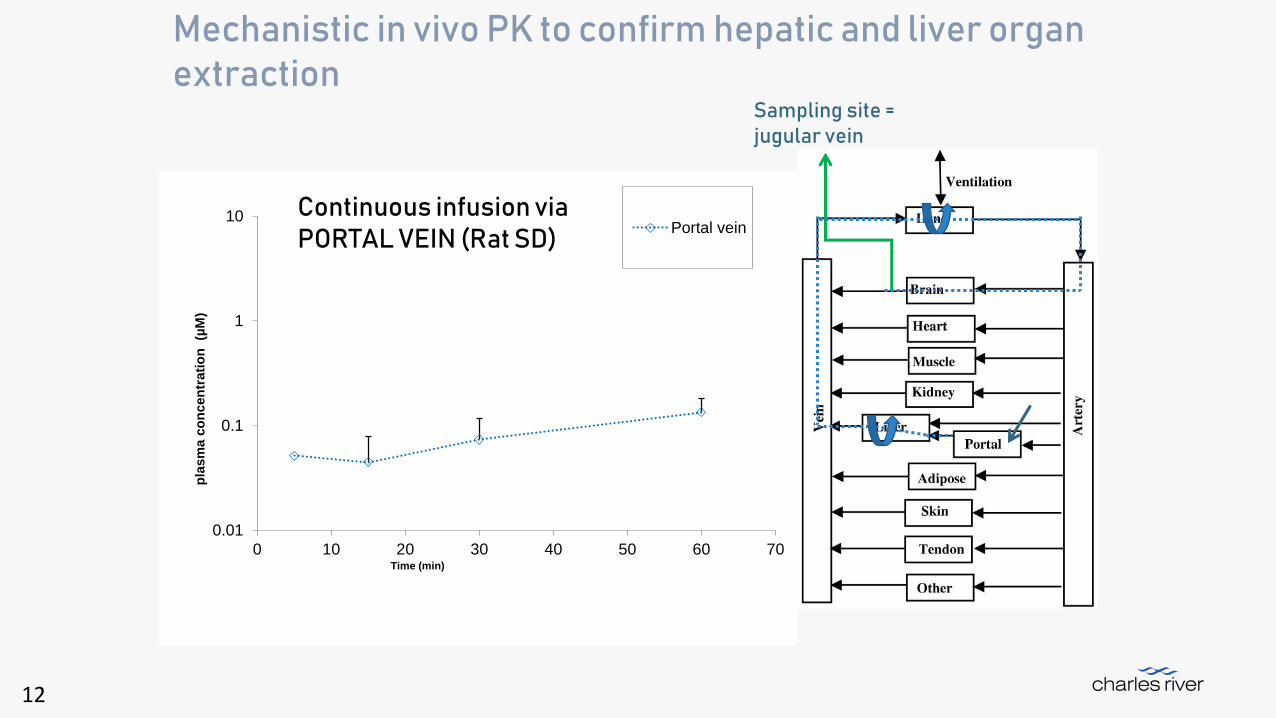
0.01
0.1
1
10
0 10 20 30 40 50 60 70
pla
sm
a c
on
cen
trati
on
(µ
M)
Time (min)
Portal vein
Sampling site = jugular vein
Continuous infusion via PORTAL VEIN (Rat SD)
Mechanistic in vivo PK to confirm hepatic and liver organ extraction
12

0.01
0.10
1.00
10.00
0 10 20 30 40 50 60 70
pla
sm
a c
on
cen
trati
on
(µ
M)
Time (min)
Femoral vein
Portal vein
Sampling site = jugular vein
Continuous infusion via FEMORAL VEIN (Rat SD)
13

0.01
0.10
1.00
10.00
0 10 20 30 40 50 60 70
pla
sm
a c
on
cen
trati
on
(µ
M)
Time (min)
Intra-arterial
Femoral vein
Portal vein
Sampling site = jugular vein
Cssfemoral µM 0.52±0.06
Clp* ml/min/kg 140±16
Cssportal µM 0.21±0.06
E%hepatic % 59±19
Cssarterial µM 2.0±0.5
E%lung % 78±23
Continuous infusion via CAROTID ARTERY (Rat SD)
14

SPR in vitro & in vivo
NHMeNHMe NHMe
N
N
O NH2
R
CLint
rCYP1a1 6000 2200 400 300 <100(uL/min/nmol)
CLb
(mL/min/kg) 220 58 30 46 24
NH
(S)
NH
(R)
MK-4827 (Niraparib)
PARylation EC90 (nM) 30 280
15J Med Chem. 2009 Nov 26;52(22):7170-85.

L-001946812-001G005 plasma concentration of Rats receiving
an i.v. infusion via Femoral or Portal vein at 10 g/min for 120 minutes
Infusion via Femoral vein Infusion via Portal veinTime Average Std. Dev. Time Average Std. Dev.
(min) Rat 1 Rat 2 Rat 3 (h) Rat 4 Rat 5 Rat 6
15 0.80 0.85 0.67 0.78 0.09 15 0.51 0.41 0.59 0.50 0.09
30 1.16 1.17 0.79 1.04 0.22 30 0.84 0.78 0.97 0.86 0.09
45 1.36 1.36 0.90 1.21 0.26 45 1.02 0.87 1.15 1.01 0.14
60 1.53 1.52 1.30 1.45 0.13 60 1.61 0.99 1.48 1.36 0.33
90 1.89 2.00 1.69 1.86 0.15 90 1.82 1.47 1.79 1.69 0.19
120 2.29 2.22 1.64 2.05 0.36 120 1.85 1.60 2.15 1.87 0.28
AUC ( M * h) 174.8 177.9 140.5 164.4 20.8 152.9 121.7 159.2 144.6 20.1
Css (µM) 1.8 1.6
Average 60 and 120 min
Project Mol. Wt. Analytical Method Analytical Protocol
PARP 320.397 LC/MS/MS ACN PPT
Date dosed Notebook # LOQ (uM) Analysis date Notebook #
4/1/2007 227351 0.008 11/1/2007 227369
Comments Dosing solution:Saline
Concentration (µM)
Cl (ml/min/kg) = 58E% = 10
Concentration (µM)
0.00
0.00
0.01
0.10
1.00
10.00
0 20 40 60 80 100 120
Time (min)
Co
nc (
uM
)
Femoral vein
Portal vein
N
N
NH2
O
N
H2+
Chiral
Cl
0.10
0.60
1.10
1.60
2.10
2.60
3.10
3.60
0 20 40 60 80 100 120
Time (min)
Co
nc (
uM
)
Femoral vein
Portal vein
N
N
NH2
O
N
H2+
Chiral
Cl
MK-4827 IVIVC: Rat liver data
Hep Intrinsic Clearance
(l/min/million cells)
Rat Hum
2.2 1.6
1 Rat QH = 68 ((ml/min)/kg) - Hum QH = 20 ((ml/min)/kg).
Ring B.J.et al. Pharmaceutical Sciences, 2011 DOI 10.1002/jps
Measured hepatic CL (in vivo)
ERH = 10% CLH= ERH * QH = 6.8 ((ml/min)/kg)1
Predicted Rat hepatic CL1
ERH = 11%
CLH= 7.1 (ml/min)/kg
Predicted hum hepatic CL1
ERH = 14%
CLH= 2.8 (ml/min)/kg
16
TOTAL blood CL = 46 mL/min/Kgbw – F% = 92%

17
Mechanism of Clearance in rats
TOTAL blood CL = 46 mL/min/Kgbw – F% = 92%
• 35% urinary excretion
=> CLR= 0.35*CLB = 0.35*46= 16.1 ml/min/kg ; > GFRrat (5-6 ml/min/kg)-Rat Kidney BF (40-52 ml/min/kg)
• 2 % biliary excretion
• 10 % hepatic extraction (determined by portal/femoral infusion)
• ~ 50 % extrahepatic metabolism
17

Transporters Data
Compound PappB-A/PappA-B
LLC-PK1
Papp (cm*10E-6/s)
Human
MDR1
Mouse
Mdr1a
Rat Mdr1a Beagle
MDR1
Monkey
MDR1
MK-4827
(5 M)
3 12 22 17 10 ND
Verapamil
(1 M)
1 6 12 7 4 ND
MK-4827 is a Pgp substrate
Solubility >20 mg/mL
24
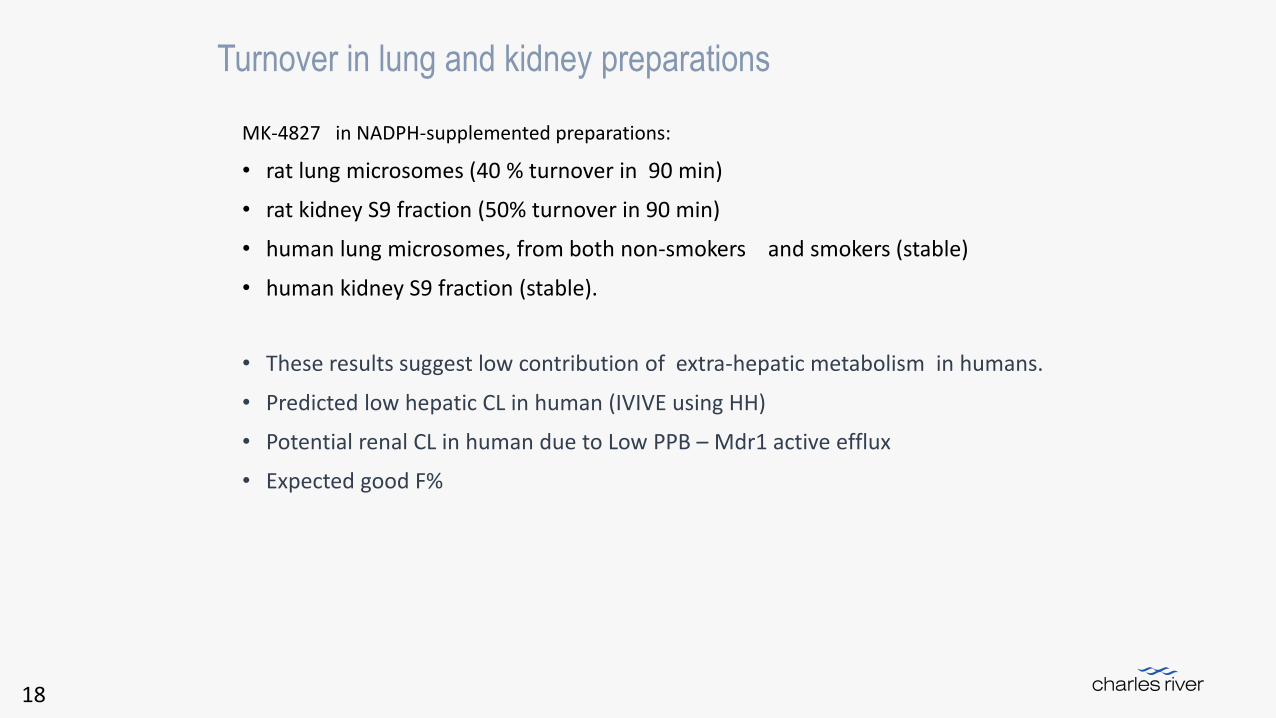
Turnover in lung and kidney preparations
MK-4827 in NADPH-supplemented preparations:
• rat lung microsomes (40 % turnover in 90 min)
• rat kidney S9 fraction (50% turnover in 90 min)
• human lung microsomes, from both non-smokers and smokers (stable)
• human kidney S9 fraction (stable).
• These results suggest low contribution of extra-hepatic metabolism in humans.
• Predicted low hepatic CL in human (IVIVE using HH)
• Potential renal CL in human due to Low PPB – Mdr1 active efflux
• Expected good F%
18

20
Proposed Metabolite Scheme (Rat and Human)
NH
NH2O
N
N
m/z 321
NH
NH2O
N
N
-H2+O
m/z 335
NH
NH2O
N
N
O
m/z 337
NH
NH2O
N
N
-H2+O2O
m/z 367
NH
NH2O
N
N
O
NH
NH2O
N
N m/z 351
-H2+OO NH
NH2O
N
N
O2
m/z 353
MK-4827
RlungMHLM,RLMRat bileRat urine
RLM,HLMrCYP1A1 H,RRat urine HLM, RLM
Rat bileRat urine
Rat urine
Rat bileRat urine
Rat urineRat bile
m/z 337
NH
OHO
N
N
m/z 322
HLM, RLMHH, RHRat urine, bileTraces
NH
NH2O
N
N
m/z 479 Gluc
M1
M2
M3
M4
M5
M6
M7
M8
Rat bile
Traces

Activity in MDA-MB-436 (BRCA1-) xenografts
0
200
400
600
800
1000
1200
1 5 8 14 21 29 33
Tu
mo
r vo
lum
e (
mm
3)
DAY
Vehicle QD
Vehicle BID
MK4827 100 mpk QD
MK4827 50 mpk BID
0 0.1 0.2 0.3 0.4 0.5 0.6 0.7 0.8
Tumor Weight (g)
0
20
40
60
80
100
120
1 5 8 14 21 29 33
% B
od
y W
eig
ht
DAY
P < 0.005
P < 0.005
P < 0.005
P < 0.005
Administered orally
Approved as PCC April 2007 (MK-4827)20

22
Species Dose
(mg/kg)
Clb
(mL/(min*kg))
Vd
(L/kg)
T1/2
(hr)
AUC
(M*hr)0-x
Rat 3 46±3 22.8±8.7 5.1±2.0 2.9±0.1
Dog 1 89±6 29.3±5.2 5.3±0.3 0.6±0.0
Monkey 1 17.5±6 17.1±2.5 6.8±1.0 1.5±0.2
± ± ± ±
IV (male, n=3, saline)
Species Dose
(mg/kg)
Cmax
(M)
Tmax
(hr)
AUC
(M*hr)0-x
%F
Rat 4 0.3±0.1 4.0±1.0 3.7±1.8 92±29
Dog 2 0.2±0.0 0.9±0.3 0.8±0.1 80±14
Monkey 2 0.3±0.1 1.3±0.6 1.9±0.5 70±17
± ± ± ±
P.O. (male, n=3, water)
MK-4827 (Niraparib) preclinical profiling - PK
Dose proportional PK in rat – MK-482721
23
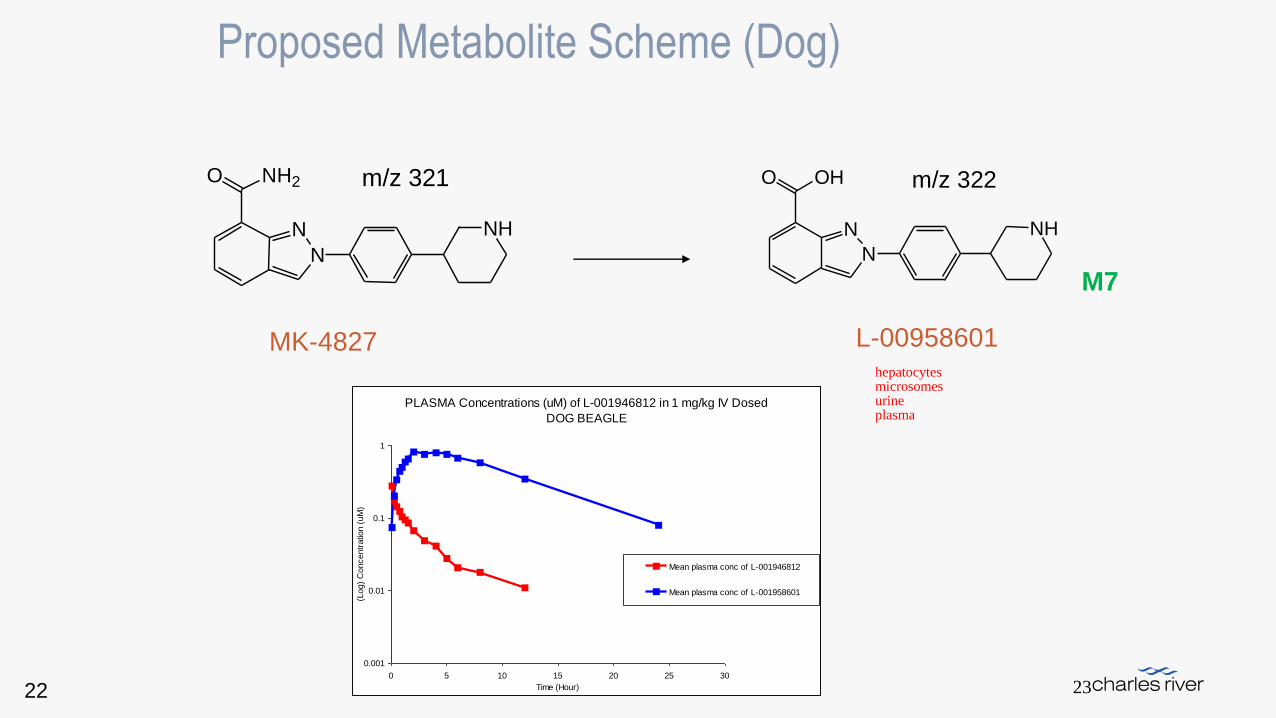
Proposed Metabolite Scheme (Dog)
NH
NH2O
N
N
m/z 321
NH
OHO
N
N
m/z 322
MK-4827 L-00958601 hepatocytes microsomes urine plasma
PLASMA Concentrations (uM) of L-001946812 in 1 mg/kg IV Dosed
DOG BEAGLE
0.001
0.01
0.1
1
0 5 10 15 20 25 30
Time (Hour)
(Log)
Concentr
atio
n (
uM
)
Mean plasma conc of L-001946812
Mean plasma conc of L-001958601
M7
22

24
Rat/Dog Excretion Study 3 mg/kg iv (n=3)
Percent of Dose Recovered (0-48h)
urine bile (0-24h) total
Total 48±1 32 ±4 80±4
Parent 35±2 2±2 37±3
Water 2±1 2±1
Data obtained using MK4827 labeled with tritium in position 3 of the indazole ring.
Low tritium loss was detected both in vivo and in vitro
In dogs only 2 % of parent excreted in urine
23

Hum CL – t1/2 prediction for MK4827
• Total hum CL = CLmetab liver + CLR + CLmetab extrahep
• CLmetab liver : IVIV scaling from HH = 2.8 ml/min/kg (range 1.8-3.8)
• CLR = CLR-rat * (fuhum / furat )* KBFhum / KBFrat * ERhum/ERrat= 4.5 ml/min/kg
(range 3.5-7)
• CLmetab extrahep: expected to be negligible in human
• Vdss = Vdss hum = Vd (animal)*fu(hum)/fu(animal) = 26 (L/kg) range (17-37)
25
Vd (L/kg)17 26 37
total min avrg maxCL 5.5 min 28 43 61
(mL/min/kg) 8.3 avrg 21 36 4611 max 16 25 36
Values used for rat, and human KBF were 52 (Hsu et al., 1975) and 16 ml/min/kg (Wolf et al., 1993)
Predicted half-life (hr)
25

Human PK data (Phase II)
http://meetinglibrary.asco.org/content/62393?format=posterImg
Niraparib was approved in 2017
26

Case studies in drug discovery have been reported showing relevant lungs and generalized extrahepatic metabolism in rats. The large extrahepatic contribution appeared to be rat specific with no analogy to human metabolism. Rat CYP1a1 was identified as the major enzyme responsible
The extraction fraction (CL/Q) in the lung is in general small, as a result of its modestmetabolic activity but due to the fact that the lung blood flow is equivalent to the totalcardiac output, in some cases, drug metabolism in the lungs can be substantial.
In general, xenobiotic metabolizing enzymes (XMEs) are expressed in lower levels in the extrahepatic tissues than in the liver, making the former less relevant for the clearance of xenobiotics. Local metabolism, however, may lead to tissue-specific adverse responses, e.g. organ toxicities, allergies or cancer.*
Conclusion
Fonsi M - Drug Metab Lett. 2014;8(1):51-66.* U. Gundert-Remy et al. Drug Metab Rev, Early Online: 1–34
27

Thank you very much!