integrated gas - total.com · potential lng project merit order ... •b2b & b2c marketing and...
TRANSCRIPT
Philippe Sauquet
President Gas, Renewables & Power
Integrated Gas

Line 1
Base for all bar charts
axis labels base
Line 1 Text under charts
Line 2 Text under charts
Line 2
Disclaimer
This document may contain forward-looking information on the Group (including objectives and trends), as well as forward-looking statements within the meaning of the Private Securities Litigation Reform Act of 1995, notably with respect to the financial condition, results of operations, business, strategy and plans of TOTAL. These data do not represent forecasts within the meaning of European Regulation No. 809/2004.
Such forward-looking information and statements included in this document are based on a number of economic data and assumptions made in a given economic, competitive and regulatory environment. They may prove to be inaccurate in the future, and are subject to a number of risk factors that could lead to a significant difference between actual results and those anticipated, including currency fluctuations, the price of petroleum products, the ability to realize cost reductions and operating efficiencies without unduly disrupting business operations, environmental regulatory considerations and general economic and business conditions. Certain financial information is based on estimates particularly in the assessment of the recoverable value of assets and potential impairments of assets relating thereto.
Neither TOTAL nor any of its subsidiaries assumes any obligation to update publicly any forward-looking information or statement, objectives or trends contained in this document whether as a result of new information, future events or otherwise. Further information on factors, risks and uncertainties that could affect the Company’s financial results or the Group’s activities is provided in the most recent Registration Document filed by the Company with the French Autorité des Marchés Financiers and annual report on Form 20-F filed with the United States Securities and Exchange Commission (“SEC”).
Financial information by business segment is reported in accordance with the internal reporting system and shows internal segment information that is used to manage and measure the performance of TOTAL. Performance indicators excluding the adjustment items, such as adjusted operating income, adjusted net operating income, and adjusted net income are meant to facilitate the analysis of the financial performance and the comparison of income between periods. These adjustment items include:
(i) Special itemsDue to their unusual nature or particular significance, certain transactions qualified as "special items" are excluded from the business segment figures. In general, special items relate to transactions that are significant, infrequent or unusual. However, in certain instances, transactions such as restructuring costs or asset disposals, which are not considered to be representative of the normal course of business, may be qualified as special items although they may have occurred within prior years or are likely to occur again within the coming years.
(ii) Inventory valuation effectThe adjusted results of the Refining & Chemicals and Marketing & Services segmentsare presented according to the replacement cost method. This method is used to assess the segments’ performance and facilitate the comparability of the segments’ performance with those of its competitors.
In the replacement cost method, which approximates the LIFO (Last-In, First-Out) method, the variation of inventory values in the statement of income is, depending on the nature of the inventory, determined using either the month-end price differentials between one period and another or the average prices of the period rather than the historical value. The inventory valuation effect is the difference between the results according to the FIFO (First-In, First-Out) and the replacement cost.
(iii) Effect of changes in fair value The effect of changes in fair value presented as an adjustment item reflects for some transactions differences between internal measures of performance used by TOTAL’s management and the accounting for these transactions under IFRS.
IFRS requires that trading inventories be recorded at their fair value using period-end spot prices. In order to best reflect the management of economic exposure through derivative transactions, internal indicators used to measure performance include valuations of trading inventories based on forward prices.
Furthermore, TOTAL, in its trading activities, enters into storage contracts, which future effects are recorded at fair value in Group’s internal economic performance. IFRS precludes recognition of this fair value effect.
The adjusted results (adjusted operating income, adjusted net operating income, adjusted net income) are defined as replacement cost results, adjusted for special items, excluding the effect of changes in fair value.
Cautionary Note to U.S. Investors – The SEC permits oil and gas companies, in their filings with the SEC, to separately disclose proved, probable and possible reserves that a company has determined in accordance with SEC rules. We may use certain terms in this presentation, such as resources, that the SEC’s guidelines strictly prohibit us from including in filings with the SEC. U.S. investors are urged to consider closely the disclosure in our Form 20-F, File N° 1-10888, available from us at 2, Place Jean Millier – Arche Nord Coupole/Regnault- 92078 Paris-La Défense Cedex, France, or at our website: total.com. You can also obtain this form from the SEC by calling 1-800-SEC-0330 or on the SEC’s website: sec.gov.
Line 1
2017 Field Trip
Base for all bar charts
axis labels base
Line 1 Text under charts
Line 2 Text under charts
Line 2
400
2005 2015 2025
100
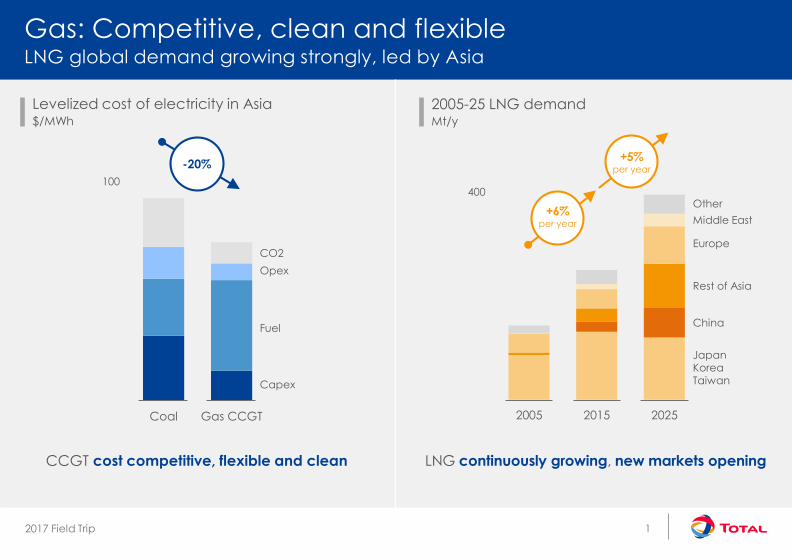
Coal Gas CCGT
CCGT cost competitive, flexible and clean LNG continuously growing, new markets opening
Gas: Competitive, clean and flexibleLNG global demand growing strongly, led by Asia
2005-25 LNG demandMt/y
Levelized cost of electricity in Asia$/MWh
Capex
Fuel
Opex
CO2
JapanKoreaTaiwan
China
Rest of Asia
Europe
Middle East
Other
-20%
1
+5%per year
+6%per year
Line 1
2017 Field Trip
Base for all bar charts
axis labels base
Line 1 Text under charts
Line 2 Text under charts
Line 2
200
LNG projects
400
2015 2020 2025 2030
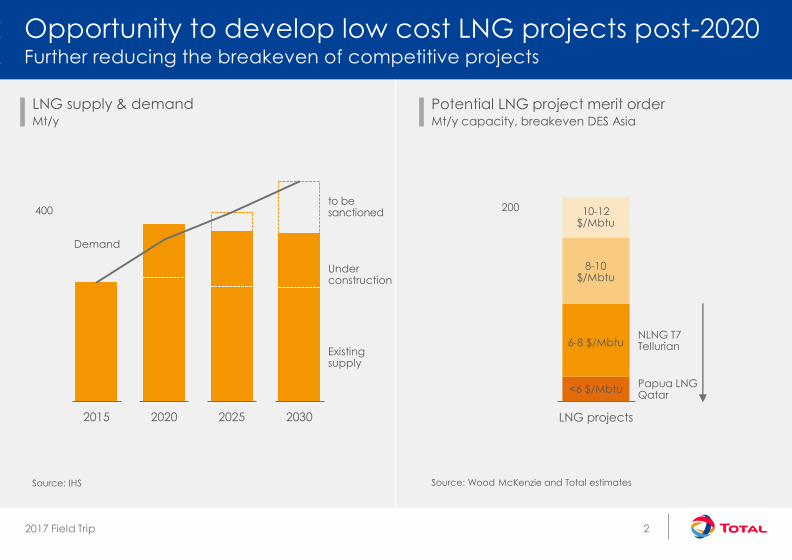
Opportunity to develop low cost LNG projects post-2020Further reducing the breakeven of competitive projects
Potential LNG project merit orderMt/y capacity, breakeven DES Asia
LNG supply & demandMt/y
to besanctioned
Under construction
Existingsupply
Demand
<6 $/Mbtu
6-8 $/Mbtu
8-10 $/Mbtu
10-12 $/Mbtu
Papua LNGQatar
NLNG T7Tellurian
Source: IHS Source: Wood McKenzie and Total estimates
2
Line 1
2017 Field Trip
Base for all bar charts
axis labels base
Line 1 Text under charts
Line 2 Text under charts
Line 2
US exports
Altamira
South Hook
Fosmax
Dunkirk
SnøhvitYamal
Angola
Nigeria
Yemen
Qatargas 1 & 2
Adgas
Qalhat
OmanIchthys GLNG
Bontang
Papua
project
Hazira
Liquefaction
Existing & new regasification
Long term purchase
Existing & post 2016 long term sales
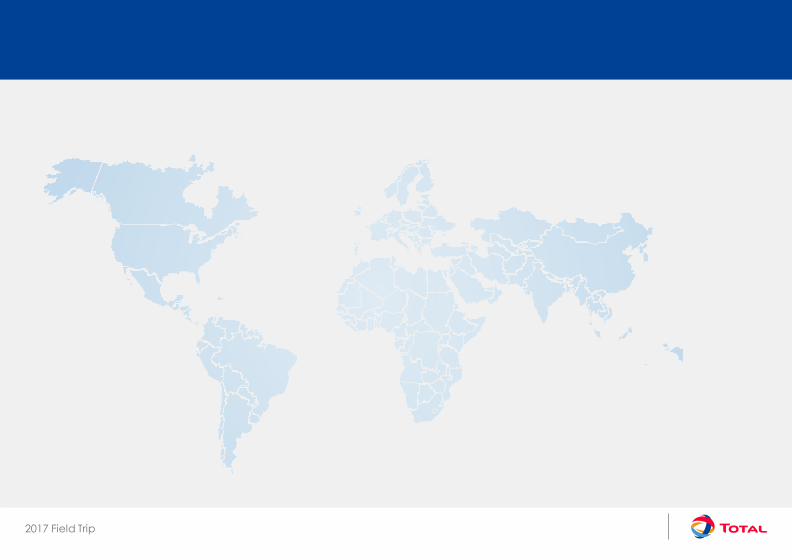
Global player with access to all LNG marketsGrowing flexibility from scale and integration
Brazil
Cuba
Pakistan
2 Mt/y new
contracts in 2016Ivory Coast
Tellurian
3
Line 1
2017 Field Trip
Base for all bar charts
axis labels base
Line 1 Text under charts
Line 2 Text under charts
Line 2
15
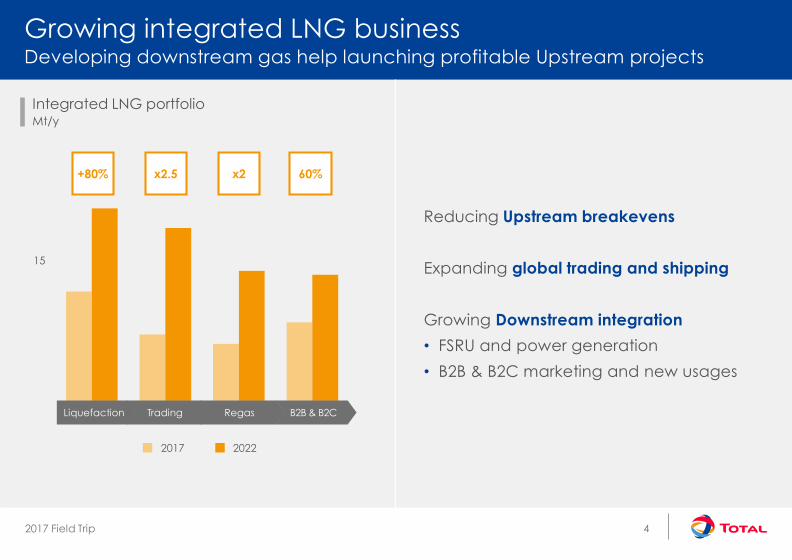
Growing integrated LNG businessDeveloping downstream gas help launching profitable Upstream projects
Integrated LNG portfolio Mt/y
x2x2.5 60%+80%
Regas B2B & B2CLiquefaction Trading
2017 2022
Reducing Upstream breakevens
Expanding global trading and shipping
Growing Downstream integration
• FSRU and power generation
• B2B & B2C marketing and new usages
4

Line 1
2017 Field Trip
Base for all bar charts
axis labels base
Line 1 Text under charts
Line 2 Text under charts
Line 2
Focusing on
low cost gas
(onshore)
Optimizing the full value chainDriving down costs in all segments
0.5-2$/Mbtu
Simplifying
designs (modular, small
scale, brownfields)
1-2$/Mbtu
Increasing
flexibility of
portfolio
0.2-0.4$/Mbtu
Reducing
Boil-off
0.5-3$/Mbtu DES Asia
Operating
floating regas(FSRU)
~0.5$/Mbtu
Leveraging
digital
platforms
B2B: 0.2-0.4 B2C: 1.5-2.5
$/Mbtu
Production Liquefaction Trading Shipping Regasification Marketing
5

Line 1
2017 Field Trip
Base for all bar charts
axis labels base
Line 1 Text under charts
Line 2 Text under charts
Line 2
Starting from low cost gasOptimizing the development of competitive resources
1.5
Production cost$/Mbtu Capex+Opex, including transport
DeepOffshoredry gas
US Shale Papua QatarNigeria
Source: Wood McKenzie and Total estimates
x 2.5cheaper
6

Line 1
2017 Field Trip
Base for all bar charts
axis labels base
Line 1 Text under charts
Line 2 Text under charts
Line 2
1,000
Reducing liquefaction costs to ~500 $/tPrioritizing low cost modular solutions and brownfield expansions
Liquefaction cost$/t Capex
~500 $/ttarget
USmodular
Papua Yemen(2009)
QatarEast Africa
Greenfield
NLNG T7
Source: Wood McKenzie and Total estimates
7

Line 1
2017 Field Trip
Base for all bar charts
axis labels base
Line 1 Text under charts
Line 2 Text under charts
Line 2
Floating regasification units reducing cost to ~50 $/tWorld capacity expected to double to ~120 Mt per year by 2020
50
100
Onshore FSRU
Regasification unit cost$/t, Capex
Opening new LNG markets, quick & easy to install
4 Mt/y announced, evaluating ~6 Mt/y
-60%
8

Line 1
2017 Field Trip
Base for all bar charts
axis labels base
Line 1 Text under charts
Line 2 Text under charts
Line 2
15
Flexible supply & demand in line with market needs
Targeting 5% market share of LNG trading
Solid long term contracts
Growing balanced trading portfolioLeveraging size and flexibility to maximize margin
2022 long term contracts price reviewsWell balanced LNG trading portfolioMt/y
Fixed destination
Flexibledestination
Long term sales
B2B/B2Cintegrated
regas
spot
Price review before 2022
Price reviewafter 2022
No price review
Floating regas long term sales
2016supply
2016demand
2022supply
2022demand
9

Line 1
2017 Field Trip
Base for all bar charts
axis labels base
Line 1 Text under charts
Line 2 Text under charts
Line 2
Growing B2B and B2CMarketing activities adding margin and resilience to the portfolio
30
Highest
cost
average
cost
Total
Lampiris
Lowest
cost
Cost to serve European B2C customers€/year/client, for Total and European competitor range*
High performance, low-cost digital platform
Save money now!
ESTIMATE MY SAVINGS
SUBSCRIBE IN 2 CLICKS
Your green electricity
Yourgas
Combinedoffer
10
- 50%
* Total estimates

Line 1
2017 Field Trip
Base for all bar charts
axis labels base
Line 1 Text under charts
Line 2 Text under charts
Line 2
Building supply network on main bunkering hubs Deploying Pitpoint technology in >300 stations
Developing new markets for gasDownstream portfolio generating new demand
Road transport – Natural gas for vehiculesBecoming the European leader by 2022
Marine transportLNG stimulated by IMO 2020 regulation change
11
Line 1
2017 Field Trip
Base for all bar charts
axis labels base
Line 1 Text under charts
Line 2 Text under charts
Line 2
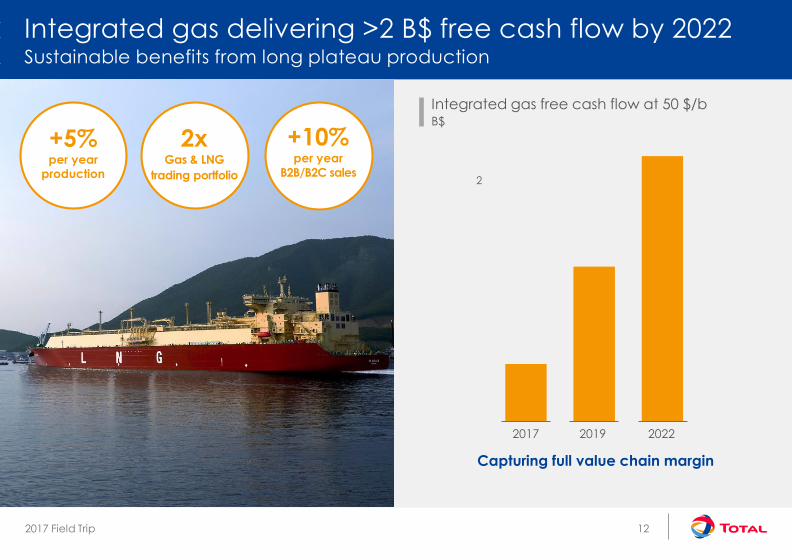
2
Integrated gas delivering >2 B$ free cash flow by 2022Sustainable benefits from long plateau production
Integrated gas free cash flow at 50 $/bB$
2xGas & LNG
trading portfolio
+10% per year
B2B/B2C sales
+5%per year
production
202220192017
Capturing full value chain margin
12