integrated environmental control model model tutorial · the case study ... • any svga (or...
TRANSCRIPT

Integrated Environmental Control Model
Model Tutorial
Prepared for the National Energy Technology LaboratoryU. S. Department of Energy
By Michael B. BerkenpasJohn J. Fry
Karen KietzkeEdward S. Rubin
Center for Energy and Environmental StudiesCarnegie Mellon University
Pittsburgh, PA 15213
November 2000
(Web and email addresses updated July 2015)


Model Tutorial Contents •••• i
Contents
Introduction 1The Integrated Environmental Control Model ...........................................................................1Purpose.......................................................................................................................................1System Requirements.................................................................................................................1Uncertainty Features ..................................................................................................................2Software Used in Development..................................................................................................2Disclaimer of Warranties and Limitation of Liabilities..............................................................2Copyright Notices ......................................................................................................................3
User Documentation and Help 4Getting Started ...........................................................................................................................4User Manual ...............................................................................................................................4Model Tutorial ...........................................................................................................................4Technical Manual.......................................................................................................................4Online Help ................................................................................................................................4
A Tour of the Interface 6The Tour.....................................................................................................................................6The IECM Window and Logo Box ............................................................................................6Opening a Session ......................................................................................................................7Configure Plant ..........................................................................................................................9Set Parameters..........................................................................................................................10
Overall Plant ..............................................................................................................10Coal Properties...........................................................................................................10Base Plant ..................................................................................................................12Other Input Areas.......................................................................................................16
Get Results ...............................................................................................................................16Overall Plant ..............................................................................................................16Boiler .........................................................................................................................19Other Result Areas.....................................................................................................23
Graphs ......................................................................................................................................23
Case Study 25The Case Study ........................................................................................................................25Installing the IECM Software ..................................................................................................25The IECM Window and Logo Box ..........................................................................................26The New Session Dialog Box ..................................................................................................27Configure Plant ........................................................................................................................28Set Parameters..........................................................................................................................29
Overall Plant ..............................................................................................................29Coal Properties...........................................................................................................29Base Plant ..................................................................................................................30Other Input Areas and Technologies .........................................................................32

ii •••• Contents Model Tutorial
Get Results ...............................................................................................................................33Overall Plant ..............................................................................................................33Boiler .........................................................................................................................37
Graphs ......................................................................................................................................39
Index 40

Model Tutorial Introduction •••• 1
Introduction
The Integrated Environmental Control ModelThis Integrated Environmental Control Model (IECM) and Interface were developedfor the U. S. Department of Energy’s National Energy Technology Laboratory(NETL), formerly known as the Federal Energy Technology Center (FETC), undercontracts No. DE-AC22-92PC91346 and DE-AC21-92MC29094.
PurposeThe purpose of the model is to calculate the performance, emissions and cost ofemploying alternative environmental control methods in a coal-fired power plant.The model consists of a base plant and various control technology modules; thesemodules may be implemented together in any desired combination.
A Graphical User Interface (GUI) facilitates the configuration of the technologies,entry of data, and retrieval of results.
System RequirementsThe current model requires the following configuration:
• Intel-based computer running Windows 95 (or better) or Windows NT4.0 (or better) operating system
• Pentium Processor
• any SVGA (or better) display—at a resolution of 800x600 (or more)pixels1
• at least 40 Megabytes of free hard disk space
• at least 32 Megabytes of total memory
1 Smaller screen resolution results in the interface screens being scaled smaller. The taskbar, part of the Windowsoperating system, reduces the useable resolution of the screen if it is always visible. This may force the IECM interfaceto be scaled down slightly. To avoid this situation, select the “Auto Hide” option of the Taskbar properties in Windows.

2 •••• Introduction Model Tutorial
Uncertainty FeaturesThe ability to characterize uncertainties explicitly is a feature unique to this model.As many as one hundred input parameters can be assigned probability distributions.When input parameters are uncertain, an uncertainty distribution of results isreturned. Such result distributions give the likelihood of a particular value, incontrast to conventional single-value estimates.
The model can run using single deterministic values or uncertainty distributions. Theconventional deterministic form using single values for all input parameters andresults may be used, or probabilistic analyses may be run—for instance, to analyzeadvanced technology costs.
Software Used in DevelopmentThe underlying engineering models are written in Digital Equipment Corporation'sFortran. Fortran runtime libraries are included with the IECM Interface software.This language provides the flexibility to configure many various power plant designswhile also providing the power to conduct probabilistic analyses.
All databases are in Microsoft® Access format and may be viewed in Access, aslong as they are not changed. This format is a software industry standard andfacilitates sharing and updating of information.
To simplify the use of the model, a Graphical User Interface (GUI) has been added.The interface eliminates the need to master the underlying commands normallyrequired for model operation. The interface is written in Microsoft® Visual C++, astandard software development tool for the Windows environment. Visual C++runtime libraries are included with the IECM Model software and do not need to belicensed separately.
Wise InstallBuilder was used to generate full and upgrade installer programs. Thisproduct was chosen based on its flexibility and its support of Visual Basic runtimelibraries and Microsoft Data Access Components (MDAC)2. The Visual Basicruntime libraries provide the support needed to run the database file compactorprogram provided with the IECM. MDAC provides the software support needed tolink Microsoft® Access data files to the IECM interface program. WiseInstallBuilder provides the VB and MDAC installation as an option, rather thanforcing the user to download it from Microsoft and install it prior to installing theIECM.
Disclaimer of Warranties and Limitation of LiabilitiesThis report was prepared by the organization(s) named below as an account of worksponsored or cosponsored by the U.S. Department of Energy National EnergyTechnology Laboratory (NETL). NEITHER NETL, ANY MEMBER OF NETL,ANY COSPONSOR, THE ORGANIZATION(S) NAMED BELOW, NOR ANYPERSON ACTING ON BEHALF OF THEM:
(A) MAKES ANY WARRANTY OR REPRESENTATION WHATSOEVER,EXPRESS OR IMPLIED, (I) WITH RESPECT TO THE USE OF ANY
2 The current version of MDAC is 2.5. This is installed with the full installer for the IECM 3.4. Any update installersprovided for upgrading the IECM from version 3.4 to a higher version does not upgrade MDAC unless the user updatesMDAC separately.

Model Tutorial Introduction •••• 3
INFORMATION, APPARATUS, METHOD, PROCESS, OR SIMILAR ITEMDISCLOSED IN THIS REPORT, INCLUDING MERCHANTABILITY ANDFITNESS FOR A PARTICULAR PURPOSE, OR (II) THAT SUCH USE DOESNOT INFRINGE ON OR INTERFERE WITH PRIVATELY OWNED RIGHTS,INCLUDING ANY PARTY'S INTELLECTUAL PROPERTY, OR (III) THATTHIS REPORT IS SUITABLE TO ANY PARTICULAR USER'SCIRCUMSTANCE; OR
(B) ASSUMES RESPONSIBILITY FOR ANY DAMAGES OR OTHERLIABILITY WHATSOEVER (INCLUDING ANY CONSEQUENTIALDAMAGES, EVEN IF DOE OR ANY DOE REPRESENTATIVE HAS BEENADVISED OF THE POSSIBILITY OF SUCH DAMAGES) RESULTING FROMYOUR SELECTION OR USE OF THIS REPORT OR ANY INFORMATION,APPARATUS, METHOD, PROCESS, OR SIMILAR ITEM DISCLOSED IN THISREPORT.
Organization(s) that prepared this report: Carnegie Mellon University
Copyright NoticesDIGITAL Visual Fortran 5.0, Copyright © 1997, Digital Equipment Corporation.All Rights Reserved.
Spread 3.0, Copyright © 1998, FarPoint Technologies, Inc. All Rights Reserved.
Tab Pro 2.0, Copyright © 1996, FarPoint Technologies, Inc. All Rights Reserved.
Graphics Server 4.5, Copyright © 1996, Bits Per Second Ltd. and PinnaclePublishing, Inc. All Rights Reserved.
Microsoft Visual C++ 5.0, Copyright © 1997, Microsoft Corporation. All RightsReserved.
InstallBuilder 8.1, Copyright © 2000, Wise Solutions, Inc. All Rights Reserved.
Microsoft Data Access Components 2.5, Copyright © 2000, Microsoft Corporation.All Rights Reserved.
Integrated Environmental Control Model (IECM) Interface 3.4, Copyright © 2000,Carnegie Mellon University. All Rights Reserved.
Integrated Environmental Control Model (IECM) 3.4, Copyright © 2000, CarnegieMellon University. All Rights Reserved.
Median Latin Hypercube and Hammersley Sequence Sampling, Copyright © 1997,Urmila Diwekar, Carnegie Mellon University. All Rights Reserved.
Graphics Server is a trademark of Bits Per Second Ltd.
Microsoft is a registered trademark; Windows, Windows 95,Windows 98, WindowsNT, and Visual C++ are trademarks of Microsoft Corporation.
Spread™ is a trademark of FarPoint Technologies, Inc.
Tab Pro™ is a trademark of FarPoint Technologies, Inc.
DEC, DEC Fortran, and DIGITAL are trademarks of Digital Equipment Corporation.
4 •••• User Documentation and Help Model Tutorial
User Documentation and Help
Getting StartedGetting Started gives step-by-step instructions for installing the model software andusing the interface. It describes navigating the model, using the main program areas,working with sessions, and printing or exporting results.
User ManualThe User Manual gives further information on both the interface and the underlyingmodel. It provides detailed descriptions of plant configurations, parameter settings,and result screens. It also describes technical details behind the model’s operationand includes an introduction to uncertainty analysis.
Model TutorialThe Model Tutorial is a pictorial introduction to the IECM. It presents a graphicaltour of the interface, a case study to follow using the model, and an appendix, whichreproduces every screen in the model. These tools help any user to quickly becomemore familiar with the interface and model.
Technical ManualThe Technical manual is a detailed engineering description of the technologies andcosting assumptions used in the IECM. This manual is not provided by default withthe IECM software; however, it can be downloaded with any web browser fromhttp://www.iecm-online.com/.
Online HelpOnline help is provided via a Windows Help File containing the text of GettingStarted and the User Manual.

Model Tutorial User Documentation and Help •••• 5
Accessing the IECM Help file:
If you are not running the IECM interface, click the Help icon inside the IECMfolder on the Start menu. This opens the help file to the table of contents.
If you are running the IECM interface, do any one of the following:
• Press the F1 key. The IECM supports context-sensitive help and willopen the help file to the topic associated with the item or screen you areviewing.
• Pull down the Help menu at the top of the IECM window. Select HelpTopics. This opens the help file to the table of contents.
• Click the Context-Sensitive Help icon on the toolbar on the left side ofthe IECM window. The IECM supports context-sensitive help and willopen the help file to the topic associated with the item or screen you areviewing.
• Click the Help Topics icon on the toolbar on the left side of the IECMwindow. This opens the help file to the table of contents.
The IECM Help File Contents window will display.
The IECM Help File Topics Window

6 •••• A Tour of the Interface Model Tutorial
A Tour of the Interface
The TourThis tour gives a grap h ical introduction to the interface. It reproduces and describesthe commonly used screens of the interface so that you become familiar with howthe model functions.
The IECM Window and Logo BoxWhen you first start the model, the IECM Interface Window and Logo Box willdisplay.
The IECM Logo Box
The Logo Box will disappear in 5 seconds, after which just the IECM Window willremain and the interface will be ready for use. The IECM Window contains all thescreens used by the Interface.
Model Tutorial A Tour of the Interface •••• 7
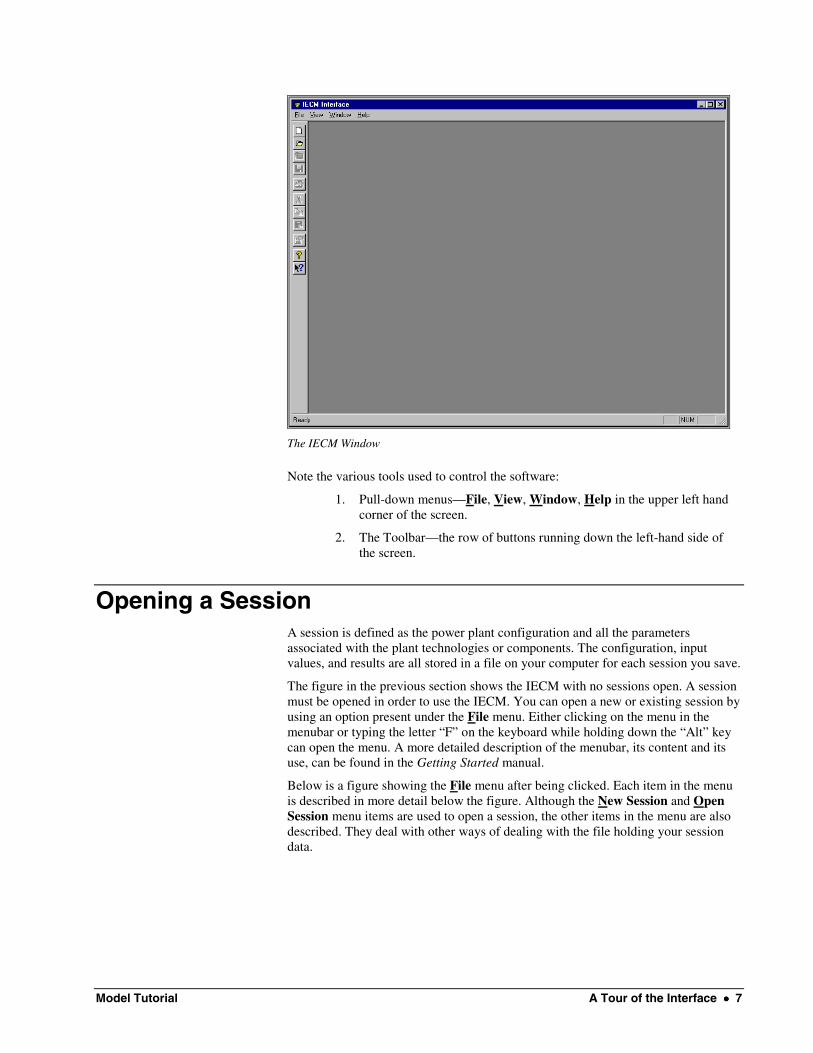
The IECM Window
Note the various tools used to control the software:
1. Pull-down menus—File, View, Window, Help in the upper left handcorner of the screen.
2. The Toolbar—the row of buttons running down the left-hand side ofthe screen.
Opening a SessionA session is defined as the power plant configuration and all the parametersassociated with the plant technologies or components. The configuration, inputvalues, and results are all stored in a file on your computer for each session you save.
The figure in the previous section shows the IECM with no sessions open. A sessionmust be opened in order to use the IECM. You can open a new or existing session byusing an option present under the File menu. Either clicking on the menu in themenubar or typing the letter “F” on the keyboard while holding down the “Alt” keycan open the menu. A more detailed description of the menubar, its content and itsuse, can be found in the Getting Started manual.
Below is a figure showing the File menu after being clicked. Each item in the menuis described in more detail below the figure. Although the New Session and OpenSession menu items are used to open a session, the other items in the menu are alsodescribed. They deal with other ways of dealing with the file holding your sessiondata.

8 •••• A Tour of the Interface Model Tutorial
The File menu
You may choose the following commands from the file menu:
New Session – Creates a new session from model defaults.
Open Session – Opens a previously created session.
Close Session – Closes the currently active session.
Delete Session – Deletes a session.
Unlock Session – Unlocks a session that was not closed normally (e.g.because of a crash or loss of network connectivity.
Save Results – Saves the results from a session in an external file.
Save As – Saves a session with a different name.
Import – Imports a session from an external database file.
Print – Prints configuration settings, inputs or results.
Exit – Closes the current session and exits the interface.

Model Tutorial A Tour of the Interface •••• 9
Configure PlantThe first program area—and the first screen displayed—is Configure Plant.
The Configure Plant Program Area
On this screen you choose the technologies implemented by the plant and how theyoperate. Available options are presented via pull-down menus on the left side of thescreen. A “Plant Diagram” displays on the right side of the screen and reflects thevarious plant technologies you have chosen.
Note the three tabs at the top of the screen. Clicking one of these tabs chooses theprogram area you are in. The three program areas are Configure Plant, SetParameters, and Get Results.

10 •••• A Tour of the Interface Model Tutorial
Set ParametersThe second program area is Set Parameters. From this area you can modify theinput values for this session.
The Set Parameters Program Area
Note the nine tabs below the program area navigation tabs at the top of the screen.Clicking one of these tabs chooses the input area you will use. The input screenscorrespond to the various technologies chosen in Configure Plant.
Overall PlantThe first tab of the Set Parameters program area is for the Overall Plant (seepicture above). This screen displays the plant configuration settings on the left sideof the page and a diagram of the plant as configured at the right of the page. Noinputs are entered on this screen.
The Plant Diagram in Set Parameters may be used as an alternate way to moveamong input Technology Navigation Tabs. Clicking the button of the technology forwhich you would like to provide inputs chooses that input screen.
Coal PropertiesThe second tab of the Set Parameters program area is for the Coal Properties inputarea. Inputs in this area define the composition of the coal, composition of the ash,and cost of the coal used in the plant for this session.
Model Tutorial A Tour of the Interface •••• 11
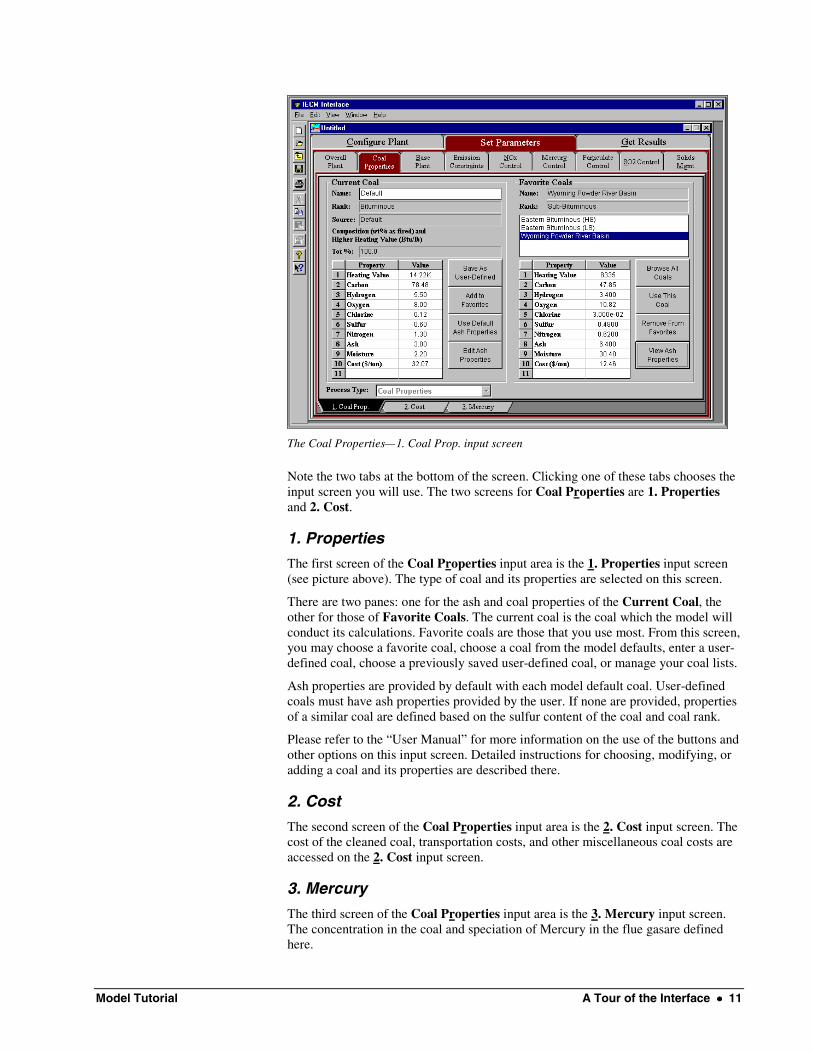
The Coal Properties—1. Coal Prop. input screen
Note the two tabs at the bottom of the screen. Clicking one of these tabs chooses theinput screen you will use. The two screens for Coal Properties are 1. Propertiesand 2. Cost.
1. Properties
The first screen of the Coal Properties input area is the 1. Properties input screen(see picture above). The type of coal and its properties are selected on this screen.
There are two panes: one for the ash and coal properties of the Current Coal, theother for those of Favorite Coals. The current coal is the coal which the model willconduct its calculations. Favorite coals are those that you use most. From this screen,you may choose a favorite coal, choose a coal from the model defaults, enter a user-defined coal, choose a previously saved user-defined coal, or manage your coal lists.
Ash properties are provided by default with each model default coal. User-definedcoals must have ash properties provided by the user. If none are provided, propertiesof a similar coal are defined based on the sulfur content of the coal and coal rank.
Please refer to the “User Manual” for more information on the use of the buttons andother options on this input screen. Detailed instructions for choosing, modifying, oradding a coal and its properties are described there.
2. Cost
The second screen of the Coal Properties input area is the 2. Cost input screen. Thecost of the cleaned coal, transportation costs, and other miscellaneous coal costs areaccessed on the 2. Cost input screen.
3. Mercury
The third screen of the Coal Properties input area is the 3. Mercury input screen.The concentration in the coal and speciation of Mercury in the flue gasare definedhere.

12 •••• A Tour of the Interface Model Tutorial
Base PlantThe second tab of the Set Parameters program area is for the Base Plant input area.Inputs in this area define performance and costs directly associated with the basepower plant, particularly the boiler.
The Base Plant—1. Performance input screen
Note the six tabs at the bottom of the screen. Clicking one of these tabs chooses theinput screen you will use. The Base Plant input area contains a Performance screenand five screens having to do with cost parameters.
1. Performance
The first screen of the Base Plant input area is the 1. Performance input screen (seepicture above). Inputs determining the overall plant size, temperature profiles, andmajor flow rates and concentrations of the gas and solids streams are entered on thisscreen. The first six inputs are highlighted in blue to point out their importance.
2. Furnace Factors
The second input screen in this section defines the emission rates of various gascomponents of the flue gas during the combustion of fuel. The emission of carbon,ash, sulfur and nitrogen are specified by the United States Government’sEnvironmental Protection Agency’s (EPA) compilation of emission factors. Alsoincluded from the compilation are the incomplete transfer percentages of solid andgaseous forms of these substances.

Model Tutorial A Tour of the Interface •••• 13
The Base Plant —2. Furnace Factors input screen
3. Financing
The third base plant input screen describes the factors required to determine thecarrying charge for all capital investments. The carrying charge is defined as therevenue required to pay for any capital investment. The total charge can also beexpressed as a levelized cost factor or fixed charge factor.
The Base Plant—3. Financing input screen

14 •••• A Tour of the Interface Model Tutorial
4. Retrofit Cost
The fourth screen of the Base Plant input area is the 4. Retrofit Cost input screen,shown below. The retrofit cost factor of each process is a multiplicative costadjustment, which considers the cost of retrofitted capital equipment relative tosimilar equipment installed in a new plant. These factors affect the capital costsdirectly and the operating and maintenance costs indirectly. Every technology tab ofthe Set Parameters program area contains a retrofit cost input screen.
The Base Plant—4. Retrofit Cost input screen
5. Capital Cost
The fifth screen of the Base Plant input area is the 5. Capital Cost input screen,shown below. The necessary capital cost input parameters associated with the baseplant are on this input screen. Every technology tab of the Set Parameters programarea contains a capital cost input screen.
The capital cost parameters and terminology used in the IECM are based on themethodologies developed by the Electric Power Research Institute (EPRI). Theyhave prepared a Technical Assessment Guide (TAG) to provide a consistent basis forreporting cost and revenues associated with the electric power industry. The IECMhas been developed around this TAG system so that costs associated with varioustechnologies can be compared directly on a consistent basis and communicated in thelanguage used by energy engineers, researchers, planners, and managers.

Model Tutorial A Tour of the Interface •••• 15
The Base Plant—5. Capital Cost input screen
6. O&M Cost
Inputs for the operation and maintenance costs of the base plant itself are entered onthe 6. O&M Cost input screen, shown below. O&M is a short form for “operatingand maintenance.” Every technology tab of the Set Parameters program areacontains an O&M cost input screen.
The Base Plant—6. O&M Cost input screen
16 •••• A Tour of the Interface Model Tutorial
The EPRI TAG method of categorization has been also used for operating andmaintenance cost screens. It provides a consistent basis of reporting for a wideraudience of users.
Other Input AreasAs has been noted, there are up to nine input areas, depending on the technologiesselected in Configure Plant. Each contains performance and/or cost screens as isappropriate to the technology. Each will have at least one performance input screen,one retrofit cost screen, one capital cost screen, and one O&M cost screen.
The detail of each parameter on each screen is described in detail in the “UserManual.” The general use of the options shown on the input screens is described inmore detail in the Getting Started manual.
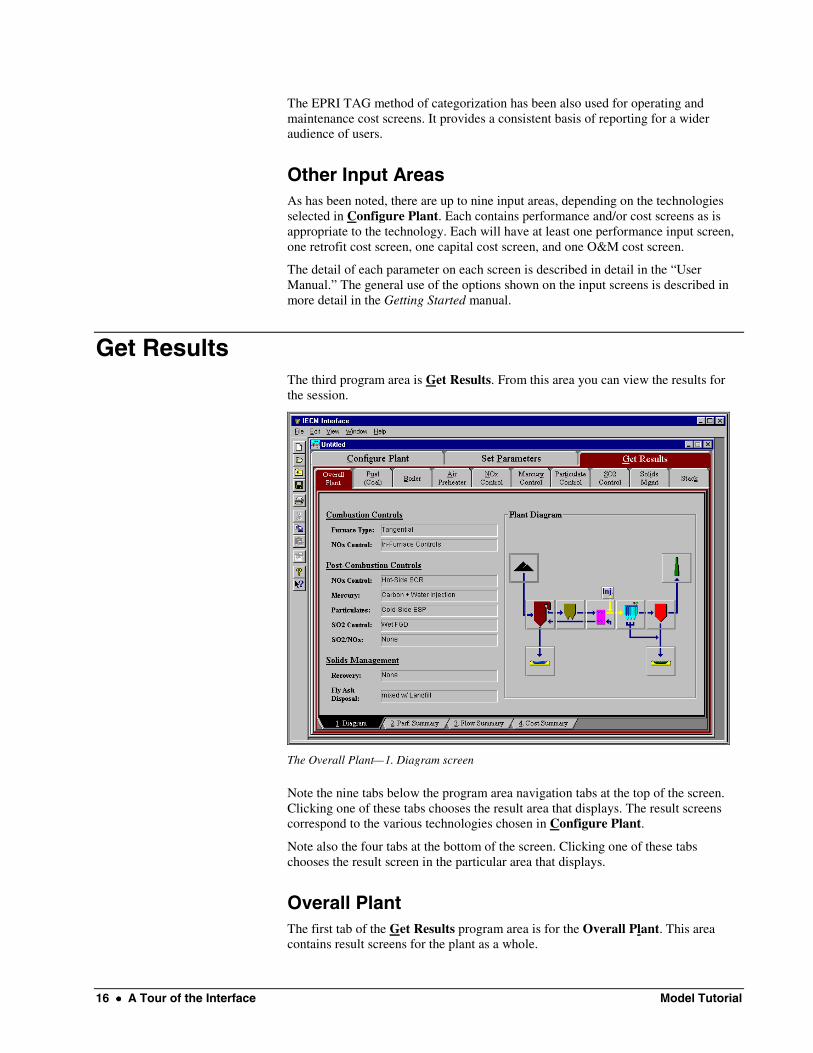
Get ResultsThe third program area is Get Results. From this area you can view the results forthe session.
The Overall Plant—1. Diagram screen
Note the nine tabs below the program area navigation tabs at the top of the screen.Clicking one of these tabs chooses the result area that displays. The result screenscorrespond to the various technologies chosen in Configure Plant.
Note also the four tabs at the bottom of the screen. Clicking one of these tabschooses the result screen in the particular area that displays.
Overall PlantThe first tab of the Get Results program area is for the Overall Plant. This areacontains result screens for the plant as a whole.

Model Tutorial A Tour of the Interface •••• 17
1. Diagram
The first screen of the Overall Plant result area is the 1. Diagram result screen (seepicture above). It displays the plant configuration settings on the left side of the pageand a diagram of the plant as configured at the right of the page. No results aredisplayed on this screen.
2. Performance Summary
The second screen of the Overall Plant result area is the 2. Perf. Summary resultscreen. It displays performance results for the plant as a whole. Values for the majorinput and outputs of the power plant are given.
The Overall Plant—2. Perf. Summary result screen
3. Flow Summary
The third screen of the Overall Plant result area is the 3. Flow Summary resultscreen. It displays values for the major flows in, through and out of the power plant.Subtotals and totals are highlighted with yellow on this and all result screens.

18 •••• A Tour of the Interface Model Tutorial
The Overall Plant—3. Flow Summary result screen
4. Cost Summary
The fourth screen of the Overall Plant result area is the 4. Cost Summary resultscreen. It displays costs associated with the power plant as a whole. Details of eachof the values shown on this screen can be accessed in the cost tables for eachseparate technology. This is described in more detail in the following sections.
The Overall Plant—4. Cost Summary result screen

Model Tutorial A Tour of the Interface •••• 19
BoilerThe third tab in the Get Results program area is for the Boiler result area. It containsresult screens for flows and costs related to the Boiler itself. The individual resultscreens for this result area will be described in the following sections. They arerepresentative of all the result screens for the remainder of the result areas in the GetResults program area.
Each result area contains the same result screens. The first is a pictorial diagram withthe major flow rates, temperatures, and performance values. The second screen is atable summarizing the capital costs. The third result screen shows a detailedbreakdown of the O&M costs. The fourth screen summarizes the total costs shownon the second and third screens but on an annualized basis. The fifth screensummarizes the input parameters used to derive the results on the second, third andfourth screens. The sixth and last screen summarizes the flue gas component flowrates in and out of the device.
1. Diagram
The first screen in the Boiler result area is the 1. Diagram result screen. It displaysan icon for the Boiler and values for major flows in and out of it.
The Boiler—1. Diagram result screen
2. Capital Cost
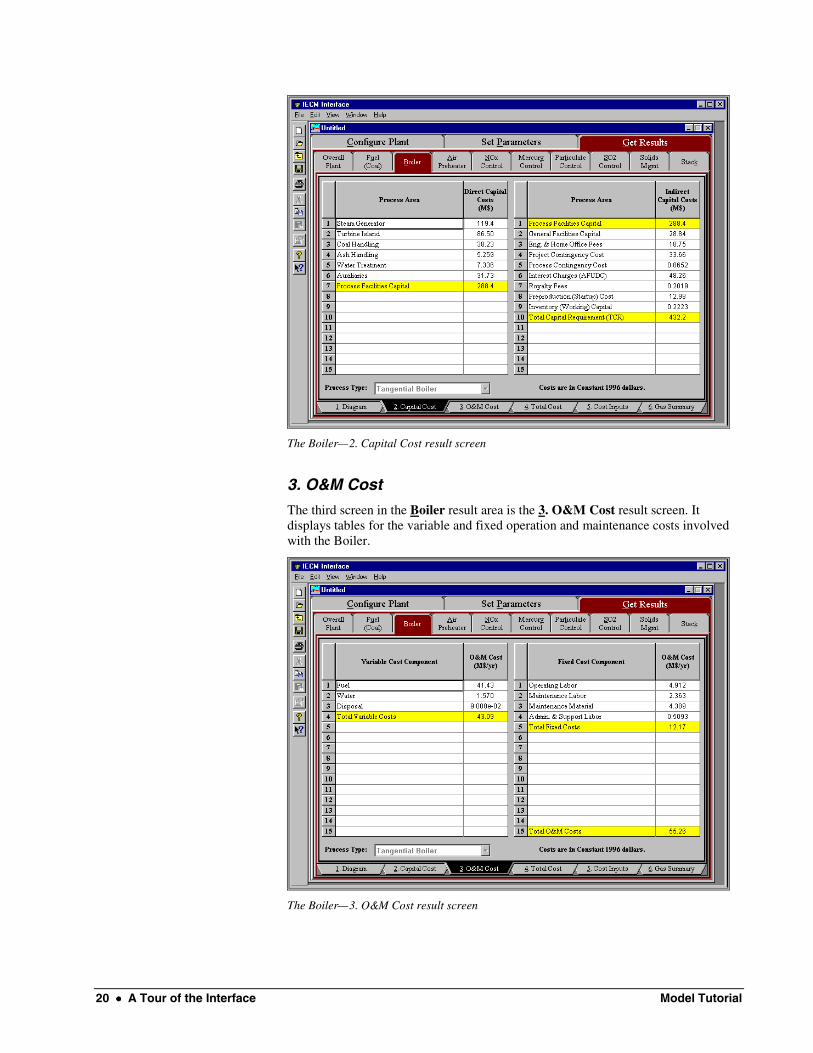
The second screen in the Boiler result area is the 2. Capital Cost result screen. Itdisplays tables for the direct and indirect capital costs related to the Boiler.
20 •••• A Tour of the Interface Model Tutorial
The Boiler—2. Capital Cost result screen
3. O&M Cost
The third screen in the Boiler result area is the 3. O&M Cost result screen. Itdisplays tables for the variable and fixed operation and maintenance costs involvedwith the Boiler.
The Boiler—3. O&M Cost result screen

Model Tutorial A Tour of the Interface •••• 21
4. Total Cost
The fourth screen in the Boiler result area is the 4. Total Cost result screen. Itdisplays a table which totals the annual fixed, variable, operations and maintenance,and capital costs associated with the boiler.
The Boiler—4. Total Cost result screen
5. Cost Inputs
The fifth screen in the Boiler result area is the 5. Cost Inputs result screen. Itdisplays tables for the performance and economic inputs used in deriving total costsfor the boiler.

22 •••• A Tour of the Interface Model Tutorial
The Boiler—5. Cost Inputs result screen
6. Gas Summary
The sixth screen in the Boiler result area is the 6. Gas Summary result screen. Itdisplays a table of quantities of flue gas components entering the boiler in heated airand exiting the boiler in the flue gas. For each component, quantities are given inboth moles and mass per hour.
The Boiler—6. Gas Summary result screen
Model Tutorial A Tour of the Interface •••• 23
Other Result AreasAs has been noted, there are up to nine result areas, depending on the technologiesselected in Configure Plant. Each contains diagram and/or cost screens as isappropriate to the technology.
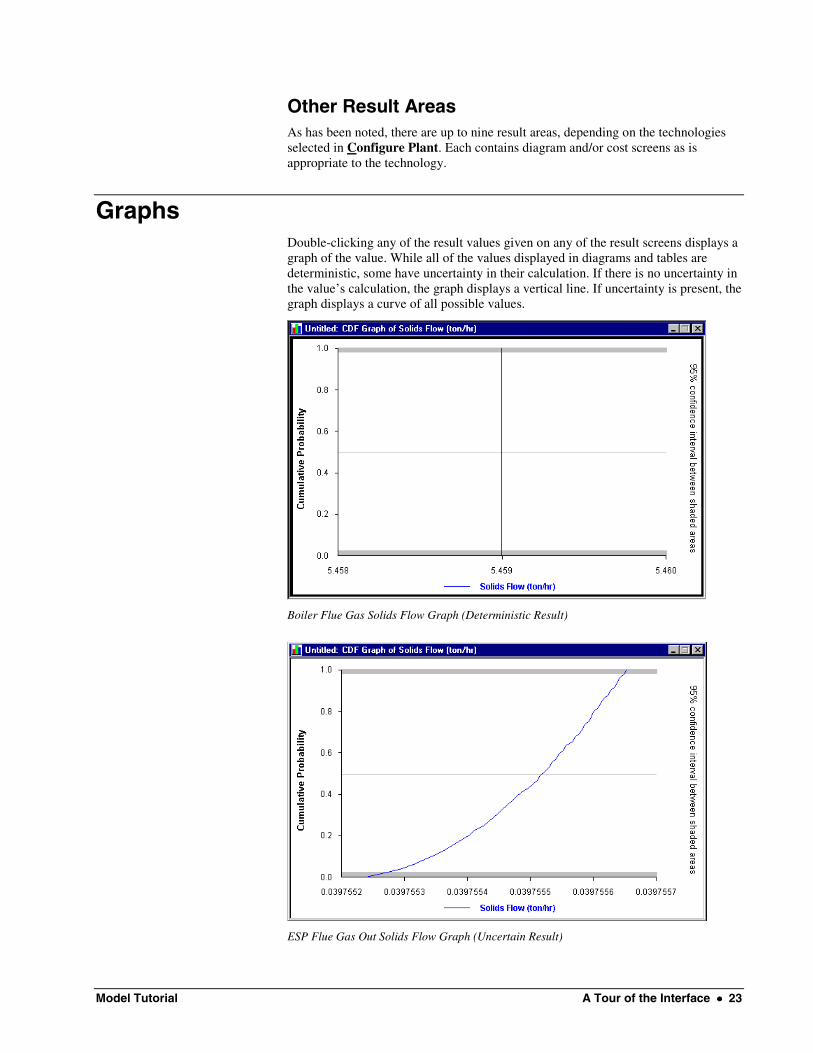
GraphsDouble-clicking any of the result values given on any of the result screens displays agraph of the value. While all of the values displayed in diagrams and tables aredeterministic, some have uncertainty in their calculation. If there is no uncertainty inthe value’s calculation, the graph displays a vertical line. If uncertainty is present, thegraph displays a curve of all possible values.
Boiler Flue Gas Solids Flow Graph (Deterministic Result)
ESP Flue Gas Out Solids Flow Graph (Uncertain Result)

24 •••• A Tour of the Interface Model Tutorial

Model Tutorial Case Study •••• 25
Case Study
The Case StudyThis chapter is meant to be used with the IECM Interface installed and running. Thecase study takes you to the commonly used screens described in the previouschapter. It is recommended that you:
1. Follow the directions to set up a plant, enter input parameters, and lookat results for the sample plant and
2. compare the screen shots to the screens you see.
Installing the IECM SoftwareTo install the IECM software, see the instructions in Getting Started and the UserManual.

26 •••• Case Study Model Tutorial
The IECM Window and Logo BoxOnce you have installed the IECM software, a program group called “IECMInterface” will appear in the Programs group in the Start Menu. To start the Model,click the IECM Interface icon in the Start Menu.
The IECM Logo Box
The model will launch, and the IECM Interface Window and Logo Box will display.
The Logo Box will disappear in 5 seconds, after which the interface will be ready foruse. You may also click the Close button in the upper right hand corner of the logobox to begin.
Once launched, the IECM Window displays. The IECM Window contains all thescreens used by the Interface and all the tools that control the software.
The IECM Window

Model Tutorial Case Study •••• 27
The New Session Dialog BoxThe first time you use the software, you will have to create a new session. Atsubsequent startups, you can create a new session or use a previously saved session.
To create a new session:
1. Pull down the File menu and select New Session The New Sessiondialog box will display.
2. Type Case Study. The screen should look like the follo wing:
The New Session dialog box
3. Click the Ok button.
A more detailed description of managing session data is described in the GettingStarted manual.
Once you have created a session, a session window will display. It contains all thescreens used by the session. The screen should look like the following:
The Session Window

28 •••• Case Study Model Tutorial
Configure PlantThe Configure Plant Program area will be the first screen displayed in the sessionwindow. On this screen, use the menus to choose the following technologies:
Combustion Controls:
NOx Control: In-Furnace Controls
Post-Combustion Controls:
Particulates: Cold Side ESP
Mercury: Carbon + Water Injection
SO2 Control: Wet FGD
A description of drop-down or pop-up menus is given in the Getting Started manual.Detailed descriptions of all individual settings are given in the User Manual.
The screen should look like the following:
The Configure Plant Program Area
Once you have chosen the options, move on to the Set Parameters program area.(You may return to Configure Plant to change the settings at any time: click its tabat the top of the screen.)

Model Tutorial Case Study •••• 29
Set ParametersClick the tab for the Set Parameters program area. The screen should look like thefollowing:
The Set Parameters Program Area
You may return to Set Parameters and change the inputs at any time: click its tab atthe top of the screen. Detailed descriptions of all inputs are given in the UserManual.
Overall PlantWhen you first enter the Set Parameters program area, the active TechnologyNavigation Tab is for the Overall Plant. This screen displays the plant configurationsettings on the left side of the page and a diagram of the plant as configured at theright of the page. No inputs are entered on this screen.
You can navigate to the other Technology Tabs by either clicking on them or using akeyboard equivalent (described in more detail in the Getting Started manual). Youmay use the Plant Diagram as an alternate way to move among input TechnologyNavigation Tabs. Click the button for the technology for which you would like toprovide inputs and it will activate the corresponding tab for that technology. Youmay also move through the Plant Diagram by pressing the Tab key (a highlightingbox will surround the technology selected) and press the Space bar to activate thecorresponding tab for that technology.
Coal PropertiesClick the Technology Navigation Tab for the Coal Properties input area. Inputs inthis area define the composition and cost of the coal used in the plant.

30 •••• Case Study Model Tutorial
1. Properties
When you first enter the Coal Properties input area, the 1. Properties input screenis displayed. On this screen you select the particular coal and its properties.
There are two panes: one for the ash and coal properties of the Current Coal, theother for those of Favorite Coals. The current coal is the coal which the model willconduct its calculations. Favorite coals are those that you use most. From this screen,you may choose a favorite coal, choose a coal from the model defaults, enter a user-defined coal, choose a previously saved user-defined coal, or manage your coal lists.
Choose the Appalachian Medium Sulfur coal for this model run:
1. Click the Browse All Coals button in the Favorite Coals pane.
2. Click Appalachian Medium Sulfur in the drop-down menu of theSelect Coal pane.
3. Click the Use This Coal button.
When you are finished, the screen should look like the following:
The Coal Properties—1. Properties input screen
Base PlantClick the Technology Navigation Tab for the Base Plant input area. Inputs in thisarea define performance and costs directly associated with the power plant,particularly the boiler.
1. Performance
When you first enter the Base Plant input area, the 1. Performance input screen isdisplayed. Inputs for the major flow rates and concentrations of the gas and solidsstreams are entered on this screen.

Model Tutorial Case Study •••• 31
The first six inputs are highlighted in blue to point out their importance. Detaileddescriptions of all inputs are given in the User Manual. Descriptions of how to enterinputs and replacing calculated values are given in the Getting Started manual.
Enter the following values for the first five inputs:
Gross Electrical Output: 600 MW
Steam Cycle Heat Rate: 8100 Btu/kWh
Boiler Efficiency: this is calculated by the model – do not change it
Capacity Factor: 80 %
Excess Air For Furnace: this is calculated by the model – do not change it
Leakage Air at Preheater: 10 % (override calculated value)
When you are finished, the screen should look like the following:
The Base Plant—1. Performance input screen
Uncertainty distributions are provided by default with several of the cost inputparameters of the technologies accessible from the various navigation tabs. These aredescribed in more detail in the User Manual. For this case study, only oneperformance parameter will be used to demonstrate the use of uncertainty.
Define a triangular distribution for boiler efficiency:
1. Click the Boiler Efficiency (%) uncertainty button in the Unc column.This will bring up the Uncertainty Editor window.
2. Select Triangular from the Distribution: drop-down menu.
3. Assume the boiler efficiency can be 1% higher or lower than thenominal value calculated by the IECM. This would be represented byentering 0.99, 1.00, and 1.01 in the Mid, Mode, and Max input fieldsrespectively. Notice that these are multiplicative factors. The nominalor actual values are displayed immediately below the normalized valuesyou entered.

32 •••• Case Study Model Tutorial
After you are finished entering the triangular distribution parameters, the screenshould look like the following:
Uncertainty Editor
4. Click the Done button to close the Uncertainty Editor.
Notice that a “?” appears inside the uncertainty button. This is a reminder thatuncertainty has been applied to this input parameter. This is shown in the following:
The Base Plant – 1. Performance input screen
Other Input Areas and TechnologiesDefault parameters will be used for all the other input areas for the base plant andother technology tabs. You may browse these input screens to view the defaults.

Model Tutorial Case Study •••• 33
Get ResultsClick the tab for the Get Results program area. From this area you can view theresults for this session.
The Get Results Program Area
You may return to Get Results to look at results at any time: click its tab at the topof the screen. Detailed descriptions of all results are given in the User Manual.
Overall PlantWhen you first enter the Get Results program area, the Technology Navigation Tabwhich is active is for the Overall Plant. This area contains result screens for theplant as a whole.
1. Diagram
When you first enter the Overall Plant result area, the 1. Diagram result screen isdisplayed. This screen displays the plant configuration settings on the left side of thepage and a diagram of the plant as configured at the right of the page. No results aredisplayed on this screen.
You may use the Plant Diagram as an alternate way to move among inputTechnology Navigation Tabs, similarly to the alternatives available on the SetParameters program area. See “Overall Plant” on page 29 to see the alternatives.
2. Performance Summary
Click the Result Navigation Tab for the 2. Perf. Summary result screen. It displaysperformance results for the plant as a whole. Values for the major input and outputsof the power plant are given. The screen should look like the following:
34 •••• Case Study Model Tutorial
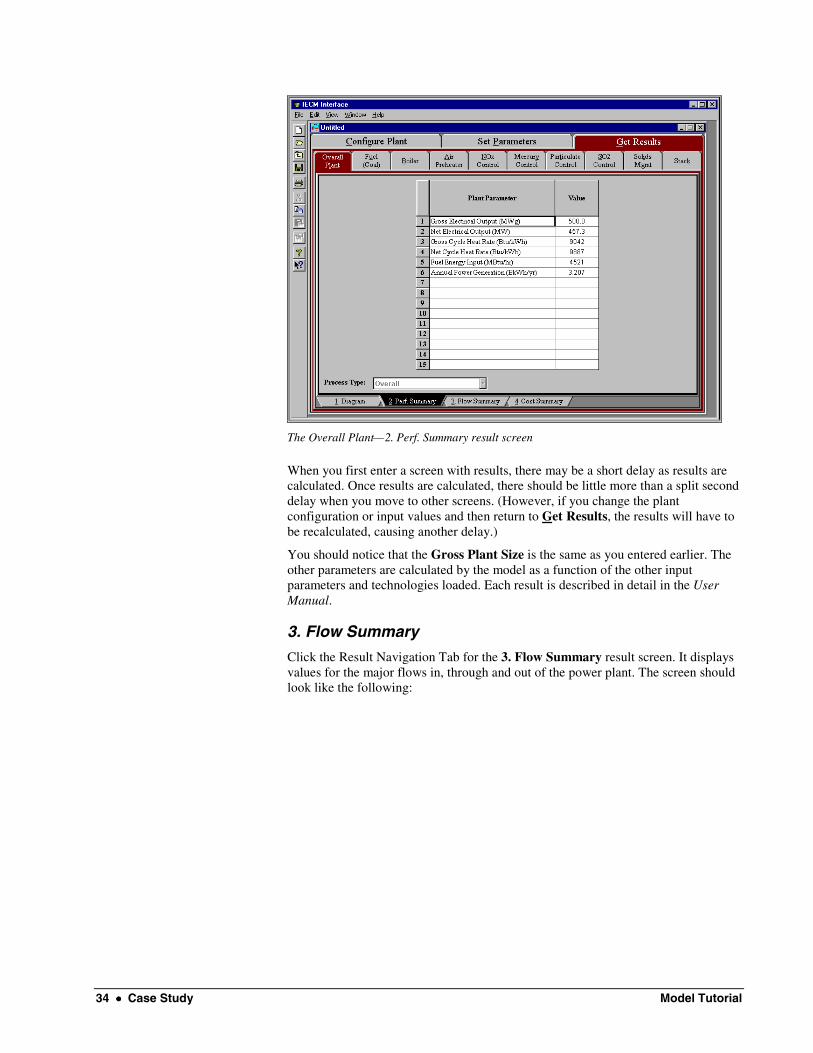
The Overall Plant—2. Perf. Summary result screen
When you first enter a screen with results, there may be a short delay as results arecalculated. Once results are calculated, there should be little more than a split seconddelay when you move to other screens. (However, if you change the plantconfiguration or input values and then return to Get Results, the results will have tobe recalculated, causing another delay.)
You should notice that the Gross Plant Size is the same as you entered earlier. Theother parameters are calculated by the model as a function of the other inputparameters and technologies loaded. Each result is described in detail in the UserManual.
3. Flow Summary
Click the Result Navigation Tab for the 3. Flow Summary result screen. It displaysvalues for the major flows in, through and out of the power plant. The screen shouldlook like the following:

Model Tutorial Case Study •••• 35
The Overall Plant—3. Flow Summary result screen (maximum hourly values)
As mentioned before, the totals are highlighted for you in yellow. Each result isdescribed in detail in the User Manual.
The results above are based on a maximum hourly flow rate which assumes 100%capacity. To see the annual average values, which takes into consideration thecapacity factor you entered earlier, do the following:
1. Select Result Tools from the View menu. This displays a window withresult menu options.
Result Tools
2. Select Avg Annual Avg. from the Time Period: menu. The flow rateson the result screen are automatically updated.
3. Select Result Tools from the View menu again. This closes thewindow. (An alternative way to close the window is to click the “X”box in the upper right corner of the window.)
The numbers on the result screen will automatically be updated. The year costs arereported can be changed on this tool window.

36 •••• Case Study Model Tutorial
The Overall Plant—3. Flow Summary result screen (annual average values)
4. Cost Summary
Click the Result Navigation Tab for the 4. Cost Summary result screen. It displayscosts associated with the power plant as a whole. Costs are in constant 1996 dollars.The screen should look like the following:
The Overall Plant—4. Cost Summary result screen
Each result is described in detail in the User Manual.

Model Tutorial Case Study •••• 37
BoilerClick the Technology Navigation Tab for the Boiler result area. This area containsresult screens for flows and costs related to the Boiler itself.
1. Diagram
When you first enter the Boiler result area, the 1. Diagram result screen isdisplayed. This screen displays an icon for the Boiler and values for major flows inand out of it. The flow rates are shown in annual average units (tons/yr) due to theunit change made earlier. Due to the trace flow rates of mercury, it's flow rate isreported in lb/yr. The screen should look like the following:
The Boiler—1. Diagram result screen
Each result is described in detail in the User Manual.
2. Capital Cost
Click the Result Navigation Tab for the 2. Capital Cost result screen. It displaystables for the direct and indirect capital costs related to the Boiler. Costs are inconstant 1996 dollars. The screen should look like the following:

38 •••• Case Study Model Tutorial
The Boiler—2. Capital Cost result screen
Each result is described in detail in the User Manual.
3. O&M Cost
Click the Result Navigation Tab for the 3. O&M Cost result screen. It displaystables for the variable and fixed O&M costs involved with the Boiler. Costs are inconstant 1996 dollars. The screen should look like the following:
The Boiler—3. O&M Cost result screen
Each result is described in detail in the User Manual.

Model Tutorial Case Study •••• 39
GraphsDouble-click the result value on the Boiler—3. O&M Cost result screen for the TotalVariable costs. A graph of the value will display. The screen should look like thefollowing:
Graph of Total Variable Costs (Uncertain)
When you first bring up a graph, there will be a short delay as all result graphs aredrawn. Once all the graphs are drawn, there should be little more than a split seconddelay when you choose another graph. (However, if you change the plantconfiguration or input values and then return to Get Results, the graphs will have tobe redrawn, causing another delay.)
While all of the values displayed in diagrams and tables are deterministic, some haveuncertainty in their calculation. If there is no uncertainty in the value’s calculation,the graph displays a vertical line. If uncertainty is present, the graph displays a curveof all possible values.

40 •••• Index Model Tutorial
Index
B
Boiler 20
C
Coal Properties 11
D
Development software 2
G
Getting Started 4
I
Import 8
M
Model Tutorial 4
O
Online Help 4Overall Plant 16, 17, 18
P
Print 8
S
Sessiondelete 8import 8new 8
T
Technical Manual 4
U
Uncertainty 2Uncertainty Distributions 2User Manual 4