integrated ccs for kansas (ickan) · integrated ccs for kansas (ickan) ... reverse fault. 3 miles....
TRANSCRIPT

Integrated CCS for Kansas (ICKan)
Project Number FE0029474
Martin DuboisImproved Hydrocarbon Recovery, LLC
Tandis BidgoliKansas Geological Survey
University of Kansas
U.S. Department of EnergyNational Energy Technology Laboratory
DE-FOA0001584 Kickoff MeetingMarch 14 – 15, 2017
22
Presentation Outline• Program benefits• Project overview: goals and objectives• Research methodology• Expected outcomes• Organization and communication• Tasks and Subtasks• Deliverables and milestones• Project risks (Phase I and Phase II)• Schedule• Summary• Appendix

33
Benefit to the Program
Sub-basinal characterizations
Reservoir & simulation models for geological
storage
Testing site screening tools (i.e., NRAP)
Goal 1: Develop & validate technologies to ensure 99 %
storage permanence,
Goal 2: Develop technologies to improve reservoir storage
efficiency while ensuring containment effectiveness
Goal 3: Support industry’s ability to predict CO2 storage
capacity in geologic formations to within ±30 %
Goal 4: Develop best practices for commercial-
scale CCS
DOE Program GoalsThis Study

44
Benefit StatementICKan will address the handling of CO2 emissions from the source and transport them to thestorage site utilizing the combined knowledge and experience of The Linde Group includingtheir own research on post-combustion 2nd Generation CO2 capture currently sponsored bythe DOE, the electrical utilities, refinery, and the latest R&D efforts such as DOE's CarbonCapture Simulation Initiative. The knowledge, experience, and lessons learned by the KGSregarding regional studies, site characterization, monitoring, EPA Class VI permitting, andincorporating NRAP models and tools will be bring best-practices to bear on proving up acommercial-scale carbon storage complex that is safe and dependable. In this Phase I:Integrated CCS Pre-Feasibility Study, ICKan will complete the formation of the CCSCoordination Team who will deliver a plan and strategy to address the technical and non-technical challenges specific to commercial-scale deployment of a CO2 storage project utilizingthe experience and the expertise of the Team. A development plan will address technicalrequirements, economic feasibility, and public acceptance of an eventual storage project at theprimary source-sink site at Westar Energy's Jeffrey Energy Center. High-level technicalevaluations will also be made of sub-basin and potential CO2 sources utilizing prior experienceand methodologies developed previously and for this project. The ICKan and CCSCoordination Team will generate information that will allow DOE to make a determination of theproposed storage complex's level of readiness for additional development under Phase II,based upon the findings for commercial-scale capture, transportation, and storage sitesidentified as part of this investigation. Information acquired will be shared via the NETL-EDXdata portal.
55
Project Overview:Goals & Objectives
• Identify and address major technical and nontechnical challenges of implementing CO2 capture and transport and establishing secure geologic storage for CO2 in Kansas
• Evaluate and develop a plan and strategyto address the challenges and opportunities for commercial-scale CCS in Kansas

6
• Capture 50 million tonnes CO2 from one of three Jeffrey Energy Center’s 800 MWe plants over a 20 year period (2.5Mt/yr)
• Compress CO2 and transport 300 miles to Pleasant Prairie Field in SW Kansas. – Alternative: 50 miles to Davis Ranch and John
Creek Fields.
• Inject and permanently store 50 million tonnes CO2 in the Viola Formation and Arbuckle Group
6
Project Overview:Base Case Scenario

77
Storage sites
Jeffrey to SW Kansas
88
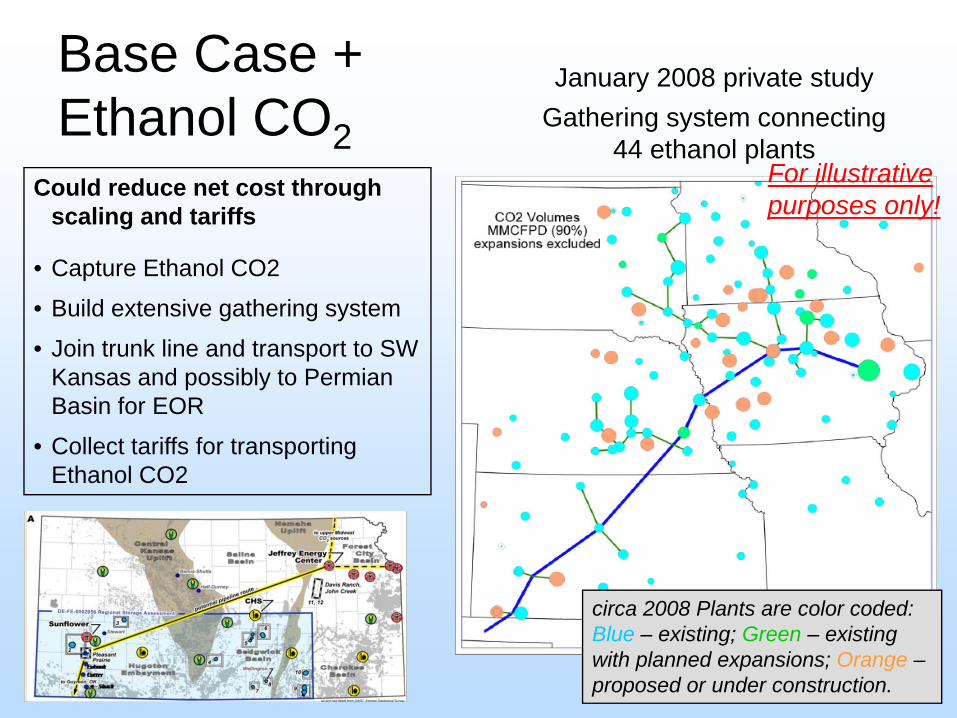
For illustrative purposes only!
Base Case + Ethanol CO2
January 2008 private studyGathering system connecting
44 ethanol plantsCould reduce net cost through
scaling and tariffs
• Capture Ethanol CO2
• Build extensive gathering system
• Join trunk line and transport to SW Kansas and possibly to Permian Basin for EOR
• Collect tariffs for transporting Ethanol CO2
circa 2008 Plants are color coded: Blue – existing; Green – existing with planned expansions; Orange –proposed or under construction.

9
Technical EvaluationsSub-Basinal Evaluations
CO2 Source Assessments
• 170 Mt storage• Viola &
Arbuckle• CO2-EOR
reservoirs• Adequate data
(core)• Unitized;
single operator
• 50 Mt storage• Simpson and
Arbuckle• Proximity to
JEC• CO2-EOR
reservoirs• Adequate data• Two operators
• 300 mile trunk line
• Connect to Midwest ethanol CO2 gathering system
• Connect to Permian through Oklahoma Panhandle
CO2Transportation
Sunflower’s Holcomb Plant
CHS McPhersonRefinery
KC Board of Public Utilities
• 2.4 GW & 12.5 million tonnes of CO2
9
Pleasant Prairie
Davis Ranch-John Creek
Westar Jeffrey Energy Center Pipeline

10
Non-Technical Evaluations
Implementation Plan
• Capture & transportation economic feasibility (with or w/o ethanol component)
• Financial backing• Financial assurance
under Class VI• State incentives• Federal tax policy
• Identify stakeholders
• Foster relationships
• Public perception• Political
challenges• Injection-induced
seismicity
• Pore space property rights including force unitization
• CO2 ownership & liability• MVA requirements under
UIC Class VI• Varying stakeholder
interests• Right-of-ways• Utility rate-payer
obligations10
Economics Legal & Regulatory Public Policy (Public Acceptance))

11
Success Criteria
CCS Coordination TeamReservoirs characterizedCO2 source assessmentsCO2 transportation assessmentImplementation plan
• Go-No Go decision point in November 2017
• Tied to application for Phase II of CarbonSAFE
11
12
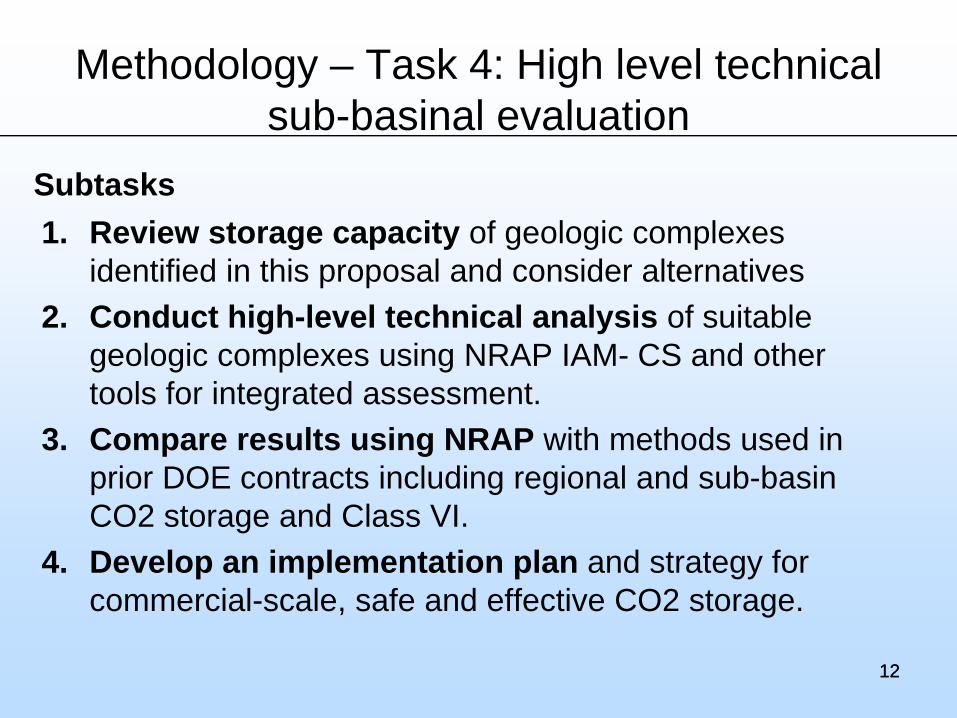
Methodology – Task 4: High level technical sub-basinal evaluation
1. Review storage capacity of geologic complexes identified in this proposal and consider alternatives
2. Conduct high-level technical analysis of suitable geologic complexes using NRAP IAM- CS and other tools for integrated assessment.
3. Compare results using NRAP with methods used in prior DOE contracts including regional and sub-basin CO2 storage and Class VI.
4. Develop an implementation plan and strategy for commercial-scale, safe and effective CO2 storage.
12
Subtasks

Davis Ranch and John Creek Fields in the Forest City Basin (FCB)
Jeffrey Energy Center
Davis Ranch
John Creek
• Davis Ranch and John Creek
• Largest oil fields in the area
• Close proximity to Jeffrey
• Combined they may be capable of storing 50+Mt CO2
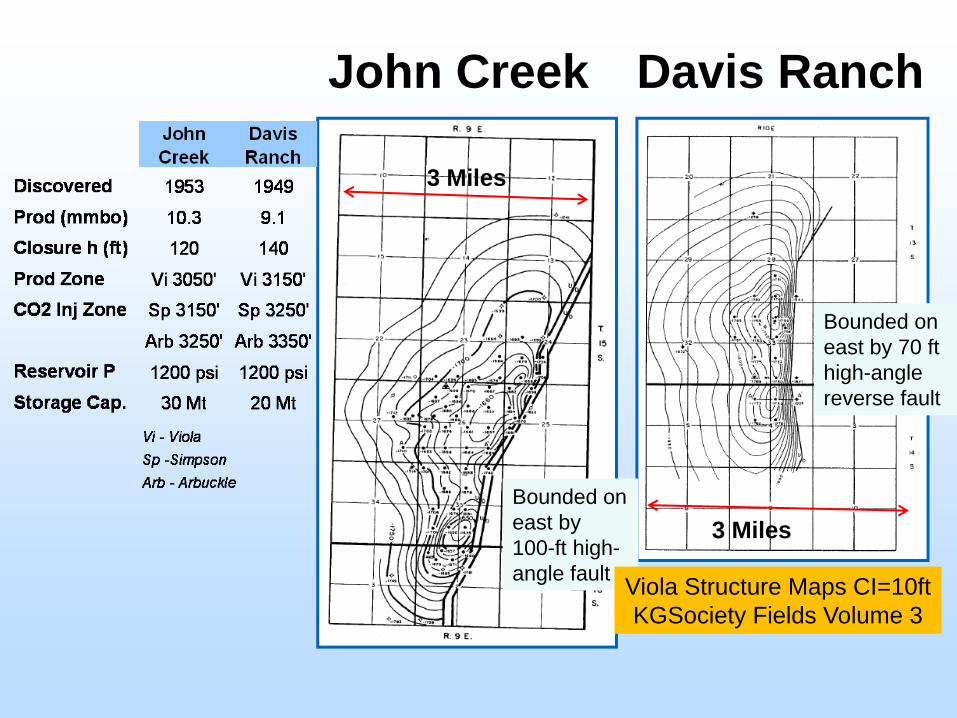
Davis Ranch
3 Miles
Bounded on east by 70 ft high-angle reverse fault
3 Miles
Bounded on east by 100-ft high-angle fault
John Creek
Viola Structure Maps CI=10ftKGSociety Fields Volume 3
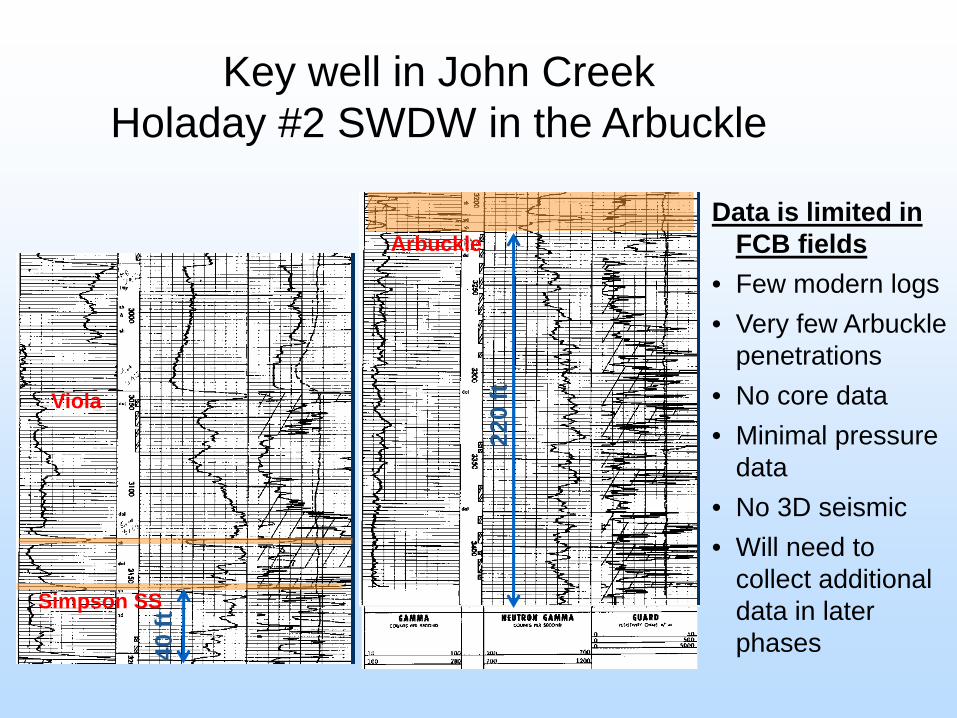
Key well in John CreekHoladay #2 SWDW in the Arbuckle
Viola
Simpson SS
ArbuckleData is limited in
FCB fields• Few modern logs• Very few Arbuckle
penetrations• No core data• Minimal pressure
data• No 3D seismic• Will need to
collect additional data in later phases
220
ft
40 ft
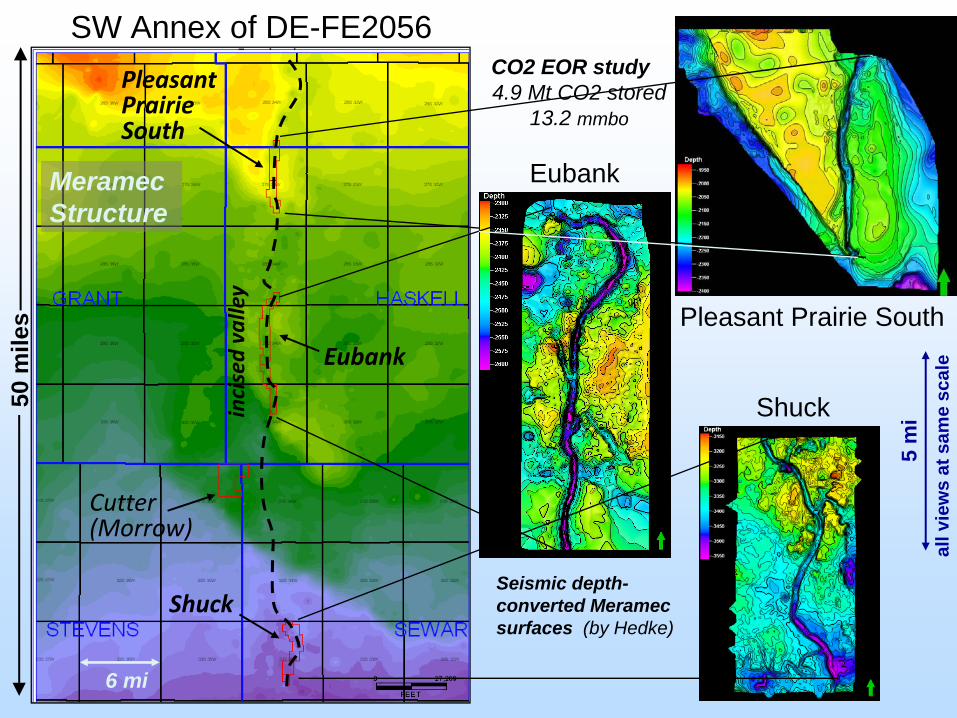
Pleasant Prairie South
Eubank
Shuck
Cutter(Morrow)
incised valley
Pleasant Prairie South
Eubank
Shuck
Meramec Structure
Seismic depth-converted Meramecsurfaces (by Hedke)
5 m
ial
l vie
ws
at s
ame
scal
e
6 mi
50 m
iles
SW Annex of DE-FE2056CO2 EOR study4.9 Mt CO2 stored
13.2 mmbo
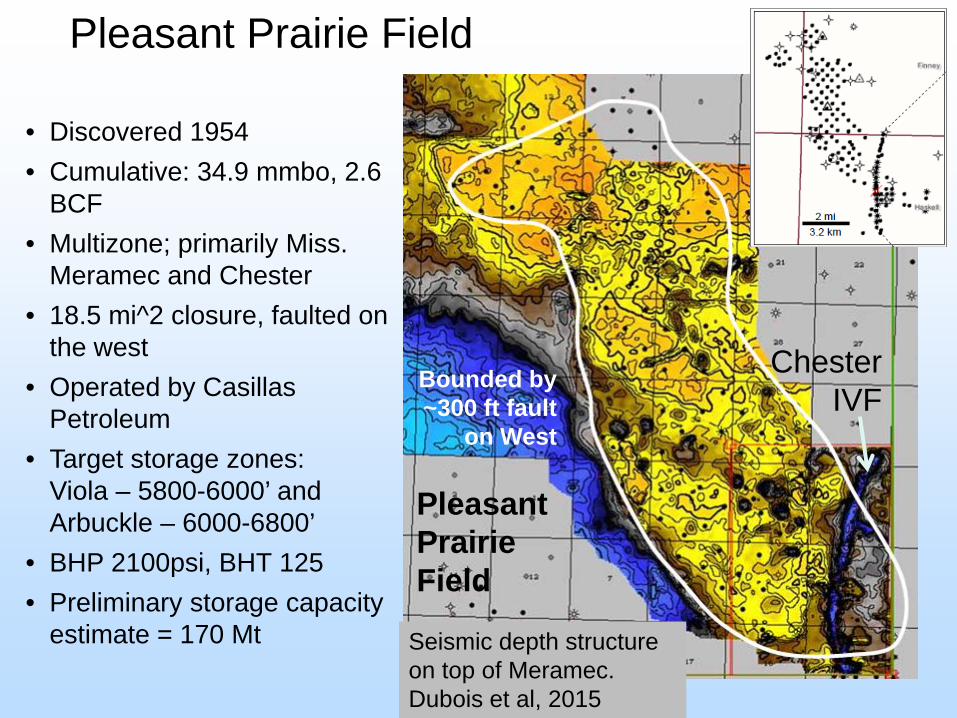
Pleasant Prairie Field
Chester IVF
• Discovered 1954• Cumulative: 34.9 mmbo, 2.6
BCF• Multizone; primarily Miss.
Meramec and Chester• 18.5 mi^2 closure, faulted on
the west• Operated by Casillas
Petroleum• Target storage zones:
Viola – 5800-6000’ and Arbuckle – 6000-6800’
• BHP 2100psi, BHT 125• Preliminary storage capacity
estimate = 170 Mt Seismic depth structure on top of Meramec. Dubois et al, 2015
Bounded by ~300 ft fault
on West
Pleasant Prairie Field
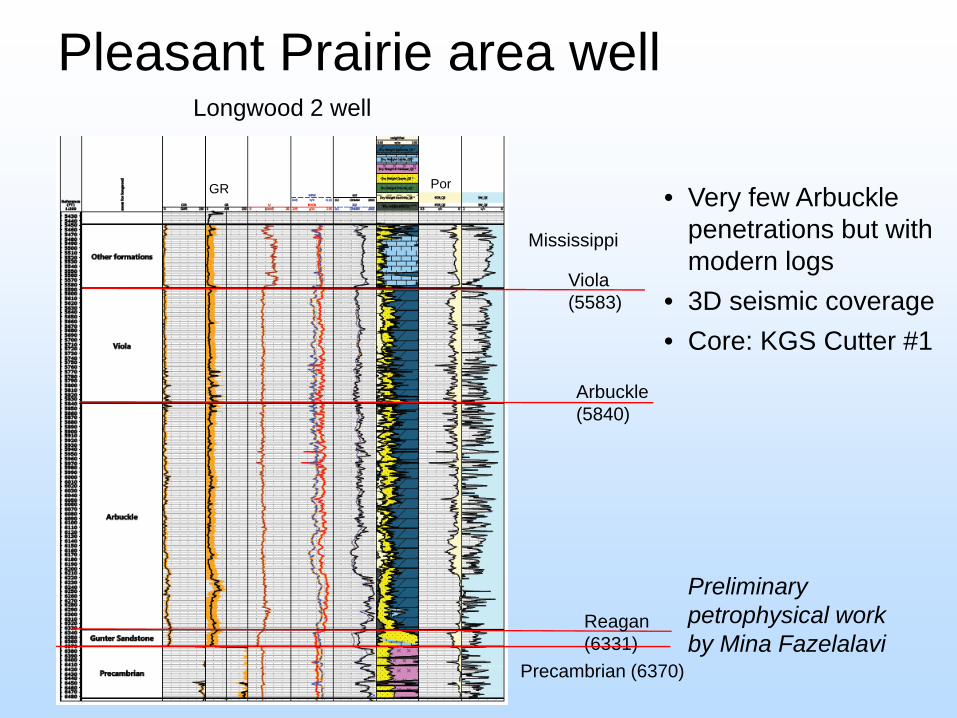
Pleasant Prairie area well
Preliminary petrophysical work by Mina Fazelalavi
Viola(5583)
Arbuckle(5840)
Reagan(6331)
Precambrian (6370)
• Very few Arbuckle penetrations but with modern logs
• 3D seismic coverage• Core: KGS Cutter #1
Mississippi
Longwood 2 well
PorGR
19
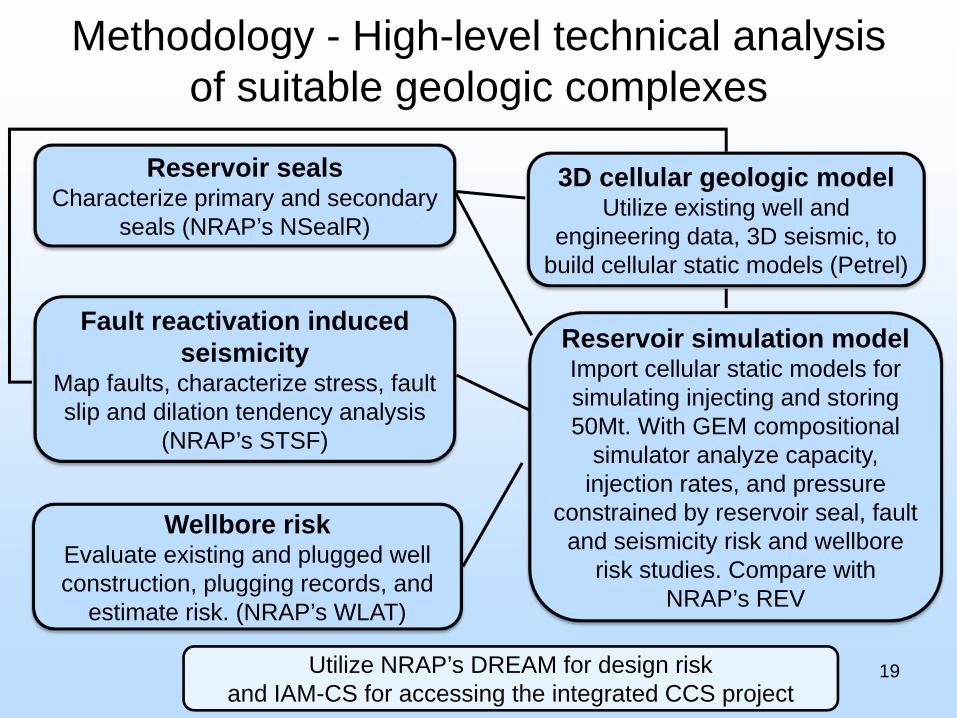
Methodology - High-level technical analysis of suitable geologic complexes
Reservoir simulation modelImport cellular static models for simulating injecting and storing 50Mt. With GEM compositional
simulator analyze capacity, injection rates, and pressure
constrained by reservoir seal, fault and seismicity risk and wellbore
risk studies. Compare with NRAP’s REV
3D cellular geologic model Utilize existing well and
engineering data, 3D seismic, to build cellular static models (Petrel)
Wellbore riskEvaluate existing and plugged well construction, plugging records, and
estimate risk. (NRAP’s WLAT)
Reservoir sealsCharacterize primary and secondary
seals (NRAP’s NSealR)
Fault reactivation induced seismicity
Map faults, characterize stress, fault slip and dilation tendency analysis
(NRAP’s STSF)
Utilize NRAP’s DREAM for design risk and IAM-CS for accessing the integrated CCS project

20
Methodology – Task 5: High level technical CO2 source assessment for capture.
20
1. Review sources for suitability• Confirm volumes and conditions with operators
2. Collaborate with source operators• Site visits for establishing relationships, evaluating siting, optimization• Minimize existing plant operations disruption
3. Determine capture technology• Coal-fired power - newer generation of amine (solvent-based) capture• Hydrogen reformers – post-combustion solvent-based or sorbent-based
(pressure or vacuum swing adsorption) capture from syngas or purge gas
4. Determine optimization opportunities• Coal-fired power - Reduce parasitic load. Multiple waste-heat sources targeted
for steam generation for solvent regeneration• Hydrogen reformers - Combine with expansion of refinery steam generation to
gain efficiencies
5. Preliminary engineering design• Design for optimal scenario: economics and CO2 capture • Optimize for overall most cost effective for capture and existing operations

2121
Site visits on Feb 15 in conjunction with ICKan kick-off meeting
Power plant capacity:― 3 x 800 MWe power plants located in St. Marys,
KS with a total nameplate annual CO2 emissions of 12.5 million tonnes.
Capture opportunity: ― Partial CO2 capture (~350 MWe flue gas) can
satisfy the entire ICKan CO2 ICCS 50Mt+ over a 20 years project period
Optimization opportunities for capturing waste heat identified
21
Steam Methane Reformer H2 plant capacities:― Two ~40,000 Nm3/hr PSA (Pressure swing
adsorption) H2 plants― SMR furnace flue gases ~760,000 Tonnes/year.
(30% of the ICKan CO2 ICCS needs)Capture opportunity: ― Solvent based post-combustion capture from the
reformer furnace flue gas would maximize CO2emissions reduction (~90% of total emissions).
Optimization opportunities for efficiency gains through centralized steam generation possible.
22
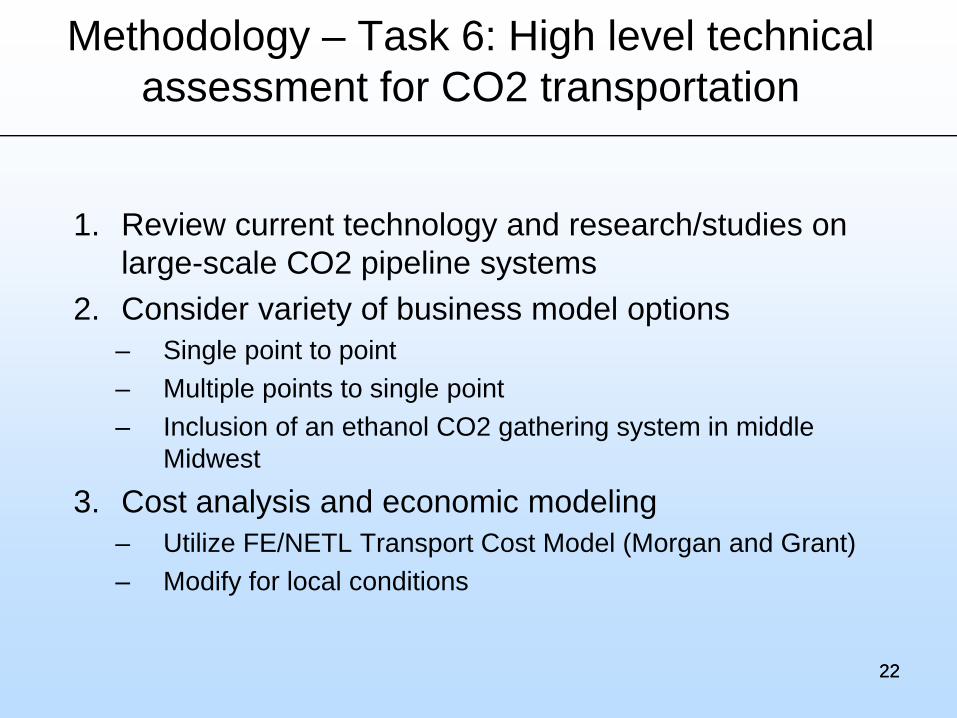
Methodology – Task 6: High level technical assessment for CO2 transportation
1. Review current technology and research/studies on large-scale CO2 pipeline systems
2. Consider variety of business model options– Single point to point– Multiple points to single point– Inclusion of an ethanol CO2 gathering system in middle
Midwest
3. Cost analysis and economic modeling– Utilize FE/NETL Transport Cost Model (Morgan and Grant)– Modify for local conditions
22

Economics – from paper studies
Mid -case for Mohan etal (2008) and NEORI (2012)* Proprietary Study (2008): 3.4 MT/yr from 14 ethanol plants ,470 miles of pipeline
Estimated costs to capture, compress, transport CO2• $50-60/tonne from coal-fired power • $38/tonne from ethanol plants
ICKan: Economic analysis of integrated project1. Capture and compression: develop in-house model2. Transportation: FE/NETL Transport Cost Model (Morgan and
Grant)3. Storage site preparation and operations: consider FE/NETL
Saline Storage Cost Model (Grant and Morgan)

24
Expected Outcomes
24
Outcome Results
Comprehensive development and implementation plan encompassing technical requirements, economic feasibility and public acceptance of an eventual CCS project
Detailed injection, storage, and monitoring plan. Legal regulatory and public policy challenges identified and plan prepared for addressing the challenges.
Formation of a CCS team to address technical and non-technical challenges for commercial-scale deployment of a CO2 storage project
Expand Phase I research team and partners/stakeholders for CarbonSAFE Phase II, Storage Complex Feasibility, DE-FOA-0001450
High-level technical evaluation of sub-basin geologic sites
Identification of geologic sites likely to be capable of safely storing 50Mt+ CO2
High-level technical evaluation CO2 sources and transportation
Technical evaluations for CO2 capture from a coal-fired power plant and refinery hydrogen reformers optimized for economics. Economic analysis of transportation scenarios to reduce CO2 transportation for CCS.
25
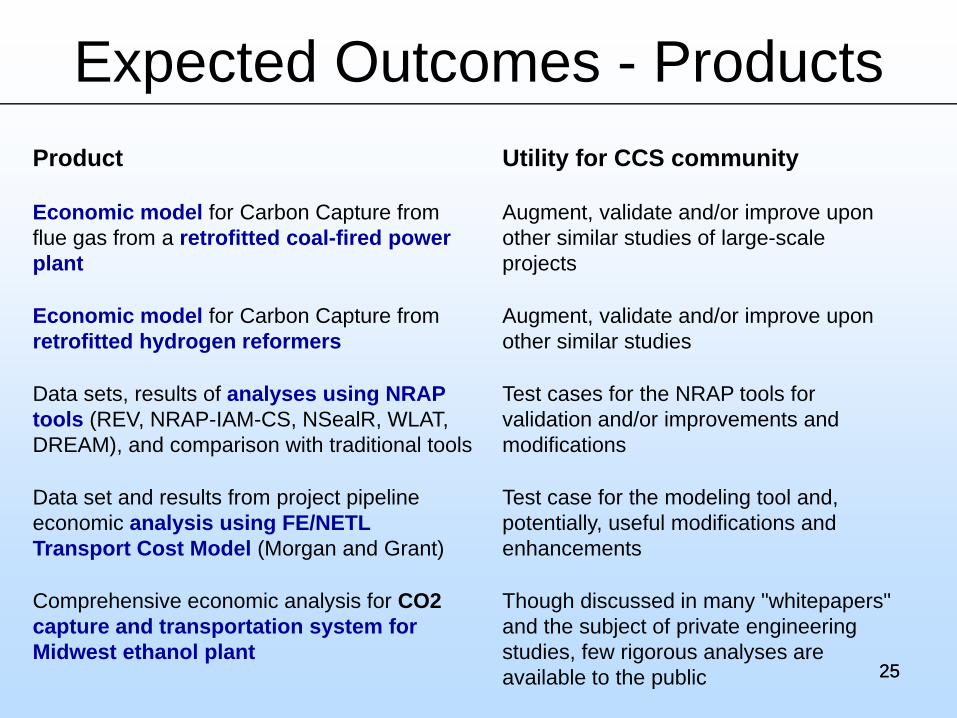
Expected Outcomes - Products
25
Product Utility for CCS community
Economic model for Carbon Capture from flue gas from a retrofitted coal-fired power plant
Augment, validate and/or improve upon other similar studies of large-scale projects
Economic model for Carbon Capture from retrofitted hydrogen reformers
Augment, validate and/or improve upon other similar studies
Data sets, results of analyses using NRAP tools (REV, NRAP-IAM-CS, NSealR, WLAT, DREAM), and comparison with traditional tools
Test cases for the NRAP tools for validation and/or improvements and modifications
Data set and results from project pipeline economic analysis using FE/NETL Transport Cost Model (Morgan and Grant)
Test case for the modeling tool and, potentially, useful modifications and enhancements
Comprehensive economic analysis for CO2 capture and transportation system for Midwest ethanol plant
Though discussed in many "whitepapers" and the subject of private engineering studies, few rigorous analyses are available to the public

2626
Organization: Phase I Research Team
18 team members, four subcontractors and KGS staff
2727
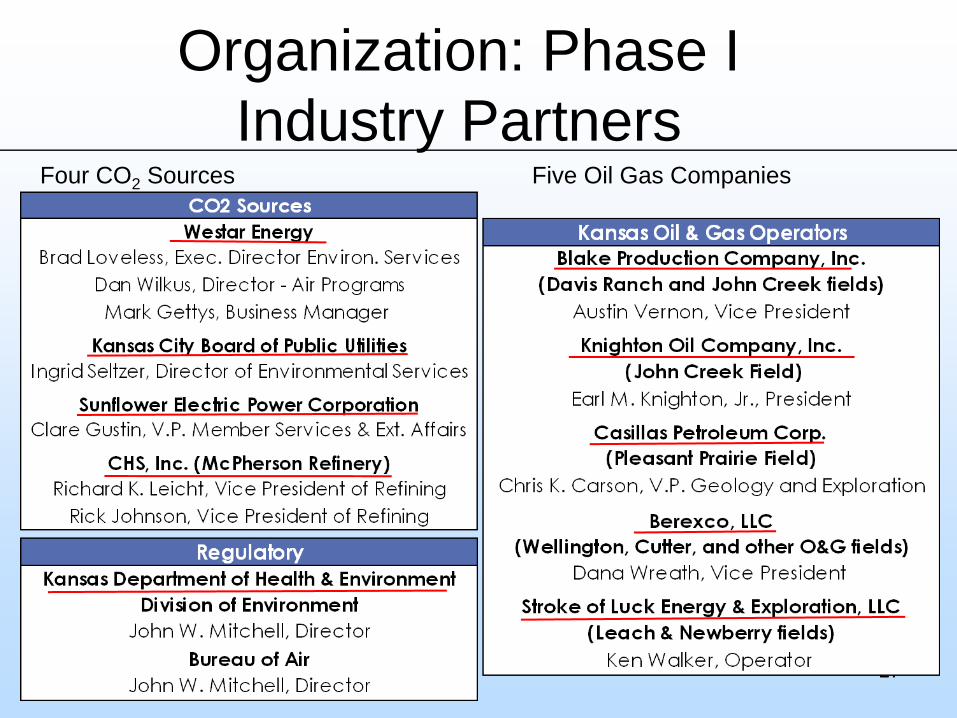
Organization: Phase I Industry Partners
Four CO2 Sources Five Oil Gas Companies

28
Communication Plan• Periodic scheduled meetings
– Monthly team meetings
– Quarterly all-teams meeting
– Biannual all-hands meetings (teams + participants)
• Communicate project status, confirm schedule, and reiterate upcoming deliverables.
• Ensure data and information are appropriately collected, integrated, modeled, and simulated
• Ensure decisions that critically impact the project are made in informed fashion and will meet the short- and long-term project goals.
• Communicate regularly with the DOE Project Manager
28
29
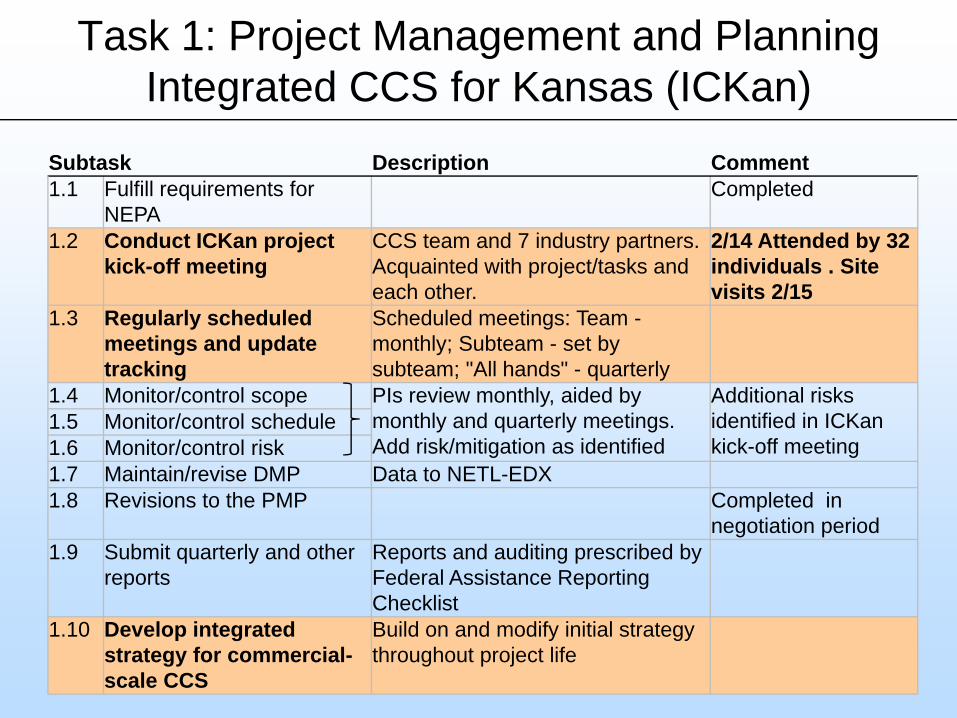
Task 1: Project Management and Planning Integrated CCS for Kansas (ICKan)
29
Subtask Description Comment1.1 Fulfill requirements for
NEPACompleted
1.2 Conduct ICKan project kick-off meeting
CCS team and 7 industry partners. Acquainted with project/tasks and each other.
2/14 Attended by 32 individuals . Site visits 2/15
1.3 Regularly scheduled meetings and update tracking
Scheduled meetings: Team -monthly; Subteam - set by subteam; "All hands" - quarterly
1.4 Monitor/control scope PIs review monthly, aided by monthly and quarterly meetings. Add risk/mitigation as identified
Additional risks identified in ICKan kick-off meeting
1.5 Monitor/control schedule1.6 Monitor/control risk1.7 Maintain/revise DMP Data to NETL-EDX1.8 Revisions to the PMP Completed in
negotiation period1.9 Submit quarterly and other
reportsReports and auditing prescribed by Federal Assistance Reporting Checklist
1.10 Develop integrated strategy for commercial-scale CCS
Build on and modify initial strategy throughout project life
30
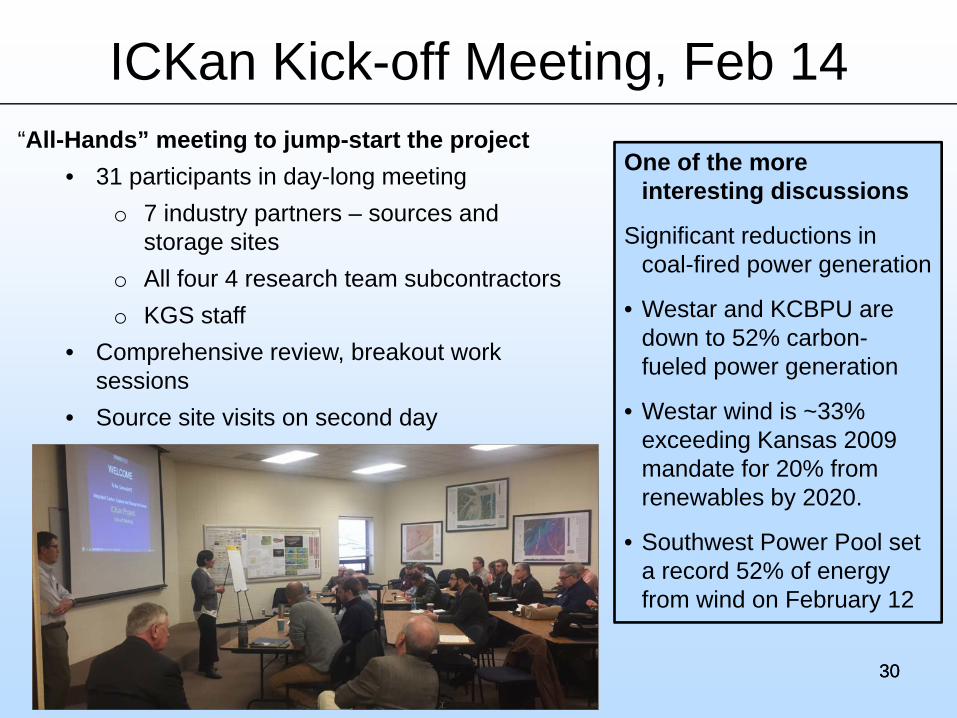
ICKan Kick-off Meeting, Feb 14
30
“All-Hands” meeting to jump-start the project• 31 participants in day-long meeting
o 7 industry partners – sources and storage sites
o All four 4 research team subcontractorso KGS staff
• Comprehensive review, breakout work sessions
• Source site visits on second day
One of the more interesting discussions
Significant reductions in coal-fired power generation
• Westar and KCBPU are down to 52% carbon-fueled power generation
• Westar wind is ~33% exceeding Kansas 2009 mandate for 20% from renewables by 2020.
• Southwest Power Pool set a record 52% of energy from wind on February 12

31
Tasks 2 and 3
31
Subtask Description CommentEstablish a Carbon Capture and Storage (CCS) Coordination Team2.1-3 Identify and recruit additional
team members and stakeholders
Expand team to cover gaps in CCS coordination team required for Phase II.
Additional team member disciplines and stakeholders were identified by Phase I CCS team in kick-off meeting
2.4 Meeting for Phase I team and recruited Phase II team members and stakeholders
Develop a plan to address challenges of a commercial-scale CCS ProjectIdentify challenges to CCS and develop a plan to address them
3.1 Capture from anthropogenic sources
Work with project's CO2 sources and oil industry partners to identify technical and legal, regulatory and policy issues and develop plans to address them (in concert with Tasks 4, 5, and 6)
Initial discussions with CO2 sources in kick-off meeting (2/14) and site tours (2/15).
3.2 Transportation and injection of CO2
3.3 CO2 storage in geologic complexes
Initial discussions with oil operators in kick-off meeting (2/14).
32
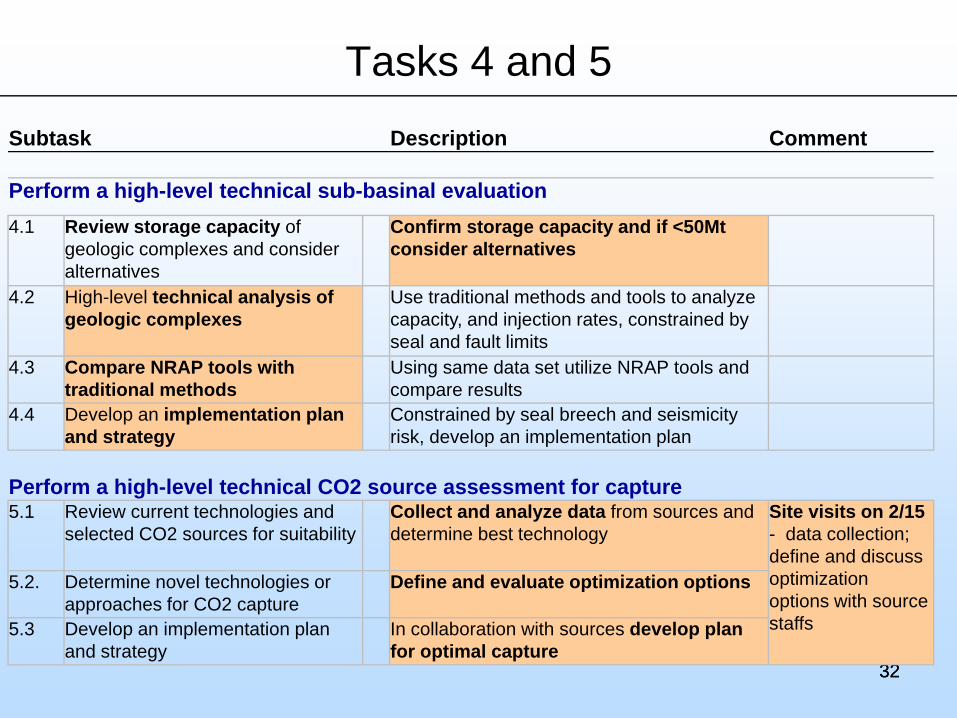
Tasks 4 and 5
32
Subtask Description Comment
Perform a high-level technical sub-basinal evaluation 4.1 Review storage capacity of
geologic complexes and consider alternatives
Confirm storage capacity and if <50Mt consider alternatives
4.2 High-level technical analysis of geologic complexes
Use traditional methods and tools to analyze capacity, and injection rates, constrained by seal and fault limits
4.3 Compare NRAP tools with traditional methods
Using same data set utilize NRAP tools and compare results
4.4 Develop an implementation plan and strategy
Constrained by seal breech and seismicity risk, develop an implementation plan
Perform a high-level technical CO2 source assessment for capture5.1 Review current technologies and
selected CO2 sources for suitabilityCollect and analyze data from sources and determine best technology
Site visits on 2/15- data collection; define and discuss optimization options with source staffs
5.2. Determine novel technologies or approaches for CO2 capture
Define and evaluate optimization options
5.3 Develop an implementation plan and strategy
In collaboration with sources develop plan for optimal capture
33
Tasks 6 and 7
33
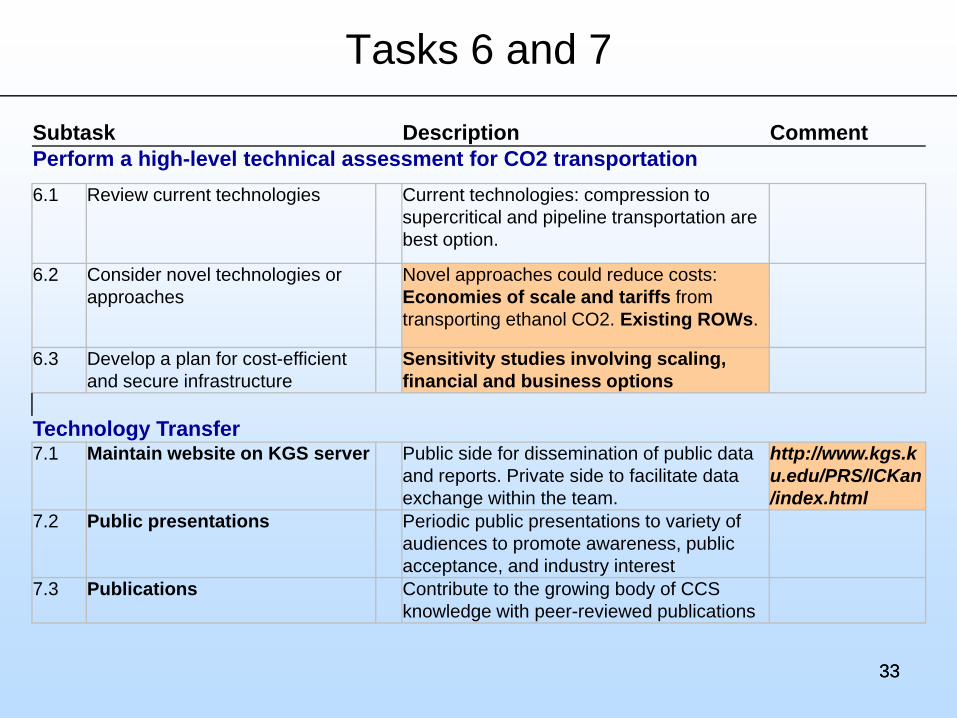
Subtask Description CommentPerform a high-level technical assessment for CO2 transportation6.1 Review current technologies Current technologies: compression to
supercritical and pipeline transportation are best option.
6.2 Consider novel technologies or approaches
Novel approaches could reduce costs: Economies of scale and tariffs from transporting ethanol CO2. Existing ROWs.
6.3 Develop a plan for cost-efficient and secure infrastructure
Sensitivity studies involving scaling, financial and business options
Technology Transfer7.1 Maintain website on KGS server Public side for dissemination of public data
and reports. Private side to facilitate data exchange within the team.
http://www.kgs.ku.edu/PRS/ICKan/index.html
7.2 Public presentations Periodic public presentations to variety of audiences to promote awareness, public acceptance, and industry interest
7.3 Publications Contribute to the growing body of CCS knowledge with peer-reviewed publications
34
Milestones, Timeline and Criteria
34
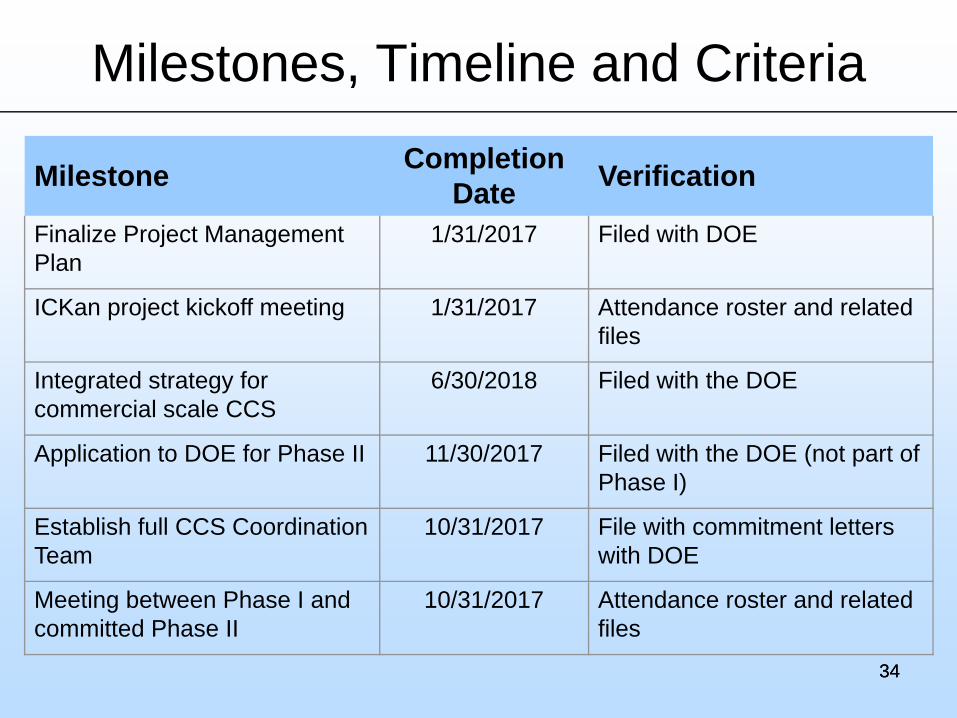
Milestone Completion Date Verification
Finalize Project Management Plan
1/31/2017 Filed with DOE
ICKan project kickoff meeting 1/31/2017 Attendance roster and related files
Integrated strategy for commercial scale CCS
6/30/2018 Filed with the DOE
Application to DOE for Phase II 11/30/2017 Filed with the DOE (not part of Phase I)
Establish full CCS Coordination Team
10/31/2017 File with commitment letters with DOE
Meeting between Phase I and committed Phase II
10/31/2017 Attendance roster and related files

35
Deliverables and Relevance
35
36
Risk Matrix
36
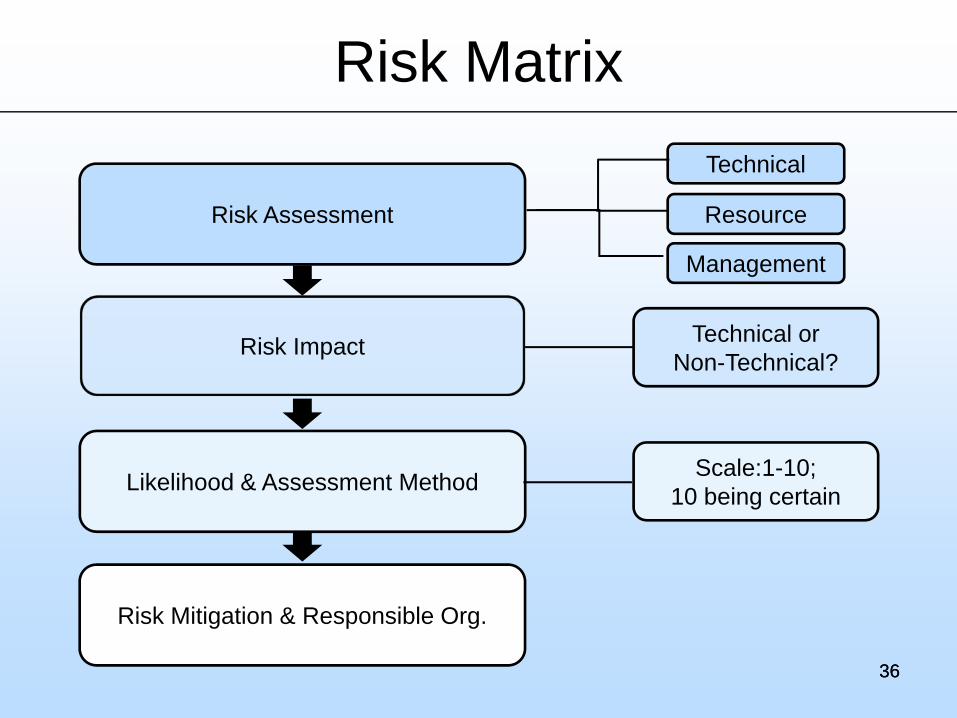
Technical
Resource
Management
Risk Impact
Likelihood & Assessment Method
Risk Mitigation & Responsible Org.
Risk Assessment
Scale:1-10;10 being certain
Technical orNon-Technical?
37
Risk Matrix
37
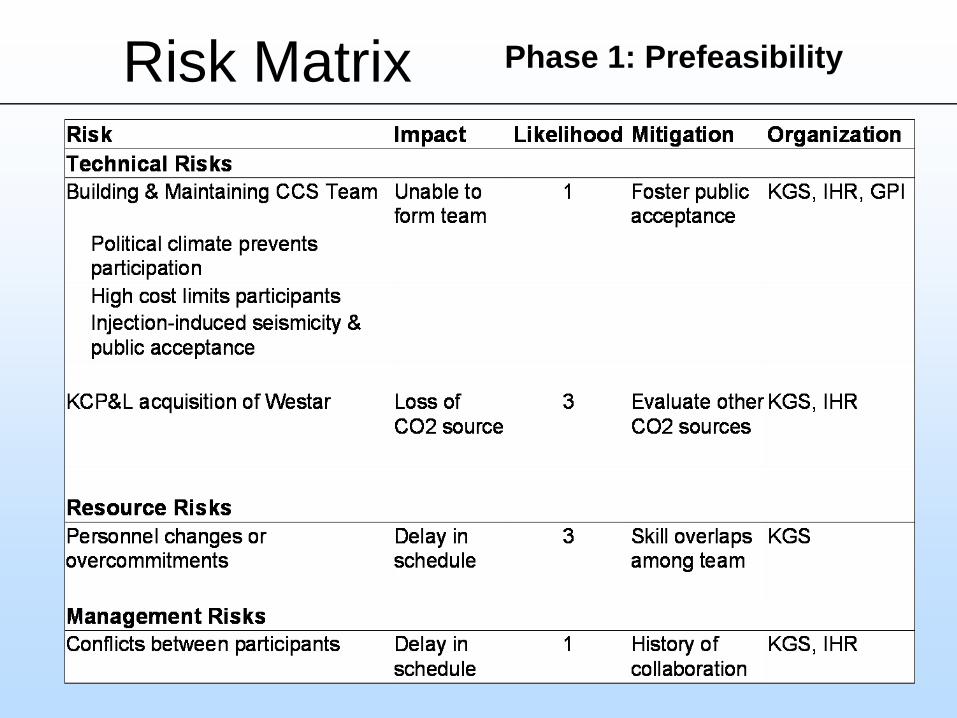
Phase 1: Prefeasibility

38
Risk Matrix
Non-technical risks:• Economic risks (i.e., high cost
or feasibility of project)
• Gaining public acceptance• Legal aspects of pore space
and long-term liability• Site access issues for field
work
• Obtaining permits (federal and state) and right-of-ways
• Schedule and cost overruns
Technical risks:• Long-term viability of coal-fired
CO2 sources• Adequacy of the site
characterization
• Class VI permit
• Drilling and installation of wellbore and other instrumentation
• CO2 leakage risks• Injection-induced earthquakes• Detecting & locating CO2 38
Phase II: Storage Complex Feasibility

39
Proposed Schedule
39
Task Task Name 1 2 3 4 5 6 7 8 9 10 11 12 1 2 3 4 5 6
Task 1.0 Project Management & Planning Integrated CCS for Kansas (ICKan)Subtask 1.1 Fulfill requirements for National Environmental Policy Act (NEPASubtask 1.2 Conduct a kick-off meeting to set expectations Subtask 1.3 Conduct regularly scheduled meetings and update trackingSubtask 1.4 Monitor and control project scopeSubtask 1.5 Monitor and control project scheduleSubtask 1.6 Monitor and control project riskSubtask 1.7 Maintain and revise the Data Management Plan including submital of data to NETL-EDXSubtask 1.8 Revisions to the Project Management Plan after submission
Task 2.0 Establish a Carbon Capture & Storage (CCS) Coordination TeamSubtask 2.1 Identify additional CCS team membersSubtask 2.2 Identify additional stakeholders that should be added to the CCS teamSubtask 2.3 Recruit & gain commitment of additional CCS team members identifiedSubtask 2.4 Conduct a formal meeting that includes Phase I team & committed Phase II team members
Task 3.0 Develop a plan to address challenges of a commercial-scale CCS ProjectSubtask 3.1 Identify challenges & develop a plan to address challenges for CO2 capture from anthropogenic sourcesSubtask 3.2 Identify challenges & develop a plan to address challenges for CO2 transportation & injectionSubtask 3.3 Identify challenges & develop a plan to address challenges for CO2 storage in geologic complexes
Task 4.0 Perform high level sub-basinal evaluations using NRAP & related DOE toolsSubtask 4.1 Review storage capacity of geologic complexes identified in this proposal & consider alternativesSubtask 4.2 Conduct high-level technical analysis of suitable geologic complexes using NRAP-IAM-CS & other tools for integrated
assessmentSubtask 4.3 Compare results using NRAP with methods used in prior DOE contracts including regional & subbasin CO2 storage
& Class VI permitSubtask 4.4 Develop an implementation plan & strategy for commercial-scale, safe & effective CO2 storage
Task 5.0 Perform a high level technical CO2 source assessment for captureSubtask 5.1 Review current technologies & CO2 sources of team members & nearby sources using NATCARB, Global CO2
Storage Portal, & KDMSubtask 5.2. Determine novel technologies or approaches for CO2 captureSubtask 5.3 Develop an implementation plan & strategy for cost effective & reliable carbon capture
Task 6.0 Perform a high level technical assessment for CO2 transportationSubtask 6.1 Review current technologies or CO2 transportationSubtask 6.2 Determine novel technologies or approaches for CO2 captureSubtask 6.3 Develop a plan for cost-efficient & secure transportation infrastructure
Task 7.0 Technology TransferSubtask 7.1 Maintain website on KGS server to facilitate effective & efficient interaction of the teamSubtask 7.2 Public presentations Subtask 7.3 Publications
2017 2018
40
Summary
40
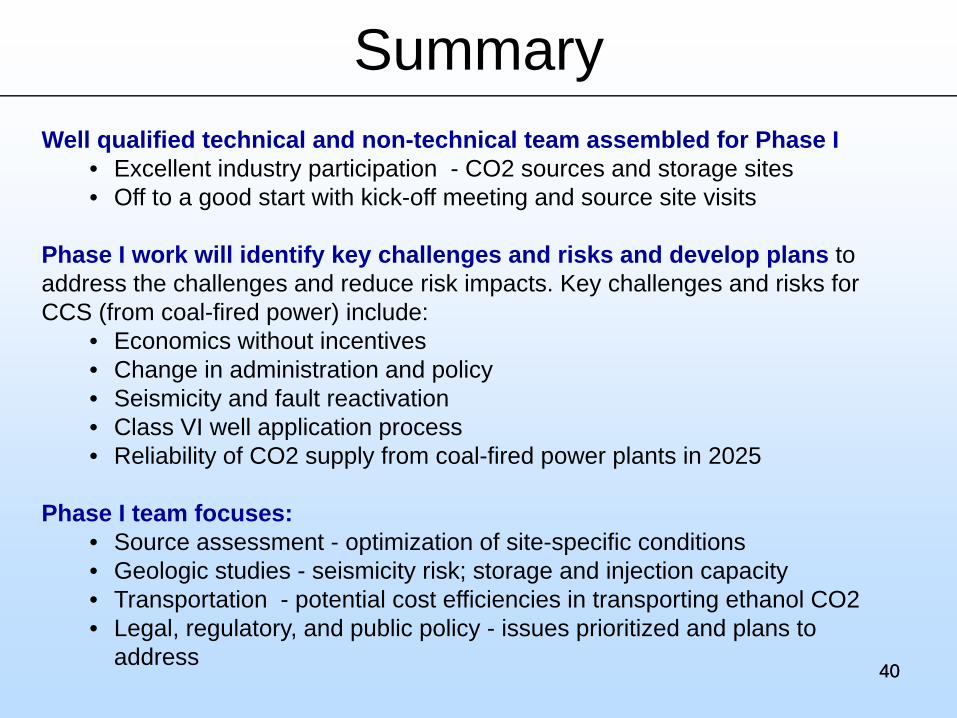
Well qualified technical and non-technical team assembled for Phase I• Excellent industry participation - CO2 sources and storage sites• Off to a good start with kick-off meeting and source site visits
Phase I work will identify key challenges and risks and develop plans to address the challenges and reduce risk impacts. Key challenges and risks for CCS (from coal-fired power) include:
• Economics without incentives• Change in administration and policy• Seismicity and fault reactivation • Class VI well application process• Reliability of CO2 supply from coal-fired power plants in 2025
Phase I team focuses:• Source assessment - optimization of site-specific conditions• Geologic studies - seismicity risk; storage and injection capacity• Transportation - potential cost efficiencies in transporting ethanol CO2 • Legal, regulatory, and public policy - issues prioritized and plans to
address

41
Appendix: Funding Tables
41

42
Funding: Project Costs By Task
42
43
Funding: Project Costs By Task
43
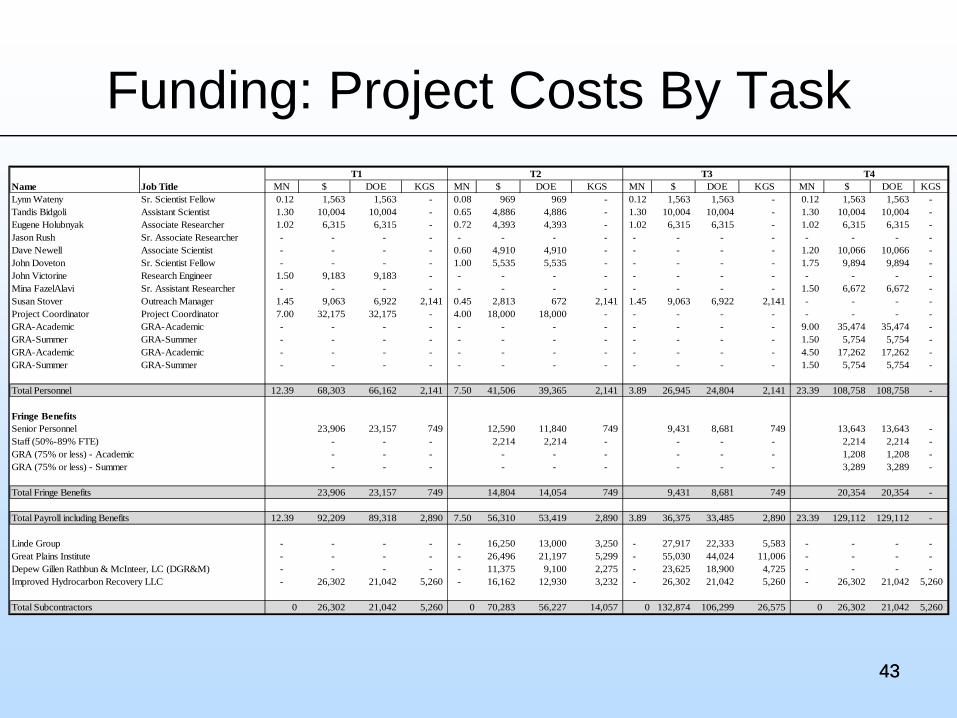
T1 T2 T3 T4Name Job Title MN $ DOE KGS MN $ DOE KGS MN $ DOE KGS MN $ DOE KGSLynn Wateny Sr. Scientist Fellow 0.12 1,563 1,563 - 0.08 969 969 - 0.12 1,563 1,563 - 0.12 1,563 1,563 - Tandis Bidgoli Assistant Scientist 1.30 10,004 10,004 - 0.65 4,886 4,886 - 1.30 10,004 10,004 - 1.30 10,004 10,004 - Eugene Holubnyak Associate Researcher 1.02 6,315 6,315 - 0.72 4,393 4,393 - 1.02 6,315 6,315 - 1.02 6,315 6,315 - Jason Rush Sr. Associate Researcher - - - - - - - - - - - - - - - - Dave Newell Associate Scientist - - - - 0.60 4,910 4,910 - - - - - 1.20 10,066 10,066 - John Doveton Sr. Scientist Fellow - - - - 1.00 5,535 5,535 - - - - - 1.75 9,894 9,894 - John Victorine Research Engineer 1.50 9,183 9,183 - - - - - - - - - - - - - Mina FazelAlavi Sr. Assistant Researcher - - - - - - - - - - - - 1.50 6,672 6,672 - Susan Stover Outreach Manager 1.45 9,063 6,922 2,141 0.45 2,813 672 2,141 1.45 9,063 6,922 2,141 - - - - Project Coordinator Project Coordinator 7.00 32,175 32,175 - 4.00 18,000 18,000 - - - - - - - - - GRA-Academic GRA-Academic - - - - - - - - - - - - 9.00 35,474 35,474 - GRA-Summer GRA-Summer - - - - - - - - - - - - 1.50 5,754 5,754 - GRA-Academic GRA-Academic - - - - - - - - - - - - 4.50 17,262 17,262 - GRA-Summer GRA-Summer - - - - - - - - - - - - 1.50 5,754 5,754 -
Total Personnel 12.39 68,303 66,162 2,141 7.50 41,506 39,365 2,141 3.89 26,945 24,804 2,141 23.39 108,758 108,758 -
Fringe BenefitsSenior Personnel 23,906 23,157 749 12,590 11,840 749 9,431 8,681 749 13,643 13,643 - Staff (50%-89% FTE) - - - 2,214 2,214 - - - - 2,214 2,214 - GRA (75% or less) - Academic - - - - - - - - - 1,208 1,208 - GRA (75% or less) - Summer - - - - - - - - - 3,289 3,289 -
Total Fringe Benefits 23,906 23,157 749 14,804 14,054 749 9,431 8,681 749 20,354 20,354 -
Total Payroll including Benefits 12.39 92,209 89,318 2,890 7.50 56,310 53,419 2,890 3.89 36,375 33,485 2,890 23.39 129,112 129,112 -
Linde Group - - - - - 16,250 13,000 3,250 - 27,917 22,333 5,583 - - - - Great Plains Institute - - - - - 26,496 21,197 5,299 - 55,030 44,024 11,006 - - - - Depew Gillen Rathbun & McInteer, LC (DGR&M) - - - - - 11,375 9,100 2,275 - 23,625 18,900 4,725 - - - - Improved Hydrocarbon Recovery LLC - 26,302 21,042 5,260 - 16,162 12,930 3,232 - 26,302 21,042 5,260 - 26,302 21,042 5,260
Total Subcontractors 0 26,302 21,042 5,260 0 70,283 56,227 14,057 0 132,874 106,299 26,575 0 26,302 21,042 5,260

44
Funding: Project Costs By Task
44
T5 T6 T7 TotalName Job Title MN $ DOE KGS MN $ DOE KGS MN $ DOE KGS MN $ DOE KGSLynn Wateny Sr. Scientist Fellow 0.12 1,563 1,563 - 0.12 1,563 1,563 - 0.12 1,563 1,563 - 0.79 10,349 10,349 - Tandis Bidgoli Assistant Scientist 1.30 10,004 10,004 - 1.30 10,004 10,004 - 1.30 10,004 10,004 - 8.46 64,913 64,913 - Eugene Holubnyak Associate Researcher - - - - - - - - 1.02 6,315 6,315 - 4.80 29,651 29,651 - Jason Rush Sr. Associate Researcher - - - - - - - - - - - - - - - - Dave Newell Associate Scientist - - - - - - - - 1.20 10,066 10,066 - 3.00 25,043 25,043 - John Doveton Sr. Scientist Fellow - - - - - - - - 1.75 9,894 9,894 - 4.50 25,323 25,323 - John Victorine Research Engineer - - - - - - - - 1.50 9,183 9,183 - 3.00 18,366 18,366 - Mina FazelAlavi Sr. Assistant Researcher - - - - - - - - 1.50 6,672 6,672 - 3.00 13,345 13,345 - Susan Stover Outreach Manager - - - - - - - - 1.45 9,063 6,922 2,141 4.80 30,000 21,436 8,564 Project Coordinator Project Coordinator - - - - - - - - 7.00 32,175 32,175 - 18.00 82,350 82,350 - GRA-Academic GRA-Academic - - - - - - - - - - - - 9.00 35,474 35,474 - GRA-Summer GRA-Summer - - - - - - - - - - - - 1.50 5,754 5,754 - GRA-Academic GRA-Academic - - - - - - - - - - - - 4.50 17,262 17,262 - GRA-Summer GRA-Summer - - - - - - - - - - - - 1.50 5,754 5,754 -
Total Personnel 1.42 11,568 11,568 - 1.42 11,568 11,568 - 16.84 94,935 92,794 2,141 66.85 363,583 355,019 8,564
Fringe BenefitsSenior Personnel 4,049 4,049 - 4,049 4,049 - 31,290 30,541 749 98,957 95,960 2,997 Staff (50%-89% FTE) - - - - - - 2,214 2,214 - 6,642 6,642 - GRA (75% or less) - Academic - - - - - - - - - 1,208 1,208 - GRA (75% or less) - Summer - - - - - - - - - 3,289 3,289 -
Total Fringe Benefits 4,049 4,049 - 4,049 4,049 - 33,504 32,755 749 110,096 107,099 2,997
Total Payroll including Benefits 1.42 15,616 15,616 - 1.42 15,616 15,616 - 16.84 128,439 125,549 2,890 66.85 473,678 462,117 11,561
Linde Group - 27,917 22,333 5,583 - 27,917 22,333 5,583 - - - - - 100,000 80,000 20,000 Great Plains Institute - - - - - - - - - - - - - 81,526 65,221 16,305 Depew Gillen Rathbun & McInteer, LC (DGR&M) - - - - - - - - - - - - - 35,000 28,000 7,000 Improved Hydrocarbon Recovery LLC - 26,302 21,042 5,260 - 26,302 21,042 5,260 - 26,302 21,042 5,260 - 173,975 139,180 34,795
Total Subcontractors 0 54,219 43,375 10,844 0 54,219 43,375 10,844 0 26,302 21,042 5,260 0 390,501 312,401 78,100
45
Funding: By Recipient Organization
45
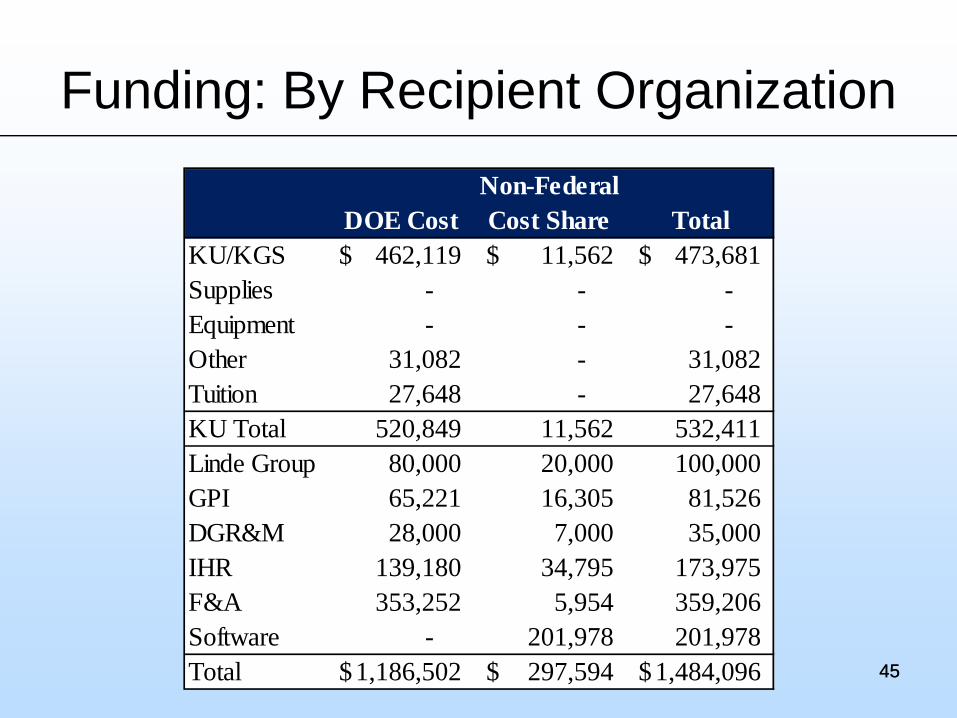
DOE CostNon-Federal Cost Share Total
KU/KGS 462,119$ 11,562$ 473,681$ Supplies - - - Equipment - - - Other 31,082 - 31,082 Tuition 27,648 - 27,648 KU Total 520,849 11,562 532,411 Linde Group 80,000 20,000 100,000 GPI 65,221 16,305 81,526 DGR&M 28,000 7,000 35,000 IHR 139,180 34,795 173,975 F&A 353,252 5,954 359,206 Software - 201,978 201,978 Total 1,186,502$ 297,594$ 1,484,096$
46
Funding: By Source & Quarter
46
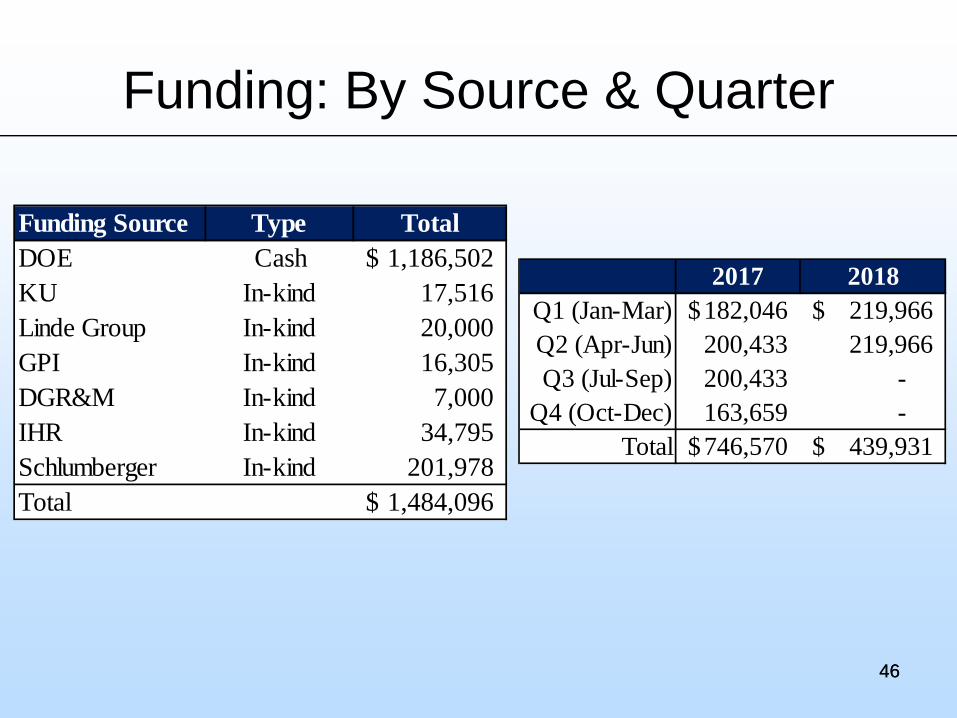
2017 2018Q1 (Jan-Mar) 182,046$ 219,966$ Q2 (Apr-Jun) 200,433 219,966 Q3 (Jul-Sep) 200,433 -
Q4 (Oct-Dec) 163,659 - Total 746,570$ 439,931$
Funding Source Type TotalDOE Cash 1,186,502$ KU In-kind 17,516 Linde Group In-kind 20,000 GPI In-kind 16,305 DGR&M In-kind 7,000 IHR In-kind 34,795 Schlumberger In-kind 201,978 Total 1,484,096$

47
Appendix: Bibliography
47