integrated catchment management in fiji · 2007-04-27 · integrated catchment management in fiji...
TRANSCRIPT

INTEGRATED CATCHMENT MANAGEMENT IN FIJI
PREPARED BY MR I. RATUKALOU AND MR. F.FINIASI OF PREPARED BY MR I. RATUKALOU AND MR. F.FINIASI OF MINISTRY OF AGRICULTURE AND MINISTRY OF WORKS, MINISTRY OF AGRICULTURE AND MINISTRY OF WORKS,
REPUBLIC OF FIJI FOR THE HELP ICM WORKSHOP, HELD REPUBLIC OF FIJI FOR THE HELP ICM WORKSHOP, HELD FROM 7FROM 7THTH –– 1212THTH OF NOVEMBER,2005, NELSON,NZ. OF NOVEMBER,2005, NELSON,NZ.

Presentation Outline
IntroductionIntroductionCountry BackgroundCountry BackgroundPilot Study of Pilot Study of RewaRewa River River CatchmentCatchmentLand Use Issues and ImpactsLand Use Issues and ImpactsCurrent and Future StrategiesCurrent and Future StrategiesConclusion.Conclusion.

Republic of the Fiji Islands

IntroductionIntegrated Integrated CatchmentCatchment Management is a holistic approach to managing natural Management is a holistic approach to managing natural resources within the river resources within the river catchmentcatchment. This involves all stakeholders that use and . This involves all stakeholders that use and manage land ,water and other natural resources.manage land ,water and other natural resources.
The loss of biodiversity and degradation of land and water resouThe loss of biodiversity and degradation of land and water resources through rces through deforestation and unsustainable use have created an immense impdeforestation and unsustainable use have created an immense impact on all of act on all of FijiFiji’’s river catchments and the surrounding reef s river catchments and the surrounding reef ecosytemecosytem..
Land degradation and depletion of plant nutrients due to soil erLand degradation and depletion of plant nutrients due to soil erosion is osion is becoming a serious and expensive problembecoming a serious and expensive problem
Soil erosion affects the fertile top soil Soil erosion affects the fertile top soil -- loss of the top soil reduces the supply loss of the top soil reduces the supply of nutrients in the soil and rooting volume of the crops. of nutrients in the soil and rooting volume of the crops.
There are two types of soil erosion There are two types of soil erosion -- Natural erosionNatural erosion-- Human induced ( accelerated) erosion.Human induced ( accelerated) erosion.
Both leads to reduction of crop yield and other downstream impaBoth leads to reduction of crop yield and other downstream impacts such as cts such as sedimentation of rivers, destruction of fish spawning areas etcsedimentation of rivers, destruction of fish spawning areas etc……..

Country BackgroundThe Land The Land
-- Consists of 340 islands.Consists of 340 islands.--Total land area Total land area -- 1,837,789 hectares(18,378 sq km).1,837,789 hectares(18,378 sq km).-- VitiViti LevuLevu -- 10,388 sq km.10,388 sq km.-- VanuaVanua LevuLevu –– 5535 sq km.5535 sq km.The GeologyThe Geology
-- Geologically young countryGeologically young country-- Volcanic material and sedimentary rocksVolcanic material and sedimentary rocks-- Raised limestone reef and alluvial terracesRaised limestone reef and alluvial terracesThe Soil The Soil ErodibilityErodibility
-- Natural erosion rate is high because of youthful Natural erosion rate is high because of youthful landscapelandscape
-- Erosion Index is high Erosion Index is high --700 for dry zone and 800 for wet 700 for dry zone and 800 for wet zonezone

Fiji Land Capability Classification
Land ClassLand Class ArableArable UsesUsesII Best arable landBest arable land Very wide rangeVery wide range
IIII Good arable landGood arable land Wide rangeWide range
IIIIII Fair arable landFair arable land Narrow rangeNarrow range
IVIV NonNon-- ArableArableMarginal arable landMarginal arable land
Very narrow range( tree Very narrow range( tree crops)crops)
vv Good grazing landGood grazing land Pasture, subsistence Pasture, subsistence cultivation, Forestrycultivation, Forestry
VIVI Fair grazing land and Fair grazing land and Forestry landForestry land
Pasture/ ForestryPasture/ Forestry
VII + VIIIVII + VIII Marginal Forestry Marginal Forestry ––Unsuitable LandUnsuitable Land
Protection Forestry or Protection Forestry or left natural stateleft natural state

Land Capability Classification

Land Capability ClassificationSLOPE SLOPE GROUPGROUP
LUC LUC CLASSCLASS
VITI LEVUVITI LEVU VANUA VANUA LEVULEVU
Flat ( 0Flat ( 0--33ºº)) II 16%16% 15%15%
Undulating Undulating to Rolling to Rolling ( 4( 4--1515ºº))
II II –– IVIV 17%17% 13%13%
SteeplandSteepland( 16( 16°°+)+)
V V --VIIIVIII 67%67% 72%72%

Climate
Fiji lies 1800 Fiji lies 1800 --2500 km South of the 2500 km South of the equator.equator.South East Trade windsSouth East Trade windsMean monthly temperatures of 23Mean monthly temperatures of 23ººc in July c in July and 27and 27ººC in JanuaryC in JanuaryMean annual rainfallMean annual rainfall--
--windward sidewindward side-- 28002800--3600mm ( wet zone)3600mm ( wet zone)--leeward side leeward side –– 13001300-- 1600mm (dry zone)1600mm (dry zone)

Soils of Fiji and Its ErodibilityLocal T & WLocal T & WClassificationClassification
USDA ClassificationUSDA ClassificationOrderOrder
USDA ClassificationUSDA ClassificationSubSub--orderorder
Soil Soil ErodibilityErodibility
Recent Soils from Recent Soils from Coastal SandCoastal Sand
EntisolsEntisols and and InceptisolsInceptisols
PsammentPsamment and and TropeptTropept
Moderate Moderate
Recent Soils from Recent Soils from AlluviumAlluvium
EntisolEntisol , , InceptisolsInceptisolsand and MollisolsMollisols
AquentAquent, , TropeptTropept and and UdollUdoll
Low Low
NigresentNigresent SoilsSoils InceptisolsInceptisols MollisolsMollisolsand and VertisolsVertisols
TropeptsTropepts, , UstollUstoll and and UsertsUserts
High to SevereHigh to Severe
LatosolicLatosolic SoilsSoils AndisolsAndisols and and InceptisolsInceptisols
UdandUdand and and TropeptTropept
Moderate Moderate
HumicHumic LatosolsLatosols SoilsSoils Inceptisols,AlfisolsInceptisols,Alfisolsand and UltisolsUltisols
Tropepts,UdalfTropepts,Udalf and and HumultHumult
HighHigh
FerruginuousFerruginuousLatosolsLatosols
OxisolsOxisols, , UltisolsUltisols and and InceptisolsInceptisols
UstoxUstox, , UstultsUstults and and TropeptsTropepts
SevereSevere
Red Yellow Red Yellow PodsolicPodsolicSoilsSoils
UltisolsUltisols and and InceptisolsInceptisols
HumultHumult, , UstultUstult and and TropeptsTropepts
High High
GleyGley SoilsSoils InceptisolsInceptisols AqueptsAquepts and and TropeptsTropepts
ModerateModerate
Organic SoilsOrganic Soils HistosolsHistosols FibristFibrist SevereSevere
Saline soils of the Saline soils of the Marine MarshMarine Marsh
EntisolsEntisols and and InceptisolsInceptisols
AquentsAquents and and AquapeptsAquapepts
HighHigh

Population and Land UsePopulation at December,1996 was 772,655.Population at December,1996 was 772,655.Fijian comprising Fijian comprising –– 51.1%51.1%IndoIndo--Fijian Fijian –– 43.6%43.6%RotumansRotumans, Chinese, etc. make up the rest, Chinese, etc. make up the rest40% live in rural areas, migration to urban areas is significan40% live in rural areas, migration to urban areas is significant.t.40 years between 1956 and 1996 40 years between 1956 and 1996 -- total population increased from total population increased from 345,000 345,000 –– 772,655.772,655.Land used for agriculture increased Land used for agriculture increased -- 178,259 178,259 -- 393,272 hectares. 393,272 hectares. Number of farms also increased Number of farms also increased -- 242, 500 in 1968 to 591,407 in 1991. 242, 500 in 1968 to 591,407 in 1991. Average size of farms decreased from 7.2 Average size of farms decreased from 7.2 ha.inha.in 1968 to 6.2 ha. In 1968 to 6.2 ha. In 1991. 1991.

AgricultureThe Sector contributes 15.12 % to GDP and $400 million The Sector contributes 15.12 % to GDP and $400 million in foreign exchange annually from 2002.in foreign exchange annually from 2002.60% of total land area suited to some form of agriculture60% of total land area suited to some form of agriculture16% is suitable for sustainable arable farming.16% is suitable for sustainable arable farming.Actual land use reported in 1991 Actual land use reported in 1991 AgrAgr Census:Census:
-- 39% or 230,881 ha as being cropped land39% or 230,881 ha as being cropped land-- 29% or 173,406 ha as being pastures and grazing land29% or 173,406 ha as being pastures and grazing land-- 32% or 187,120 ha as being natural, planted forest and 32% or 187,120 ha as being natural, planted forest and
nonnon-- agriculture areas.agriculture areas.-- More arable land being converted to housing and industriesMore arable land being converted to housing and industries-- Agriculture has shifted towards the marginal to steep land Agriculture has shifted towards the marginal to steep land
as evident in the sugar cane growing area.as evident in the sugar cane growing area.

Division and Province
Agriculture
Planted Forest
Natural Forest
Non-agriculture
Total Land Area
Central 76,719 3.492 130,532 17,376 228,150
Naitasiri 30,502 1,117 47,730 5,766 85,115
Namosi 3,510 1,107 22,351 1,532 28,500
Rewa 5,588 471 10,653 2,511 19,223
Serua 7,567 38 17,604 4,112 29,321
Tailevu 29,552 759 32,225 3,455 65,991
Western 269,743 41,773 120,332 131,566 563,414
Ba 121,679 30,448 52,630 62,251 267,026
Nadroga/Navosa 101,817 9,349 25,702 49,815 186,683
Ra 46,229 1,976 42,000 19,500 109,705
Northern 190,039 15,207 165,284 28,207 398,737
Bua 34,170 12,707 52,789 9,818 109,484
Cakaudrove 69,467 1,379 74,862 6,597 152,305
Macuata 86402 1121 37633 11792 136948
Eastern 54,906 4,152 37,451 19,818 116,327
Kadavu 6,125 1,627 13,036 13,503 34,291
Lau 29,492 1,710 8,671 2,095 41,968
Lomaiviti 15,209 815 15,124 4,200 35,348
Rotuma 4,080 - 620 20 4,720
TOTAL 591,407 64,624 453,603 196,967 1,306,601
Area of land-use type by division and province
Source: National Agriculture Census, MAFF (1991)

ForestryForest Sector contributes 2.5% GDP and $50million in Forest Sector contributes 2.5% GDP and $50million in foreign exchange annuallyforeign exchange annuallySector expected to earn $100million when mahogany will Sector expected to earn $100million when mahogany will start to be logged processed.start to be logged processed.It employs more than 1,000 workersIt employs more than 1,000 workersDeforestation is moderate.Deforestation is moderate.
-- Since 1967 Since 1967 -- 90,000 to 14,000 ha. of native forest 90,000 to 14,000 ha. of native forest converted to non forest land use such as;converted to non forest land use such as;
-- Large scale commercial agriculture etcLarge scale commercial agriculture etc……-- But its But its afforestationafforestation program has been very successfulprogram has been very successful-- 43,000 ha. of pine plantation43,000 ha. of pine plantation-- 42,000 ha. of mahogany plantation through re42,000 ha. of mahogany plantation through re--afforestationafforestation
programprogram-- 47% of Fiji is forest covered.47% of Fiji is forest covered.

Production Forestry Hectares %
a) Indigenous Forest 187,700 10. 25
State Land 5,240
Reserve Land 940
State Lease 840
Native Land 167,340
Freehold Land 13,340
b) Forest Plantations 112,490 6. 14
State Land 5,180
Reserve 6,080
Hardwood Corporation Plantation 49,850
Fiji Pine Ltd. Plantation 43,680
Private 7,700
c)Protection Forestry 260,330 14. 22
Protection Forest 242,310
Mangrove 18,020
Indigenous Logged Forest 309,940 16. 93
Total Forest Area 870,460 47. 56
Total Land Area 1,830,000 100
Fiji Forest Resources

VITI LEVU CATCHMENT

Rewa River Catchment Pilot Study
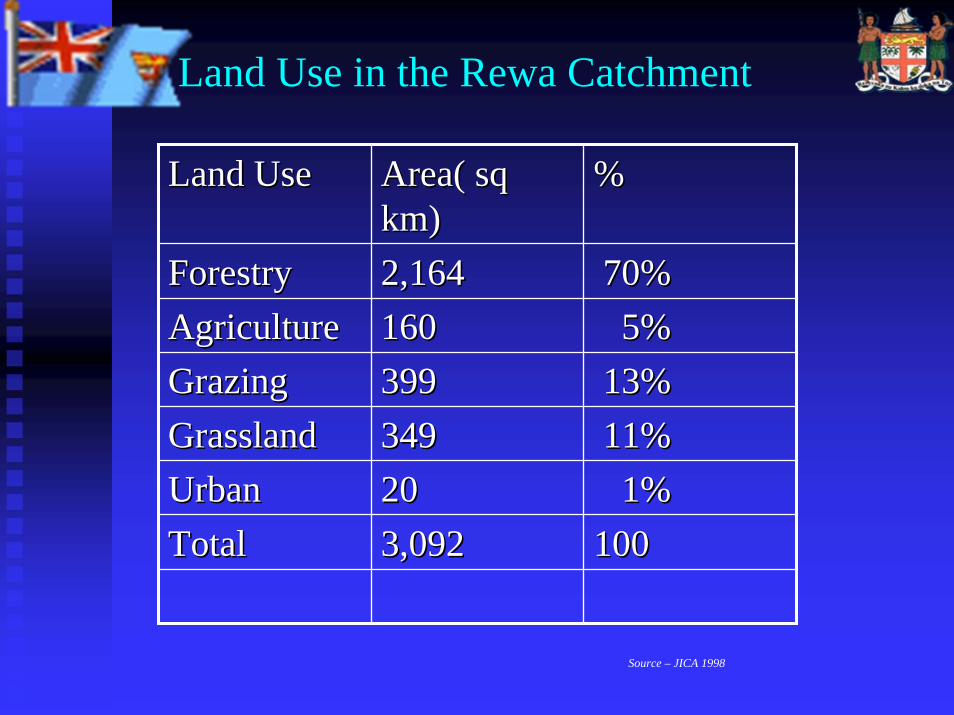
Land Use in the Rewa Catchment
Land UseLand Use Area( sq Area( sq km)km)
%%
ForestryForestry 2,1642,164 70%70%AgricultureAgriculture 160160 5%5%GrazingGrazing 399399 13%13%GrasslandGrassland 349349 11%11%UrbanUrban 2020 1%1%TotalTotal 3,0923,092 100100
Source – JICA 1998

Hydro &Water Supply
In the upper In the upper catchmentcatchment an earth fill hydroan earth fill hydro-- electricity dam located at electricity dam located at MonasavuMonasavu on the on the WainimalaWainimala at an elevation of 745m AMSL, receives an at an elevation of 745m AMSL, receives an average annual rainfall of about 5000 mm. average annual rainfall of about 5000 mm.
Within the Within the catchmentcatchment there are two major water supply intakes, both located there are two major water supply intakes, both located on the southern most tributary (on the southern most tributary (WaimanuWaimanu) of the ) of the RewaRewa river. river.
Water treatment facilities are located away from the flood plainWater treatment facilities are located away from the flood plains on high s on high ground and access is by road across the flood plain. ground and access is by road across the flood plain.
Water is drawn by pumps for the Suva Water is drawn by pumps for the Suva -- NausoriNausori reticulated water supply reticulated water supply system.system.
It serves more than 300 000 people with water that is filtered It serves more than 300 000 people with water that is filtered and disinfected. and disinfected.
The The WaimanuWaimanu pump draws an averagepump draws an averageof 36 000 m3 /day while the other pumping station located of 36 000 m3 /day while the other pumping station located at at WailaWaila draws about 90 000 m3 /day. draws about 90 000 m3 /day.

Demographic Demographic changeschanges1956 1956 --1996, the total population 1996, the total population increased from 345,000 increased from 345,000 --772,655 772,655 Land used for agriculture Land used for agriculture
increased from 178,259 ha increased from 178,259 ha --393, 272 ha. 393, 272 ha.
Land Use Issues and Impacts

Pressure on the production base75% of land resources is marginal to steep land.75% of land resources is marginal to steep land.
Soil loss measurement in Soil loss measurement in WaibauWaibau SLRS, 50 tons/ha/year of SLRS, 50 tons/ha/year of soil loss compared to 13.5 tons/ha/yr.soil loss compared to 13.5 tons/ha/yr.

Natural Erosion
Recent Flood – River Bank Erosion
Landslide Feeding Debris into the River A Typical Landslide
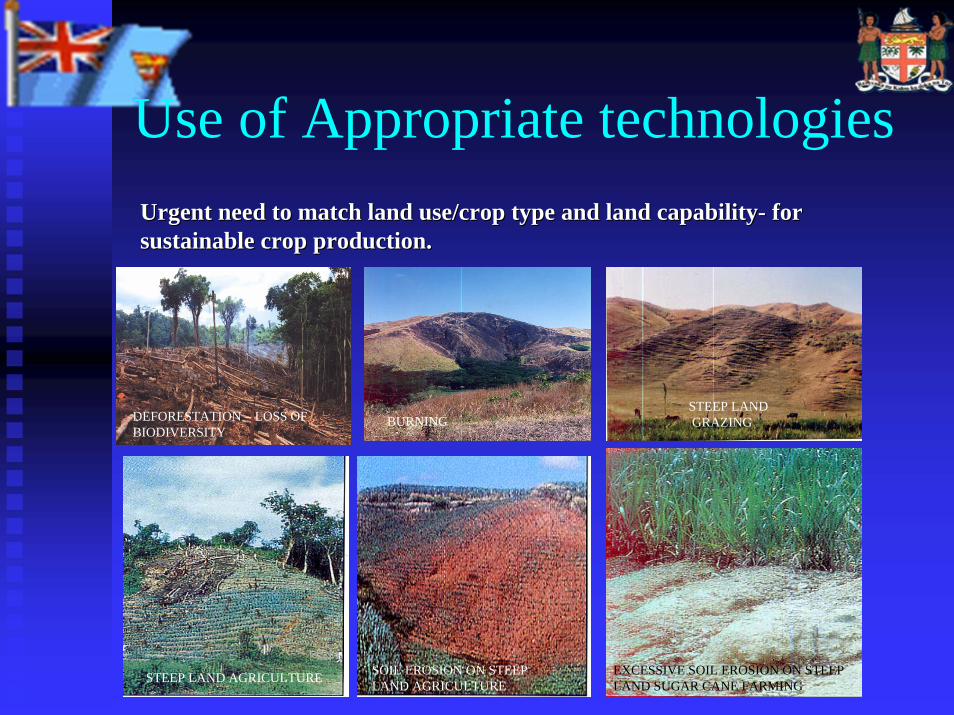
Use of Appropriate technologies
DEFORESTATION – LOSS OFBIODIVERSITY
BURNINGSTEEP LANDGRAZING
EXCESSIVE SOIL EROSION ON STEEP LAND SUGAR CANE FARMINGSTEEP LAND AGRICULTURE SOIL EROSION ON STEEP
LAND AGRICULTURE
Urgent need to matchUrgent need to match land use/crop type and land capabilityland use/crop type and land capability-- for for sustainable crop production.sustainable crop production.

Use of Appropriate Logging Techniques
Unplanned Logging Road Alignment Uncontrolled Logging – Clear Felling

On- Site Effect of Land Degradation
Soil erosionSoil erosionLoss of plant nutrientsLoss of plant nutrients-- Soil fertility lossSoil fertility lossReduction in soil depthReduction in soil depthDecrease in soil water holding capacityDecrease in soil water holding capacityLoss of BiodiversityLoss of BiodiversityIncrease in weeds, pest and disease Increase in weeds, pest and disease infestation.infestation.
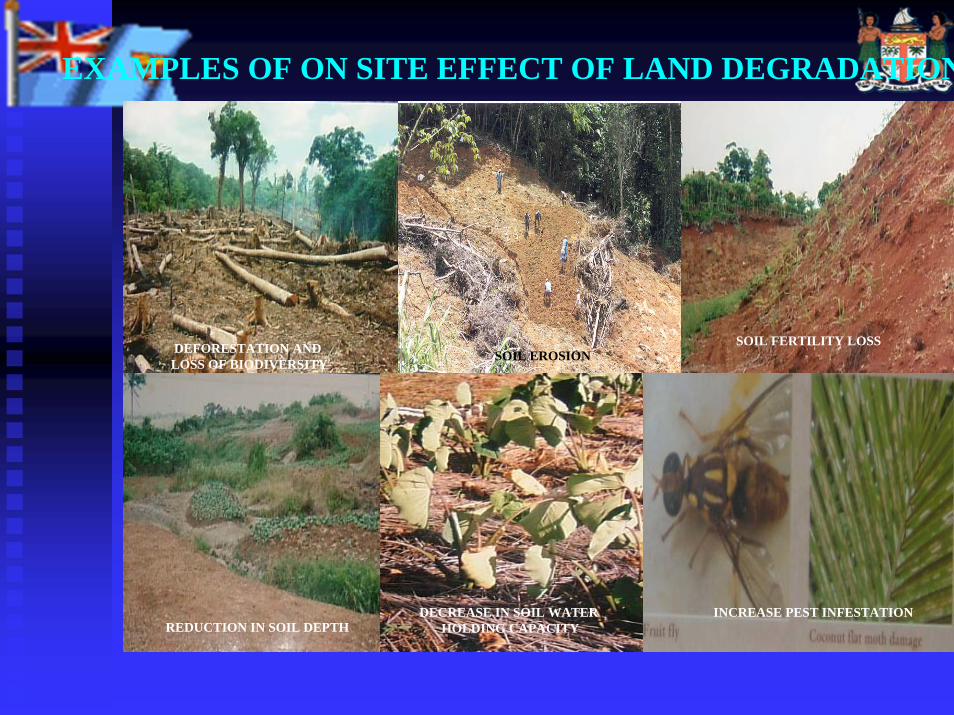
SOIL EROSIONSOIL FERTILITY LOSSDEFORESTATION AND
LOSS OF BIODIVERSITY
REDUCTION IN SOIL DEPTHDECREASE IN SOIL WATER
HOLDING CAPACITYINCREASE PEST INFESTATION
EXAMPLES OF ON SITE EFFECT OF LAND DEGRADATION

Lack of physical infrastructure
UnderUnder--resourcingresourcing by Government for rural development.by Government for rural development.

Water resourcesLack of knowledge about water mgmt.Lack of knowledge about water mgmt.Fiji have recently approved in principle an Fiji have recently approved in principle an integrated water resources policy.integrated water resources policy.

Inappropriate land use in the watersheds
Land degradation causes onLand degradation causes on-- site and offsite and off--site effects.site effects.
Total dredging cost for 5 yearsTotal dredging cost for 5 years-- $4 ( $US2) million dollars.$4 ( $US2) million dollars.

Off-Site Effect of Land Degradation
Increased sedimentation in river systemsIncreased sedimentation in river systemsFormation of mud banksFormation of mud banksReduce navigability of the riversReduce navigability of the riversFlash floods during heavy rainFlash floods during heavy rainReduce water qualityReduce water qualityDestruction of fish spawning areasDestruction of fish spawning areasLoss of reef biodiversityLoss of reef biodiversity

SEDIMENTATION & FORMATION OF MUD BANKS
REDUCE NAVIGABILITY OF THE RIVER DREDGING - COST MILLIONS OF DOLLARS
FLASH FLOODING REDUCTION OF WATER QUALITY DESTRUCTION OF FISH SPAWNING AREA
EXAMPLE OF OFF- SITE EFFECT OF LD

Soil loss in Rewa Catchment
Watershed Soil loss Tons/ha/year
Total soil loss Million tons/year
Rewa 32.2 9.3 Ba 69.0 6.4 Sigatoka 76.9 1.1 Nadi 81.4 4.2 Sources: JICA,1998

Cost of Dredging in the Rewa River
Year Cost ( F$1000)1992 1,0851993 1,0911994 7561995 1,0331996 915Total 4,880
Source: JICA,1998.

Flood Damage by Cyclone Kina
AssetAsset RewaRewa WatershedWatershed
General AssetGeneral Asset $28,536,000.00$28,536,000.00
Agricultural CropsAgricultural Crops $26,167,000.00$26,167,000.00
Business ActivitiesBusiness Activities $ 413,000.00$ 413,000.00
Public FacilitiesPublic Facilities $11,414,000.00$11,414,000.00
TotalTotal $66,530,000.00$66,530,000.00Sources: JICA 1998Cyclone Kina,January,1993

Inappropriate land use in coastal margin
Large scale reclamation of mangrove swamp proven to be Large scale reclamation of mangrove swamp proven to be uneconomical.uneconomical.

Coastal Erosion
UNPLANNED COASTAL VILLAGES CONSTRUCTION OF ROADS ON COASTAL AREAS
AGRICULTURE WITHOUT BUFFER ZONES ON THE COAST THE EFFECT OF SEA LEVEL RISE

InformationPoor public understanding on various Poor public understanding on various legislation on land resources management.legislation on land resources management.Lack of reliable information on land Lack of reliable information on land resources resources –– for sound land use decision for sound land use decision makingmaking

Land TenureBetween 1997 to 2028 a total of 13,140 leases Between 1997 to 2028 a total of 13,140 leases issued under ALTA will expire. issued under ALTA will expire. Most of the land in the Most of the land in the catchmentcatchment is communally is communally owned by indigenous land owning unitsowned by indigenous land owning unitsALTA and NLTA issues needs to be resolved ALTA and NLTA issues needs to be resolved –– to to enhance investors confidence in Fijienhance investors confidence in Fiji’’s economy.s economy.

Poverty
25 percent of Fiji25 percent of Fiji’’s s population are living population are living below poverty line ( below poverty line ( World Bank Report, World Bank Report, 1998)1998)

Poor Local Control, Responsibility and Incentive because of Central Government Control
CentralisationCentralisation of planning .of planning .Lack of ability by Government and NLTB to Lack of ability by Government and NLTB to manage natural resources.manage natural resources.

Legislation and Policies that Regulates ICM

Legislation and Policies that Governs Land and Water Resources
UseEnvironment Management Act Environment Management Act –– 20052005Land Conservation Improvement Act Land Conservation Improvement Act –– 19531953Native Land Trust ActNative Land Trust Act-- 19431943Crown Land Act Crown Land Act ––Forestry ActForestry ActStreams and Rivers ActStreams and Rivers ActAgriculture Landlord and Tenants ActAgriculture Landlord and Tenants ActLand Development ActLand Development ActNational Rural Land Use PolicyNational Rural Land Use PolicyWater PolicyWater PolicyUrban PolicyUrban Policy

Current and Future Strategies for Integrated Catchment Management.
NSDP NSDP –– Environment, Land Resources Sector etcEnvironment, Land Resources Sector etc……. . Participatory Land Use Plan of 187 Districts.Participatory Land Use Plan of 187 Districts.Geographical Information SystemsGeographical Information SystemsRemote Sensing Data Remote Sensing Data --Land & Water Resources AnalysisLand & Water Resources AnalysisOn farm soil loss research and extension programs.On farm soil loss research and extension programs.Awareness and training programs.Awareness and training programs.Capacity Building( forest, water, soil and land )Capacity Building( forest, water, soil and land )Formation of Landcare GroupsFormation of Landcare GroupsTransfer of low cost Sustainable Land Management Transfer of low cost Sustainable Land Management Technologies ( SLMT).Technologies ( SLMT).Sustainable Forestry Management.Sustainable Forestry Management.Synergies Synergies –– UNFCC,UNCBD & UNCCDUNFCC,UNCBD & UNCCDIntegrated Integrated CatchmentCatchment Management .Management .

GIS Land &Water Resources Analysis
Analysis of land and water resources for suitability is vital for ICM.

Remote Sensing Application for Resources Management Studies

Soil loss Research Site
On - farm soil research on root crops such as ginger,dalo and cassava. Soil loss 50 + tons/ha/year but withHedgerows eg pineappleless than 5 tons/ha/year.
Farmers field days todisseminate SLM /SFMinformation and shareexperiences.

Soil Erosion Modeling
FLUME
WATER LEVEL SENSOR
SOIL MOISTURE SENSOR
SOIL EROSION WITH LAND USE MAP

Training & AwarenessFarmer training on the use of new Technologies for SLM & SFM
Participatory Rural Appraisalexercise with the farmers –re- emphasising the need topractice SLM.& SFM. Need for better coordinated ICM at grassroots level ( Landcare Groups)

Formation of Landcare Groups

Capacity BuildingHuman Resources in the areas of Climate Change, Human Resources in the areas of Climate Change, BioBio--Diversity, Land Degradation and other Diversity, Land Degradation and other science and technological areas are below critical science and technological areas are below critical mass in Fiji, therefore the need to enhance mass in Fiji, therefore the need to enhance capacity building in these areas is vital.capacity building in these areas is vital.

Contour Cultivation & Agro-forestry
Agroforestry program- Dalo cultivationunder erythrina/ drala.( 1997/1998Drought – 1.3- 2kg dalo corm harvestedunder erythrina while 0.9kg under open space)
Contour cultivation of pineapples and other crops. Reduce soil loss from 50tons/ha/yr to less tan 5tons/ha/yr.

Sustainable Land Management Practices
INTEGRATED FARMING SYSTEM
MULCHING
ALLEY CROPPING CONTOUR FARMING
CONTOUR FARMING WITH HEDGEROWS
GRAZING UNDER COCONUTS

National Code of National Code of Logging Practice,1990Logging Practice,1990
Sustainable Forestry Management Practices

ConclusionBiodiversity and Land Degradation are indeed a very expensive Biodiversity and Land Degradation are indeed a very expensive problem.problem.
Public Awareness and Education on the application of Integrated Public Awareness and Education on the application of Integrated CatchmentCatchment Management is vital. Full community participation with Management is vital. Full community participation with ownership needs to be supported with strengthened institutional ownership needs to be supported with strengthened institutional arrangements that have legislative authority and resources.arrangements that have legislative authority and resources.
The need to empower communities to make good informed decisions The need to empower communities to make good informed decisions on on resources use is vital for sustainable development and managemenresources use is vital for sustainable development and management of t of natural resources.natural resources.
Fiji needs to enhance its international and regional commitmentsFiji needs to enhance its international and regional commitments to to access technical assistance, access technical assistance, mobilisationmobilisation of resources and create of resources and create synergies on UNCBD,UNFCC and UNCCD.synergies on UNCBD,UNFCC and UNCCD.
Fiji urgently needs to enhance its commitment towards IntegrateFiji urgently needs to enhance its commitment towards Integrated d CatchmentCatchment Management which demands a Management which demands a holistic and multiholistic and multi--disciplinarydisciplinary efforts by stakeholders and a firm commitment by the efforts by stakeholders and a firm commitment by the government to enhance the sustainable use of resources.government to enhance the sustainable use of resources.

A sustainablydeveloped and managed natural resources, will balance production and
protection,enhance diversity and will leave anenhanced heritage for Fiji’s future generations.
THANK YOUTHANK YOU