integrated annual report 2015 - blue label telecoms · purchasing airtime in lower denominations,...
TRANSCRIPT

INTEGRATED ANNUAL REPORT 2015
Financial performance
84 Prominent notice
85 Statement of Directors’ responsibility
86 Approval of the financial statements
86 Declaration of Company Secretary
87 Directors’ report
91 Independent auditors’ report
92 Group statement of financial position
93 Group statement of comprehensive income
94 Group statement of changes in equity
96 Group statement of cash flows
97 Notes to the Group annual financial statements
194 Company statement of financial position
195 Company statement of comprehensive income
196 Company statement of changes in equity
198 Company statement of cash flows
199Notes to the Company annual financial statements
224Annexure to the Company annual financial statements
Shareholders’ information and administration
226 Notice of Annual General Meeting and proxy
240 Glossary
IBC Administration
CONTENTS
Business model and strategic objectives
1 Nature of business
3 Vision, mission and values
4 How we work – business illustrated
6 Approach and reporting framework
7 Key facts
9 Highlights
10 Eight-year financial history
12 Operating organogram
13 Understanding material matters
17 Ethical leadership and business conduct
Leadership
18 Board of Directors
22 Senior Management
24 Chairman’s report
26 Conversation with Joint Chief Executive Officers
30 Financial Director’s report
Governance
38 Governance framework
45 King III summary
49 Governance of risk
50 Compliance report
51 Stakeholder relations
60 Remuneration report
65 Audit, Risk and Compliance Committee report
69 Social, Ethics and Transformation Committee report
Operating performance
70 Operational overview
76 Value added statement
78 Social practices
81 Human capital
83 Health and safety responsibility practices
1B
LU
E L
AB
EL IN
TE
GR
AT
ED
AN
NU
AL R
EP
OR
T 2
01
5
NATURE OF BUSINESS
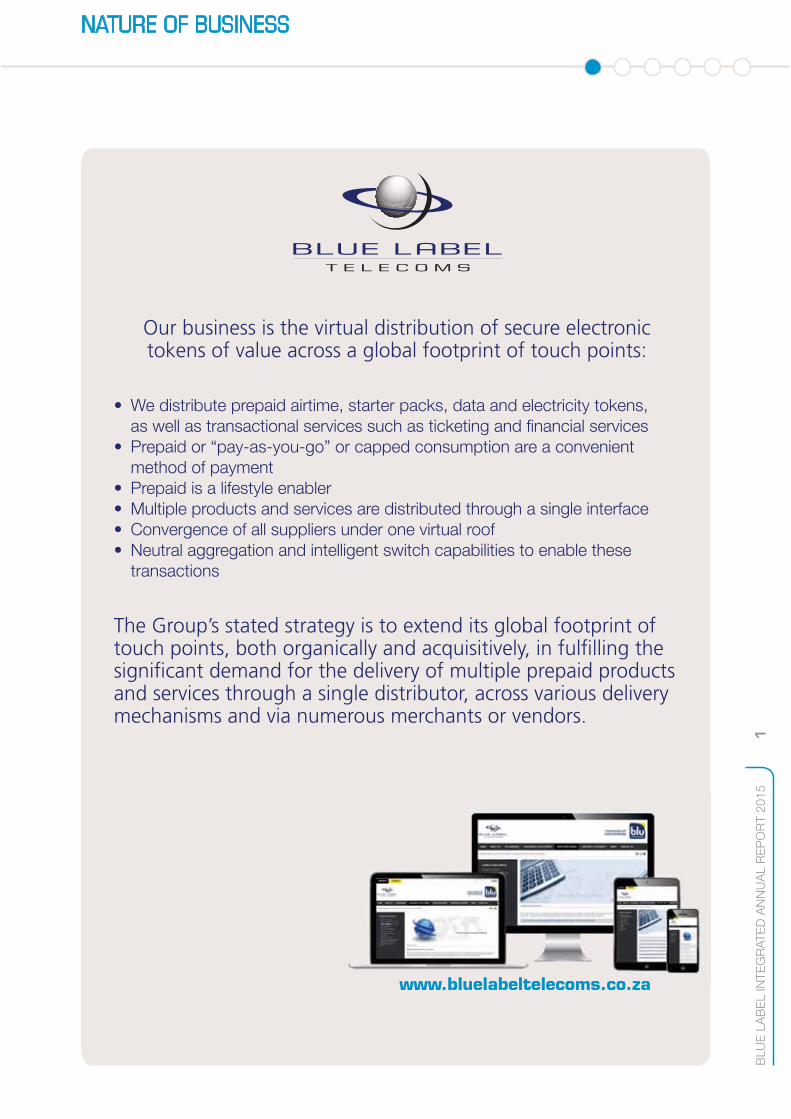
Our business is the virtual distribution of secure electronic tokens of value across a global footprint of touch points:
• We distribute prepaid airtime, starter packs, data and electricity tokens,
as well as transactional services such as ticketing and financial services • Prepaid or “pay-as-you-go” or capped consumption are a convenient
method of payment
• Prepaid is a lifestyle enabler
• Multiple products and services are distributed through a single interface
• Convergence of all suppliers under one virtual roof
• Neutral aggregation and intelligent switch capabilities to enable these
transactions
The Group’s stated strategy is to extend its global footprint of touch points, both organically and acquisitively, in fulfilling the significant demand for the delivery of multiple prepaid products and services through a single distributor, across various delivery mechanisms and via numerous merchants or vendors.
www.bluelabeltelecoms.co.zawww bluelabeltelecoms co za

2B
LU
E L
AB
EL IN
TE
GR
AT
ED
AN
NU
AL R
EP
OR
T 2
01
5
NATURE OF BUSINESS CONTINUED
The prepaid model is empowering
The cornerstone of our businesses is new groupings of consumers and our distribution of products and services to them.
Within emerging and developing economies, the supply of products and services via prepaid channels is an increasingly important distribution model. This is because the distribution of physical product is often logistically difficult, a significant portion of consumers in these markets are unbanked or badly banked or in rural areas and therefore transact in cash, while many do not qualify for purchasing on credit. Given these limitations, prepaid cash consumers are now able to demand equal treatment and can access first-world products and services. Blue Label is able to enhance the consumer’s ability to transact conveniently, affordably and with greater accessibility and choice.
Prepaid is a convenient method of payment for consumers, who are now able to purchase Blue Label’s products anywhere, anytime. Prepaid provides for forced discipline in budgeting, ensuring no surprises at month-end, as may be the case in the postpaid world. The budgeting and convenience that prepaid offers now extends to all classes of the economic pyramid, particularly evidenced in transport ticketing.
Economic slowdowns have seen many postpaid consumers migrate towards prepaid in order to enhance their financial flexibility and control spend. In general, prepaid consumers are purchasing airtime in lower denominations, while also benefiting from price reductions and variable call discounts introduced by the major mobile network operators.
A development in the prepaid space is a “hybrid contract”, which is a postpaid contract with a specified limit, and when that is exhausted, it is immediately sequenced by a prepaid top-up for the same products or services.
A key to distribution in emerging markets is to make products and services available as a prepaid offering as an alternative to postpaid.
Our three income streams:
• Interest income: The Group’s high volumes, coupled with its favourable trading terms, generate significant cash from operating activities. Interest is earned on cash balances.
• Annuity income: On distribution and successful activation of starter packs, the Group earns a rebate or activation bonus. Ongoing annuity revenue is earned on topping up for the life of each starter pack. A number of affinity programmes mitigate churn in the starter pack base. Annuity revenues are earned from subscription-based businesses, where customer retention is a key focus. Launching additional products and services to new and existing subscriber bases enhances annuity revenue.
• Sales of commodities, products and/or services: The Group distributes virtual and physical prepaid airtime on behalf of the mobile network operators, as well as electricity tokens on behalf of the utilities.
Our distribution system can be compared to a virtual railroad delivering prepaid goods
Our business is about the distribution of secure electronic tokens of value and services. If a product can be digitised, it can be distributed by us.
As distribution plays an important role in the economy, our leverage of the last mile of the distribution channel is critical. Whoever manages the last mile of the channel actually owns the whole distribution channel. Since the POS terminal is always located in the last mile, the person managing it decides what products and services may be sold from it.
OUR BUSINESS MODELHigh-volume distribution of e-tokens of value and complementary services leverage off a favourable working capital cycle. Long-term contracts with suppliers of products and services underpin the model.
VISION, MISSION AND VALUES
BLU
E L
AB
EL IN
TE
GR
AT
ED
AN
NU
AL R
EP
OR
T 2
01
53
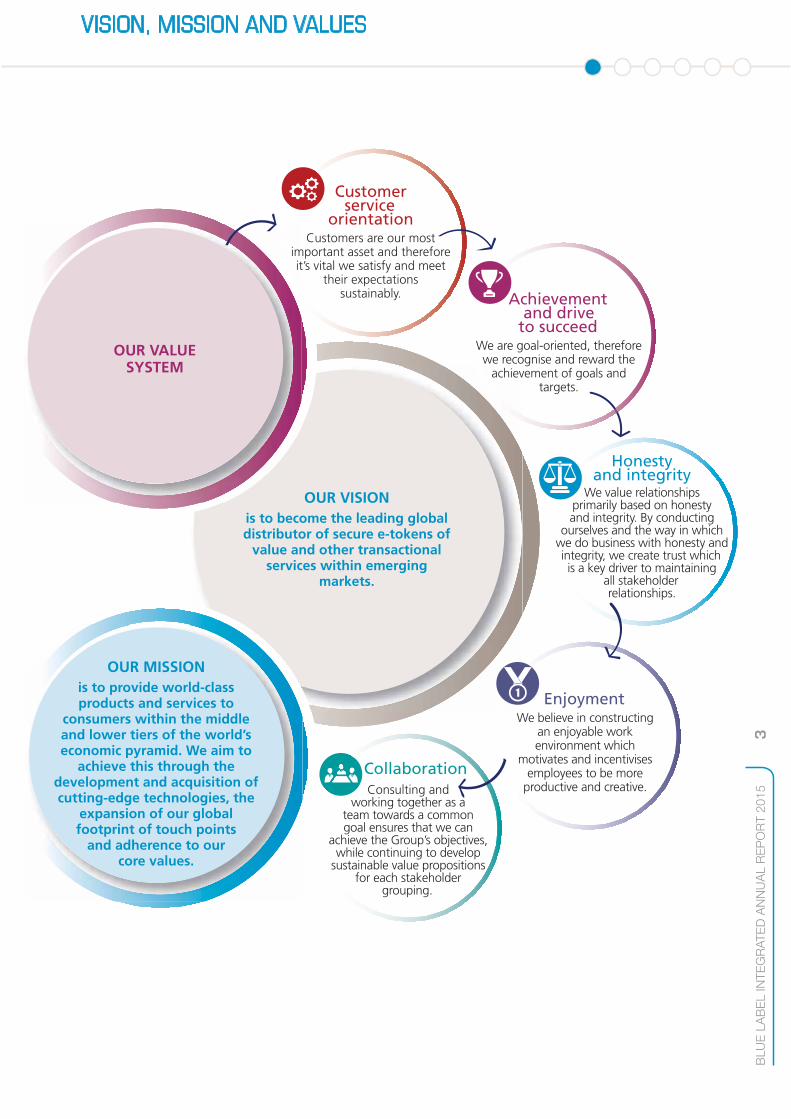
OUR VISIONis to become the leading global distributor of secure e-tokens of
value and other transactional services within emerging
markets.
OUR MISSIONis to provide world-class products and services to
consumers within the middle and lower tiers of the world’s economic pyramid. We aim to
achieve this through the development and acquisition of cutting-edge technologies, the
expansion of our global footprint of touch points
and adherence to our core values.
OUR VALUE SYSTEM
Customer service
orientationCustomers are our most
important asset and therefore it’s vital we satisfy and meet
their expectations sustainably.
Honesty and integrity
We value relationships primarily based on honesty and integrity. By conducting
ourselves and the way in which we do business with honesty and integrity, we create trust which is a key driver to maintaining
all stakeholder relationships.
EnjoymentWe believe in constructing
an enjoyable work environment which
motivates and incentivises employees to be more
productive and creative.
Achievement and drive
to succeed We are goal-oriented, therefore we recognise and reward the
achievement of goals and targets.
Consulting and
working together as a team towards a common goal ensures that we can
achieve the Group’s objectives, while continuing to develop
sustainable value propositions for each stakeholder
grouping.
Collaboration
4B
LU
E L
AB
EL IN
TE
GR
AT
ED
AN
NU
AL R
EP
OR
T 2
01
5
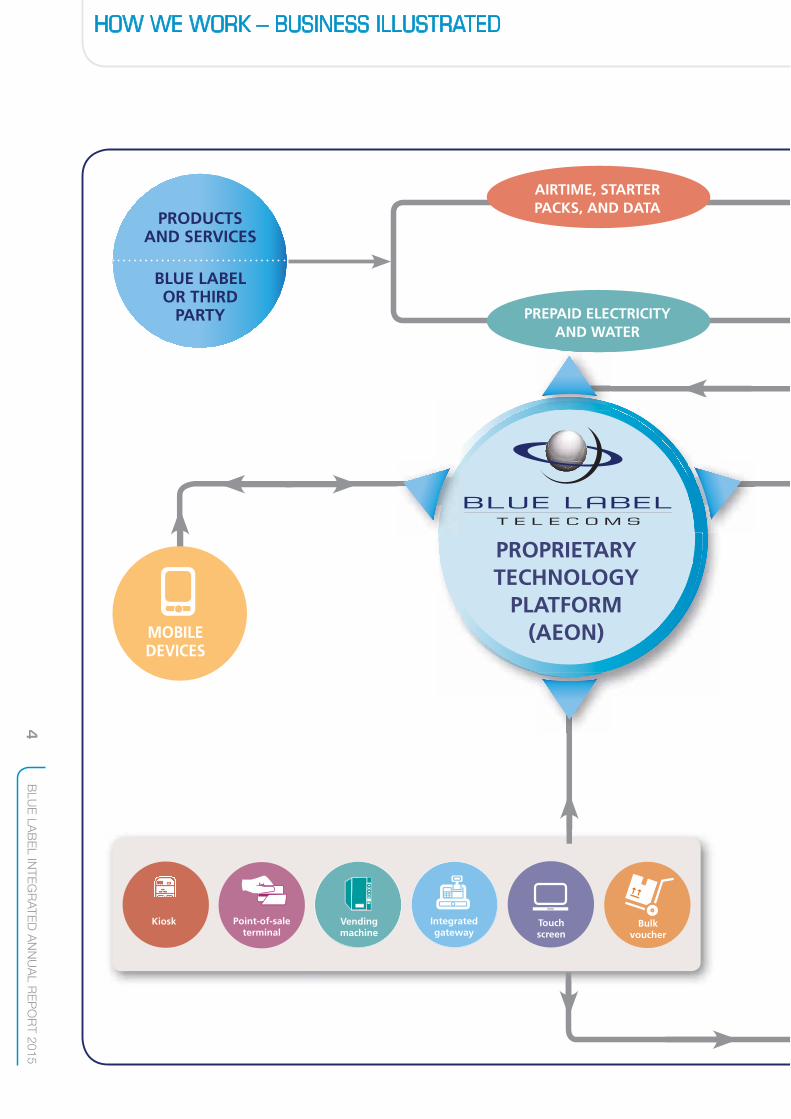
HOW WE WORK – BUSINESS ILLUSTRATED
AIRTIME, STARTER PACKS, AND DATA
PREPAID ELECTRICITY AND WATER
PRODUCTS AND SERVICES
BLUE LABEL OR THIRD
PARTY
PROPRIETARY TECHNOLOGY
PLATFORM (AEON)MOBILE
DEVICES
Kiosk Point-of-sale terminal
Integrated gateway
Touch screen
Bulk voucher
Vending machine

5B
LU
E L
AB
EL IN
TE
GR
AT
ED
AN
NU
AL R
EP
OR
T 2
01
5
FORMAL RETAIL
INFORMAL RETAIL
DIRECT DISTRIBUTION
CORPORATESLOW-COST DEVICES
TRUCKS AND FOOT SOLDIERS
PETROLEUM FORECOURTS
KIOSKS
WHOLESALER
POSTILION SWITCH
FINANCIAL INSTITUTIONS
FINANCIAL AND VALUE-ADDED SERVICES
TICKETING BY TICKETPRO EVENTS, TRANSPORT, SPORT
INDEPENDENT RETAIL

6B
LU
E L
AB
EL IN
TE
GR
AT
ED
AN
NU
AL R
EP
OR
T 2
01
5
APPROACH This is Blue Label’s fifth integrated annual report,
which continues to document the journey of our
unique story, while sharing our integrated thinking
as we implement an integrated strategy across the
Group.
In following the recommendations of the King Code
of Governance Principles for South Africa and the
structure set out by the International Integrated
Reporting Council’s framework, Blue Label’s process
aims to link material Group information with
reference to strategy, governance, performance,
remuneration and prospects in such a way that our
stakeholders obtain a view of the commercial, social
and environmental context within which the Group
operates.
This integrated annual report is the Group’s primary
report. It covers the Group’s business segments and
its financial and operational performance for the
financial year ended 31 May 2015. Non-financial
and sustainability information is limited to the South
African operations, as the International distribution
business comprises operating entities accounted for
as associates and joint ventures.
The report contains issues material to our strategy
and of interest to our stakeholders. Blue Label has
mapped its stakeholders, in particular its relationship
with its employees, providers of capital, the media,
customers, business partners and suppliers,
communities, educational institutions and
government bodies. These stakeholder groupings
receive more structured engagement processes than
other groupings and the level of inclusivity with
these stakeholders is correspondingly more
integrated into the Group’s strategic thinking
(refer to the stakeholder communication table on
pages 54 to 59).
The integrated annual report provides a detailed
understanding of the financial aspects of the
Group’s business. The annual financial statements
have been prepared in accordance with International
Financial Reporting Standards (IFRS) and the
Companies Act of South Africa and includes the
financial and Directors’ reports.
This report contains the notice of Annual General
Meeting, proxy form and information to enable
shareholders to exercise their vote on the resolutions
to be put to the meeting.
Various supporting documents to the Group’s library
of disclosure, such as results presentations,
short-form advertisements and SENS
announcements can be accessed via the website.
The Technology division has embarked on a
multi-year programme to ensure consistent
governance and compliance of required legislation
across the Group. This encompasses the review and
standardisation of all current policies, processes,
procedures, standards and supporting technologies
to ensure that this effort is repeatable, sustainable
and measurable into the future. The ultimate goal is
to achieve a number of industry certifications that
will provide assurance to all stakeholders that the
technology function is managed and governed
effectively.
Ultimately, the report aims to provide stakeholders
with the means to assess the Group’s ability to
create and sustain value over the short, medium
and long term.
REPORTING FRAMEWORKThis report has been compiled considering the
requirements of King III, the principles of the
International <IR> Framework and the GRI G3
Guidelines.
Blue Label uses a risk-based model which identifies
internal risks and stakeholder issues to determine
the material content of the report. Although Blue
Label has not declared a GRI “in accordance level”
in this year’s report, we continue to consider our
transition to “in accordance core” in future years.
APPROACH AND REPORTING FRAMEWORK

7B
LU
E L
AB
EL IN
TE
GR
AT
ED
AN
NU
AL R
EP
OR
T 2
01
5
KEY FACTS
Training and development:
R3.9 million
CSI: R5.3 million
South Africa,
India and Mexico
Operations
Johannesburg, with offices throughout
South Africa
Headquarters
Diverse revenue streams
Sales of commoditiesAnnuity incomeInterest earned
us
Int
2010Maiden
dividend paidiv
Airtime, starter packs and data
Electricity and water Ticketing by TicketPro
Financial and value- added services
Main products and services
2007 Listed on JSE
as BLU
R7.4 billion market
capitalisation
at R11.00 per share
Free float at about 57%,
with diverse institutional
shareholder base
2 179across South Africa, India and Mexico
Employees group-wide
2011Share buyback
executed
Target marketsFocused on serving the total
domesticmarket, in particular
unbanked or badly banked or rural
consumers, in South Africa, India and Mexico
A
tritinncia
dde
Main products
FoundedMark Levy and
Brett Levy
2001
Transaction volumes
61 million consumers
±5 billion Transactions p.a. peaking at 4 million online
transactions per day, 80 million bulkprint vouchers distributed per month,
maintaining a database of over

8B
LU
E L
AB
EL IN
TE
GR
AT
ED
AN
NU
AL R
EP
OR
T 2
01
5
KEY FACTS CONTINUED
MAKING A DIFFERENCE IN SOUTH AFRICA
Using our sophisticated
proprietary technology,
we distribute innovative
products and services,
such as airtime, starter packs, data, prepaid electricity and financial services and have
recently added new
solutions of ticketing
and prepaid water
We take product to the people, reaching both un-
and underbanked, as well as
rural communities, enriching and uplifting their lifestyles, by enabling them
to have access to first-world products and services
We provide informal employment
to about 30 000 merchants and
foot soldiers, build solid relationships with the merchant
base, while fostering their
entrepreneurial and
empowerment skills
Staff benefit from upskilling, education, mentoring and
development courses
CSI spend is mainly applied
to Boys & Girls
Clubs of South
Africa

9B
LU
E L
AB
EL IN
TE
GR
AT
ED
AN
NU
AL R
EP
OR
T 2
01
5
HIGHLIGHTS
Increase in gross profit by 22% to
R1.64 billion
Increase in revenue by 14% to
R22 billion
Increase in EBITDA of 37% to
R1.08 billion
Increase in headline earnings per share of 21% to 82.26 cents
Cash resources R778 million
Sale of Ukash and acquisition of Viamedia
Enhancing our retailstrategy
Increase in dividend per share of 15% to 31 cents
Increase in gross profit margins from 6.96% to 7.46%
10
BLU
E L
AB
EL IN
TE
GR
AT
ED
AN
NU
AL R
EP
OR
T 2
01
5
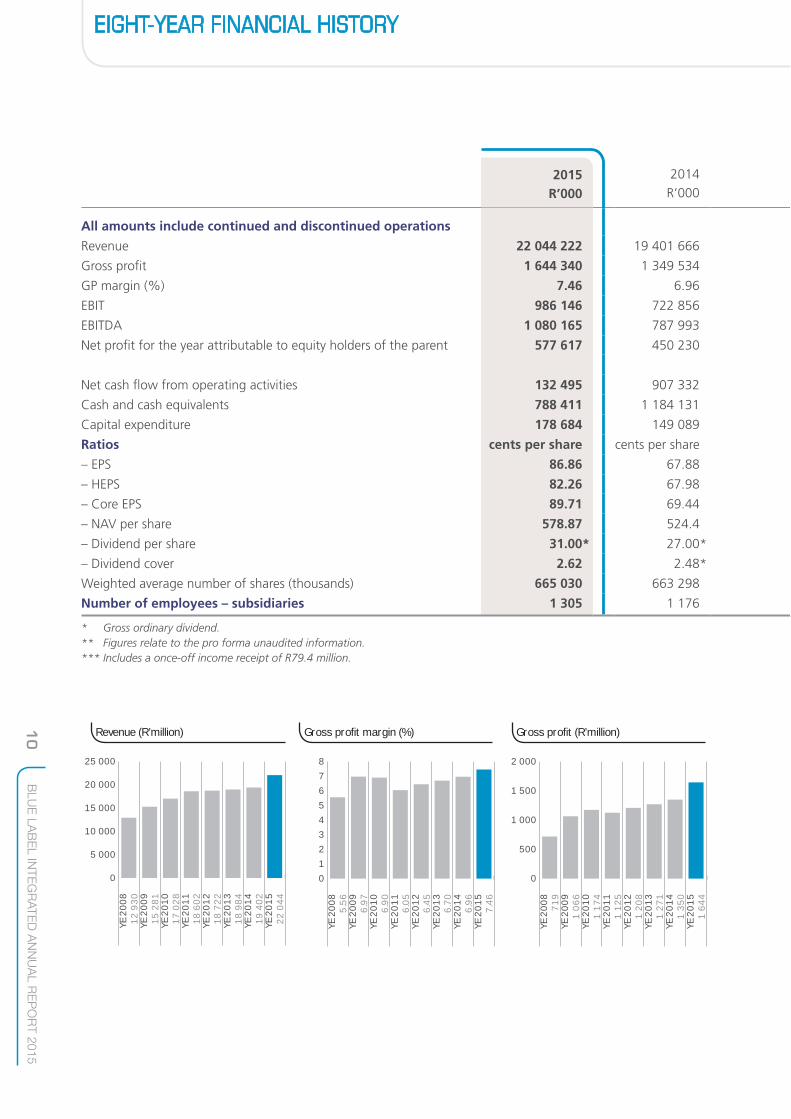
EIGHT-YEAR FINANCIAL HISTORY
2014R’000
All amounts include continued and discontinued operations
Revenue 22 044 222 19 401 666
Gross profit 1 644 340 1 349 534
GP margin (%) 7.46 6.96
EBIT 986 146 722 856
EBITDA 1 080 165 787 993
Net profit for the year attributable to equity holders of the parent 577 617 450 230
Net cash flow from operating activities 132 495 907 332
Cash and cash equivalents 788 411 1 184 131
Capital expenditure 178 684 149 089
Ratios cents per share cents per share
– EPS 86.86 67.88
– HEPS 82.26 67.98
– Core EPS 89.71 69.44
– NAV per share 578.87 524.4
– Dividend per share 31.00* 27.00*
– Dividend cover 2.62 2.48*
Weighted average number of shares (thousands) 665 030 663 298
Number of employees – subsidiaries 1 305 1 176
* Gross ordinary dividend.** Figures relate to the pro forma unaudited information.*** Includes a once-off income receipt of R79.4 million.
2015R’000
0
5 000
10 000
15 000
20 000
25 000
Revenue (R’million)
Y
E 2
00
91
5 2
81
Y
E 2
00
81
2 9
30
Y
E 2
01
01
7 0
28
Y
E 2
01
11
8 6
02
Y
E 2
01
21
8 7
22
Y
E 2
01
31
8 9
84
Y
E 2
01
41
9 4
02
Y
E 2
01
52
2 0
44
0
500
1 000
1 500
2 000
Gross profit (R’million)
Y
E 2
00
91
06
6
Y
E 2
00
87
19
Y
E 2
01
01
17
4
YE
20
11
1 1
25
Y
E 2
01
21
20
8
YE
20
13
1 2
71
Y
E 2
01
41
35
0
YE
20
15
1 6
44
0
1
2
3
4
5
6
7
8
Gross profit margin (%)
Y
E 2
00
85
.56
Y
E 2
00
96
.97
Y
E 2
01
06
.90
Y
E 2
01
16
.05
Y
E 2
01
26
.45
Y
E 2
01
36
.70
Y
E 2
01
46
.96
Y
E 2
01
57
.46

11
BLU
E L
AB
EL IN
TE
GR
AT
ED
AN
NU
AL R
EP
OR
T 2
01
5
EIGHT-YEAR FINANCIAL HISTORY CONTINUED
2013R’000
2012***R’000
2011R’000
2010R’000
2009R’000
2008R’000
18 984 210 18 722 080 18 601 571 17 027 696 15 281 449 12 930 609**
1 271 245 1 208 077 1 124 569 1 174 224 1 065 609 719 102**
6.7 6.45 6.05 6.9 6.97 5.56**
645 671 643 828 517 060 569 459 474 847 273 254**
713 622 735 385 710 192 689 244 568 067 346 929**
424 841 438 104 431 448 365 022 390 547 269 423**
(439 794) 528 109 427 663 515 910 666 994 (19 796)
941 282 1 975 242 2 226 170 2 054 902 1 756 806 1 328 294
291 605 164 485 186 196 195 817 103 496 70 136
cents per share cents per share cents per share cents per share cents per share cents per share
64.22 61.87 57.04 48.17 51.13 35.16**
64.17 64.65 46.2 48.27 51.63 34.86**
66.13 64.37 60.34 52.34 55.93 48.40**
480.77 432.08 388.9 342.76 294.04 249.17
25.00* 23.00* 14 12 – –
2.52* 2.95* 3.3 4.02 – –
661 578 708 060 756 359 757 793 763 834 766 361
1 112 1 216 1 357 1 620 1 979 1 616
0
100
200
300
400
500
600
NAV per share (cents)
Y
E 2
00
92
94
.04
Y
E 2
00
82
49
.17
Y
E 2
01
03
42
.76
Y
E 2
01
13
88
.90
Y
E 2
01
24
32
.08
Y
E 2
01
34
80
.77
Y
E 2
01
45
24
.40
Y
E 2
01
55
78
.87
0
200
400
600
800
1 000
1 200
EBITDA (R’million)
Y
E 2
00
83
46
Y
E 2
00
95
68
Y
E 2
01
06
89
Y
E 2
01
17
10
Y
E 2
01
27
35
Y
E 2
01
37
14
Y
E 2
01
47
88
Y
E 2
01
51
08
0
0
5
10
15
20
25
30
35
Dividends declared per share (cents)
Y
E 2
00
9 0
Y
E 2
00
8 0
Y
E 2
01
01
2
YE
20
11
14
Y
E 2
01
22
3
YE
20
13
25
Y
E 2
01
42
7
YE
20
15
31

12
BLU
E L
AB
EL IN
TE
GR
AT
ED
AN
NU
AL R
EP
OR
T 2
01
5
OPERATING ORGANOGRAM
Blue Label South Africa
Blue Label Solutions
The Prepaid
Company
RMCS
The Post Paid
Company
TicketPro
Transaction Junction
(60%)
Blue Label Distribution
ActiviDevelopment
Services
Ventury
Cigicell (74%)
Blue Label International
Blue Label Mexico
(46.64%)
Africa Prepaid Services (90%)
Oxigen Services
India (55.83%)
Gold Label Investments
Mpower Softcomm
(21.6%)
Blue Label Mobile
Simigenix
Blue Label One
Panacea
Cellfind
Viamedia (75%)
Supa Pesa Africa(Mauritius)
(50%)
100% unless otherwise stated
FIDS (25%)
Datacision (50%)
Blue Label Data Solutions
(81%)
Datacel
Velociti Call Centre
Blue Label Call Centre
CNS Call Centre
13
BLU
E L
AB
EL IN
TE
GR
AT
ED
AN
NU
AL R
EP
OR
T 2
01
5
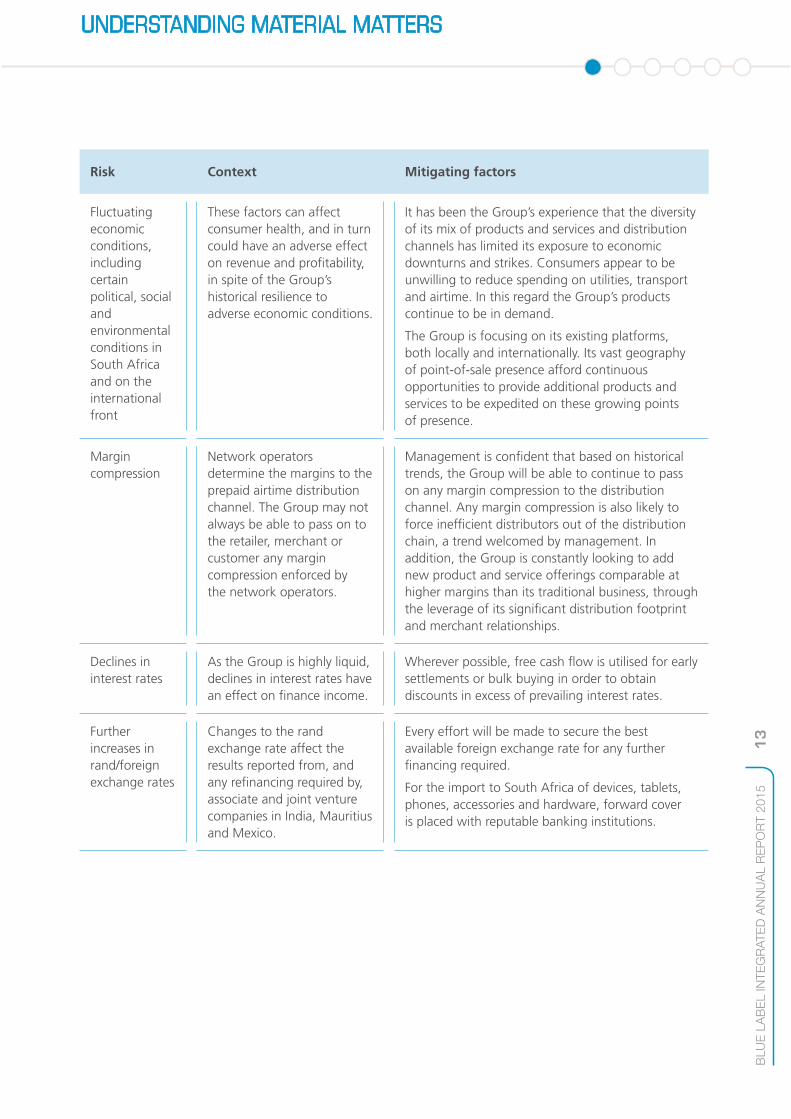
UNDERSTANDING MATERIAL MATTERS
Risk Context Mitigating factors
Fluctuating economic conditions, including certain political, social and environmental conditions in South Africa and on the international front
These factors can affect consumer health, and in turn could have an adverse effect on revenue and profitability, in spite of the Group’s historical resilience to adverse economic conditions.
It has been the Group’s experience that the diversity of its mix of products and services and distribution channels has limited its exposure to economic downturns and strikes. Consumers appear to be unwilling to reduce spending on utilities, transport and airtime. In this regard the Group’s products continue to be in demand.
The Group is focusing on its existing platforms, both locally and internationally. Its vast geography of point-of-sale presence afford continuous opportunities to provide additional products and services to be expedited on these growing points of presence.
Margin compression
Network operators determine the margins to the prepaid airtime distribution channel. The Group may not always be able to pass on to the retailer, merchant or customer any margin compression enforced by the network operators.
Management is confident that based on historical trends, the Group will be able to continue to pass on any margin compression to the distribution channel. Any margin compression is also likely to force inefficient distributors out of the distribution chain, a trend welcomed by management. In addition, the Group is constantly looking to add new product and service offerings comparable at higher margins than its traditional business, through the leverage of its significant distribution footprint and merchant relationships.
Declines in interest rates
As the Group is highly liquid, declines in interest rates have an effect on finance income.
Wherever possible, free cash flow is utilised for early settlements or bulk buying in order to obtain discounts in excess of prevailing interest rates.
Further increases in rand/foreign exchange rates
Changes to the rand exchange rate affect the results reported from, and any refinancing required by, associate and joint venture companies in India, Mauritius and Mexico.
Every effort will be made to secure the best available foreign exchange rate for any further financing required.
For the import to South Africa of devices, tablets, phones, accessories and hardware, forward cover is placed with reputable banking institutions.
14
BLU
E L
AB
EL IN
TE
GR
AT
ED
AN
NU
AL R
EP
OR
T 2
01
5
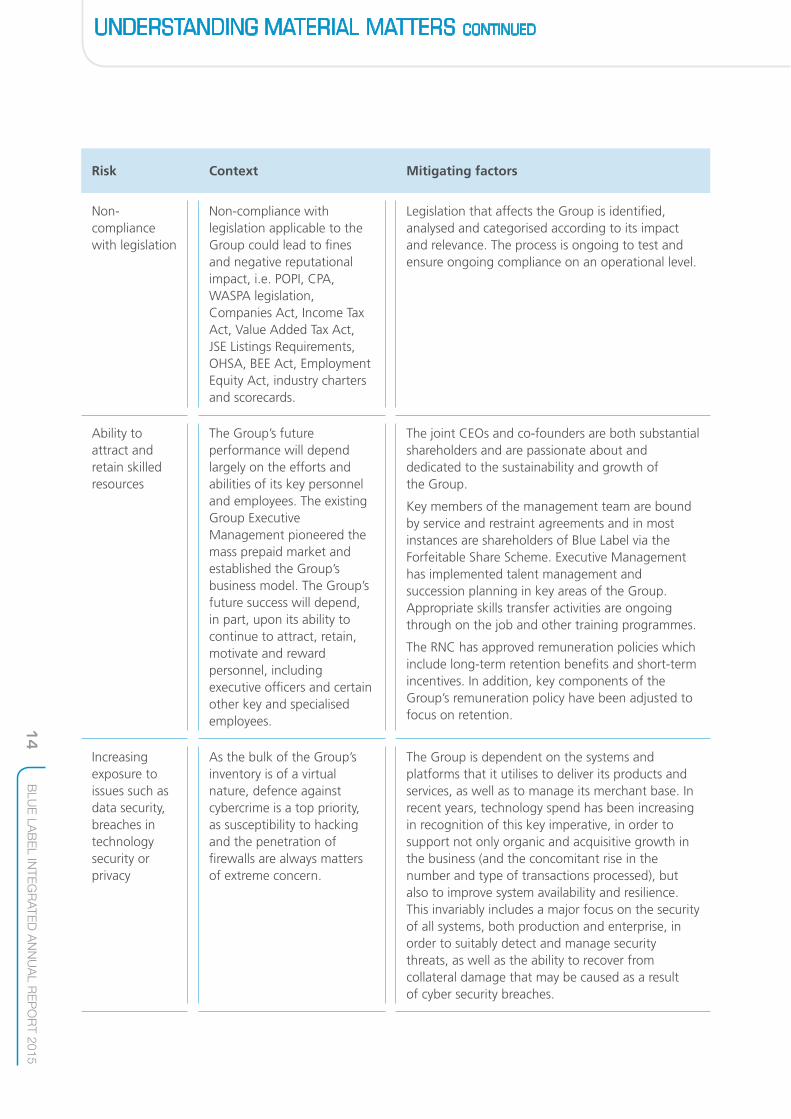
UNDERSTANDING MATERIAL MATTERS CONTINUED
Risk Context Mitigating factors
Non-compliance with legislation
Non-compliance with legislation applicable to the Group could lead to fines and negative reputational impact, i.e. POPI, CPA, WASPA legislation, Companies Act, Income Tax Act, Value Added Tax Act, JSE Listings Requirements, OHSA, BEE Act, Employment Equity Act, industry charters and scorecards.
Legislation that affects the Group is identified, analysed and categorised according to its impact and relevance. The process is ongoing to test and ensure ongoing compliance on an operational level.
Ability to attract and retain skilled resources
The Group’s future performance will depend largely on the efforts and abilities of its key personnel and employees. The existing Group Executive Management pioneered the mass prepaid market and established the Group’s business model. The Group’s future success will depend, in part, upon its ability to continue to attract, retain, motivate and reward personnel, including executive officers and certain other key and specialised employees.
The joint CEOs and co-founders are both substantial shareholders and are passionate about and dedicated to the sustainability and growth of the Group.
Key members of the management team are bound by service and restraint agreements and in most instances are shareholders of Blue Label via the Forfeitable Share Scheme. Executive Management has implemented talent management and succession planning in key areas of the Group. Appropriate skills transfer activities are ongoing through on the job and other training programmes.
The RNC has approved remuneration policies which include long-term retention benefits and short-term incentives. In addition, key components of the Group’s remuneration policy have been adjusted to focus on retention.
Increasing exposure to issues such as data security, breaches in technology security or privacy
As the bulk of the Group’s inventory is of a virtual nature, defence against cybercrime is a top priority, as susceptibility to hacking and the penetration of firewalls are always matters of extreme concern.
The Group is dependent on the systems and platforms that it utilises to deliver its products and services, as well as to manage its merchant base. In recent years, technology spend has been increasing in recognition of this key imperative, in order to support not only organic and acquisitive growth in the business (and the concomitant rise in the number and type of transactions processed), but also to improve system availability and resilience. This invariably includes a major focus on the security of all systems, both production and enterprise, in order to suitably detect and manage security threats, as well as the ability to recover from collateral damage that may be caused as a result of cyber security breaches.

15
BLU
E L
AB
EL IN
TE
GR
AT
ED
AN
NU
AL R
EP
OR
T 2
01
5
UNDERSTANDING MATERIAL MATTERS CONTINUED
Risk Context Mitigating factors
Elimination of the middle man
In most industries a wholesaler is at risk of being eliminated from the supply chain if the supplier has the infrastructure and capabilities to supply the customer directly.
From inception, the objective of the Group was to become a one-stop destination for the supply and distribution of all of the mobile networks’ offerings. This would provide both convenience and efficiency to the retailer and customer. Furthermore, the technology and footprint developed by the Group allows retailers to earn additional revenue by introducing additional products. This would make it difficult to disintermediate the Group.
No single network can offer this complete solution.
The introduction of the sale of prepaid electricity tokens, and its phenomenal uptake in South Africa, strengthens the Group’s foothold as a one-stop destination that is most convenient to the retailer. The Group’s increasing bouquet of products and its neutral aggregation thereof will continue to ensure that its middle-man status as distributor is essential to the retailer and will remain entrenched. The Group will continually develop and upgrade new, innovative products to strengthen the foundation of its middle-man status. Many merchants have limited cash flow; however, utilising the Group’s vending solutions allows them to vend products and services which they previously could not afford. The lack of affordability was due to various complexities, such as managing stock levels, obsolescence, pilferage at store level, inability to order small quantities and access to limited stock ranges.
Also, the addition of such products and services, and a growing suite of products, necessitates that the Group not only excels in the sourcing, management and delivery of these products and the management of relationships in its merchant base, but simultaneously delivering an excellent supporting back-office capability – including the ability to deliver and manage reconciliation and settlement on behalf of its customers, extensive and professional merchant support services, and deep technology support for online and integrated systems. These competencies make it even more difficult for the Group to be disintermediated, because of the significant value that it provides to merchants, not only in the products and services it delivers, but also in respect of the increasingly complex back-office support functionality required to deliver such services.
The Group is an aggregator and an enabler to both its customers and suppliers.

16
BLU
E L
AB
EL IN
TE
GR
AT
ED
AN
NU
AL R
EP
OR
T 2
01
5
UNDERSTANDING MATERIAL MATTERS CONTINUED
Risk Context Mitigating factors
Elimination of the middle man continued
Without a distributor, every one of the four mobile operators and around 200 utilities across South Africa would need to deploy a device linked to technology at every merchant in the country, in order to provide the same access and level of service as the Group.
For the amount of commission the mobile network operators charge the Group for distribution, they would not be able to provide the same level of service if they were to do it themselves. In addition the Group provides the capex, field support, R&D and call centre services to the merchant base.
Disaster recovery and continuity of business
The Group has developed proprietary technology supporting the roll out of its bouquet of products and services. The Group’s infrastructure connects into some of South Africa’s major banks, Eskom, public and private utility companies and telecommunication operators. In addition, the Group switches both debit and credit cards, electronic funds transfer transactions and e-token products for some of the country’s leading retailers and petroleum companies. The effective and continuous operation of this infrastructure is critical to the Group’s service delivery.
Management recognises the importance assigned to IT in its corporate governance systems.
The technology team has been strengthened – in people, skills and capability. A Group Information Security Officer has been appointed to assist in compliance processes and procedures from an IT governance perspective. The Group’s Business Continuity and Disaster Recovery Plan provides guidance for emergency and crisis management, business unit recovery and technology disaster recovery. The latter includes the restoration of IT facilities. The plan describes the IT framework and procedures to be activated in the event of a disaster. The major goals of the plan are to: • minimise interruptions and limit damage to
normal operations; • minimise the economic impact of the
interruption; • establish alternative means of operation in
advance; • train personnel on emergency procedures; • provide for rapid restoration of service, ensuring
availability/continuity of critical business operations; and
• communicate appropriately to relevant stakeholders.

17
BLU
E L
AB
EL IN
TE
GR
AT
ED
AN
NU
AL R
EP
OR
T 2
01
5
ETHICAL LEADERSHIP AND BUSINESS CONDUCT
Good corporate governance is essentially about effective and responsible leadership. It is characterised by the ethical values of responsibility, accountability, fairness and transparency. The typical aspects of corporate governance, such as the role and responsibilities of the Board and Directors individually, internal audit, risk management and stakeholder engagement rest on a foundation of ethical values.
Blue Label’s ethical standards are encapsulated in its ethics statement, which provides a template for ethical reasoning as a guide to all employees in their dealings with both internal and external stakeholders. The ethics statement is applicable to employees across the Group, as well as to customers, business partners, suppliers and other stakeholders. Each is requested to uphold the ethical reasoning of the statement, thereby enabling us to live our values.
The purpose of the ethics statement is to: • emphasise the Group’s commitment to ethics
and compliance with laws and regulations; • set out basic standards of ethical and legal
behaviour; • provide reporting mechanisms for known or
suspected ethical or legal violations; and • help prevent and detect wrongdoing.
Blue Label reiterates its stance on the following matters: • fraudulent, corrupt or illegal practices are not
tolerated. Bribes or any other illicit payments including facilitations will neither be paid nor received;
• the Group does not participate in any illegal anti-competitive activity. Employees cannot authorise or participate in any illegal conduct or action that purports to restrict competition; and
• the Group is non-political.
Employees are expected to demonstrate ethical business practices. All new staff members undergo an induction programme that includes training on the above code of business conduct, including the function of the ethics hotline, such as what should be reported and how to report unethical behaviour via this channel. The ethics hotline is outsourced to KPMG Ethics Line, a division of KPMG, and has been certified by EthicsSA as fulfilling the External Whistleblowing Hotline Service Provider Standard EO1.1.1. This standard is a best practice set of guidelines or norms for the professional and ethical conduct of external whistleblowing hotline service providers operating their own centres or facilities.
A number of incidents were reported during the year. All incidents were human resource-related and were resolved by the Group Head of Human Resources and the relevant line managers, in terms of the Group’s various policies and procedures.

18
BLU
E L
AB
EL IN
TE
GR
AT
ED
AN
NU
AL R
EP
OR
T 2
01
5
BOARD OF DIRECTORS
LAURENCE (LARRY) NESTADT Independent
Non-Executive Chairman
GARY HARLOW Independent
Non-Executive Director
JOE MTHIMUNYE Independent
Non-Executive Director
JERRY VILAKAZI Independent
Non-Executive Director
Chairman of
Executive Committee
Investment Committee
Social, Ethics and Transformation Committee
Audit, Risk and Compliance Committee
Nomination Committee
Remuneration Committee
1
2
3
5
YUSUF MAHOMEDIndependent
Non-Executive Director(effective 18 August 2015)
D
4

19
BLU
E L
AB
EL IN
TE
GR
AT
ED
AN
NU
AL R
EP
OR
T 2
01
5
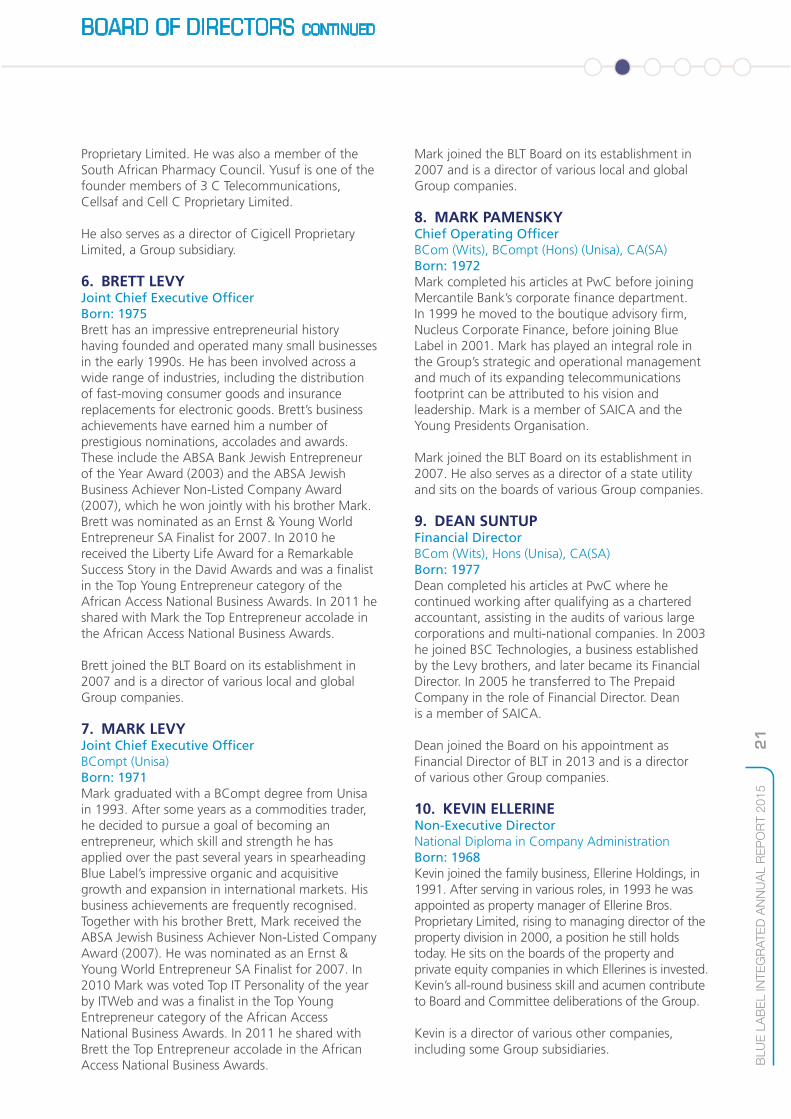
BOARD OF DIRECTORS CONTINUED
BRETT LEVYJoint Chief Executive Officer
MARK PAMENSKYChief Operating Officer
DEAN SUNTUPFinancial Director
MARK LEVYJoint Chief Executive Officer
Board Committee participationMember of Executive Committee
Member of Investment Committee
Member of Social, Ethics and Transformation Committee
Member of Audit, Risk and Compliance Committee
Member of Remuneration and Nomination Committee
6
7
8
9
KEVIN ELLERINENon-Executive Director
10

20
BLU
E L
AB
EL IN
TE
GR
AT
ED
AN
NU
AL R
EP
OR
T 2
01
5
1. LAURENCE (LARRY) NESTADTIndependent Non-Executive ChairmanBorn: 1950Larry has over 40 years’ experience in his long and successful corporate career, both in South Africa and internationally. Larry is a co-founder and former executive director of Investec Bank Limited. He assisted in the creation and strategic development of a number of listed companies such as Capital Alliance Holdings Limited, Super Group Limited, Hosken Consolidated Investments Limited, SIB Holdings Limited and Global Capital Limited. He is the past chairman on each of the boards of these companies.
Larry has also served on the board of directors of Softline Limited, JCI Limited and Abacus Technologies Holdings Limited. He was a former director of a number of non-listed companies, internationally and locally, viz, Stenham Limited (UK) and Prefsure Life Limited (Aus). Currently, Larry holds various directorships and is executive chairman of Global Capital Proprietary Limited, and chairman of Melrose Motor Investments, MoreCorp Group Proprietary Limited, SellDirect Marketing Proprietary Limited and National Airways Corporation Proprietary Limited.
Larry joined the Board on its establishment in 2007. As a respected senior member of the South African business community, his strategic vision, guidance and experience contribute significantly to the Board and its deliberations.
2. GARY HARLOWIndependent Non-Executive DirectorBBusSci (Hons) (UCT), FCMA, CGMA, CA(SA)Born: 1957Gary graduated from the University of Cape Town in 1979, qualifying as a Chartered Accountant (SA) in 1982, an associate of the Chartered Institute of Management Accountants (UK) in 1983 and as a fellow chartered management accountant (UK) in 1996. His career was forged in merchant and investment banking. In the early 1990s he became an adviser to the African National Congress in developing Black Economic Empowerment strategies and in 1992 was instrumental in the creation of Thebe Investment Corporation South Africa’s first broad-based black-owned company. Gary served as Joint Chief Executive Officer of Msele Corporate and Merchant Bank, South Africa’s first black-controlled merchant bank.
In 1996 Gary was appointed Group Chief Executive Officer of Unihold Limited, where he remains Executive Chairman. He led its transition from an engineering conglomerate to an international IT and telecommunications group, followed by a delisting
through a management buyout in 2002. Gary continues to serve on numerous private and public company boards.
He is also chairman and/or director of various Group subsidiaries.
3. JOE MTHIMUNYEIndependent Non-Executive DirectorBCompt Hons/CTA (Unisa), CA(SA)Born: 1965Joe qualified as a chartered accountant in 1993. In 1996, he co-founded Gobodo Incorporated, an accounting practice with eight other partners which in time became the largest black accounting firm in South Africa. In 1999, he led a management buyout of Gobodo Corporate Finance from the accounting firm and rebranded it AloeCap Proprietary Limited, of which he is currently executive chairman. He also serves on the board of directors of various non-listed companies in which AloeCap Private Equity is invested.
4. JERRY VILAKAZIIndependent Non-Executive DirectorBA (Unisa), MA (Thames Valley), MA (London) and MBA (California Coast University)Born: 1961Jerry is executive chairman of the Palama group of companies which he co-founded with the view to investing in private and listed companies. He previously served as CEO of Business Unity South Africa (BUSA). He is also the chairman of the State Information Technology Agency (SITA), Mpumalanga Gambling Board and Trubok Proprietary Limited. Jerry was previously a director of PPC Limited and recently retired from the position of Chairman of Netcare Limited. He currently holds directorships at Goliath Gold Limited, Sibanye Gold Limited and Saatchi & Saatchi. Jerry is a member of the National Planning Commission and previously served on the Presidential B-BBEE Advisory Council and Public Service Commission. He is an adviser to Citi Bank in South Africa.
5. YUSUF MAHOMEDIndependent Non-Executive DirectorBPharm (UDW) and MSc (Pharm Tech) from Chelsea College, University of LondonBorn: 1953Yusuf is chairperson of the Cell C Foundation which is responsible for Cell C Proprietary Limited corporate social investment initiatives. He is also a director of Legend Power Solutions Proprietary Limited and alternate director of Avon Peaking Power Proprietary Limited and Dedisa Peaking Power Proprietary Limited. His previous directorships included Cell C Proprietary Limited, Siemens Proprietary Limited and Ubambo Investment Holding
BOARD OF DIRECTORS CONTINUED
21
BLU
E L
AB
EL IN
TE
GR
AT
ED
AN
NU
AL R
EP
OR
T 2
01
5
Mark joined the BLT Board on its establishment in 2007 and is a director of various local and global Group companies.
8. MARK PAMENSKYChief Operating OfficerBCom (Wits), BCompt (Hons) (Unisa), CA(SA)Born: 1972Mark completed his articles at PwC before joining Mercantile Bank’s corporate finance department. In 1999 he moved to the boutique advisory firm, Nucleus Corporate Finance, before joining Blue Label in 2001. Mark has played an integral role in the Group’s strategic and operational management and much of its expanding telecommunications footprint can be attributed to his vision and leadership. Mark is a member of SAICA and the Young Presidents Organisation.
Mark joined the BLT Board on its establishment in 2007. He also serves as a director of a state utility and sits on the boards of various Group companies.
9. DEAN SUNTUPFinancial DirectorBCom (Wits), Hons (Unisa), CA(SA)Born: 1977Dean completed his articles at PwC where he continued working after qualifying as a chartered accountant, assisting in the audits of various large corporations and multi-national companies. In 2003 he joined BSC Technologies, a business established by the Levy brothers, and later became its Financial Director. In 2005 he transferred to The Prepaid Company in the role of Financial Director. Dean is a member of SAICA.
Dean joined the Board on his appointment as Financial Director of BLT in 2013 and is a director of various other Group companies.
10. KEVIN ELLERINENon-Executive DirectorNational Diploma in Company AdministrationBorn: 1968Kevin joined the family business, Ellerine Holdings, in 1991. After serving in various roles, in 1993 he was appointed as property manager of Ellerine Bros. Proprietary Limited, rising to managing director of the property division in 2000, a position he still holds today. He sits on the boards of the property and private equity companies in which Ellerines is invested. Kevin’s all-round business skill and acumen contribute to Board and Committee deliberations of the Group.
Kevin is a director of various other companies, including some Group subsidiaries.
Proprietary Limited. He was also a member of the South African Pharmacy Council. Yusuf is one of the founder members of 3 C Telecommunications, Cellsaf and Cell C Proprietary Limited. He also serves as a director of Cigicell Proprietary Limited, a Group subsidiary.
6. BRETT LEVYJoint Chief Executive OfficerBorn: 1975Brett has an impressive entrepreneurial history having founded and operated many small businesses in the early 1990s. He has been involved across a wide range of industries, including the distribution of fast-moving consumer goods and insurance replacements for electronic goods. Brett’s business achievements have earned him a number of prestigious nominations, accolades and awards. These include the ABSA Bank Jewish Entrepreneur of the Year Award (2003) and the ABSA Jewish Business Achiever Non-Listed Company Award (2007), which he won jointly with his brother Mark. Brett was nominated as an Ernst & Young World Entrepreneur SA Finalist for 2007. In 2010 he received the Liberty Life Award for a Remarkable Success Story in the David Awards and was a finalist in the Top Young Entrepreneur category of the African Access National Business Awards. In 2011 he shared with Mark the Top Entrepreneur accolade in the African Access National Business Awards.
Brett joined the BLT Board on its establishment in 2007 and is a director of various local and global Group companies.
7. MARK LEVYJoint Chief Executive OfficerBCompt (Unisa)Born: 1971Mark graduated with a BCompt degree from Unisa in 1993. After some years as a commodities trader, he decided to pursue a goal of becoming an entrepreneur, which skill and strength he has applied over the past several years in spearheading Blue Label’s impressive organic and acquisitive growth and expansion in international markets. His business achievements are frequently recognised. Together with his brother Brett, Mark received the ABSA Jewish Business Achiever Non-Listed Company Award (2007). He was nominated as an Ernst & Young World Entrepreneur SA Finalist for 2007. In 2010 Mark was voted Top IT Personality of the year by ITWeb and was a finalist in the Top Young Entrepreneur category of the African Access National Business Awards. In 2011 he shared with Brett the Top Entrepreneur accolade in the African Access National Business Awards.
BOARD OF DIRECTORS CONTINUED

22
BLU
E L
AB
EL IN
TE
GR
AT
ED
AN
NU
AL R
EP
OR
T 2
01
5
SENIOR MANAGEMENT
NIEL BARNARDChief Executive Officer – Blue Label MobileBSc Information Technology (Unisa), MCSE
TANYA GROTAGroup Finance – Chief Technical Adviser
BCom (Hons) (Wits), CA(SA)
INGRID HINDLEYGroup Head of Human Resources
BSocSci (Hons) (Industrial Psychology) (Natal)
WALTER KLUCZNIKChief Financial Officer – SA Distribution
Chartered Accountant (Buenos Aires University, Argentina)
KIKon
MICHAEL CAMPBELLGroup Head of Investor and Media Relations
BProc, FCIS, AIAC, EMP (UCT)
ETIENNE DE VILLIERSGeneral Counsel
BA LLB (Natal)
ROB FLEMINGChief Marketing Officer
BCom (Rhodes University)

23
BLU
E L
AB
EL IN
TE
GR
AT
ED
AN
NU
AL R
EP
OR
T 2
01
5
SENIOR MANAGEMENT CONTINUED
JABU MOGANEDirector Sales and Marketing for Community Channels
ANDREW MURRAYChief Information OfficerBSc Eng (Wits)
LARRY POGIRExecutive Chairman – Blue Label Data SolutionsBCom (Unisa)
ARCHIE RANTAODirector of Sales Community ChannelsExecutive Development Programme (Unisa)
JANINE VAN EDENGroup Company SecretaryBProc LLB (RAU)
WERNER VAN REENENChief Executive Officer – SA DistributionBCom (Hons) (Marketing) (Unisa)
ANN NGWENYASenior Business Development ManagerBA International Relations (Northern Kentucky University), Public Relations Accreditation

24
BLU
E L
AB
EL IN
TE
GR
AT
ED
AN
NU
AL R
EP
OR
T 2
01
5
challenges, given the consolidating telco landscape resulting from regulatory changes.
During the course of the financial year we disposed of our minority shareholding in Ukash, contributing R37 million to pre-tax profit in this regard.
The Group once again achieved growth in its financial performance and returns to shareholders. Headline earnings per share increased 21% to 82.26 cents, on an EBITDA uplift of 37% to R1.08 billion. The increase in headline earnings was achieved through organic growth in the South African distribution segment and augmented by the acquisitions of RMCS and Viamedia. The growth in earnings was primarily attributable to increases in revenue of 14% and gross profit of 22%. Gross profit margins increased from 6.96% to 7.46%. Cash at year-end amounted to R788 million.
The Board approved ordinary dividend No 6 of 31 cents per share (2014: 27 cents per share), equating to a dividend cover of 2.62 times or pay-out ratio of 38% on HEPS.
Since the listing in 2007, the Company has achieved the following worthy milestones: • Gross profit margin has grown from 5.56%
to 7.46% in the current period; • Revenue has grown from R13 billion to
R22 billion; • Identification and introduction of additional
product categories besides prepaid airtime,
CHAIRMAN’S REPORT
Larry NestadtChairman
“We continue delivering on our vision of being a leading distributor of secure e-tokens of value and other transactional services in emerging markets …”
DEAR STAKEHOLDERSIt has been 14 years since Blue Label commenced commercialising the Levy brothers’ entrepreneurial vision of offering prepaid airtime and other related services to the mass market in South Africa. Through our sophisticated and proprietary technology, the business model now embraces a vast network of POS devices, delivering both physical and virtual goods and services across South Africa, India and Mexico.
A key to the success of the Group has been the strong relationships that it has established with both its suppliers and customers.
In delivering on the Group’s stated strategy, this year we further diversified our range of products and services, through entrenching the new product lines of ticketing and prepaid water, as well as integrating the most recent acquisitions, RMCS and Viamedia. Our retail strategy progressed with the establishment of the Edgars Connect brand of standalone stores.
Oxigen Services India continues to benefit from the exponential growth in India’s e-commerce platforms, affirming its strategic decision to enter into the financial services arena.
Although Blue Label Mexico incurred losses, it continues to expand its distribution footprint of POS devices and is steadily benefiting from its election to become a multi-carrier. It has experienced several
h ll i t
Larry NestadtChairman
“We codeliverivision oleadingsecure evalue atransacin emermarket
DEAR STAKEHOLDERS
25
BLU
E L
AB
EL IN
TE
GR
AT
ED
AN
NU
AL R
EP
OR
T 2
01
5
starter packs and data, such as prepaid electricity, water, ticketing and a variety of financial services;
• Total dividends paid to shareholders, including dividend No 6, amount to R0.9 billion; and
• R392.2 million returned to shareholders via a 12% share buyback in 2011.
Our pipeline of corporate action remains active. In delivering on our stated M&A strategy, we consider acquisitions that are earnings enhancing, add to our product line, distribution network or geography and which are of a strategic or defensive benefit.
In September 2014, the Board received an unsolicited written expression of interest to acquire 100% of the Group. Over the ensuing months it became apparent that the potential acquirer was not advancing its proposal timeously and by mutual agreement, the engagement terminated in December 2014.
Since early 2011 we have regularly reported on the litigation proceedings surrounding the cancellation by Telkom SA SOC Limited of the Multi-Links contract in Nigeria. In December 2014 the Chairman of Telkom and I jointly announced our agreement to resolve the disputes on the basis that all claims, counterclaims and allegations would be withdrawn, with each party responsible for payment of its own costs. I am pleased that we resolved the dispute on an amicable basis.
Through the Social, Ethics and Transformation Committee, expenditure on uplifting communities reached R5.3 million for the year. The spend was mainly directed towards co-founding a new initiative, being the construction and operation of the Protea Glen Boys & Girls Clubs, which offers after school care and extramural activities to the local disadvantaged community. In addition, we provide ongoing support for expanding the parkrun SA franchise, promoting grassroots running, with a quarter of a million members registered to date.
Our journey of reporting on financial risks, performance and opportunities as well as many non-financial parameters, steadily progresses. As we mature, we understand the need to balance our levels of disclosure, while recognising areas of market and price sensitivity.
Looking ahead, South African Distribution is expected to gain further momentum from its enhanced bouquet of products, including mobile handsets and tablets. Edgars Connect, with its increasing number of standalone stores, is an ideal
CHAIRMAN’S REPORT CONTINUED
avenue for the retailing of cellular products and services, hardware and accessories requiring SIM connection. Sales of prepaid water tokens are also expected to gain momentum. Ticketing by TicketPro continues to increase its range of ticketing and access control services and solutions. Its technology offering and distribution reach affords it a competitive edge as it steadily grows its market share. A planned domestic and international money transfer solution will enhance the Group’s offerings in the financial services sector.
On the international front, the Group expects a significant increase in revenue streams at Oxigen Services India due to its shift to financial services and new proprietary micro-ATM roll-outs. At Blue Label Mexico, the distribution of additional products and services, over layered by improving revenues from the existing products, positions the business well in its drive towards reaching profitability.
After nearly eight years of service to the Board, Neil Lazarus SC, resigned on 27 January 2015 in order to pursue other business opportunities. Neil joined the Board as a non-executive director at the time of our JSE listing in 2007. He actively participated at Board and Committee levels and made exceptional contributions in supporting the Group’s governance, legal and corporate finance functions. On 18 August 2015, we welcomed Yusuf Mahomed as an independent non-executive director to the Board and we look forward to engaging in a long and valuable working relationship with him. He brings a wealth of cellular industry experience as a long-standing board member of Cell C and a founder director of 3 C Telecommunications.
I wish to thank my fellow Directors, the management team led by Brett Levy and Mark Levy, all employees and other stakeholders for their support over the past year.
Larry Nestadt
Chairman
23 October 2015
26
BLU
E L
AB
EL IN
TE
GR
AT
ED
AN
NU
AL R
EP
OR
T 2
01
5
South African business model, we operate in India
and Mexico.
Blue Label is a lifestyle enabler. Through the
deployment of a myriad of different types of touch
points, we deliver products and services in an
effective and efficient manner, allowing consumers
to transact when and where they choose. We
facilitate convenient and suitable payment types –
be it cash, EFT, debit and credit cards.
Blue Label has built a virtual railroad with our
proprietary platforms, comprising AEON, Postilion
and AMS as the enabling carrier for transactions,
which in this analogy are the tracks and locomotive.
Each additional product is another carriage on the
locomotive. Incremental costs are minimal, because
the heavy lifting to establish the distribution
network is already in place, which results in profit
CONVERSATION WITH JOINT CHIEF EXECUTIVE OFFICERS
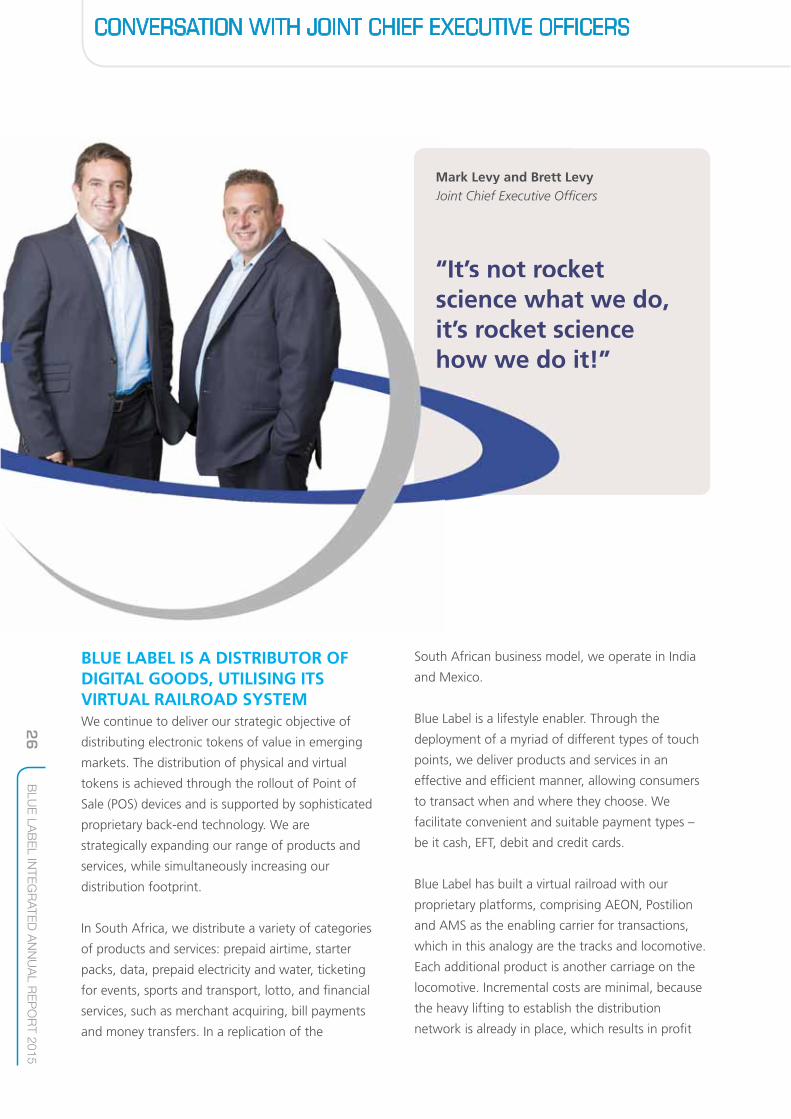
Mark Levy and Brett LevyJoint Chief Executive Officers
“It’s not rocket science what we do, it’s rocket science how we do it!”
BLUE LABEL IS A DISTRIBUTOR OF DIGITAL GOODS, UTILISING ITS VIRTUAL RAILROAD SYSTEMWe continue to deliver our strategic objective of
distributing electronic tokens of value in emerging
markets. The distribution of physical and virtual
tokens is achieved through the rollout of Point of
Sale (POS) devices and is supported by sophisticated
proprietary back-end technology. We are
strategically expanding our range of products and
services, while simultaneously increasing our
distribution footprint.
In South Africa, we distribute a variety of categories
of products and services: prepaid airtime, starter
packs, data, prepaid electricity and water, ticketing
for events, sports and transport, lotto, and financial
services, such as merchant acquiring, bill payments
and money transfers. In a replication of the
Mark Levy and Brett LJoint Chief Executive Offi
“It’s not rockscience whait’s rocket schow we do
27
BLU
E L
AB
EL IN
TE
GR
AT
ED
AN
NU
AL R
EP
OR
T 2
01
5
CONVERSATION WITH JOINT CHIEF EXECUTIVE OFFICERS CONTINUED
margins filtering straight through to the bottom line.
The speed of launching and delivering new products
is unparalleled.
The importance of distribution is that the operator
of the last mile of the channel determines
merchandising techniques and pricing, as the POS
terminal is located in the last mile of the channel.
HOW WE OPERATE The business model is based on strategic
partnerships, underpinned by long-term contracts.
Operations are grouped into four main business
segments: South African Distribution, International
Distribution, Mobile and Solutions. The South
African segment remains the predominant
contributor to the Group’s profitability, derived
mainly from the prepaid airtime, starter packs, data
and the electricity businesses. The strategy of the
International segment is to pursue growth
opportunities across our global footprint, presently
though an associate in India and a joint venture
in Mexico.
Income is derived from three main pillars: the sales
of commodities (such as airtime, electricity, water
and tickets), annuity transactions (from our SIM
card base, contractual Vodacom starter packs,
location-based services and other subscription
services) and interest earned on surplus
cash generated.
The commission structure is based on long-term
contracts with the network operators, covering
payment terms, annuity and commissions receivable.
The commissions received are shared with
merchants in the distribution channel.
THE EVOLVING TELECOMS LANDSCAPEThere are a number of trends evolving in the
industry worldwide, which influence our strategy
and our operations.
South Africa: The emphasis on voice
communication is rapidly moving to m-commerce as
trends in data consumption increase. We do not
differentiate when selling airtime, be it for voice or
data consumption.
The growth of data will be infinite, as more and
more data or content becomes available and is
downloadable 24/7, exceeding consumer time spent
on voice. Blue Label, as a South African distributor,
has enviable lines of sight into a number of sectors,
such as banking, retail, consumer and
telecommunications.
We observe a changing landscape: • telcos are becoming banks – with money
transfers, while banks are becoming telcos –
through aligning with MVNOs, • competitive pricing among the MNOs, • consolidation through M&A activities –
infrastructure, co-location and radio access
sharing among the networks – spurred by the
realisation of the costs involved in upgrading
4G to 5G connectivity, • margin compression due to this competitive
pricing and consolidation, • the rise in the economic status of internet
enabled millennials (people born after 1980), • the exponential availability of inexpensive smart
phones, as the growth in mobile data,
e-commerce and m-commerce continues
to outstrip that of voice, and • the intensified interest in South Africa as
a destination by international mobile
phone producers.
The focus of the MNOs is forever evolving. In 2003
their goal was to maximise the number of base
stations in service. Soon thereafter followed the
chase for subscription numbers, which led to
massive penetration of users and which now
touches 144% of South Africa’s population, on
inclusion of multiple SIM cards per user. Around

28
BLU
E L
AB
EL IN
TE
GR
AT
ED
AN
NU
AL R
EP
OR
T 2
01
5
nature of and the methods in which we sell and
distribute our products and services, we find
ourselves acting as an agent more often than not.
This results in only the commission earned and not
the face value of the sale being included in revenue.
These products and services include electricity, ticket
sales and PINless products. If the gross value of
PINless products were to be included in the revenue
line, Group revenue would have effectively increased
by 17% as opposed to 13%.
Revenue increased by 13% to R22 billion and was
achieved organically and through contributions
made through the acquisitions of RMCS and
Viamedia. Gross profit increased by 22% to
R1.64 billion supported by margin increases from
6.96% to 7.46%.
Our financial position remains robust and liquid,
with accumulated equity increasing to R3.9 billion,
net of accumulated dividends paid to date totalling
R704 million. Net asset value equated to R5.79 per
share. Operations continue to generate strong levels
of cash, enabling the group to deliver its strategy, as
well as to conclude strategic acquisitions and to
declare dividends to shareholders.
DEEPENING OUR PRODUCT RANGETicketPro is South Africa’s second largest ticketing
solution for transport and events, such as sports,
entertainment, concerts, lifestyle shows and expos.
TicketPro’s focus this year included increasing its
market share, gaining brand recognition and striving
for market differentiation, through product and
technology innovation.
Prepaid water: In taking product to the population,
we are replicating the successful prepaid electricity
model in the distribution of prepaid water e-tokens.
In this regard, there is continued dialogue between
ourselves, municipalities, water boards, water meter
suppliers and service providers, township developers,
closed communities and other special interest
groups, with a view to maximising on this vast
2014, the MNOs recognised the importance of
introducing product and service distribution into the
distribution channel. The importance to the Group
is that we manage the last mile of the distribution
channel as well as the products and services that
are introduced.
India has a population of about 1.3 billion people,
of which approximately 65% are unbanked. The
new government continues to create a positive
economic environment, with the Reserve Bank of
India driving its financial inclusion programme.
Oxigen Services India continues to benefit from the
country’s exponential growth in e-commerce and
m-commerce, as the business capitalises on its
strategic shift into financial services. In this dynamic
market, recent M&A deals have reinforced the value
of Oxigen’s distribution network and banking
enabled infrastructure.
Mexico has a mobile phone penetration of around
67% in a market serving a population of
approximately 121 million.
Structural and fiscal reforms have resulted in
increasing competition among the networks. In
September 2014 Blue Label Mexico implemented a
strategic decision to become a multi-carrier – for all
networks. Although this initially came at a cost, as
the dominant player immediately reduced
commissions, which resulted in an exacerbation of
losses, it has taken us approximately nine months to
recover. Only recently has the reduction been more
than offset by an increase in both terminal activity
and commissions earned from the other carriers.
Our stated game plan is heading in the right
direction to yield some of the anticipated returns
in order to mitigate future losses.
MEASURING OUR PERFORMANCE We do not gauge revenue as our only measure of
performance. We believe growth should also be
measured by gross profit achieved. Due to the
CONVERSATION WITH JOINT CHIEF EXECUTIVE OFFICERS CONTINUED
29
BLU
E L
AB
EL IN
TE
GR
AT
ED
AN
NU
AL R
EP
OR
T 2
01
5
CONVERSATION WITH JOINT CHIEF EXECUTIVE OFFICERS CONTINUED
Acquisitive and organic growth enables us to
consolidate and optimise various technology
landscapes, as well as share technology skills,
know-how and resources, locally and across our
international operations.
We have embarked on implementing a Group-wide
Information Security Management System in order
to enhance current governance, compliance and
security processes. This also takes cognisance of
relevant changes in legislation, such as POPI
and CPA.
ENTREPRENEURS IN THE CORPORATE ENVIRONMENTAs entrepreneurs operating in a mainstream
business environment, we continue striving to retain
and instil our “can-do” ethos and creative culture
across the Group: • our achievements in building the Group are
unique, • the Blue Label Values (see page 3) were selected
and ranked by the staff. We celebrate
achievements by embodying our values in a
charter that ensures their longevity in our
working culture, and • when launching new products and services, we
consider the needs of the consumer and then
take a 5-P approach: preparation, product and
packaging, pricing, public relations & promotion,
and position in market.
We believe that entrepreneurs and entrepreneurial
spirit are ageless, timeless and tenacious.
Brett Levy Mark Levy
Joint Chief Executive Officers
23 October 2015
potential. We have a long runway ahead as
awareness campaigning continues, while meters and
technology at municipalities are upgraded. It is clear
that our proprietary technology is a differentiator in
this market.
RETAIL STRATEGY IS UNFOLDINGThe Group continues to capitalise on its existing
base by identifying opportunities to further the
footprint in the formal retail sector in South Africa.
In 2014 the acquisition of RMCS afforded us access
to new distribution channels for the sale of both
RMCS and the Group’s ranges of products and
services, principally to the Edcon Group.
This year, in a strategic partnership with the Edcon
Group, we established the Edgars Connect
stand-alone stores. Edgars Connect retails cellular
products and services, hardware and accessories and
any products requiring a SIM connection. Its focus is
towards serving the “Internet of Things”.
STRENGTHENING OUR FOCUS ON MARKETING We are evolving our marketing approach to ensure
that we deliver technology, products and services
which are required by our merchants and
consumers. Extensive research and perception
studies assist us in identifying new opportunities in
order to entrench our distribution footprint in formal
retail, independent, petroleum forecourts, corporate
or low-cost device channels. These results enable us
to develop tailored service offerings to merchants
and consumers, leveraging our unique strengths to
do so.
TECHNOLOGY IS THE CORNERSTONE OF THE BUSINESS We have established that successful product
launches are underpinned by strong distribution
capabilities, especially ones that can cater for
ever-changing levels of sophistication in modern
products and services. We continue investing in
technology to ensure our distribution platforms
perform optimally across the Group.

30
BLU
E L
AB
EL IN
TE
GR
AT
ED
AN
NU
AL R
EP
OR
T 2
01
5
FINANCIAL DIRECTOR’S REPORT
Dean SuntupFinancial Director
“The increase in headline earnings was achieved through organic growth in the South African Distribution segment, assisted by the acquisitions of Retail Mobile Credit Specialists Proprietary Limited and Viamedia Proprietary Limited.”
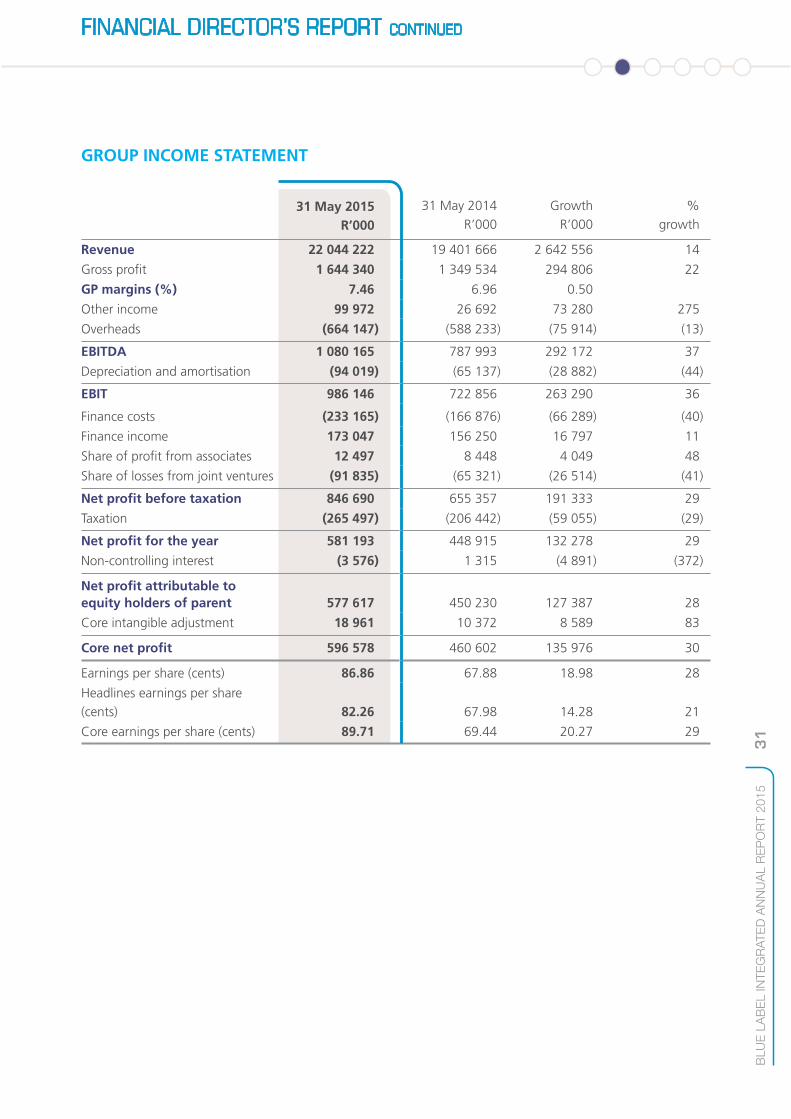
FINANCIAL REVIEWHeadline earnings per share increased by 21% to 82.26 cents, net of the Group’s share of losses of R85 million in Blue Label Mexico which equated to 12.82 cents per share. The remaining businesses within the Group contributed 95.08 cents to headline earnings per share.
The growth in earnings was primarily attributable to increases in revenue of 14%, gross profit of 22% and EBITDA of 37%. Gross profit margins increased from 6.96% to 7.46%. Organic growth was achieved through the expansion of the Group’s bouquet of offerings to its escalating multitude of distribution channels.
Core earnings, which increased by 30% to R597 million, represent the earnings of the Group after adjusting for the amortisation of intangible assets net of taxation and non-controlling interests as a consequence of purchase price allocations in terms of IFRS 3(R): Business Combinations. Core earnings reflect the underlying financial performance of the Group.
The statement of financial position remains robust and liquid, with accumulated equity increasing to R3.9 billion, net of accumulated dividends paid to date totalling R704 million. Net asset value equated to R5.79 per share.
Dean SuFinancia
“Theheadachiorgathe SDistassisacquMobSpecLimiProp
FINANCIAL REVIEW Core ea
31
BLU
E L
AB
EL IN
TE
GR
AT
ED
AN
NU
AL R
EP
OR
T 2
01
5
FINANCIAL DIRECTOR’S REPORT CONTINUED
GROUP INCOME STATEMENT
31 May 2014R’000
GrowthR’000
% growth
Revenue 22 044 222 19 401 666 2 642 556 14
Gross profit 1 644 340 1 349 534 294 806 22
GP margins (%) 7.46 6.96 0.50
Other income 99 972 26 692 73 280 275
Overheads (664 147) (588 233) (75 914) (13)
EBITDA 1 080 165 787 993 292 172 37
Depreciation and amortisation (94 019) (65 137) (28 882) (44)
EBIT 986 146 722 856 263 290 36
Finance costs (233 165) (166 876) (66 289) (40)
Finance income 173 047 156 250 16 797 11
Share of profit from associates 12 497 8 448 4 049 48
Share of losses from joint ventures (91 835) (65 321) (26 514) (41)
Net profit before taxation 846 690 655 357 191 333 29
Taxation (265 497) (206 442) (59 055) (29)
Net profit for the year 581 193 448 915 132 278 29
Non-controlling interest (3 576) 1 315 (4 891) (372)
Net profit attributable to equity holders of parent 577 617 450 230 127 387 28
Core intangible adjustment 18 961 10 372 8 589 83
Core net profit 596 578 460 602 135 976 30
Earnings per share (cents) 86.86 67.88 18.98 28
Headlines earnings per share (cents) 82.26 67.98 14.28 21
Core earnings per share (cents) 89.71 69.44 20.27 29
31 May 2015R’000
32
BLU
E L
AB
EL IN
TE
GR
AT
ED
AN
NU
AL R
EP
OR
T 2
01
5
FINANCIAL DIRECTOR’S REPORT CONTINUED
REVENUERevenue increased by R2.6 billion to R22 billion, a growth of 14%. This growth was predominantly achieved through access to additional channels of distribution. This revenue does not include the turnover of international operations, as these associate and joint venture companies are equity accounted for only.
The vending of “PINless top-ups” continues to gain momentum. Only the gross profit earned thereon is accounted for in Group revenue as opposed to the gross sales generated from transactions of this nature. The gross sales increased by R966 million from R1.7 billion to R2.7 billion, equating to an effective increase of 17% as opposed to the 14% revenue growth reported.
GROSS PROFITGross profit increased by R295 million (22%), congruent with the increase in revenue and margin increases.
The increase in gross profit margins from 6.96% to 7.46% was primarily achieved through the application of cash resources to bulk inventory purchases at favourable discounts, early settlement discounts, growth in the gross profit earned on “PINless top-ups”, compounding annuity income and an increase in commissions earned on the distribution of prepaid electricity.
OVERHEADSOverheads comprising employee costs and operating expenses amounted to R664 million, equating to an increase of R76 million (13%). This increase was entirely attributable to employee costs, mainly due to a hybrid of the forfeiture of executive bonuses in the prior year, payroll attributable to the acquisitions of RMCS and Viamedia and annual increases.
EBITDAEBITDA increased by R292 million to R1.08 billion, equating to a growth of 37%. Included in this growth was an amount of R37 million relating to the disposal of the Group’s interest in Ukash.
DEPRECIATION, AMORTISATION AND IMPAIRMENT CHARGESDepreciation, amortisation and impairment charges increased by R29 million of which R16 million emanated from the acquisitions of RMCS and Viamedia. Of this amount, R13 million pertained to the purchase price allocation amortisation of intangibles.
FINANCE COSTSFinance costs totalled R233 million, of which R68 million related to interest paid on borrowed funds and R165 million to imputed IFRS interest adjustments on credit received from suppliers. On a comparative basis, interest paid on borrowed funds amounted to R23 million and the imputed IFRS interest adjustment equated to R144 million. Interest paid on borrowed funds was attributable to the cost of financing bulk inventory purchase transactions and early settlement payments attracting discounts, for which facilities were utilised and repaid during the current year.
FINANCE INCOMEFinance income totalled R173 million, of which R31 million was attributable to interest received on cash resources and R142 million to imputed IFRS interest adjustments. On a comparative basis, interest received on cash resources amounted to R39 million and the imputed IFRS interest adjustment to R117 million. The decline in interest received on cash resources was attributable to the utilisation of funds on hand for the payment of dividends, acquisitions, bulk inventory purchase transactions and early settlement discounts.
SHARE OF PROFITS FROM ASSOCIATESThe predominant contributors to a net share of profits of R12.5 million were Ukash and Oxigen Services India.
SHARE OF LOSSES FROM JOINT VENTUREThe Group’s share of losses was mainly attributable to the losses incurred in Blue Label Mexico.
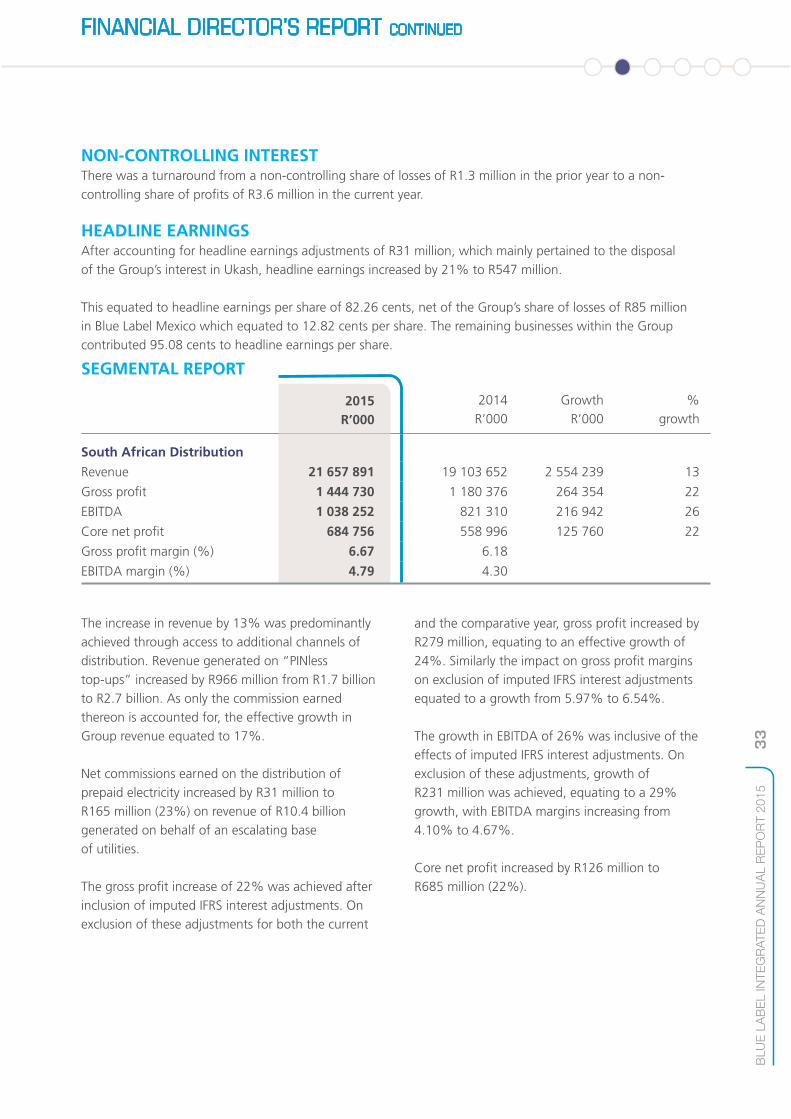
33
BLU
E L
AB
EL IN
TE
GR
AT
ED
AN
NU
AL R
EP
OR
T 2
01
5
FINANCIAL DIRECTOR’S REPORT CONTINUED
NON-CONTROLLING INTERESTThere was a turnaround from a non-controlling share of losses of R1.3 million in the prior year to a non-controlling share of profits of R3.6 million in the current year.
HEADLINE EARNINGSAfter accounting for headline earnings adjustments of R31 million, which mainly pertained to the disposal of the Group’s interest in Ukash, headline earnings increased by 21% to R547 million.
This equated to headline earnings per share of 82.26 cents, net of the Group’s share of losses of R85 million in Blue Label Mexico which equated to 12.82 cents per share. The remaining businesses within the Group contributed 95.08 cents to headline earnings per share.
SEGMENTAL REPORT
2014 R’000
Growth R’000
% growth
South African Distribution
Revenue 21 657 891 19 103 652 2 554 239 13
Gross profit 1 444 730 1 180 376 264 354 22
EBITDA 1 038 252 821 310 216 942 26
Core net profit 684 756 558 996 125 760 22
Gross profit margin (%) 6.67 6.18
EBITDA margin (%) 4.79 4.30
2015R’000
The increase in revenue by 13% was predominantly achieved through access to additional channels of distribution. Revenue generated on “PINless top-ups” increased by R966 million from R1.7 billion to R2.7 billion. As only the commission earned thereon is accounted for, the effective growth in Group revenue equated to 17%.
Net commissions earned on the distribution of prepaid electricity increased by R31 million to R165 million (23%) on revenue of R10.4 billion generated on behalf of an escalating base of utilities.
The gross profit increase of 22% was achieved after inclusion of imputed IFRS interest adjustments. On exclusion of these adjustments for both the current
and the comparative year, gross profit increased by R279 million, equating to an effective growth of 24%. Similarly the impact on gross profit margins on exclusion of imputed IFRS interest adjustments equated to a growth from 5.97% to 6.54%.
The growth in EBITDA of 26% was inclusive of the effects of imputed IFRS interest adjustments. On exclusion of these adjustments, growth of R231 million was achieved, equating to a 29% growth, with EBITDA margins increasing from 4.10% to 4.67%.
Core net profit increased by R126 million to R685 million (22%).

34
BLU
E L
AB
EL IN
TE
GR
AT
ED
AN
NU
AL R
EP
OR
T 2
01
5
FINANCIAL DIRECTOR’S REPORT CONTINUED
The benefits of Oxigen Services India’s defined strategy of becoming India’s first non-banked mobile wallet that empowers the unbanked masses to instantly transfer and receive cash across the entire country continues to gain momentum. This has been primarily due to its focus on money transfer services without detracting from its traditional airtime sales.
Daily money transfer deposits have increased from USD2.3 million per day as at 31 May 2014 to USD3.3 million per day as at 31 May 2015, this increased exponentially through its connectivity with the National Payment Corporation of India.
Blue Label MexicoIn the comparative year, Blue Label Mexico incurred losses of R131 million. The Group’s share thereof equated to R61 million after the amortisation of intangible assets. In the current year, Blue Label Mexico’s losses increased to an equivalent of R186 million, of which the Group’s share equated to R89 million.
In spite of revenue increasing by 23%, the main reasons for further losses were attributable to continued margin compression and an increase in overhead costs. The increase in overheads was necessitated by the need for enhanced post-sale customer support as well as systems fortification.
2014 R’000
Growth R’000
% growth
International Distribution
EBITDA 35 379 (13 961) 49 340 353
Share of (losses)/profits from associates and joint ventures (81 269) (56 249) (25 020) (44)
– Ukash 12 004 14 089 (2 085) (15)
– Oxigen Services India 2 619 (3 259) 5 878 180
– Blue Label Mexico (88 508) (60 844) (27 664) (45)
– Other (7 384) (6 235) (1 149) (18)
Core net loss (54 646) (59 987) 5 341 9
– Equity holders of the parent (46 958) (47 862) 904 2
– Non-controlling interests (7 688) (12 125) 4 437 37
2015R’000
The Group disposed of its interest in Ukash at the end of March 2015. This profit on disposal increased EBITDA by R37 million. The balance of the growth was attributable to a decline in expenditure incurred by Africa Prepaid Services Nigeria (APSN). Legal fees declined from R20.9 million to R9.4 million. These costs will not perpetuate as litigation matters have been settled.
The share of net losses from associates and joint ventures comprised the following:
UkashThe Group’s share of profits in Ukash, after the amortisation of intangible assets, declined by 15% from R14 million to R12 million. This decline was attributable to the Group having sold its interest in Ukash after 10 months of trading in the current financial year.
Oxigen Services IndiaThere was a turnaround of the Group’s share of losses of R3.3 million in the comparative year to a share of profits equating to R2.6 million in the current year, after the amortisation of intangible assets. This positive turnaround was attributable to increases in revenue by 15% and gross profit by 21%, reported in their local currency.
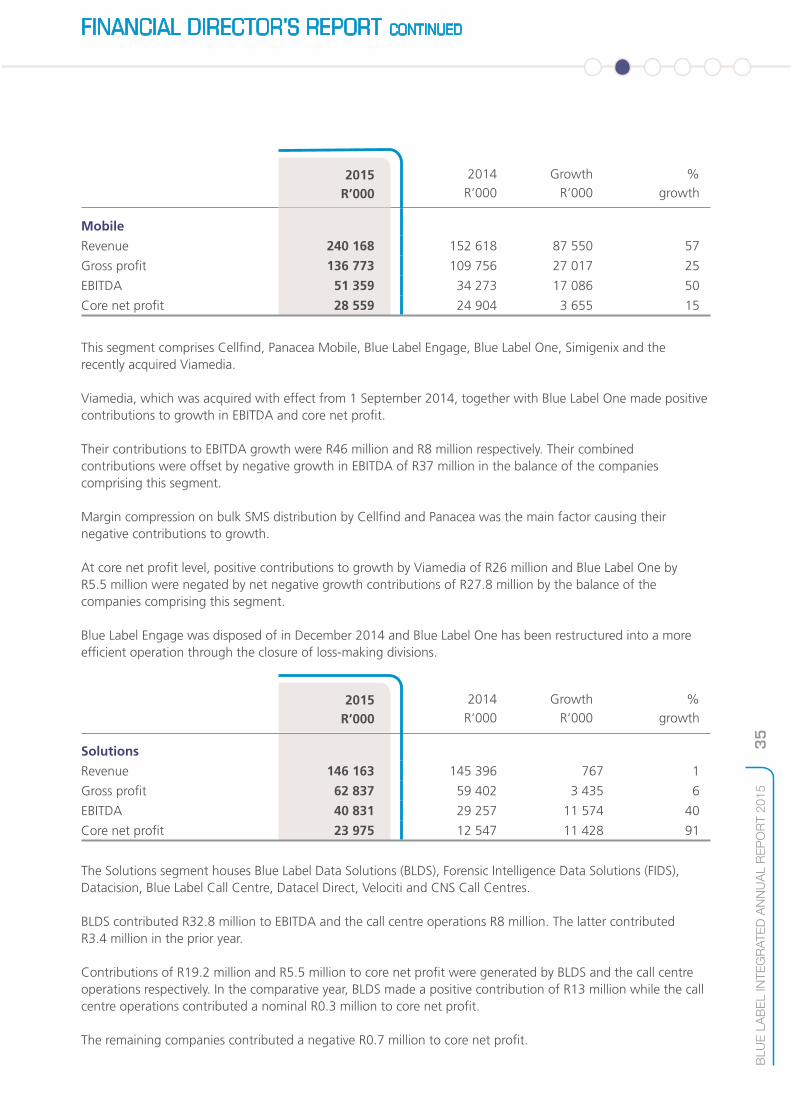
35
BLU
E L
AB
EL IN
TE
GR
AT
ED
AN
NU
AL R
EP
OR
T 2
01
5
FINANCIAL DIRECTOR’S REPORT CONTINUED
2014 R’000
Growth R’000
% growth
Mobile
Revenue 240 168 152 618 87 550 57
Gross profit 136 773 109 756 27 017 25
EBITDA 51 359 34 273 17 086 50
Core net profit 28 559 24 904 3 655 15
This segment comprises Cellfind, Panacea Mobile, Blue Label Engage, Blue Label One, Simigenix and the recently acquired Viamedia.
Viamedia, which was acquired with effect from 1 September 2014, together with Blue Label One made positive contributions to growth in EBITDA and core net profit.
Their contributions to EBITDA growth were R46 million and R8 million respectively. Their combined contributions were offset by negative growth in EBITDA of R37 million in the balance of the companies comprising this segment.
Margin compression on bulk SMS distribution by Cellfind and Panacea was the main factor causing their negative contributions to growth.
At core net profit level, positive contributions to growth by Viamedia of R26 million and Blue Label One by R5.5 million were negated by net negative growth contributions of R27.8 million by the balance of the companies comprising this segment.
Blue Label Engage was disposed of in December 2014 and Blue Label One has been restructured into a more efficient operation through the closure of loss-making divisions.
2014 R’000
Growth R’000
% growth
Solutions
Revenue 146 163 145 396 767 1
Gross profit 62 837 59 402 3 435 6
EBITDA 40 831 29 257 11 574 40
Core net profit 23 975 12 547 11 428 91
The Solutions segment houses Blue Label Data Solutions (BLDS), Forensic Intelligence Data Solutions (FIDS), Datacision, Blue Label Call Centre, Datacel Direct, Velociti and CNS Call Centres.
BLDS contributed R32.8 million to EBITDA and the call centre operations R8 million. The latter contributed R3.4 million in the prior year.
Contributions of R19.2 million and R5.5 million to core net profit were generated by BLDS and the call centre operations respectively. In the comparative year, BLDS made a positive contribution of R13 million while the call centre operations contributed a nominal R0.3 million to core net profit.
The remaining companies contributed a negative R0.7 million to core net profit.
2015R’000
2015R’000

36
BLU
E L
AB
EL IN
TE
GR
AT
ED
AN
NU
AL R
EP
OR
T 2
01
5
FINANCIAL DIRECTOR’S REPORT CONTINUED
2014 R’000
Growth R’000
% growth
Corporate
EBITDA (85 656) (82 886) (2 770) (3)
Core net loss (93 754) (87 983) (5 771) (7)
2015R’000
The increases in negative EBITDA and core net loss were primarily attributable to bonuses granted to senior executives who did not receive bonuses in the prior year, partially offset by a once-off income receipt.
STATEMENT OF FINANCIAL POSITION Total assets increased by R524 million to R7 billion, of which growth in non-current assets accounted for R242 million and current assets for R282 million.
The net increase in non-current assets was mainly attributable to a net growth in intangible assets and goodwill totalling R249 million, to capital expenditure net of depreciation of R9 million and to loans receivable of R11 million. These increases were offset by a net decline in investment in associates and joint ventures of R50 million.
The net increase in intangible assets and goodwill mainly pertained to the acquisition of Viamedia, in which goodwill equated to R186 million and intangibles R63 million. A further R125 million was incurred for the purchase of software, development costs, starter pack bases and distribution channels. Amortisation of intangibles amounted to R122 million.
The net decline in investment in associates and joint ventures was predominantly due to the disposal of the Group’s interest in Ukash amounting to R94 million, a share of net losses of R79 million and a negative impact of R10 million in foreign currency translation reserves. These declines were offset by an additional R50 million capital contribution to Blue Label Mexico and a contingent purchase consideration of R30 million for the acquisition of an effective 37.5% shareholding in the Supa Pesa group. Movements in loans equated to a further R53 million, comprising loans granted of
R13 million, interest capitalised of R14 million and unrealised foreign exchange gains of R26 million.
The net increase in current assets mainly comprised an increase in accounts receivable of R530 million and an increase in inventories of R127 million in line with bulk inventory purchases. Cash resources declined by R396 million congruent with the application of cash to fund the increase in assets and payment of dividends.
In spite of an increase in inventory of R127 million, the stock turn improved from 35 days reported at the interim reporting date to 26 days at year-end. The discount afforded on bulk inventory purchases justified the quantum of inventory held.
The debtor’s collection period increased from 44 days reported at the interim reporting date to 46 days at year-end.
The net profit attributable to equity holders of R578 million, less a dividend of R182 million, resulted in retained earnings accumulating to R2.6 billion.
Trade and other payables increased by R105 million with credit terms averaging 53 days.
STATEMENT OF CASH FLOWSCash flows from operating activities amounted to R132 million net of the funding of additional working capital requirements of R657 million.
Cash flows applied to investing activities amounted to R329 million. Of this amount R50 million related to the additional investment in Blue Label Mexico, R13 million to loans to associates, R157 million to the acquisition of Viamedia, R125 million to the purchase of intangible assets, R10 million to net

37
BLU
E L
AB
EL IN
TE
GR
AT
ED
AN
NU
AL R
EP
OR
T 2
01
5
FINANCIAL DIRECTOR’S REPORT CONTINUED
loans granted, R53 million to capital expenditure and R20 million to the settlement of contingent purchase considerations for RMCS and Panacea Mobile. The above funds applied to investing activities were partially offset by proceeds received of R95 million on the disposal of Ukash.
After applying R19 million to the acquisition of treasury shares and a dividend payment of R187 million to shareholders and non-controlling interests, the balance of cash on hand amounted to R788 million.
Although cash on hand declined by R402 million, inventory of R1.4 billion is a highly liquid commodity.
FORFEITABLE SHARE SCHEME Forfeitable shares totalling 2 937 836 (2014: 2 782 541) were issued to qualifying employees. During the period 419 998 (2014: 1 074 880) shares were forfeited and 3 819 409 (2014: 3 629 922) shares vested.
DIVIDEND NUMBER 6 The Group’s current dividend policy is to declare an annual dividend. On 18 August 2015, the board approved a gross ordinary dividend (number 6) of 31 cents per ordinary share (26.35 cents per ordinary share net of dividend withholding tax) for the year ended 31 May 2015. This dividend of R209 097 803, inclusive of withholding tax, equates to a 2.62 cover on headline earnings. The dividend for the year ended 31 May 2015 has not been recognised in the financial statements as it was declared after this date.
LITIGATION UPDATE The arbitration proceedings between APSN and the former subsidiary of Telkom SA SOC Limited (Telkom), Multi-Links Telecommunications Limited (Multi-Links) have been settled.
The litigation action in the High Court of South Africa between Telkom and Multi-Links, on the one hand, and Blue Label, Africa Prepaid Services, APSN and certain individuals, on the other, has been settled.
In terms of the settlement agreement all claims and counterclaims have been withdrawn and all of the parties have agreed that they will have no further claims against one another arising out of the disputes forming the subject of both the arbitration proceedings and the action, including any claims for costs.
APPRECIATION I wish to express my gratitude to the Group’s finance team for their professional input and dedication.
Dean SuntupFinancial Director
23 October 2015
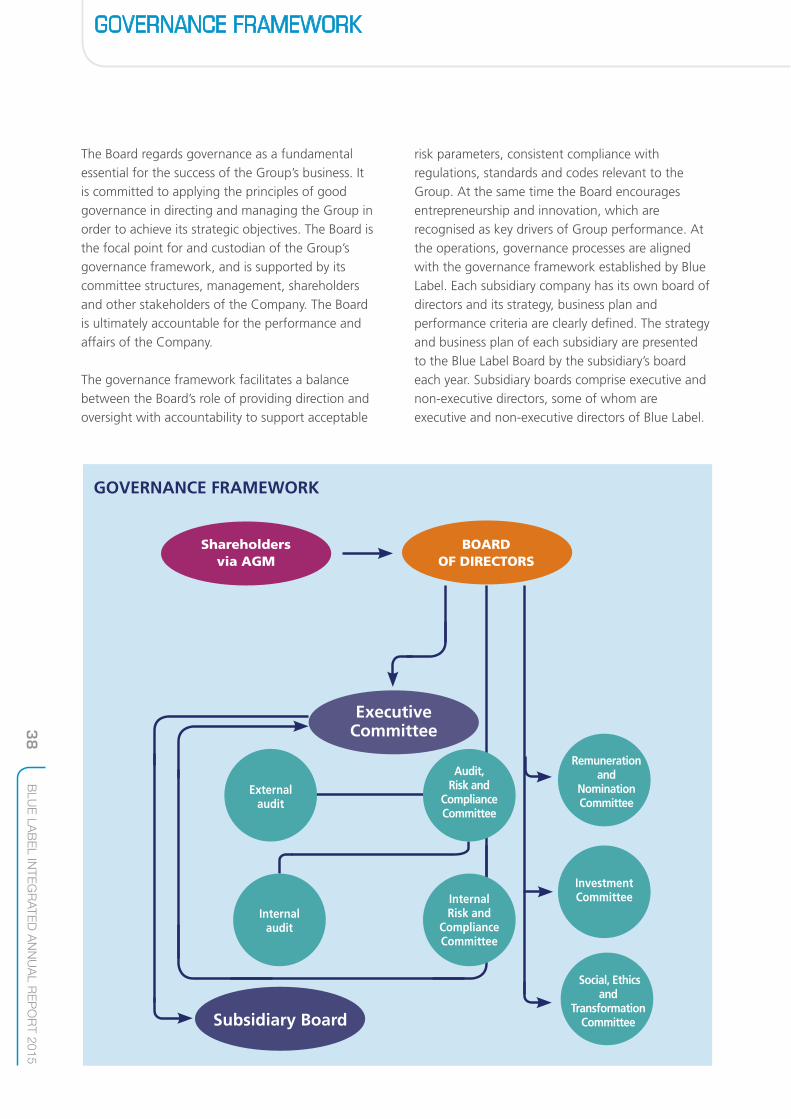
38
BLU
E L
AB
EL IN
TE
GR
AT
ED
AN
NU
AL R
EP
OR
T 2
01
5
The Board regards governance as a fundamental essential for the success of the Group’s business. It is committed to applying the principles of good governance in directing and managing the Group in order to achieve its strategic objectives. The Board is the focal point for and custodian of the Group’s governance framework, and is supported by its committee structures, management, shareholders and other stakeholders of the Company. The Board is ultimately accountable for the performance and affairs of the Company.
The governance framework facilitates a balance between the Board’s role of providing direction and oversight with accountability to support acceptable
risk parameters, consistent compliance with regulations, standards and codes relevant to the Group. At the same time the Board encourages entrepreneurship and innovation, which are recognised as key drivers of Group performance. At the operations, governance processes are aligned with the governance framework established by Blue Label. Each subsidiary company has its own board of directors and its strategy, business plan and performance criteria are clearly defined. The strategy and business plan of each subsidiary are presented to the Blue Label Board by the subsidiary’s board each year. Subsidiary boards comprise executive and non-executive directors, some of whom are executive and non-executive directors of Blue Label.
GOVERNANCE FRAMEWORK
GOVERNANCE FRAMEWORK
Executive Committee
Remuneration and
Nomination Committee
Investment Committee
Social, Ethics and
Transformation Committee
Audit, Risk and
Compliance Committee
Internal Risk and
Compliance Committee
Internal audit
External audit
Subsidiary Board
Shareholders via AGM
BOARD OF DIRECTORS
39
BLU
E L
AB
EL IN
TE
GR
AT
ED
AN
NU
AL R
EP
OR
T 2
01
5
APPLICATION OF KING IIIBlue Label is committed to King III and continues to develop its governance policies, practices and procedures, in line with an integrated governance, risk and compliance framework. The Board is responsible for ensuring the principles contained in King III are applied. The JSE Listings Requirements further stipulate compulsory adherence to certain specific requirements of King III. A summarised table of Blue Label’s application of King III is available on the Company’s website at www.bluelabeltelecoms.co.za.
BOARD OF DIRECTORSBoard compositionBlue Label has a unitary Board structure comprising 10 Directors. As at 18 August 2015 five are independent non-executive directors, while one is non-executive and four Executive Directors. A biography of each Director appears on pages 20 and 21 of the integrated annual report.
The Board has a balance of independent directors and non-executive directors. In line with King III, the roles of the Chairman and the Chief Executives are separate. The Board is led by Larry Nestadt, an independent non-executive Chairman. The Joint Chief Executives are Brett Levy and Mark Levy.
The Chairman’s role includes setting the ethical tone for the Board and ensuring that the Board remains efficient, focused and operates as a unit. The Chairman provides overall leadership to the Board, without limiting the principle of collective responsibility for Board decisions. He also facilitates appropriate communication with shareholders and enables constructive relations between the executive and non-executive directors.
The Joint Chief Executives’ principal role is to provide leadership to the executive team in running the Group’s businesses. The Board defines the Group’s levels of authority, reserving specific powers for the Board, while delegating others to Senior Management. The collective responsibility of management vests with the Joint Chief Executives who regularly report to the Board on the Group’s progress in delivering its objectives and strategy.
The Group’s Financial Director is Dean Suntup. The Audit, Risk and Compliance Committee is satisfied that he has the appropriate expertise and experience for this position.
The role of the Board and Board proceduresThe Board directs the Group towards and facilitates the achievement of the Group’s strategy and operational objectives. It is accountable for the development and execution of the Group’s strategy, operating performance and financial results. Its primary responsibilities include: determining the Group’s purpose and values, providing strategic direction to the Group, appointing the Joint Chief Executive Officers, identifying key risk areas and key performance indicators of the Group’s businesses, monitoring the performance of the Group against agreed objectives, deciding on significant financial matters and reviewing the performance of the Executive Directors against defined objectives. A range of non-financial information is also provided to the Board to enable it to consider qualitative performance factors that involve broader stakeholder interests.
The Board, which meets at least quarterly, retains full and effective control over all the operations. Additional ad hoc Board meetings are convened as circumstances require.
The Board has unrestricted access to all Group information, records, documents and resources to enable it to discharge its responsibilities in a proper manner. The Executive Directors are tasked with ensuring that Board members are provided with all relevant information and facts to enable them to reach objective and informed decisions.
Board meetings are scheduled well in advance and Board documentation is provided timeously. The Board agenda and meeting structure assist the Board in focusing on corporate governance, its legal and fiduciary duties, Group strategy and operational performance monitoring, thus ensuring that the Board’s time and energy is appropriately applied. Between Board meetings, Directors are kept informed of key developments affecting the Group.
GOVERNANCE FRAMEWORK CONTINUED

40
BLU
E L
AB
EL IN
TE
GR
AT
ED
AN
NU
AL R
EP
OR
T 2
01
5
Board appointmentsOne-third of the Directors retire by rotation every three years in terms of the MoI. If eligible, available and recommended for re-election by the RNC, their names are submitted for re-election at the AGM, accompanied by a short biography set out in the integrated annual report. In this regard Messrs KM Ellerine, GD Harlow and SJ Vilakazi will be retiring at the forthcoming AGM and, being eligible, have made themselves available for re-election. A brief biography of each Director appears on pages 20 and 21.
The RNC assists the Board with the assessment, recruitment and nomination of new Directors, subject to the whole Board approving these appointments. Board members are also invited to interview potential appointees.
A formal and transparent procedure applies to all new Board appointments, which are subject to approval by shareholders at the first AGM following that Director’s appointment. Prior to appointment, candidates are required to complete a fit and proper test, as per the JSE Listings Requirements.
Induction of a new Director is tailored according to the knowledge and experience of the Director in a listed environment. Focus is placed on providing information on the Board structure, business operations and Group strategy. Ongoing training and development of Directors involve ad hoc presentations to the Board by professional advisers and Senior Management to ensure the Board is kept abreast of governance, regulatory and operational developments.
Non-Executive Directors have access to management and may meet without the attendance of Executive Directors.
The Board acts in the best interests of the Group by ensuring that individual Directors: • adhere to the legal standards of conduct set out
in the Companies Act; • are permitted to take independent professional
advice in connection with discharging their duties following an agreed procedure;
• disclose real and perceived conflicts to the Board annually as well as prior to each Board meeting; and
• deal in securities only in accordance with the dealings in securities policy adopted by the Board.
The Board is kept informed of the Group’s going concern status and monitors the solvency and liquidity of the Company and Group on a regular basis.
Board CharterThe Board has adopted a written charter to assist it in conducting its business in accordance with the principles of good corporate governance and legislation.
The purpose of the Board Charter is to ensure that each director is aware of the powers, duties and responsibilities when acting on behalf of the Company. The Board Charter is subject to the provisions of the Act, JSE Listings Requirements, the Company’s MoI, and all other applicable legislation. Salient features of the Board Charter are: • role and function of the Board; • detailed responsibilities; • discharge of duties; • Board composition; and • establishment of committees.
GOVERNANCE FRAMEWORK CONTINUED

41
BLU
E L
AB
EL IN
TE
GR
AT
ED
AN
NU
AL R
EP
OR
T 2
01
5
The performance appraisal of the Company Secretary for the year under review took into account the quality of support received and guidance provided to the Board. All parties were satisfied with the quality of support received as well as the competency and experience of the Company Secretary. The Company Secretary is responsible for complying with the JSE Listings Requirements. This includes the preparation and submission of all relevant communication, such as SENS announcements, to the securities exchange.
Board CommitteesThe Board has delegated certain functions to well-structured Committees without abdicating its own responsibilities. Board Committees operate under written terms of reference approved by the Board. Board Committees are free to take independent professional advice as and when deemed necessary, for which a formal policy is in place. The Group Company Secretary provides secretarial services for the Committees.
There is transparency and full disclosure from Board Committees to the Board. The minutes of Committees are submitted to the Board for noting and discussion. In addition, directors have full access to all Board Committee documentation and Committee chairpersons provide the Board with verbal reports on recent activities.
The Board is of the opinion that all Board Committees have effectively discharged their responsibilities, as contained in their respective terms of reference.
The Board Charter provides for assessing of the Board and its Committees every other year. The next assessment is due in 2016.
Company SecretaryThe Company Secretary’s roles and responsibilities are set out in the Act, which stipulates the Company Secretary has duties towards the Board, the Group and shareholders.
All Directors have full access to all Group information, property and records, and the services and advice of the Group Company Secretary or, where appropriate, to the services of independent professionals and advisers. The Company Secretary is neither a Director of the Board nor a Director of the Group’s operational companies and therefore maintains an arm’s-length relationship with the Group and its Directors.
Duties include ensuring that the Board complies with procedures and regulations of a statutory nature, such as changes in legislation or practices that might affect Board members in their capacity as Directors.
All meetings of shareholders, Directors and Board Committees are properly recorded and distributed.
The Company Secretary also ensures that all Board and Committee charters are kept current, and assists in the evaluation of the Board, Directors and Committees. The Company Secretary offers advice to directors on business ethics and good governance. She also plays a role in ensuring that the Board’s policies and instructions are communicated to relevant persons in the Group and that pertinent issues from management are referred back to the Board where appropriate.
GOVERNANCE FRAMEWORK CONTINUED

42
BLU
E L
AB
EL IN
TE
GR
AT
ED
AN
NU
AL R
EP
OR
T 2
01
5
GOVERNANCE FRAMEWORK CONTINUED
The Committees, their members and principal functions are set out below:
Committee Members and attendees Principal activities
Executive (weekly)
MS Levy (C)EC de Villiers*BM LevyMV PamenskyDA Suntup
• Implement strategies and policies of the Group, • Manage the business of the Group, • Senior Management appointments and
performance management, • Prioritise the allocation of capital, technical matters
and human resources, and • Review and approve acquisitions, disposals and
investments of up to R40 million per transaction.
Audit, Risk and Compliance (quarterly)
JS Mthimunye (C)EC de Villiers*GD HarlowBM Levy*MS Levy*DA Suntup*SJ Vilakazi
More information on the activities and responsibilities of the Committee is included on page 65.
The report of the Committee is on pages 65 to 68.
Remuneration and Nomination (bi-annually)
GD Harlow (C of RC)LM Nestadt (C of NC)EC de Villiers*BM Levy*MS Levy*JS MthimunyeDA Suntup*
• Determine and agree with the Board, the framework or broad policy for the remuneration of the Executive Directors, non-executive directors and any other members of Executive Management, or as it is designated to consider,
• Review, for recommendation to the Board, the design of and targets for the Group’s Forfeitable Share Plan,
• Determine annually whether awards are to be made under the Forfeitable Share Plan and the overall individual amounts of such awards,
• Recommend to the Board the remuneration of non-executive directors for approval by shareholders.
• Identify and nominate candidates to fill vacancies on the Board as and when they arise, for the ultimate approval of the Board, and
• Recommend the appointment of new Executive and Non-Executive Directors, including recommendations on the composition of the Board and the balance between Executive and Non-Executive Directors and any adjustments that are deemed necessary.
The report of the Committee is on pages 60 to 64.
C – Chairman.
* Attendee.
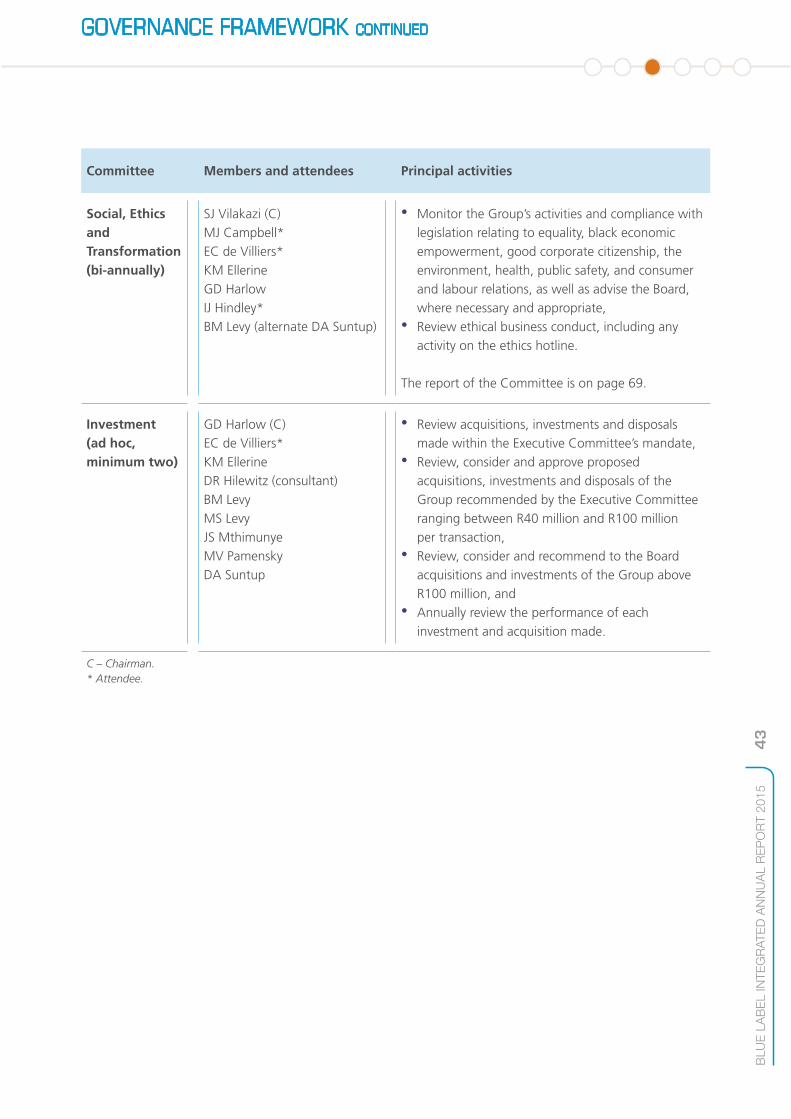
43
BLU
E L
AB
EL IN
TE
GR
AT
ED
AN
NU
AL R
EP
OR
T 2
01
5
GOVERNANCE FRAMEWORK CONTINUED
Committee Members and attendees Principal activities
Social, Ethics and Transformation (bi-annually)
SJ Vilakazi (C)MJ Campbell*EC de Villiers*KM EllerineGD HarlowIJ Hindley*BM Levy (alternate DA Suntup)
• Monitor the Group’s activities and compliance with legislation relating to equality, black economic empowerment, good corporate citizenship, the environment, health, public safety, and consumer and labour relations, as well as advise the Board, where necessary and appropriate,
• Review ethical business conduct, including any activity on the ethics hotline.
The report of the Committee is on page 69.
Investment (ad hoc, minimum two)
GD Harlow (C)EC de Villiers*KM EllerineDR Hilewitz (consultant)BM LevyMS LevyJS MthimunyeMV PamenskyDA Suntup
• Review acquisitions, investments and disposals made within the Executive Committee’s mandate,
• Review, consider and approve proposed acquisitions, investments and disposals of the Group recommended by the Executive Committee ranging between R40 million and R100 million per transaction,
• Review, consider and recommend to the Board acquisitions and investments of the Group above R100 million, and
• Annually review the performance of each investment and acquisition made.
C – Chairman. * Attendee.
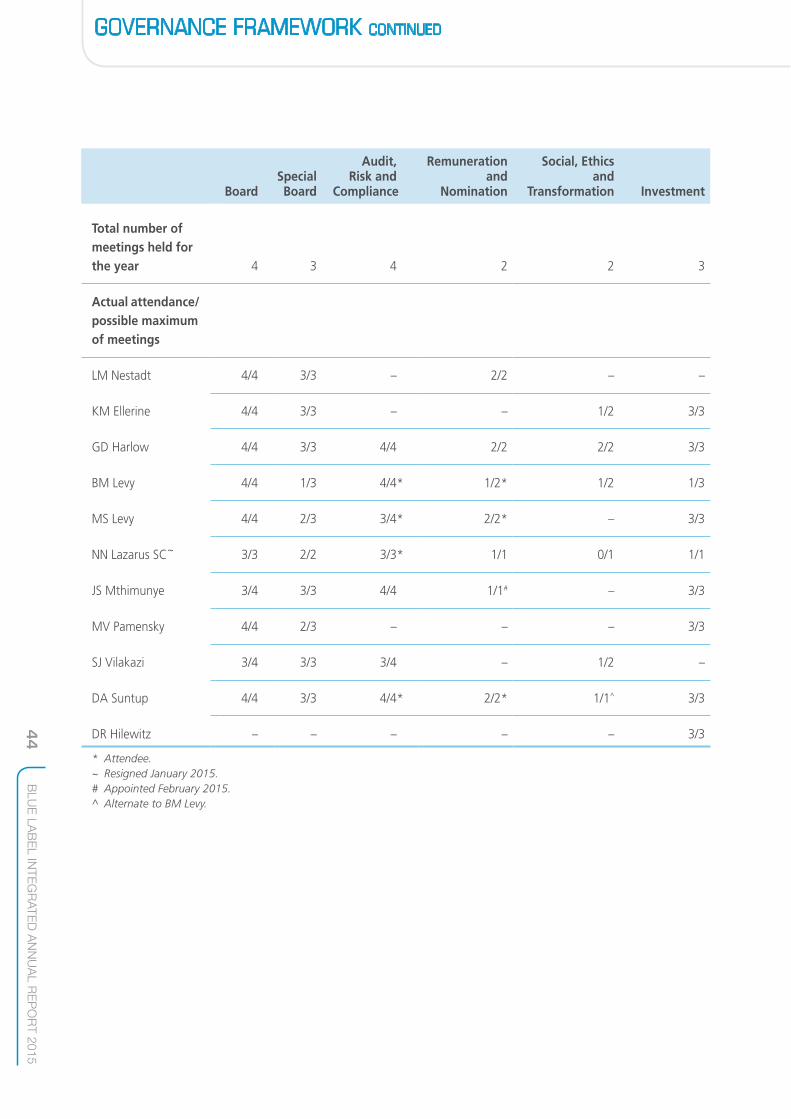
44
BLU
E L
AB
EL IN
TE
GR
AT
ED
AN
NU
AL R
EP
OR
T 2
01
5
GOVERNANCE FRAMEWORK CONTINUED
BoardSpecialBoard
Audit,Risk and
Compliance
Remunerationand
Nomination
Social, Ethics and
Transformation Investment
Total number of meetings held for the year 4 3 4 2 2 3
Actual attendance/ possible maximum of meetings
LM Nestadt 4/4 3/3 – 2/2 – –
KM Ellerine 4/4 3/3 – – 1/2 3/3
GD Harlow 4/4 3/3 4/4 2/2 2/2 3/3
BM Levy 4/4 1/3 4/4* 1/2* 1/2 1/3
MS Levy 4/4 2/3 3/4* 2/2* – 3/3
NN Lazarus SC~ 3/3 2/2 3/3* 1/1 0/1 1/1
JS Mthimunye 3/4 3/3 4/4 1/1# – 3/3
MV Pamensky 4/4 2/3 – – – 3/3
SJ Vilakazi 3/4 3/3 3/4 – 1/2 –
DA Suntup 4/4 3/3 4/4* 2/2* 1/1^ 3/3
DR Hilewitz – – – – – 3/3
* Attendee.~ Resigned January 2015.# Appointed February 2015.^ Alternate to BM Levy.
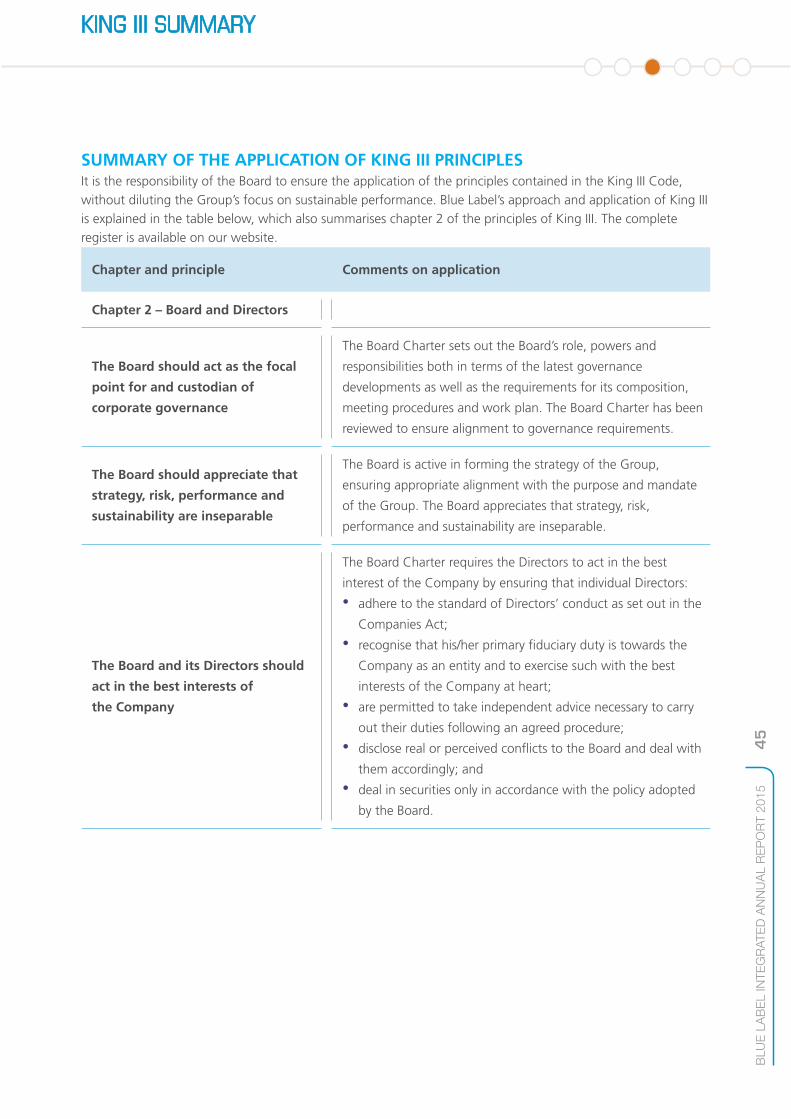
45
BLU
E L
AB
EL IN
TE
GR
AT
ED
AN
NU
AL R
EP
OR
T 2
01
5
KING III SUMMARY
SUMMARY OF THE APPLICATION OF KING III PRINCIPLESIt is the responsibility of the Board to ensure the application of the principles contained in the King III Code, without diluting the Group’s focus on sustainable performance. Blue Label’s approach and application of King III is explained in the table below, which also summarises chapter 2 of the principles of King III. The complete register is available on our website.
Chapter and principle Comments on application
Chapter 2 – Board and Directors
The Board should act as the focal
point for and custodian of
corporate governance
The Board Charter sets out the Board’s role, powers and
responsibilities both in terms of the latest governance
developments as well as the requirements for its composition,
meeting procedures and work plan. The Board Charter has been
reviewed to ensure alignment to governance requirements.
The Board should appreciate that
strategy, risk, performance and
sustainability are inseparable
The Board is active in forming the strategy of the Group,
ensuring appropriate alignment with the purpose and mandate
of the Group. The Board appreciates that strategy, risk,
performance and sustainability are inseparable.
The Board and its Directors should
act in the best interests of
the Company
The Board Charter requires the Directors to act in the best
interest of the Company by ensuring that individual Directors: • adhere to the standard of Directors’ conduct as set out in the
Companies Act; • recognise that his/her primary fiduciary duty is towards the
Company as an entity and to exercise such with the best
interests of the Company at heart; • are permitted to take independent advice necessary to carry
out their duties following an agreed procedure; • disclose real or perceived conflicts to the Board and deal with
them accordingly; and • deal in securities only in accordance with the policy adopted
by the Board.

46
BLU
E L
AB
EL IN
TE
GR
AT
ED
AN
NU
AL R
EP
OR
T 2
01
5
Chapter and principle Comments on application
The Board should consider
business rescue proceedings or
other turnaround mechanisms as
soon as the Company is financially
distressed as defined in the Act
No business rescue proceedings were required.
The Board should elect a Chairman
of the Board who is an
independent non-executive
director. The CEO of the Company
should not also fulfil the role of
Chairman of the Board
The Chairman of the Board is an experienced Independent
Non-Executive Director elected by the Board. See Chairman’s
curriculum vitae on page 20.
The Board should appoint the
Chief Executive Officer and
establish a framework for the
delegation of authority
The Board approved the role of Joint Chief Executive Officers
and has formalised the role and function of the Joint Chief
Executive Officers, including the adoption of a governance
guideline and delegation of authority framework. Both guideline
and framework were updated in August 2015.
The Board should comprise a
balance of power, with a majority
of non-executive directors. The
majority of non-executive directors
should be independent
Presently, the Board comprises: • four Executive Directors; • one Non-Executive Director; and • five Independent Non-Executive Directors:
– NN Lazarus SC resigned 27 January 2015.
– Y Mahomed appointed 18 August 2015.
Directors should be appointed
through a formal process
The RNC is a Committee of the Board and assists in identifying
and selecting suitable members who will meet the Board’s
requirements in terms of knowledge, skills and resources. All
appointments are made in compliance with the Companies Act,
JSE Listings Requirements and the Company’s MoI.
KING III SUMMARY CONTINUED

47
BLU
E L
AB
EL IN
TE
GR
AT
ED
AN
NU
AL R
EP
OR
T 2
01
5
Chapter and principle Comments on application
The induction and ongoing
training and development of
Directors should be conducted
through formal processes
Induction programmes for new Directors are tailored based on
the knowledge and experience of the Director and focus on
providing information on the Board structure and the Group’s
strategy and operations. Ad hoc presentations are made to the
Board by professional advisers and Senior Management to
ensure that the Board is up to date with governance, regulatory
and operational developments.
The Board should be assisted by a
competent, suitably qualified and
experienced Company Secretary
The role and function of the Company Secretary is in line with
the requirements of the Act, governance principles and
JSE Listings Requirements.
The evaluation of the Board, its
Committees and the individual
Directors should be performed
every year
1. Performance evaluations of the Board and its Committees
takes place every other year, as opposed to annually as
recommended by King III. The Board is satisfied that
evaluations every other year, as opposed to annually, are
appropriate for the business;
2. Evaluations regarding the performance of individual Executive
Directors take place annually, once during remuneration
increase and performance bonus award periods and, as
applicable, prior to the AGM regarding the re-election of
Directors; and
3. Evaluations regarding the performance of individual
Non-Executive Directors takes place annually (in respect
of those standing for re-election at the AGM) and every
other year for the remainder (as part of the Board and
Committee evaluations).
KING III SUMMARY CONTINUED

48
BLU
E L
AB
EL IN
TE
GR
AT
ED
AN
NU
AL R
EP
OR
T 2
01
5
KING III SUMMARY CONTINUED
Chapter and principle Comments on application
The Board should delegate certain
functions to well-structured
committees but without abdicating
its own responsibilities
The Board has appointed the following Committees to assist it
in its duties: • Investment Committee • ARCC • RNC • Social, Ethics and Transformation Committee • Exco
A governance framework should
be agreed between the Group and
its subsidiary boards
The governance framework is applied by subsidiary boards.
Companies should remunerate
Directors and executives fairly and
responsibly
The RNC is in place and assists the Board in ensuring the
Group’s remuneration policy attracts, retains and motivates
top-quality people in the best interests of the Group.
Companies should disclose the
remuneration of each individual
Director and prescribed officer
The disclosure of Directors’ remuneration meets the
requirements of the Act and this governance principle. No
additional prescribed officers identified for the current year.
Shareholders should approve the
Company’s remuneration policyApproved at the AGM on 28 November 2014.
49
BLU
E L
AB
EL IN
TE
GR
AT
ED
AN
NU
AL R
EP
OR
T 2
01
5
GOVERNANCE OF RISK
STRUCTUREThe Board accepts its responsibility for the
governance of risk, which includes the total process
of risk management and the forming of its opinion
on the effectiveness of the process. The Board forms
its opinion on the process of risk management
based on the recommendations of the ARCC and
is satisfied with the effectiveness of the risk
management process. The ARCC is responsible for
ensuring that the Group has implemented an
effective policy and plan for risk management and
that the risk disclosures are comprehensive, timely
and relevant. The Board and Committees’
responsibilities are documented in the Blue Label
Enterprise Risk Management Framework Policy.
Management is accountable to the Board for
designing, implementing and monitoring the
process of risk management. The IRCC, established
by management, supports the enterprise-wide risk
approach by identifying, evaluating and measuring
Group-wide risks and compliance in all functional
areas of the Group, as well as maintaining adequate
internal controls. The IRCC reports to the ARCC
bi-annually.
PROCESSGroup-wide strategic risk assessments are conducted
bi-annually. These assessments are facilitated by
internal audit which plays an important role in
evaluating the risk management process and
guiding management to continuing improvement.
Internal audit does not take any direct responsibility
for making risk management decisions or managing
the risk management function. The outcome of the
risk assessments is integral in developing a plan for
internal audit engagements for the forthcoming
year. The risk assessments conducted involve risk
identification and prioritisation at subsidiary and
holding company level, followed by interviews with
Senior Management at subsidiary level and key
members of Executive Management to confirm risks,
their descriptions and prioritisation. Each risk is
evaluated in terms of potential impact, likelihood
of occurrence and the perceived effectiveness of
controls in place to manage the risks according to
set criteria. The Group’s material risks are listed on
pages 13 to 16.
A risk appetite and tolerance framework has been
developed in line with the principles of King III and
the framework was presented to the ARCC for
consideration and has been approved/noted by the
Board. In terms of the framework, priority risks will
be considered in terms of risk appetite, which is
defined as how much risk the Group is prepared to
take in pursuit of its objectives. The Group has
identified its strategic risks and acknowledges that
its appetite to accept risk varies across these risks.
The ARCC has elected to set risk tolerances in
respect of each of the prioritised risks. This
framework is refined during each reporting period.
TECHNOLOGY GOVERNANCEThe Board is responsible for the Group’s technology
governance risk and compliance. The Board has
delegated its responsibility for the implementation
of IT governance to management. Management has
developed an IT governance framework which has
been adopted and the Information Security Officer is
50
BLU
E L
AB
EL IN
TE
GR
AT
ED
AN
NU
AL R
EP
OR
T 2
01
5
marked increase in new requests for technology
enhancements. A process has been implemented to
ensure that the efforts are focused on developments
that will assist our customers to meet their
objectives, while maintaining acceptable
performance levels from our systems.
In order to gear the technology function to support
the growing business environment, a number of
governance, risk and compliance objectives have
been set. The governance framework was
developed by initially identifying generic technology
risks and the policies developed aligned to the
framework are in some cases more Group specific.
A policy framework has been implemented to
manage these risks and an implementation plan is
being executed to complete the roll-out of the
policy framework.
Blue Label’s compliance function oversees the
discharge of legal and regulatory responsibilities.
The function monitors, researches and reports on
the regulatory environment in which the Group
operates. The compliance function reports to the
Audit, Risk and Compliance Committee.
The process of compliance reporting encompasses: • identifying and prioritising all acts and regulations
at a national level applicable to Blue Label; • incorporating regulatory requirements into
control measures such as standard operating
procedures or processes, manuals or policies;
• recommending corrective measures or steps to
ensure compliance; and • monitoring compliance through the adequacy
and effectiveness of control measures, which
includes the use of best industry practice
compliance tools and active involvement by Blue
Label’s internal auditors to actively monitor and
manage business units’ compliance against
regulations on a continual basis.
There have been no material instances of
non-compliance by the Group or its Directors during
the past financial year.
COMPLIANCE REPORT
GOVERNANCE OF RISK CONTINUED
driving a number of programmes across the
organisation to ensure it is effectively communicated
and that all Group companies are informed of the
framework and associated policies. Management is
implementing a number of controls to ensure that
the policies are effectively adopted and maintained
across the organisation.
A number of areas relating to technology
governance have progressed. There has been a
significant drive to formalise controls in order to
ensure consistent and adequate risk management.
The operation’s environment has been assessed to
ascertain the process requirements from both an
enhancement as well as a compliance perspective.
On the disaster recovery side, progress has been
made to deal with multi-node failure and
location outages.
On the project and system changes side, processes
have been formalised to streamline work activity as
well as ensure focus is maintained appropriately.
With the growth in business there has been a

51
BLU
E L
AB
EL IN
TE
GR
AT
ED
AN
NU
AL R
EP
OR
T 2
01
5
The Board has ultimate accountability for stakeholder strategy and engagement, recognising that developing and nurturing dialogue with key stakeholders is a driver of business sustainability.
DISCLOSURE
EQU
ITABLE
TREATM
ENT
IDEN
TIFY
AN
D
ENG
AG
E
REPUTATION
BALA
NCE BEST
INTEREST
DEM
ON
STRA
TE
COM
MIT
MEN
T
PROVIDERS OF CAPITAL
including shareholders, institutional and
retail investors and financial analysts
GOVERNMENTRegulatory bodies
and the public sector
CUSTOMERS
BUSINESS PARTNERS
and suppliers
MEMBERS OF THE MEDIA
including journalists, reporters and
editors
EMPLOYEES
Educational institutions
and research organisations
COMMUNITIES
STAKEHOLDER RELATIONS

52
BLU
E L
AB
EL IN
TE
GR
AT
ED
AN
NU
AL R
EP
OR
T 2
01
5
STAKEHOLDER RELATIONS CONTINUED
The Board acknowledges that Blue Label’s
relationship with its stakeholders is a core capital,
as defined by the framework for International
Integrated Reporting. The responsibility for
satisfactory stakeholder relationships vests with
every employee in the Group, as we consider a
good reputation to be a competitive advantage,
which gives the Group the ability to create
additional value.
We approach stakeholders with trust and respect
and look to them for the same mutual good faith.
A broad range of internal and external stakeholders
with a material or potential interest in, or who are
affected by us, have been identified.
We recognise the importance of identifying issues
of a shared interest, but also value the opportunity
for engagement, as it provides a unique insight
into the expectations of each stakeholder group.
We apply a measured approach to interacting with
and responding to stakeholders, while building
enduring relationships. A stakeholder engagement
programme has been formalised for the most
relevant stakeholder groupings. This process takes
into account the impact that each stakeholder group
may have on our business, while the frequency
and form of engagement is aligned to its
estimated impact.
Some of the initiatives and methods used in the
process of engaging with stakeholders comprise:
face-to-face formal or informal, individual or group
meetings (including the AGM), media and securities
exchange news announcements, presentations,
roadshows, telephone and conference calls, the Blue
Label website (www.bluelabeltelecoms.co.za),
investor site and trade visits. We may also rely on
the results of perception studies, independent
research, reputation audits, whistleblowing facilities
and formal grievance mechanisms and financial and
sustainability reports. In addition, we initiate
newsletters, circulars and e-mail updates, regular
customer, business partner and supplier meetings,
below and above-the-line advertising and marketing
across various channels, formal consultations and
audit processes, and host management and sales
conferences. Dialogue, review and feedback are
encouraged wherever possible, which in turn are
presented to Exco for consideration.
Blue Label’s stakeholder engagement programme
supports its efforts to be a successful, stable and
ethical company contributing to the economic
growth of the communities in which we operate.
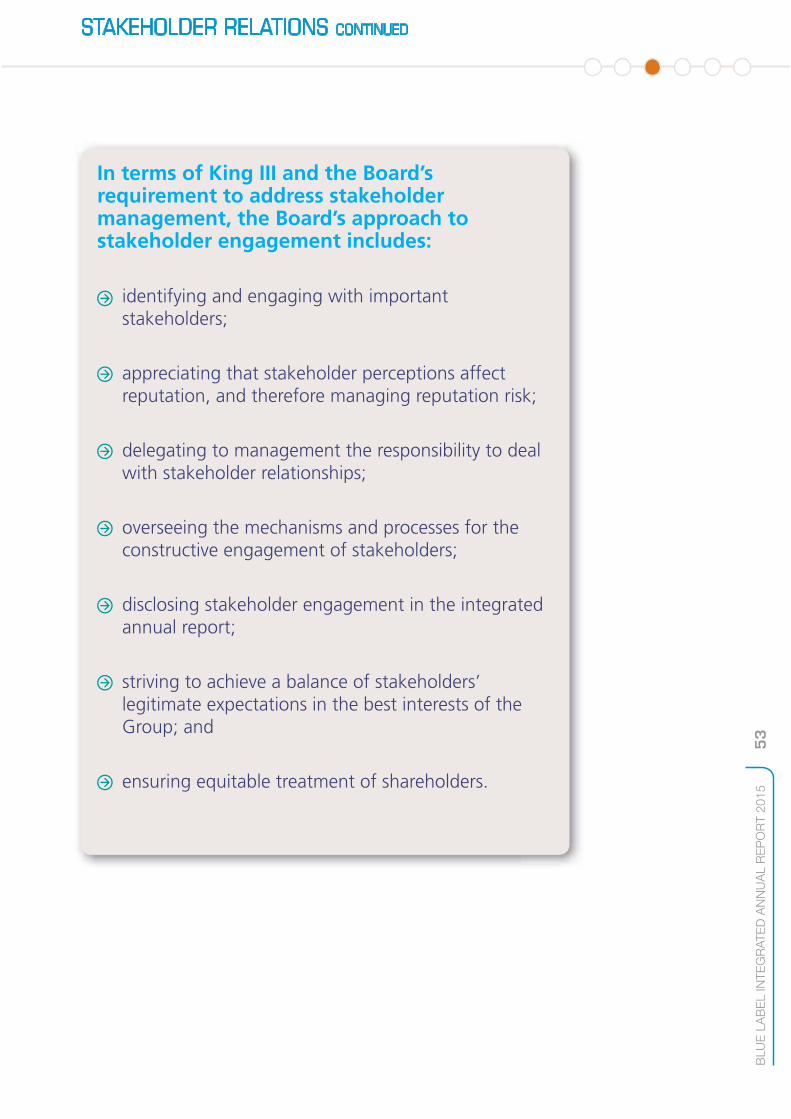
53
BLU
E L
AB
EL IN
TE
GR
AT
ED
AN
NU
AL R
EP
OR
T 2
01
5
STAKEHOLDER RELATIONS CONTINUED
In terms of King III and the Board’s requirement to address stakeholder management, the Board’s approach to stakeholder engagement includes:
identifying and engaging with important stakeholders;
appreciating that stakeholder perceptions affect reputation, and therefore managing reputation risk;
delegating to management the responsibility to deal with stakeholder relationships;
overseeing the mechanisms and processes for the constructive engagement of stakeholders;
disclosing stakeholder engagement in the integrated annual report;
striving to achieve a balance of stakeholders’ legitimate expectations in the best interests of the Group; and
ensuring equitable treatment of shareholders.

54
BLU
E L
AB
EL IN
TE
GR
AT
ED
AN
NU
AL R
EP
OR
T 2
01
5
STAKEHOLDER RELATIONS CONTINUED
Stakeholder group Nature of engagement Method of
engagementDialogue process and outcomes
Employees – we invest in the growth of our people
Ongoing communication with employees covers matters of a strategic, financial and operational nature, including new developments, product launches, health and safety initiatives, internal policies and practices such as the ethics hotline, competitions, business initiatives, charitable initiatives, human resource matters, staff wellness, staff-related news and regulatory and compliance matters.
Blue Label also holds an annual off-site conference attended by Directors and Senior Management. The purpose of the conference is to obtain input and feedback from attendees on strategic and common operational matters. Companies within the Group host their own management, sales and strategy conference, held at least once a year.
Staff meetings, newsletters, posters, e-mails, staff notices posted on notice boards, in the canteen and in lifts, lunch and coffee station discussions, management presentations and briefings of strategy updates, financial and personal performance.
Other methods include wellness days, a carnival day, blood donor drives, health campaigns, the winter Olympics, the year-end awards ceremony, and social events with employees, customers and service providers. More details are provided in the human capital section on page 81.
Keynote speakers from industry, discussion groups, breakaway sessions, motivational speakers and team building exercises.
Newly appointed staff attend an induction programme held at the beginning of each month.
Innovation in our entrepreneurial environment is nurtured, while motivation and values are reinforced in a safe and rewarding environment. Efforts are made to balance the organisation’s entrepreneurial spirit with a structured work environment by streamlining processes and procedures in a relatively flat organogram and an open communication system.
Staff performance is reviewed bi-annually with the intention of measuring performance and reviewing salaries. There is a forum to which staff may make recommendations and/or requests.
External training, coaching and mentoring programmes are available to staff on the recommendation of their line manager.
See pages 78 and 79 for more details.

55
BLU
E L
AB
EL IN
TE
GR
AT
ED
AN
NU
AL R
EP
OR
T 2
01
5
STAKEHOLDER RELATIONS CONTINUED
Stakeholder group Nature of engagement Method of
engagementDialogue process and outcomes
Providers of capital, including shareholders, institutional and retail investors and financial analysts – we believe in delivering value to Blue Label’s shareholders
Engagement includes ongoing and/or ad hoc meetings with top management involving presentations and discussions covering Group financial performance, overview of strategic direction and the investment proposition.
Tours of the Demonstration Centre and warehouse at No 75 Grayston Drive and visits to a local mall, merchant trading grounds and our customers’ sites are arranged on request.
Individuals from this stakeholder group and their contact details are registered on the Blue Label investor database.
Questions received via telephone or e-mail are answered immediately where possible, with a return time of no longer than 48 hours from receipt, with due regard of close periods.
Management undertakes local and international roadshows to existing and prospective institutional investors and analysts.
Integrated annual report, interim report and AGM.
The highlights of the interim and year-end results are published in the press as a short-form advertisement, with the long form posted on the Company website.
SENS announcements via the JSE.
Face-to-face meetings, group meetings, teleconference and videoconference calls.
Speaker and presenter at investor conferences, JSE showcases and other workshops.
Investor alerts are e-mailed once individuals register on the website to receive them.
Other activities as arranged by sell-side analysts, banks and financial communication houses.
To address this stakeholder group’s request to increase its understanding of the business model, the geographies and markets in which we operate, and products and services, management is available to take meetings and conference calls throughout the year, subject to close period dates. Presentations and webcasts are posted on the Company’s website.
The Demonstration Centre, situated at No 75 Grayston Drive, Sandton, provides an audio-visual overview of the Group, its activities and products and services, while transactions can be simulated on various types of terminals. A warehouse, also situated at No 75 Grayston Drive, can be visited by prior arrangement.
Visits are arranged to local markets, petroleum forecourts, retail outlets, Mom & Pop stores and malls, where our merchants’ activities can be witnessed. By prior arrangement the truck and footsoldier model can be seen in action in nearby local communities. Numerous visits of this nature were held in and around Johannesburg and Cape Town during the year.

56
BLU
E L
AB
EL IN
TE
GR
AT
ED
AN
NU
AL R
EP
OR
T 2
01
5
STAKEHOLDER RELATIONS CONTINUED
Stakeholder group Nature of engagement Method of
engagementDialogue process and outcomes
Customers – we are at their service in enhancing innovation
The Group’s customer base comprises corporate clients, chain stores, large independent retail clients, wholesale/cash-and-carry stores, Mom & Pop stores and petroleum forecourts.
Engagement involves servicing customers, POS device installations, marketing, Blu Approved branding, maintenance, support and sharing information on new products, market trends, business queries and other growth opportunities. Low-cost devices receive a more limited range of servicing.
Senior Management liaises regularly with its customers and supplier counterparts and, in so doing, continue building and strengthening long-term relationships, which in turn, furthers growth opportunities.
A dedicated, national helpdesk operating daily from 07:00 to 21:00, with a team of customer relationship and technical support consultants.
Face-to-face formal and informal meetings, as well as formal consultation.
The Group has a CRM system, self-help facilities and dedicated CRCs to enhance its customer engagement service.
Price and value for money drive the relationship with this stakeholder group. FAQs by customers usually involve technical matters or account queries. It is essential that queries are expeditiously resolved to impart a greater sense of value to the customer. A call-out is logged for technical matters and a technician will visit the site within 24 to 48 hours. Account queries that require escalation are dealt with by a CRC who will visit the merchant. The contact centre sends regular updates to the merchant base through SMS and e-mail communications.
CRCs and regional managers maintain good relationships through a scheduled call cycle to ensure open communication and updates on new product offerings. Support is also provided for POS material, branding, minor repairs and maintenance. Emphasis is given to upselling and cross-selling opportunities within the Group’s products and services lists.

57
BLU
E L
AB
EL IN
TE
GR
AT
ED
AN
NU
AL R
EP
OR
T 2
01
5
STAKEHOLDER RELATIONS CONTINUED
Stakeholder group Nature of engagement Method of
engagementDialogue process and outcomes
Business partners and suppliers – we collaborate to enhance the end customer’s experience
The relationships with business partners such as Vodacom, MTN, Cell C, Telkom, Eskom, municipalities, utilities, parastatals, event, concert and sport organisers, transport providers, commercial banks and merchant acquirers, as well as service providers are managed in terms of written distributor and/or dealer agreements. The nature of the agreements are generally long term.
Relationship managers are appointed to each partner to provide a single and dedicated point of contact.
Suppliers are managed in a formal procurement process, during which issues such as quality of product, creditworthiness and B-BBEE status are confirmed, prior to their appointment. Suppliers of services are, if appropriate, initially engaged through a tender process and, where successful, agreements are concluded. The majority of the Group’s goods and services are procured from locally based suppliers.
Engaging this group of stakeholders also provides a platform for product innovation, as well as line of sight into indicative market supply and demand trends.
Written distributor and/or dealer agreements.
Face-to-face formal and informal meetings.
Site visits are held on request.
We recognise the need to work co-operatively to ensure quality and value for money in products and services. Prompt and full payment for goods delivered and services rendered are key to maintaining sound relationships with this stakeholder group. Matters raised pertain mostly to technical and operational issues, which are resolved timeously to ensure a smooth service delivery.

58
BLU
E L
AB
EL IN
TE
GR
AT
ED
AN
NU
AL R
EP
OR
T 2
01
5
STAKEHOLDER RELATIONS CONTINUED
Stakeholder group Nature of engagement Method of
engagementDialogue process and outcomes
Communities, educational institutions and research organisations – we participate with leaders in the communities in which we operate
By deepening our understanding of the interests of the communities in which we operate, we enhance trust and strengthen relationships.
The TPC community channel specialises in the development and empowerment of broad-based communities through the deployment of mobile technology and products. The community channel aims to distribute the Group’s products more widely, create job opportunities for members of the communities and share a portion of the revenue with these communities.
Senior Management, such as the Group Head of Human Resources and the Head of Investor and Media Relations, also engages with the business community, professional associations and research organisations across various levels on a regular basis.
The Joint CEOs and Senior Management are involved in collaborative projects and workshops with the Gordon Institute of Business Science (GIBS), among other local and international business and secondary schools.
Management also takes cognisance of the work of Financial Technology Partners LP, Frost and Sullivan, and the Institute for Futures Research at the University of Stellenbosch. The outputs of relevant print, electronic and social media monitoring services are also noted.
The Joint CEOs are regularly recognised for their contributions to entrepreneurialism, business development and the community in general, if not as award recipient, then as a judge. Some accolades are listed in each person’s biography on page 21.
Face-to-face formal and informal meetings and forums.
Training and workshops. Outreach programmes, as requested.
Presentation at conferences, participation in panel and roundtable discussions.
Address public conferences, roundtable sessions on governance and sustainability.
Frequent engagement with lecturers, students and scholars at formal and informal settings. Case studies assist the Group and the community in better understanding developments, challenges, achievements and failures.
The Group, represented by Executive Directors or Senior Management, frequently participates in group discussions with the community on business entrepreneurialism and administration.
The Group supports making responsible contributions to broader societal issues, be it through its charitable donations, CSI spend or in developing our business model among communities. See page 80 for more detail.
The communities in which the TPC community channel operates are mainly worried about the upliftment of their community, the enhancement of skills and the delivery of services in their mostly rural areas. These concerns are directly addressed by the community channel, in focusing on providing services, creating job opportunities and stimulating economic upliftment.
These opportunities provide extramural stimulus for senior staff and enable them to extend their knowledge, mentoring reach and networks.
This provides the Group quick access to talented individuals, while gaining direct line of sight into academia, where it may be able to offer and receive learning.

59
BLU
E L
AB
EL IN
TE
GR
AT
ED
AN
NU
AL R
EP
OR
T 2
01
5
STAKEHOLDER RELATIONS CONTINUED
Stakeholder group Nature of engagement Method of
engagementDialogue process and outcomes
Members of the media, including journalists, reporters and editors – we engage with outsiders to our business who may have difficulty understanding our activities
Briefings to media are held at the interim and full-year results, followed by Q&A. One-on-one interviews are conducted on radio, TV and with print and online journalists and editors.
Ad hoc requests for interviews and participation in panel discussions.
News releases are distributed to media and news services both locally and overseas, as per a database maintained by the Company.
Print, online, broadcast and social media monitoring is outsourced and reports of coverage are received and distributed daily among business segments, as appropriate.
Mid-cap companies do not readily gain news coverage. To raise this stakeholder group’s interest and awareness of the scope of business, products and services, media site and trade visits, including to the demonstration centre, were held during the year.
A number of interviews with Senior Management resulted in articles published in the press, with subjects covering the CEOs, financial performance, various new products such as ticketing and prepaid water, and distribution by truck and footsoldier to the informal sector.
Management regularly participates in radio and TV shows, especially around the release of our financial results.
Government, regulatory bodies and the public sector – we believe in partnering with regulators
The Group regularly engages national and local government, parastatals and other public organisations through various tender processes.
From a compliance perspective, the completion and rendition of statutory returns are undertaken diligently.
Blue Label is not a member of any industry association or national/international advocacy organisation in which the Company has positions in governance bodies, participates in projects or committees or provides substantive funding.
The Group occasionally consults the Department of Labour and physically lodges returns at the CIPC to expedite registration.
Formal personal meetings, written communications and tender processes.
The Group takes cognisance of the implications of the B-BBEE Codes of Best Practice.
Meetings are held covering matters such as health and safety and the Codes of Best Practice.
The Group meets all its statutory filing obligations in respect of the Department of Labour, CIPC, SARS, etc.
Our good reputation is our licence to operate and we therefore have to uphold our stature with all stakeholders.
During the year under review no prosecutions were brought against the Group for the contravention or non-compliance of any laws or regulations.

60
BLU
E L
AB
EL IN
TE
GR
AT
ED
AN
NU
AL R
EP
OR
T 2
01
5
REMUNERATION REPORT
The Board has delegated to the Remuneration and
Nomination Committee the responsibility to
determine the remuneration of the Executive
Directors and Senior Managers, as well as to
approve the allocation of shares under the Group’s
Forfeitable Share Scheme. The RNC also fulfils the
functions of the Nomination Committee.
Following the resignation of Mr NN Lazarus SC
as Chairman of the RNC on 27 January 2015,
Mr GD Harlow was appointed Chairman to the
RNC. Mr LM Nestadt continues to chair the
Nomination Agenda at meetings of the Committee.
Mr JS Mthimunye was appointed as a member of
the Committee during February 2015.
The RNC consists of three independent non-
executive directors, namely Messrs LM Nestadt,
GD Harlow and JS Mthimunye. The Joint CEOs and
the Financial Director attend meetings of the RNC
by invitation, but do not vote on decisions. The
chairpersons of the RNC report to the Board on its
deliberations and decisions.
In respect of the annual salary review of staff, the
Group Head of Human Resources presents
recommendations for the RNC’s consideration. The
RNC makes its own proposals regarding the fee
structure for non-executive directors and the fees
payable to members of Board committees for
consideration by the Board and ultimately, for
approval by shareholders.
PHILOSOPHYThe Group’s Remuneration Philosophy is to strive to
reward employees in a fair and equitable manner
and to ensure a culture of high performance
through employees who are motivated, engaged
and who subscribe to the principle of achieving a
balance between shareholder interests and
appropriate remuneration packages. The
Remuneration Policy is formulated to attract, retain
and motivate top-quality individuals. Remuneration
is designed to support Blue Label’s business strategy,
vision and to align with best practices. Total rewards
are set at levels that are competitive in the context
of the relevant areas of responsibility and the
industry in which the Group operates, with due
regard to market conditions. Total incentive-based
rewards are earned through the attainment of
demanding key performance indices and targets,
consistent with shareholder growth expectations.
The Group is conscious of the fact that succession
planning is essential and ensures that alternative
candidates are in place for certain identified
positions.
GOVERNANCEKey duties of the RNC include: • ensuring that the Group upholds its entrenched
Remuneration Philosophy, • ensuring that the combination of fixed and
variable pay is appropriate when benchmarking
remuneration levels, • reviewing incentive schemes to ensure a
continuing contribution to growth in shareholder
value, • reviewing incentive schemes to ensure that they
are administered and implemented in terms of
their rules and performance targets, • reviewing remuneration of Executive Directors
and Senior Management, and • submitting recommendations to the Board with
regard to non-executive remuneration for
ultimate approval by shareholders.
In the course of deliberations, the RNC considers the
views of the Joint CEOs on the remuneration and
performance of other Executive Directors and
members of Senior Management.
From time to time independent advice on market
information and remuneration trends is provided to
the RNC by external remuneration consultants. Blue
Label’s human resources department also assists the
Committee by providing supporting information and
documentation relating to matters for its
consideration, including the assessment of proposed
changes to legislation such as in determining the
employers’ responsibility to provide retirement
funding for staff.

61
BLU
E L
AB
EL IN
TE
GR
AT
ED
AN
NU
AL R
EP
OR
T 2
01
5
Salary increases for the 2016 financial year ranged
from 0% to 6% (2015: also 0% to 6%).
Management of each operating company was
afforded their own discretion to apply the
appropriate increase within the stipulated range
to each staff member falling under their control.
The annual salary increase of the Executive Directors
for the forthcoming financial year is 6%.
Details of the Directors’ remuneration for the year
ended 31 May 2015 appear on pages 172 and 173.
Incentive bonus plan
The Executive Directors and Senior Management
participate in an annual incentive bonus plan, which
is based on the achievement of short-term
performance targets. These targets comprise
financial and non-financial components. The
financial performance component is based on
growth in profits, as measured by core headline
earnings per share. Historically the performance
component was based on growth in headline
earnings per share. However, going forward it will
be more prudent to apply growth in core headline
earnings per share, as the latter is more indicative of
the trading performance of the Group.
The non-financial elements include the achievement
of transformation targets, progress in delivering the
Group’s growth strategy, rolling out the Group’s
transactional footprint, the rate and level of progress
in respect of organisational development and
succession planning, together with the application
of leadership qualities, corporate governance best
practices and risk mitigation.
For the 2015 financial year, the Group achieved the
levels required in terms of its predetermined targets
for growth in headline earnings per share. In
addition, the non-financial targets set for the
Executive Directors and Senior Management were
Additional governance principles applicable to the
composition and principal activities of the RNC are
more fully set out on page 42 (Governance
Framework) of this integrated annual report.
POLICYThe remuneration of Executive Directors and Senior
Management is determined on a total cost-to-
company basis, comprising three components: • Fixed remuneration – fixed monthly salary and
benefits. Fixed remuneration is reviewed annually
in order to ensure that the Executive Directors
and Senior Management, who contribute to the
success of the Group, remain remunerated at
appropriate levels in accordance with the
remuneration philosophy. • Variable remuneration – a short-term
performance-related bonus payment. The variable
pay element provided by the short-term bonus
plan is intended to enhance total pay
opportunities, should that be merited by Group
and individual performance. The purpose of the
annual performance-related bonus payment is to
reward and motivate the achievement of Group
and subsidiary financial targets, as well as to
motivate strategic and personal performance. The
Joint CEOs may earn an annual incentive bonus
of up to 120% of fixed remuneration and other
executive directors of up to 70%. Senior
Management may earn up to 50% of their
annualised fixed salary package. • Forfeitable share plan – a long-term
performance-related incentive scheme. Long-term
incentives, in the form of forfeitable shares
awarded under the share plan, are based on a
percentage of total annualised fixed salary
packages and are intended to reward sustained
long-term performance and to align the interests
of the Executive Directors and Senior
Management with those of shareholders.
Fixed remuneration
Blue Label applies a discretionary approach in all
remuneration reviews and there is no minimum
across-the-board increase to all employees.
REMUNERATION REPORT CONTINUED

62
BLU
E L
AB
EL IN
TE
GR
AT
ED
AN
NU
AL R
EP
OR
T 2
01
5
The financial criteria will be split as to 60% on the
performance of the subsidiary which employs the
person concerned (where applicable) and 20% on
Group performance. • Financial per subsidiary (60%)
– If growth in core headline earnings per share
is less than CPI, no element of the 60% will
be paid.
– If growth in core headline earnings per share is
equal to CPI plus 10%, then 70% of the 60%
will be paid in full or pro rata, as the case
may be.
– If growth in core headline earnings per share
exceeds CPI plus 10%, then an additional
30% of the 60% will be paid. • Group performance (20%)
– If growth in core headline earnings per share
is less than CPI, no element of the 20% will
be paid.
– If growth in core headline earnings per share is
equal to CPI plus 10%, then 70% of the 20%
will be paid, either in full or pro rata, as the
case may be.
– If growth in core headline earnings per share
exceeds CPI plus 10%, then an additional
30% of the 20% will be paid. • Non-financial (20%)
The following criteria will be taken into account
in determining qualification for the 20%: the
achievement of agreed transformation targets,
progress in delivering its growth strategy, the
roll-out of its transactional footprint, the rate and
level of progress made in respect of
organisational development and succession
planning, together with the application of
leadership qualities, corporate governance best
practices and risk mitigation.
Forfeitable share scheme
The forfeitable share scheme vesting criteria for the
2012 share scheme allocation was as follows: • 40% for retention (three years from date of
award); and
also achieved. The achievement of these targets
resulted in each Joint Chief Executive Officer being
paid a bonus of 96% of annual salary and the
Financial Director and Chief Operating Officer each
receiving a bonus of 56% of annual salary.
The bonus parameters for Executive Directors and
Senior Management for the 2016 financial year
have been determined as follows:
1. Executive Directors
Joint CEOs up to 120% of annual salary, Financial
Director and Chief Operating Officer up to 70% of
annual salary, of which 80% will apply to financial
criteria and 20% to non-financial criteria. • Financial (80%)
– If growth in core headline earnings per share
is less than CPI, no element of the 80% will
be paid.
– If growth in core headline earnings per share is
equal to CPI plus 10%, then 70% of the 80%
will be paid, either in full or pro rata, as the
case may be.
– If growth in core headline earnings per share
exceeds CPI plus 10%, then an additional
30% of the 80% will be paid. • Non-financial (20%)
The following criteria will be taken into account
in determining qualification for the 20%: the
achievement of agreed transformation targets,
progress in delivering the Group’s growth
strategy, the roll-out of the Group’s transactional
footprint, the rate and level of progress made in
respect of organisational development and
succession planning, together with the
application of leadership qualities, corporate
governance best practices and risk mitigation.
2. Executive Directors and Senior Management
A maximum of 50% of annual salary will be paid, of
which 80% will apply to financial criteria and 20%
to non-financial criteria.
REMUNERATION REPORT CONTINUED

63
BLU
E L
AB
EL IN
TE
GR
AT
ED
AN
NU
AL R
EP
OR
T 2
01
5
• 60% financial (50% for growth in core headline earnings per share and 10% based on shareholder returns). • The 50% for growth in core headline earnings
per share will be based on the following achievements:– If growth is 5% above CPI compounded
annually over three years, then 20% of the 50% will vest.
– If growth is 10% above CPI compounded annually over three years, then an additional 50% (i.e. a total of 70%) of the 50% will vest.
– If growth is 25% above CPI compounded annually over three years, then a further 30% (i.e. a total of 100%) of the 50% will vest.
The measurement period is from 1 June 2015 to
31 May 2018.
• The 10% for shareholder return will be based on a 10% compounded growth in the share price over the three-year vesting period, measured with reference to the weighted average price per share during the month of the commencement of the allocation plus dividends over the three-year period against the weighted average share price for the month during which the vesting takes place.
EXECUTIVE DIRECTORS’ SERVICE CONTRACTSThe three-year service contracts of the Executive
Directors expire as follows: • Messrs BM Levy and MS Levy, Joint CEOs –
14 November 2016, • Mr MV Pamensky, COO – 1 August 2017, • Mr DA Suntup, FD – 14 November 2017.
Each contract includes a restraint of trade
undertaking applicable for a period of 12 months
from the date from which the executive leaves the
employment from the Company on his own accord.
The restraint of trade is not enforceable in the event
that the employment contract is not renewed by the
Company, or if the executive’s employment is
illegitimately terminated by the Company.
• 60% financial (50% for growth in core headline
earnings per share and 10% based on
shareholder returns). • The 50% for growth in core headline earnings
per share was based on the following
achievements:
– If growth is 5% above CPI compounded
annually over three years, then 20% of the
50% would vest.
– If growth is 10% above CPI compounded
annually over three years, then an
additional 50% (i.e. a total of 70%) of the
50% would vest.
– If growth is 25% above CPI compounded
annually over three years, then a further
30% (i.e. a total of 100%) of the 50%
would vest.
The measurement period was from
1 June 2012 to 31 May 2015.
• The 10% for shareholder return was based on a
10% compounded growth in the share price over
the three-year vesting period, measured with
reference to the weighted average price per share
during the month of the commencement of the
allocation plus dividends over the three-year
period against the weighted average share
price for the month during which the vesting
takes place.
Vesting of the 2012 share scheme allocations fell
due on 31 August 2015. Although the cumulative
growth in core HEPS over the three-year period
resulted in 70% of the 50% of this portion of the
performance criteria qualifying for vesting, the
Board exercised its discretion and approved that
100% of the 50% element of the financial criteria
will vest.
The criteria for a minimum return to shareholders of
compounded growth of 10% per annum over the
three-year period were achieved.
The vesting criteria for the forfeitable shares
allocated in September 2015 are as follows: • 40% for retention (three years from date of
award); and
REMUNERATION REPORT CONTINUED
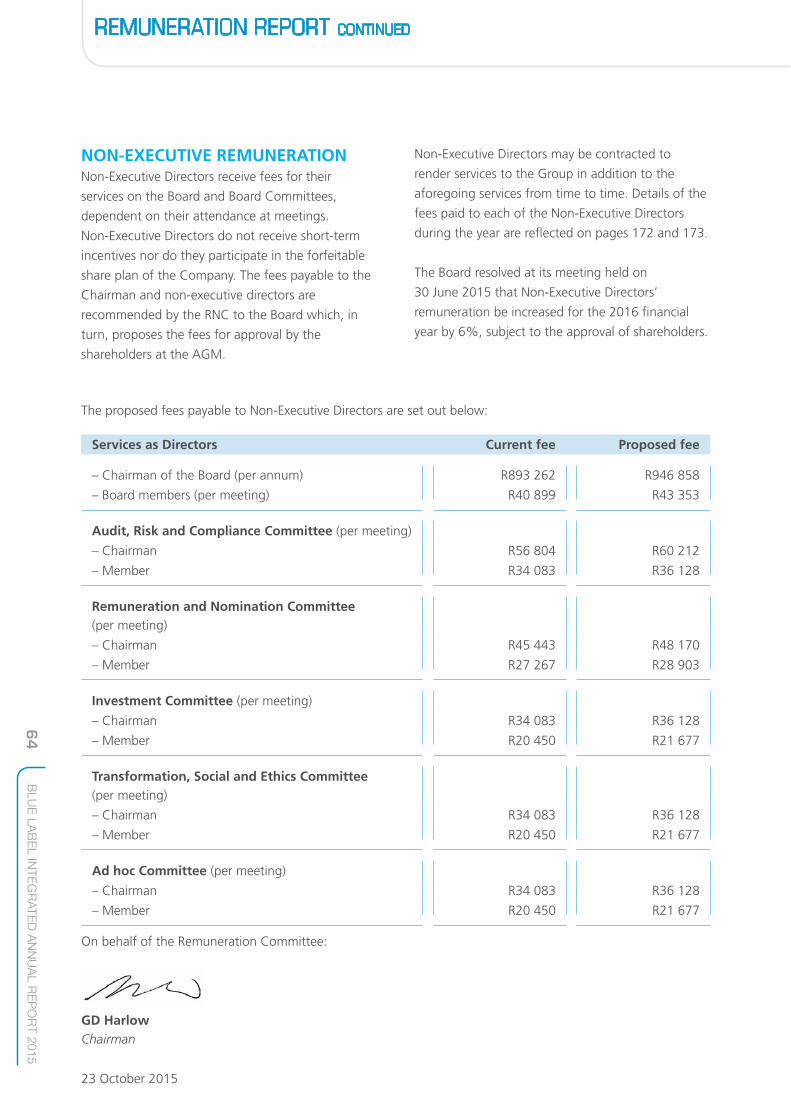
64
BLU
E L
AB
EL IN
TE
GR
AT
ED
AN
NU
AL R
EP
OR
T 2
01
5
NON-EXECUTIVE REMUNERATIONNon-Executive Directors receive fees for their
services on the Board and Board Committees,
dependent on their attendance at meetings.
Non-Executive Directors do not receive short-term
incentives nor do they participate in the forfeitable
share plan of the Company. The fees payable to the
Chairman and non-executive directors are
recommended by the RNC to the Board which, in
turn, proposes the fees for approval by the
shareholders at the AGM.
REMUNERATION REPORT CONTINUED
Non-Executive Directors may be contracted to
render services to the Group in addition to the
aforegoing services from time to time. Details of the
fees paid to each of the Non-Executive Directors
during the year are reflected on pages 172 and 173.
The Board resolved at its meeting held on
30 June 2015 that Non-Executive Directors’
remuneration be increased for the 2016 financial
year by 6%, subject to the approval of shareholders.
The proposed fees payable to Non-Executive Directors are set out below:
Services as Directors Current fee Proposed fee
– Chairman of the Board (per annum) R893 262 R946 858
– Board members (per meeting) R40 899 R43 353
Audit, Risk and Compliance Committee (per meeting)
– Chairman R56 804 R60 212
– Member R34 083 R36 128
Remuneration and Nomination Committee (per meeting)
– Chairman R45 443 R48 170
– Member R27 267 R28 903
Investment Committee (per meeting)
– Chairman R34 083 R36 128
– Member R20 450 R21 677
Transformation, Social and Ethics Committee (per meeting)
– Chairman R34 083 R36 128
– Member R20 450 R21 677
Ad hoc Committee (per meeting)
– Chairman R34 083 R36 128
– Member R20 450 R21 677
On behalf of the Remuneration Committee:
GD HarlowChairman
23 October 2015
65
BLU
E L
AB
EL IN
TE
GR
AT
ED
AN
NU
AL R
EP
OR
T 2
01
5
The Audit, Risk and Compliance Committee (ARCC)
is pleased to present its report for the financial year
ended 31 May 2015.
The Committee is an independent statutory
committee appointed by the shareholders of the
Company. In addition to its statutory duties the
Board has delegated further duties to the
Committee. This report covers both these sets
of duties and responsibilities.
MANDATE AND TERMS OF REFERENCEThe Committee has adopted comprehensive and
formal terms of reference which have been
approved by the Board and which are reviewed
on an annual basis. The responsibilities of the
ARCC include:
• examining and reviewing the Group’s financial
statements and reporting of interim and
final results;
• reviewing and considering, for recommendation
to the Board, the consolidated budget for the
ensuing financial year;
• overseeing integrated reporting;
• overseeing the Internal Risk and Compliance
Committee function;
• monitoring the risk management framework and
assess the risks impacting the Group’s ability to
achieve its strategic objectives;
• reviewing and satisfying itself of the expertise,
resources and experience of the Blue Label
finance function;
• overseeing the internal audit function and
internal financial control process;
• recommending the appointment of the external
auditor and overseeing the external audit process
including their audit fee, independence, nature
and extent of any non-audit services; and
• monitoring compliance activities.
MEMBERSHIP AND MEETINGS HELDIn accordance with the requirements of the
Companies Act, No 71 of 2008 (the Act) Messrs
JS Mthimunye, GD Harlow and SJ Vilakazi were
appointed to the Committee by shareholders
at the Annual General Meeting held on
28 November 2014.
Membership of the Committee remained
unchanged during the year under review: • JS Mthimunye (Independent Non-Executive
Chairman) • GD Harlow (Independent Non-Executive Director) • SJ Vilakazi (Independent Non-Executive Director)
The members of the Committee collectively have
experience in audit, accounting, commerce,
economics, law, corporate governance and general
industry. All of the members of the ARCC are
independent non-executive directors.
The Committee meets quarterly and the quorum for
each meeting is three members present throughout
the meeting. Mandatory attendees at the meetings
are the Joint Chief Executive Officers and the
Financial Director of Blue Label. The external audit
partner from PricewaterhouseCoopers Inc. (PwC)
and a director from KPMG Services Proprietary
Limited (KPMG), to whom Blue Label outsources
its internal audit function, are also attendees.
Both internal and external auditors are afforded
the opportunity to address the meeting and
have unlimited access to the Committee. During
the year, the Committee met with the external
and internal auditors respectively without the
presence of management. The internal audit
function reports directly to the ARCC and is also
responsible to the Financial Director on day-to-day
administrative matters.
AUDIT, RISK AND COMPLIANCE COMMITTEE REPORT
66
BLU
E L
AB
EL IN
TE
GR
AT
ED
AN
NU
AL R
EP
OR
T 2
01
5
announcements and the accounting policies and
recommended these to the Board for approval;
• reviewed and recommended to the Board for
adoption the consolidated budget for the ensuing
financial year; and
• considered the going concern status of the
Company and Group on the basis of review of
the annual financial statements and the
information available to the Committee and
recommended such going concern status for
adoption by the Board. The Board statement on
the going concern status of the Group and
Company is contained on page 87 in the
Directors’ report.
External audit and non-audit services
The ARCC has satisfied itself as to the independence
of the external auditor, PwC, as set out in section
94(7) of the Act, which includes consideration of
compliance with criteria relating to independence or
conflicts of interest as prescribed by the Independent
Regulatory Board for Auditors. Requisite assurance
was sought from and provided by PwC that internal
governance processes within the firm support and
demonstrate its claim to independence.
To assess the effectiveness of the external auditors,
the Committee considered PwC’s fulfilment of the
agreed audit plan and variations from the plan,
and the robustness and perceptiveness of PwC
in its handling of key accounting treatments
and disclosures.
The Committee, in consultation with Executive
Management, agreed to the engagement letter,
terms, audit plan and budgeted audit fees for the
2015 financial year.
STATUTORY DUTIES DISCHARGEDIn execution of its statutory duties during the year
under review, the Committee:
• nominated and recommended to shareholders
the reappointment of PwC as independent
external auditors, with Deon Storm the audit
partner as the registered independent auditor;
• approved the fees to be paid to PwC and other
external auditors, where applicable, and
approved the terms of engagement;
• maintained a non-audit services policy which
determines the nature and extent of any
non-audit services that PwC may provide to
the Group;
• discharged those statutory duties as prescribed by
section 94 of the Act acting in its capacity as the
appointed audit committee of the subsidiary
companies of Blue Label;
• considered the Committee’s report describing
how duties have been discharged; and
• submitted matters to the Board concerning the
Company’s accounting policies, financial controls,
records and reporting, as appropriate.
OTHER DUTIES DISCHARGEDFinancial statements and reporting
The Committee:
• monitored compliance with accounting standards
and legal requirements and ensured that all
regulatory compliance matters had been
considered in the preparation of the financial
statements;
• reviewed the external auditor’s report to the
Committee and management’s responses thereto
and made appropriate recommendations to the
Board of Directors regarding actions to be taken;
• reviewed and commented on the annual financial
statements, interim reports, paid advertisements,
AUDIT, RISK AND COMPLIANCE COMMITTEE REPORT CONTINUED

67
BLU
E L
AB
EL IN
TE
GR
AT
ED
AN
NU
AL R
EP
OR
T 2
01
5
Risk management and compliance
The Committee:
• reviewed the integrity of the risk control systems
and ensured that the risk policies and strategies
of the Company are effectively managed;
• made recommendations to the Board concerning
the levels of tolerance and risk appetite;
• monitored bi-annual risk assessments;
• ensured that management considered and
implemented appropriate risk responses;
• reviewed legal matters that could have a material
impact on the Group;
• reviewed developments in corporate governance
and best practice and considered their impact
and implications across the Group with particular
reference to the principles of King III.
EXPERTISE AND EXPERIENCE OF THE FINANCIAL DIRECTOR AND FINANCE FUNCTIONThe Committee considered the appropriateness
of the expertise and experience of the Financial
Director and finance function in accordance with
the JSE Listings Requirements and governance best
practice. The ARCC concluded that the finance
function is adequately resourced with technically
competent individuals and is effective. The
Committee confirms that it is satisfied that Dean
Suntup possesses the appropriate expertise and
experience to discharge his responsibilities as
Financial Director.
Any non-audit services to be provided by the
external auditors are governed by a formal written
policy which incorporates a monetary delegation
of authority in terms of non-audit services to be
provided. The non-audit services rendered by
the external auditors during the year ended
31 May 2015 comprised tax advisory services, tax
compliance services and general advisory services.
The fees applicable to the aforementioned services
totalled R0.5 million (2014: R1.6 million).
The ARCC has nominated, for approval at the
Annual General Meeting, the reappointment of PwC
as registered auditors for the 2016 financial year.
The Committee also satisfied itself that PwC is
accredited and appears on the JSE List of Accredited
Auditors as contemplated in paragraph 3.86 of the
JSE Listings Requirements.
Internal audit and internal controls
The Committee:
• reviewed the co-operation and co-ordination
between the internal and external audit functions
to avoid duplication of work. This will be further
formalised through a combined assurance
facilitation;
• examined and reviewed the progress made by
internal audit against the approved 2014/15 audit
plan;
• approved the internal audit plan for the 2015/16
financial year;
• considered the effectiveness of internal audit;
• considered internal audit findings and corrective
actions taken in response to such findings; and
• reviewed the effectiveness of the systems of
internal control, including internal financial
control and risk management.
AUDIT, RISK AND COMPLIANCE COMMITTEE REPORT CONTINUED

68
BLU
E L
AB
EL IN
TE
GR
AT
ED
AN
NU
AL R
EP
OR
T 2
01
5
statements for the year ended 31 May 2015. The
Committee, further, has considered the
sustainability information as disclosed in the
integrated annual report and assessed its
consistency with operational and other
information known to Committee members.
• As recommended by King III, internal audit
provided a written assessment on internal
financial controls to the ARCC.
• The Committee recommended the approval
of the integrated annual report to the Board.
On behalf of the Audit, Risk and Compliance
Committee
JS Mthimunye Chairman
23 October 2015
ANNUAL FINANCIAL STATEMENTSThe Committee has reviewed the accounting policies
and financial statements of the Company and the
Group and is satisfied that they are appropriate and
comply with International Financial Reporting
Standards, the JSE Listings Requirements and the
requirements of the Act.
The Committee recommended the approval of the
adoption of the annual financial statements to
the Board.
The ARCC is satisfied that it complied with its legal,
regulatory and other responsibilities as per its terms
of reference.
The contents of the ARCC report have been
approved by the Committee on 17 August 2015 and
read by PwC as at 18 August 2015. Subsequent to
this date, the Committee has performed the
following responsibilities:
• The Committee considered the integrated annual
report, incorporating the annual financial
AUDIT, RISK AND COMPLIANCE COMMITTEE REPORT CONTINUED

69
BLU
E L
AB
EL IN
TE
GR
AT
ED
AN
NU
AL R
EP
OR
T 2
01
5
SOCIAL, ETHICS AND TRANSFORMATION COMMITTEE REPORT
DEAR STAKEHOLDERSI am pleased to report on the activities of the Committee for the financial year ended 31 May 2015.
The Committee was formed in February 2012 in accordance with section 72(4) of the Act and operates under Board-approved terms of reference, which include meeting twice per financial year.
Two main items occupied the Committee’s deliberations during the year: • Transformation in the workplace: Current
initiatives and reviewing their effectiveness, designing a roadmap to address equity B-BBEE shortfalls, Company and subsidiary B-BBEE ratings, and impacts of the revised and clarified dti codes of good practice.
• Support for the Boys & Girls Clubs of South Africa (BGCSA): The flagship project to provide significant and sustainable support for the Protea Glen Club was approved during the year. The Committee undertook a comprehensive visit to the construction site in March 2015 and met with stakeholders, including representatives of BGCSA, Tupperware and the contractors. Following completion of the facilities in July 2015, the club will be formally opened later this year.
The Committee also considered the following matters: • Current and new training and development
programmes, including Board participation, leadership and mentoring programmes.
• Consideration of the feedback provided by the Chairman of the Employment Equity Committee.
• 10 principles of the United Global Compact. • Business ethics statement and whistleblowing
policy. • Health and safety performance across the Group. • Monitoring and spend of CSI projects. • Current donations and sponsorships.
I look forward to reporting on our progress next year.
SJ VilakaziChairman
23 October 2015

70
BLU
E L
AB
EL IN
TE
GR
AT
ED
AN
NU
AL R
EP
OR
T 2
01
5
SOUTH AFRICAN DISTRIBUTION This business segment distributes prepaid products and transactional services to the South African wholesale and retail markets, covering a diverse distribution footprint reaching all LSM groups.
Its product range includes prepaid airtime, electricity and water, starter packs and data, event and transport ticketing and financial services that include merchant acquiring.
South African Distribution contributes 98% to Group revenue.
OverviewAs the leading distributor of prepaid airtime and electricity in South Africa, augmented by an expanding suite of products and services, this segment is well positioned to supply its customers through its widespread POS network of approximately 150 000 devices. Distribution capabilities range from independent stores, wholesalers, petroleum forecourts, spaza shops and Mom & Pop stores, through to numerous banking outlets and the multi-channel retail chains.
The informal sector contributes approximately 85% to South African Distribution’s revenue. Services to rural areas are facilitated by a fleet of trucks accompanied by footsoldiers. In this direct distribution model, innovative transactions and incentives are implemented, value is added directly to the consumers, in turn solidifying relationships with merchants.
The remaining 15% of revenue is derived from the formal corporate and retail sectors, in which the Group continues to capitalise on its base. During the year agreements were concluded that will afford greater access to new distribution channels. The acquisition of RMCS in 2014 has enhanced the reach into the retail channel. By managing the front end of retailers’ businesses, ensures that the full suite of Blue Label products and services is available to consumers at these outlets. Distribution to urban merchants is supported through the Group’s proprietary technology platforms.
The trend in consumers opting for “PINless or direct top-up” as an alternative redemption method for prepaid airtime, continues to escalate. During the past year sales through these means increased from R1.7 billion to R2.7 billion.
Airtime and starter packs
Prepaid airtime, starter packs and data Prepaid airtime, starter pack and data sales continue to comprise the majority of this segment’s profits.
The Group’s prepaid airtime products are differentiated in the market, as they include community-based and customised benefit starter packs, such as healthcare cover and insurance policies for accidental death and funeral plans. Prepaid airtime sales are augmented by voucher sales that are utilised for data downloads and other online data products. Merchant acceptance of low-cost POS terminals and “business in a box” continues to gain momentum.
The importance of a targeted approach is that starter packs are distributed to market in a strategic manner which maximises activation which in turn results in a monthly compounded annuity revenue stream.
The Prepaid Company is the leading distributor of prepaid products for all the major network operators. It facilitates, manages and maintains the distribution of the group’s bouquet of products and starter packs, including the distribution of approximately 80 million bulk print vouchers per month. These services are supported by proven proprietary technology, which ensures purchasing efficiency and inventory control. Relationships with each of the network operators are key to the success of this business. It is responsible for supplier agreements and procurement for the Group, wholesale and community sales, starter packs, handsets, tablets and facilitating its merchants with bulk airtime printing capabilities. Group treasury falls under its ambit.
OPERATIONAL OVERVIEW
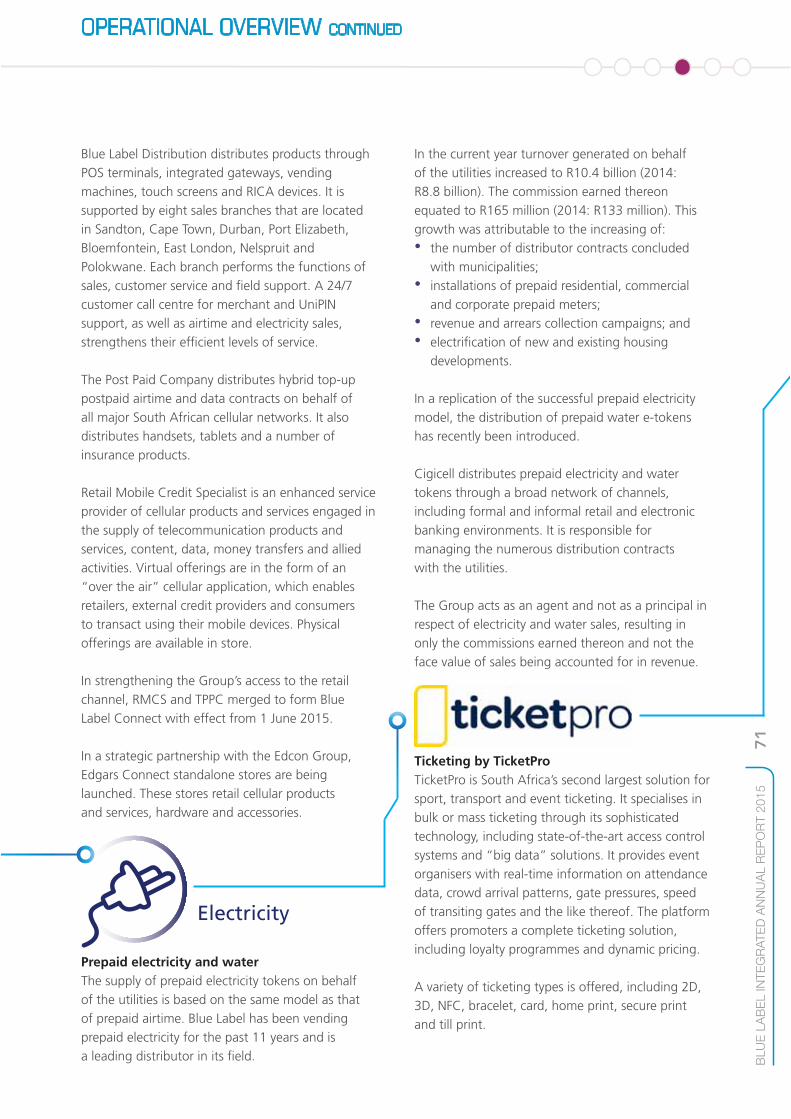
71
BLU
E L
AB
EL IN
TE
GR
AT
ED
AN
NU
AL R
EP
OR
T 2
01
5
In the current year turnover generated on behalf of the utilities increased to R10.4 billion (2014: R8.8 billion). The commission earned thereon equated to R165 million (2014: R133 million). This growth was attributable to the increasing of: • the number of distributor contracts concluded
with municipalities; • installations of prepaid residential, commercial
and corporate prepaid meters; • revenue and arrears collection campaigns; and • electrification of new and existing housing
developments.
In a replication of the successful prepaid electricity model, the distribution of prepaid water e-tokens has recently been introduced.
Cigicell distributes prepaid electricity and water tokens through a broad network of channels, including formal and informal retail and electronic banking environments. It is responsible for managing the numerous distribution contracts with the utilities.
The Group acts as an agent and not as a principal in respect of electricity and water sales, resulting in only the commissions earned thereon and not the face value of sales being accounted for in revenue.
Ticketing by TicketPro TicketPro is South Africa’s second largest solution for sport, transport and event ticketing. It specialises in bulk or mass ticketing through its sophisticated technology, including state-of-the-art access control systems and “big data” solutions. It provides event organisers with real-time information on attendance data, crowd arrival patterns, gate pressures, speed of transiting gates and the like thereof. The platform offers promoters a complete ticketing solution, including loyalty programmes and dynamic pricing.
A variety of ticketing types is offered, including 2D, 3D, NFC, bracelet, card, home print, secure print and till print.
Blue Label Distribution distributes products through POS terminals, integrated gateways, vending machines, touch screens and RICA devices. It is supported by eight sales branches that are located in Sandton, Cape Town, Durban, Port Elizabeth, Bloemfontein, East London, Nelspruit and Polokwane. Each branch performs the functions of sales, customer service and field support. A 24/7 customer call centre for merchant and UniPIN support, as well as airtime and electricity sales, strengthens their efficient levels of service.
The Post Paid Company distributes hybrid top-up postpaid airtime and data contracts on behalf of all major South African cellular networks. It also distributes handsets, tablets and a number of insurance products.
Retail Mobile Credit Specialist is an enhanced service provider of cellular products and services engaged in the supply of telecommunication products and services, content, data, money transfers and allied activities. Virtual offerings are in the form of an “over the air” cellular application, which enables retailers, external credit providers and consumers to transact using their mobile devices. Physical offerings are available in store.
In strengthening the Group’s access to the retail channel, RMCS and TPPC merged to form Blue Label Connect with effect from 1 June 2015.
In a strategic partnership with the Edcon Group, Edgars Connect standalone stores are being launched. These stores retail cellular products and services, hardware and accessories.
Electricity
Prepaid electricity and water The supply of prepaid electricity tokens on behalf of the utilities is based on the same model as that of prepaid airtime. Blue Label has been vending prepaid electricity for the past 11 years and is a leading distributor in its field.
OPERATIONAL OVERVIEW CONTINUED

72
BLU
E L
AB
EL IN
TE
GR
AT
ED
AN
NU
AL R
EP
OR
T 2
01
5
A money transfer solution, developed in collaboration with Group companies, RMCS and Oxigen Services India, will be launched to market later this year.
Technology The Technology division is housed in the South African Distribution segment as the bulk of its functions and services are interdependent with the distribution of airtime, starter packs, electricity and ticketing.
The proprietary AEON and AMS systems, as well as the banking and financial services grade Postilion platform, entrenches the Group’s capability as a neutral aggregator in connecting to mobile networks, utilities, banks, retailers, petroleum companies and POS devices.
This year, in an environment of steadily increasing transaction volumes driven by organic and acquisitive growth, the platforms remained stable. Technology supports in excess of 5 billion transactions per annum, peaking at approximately 4 million online transactions in a day. Transaction Junction provides the Group’s banking grade switching capability which includes EFTs.
During the year operating management processes and procedures were tested. Internal penetration tests and external vulnerability assessments revealed no significant issues. The South African Distribution segment’s contribution to core net profit equated to R685 million (2014: R559 million).
During the year an increasing number of sports unions, event managers, commuter groups, concerts, hospitality and lifestyle shows, festivals and expos went live with TicketPro, enabling Blu Approved retail outlets to add ticketing to their product range. New distribution partners include The TicketPro Dome and Nasrec’s Johannesburg Expo Centre and Show Grounds.
The TicketPro Dome is an iconic landmark in Johannesburg, and was voted the best exhibition and concert venue in South Africa for 14 consecutive years. A long-term agreement includes naming and branding rights, ticketing and access management of approximately 44 events per year. Nasrec is the home of the Rand Show and Lifestyle Show. A long-term contract provides turnkey ticketing and access control solutions.
Financial services In support of financial inclusion of unbanked and underbanked communities, an increasing number of financial services are available, including bill payments, merchant acquiring and money transfers.
This year, growth in the volume of bill payment transactions was approximately 33%. Payments in this regard include TV licences, satellite TV subscriptions, telephone landlines, traffic fines, municipal rates and taxes, electricity accounts, funeral policies, education and school fees and furniture accounts.
During the year EMV certification and user acceptance testing was successfully completed in support of credit and debit card acquiring arrangements with MasterCard and Absa.
OPERATIONAL OVERVIEW CONTINUED
Blu ApprovedBlu Approved is the Group’s brand that is displayed at its points of presence.
Blu Approved serves as a stamp of approval and authenticity, duly endorsed and acknowledged by Blue Label.
Each Blu Approved merchant is equipped with an in-store Blu Approved device and clearly identifiable merchandising tools.
73
BLU
E L
AB
EL IN
TE
GR
AT
ED
AN
NU
AL R
EP
OR
T 2
01
5
ViamediaViamedia is a mobile content and value-added services provider. Its technology platform connects to all of the network operators, offering the best of breed in mobile services. These include mobile terminate and originate and premium rated SMSs, online billing, multimedia messaging, WAP and web services, USSD and interactive voice response. Viamedia offers its partners the ability to sell mobile entertainment, information and communication services to consumers through a variety of media and technology channels.
SOLUTIONS This segment specialises in providing data and analytical support services, as well as inbound customer care and outbound telesales contact centre services.
The Solutions segment houses CNS, Velociti and Blue Label call centres, Datacision, Forensic Intelligence Data Solutions, Datacel Direct and Blue Label Data Solutions.
BLDS is one of South Africa’s market leaders in consumer data, big data, validation, verification, cleansing of data and lead generation. BLDS is accredited by the Direct Marketing Association of South Africa, of which it is a founding member.
Its databases cover in excess of 61 million consumers, with qualifying lead generation exceeding 2.2 million consumers. A further 1 million unique leads were provided during the past year.
Core net profit contribution from this segment equated to R24 million (2014: R13 million).
MOBILE This segment provides mobile phone users with a complete ecosystem of services that include smartphone applications, WAP, MMS, e-mail, LBS, instant messaging, web messaging, SMS and USSD.
Mobile’s capability allows for the rapid roll out of mobile-mediated sales, financial services, banking, couponing, loyalty, rewards, ticketing, transport, NFC, media advertising, gaming and location-based services. The technologies and products developed enable its customers to reach their customers, agnostic to any phone type or any mobile operator. Core net profit contribution from this segment amounted to R29 million (2014: R25 million).
During the year the Group’s interest in Blue Label Engage was disposed of. The predominant remaining companies within the Mobile segment are:
Cellfind Cellfind is the Group’s WASP, aggregator and location-based services provider, predominantly deriving annuity income from location-based services delivered to the major mobile network operators.
Its offerings include intelligent and bulk aggregation as well as the distribution of SMSs, mobile financial services, mobile payslips and LBS. Following the formation of Simigenix with its Electronic Communication Network Service, this licenced hub provides enhanced SMS interconnection and distribution for the main network operators. In a competitive environment, Cellfind continues to process significant volumes in excess of 200 million SMSs per month.
OPERATIONAL OVERVIEW CONTINUED
74
BLU
E L
AB
EL IN
TE
GR
AT
ED
AN
NU
AL R
EP
OR
T 2
01
5
INTERNATIONAL The strategy of the International Distribution segment is to pursue growth opportunities for Group products and services across its global footprint, by systematically rolling out points of presence, in a replication of the proven South African business model. As at the end of March 2015 the Group disposed of its non-controlling interest in Smart Voucher Limited, trading as Ukash.
Blue Label Mexico
The business in Mexico encapsulates a number of
agreements with key participants in the sales and
distribution channels, including the major network
operators and the world’s largest bakery, Grupo
Bimbo, a joint 46.64% shareholder with Blue Label
in BLM.
In September 2014 BLM implemented a strategic
decision to become a multi-carrier for all networks.
This initiative was costly to BLM in that the
dominant network immediately reduced BLM’s
commission. As a result thereof, it took nine months
to regain lost ground incurred, during which both
terminal activity and commissions earned from
other carriers increased.
OPERATIONAL OVERVIEW CONTINUED
The project to expand the distribution network
across Mexico progresses steadily with some
62 000 terminals active at present. BLM continues
to redeploy underperforming devices and to retrofit
mature devices to include financial services
transaction capabilities.
Products and services on offer through BLM’s
technology platform continue to expand. The range
now includes PINless recharge, bill payments, cash
collections, card acquiring through Banamex and
Visa and digital food vouchers through all five major
distributors. Distribution of SIM cards through most
of the major networks and an international money
transfer service are currently being piloted.
Blue Label’s share of losses for the year amounted to
R89 million (2014: R60.8 million loss), consistent
with continued margin compression and an increase
in overhead costs.
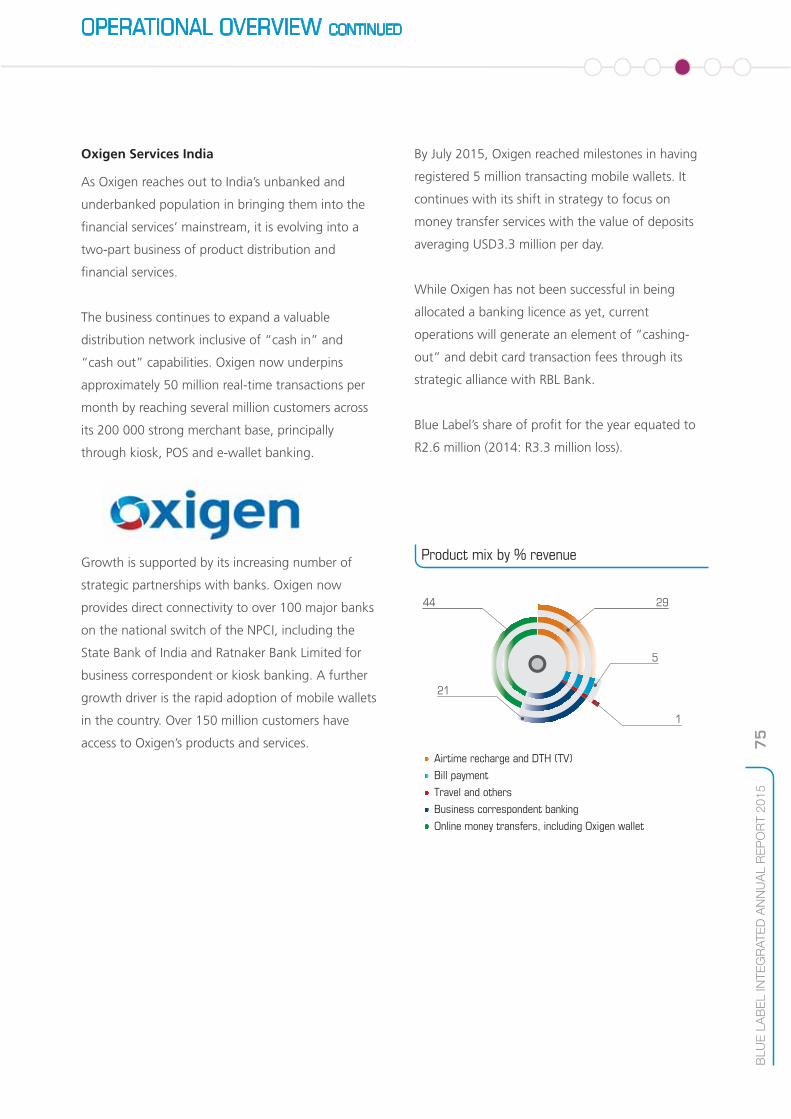
75
BLU
E L
AB
EL IN
TE
GR
AT
ED
AN
NU
AL R
EP
OR
T 2
01
5
By July 2015, Oxigen reached milestones in having
registered 5 million transacting mobile wallets. It
continues with its shift in strategy to focus on
money transfer services with the value of deposits
averaging USD3.3 million per day.
While Oxigen has not been successful in being
allocated a banking licence as yet, current
operations will generate an element of “cashing-
out” and debit card transaction fees through its
strategic alliance with RBL Bank.
Blue Label’s share of profit for the year equated to
R2.6 million (2014: R3.3 million loss).
29
5
44
21
1
Airtime recharge and DTH (TV)
Bill payment
Travel and others
Business correspondent banking
Online money transfers, including Oxigen wallet
Product mix by % revenue
Oxigen Services India
As Oxigen reaches out to India’s unbanked and
underbanked population in bringing them into the
financial services’ mainstream, it is evolving into a
two-part business of product distribution and
financial services.
The business continues to expand a valuable
distribution network inclusive of “cash in” and
“cash out” capabilities. Oxigen now underpins
approximately 50 million real-time transactions per
month by reaching several million customers across
its 200 000 strong merchant base, principally
through kiosk, POS and e-wallet banking.
Growth is supported by its increasing number of
strategic partnerships with banks. Oxigen now
provides direct connectivity to over 100 major banks
on the national switch of the NPCI, including the
State Bank of India and Ratnaker Bank Limited for
business correspondent or kiosk banking. A further
growth driver is the rapid adoption of mobile wallets
in the country. Over 150 million customers have
access to Oxigen’s products and services.
OPERATIONAL OVERVIEW CONTINUED
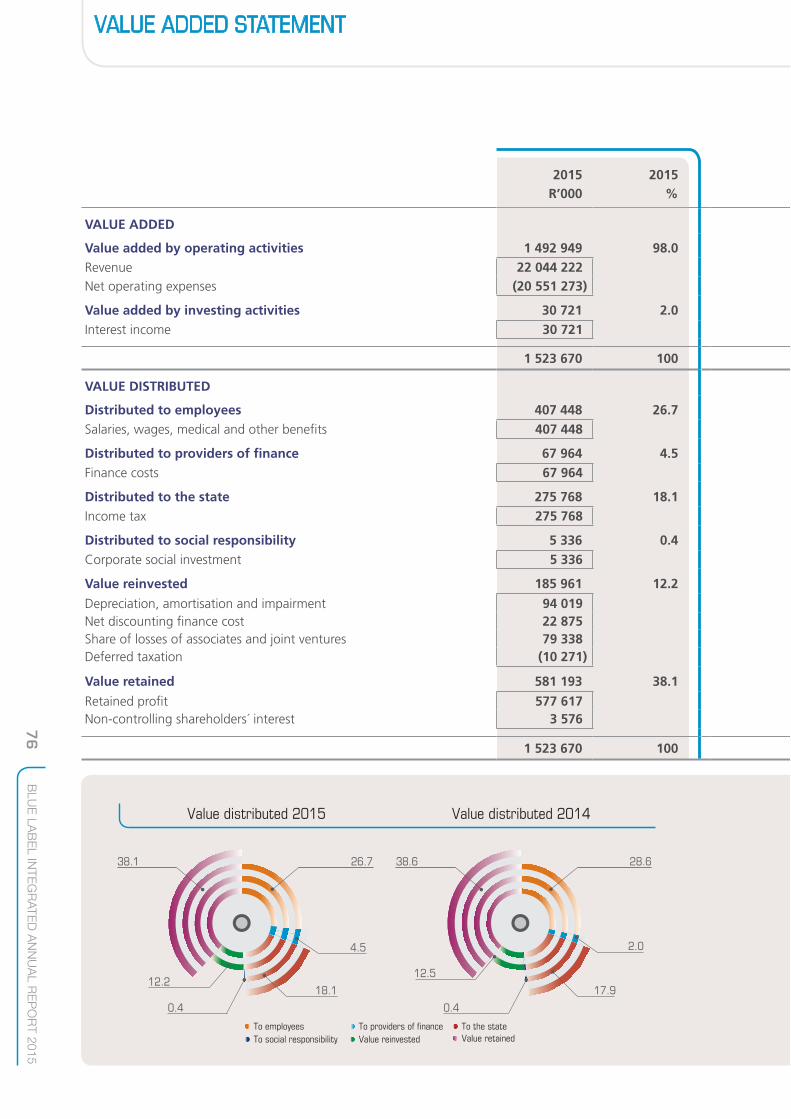
76
BLU
E L
AB
EL IN
TE
GR
AT
ED
AN
NU
AL R
EP
OR
T 2
01
5
VALUE ADDED STATEMENT
VALUE ADDED
Value added by operating activities 1 492 949 98.0 Revenue 22 044 222 Net operating expenses (20 551 273)
Value added by investing activities 30 721 2.0 Interest income 30 721
1 523 670 100
VALUE DISTRIBUTED
Distributed to employees 407 448 26.7 Salaries, wages, medical and other benefits 407 448
Distributed to providers of finance 67 964 4.5 Finance costs 67 964
Distributed to the state 275 768 18.1 Income tax 275 768
Distributed to social responsibility 5 336 0.4 Corporate social investment 5 336
Value reinvested 185 961 12.2
Depreciation, amortisation and impairment 94 019 Net discounting finance cost 22 875 Share of losses of associates and joint ventures 79 338 Deferred taxation (10 271)
Value retained 581 193 38.1
Retained profit 577 617 Non-controlling shareholders´ interest 3 576
1 523 670 100
2015R’000
2015%
26.7
4.5
38.1
18.112.2
0.4
Value distributed 2015 Value distributed 2014
To employeesTo social responsibility Value reinvested
To providers of finance To the state
28.6
2.0
38.6
17.9
12.5
0.4
Value retained

77
BLU
E L
AB
EL IN
TE
GR
AT
ED
AN
NU
AL R
EP
OR
T 2
01
5
2014R’000
2014%
2013R’000
2013%
2012R’000
2012%
1 125 610 96.7 1 050 765 95.9 1 068 131 94.7
19 401 666 18 984 210 18 722 080 (18 276 056) (17 933 445) (17 653 949)
38 807 3.3 45 489 4.1 59 730 5.3
38 807 45 489 59 730
1 164 417 100 1 096 254 100 1 127 861 100
332 542 28.6 332 901 30.4 329 406 29.2
332 542 332 901 329 406
22 993 2.0 23 767 2.2 3 307 0.3
22 993 23 767 3 307
208 996 17.9 215 075 19.6 190 759 16.9
208 996 215 075 190 759
5 075 0.4 4 242 0.4 3 340 0.3
5 075 4 242 3 340
145 896 12.5 112 164 10.2 181 575 16.1
65 137 67 951 91 557 26 440 15 558 66 505 56 873 47 326 19 835 (2 554) (18 671) 3 678
448 915 38.6 408 105 37.2 419 474 37.2
450 230 424 841 438 104 (1 315) (16 736) (18 630)
1 164 417 100 1 096 254 100 1 127 861 100
VALUE ADDED STATEMENT CONTINUED
30.4
2.2
37.2
19.60.4
Value distributed 2013 Value distributed 2012
To employeesTo social responsibility Value reinvested
To providers of finance To the stateValue retained
10.2
29.2
0.3
37.2
16.9
16.1
0.3
78
BLU
E L
AB
EL IN
TE
GR
AT
ED
AN
NU
AL R
EP
OR
T 2
01
5
SOCIAL PRACTICES
The transformation strategy has gained momentum
over the last year. The Group has continued to align
its various transformation initiatives with the
requirements of the B-BBEE codes, which in turn
have been integrated into the planning and roll out
of transformation initiatives.
TRAINING AND DEVELOPMENT The training strategy continues to focus on a
blended learning approach which offers both offline
and online training opportunities. This is housed in
the online Blue Label Academy.
This online facility offers all staff the opportunity to
register and complete accredited courses via the
e-learning portal. Staff have access to over
100 courses ranging from Microsoft-based training
material to assertiveness training, and basic
management skills. This offering means that all staff
throughout the country have access to the same
training material.
In support of the focus on developing and retaining
technological skill sets, the staff in the technology
division have dedicated access to the Safari Books
technical training material. This enables them to
have access to world-class training material on a
flexible and individualised basis.
The offline training focuses on developing sales,
customer service and leadership skills. Most of the
senior and mid-level managers in the larger Group
subsidiaries underwent a 12-month coaching
programme. This is aimed specifically at enhancing
leadership competence and providing them with
skills to ensure that their teams remain focused,
engaged and motivated.
The Group nominated eight candidates from mid
and Senior Management levels, who had been
identified for potentially taking up subsidiary board
positions, for a Directors’ development course. The
nine-month programme is aimed at providing
participants with the skills necessary to acquit
themselves at Senior Management and Board level.
Incumbents were further supported by internal
mentors and external coaching. The programme
culminated in a report to the Blue Label Board.
The total training and development spend for the
Group for the financial year totalled R3.9 million
(2014: R5.4 million).
LEARNERSHIPS The Group continues to support various learnerships
via its partnership with Bytes People Solutions. This
year 13 learners (2014: 240) were hosted within the
Group’s subsidiaries. The decline was mainly due to
the KwaZulu-Natal branch of the Services SETA not
issuing any funded learnerships for Velociti for the
review period.
Each learner is mentored through the period of their learnership. Of the 13 learners, four are disabled (2014: three), while 69% is female (2014: 60%).
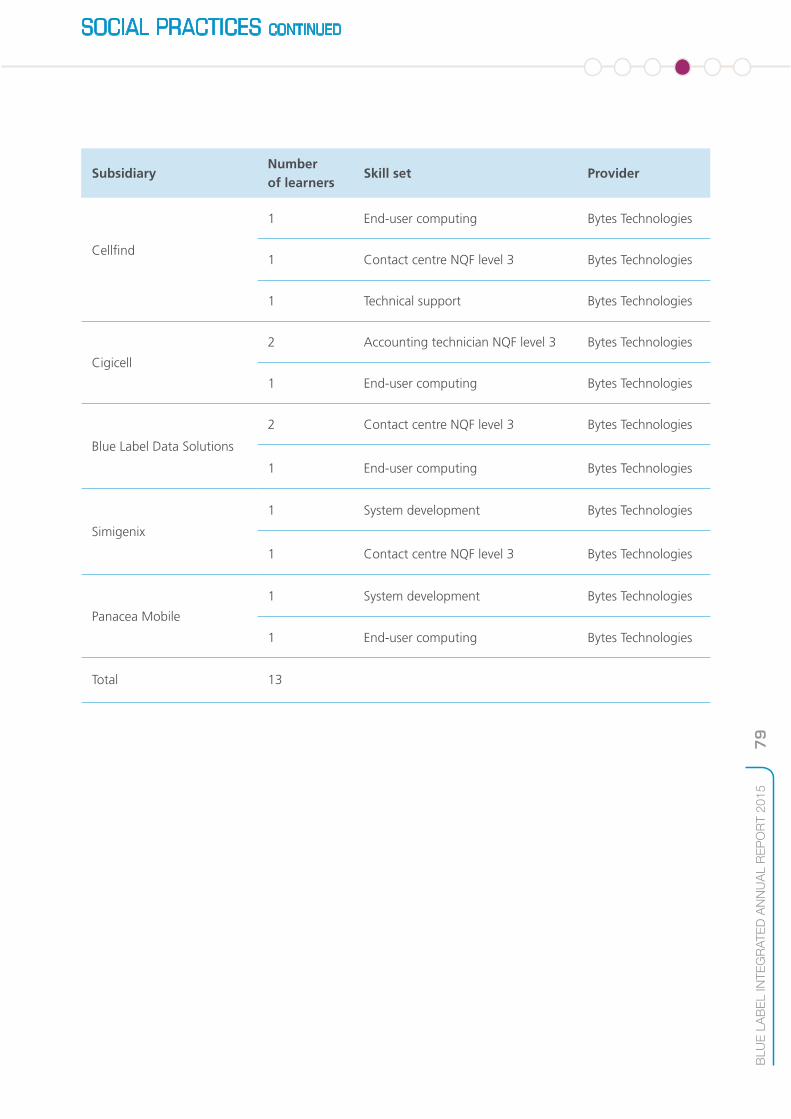
79
BLU
E L
AB
EL IN
TE
GR
AT
ED
AN
NU
AL R
EP
OR
T 2
01
5
SOCIAL PRACTICES CONTINUED
SubsidiaryNumber of learners
Skill set Provider
Cellfind
1 End-user computing Bytes Technologies
1 Contact centre NQF level 3 Bytes Technologies
1 Technical support Bytes Technologies
Cigicell
2 Accounting technician NQF level 3 Bytes Technologies
1 End-user computing Bytes Technologies
Blue Label Data Solutions
2 Contact centre NQF level 3 Bytes Technologies
1 End-user computing Bytes Technologies
Simigenix
1 System development Bytes Technologies
1 Contact centre NQF level 3 Bytes Technologies
Panacea Mobile
1 System development Bytes Technologies
1 End-user computing Bytes Technologies
Total 13

80
BLU
E L
AB
EL IN
TE
GR
AT
ED
AN
NU
AL R
EP
OR
T 2
01
5
SOCIAL PRACTICES CONTINUED
ENTERPRISE DEVELOPMENT TPC continues to provide financial assistance and strategic support to ZOK, which aims to empower budding entrepreneurs from previously disadvantaged communities, by equipping them with a fully functional shipping container equipped as a retail solution provider.
Parkrun SA is a 50% black-owned business. The Group maintains its support for Parkrun SA, assisting both strategically and operationally. It has the objective of setting up venues throughout South Africa where all people, irrespective of race, gender, age, income bracket or fitness level, may come together once a week to run a 5km time trial, free of charge. Parkrun SA was established in 2011 in a venture between Bruce Fordyce and Blue Label, in addition to which Discovery Vitality and adidas are current major sponsors.
The Group was instrumental in establishing Marvellous Car Wash, a 100% black-owned entity, providing car valet and staff shuttle bus services at its head office. It recently expanded by securing the contract to wash cars at a neighbouring building to 75 Grayston Drive.
PREFERENTIAL PROCUREMENTThe Group continues to source goods and services from B-BBEE compliant suppliers, in terms of the B-BBEE Act.
SOCIO-ECONOMIC DEVELOPMENTThe Group continues to focus on youth, education and HIV prevention programmes, and where possible, on projects where staff are actively involved. To this end the Group contributed R5.3 million (2014: R5.1 million).
This year saw the completion of the Group’s flagship SED initiative, the Boys & Girls Clubs of South Africa (BGCSA) club house in Protea Glen. The club house was built using the environmentally friendly plastic bottle technology for its walling infrastructure. The 700m2 facility was completed in July 2015 and accommodates up to 400 children drawn from the surrounding community.
A number of Group SED beneficiaries are also collaborating in the project. Women and Men against Child Abuse provide a social worker, and Afrika Tikkun is planning to introduce its “Work Readiness Programme” among school leavers.
The club offers aftercare facilities to children of school going age where they are offered a meal, provided with supervision of academic activities, and exposed to various sports, such as basketball and netball, and other extramural activities in a safe and caring environment.

81
BLU
E L
AB
EL IN
TE
GR
AT
ED
AN
NU
AL R
EP
OR
T 2
01
5
HUMAN CAPITAL
Kos Competition, Women’s Day and World Aids Day. On Vitality days, staff on Discovery medical aid may undergo various health checks, while earning points towards their vitality status. Wellness programmes are positively supported by all.
A monthly internal newsletter is e-mailed to staff across the Group, sharing news on operational highlights, important events, achievements, profiling companies and employees, while recognising standout performers, called “Super Heros”.
The Group’s management views incidents of child or forced labour as morally abhorrent, and consequently does not allow such activities. The Group upholds the protection provided by the Constitution of the Republic of South Africa, the Bill of Rights, and labour laws.
EMPLOYMENT EQUITY The Group promotes and supports equal opportunity and fair treatment of all staff in accordance with its employment equity policy. The Group’s recruitment policies and procedures enable staff and external candidates to compete for job and/or promotional opportunities in an equitable environment where the sole criterion is merit based.
The Employment Equity Committee meets quarterly to discuss and review various matters such as barriers to employment and affirmative action initiatives.
Subsidiary company employment equity performance relative to targets is recorded and monitored and reported to the Social and Ethics Committee. The Group continues to be non-unionised.
The Group progresses in its efforts to attract and retain key talent. As a matter of policy, companies make a concerted effort to promote staff already in their employ when opportunities arise. The Group partners with recruitment agencies and executive search companies, while its appointments network also include social media channels.
All new staff, usually on their first day of work, participate in a detailed induction, which covers an introduction to the Group, its vision, mission, ethics, products and services, recent financial performance, management team, health and safety requirements, policies, procedures and processes.
All new employees automatically gain access to the Group’s various benefits, such as medical aid, Group life scheme, wellness programmes and free access to Group products and services.
The Group life benefit scheme is fully funded and includes death, disability, dreaded disease and funeral benefits. Membership of Discovery Health is compulsory for all new permanent employees earning over R6 500 per month. For staff earning less than this amount, Boncap Medical Aid is available.
All changes to terms and conditions of employment, including any changes to significant operational matters, are dealt with in a consultative manner with staff, with the objective of mutual consensus.
Staff (excluding those at Velociti) have relevant job descriptions containing detailed KPAs and KPIs. Each job has been rated on the Patterson Grading System. Performance assessments are conducted bi-annually and linked to remuneration and incentive structures. Skills development plans are referenced to job descriptions, KPAs and KPIs. The entire process is managed via the employee self-help module on Psiber.
The Group regularly hosts social and wellness days at head office. These include blood drives in partnership with the South African National Blood Service, food parcel and winter blanket collections for the needy, Bandanna Day, Slipper Day, a Potjie

82
BLU
E L
AB
EL IN
TE
GR
AT
ED
AN
NU
AL R
EP
OR
T 2
01
5
HUMAN CAPITAL CONTINUED
The table below reflects the demographics of the employee base over three years, excluding international operations.
Levels AM CM IM WM AF CF IF WFTotal2015
Total2014
Total2013
Unskilled and defined decision-makers 24 1 3 1 22 1 0 0 52 62 72
Semi-skilled and discretionary decision-makers 62 16 14 19 79 17 4 29 240 239 131
Skilled technical and academically qualified workers, junior management and supervisors 49 15 34 114 32 14 26 67 351 280 224
Professionally qualified and experienced specialists and mid-management 3 3 10 50 3 1 8 14 92 81 94
Senior Management 0 0 6 17 0 0 2 8 33 32 57
Top Management 2 0 0 23 1 0 0 1 27 36 35
Total permanent 140 35 67 224 137 33 40 119 795 730 613
Non-permanent staff 126 8 33 2 276 25 35 5 510 446 499
Grand total 266 43 100 226 413 58 75 124 1 305 1 176 1 112
AM: African male, CM: Coloured male, IM: Indian male, WM: White male, AF: African female, CF: Coloured female, IF: Indian female, WF: White female.
The headcount increased approximately 10% over the year, largely due to strengthening the technical and skilled resources, and additional staffing at the call centre.
The consolidated Group Employment Equity Report was approved by the Department of Labour.

83
BLU
E L
AB
EL IN
TE
GR
AT
ED
AN
NU
AL R
EP
OR
T 2
01
5
HEALTH AND SAFETY RESPONSIBILITY PRACTICES
The Group health and safety policy articulates the Group’s commitment to ensuring a secure work environment for all, and is implemented in accordance with the guidelines set out in the OHS Act. Regular fire drills, monthly health and safety forum meetings and regular training workshops for elected representatives in respect of first aid, fire marshalling and evacuation procedures, are held.
Health and safety activities include: • Appointment of a Group Health and Safety
Manager who assumes full responsibility for the management and facilitation of health and safety-related activities inclusive of policy, practices and procedures nationally.
• Appointment and training of health and safety representatives, first aiders, and fire marshalls at head office and branches nationally.
• Facilitated and documented meetings conducted monthly to evaluate Group health and safety performance and requirements.
• Identification of all health and safety hazards by means of a formal hazard survey done monthly and taking appropriate action to mitigate identified risks.
• Display all relevant health and safety plans, evacuation procedures and policies in strategic points throughout the business.
• Create awareness and training of employees around health and safety requirements via rigorous induction, regular drills and awareness presentations.
• Conducting business activities in a manner which ensures the general wellbeing of our staff from a physical, mental and social perspective.
• Regular evaluation of Group practices compared to relevant health and safety legislation.
The Group reported nine non-reportable health and safety incidents during the year under review.
Disabling injury frequency rate 2015 2014 2013 2012
South Africa 0.92 0.74 0.62 1.102
Work-related fatalities 0 0 1 0
The disabling injury frequency rate (DIFR) increased to 0.92. This is due to increasing awareness among staff in reporting workplace injuries. The majority of incidents are ascribed to motor vehicle accidents and slipping on stairs. Staff are regularly reminded to exercise caution when descending stairs, by using the two-point contact technique.
Staff are offered a “Wellness for Life” programme for addressing and reducing stress levels. The programme partners with organisations specialising in debt counselling, trauma counselling, substance abuse and physical wellbeing, including advice on HIV/Aids, cancer, tuberculosis and diabetes. Advice from service providers in life and short-term insurance, financial planning and retirement funding is also regularly available.
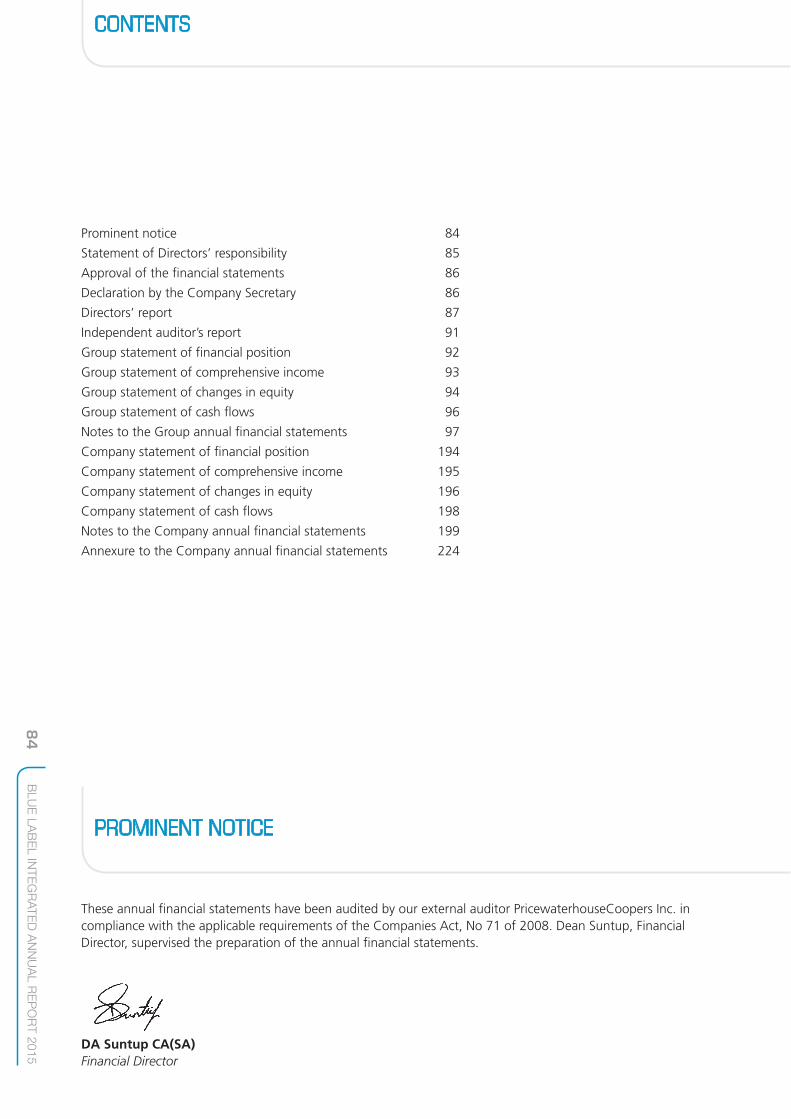
84
BLU
E L
AB
EL IN
TE
GR
AT
ED
AN
NU
AL R
EP
OR
T 2
01
5
PROMINENT NOTICE
These annual financial statements have been audited by our external auditor PricewaterhouseCoopers Inc. in compliance with the applicable requirements of the Companies Act, No 71 of 2008. Dean Suntup, Financial Director, supervised the preparation of the annual financial statements.
DA Suntup CA(SA)Financial Director
Prominent notice 84
Statement of Directors’ responsibility 85
Approval of the financial statements 86
Declaration by the Company Secretary 86
Directors’ report 87
Independent auditor’s report 91
Group statement of financial position 92
Group statement of comprehensive income 93
Group statement of changes in equity 94
Group statement of cash flows 96
Notes to the Group annual financial statements 97
Company statement of financial position 194
Company statement of comprehensive income 195
Company statement of changes in equity 196
Company statement of cash flows 198
Notes to the Company annual financial statements 199
Annexure to the Company annual financial statements 224
CONTENTS
85
BLU
E L
AB
EL IN
TE
GR
AT
ED
AN
NU
AL R
EP
OR
T 2
01
5
STATEMENT OF DIRECTORS’ RESPONSIBILITY
The Directors are responsible for the maintenance of adequate accounting records and the preparation, integrity and fair presentation of the Group and Company financial statements of Blue Label Telecoms Limited. The financial statements have been prepared in accordance with International Financial Reporting Standards (IFRS) and the requirements of the Companies Act, No 71 of 2008 and the JSE Listings Requirements.
The Directors consider that having applied IFRS in preparing the Group and Company financial statements they have selected the most appropriate accounting policies, consistently applied and supported by reasonable and prudent judgements and estimates, and that all IFRS statements that they consider to be applicable have been followed.
The Directors are satisfied that the information contained in the Group and Company financial statements fairly presents the results of operations for the year and the financial position of the Group at year-end. The Directors also prepared the other information included in the Group and Company financial statements and are responsible for both its accuracy and its consistency.
In addition, the Directors are responsible for the Company’s system of internal financial control. This is designed to provide reasonable, but not absolute, assurance as to the reliability of the financial statements, and to adequately safeguard, verify and maintain accountability of the assets, and to prevent and detect misstatement and loss. Nothing has come to the attention of the Directors to indicate that any material breakdown in the functioning of these controls, procedures and systems has occurred during the year under review.
The Group and Company financial statements have been prepared on the going concern basis, since the Directors have every reason to believe that the Group and Company have adequate resources in place to continue in operation for the foreseeable future, based on forecasts and available cash resources. These Group and Company financial statements support the viability of the Group and the Company.
The Group and Company financial statements have been audited by the independent auditors, PricewaterhouseCoopers Inc., who were given unrestricted access to all financial records and related data, including minutes of all meetings of shareholders, the Board of Directors and Committees of the Board. The Directors believe that all representations made to the independent auditors during their audit are valid and appropriate.

86
BLU
E L
AB
EL IN
TE
GR
AT
ED
AN
NU
AL R
EP
OR
T 2
01
5
APPROVAL OF THE FINANCIAL STATEMENTS
For the year ended 31 May 2015
DECLARATION BY THE COMPANY SECRETARY
In terms of section 88(2)(e) of the Companies Act, No 71 of 2008 (the Act), I confirm that for the year ended 31 May 2015, Blue Label Telecoms Limited has lodged with the Companies and Intellectual Property Commission all such returns and notices as are required of a public company in terms of the Act and that all such returns and notices are true, correct and up to date.
J van EdenGroup Company Secretary
Sandton18 August 2015
The financial statements which appear on pages 92 to 223 were produced and approved by the Board of Directors on 18 August 2015 and are signed on its behalf by:
LM Nestadt DA SuntupNon-executive Chairman Financial Director
BM Levy MS LevyJoint Chief Executive Officer Joint Chief Executive Officer
87
BLU
E L
AB
EL IN
TE
GR
AT
ED
AN
NU
AL R
EP
OR
T 2
01
5
DIRECTORS’ REPORT
The Directors have pleasure in presenting the Group and Company annual financial statements of Blue Label Telecoms Limited (Blue Label Telecoms or the Company) and its subsidiary, associate and joint venture companies (the Group) for the year ended 31 May 2015.
PRINCIPAL ACTIVITIES AND STRATEGYBlue Label Telecoms’ core business is the virtual distribution of secure electronic tokens of value and transactional services across its global footprint of touch points. The Group’s stated strategy is to extend its global footprint of touch points, both organically and acquisitively, to meet the significant demand for the delivery of multiple prepaid products and services through a single distributor, across various delivery mechanisms and via numerous merchants or vendors.
FINANCIAL RESULTSThe Group recorded a net profit after tax attributable to equity holders for the year ended 31 May 2015 of R578 million (2014: R450 million). Full details of the financial position and results of the Company, the Group and its segments are set out in the annual financial statements and Group annual financial statements. The Group and Company annual financial statements for the year ended 31 May 2015 were approved by the Board and signed on its behalf on 18 August 2015.
GOING CONCERNThe financial statements have been prepared on the going concern basis, since the Directors have every reason to believe that the Blue Label Telecoms Group and the Company have adequate resources in place to continue in operation for the foreseeable future.
ACQUISITIONSIn September 2014 Blue Label Telecoms Limited purchased 75% of Viamedia Proprietary Limited (Viamedia). The purchase consideration was for an initial sum of R144.4 million plus additional amounts totalling up to R103.1 million if warranted profits are achieved by Viamedia. If the warranted profits are not achieved, the above additional payments will be abated on a pro-rata basis. A further R112.5 million or part thereof will be payable if stretched targets over and above the warranted accumulated profits are achieved. Refer to note 26 of the Group annual financial statements for further information.
In March 2015 Viamedia Proprietary Limited purchased 50% of Supa Pesa Africa (Mauritius) Limited for R0.1 million plus an additional amount of R29.5 million if certain profit warranties are achieved. A further R8 million will be payable if stretched targets over and above the warranted accumulated profits are achieved. Refer to note 6 of the Group annual financial statements for further information.
In September 2014 Blue Label Telecoms Limited advanced a further R49 million to Blue Label Mexico S.A. de C.V.. This amount was capitalised resulting in the Group’s shareholding in Blue Label Mexico S.A. de C.V. increasing to 46.64%. Refer to note 6 of the Group annual financial statements for further information.
DISPOSALIn April 2015 Gold Label Investments Proprietary Limited disposed of its interest in Smart Voucher Limited trading as Ukash for an initial sum of R94.9 million plus additional amounts totalling R17.5 million if certain warranties are achieved. Refer to note 6 of the Group annual financial statements for further information.
SHARE CAPITALFull details of the authorised, issued and unissued capital of the Company at 31 May 2015 are contained in note 13 of the Group annual financial statements. There were no shares issued during the financial year ended 31 May 2015 (2014: nil).
SUBSEQUENT EVENTSSubsequent to year-end, dividend number 6 was declared and approved by the Board.

88
BLU
E L
AB
EL IN
TE
GR
AT
ED
AN
NU
AL R
EP
OR
T 2
01
5
DIRECTORS’ REPORT CONTINUED
DIVIDENDOn 18 August 2015 the Board approved a dividend of 31 cents per ordinary share. The dividend in respect of ordinary shares for the year ended 31 May 2015 of R209 097 803 has not been recognised in the financial statements as it was declared after this date. The salient dates are as follows:
Last date to trade cum dividend Friday, 4 September 2015
Shares commence trading ex dividend Monday, 7 September 2015
Record date Friday, 11 September 2015
Payment of dividend Monday, 14 September 2015
Share certificates may be dematerialised or rematerialised between Monday, 7 September 2015 and Friday, 11 September 2015, both days inclusive.
Before declaring the final dividend the Board applied the solvency and liquidity test on the Company and reasonably concluded that the Company will satisfy the solvency and liquidity test immediately after payment of the final dividend. The final dividend will be paid 26 days after the Directors have performed the solvency and liquidity testing.
Dividends tax is provided for at 15% of the amount of any dividend paid by Blue Label Telecoms, subject to certain exemptions. The dividends tax is a tax borne by the beneficial owner of the dividend and will be withheld by either the issuer of the dividend or by regulated intermediaries.
DIRECTORATEThe following are the details of the Company’s Directors:
Name Office Appointment dateDate and nature of change
Larry M Nestadt Independent Non-Executive Director 5 October 2007 —
Brett M Levy Joint Chief Executive Officer 1 February 2007 —
Mark S Levy Joint Chief Executive Officer 1 February 2007 —
Kevin M Ellerine Non-Executive Director 8 December 2009 —
Gary D Harlow Independent Non-Executive Director 5 October 2007 —
Neil N Lazarus SC Non-Executive Director 5 October 2007 Resigned 27 January 2015
Yusuf Mahomed Independent Non-Executive Director 18 August 2015 Appointed 18 August 2015
Joe S Mthimunye Independent Non-Executive Director 5 October 2007 —
Mark V Pamensky Chief Operating Officer 5 October 2007 —
Dean A Suntup Financial Director 14 November 2013 —
Jeremiah S Vilakazi Independent Non-Executive Director 19 October 2011 —

89
BLU
E L
AB
EL IN
TE
GR
AT
ED
AN
NU
AL R
EP
OR
T 2
01
5
DIRECTORS’ REPORT CONTINUED
DIRECTORS’ INTERESTSThe individual interests declared by Directors and officers in the Company’s share capital as at 31 May 2015, held directly or indirectly, were as follows:
Nature of interest Direct beneficial Indirect beneficial
Director/officer 2015 2014 2014
BM Levy 62 548 690 75 078 183 21 272 778 8 272 778
MS Levy 55 141 282 67 670 775 21 272 777 8 272 777
KM Ellerine — — 266 667 266 667
GD Harlow — — 2 414 815 2 414 815
JS Mthimunye 30 000 30 000 — —
NN Lazarus — 3 803 424 — 177 779
LM Nestadt — — 8 204 674 8 204 674
MV Pamensky — — 5 565 738 5 565 738
DA Suntup 394 176 189 037 3 877 778 3 877 778
JS Vilakazi — — — —
* Y Mahomed appointed post year-end.
The aggregate interest of the current Directors and officers in the capital of the Company was as follows:
Number of shares
Director/officer 2015 2014
Beneficial 180 989 375 183 824 425
The beneficial interest held by Directors and officers of the Company constitutes 27.20% (2014: 27.69%) of the issued share capital of the Company.
Details of Directors’ and prescribed officer’s emoluments and equity compensation benefits are set out in note 30 of the Group annual financial statements and details of the forfeitable share plan are set out in note 32.
RESOLUTIONSOn 28 November 2014 the Company passed and filed with the Companies and Intellectual Property Commission the following special resolutions: • Approving the remuneration of non-executive directors. • Granting a general authority to repurchase the Company’s shares. • Approval to grant financial assistance in terms of sections 44 and 45 of the Companies Act, No 71 of 2008.
2015 2015
2015

90
BLU
E L
AB
EL IN
TE
GR
AT
ED
AN
NU
AL R
EP
OR
T 2
01
5
DIRECTORS’ REPORT CONTINUED
Except for the aforementioned, no other special resolutions, the nature of which might be significant to shareholders in their appreciation of the state of affairs of the Group, were passed by the Company or its subsidiaries during the period covered at the date of signing these Group and Company annual financial statements.
COMPANY SECRETARYThe Board is satisfied that Ms van Eden has the requisite knowledge and experience to carry out the duties of a company secretary of a public company in accordance with section 88 of the Act and is not disqualified to act as such. She is not a director of the Board and maintains an arm’s-length relationship with the Board.
The business and postal address of the Company secretary appear on the Company’s website.
AMERICAN DEPOSITORY RECEIPT FACILITYBlue Label Telecoms has a sponsored American depository receipt facility. The facility is sponsored by BNY Mellon and details of the administrators are reflected on the Company’s website.
AUDITORSPricewaterhouseCoopers Inc. will continue in office in accordance with section 90(6) of the Companies Act.
Larry NestadtChairman

91
BLU
E L
AB
EL IN
TE
GR
AT
ED
AN
NU
AL R
EP
OR
T 2
01
5
For the year ended 31 May 2015
INDEPENDENT AUDITOR’S REPORT TO THE SHAREHOLDERS OF BLUE LABEL TELECOMS LIMITED
We have audited the Group and separate financial statements of Blue Label Telecoms Limited set out on pages 92 to 223, which comprise the statements of financial position as at 31 May 2015, and the statements of comprehensive income, statements of changes in equity and statements of cash flows for the year then ended, and the notes, comprising a summary of significant accounting policies and other explanatory information.
DIRECTORS’ RESPONSIBILITY FOR THE FINANCIAL STATEMENTSThe Company’s directors are responsible for the preparation and fair presentation of these consolidated and separate financial statements in accordance with International Financial Reporting Standards and the requirements of the Companies Act of South Africa, and for such internal control as the directors determine is necessary to enable the preparation of consolidated and separate financial statements that are free from material misstatement, whether due to fraud or error.
AUDITOR’S RESPONSIBILITY Our responsibility is to express an opinion on these consolidated and separate financial statements based on our audit. We conducted our audit in accordance with International Standards on Auditing. Those standards require that we comply with ethical requirements and plan and perform the audit to obtain reasonable assurance about whether the consolidated and separate financial statements are free from material misstatement.
An audit involves performing procedures to obtain audit evidence about the amounts and disclosures in the financial statements. The procedures selected depend on the auditor’s judgement, including the assessment of the risks of material misstatement of the financial statements, whether due to fraud or error. In making those risk assessments, the auditor considers internal control relevant to the entity’s preparation and fair presentation of the financial statements in order to design audit procedures that are appropriate in the circumstances, but not for the purpose of expressing an opinion on the effectiveness of the entity’s internal control. An audit also includes evaluating the appropriateness of accounting policies used and the reasonableness of accounting estimates made by management, as well as evaluating the overall presentation of the financial statements.
We believe that the audit evidence we have obtained is sufficient and appropriate to provide a basis for our audit opinion.
OPINIONIn our opinion, the Group and separate financial statements present fairly, in all material respects, the consolidated and separate financial position of Blue Label Telecoms Limited as at 31 May 2015, and its consolidated and separate financial performance and its consolidated and separate cash flows for the year then ended in accordance with International Financial Reporting Standards and the requirements of the Companies Act of South Africa.
OTHER REPORTS REQUIRED BY THE COMPANIES ACTAs part of our audit of the consolidated and separate financial statements for the year ended 31 May 2015, we have read the Directors’ report, the Audit, Risk and Compliance Committee’s report and the Declaration by the Company Secretary for the purpose of identifying whether there are material inconsistencies between these reports and the audited consolidated and separate financial statements. These reports are the responsibility of the respective preparers. Based on reading these reports we have not identified material inconsistencies between these reports and the audited consolidated and separate financial statements. However, we have not audited these reports and accordingly do not express an opinion on these reports.
PricewaterhouseCoopers Inc. Director: D StormRegistered Auditor Johannesburg18 August 2015
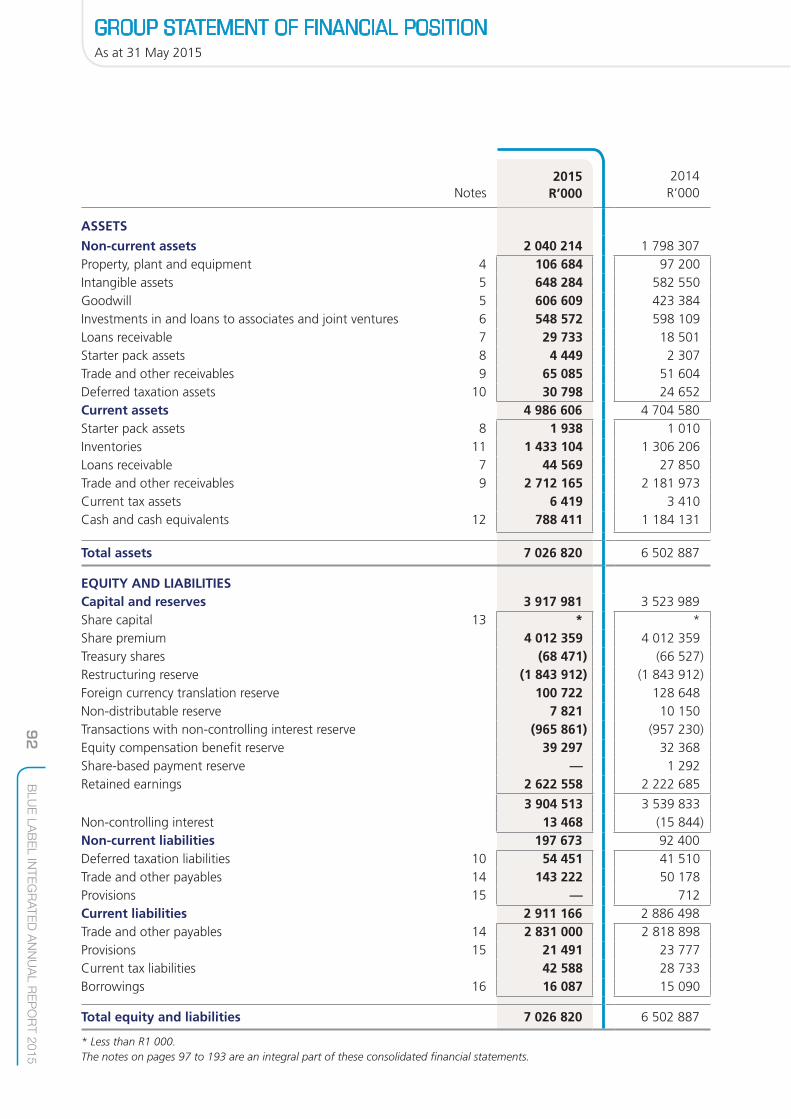
92
BLU
E L
AB
EL IN
TE
GR
AT
ED
AN
NU
AL R
EP
OR
T 2
01
5
As at 31 May 2015
GROUP STATEMENT OF FINANCIAL POSITION
Notes 2014R’000
ASSETS
Non-current assets 2 040 214 1 798 307Property, plant and equipment 4 106 684 97 200 Intangible assets 5 648 284 582 550 Goodwill 5 606 609 423 384 Investments in and loans to associates and joint ventures 6 548 572 598 109Loans receivable 7 29 733 18 501 Starter pack assets 8 4 449 2 307Trade and other receivables 9 65 085 51 604Deferred taxation assets 10 30 798 24 652Current assets 4 986 606 4 704 580Starter pack assets 8 1 938 1 010 Inventories 11 1 433 104 1 306 206Loans receivable 7 44 569 27 850Trade and other receivables 9 2 712 165 2 181 973Current tax assets 6 419 3 410Cash and cash equivalents 12 788 411 1 184 131
Total assets 7 026 820 6 502 887
EQUITY AND LIABILITIESCapital and reserves 3 917 981 3 523 989Share capital 13 * *Share premium 4 012 359 4 012 359Treasury shares (68 471) (66 527)Restructuring reserve (1 843 912) (1 843 912)Foreign currency translation reserve 100 722 128 648Non-distributable reserve 7 821 10 150Transactions with non-controlling interest reserve (965 861) (957 230)Equity compensation benefit reserve 39 297 32 368Share-based payment reserve — 1 292Retained earnings 2 622 558 2 222 685
3 904 513 3 539 833Non-controlling interest 13 468 (15 844) Non-current liabilities 197 673 92 400Deferred taxation liabilities 10 54 451 41 510Trade and other payables 14 143 222 50 178Provisions 15 — 712Current liabilities 2 911 166 2 886 498Trade and other payables 14 2 831 000 2 818 898Provisions 15 21 491 23 777Current tax liabilities 42 588 28 733Borrowings 16 16 087 15 090
Total equity and liabilities 7 026 820 6 502 887
* Less than R1 000.The notes on pages 97 to 193 are an integral part of these consolidated financial statements.
2015R’000
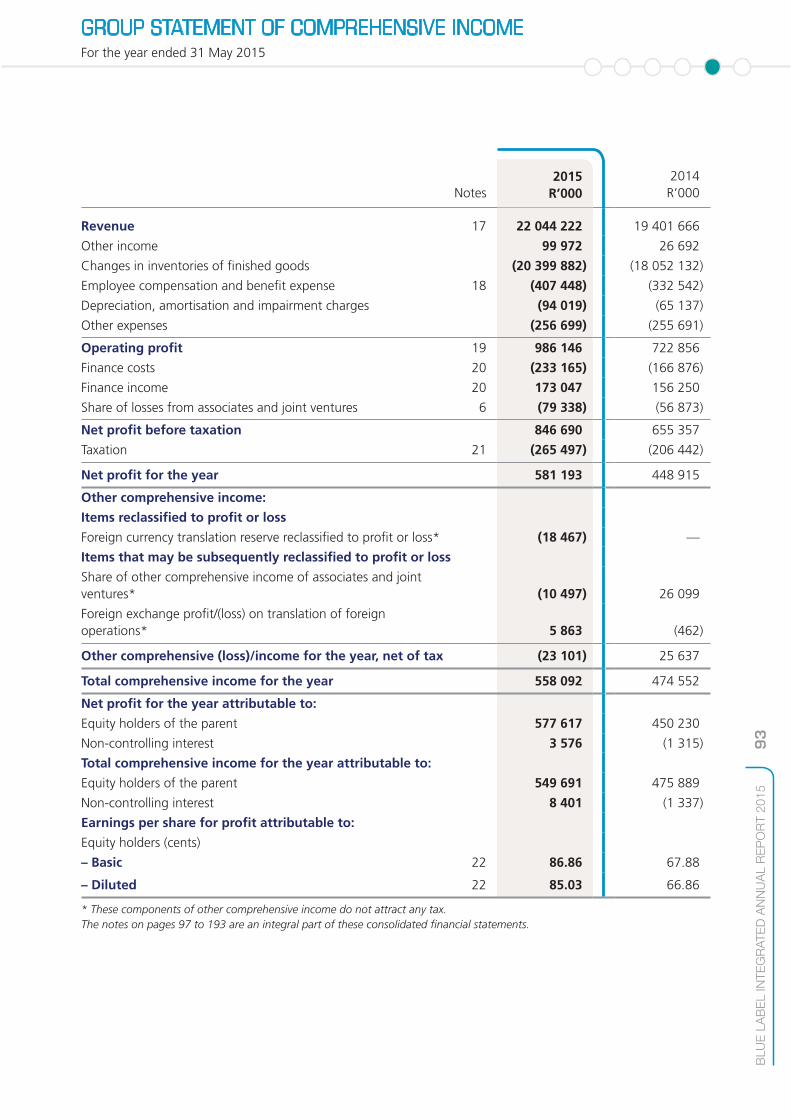
For the year ended 31 May 2015
93
BLU
E L
AB
EL IN
TE
GR
AT
ED
AN
NU
AL R
EP
OR
T 2
01
5
GROUP STATEMENT OF COMPREHENSIVE INCOME
Notes 2014R’000
Revenue 17 22 044 222 19 401 666
Other income 99 972 26 692
Changes in inventories of finished goods (20 399 882) (18 052 132)
Employee compensation and benefit expense 18 (407 448) (332 542)
Depreciation, amortisation and impairment charges (94 019) (65 137)
Other expenses (256 699) (255 691)
Operating profit 19 986 146 722 856
Finance costs 20 (233 165) (166 876)
Finance income 20 173 047 156 250
Share of losses from associates and joint ventures 6 (79 338) (56 873)
Net profit before taxation 846 690 655 357
Taxation 21 (265 497) (206 442)
Net profit for the year 581 193 448 915
Other comprehensive income:
Items reclassified to profit or loss
Foreign currency translation reserve reclassified to profit or loss* (18 467) —
Items that may be subsequently reclassified to profit or loss
Share of other comprehensive income of associates and joint ventures* (10 497) 26 099
Foreign exchange profit/(loss) on translation of foreign operations* 5 863 (462)
Other comprehensive (loss)/income for the year, net of tax (23 101) 25 637
Total comprehensive income for the year 558 092 474 552
Net profit for the year attributable to:
Equity holders of the parent 577 617 450 230
Non-controlling interest 3 576 (1 315)
Total comprehensive income for the year attributable to:
Equity holders of the parent 549 691 475 889
Non-controlling interest 8 401 (1 337)
Earnings per share for profit attributable to:
Equity holders (cents)
– Basic 22 86.86 67.88
– Diluted 22 85.03 66.86
* These components of other comprehensive income do not attract any tax.The notes on pages 97 to 193 are an integral part of these consolidated financial statements.
2015R’000
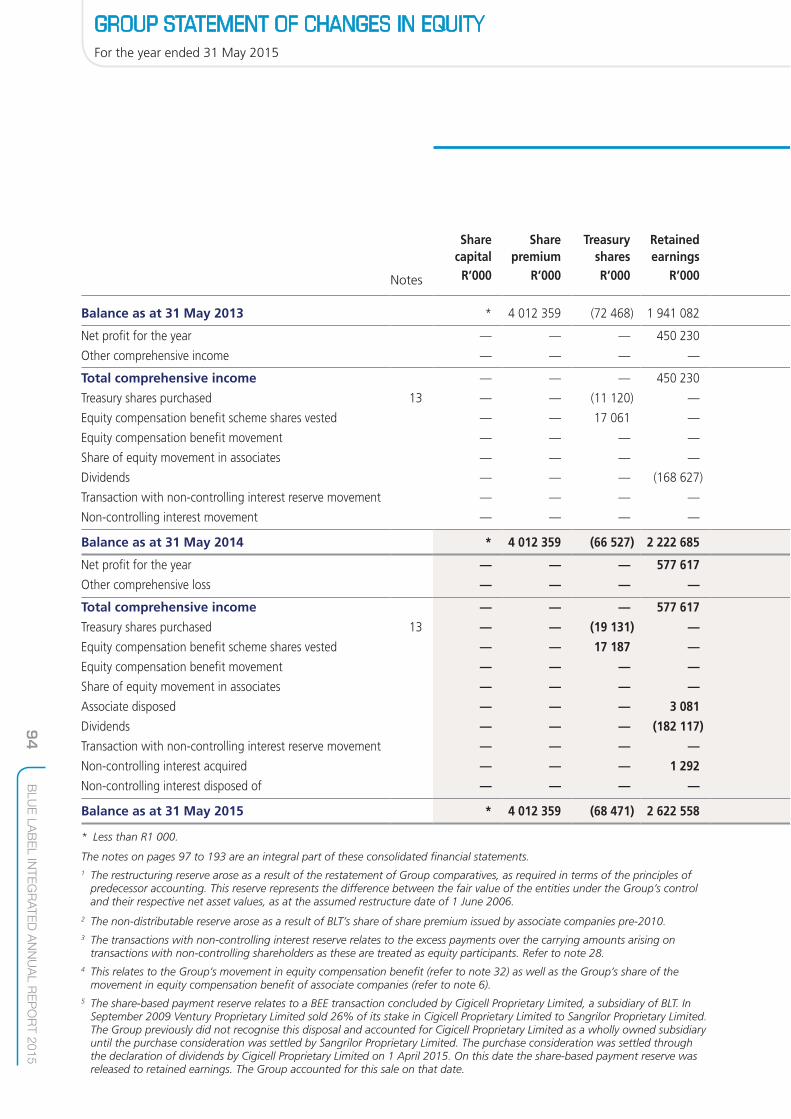
For the year ended 31 May 2015
94
BLU
E L
AB
EL IN
TE
GR
AT
ED
AN
NU
AL R
EP
OR
T 2
01
5
GROUP STATEMENT OF CHANGES IN EQUITY
Notes
SharecapitalR’000
Sharepremium
R’000
TreasurysharesR’000
Retainedearnings
R’000
Balance as at 31 May 2013 * 4 012 359 (72 468) 1 941 082
Net profit for the year — — — 450 230
Other comprehensive income — — — —
Total comprehensive income — — — 450 230
Treasury shares purchased 13 — — (11 120) —
Equity compensation benefit scheme shares vested — — 17 061 —
Equity compensation benefit movement — — — —
Share of equity movement in associates — — — —
Dividends — — — (168 627)
Transaction with non-controlling interest reserve movement — — — —
Non-controlling interest movement — — — —
Balance as at 31 May 2014 * 4 012 359 (66 527) 2 222 685
Net profit for the year — — — 577 617
Other comprehensive loss — — — —
Total comprehensive income — — — 577 617
Treasury shares purchased 13 — — (19 131) —
Equity compensation benefit scheme shares vested — — 17 187 —
Equity compensation benefit movement — — — —
Share of equity movement in associates — — — —
Associate disposed — — — 3 081
Dividends — — — (182 117)
Transaction with non-controlling interest reserve movement — — — —
Non-controlling interest acquired — — — 1 292
Non-controlling interest disposed of — — — —
Balance as at 31 May 2015 * 4 012 359 (68 471) 2 622 558
* Less than R1 000.
The notes on pages 97 to 193 are an integral part of these consolidated financial statements.1 The restructuring reserve arose as a result of the restatement of Group comparatives, as required in terms of the principles of
predecessor accounting. This reserve represents the difference between the fair value of the entities under the Group’s control and their respective net asset values, as at the assumed restructure date of 1 June 2006.
2 The non-distributable reserve arose as a result of BLT’s share of share premium issued by associate companies pre-2010.3 The transactions with non-controlling interest reserve relates to the excess payments over the carrying amounts arising on
transactions with non-controlling shareholders as these are treated as equity participants. Refer to note 28.4 This relates to the Group’s movement in equity compensation benefit (refer to note 32) as well as the Group’s share of the
movement in equity compensation benefit of associate companies (refer to note 6).5 The share-based payment reserve relates to a BEE transaction concluded by Cigicell Proprietary Limited, a subsidiary of BLT. In
September 2009 Ventury Proprietary Limited sold 26% of its stake in Cigicell Proprietary Limited to Sangrilor Proprietary Limited. The Group previously did not recognise this disposal and accounted for Cigicell Proprietary Limited as a wholly owned subsidiary until the purchase consideration was settled by Sangrilor Proprietary Limited. The purchase consideration was settled through the declaration of dividends by Cigicell Proprietary Limited on 1 April 2015. On this date the share-based payment reserve was released to retained earnings. The Group accounted for this sale on that date.
SharecapitalR’000
Sharepremium
R’000
TreasurysharesR’000
Retainedearnings
R’000
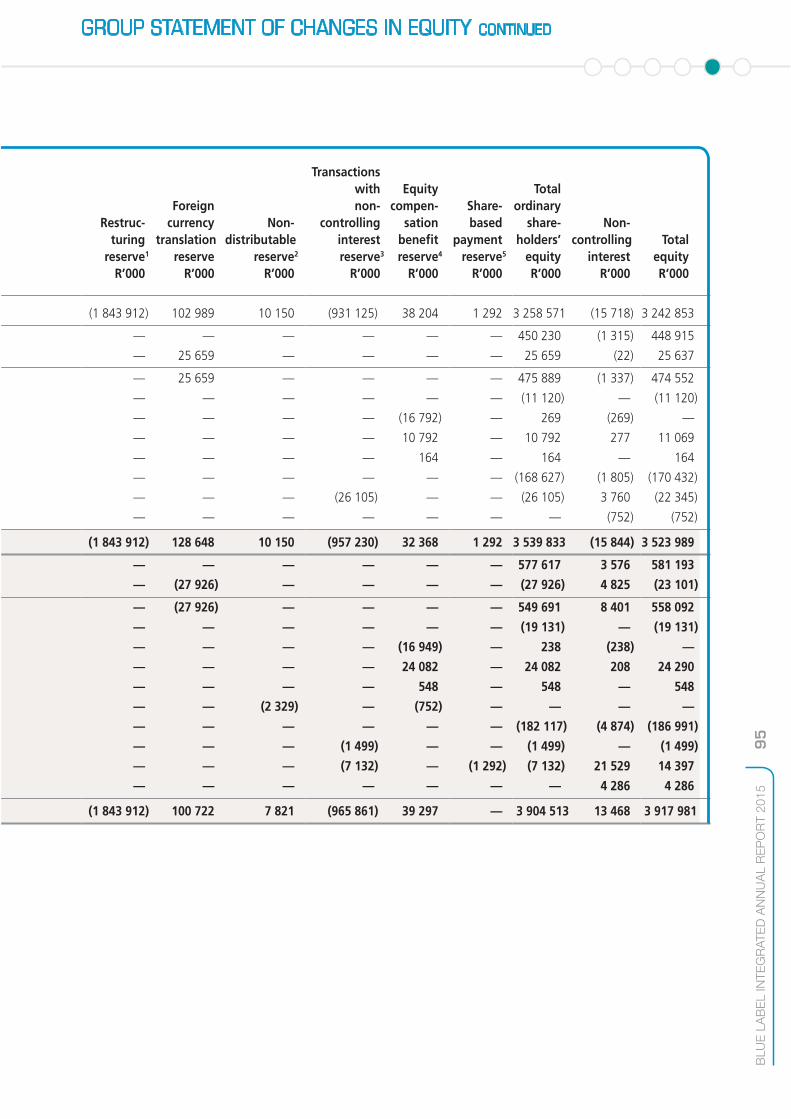
95
BLU
E L
AB
EL IN
TE
GR
AT
ED
AN
NU
AL R
EP
OR
T 2
01
5
GROUP STATEMENT OF CHANGES IN EQUITY CONTINUED
Restruc-turing
reserve1
R’000
Foreigncurrency
translationreserve
R’000
Non-distributable
reserve2
R’000
Transactionswithnon-
controllinginterestreserve3
R’000
Equitycompen-
sationbenefitreserve4
R’000
Share-based
paymentreserve5
R’000
Totalordinary
share-holders’
equityR’000
Non-controlling
interestR’000
TotalequityR’000
(1 843 912) 102 989 10 150 (931 125) 38 204 1 292 3 258 571 (15 718) 3 242 853
— — — — — — 450 230 (1 315) 448 915
— 25 659 — — — — 25 659 (22) 25 637
— 25 659 — — — — 475 889 (1 337) 474 552
— — — — — — (11 120) — (11 120)
— — — — (16 792) — 269 (269) —
— — — — 10 792 — 10 792 277 11 069
— — — — 164 — 164 — 164
— — — — — — (168 627) (1 805) (170 432)
— — — (26 105) — — (26 105) 3 760 (22 345)
— — — — — — — (752) (752)
(1 843 912) 128 648 10 150 (957 230) 32 368 1 292 3 539 833 (15 844) 3 523 989
— — — — — — 577 617 3 576 581 193
— (27 926) — — — — (27 926) 4 825 (23 101)
— (27 926) — — — — 549 691 8 401 558 092
— — — — — — (19 131) — (19 131)
— — — — (16 949) — 238 (238) —
— — — — 24 082 — 24 082 208 24 290
— — — — 548 — 548 — 548
— — (2 329) — (752) — — — —
— — — — — — (182 117) (4 874) (186 991)
— — — (1 499) — — (1 499) — (1 499)
— — — (7 132) — (1 292) (7 132) 21 529 14 397
— — — — — — — 4 286 4 286
(1 843 912) 100 722 7 821 (965 861) 39 297 — 3 904 513 13 468 3 917 981
Restruc-turing
reserve1
R’000
Foreigncurrency
translationreserve
R’000
Non-distributable
reserve2
R’000
Transactionswithnon-
controllinginterestreserve3
R’000
Equitycompen-
sationbenefitreserve4
R’000
Share-based
paymentreserve5
R’000
Totalordinary
share-holders’
equityR’000
Non-controlling
interestR’000
TotalequityR’000

For the year ended 31 May 2015
96
BLU
E L
AB
EL IN
TE
GR
AT
ED
AN
NU
AL R
EP
OR
T 2
01
5
GROUP STATEMENT OF CASH FLOWS
Notes 2014R’000
Cash flows from operating activities
Cash received from customers 21 499 455 18 708 547
Cash paid to suppliers and employees (21 069 649) (17 579 539)
Cash generated by operations 23 429 806 1 129 008
Interest received 15 995 24 613
Interest paid (67 811) (22 751)
Taxation paid 24 (245 495) (223 538)
Net cash generated from operating activities 132 495 907 332
Cash flows from investing activities
Acquisition of intangible assets 5 (125 366) (102 778)
Warranty refund — 15 501
Proceeds on disposal of intangible assets 308 1 209
Disposal of subsidiaries net of cash disposed 25 2 334 —
Acquisition of subsidiaries net of cash acquired 26 (157 460) (273 242)
Acquisition of associate and joint venture 6 (100) *
Proceeds on disposal of associate 6 94 897 —
Loans advanced to Blue Label Mexico** (48 979) (85 765)
Loans advanced to associates and joint ventures (14 353) (603)
Loans granted (17 837) (16 155)
Loans receivable repaid 7 522 28 662
Settlement of contingent consideration (19 515) —
Dividends received from associates and joint ventures — 11 118
Proceeds on disposal of property, plant and equipment 3 116 1 144
Acquisition of property, plant and equipment (53 318) (46 311)
Net cash utilised in investing activities (328 751) (467 220)
Cash flows from financing activities
Interest-bearing borrowings repaid (3 573) (112)
Interest-bearing borrowings raised 4 419 962
Acquisition of non-controlling interest — (16 190)
Acquisition of treasury shares 13 (19 131) (11 120)
Dividends paid to non-controlling interest (4 874) (1 805)
Dividends paid (182 117) (168 627)
Net cash utilised in financing activities (205 276) (196 892)
Net (decrease)/increase in cash and cash equivalents (401 532) 243 220
Cash and cash equivalents at the beginning of the year 1 184 131 941 282
Translation difference 5 812 (371)
Cash and cash equivalents at the end of the year 12 788 411 1 184 131
* Less than R1 000.** These loans were subsequently capitalised. Refer to note 6.The notes on pages 97 to 193 are an integral part of these consolidated financial statements.
2015R’000
For the year ended 31 May 2015
97
BLU
E L
AB
EL IN
TE
GR
AT
ED
AN
NU
AL R
EP
OR
T 2
01
5
NOTES TO THE GROUP ANNUAL FINANCIAL STATEMENTS
1. SIGNIFICANT ACCOUNTING POLICIES
Basis of preparation
The principal accounting policies applied in the preparation of the Group and Company annual financial statements are set out below in the related notes and are consistent with those adopted in the prior year, unless otherwise specified.
The Group and Company annual financial statements have been prepared in accordance with International Financial Reporting Standards (IFRS), the SAICA Financial Reporting Guides as issued by the Accounting Practices Committee and Financial Reporting Pronouncements as issued by Financial Reporting Standards Council, the JSE Listings Requirements and the Companies Act, No 71 of 2008.
The term IFRS includes International Financial Reporting Standards (IFRS), International Accounting Standards (IAS) and interpretations issued by the International Financial Reporting Interpretations Committee (IFRIC) or the former Standing Interpretations Committee (SIC). The standards referred to are set by the International Accounting Standards Board (IASB).
The Group and Company annual financial statements are prepared under the historical cost convention, except for certain financial and equity instruments which have been measured at fair value. Amounts are rounded to the nearest thousand with the exception of earnings per share, ordinary share capital and equity compensation benefit. The preparation of financial statements in conformity with IFRS requires management to make judgements, estimates and assumptions that affect the application of policies and reported amounts of assets and liabilities, income and expenses. The estimates and associated assumptions are based on historical experience and various other factors that are believed to be reasonable under the circumstances. Actual results may differ from these estimates.
The estimates and underlying assumptions are reviewed on an ongoing basis. Revisions to accounting estimates are recognised in the period in which the estimate is revised if the revision affects only that period, or in the period of the revision and future periods if the revision affects both current and future periods.
Judgements made by management in the application of IFRS that have a significant effect on the financial statements and estimates with a significant risk of material adjustment in the next year are discussed in note 2.
Going concern
The Group and Company’s forecasts and projections, taking account of reasonably possible changes in trading performance, show that the Group and Company should be able to operate within their current funding levels into the foreseeable future.
After making enquiries, the Directors have a reasonable expectation that the Group and Company have adequate resources to continue in operational existence for the foreseeable future. The Group and Company therefore continue to adopt the going concern basis in preparing the financial statements.
NOTES TO THE GROUP ANNUAL FINANCIAL STATEMENTS CONTINUED
For the year ended 31 May 2015
98
BLU
E L
AB
EL IN
TE
GR
AT
ED
AN
NU
AL R
EP
OR
T 2
01
5
1. SIGNIFICANT ACCOUNTING POLICIES continued
Standards, interpretations and amendments effective in 2015
The following standards, interpretations and amendments are effective for the first time for the year ended 31 May 2015 and have not had an impact on the Group’s and Company’s financial statements:
• Amendments to IFRS 10, IFRS 12 and IAS 27 for investment entities • Amendments to IAS 32 – Financial Instruments: Presentation – requirements for offsetting financial
assets and financial liabilities • Amendment to IAS 36 – Impairment of Assets regarding recoverable amount disclosures • Amendment to IAS 39 – Financial Instruments: Recognition and Measurement – novation of
derivatives and hedge accounting • Amendment to IAS 19 – Employee Benefits regarding defined benefit plan • IFRIC 21 – Accounting for Levies
Standards, amendments and interpretations not yet effective
The Group has evaluated the effect of all new standards, amendments and interpretations that have been issued but which are not yet effective. Based on the evaluation, management does not expect these standards, amendments and interpretations to have a significant impact on the Group’s results and disclosures. The expected implications of applicable standards, amendments and interpretations are dealt with below.
IFRS 9 – Financial Instruments
IFRS 9 – Financial Instruments addresses the classification, measurement and recognition of financial assets and financial liabilities. The complete version of IFRS 9 was issued in July 2014. It replaces the guidance in IAS 39 that relates to the classification and measurement of financial instruments. IFRS 9 retains but simplifies the mixed measurement model and establishes three primary measurement categories for financial assets: amortised cost, fair value through other comprehensive income and fair value through profit or loss. The basis of classification depends on the entity’s business model and the contractual cash flow characteristics of the financial asset. Investments in equity instruments are required to be measured at fair value through profit or loss with the irrevocable option at inception to present changes in fair value in other comprehensive income not recycling. There is now a new expected credit losses model that replaces the incurred loss impairment model used in IAS 39. For financial liabilities there were no changes to classification and measurement except for the recognition of changes in own credit risk in other comprehensive income, for liabilities designated at fair value through profit or loss. IFRS 9 relaxes the requirements for hedge effectiveness by replacing the bright line hedge effectiveness tests. It requires an economic relationship between the hedged item and hedging instrument and for the “hedged ratio” to be the same as the one management actually uses for risk management purposes. Contemporaneous documentation is still required but is different to that currently prepared under IAS 39.
The standard is effective for accounting periods beginning on or after 1 January 2018. Early adoption is permitted. The Group is currently considering the impact on the consolidated financial statements.

NOTES TO THE GROUP ANNUAL FINANCIAL STATEMENTS CONTINUED
For the year ended 31 May 2015
99
BLU
E L
AB
EL IN
TE
GR
AT
ED
AN
NU
AL R
EP
OR
T 2
01
5
1. SIGNIFICANT ACCOUNTING POLICIES continued
Standards, amendments and interpretations not yet effective continued
Amendments to IFRS 10 – Consolidated Financial Statements and IAS 28 – Investments in Associates and Joint Ventures – on sale or contribution of assets
The IASB has issued this amendment to eliminate the inconsistency between IFRS 10 and IAS 28. If the non-monetary assets sold or contributed to an associate or joint venture constitute a “business”, then the full gain or loss will be recognised by the investor. A partial gain or loss is recognised when a transaction involves assets that do not constitute a business, even if these assets are housed in a subsidiary.
This statement is effective for periods beginning on or after 1 January 2016. The Group is currently considering the impact on the consolidated financial statements.
Amendments to IFRS 10 – Consolidated Financial Statements and IAS 28 – Investments in Associates and Joint Ventures – on applying the consolidation exemption
The amendments clarify the application of the consolidation exception for investment entities and their subsidiaries.
This statement is effective for periods beginning on or after 1 January 2016. The Group does not believe the statement will have a significant impact, given that the Group does not apply the exemption currently.
Amendment to IFRS 11 – Joint Arrangement – on acquisition of an interest in a joint operation
This amendment adds new guidance on how to account for the acquisition of an interest in a joint operation that constitutes a business. The amendments specify the appropriate accounting treatment for such acquisitions.
This statement is effective for periods beginning on or after 1 January 2016. The Group is currently considering the impact on the consolidated financial statements.
IFRS 14 – Regulatory Deferral Accounts
The IASB has issued IFRS 14, an interim standard on the accounting for certain balances that arise from rate-regulated activities (regulatory deferral accounts).
This statement is effective for periods beginning on or after 1 January 2016 and is not applicable to the Group.
Amendments to IAS 1 – Presentation of Financial Statements – disclosure initiative
In December 2014 the IASB issued amendments to clarify guidance in IAS 1 on materiality and aggregation, the presentation of subtotals, the structure of financial statements and the disclosure of accounting policies.
This statement is effective for periods beginning on or after 1 January 2016. The Group is currently considering the impact on the consolidated financial statements.
NOTES TO THE GROUP ANNUAL FINANCIAL STATEMENTS CONTINUED
For the year ended 31 May 2015
100
BLU
E L
AB
EL IN
TE
GR
AT
ED
AN
NU
AL R
EP
OR
T 2
01
5
1. SIGNIFICANT ACCOUNTING POLICIES continued
Standards, amendments and interpretations not yet effective continued
Amendment to IAS 16 – Property, Plant and Equipment and IAS 38 – Intangible Assets – on depreciation and amortisation
In this amendment the IASB has clarified that the use of revenue-based methods to calculate the depreciation of an asset is not appropriate because revenue generated by an activity that includes the use of an asset generally reflects factors other than the consumption of the economic benefits embodied in the asset. The IASB has also clarified that revenue is generally presumed to be an inappropriate basis for measuring the consumption of the economic benefits embodied in an intangible asset.
This statement is effective for periods beginning on or after 1 January 2016. The Group is currently considering the impact on the consolidated financial statements.
Amendments to IAS 16 – Property, Plant and Equipment and IAS 41 – Agriculture – on bearer plants
This statement is effective for periods beginning on or after 1 January 2016 and is not applicable to the Group.
Amendments to IAS 27 – Separate Financial Statements – on equity accounting
In this amendment the IASB has restored the option to use the equity method to account for investments in subsidiaries, joint ventures and associates in an entity’s separate financial statements.
This statement is effective for periods beginning on or after 1 January 2016 and is not applicable to the Group. The Company does not believe the statement will have a significant impact, given that the Company does not intend on applying this option.
IFRS 15 – Revenue From Contracts with Customers
This statement establishes principles for reporting useful information to users of the financial statements about the nature, amount, timing and uncertainty of revenue and cash flows arising from an entity’s contracts with customers.
This statement is effective for periods beginning on or after 1 January 2017. The Group is currently considering the impact on the consolidated financial statements.

NOTES TO THE GROUP ANNUAL FINANCIAL STATEMENTS CONTINUED
For the year ended 31 May 2015
101
BLU
E L
AB
EL IN
TE
GR
AT
ED
AN
NU
AL R
EP
OR
T 2
01
5
1. SIGNIFICANT ACCOUNTING POLICIES continued
Annual improvements project
The IASB decided to initiate an annual improvements project in 2007 as a method of making necessary, but non-urgent, amendments to IFRS that will not be included as part of another major project. The IASB’s objective was to ease the burden for all concerned.
Improvements to IFRS were issued by the IASB as part of the “annual improvements process” resulting in the following amendments to standards issued, but not effective for 31 May 2015 year-ends:
IFRS 5 – Non-current Assets Held-for-Sale and Discontinued Operations
This is an amendment to the changes in methods of disposal – Assets (or disposal groups) are generally disposed of either through sale or through distribution to owners. The amendment to IFRS 5 clarifies that changing from one of these disposal methods to the other should not be considered a new plan of disposal, rather it is a continuation of the original plan. There is therefore no interruption of the application of the requirements in IFRS 5.
The amendment also clarifies that changing the disposal method does not change the date of classification.
IFRS 7 – Financial Instruments: Disclosures
Applicability of the offsetting disclosures to condensed interim financial statements – The amendment removes the phrase “and interim periods within those annual periods” from paragraph 44R, clarifying that these IFRS 7 disclosures are not required in the condensed interim financial report. However, the Board noted that IAS 34 requires an entity to disclose an explanation of events and transactions that are significant to an understanding of the changes in financial position and performance of the entity since the end of the last annual reporting period. Therefore, if the IFRS 7 disclosures provide a significant update to the information reported in the most recent annual report, the Board would expect the disclosures to be included in the entity’s condensed interim financial report.
IFRS 7 – Financial Instruments: Disclosures
Servicing contracts – The amendment clarifies that a servicing contract that includes a fee can constitute continuing involvement in a financial asset. An entity must assess the nature of the fee and arrangement against the guidance for continuing involvement in paragraphs IFRS 7.B30 and IFRS 7.42C in order to assess whether the disclosures are required.
IAS 19 – Employee Benefits
Discount rate: regional market issue – The amendment to IAS 19 clarifies that market depth of high-quality corporate bonds is assessed based on the currency in which the obligation is denominated, rather than the country where the obligation is located. When there is no deep market for high-quality corporate bonds in that currency, government bond rates must be used.
NOTES TO THE GROUP ANNUAL FINANCIAL STATEMENTS CONTINUED
For the year ended 31 May 2015
102
BLU
E L
AB
EL IN
TE
GR
AT
ED
AN
NU
AL R
EP
OR
T 2
01
5
1. SIGNIFICANT ACCOUNTING POLICIES continued
Annual improvements project continued
IAS 34 – Interim Financial Reporting
Disclosure of information “elsewhere in the interim financial report” – The amendment states that the required interim disclosures must either be in the interim financial statements or incorporated by cross-reference between the interim financial statements and wherever they are included within the greater interim financial report.
The Board specified that the other information within the interim financial report must be available to users on the same terms as the interim financial statements and at the same time. If users do not have access to the other information in this manner, the interim financial report is incomplete.
Management is currently considering the effect of the changes.
Basis of consolidation
(a) Subsidiaries
Subsidiaries are all entities (including structured entities) over which the Group has control. The Group controls an entity when the Group is exposed to, or has rights to, variable returns from its involvement with the entity and has the ability to affect those returns through its power over the entity. Subsidiaries are fully consolidated from the date on which control is transferred to the Group. They are deconsolidated from the date that control ceases.
The Group applies the acquisition method to account for business combinations. The consideration transferred for the acquisition of a subsidiary is the fair value of the assets transferred, the liabilities incurred to the former owners of the acquiree and the equity interests issued by the Group. The consideration transferred includes the fair value of any asset or liability resulting from a contingent consideration arrangement. Identifiable assets acquired and liabilities and contingent liabilities assumed in a business combination are measured initially at their fair values at the acquisition date. The Group recognises any non-controlling interest in the acquiree on an acquisition-by-acquisition basis, either at fair value or at the non-controlling interest’s proportionate share of the recognised amounts of acquiree’s identifiable net assets.
Acquisition-related costs are expensed as incurred.
If the business combination is achieved in stages, the acquisition date carrying value of the acquirer’s previously held equity interest in the acquiree is remeasured to fair value at the acquisition date; any gains or losses arising from such remeasurement are recognised in profit or loss.
Any contingent consideration to be transferred by the Group is recognised at fair value at the acquisition date. Subsequent changes to the fair value of the contingent consideration that is deemed to be an asset or liability are recognised in accordance with IAS 39 either in profit or loss or as a change to other comprehensive income. Contingent consideration that is classified as equity is not remeasured, and its subsequent settlement is accounted for within equity.

NOTES TO THE GROUP ANNUAL FINANCIAL STATEMENTS CONTINUED
For the year ended 31 May 2015
103
BLU
E L
AB
EL IN
TE
GR
AT
ED
AN
NU
AL R
EP
OR
T 2
01
5
1. SIGNIFICANT ACCOUNTING POLICIES continued
Basis of consolidation continued
(a) Subsidiaries continued
The excess of the consideration transferred, the amount of any non-controlling interest in the acquiree and the acquisition date fair value of any previous equity interest in the acquiree over the fair value of the identifiable net assets acquired is recorded as goodwill. If the total consideration transferred, non-controlling interest recognised and previously held interest measured is less than the fair value of the net assets of the subsidiary acquired in the case of a bargain purchase, the difference is recognised directly in the statement of comprehensive income.
Inter-company transactions, balances and unrealised gains on transactions between Group companies are eliminated. Unrealised losses are also eliminated. When necessary, amounts reported by subsidiaries have been adjusted to conform with the Group’s accounting policies.
(b) Changes in ownership interests in subsidiaries without change of control
Transactions with non-controlling interests that do not result in loss of control are accounted for as equity transactions, i.e. transactions with the owners in their capacity as owners. The difference between fair value of any consideration paid and the relevant share acquired of the carrying value of net assets of the subsidiary is recorded in equity. Gains or losses on disposals to non-controlling interests are also recorded in equity.
(c) Disposal of subsidiaries
When the Group ceases to have control, any retained interest in the entity is remeasured to its fair value at the date when control is lost, with the change in carrying amount recognised in profit or loss. The fair value is the initial carrying amount for the purposes of subsequently accounting for the retained interest as an associate, joint venture or financial asset. In addition, any amounts previously recognised in other comprehensive income in respect of that entity are accounted for as if the Group had directly disposed of the related assets or liabilities. This may mean that amounts previously recognised in other comprehensive income are reclassified to profit or loss.
(d) Associates
Associates are all entities over which the Group has significant influence but not control, generally accompanying a shareholding of between 20% and 50% of the voting rights. Investments in associates are accounted for using the equity method of accounting. Under the equity method, the investment is initially recognised at cost, and the carrying amount is increased or decreased to recognise the investor’s share of the profit or loss of the investee after the date of acquisition. The Group’s investment in associates includes goodwill identified on acquisition.
If the ownership interest in an associate is reduced but significant influence is retained, only a proportionate share of the amounts previously recognised in other comprehensive income is reclassified to profit or loss where appropriate.
The Group’s share of post-acquisition profit or loss is recognised in the income statement, and its share of post-acquisition movements in other comprehensive income is recognised in other comprehensive income with a corresponding adjustment to the carrying amount of the investment. When the Group’s share of losses in an associate equals or exceeds its interest in the associate, including any other unsecured receivables, the Group does not recognise further losses, unless it has incurred legal or constructive obligations or made payments on behalf of the associate.

NOTES TO THE GROUP ANNUAL FINANCIAL STATEMENTS CONTINUED
For the year ended 31 May 2015
104
BLU
E L
AB
EL IN
TE
GR
AT
ED
AN
NU
AL R
EP
OR
T 2
01
5
1. SIGNIFICANT ACCOUNTING POLICIES continued
Basis of consolidation continued
(d) Associates continued
The Group determines at each reporting date whether there is any objective evidence that the investment in the associate is impaired. If this is the case, the Group calculates the amount of impairment as the difference between the recoverable amount of the associate and its carrying value and recognises the amount adjacent to share of profit/(loss) from associates in the statement of comprehensive income.
Profits and losses resulting from upstream and downstream transactions between the Group and its associates are recognised in the Group’s financial statements only to the extent of unrelated investors’ interests in the associates. Unrealised losses are eliminated unless the transaction provides evidence of an impairment of the asset transferred. Accounting policies of associates have been changed where necessary to ensure consistency with the policies adopted by the Group.
Dilution gains and losses arising in investments in associates are recognised in the statement of comprehensive income.
The Company financial statements account for investments in associates at cost less any accumulated impairment.
(e) Joint arrangements
Under IFRS 11, investments in joint arrangements are classified as either joint operations or joint ventures depending on the contractual rights and obligations of each investor. The Group has assessed the nature of its joint arrangements and determined them to be joint ventures. Joint ventures are accounted for using the equity method.
Under the equity method of accounting, interests in joint ventures are initially recognised at cost and adjusted thereafter to recognise the Group’s share of the post-acquisition profits or losses and movements in other comprehensive income. When the Group’s share of losses in a joint venture equals or exceeds its interests in the joint venture (which includes any long-term interests that, in substance, form part of the Group’s net investment in the joint venture), the Group does not recognise further losses, unless it has incurred obligations or made payments on behalf of the joint venture.
The Group determines at each reporting date whether there is any objective evidence that the investment in the joint venture is impaired. If this is the case, the Group calculates the amount of impairment as the difference between the recoverable amount of the associate and its carrying value and recognises the amount adjacent to share of profit/(loss) from joint ventures in the statement of comprehensive income.
Unrealised gains on transactions between the Group and its joint ventures are eliminated to the extent of the Group’s interest in the joint ventures. Unrealised losses are also eliminated unless the transaction provides evidence of an impairment of the asset transferred. Accounting policies of the joint ventures have been changed where necessary to ensure consistency with the policies adopted by the Group.
The Company financial statements account for investments in joint ventures at cost less any accumulated impairment.

NOTES TO THE GROUP ANNUAL FINANCIAL STATEMENTS CONTINUED
For the year ended 31 May 2015
105
BLU
E L
AB
EL IN
TE
GR
AT
ED
AN
NU
AL R
EP
OR
T 2
01
5
1. SIGNIFICANT ACCOUNTING POLICIES continued
Foreign currencies
(a) Functional and presentation currency
Items included in the financial statements of each of the Group’s entities are measured using the currency of the primary economic environment in which the entity operates (the functional currency). The Group financial statements are presented in South African rand (ZAR), which is the functional and presentation currency of the parent company.
(b) Transactions and balances
Foreign currency transactions are translated into the functional currency using the exchange rates prevailing at the dates of the transactions. Foreign exchange gains and losses resulting from the settlement of such transactions and from the translation at year-end exchange rates of monetary assets and liabilities denominated in foreign currencies are recognised in the statement of comprehensive income.
(c) Group companies
The results and financial position of all the Group entities (none of which has the currency of a hyperinflationary economy) that have a functional currency different from the presentation currency are translated into the presentation currency as follows: • Assets and liabilities are translated at the closing rate as at statement of financial position date. • Income and expenses are translated at average exchange rates (unless this average is not a
reasonable approximation of the cumulative effect of the rates prevailing on the transaction dates, in which case income and expenses are translated at the dates of the transactions).
• All resulting exchange differences are recognised as a separate component of equity.
On consolidation, exchange differences arising from the translation of the net investment in foreign entities, and of borrowings and other currency instruments designated as hedges of such investments, are taken to other comprehensive income. When a foreign operation is partially disposed of or sold, such exchange differences are recognised in the statement of comprehensive income as part of the gain or loss on sale.
Goodwill and fair value adjustments arising on the acquisition of a foreign entity are treated as the foreign entity’s assets and liabilities and are translated at the closing rate.
Financial instruments
Financial instruments carried on the statement of financial position include:
Financial assets • Loans receivable. • Trade and other receivables. • Cash and cash equivalents.
Financial liabilities • Borrowings. • Trade and other payables.
NOTES TO THE GROUP ANNUAL FINANCIAL STATEMENTS CONTINUED
For the year ended 31 May 2015
106
BLU
E L
AB
EL IN
TE
GR
AT
ED
AN
NU
AL R
EP
OR
T 2
01
5
1. SIGNIFICANT ACCOUNTING POLICIES continued
Financial instruments continued
Financial liabilities continued
The particular recognition methods adopted are disclosed in the individual accounting policy statements associated with each item.
Regular way purchases and sales of financial assets that require delivery are recognised on trade date, being the date on which the Group commits to purchase or sell the asset.
The Group recognises a financial asset or a financial liability on its statement of financial position when, and only when, the Group becomes a party to the contractual provisions of the instrument.
Financial assets are derecognised when the rights to receive cash flows from the financial asset have expired or have been transferred and the Group has transferred substantially all risks and rewards of ownership. Financial liabilities (or a part of a financial liability) are removed from its statement of financial position when, and only when, they are extinguished, i.e. when the obligation specified in the contract is discharged, cancelled or expires.
Financial assets
The Group classifies its financial assets in the following categories: loans and receivables, and cash and cash equivalents. The classification depends on the purpose for which the financial assets were acquired. Management determines the classification of its investments at initial recognition.
Loans and receivables
Loans and receivables are non-derivative financial assets with fixed or determinable payments that are not quoted in an active market. This category does not include those loans and receivables that the Group intends to sell in the short term or that it has designated as at fair value through profit or loss or available-for-sale. These assets are included in current assets, except for maturities greater than 12 months after the statement of financial position date, which are classified as non-current assets.
Financial assets classified as loans and receivables are initially recognised at fair value plus transaction costs. Subsequent to initial recognition, loans and receivables are carried at amortised cost using the effective interest rate method, less any provision for impairment.
Loans and receivables comprise loans receivable, trade and other receivables (excluding prepayments and VAT) and cash and cash equivalents.

NOTES TO THE GROUP ANNUAL FINANCIAL STATEMENTS CONTINUED
For the year ended 31 May 2015
107
BLU
E L
AB
EL IN
TE
GR
AT
ED
AN
NU
AL R
EP
OR
T 2
01
5
1. SIGNIFICANT ACCOUNTING POLICIES continued
Impairment of financial assets
A financial asset is impaired if its carrying amount is greater than its estimated recoverable amount.
The Group assesses at each reporting date whether there is objective evidence that a financial asset or a group of financial assets is impaired. A provision for impairment is established when there is objective evidence that the Group will not be able to collect all amounts due according to the original terms of the receivables. Objective evidence that receivables are impaired includes observable data that comes to the attention of the Group about the following events: • Significant financial difficulty of the debtor; • A breach of contract, such as default or delinquency in payments; or • It becoming probable that the borrower will enter bankruptcy or other financial reorganisation.
The amount of the provision is the difference between the carrying amount and the recoverable amount of the assets being the present value of expected cash flows discounted at the original effective interest rate. The amount of the provision is recognised as a charge in the statement of comprehensive income.
When a receivable is uncollectible, it is written off against the provision. Subsequent recoveries of amounts previously written off are credited to the statement of comprehensive income.
Financial liabilities and equity instruments
Financial liabilities and equity instruments issued by the Group are classified according to the substance of the contractual arrangements entered into and the definitions of a financial liability and an equity instrument. An equity instrument is any contract that evidences a residual interest in the assets of the Group after deducting all of its liabilities. Refer to accounting policies on borrowings and trade and other payables for financial liabilities (which exclude employee-related liabilities and VAT), and share capital for equity instruments issued by the Group.
Property, plant and equipment
Property, plant and equipment is initially recorded at historical cost, being the purchase cost plus any cost to prepare the assets for their intended use. Historical cost includes expenditure that is directly attributable to the acquisition of the item. Subsequent costs are included in the asset’s carrying amount or recognised as a separate asset, as appropriate, only when it is probable that future economic benefits associated with the item will flow to the Group and the cost of the item can be measured reliably. All other repairs and maintenance costs are charged to the statement of comprehensive income during the financial year in which they are incurred.
Property, plant and equipment is subsequently carried at historical cost less accumulated depreciation and any accumulated impairment losses.
Property, plant and equipment is depreciated on the straight-line basis over each asset’s estimated useful life.

NOTES TO THE GROUP ANNUAL FINANCIAL STATEMENTS CONTINUED
For the year ended 31 May 2015
108
BLU
E L
AB
EL IN
TE
GR
AT
ED
AN
NU
AL R
EP
OR
T 2
01
5
1. SIGNIFICANT ACCOUNTING POLICIES continued
Property, plant and equipment continued
Depreciation is calculated on the straight-line basis to write off the cost of the assets to their residual values over their estimated useful lives as follows:
Motor vehicles 20% – 25%Furniture and fittings 16.67% – 25%Office equipment 25%Computer equipment 25% – 33.3%Terminals and vending machines 16.67%Media equipment 33.33%Plant and machinery 20%Buildings 8.33%
Major leasehold improvements are amortised over the shorter of their respective lease periods and estimated useful lives.
Borrowing costs directly attributable to the acquisition, construction or production of qualifying assets are capitalised as part of the cost of those assets. No such qualifying assets exist at year-end.
The assets’ residual values and useful lives are reviewed, and adjusted if appropriate, at year-end. Where the assets’ residual value is higher than the carrying value, no depreciation is provided.
Gains and losses on disposal of property, plant and equipment are determined as the difference between the carrying amount and the fair value of the sale proceeds, and are included in operating profit.
Where the carrying amount of an asset is greater than its estimated recoverable amount, it is written down immediately to its recoverable amount.
Intangible assets
(a) Computer software
Acquired computer software licences are capitalised on the basis of the costs incurred to acquire and bring to use the specific software. Computer software has a finite useful life and is subsequently carried at cost less accumulated amortisation. Amortisation is calculated using the straight-line method to allocate the cost of the computer software over its estimated useful life (three to 10 years).
Costs associated with the maintenance of existing computer software programs are expensed as incurred.
(b) Trademarks
Trademarks are shown at historical cost. Trademarks have a finite useful life and are subsequently carried at cost less accumulated amortisation. Amortisation is calculated using the straight-line method to allocate the cost of trademarks over their estimated useful lives (10 years).
Trademarks are initially shown at fair value as determined in accordance with IFRS 3 – Business Combinations, and are subsequently carried at the initially determined fair value less accumulated amortisation and impairment losses.
NOTES TO THE GROUP ANNUAL FINANCIAL STATEMENTS CONTINUED
For the year ended 31 May 2015
109
BLU
E L
AB
EL IN
TE
GR
AT
ED
AN
NU
AL R
EP
OR
T 2
01
5
1. SIGNIFICANT ACCOUNTING POLICIES continued
Intangible assets continued
(c) Franchise fees
Franchise fees are shown at historical cost. Franchise fees have a finite useful life and are subsequently carried at cost less accumulated amortisation. Amortisation is calculated using the straight-line method to allocate the cost of franchise fees over their estimated useful lives (20 years).
Franchise fees are initially shown at fair value as determined in accordance with IFRS 3 – Business Combinations, and are subsequently carried at the initially determined fair value less accumulated amortisation and impairment losses.
(d) Databases, customer listings, distribution agreements and customer relationships
Databases, customer listings, distribution agreements and customer relationships acquired through business combinations are initially shown at fair value as determined in accordance with IFRS 3 – Business Combinations, and are subsequently carried at the initially determined fair value less accumulated amortisation and impairment losses. Amortisation is calculated using the straight-line method to allocate the value of these assets over their estimated useful lives (three to 10 years).
Distribution agreements purchased are initially shown at cost, and are subsequently carried at the initial cost less accumulated amortisation and impairment losses. Amortisation is calculated using the straight-line method to allocate the value of these assets over their estimated useful lives (10 years).
(e) Research and development
Costs incurred on development projects are recognised as intangible assets when the following criteria are fulfilled: • It is technically feasible to complete the intangible asset and that it will be available for use or sale; • Management intends to complete the intangible asset and use or sell it; • There is an ability to use or sell the intangible asset; • It can be demonstrated how the intangible asset will generate probable future economic benefits; • Adequate technical, financial and other resources to complete the development and to use or sell
the intangible asset are available; and • The expenditure attributable to the intangible asset during its development can be reliably
measured.
Research expenditure is recognised as an expense as incurred. Other development expenditures that do not meet these criteria are recognised as an expense as incurred.
Development costs previously recognised as an expense are not recognised as an asset in a subsequent period. Capitalised development costs are recorded as intangible assets and amortised from the point at which the asset is available for use (i.e. when it is in the location and condition necessary for it to be capable of operating in the manner intended by management) on a straight-line basis over its useful life (five to 10 years). Direct costs include the product development employee costs and an appropriate portion of relevant overheads. Costs associated with the maintenance of existing products are expensed as incurred.

NOTES TO THE GROUP ANNUAL FINANCIAL STATEMENTS CONTINUED
For the year ended 31 May 2015
110
BLU
E L
AB
EL IN
TE
GR
AT
ED
AN
NU
AL R
EP
OR
T 2
01
5
1. SIGNIFICANT ACCOUNTING POLICIES continued
Intangible assets continued
(f) Purchased starter pack bases and postpaid bases
Purchased starter pack bases represent the right to earn future revenue from starter packs already distributed and are initially recognised at the cost to the Group. Starter pack bases have a finite life and are subsequently carried at cost less accumulated amortisation. Amortisation is calculated using the straight-line method over their estimated useful lives (seven years).
Purchased postpaid bases represent the right to earn revenue from the cellular network in respect of contracts forming part of the acquired base. Postpaid bases have a finite life and are subsequently carried at cost less accumulated amortisation. Amortisation is calculated using the straight-line method over their estimated useful lives (10 years). Where the Group is entitled to a warranty refund on the initial cost of a base, this is disclosed as a reduction in the cost of the asset.
(g) Goodwill
Goodwill represents the excess of the cost of an acquisition over the fair value of the Group’s share of the net identifiable assets of the acquired subsidiary, associate or jointly controlled entity at the date of acquisition. Goodwill is attributable to synergies that the Group expects to derive from the transaction. If the cost of acquisition is less than the net assets of the subsidiary acquired, the difference is recognised directly in the statement of comprehensive income. Goodwill on the acquisition of subsidiaries is included in “goodwill” in the statement of financial position. Goodwill on acquisitions of associates and joint ventures is included in “investments in and loans to associates and joint ventures”.
Goodwill is allocated to cash-generating units for the purpose of impairment testing. Impairment is determined by assessing the recoverable amount of the cash-generating unit to which the goodwill relates. Where the recoverable amount of the cash-generating unit is less than the carrying amount, an impairment is recognised.
Separately recognised goodwill is tested annually for impairment and carried at cost less accumulated impairment losses. Impairment losses on goodwill are not reversed. Gains and losses on the disposal of an entity include the carrying amount of goodwill relating to the entity sold.

NOTES TO THE GROUP ANNUAL FINANCIAL STATEMENTS CONTINUED
For the year ended 31 May 2015
111
BLU
E L
AB
EL IN
TE
GR
AT
ED
AN
NU
AL R
EP
OR
T 2
01
5
1. SIGNIFICANT ACCOUNTING POLICIES continued
Impairment of non-financial assets
The Group evaluates the carrying value of assets with finite useful lives when events and circumstances indicate that the carrying value may not be recoverable and when there are indicators of impairment. Intangible assets that have an indefinite useful life are not subject to amortisation and are tested annually for impairment.
An impairment loss is recognised in the statement of comprehensive income when the carrying amount of an asset exceeds its recoverable amount. An asset’s recoverable amount is the higher of the fair value less cost of disposal (the amount obtainable from the sale of an asset in an arm’s-length transaction between knowledgeable willing parties), or its value-in-use. Value-in-use is the present value of estimated future cash flows expected to arise from the continuing use of an asset and from its disposal at the end of its useful life. The estimated future cash flows are discounted to their present value using a pre-tax discount rate that reflects current market assessments of the time value of money and the risks specific to the asset. For the purposes of assessing impairment, assets are grouped at the lowest levels for which there are separately identifiable cash flows.
An impairment loss recognised for an asset, other than goodwill, in prior years is reversed if there has been a change in the estimates used to determine the asset’s recoverable amount since the last impairment loss was recognised and the recoverable amount exceeds the new carrying amount. The reversal of the impairment is limited to the carrying amount that would have been determined (net of depreciation or amortisation) had no impairment loss been recognised in prior years. The reversal of such an impairment loss is recognised in the statement of comprehensive income in the same line item as the original impairment charge.
Leases
(a) Finance leases
Lease agreements that transfer substantially all the risks and rewards of ownership are classified as finance leases at inception of the lease. The asset is capitalised at the lower of the fair value of the asset or the present value of the minimum lease payments at inception of the lease, with an equivalent amount being stated as a finance lease liability. Finance lease liabilities are classified as non-current or current liabilities, as appropriate. Each lease payment is allocated between the liability and finance charges using the effective interest rate. Finance costs are charged to the statement of comprehensive income over the lease period.
The capitalised asset is depreciated over the shorter of the useful life of the asset or the lease term to its residual value.
(b) Operating leases
Leases in which a significant portion of the risks and benefits of ownership are effectively retained by the lessor are classified as operating leases. Payments under operating leases, net of incentives, are charged to the statement of comprehensive income on a straight-line basis over the period of the lease. When an operating lease is terminated before the lease period has expired, any payment required to be made to the lessor by way of penalty is recognised as an expense in the period in which termination takes place.

NOTES TO THE GROUP ANNUAL FINANCIAL STATEMENTS CONTINUED
For the year ended 31 May 2015
112
BLU
E L
AB
EL IN
TE
GR
AT
ED
AN
NU
AL R
EP
OR
T 2
01
5
1. SIGNIFICANT ACCOUNTING POLICIES continued
Starter pack assets
A starter pack is a tool which enables the connection of a mobile device to a mobile network operator, also known as a subscriber identity module (SIM) card.
The starter pack asset represents starter packs which have been distributed but not yet activated. On activation of the starter pack, the Group has a right to receive cash. Starter packs are stated at cost less provision for impairment and are determined by means of the weighted average cost basis. Provision for impairments are made for starter packs distributed but not expected to be activated.
Inventories
Inventories are stated at the lower of cost or estimated net realisable value. Cost comprises direct materials and, where applicable, overheads that have been incurred in bringing the inventories to their present location and condition, excluding borrowing costs. The cost of inventory is determined by means of the weighted average cost basis. Net realisable value is the estimate of the selling price in the ordinary course of business, less selling expenses. Provisions are made for obsolete, unusable and unsaleable inventory and for latent damage first revealed when inventory items are taken into use or offered for sale.
Trade receivables
Trade receivables are amounts due from customers for goods sold or services performed in the ordinary course of business. If collection is expected in the normal operating cycle of the business, they are classified as current assets. If not, they are presented as non-current assets.
Trade receivables are recognised initially at fair value and subsequently measured at amortised cost using the effective interest rate method, less provision for impairment. A provision for impairment of trade receivables is established when there is objective evidence that the Group will not be able to collect all amounts due according to the original terms of receivables. The amount of the provision is the difference between the asset’s carrying amount and the present value of estimated future cash flows, discounted at the original effective interest rate. The amount of the provision is recognised in the statement of comprehensive income.
Cash and cash equivalents
Cash and cash equivalents include cash in hand, deposits held at call with banks, other short-term highly liquid investments with original maturities of three months or less.
Share capital
Ordinary shares are classified as equity and the shares are fully paid up.
Incremental costs directly attributable to the issue of new shares or options are shown in equity as a deduction, net of tax, from the proceeds. Share issue costs incurred directly in connection with a business combination are shown as a deduction from equity.
Shares acquired by Blue Label Telecoms for its own employees’ equity compensation benefit scheme, as well as the shares procured by the subsidiaries in terms of this scheme, are accounted for as treasury shares in the Group statement of financial position.

NOTES TO THE GROUP ANNUAL FINANCIAL STATEMENTS CONTINUED
For the year ended 31 May 2015
113
BLU
E L
AB
EL IN
TE
GR
AT
ED
AN
NU
AL R
EP
OR
T 2
01
5
1. SIGNIFICANT ACCOUNTING POLICIES continued
Provisions
Provisions are recognised when the Group has a present legal or constructive obligation as a result of past events, it is more likely than not that an outflow of resources embodying economic benefits will be required to settle the obligation and a reliable estimate of the amount of the obligation can be made. Provisions are not recognised for future operating expenses.
Provisions are measured at the present value of the expenditures expected to be required to settle the obligation using a pre-tax rate that reflects current market assessments of the time value of money and the risks specific to the obligation.
The increase in the provision due to the passage of time is recognised as an interest expense.
Borrowings
Borrowings are recognised initially at fair value, net of transaction costs incurred, when the relevant contracts are entered into. Borrowings are subsequently stated at amortised cost; any difference between the proceeds (net of transaction costs) and the redemption value is recognised in the statement of comprehensive income over the period of the borrowings using the effective interest rate method.
Financial liabilities are derecognised when the obligation specified in the contract is discharged, cancelled or expired.
Borrowings are classified as current liabilities unless the Group has an unconditional right to defer settlement of the liability for at least 12 months after year-end.
Normal taxation
The current income tax charge is calculated on the basis of the tax laws enacted or substantively enacted at year-end in the countries where the Company’s subsidiaries, associates and joint ventures operate and generate taxable income. Management periodically evaluates positions taken in tax returns with respect to situations in which applicable tax regulations are subject to interpretation and establishes provisions where appropriate on the basis of amounts expected to be paid to the tax authorities.
The tax expense for the period comprises current and deferred tax. Tax is recognised in the statement of comprehensive income, except to the extent that it relates to items recognised in other comprehensive income or directly in equity. In this case, the tax is also recognised in other comprehensive income or directly in equity respectively.
Uncertain tax positions are considered by the Group at the level of the individual uncertainty or group of related uncertainties.

NOTES TO THE GROUP ANNUAL FINANCIAL STATEMENTS CONTINUED
For the year ended 31 May 2015
114
BLU
E L
AB
EL IN
TE
GR
AT
ED
AN
NU
AL R
EP
OR
T 2
01
5
1. SIGNIFICANT ACCOUNTING POLICIES continued
Deferred taxation
Deferred taxation is provided using the liability method for all temporary differences arising between the tax bases of assets and liabilities and their carrying values for financial reporting purposes. However, if the deferred income tax arises from initial recognition of an asset or liability in a transaction other than a business combination that at the time of the transaction affects neither accounting nor taxable profit or loss, it is not accounted for. Deferred income tax is determined using tax rates (and laws) that have been enacted or substantively enacted by year-end and are expected to apply when the related deferred income tax asset is realised or the deferred income tax liability is settled.
Deferred income tax assets are recognised to the extent that it is probable that future taxable profit will be available against which the temporary differences can be utilised. Deferred income tax is provided on temporary differences arising on investments in subsidiaries and associates, except where the timing of the reversal of the temporary difference is controlled by the Group and it is probable that the temporary difference will not reverse in the foreseeable future.
Deferred income tax assets and liabilities are offset when there is a legally enforceable right to offset current tax assets against current tax liabilities and when the deferred income tax assets and liabilities relate to income taxes levied by the same taxation authority on either the same taxable entity or different taxable entities where there is an intention to settle the balances on a net basis.
Dividends tax
Dividends tax is provided for at 15% of the amount of any dividend paid, subject to certain exemptions. The dividends tax is a tax borne by the beneficial owner of the dividend and will be withheld by either the issuer of the dividend or by regulated intermediaries.
Trade and other payables
Trade payables are obligations to pay for goods or services that have been acquired in the ordinary course of business from suppliers. Trade payables are classified as current liabilities if payment is due within the normal operating cycle of the business. If not, they are presented as non-current liabilities.
Trade payables are measured initially at fair value and are subsequently measured at amortised cost, using the effective interest rate method.
Revenue recognition
Revenue comprises the fair value of the consideration received or receivable for the sale of goods and services in the ordinary course of the Group’s activities. Revenue is shown net of indirect taxes, estimated returns, rebates and discounts, and after eliminated sales within the Group.
Revenue from the sale of goods and the rendering of services is recognised when it is probable that the economic benefits associated with a transaction will flow to the Group and the amount of revenue, and associated costs incurred or to be incurred, can be measured reliably.
Consideration received in advance of goods sold or services rendered is recorded in trade and other payables as deferred revenue. The liability is reversed and the associated revenue is recognised only when the risks and rewards of ownership of the goods are transferred to the customer or the service has been rendered.
NOTES TO THE GROUP ANNUAL FINANCIAL STATEMENTS CONTINUED
For the year ended 31 May 2015
115
BLU
E L
AB
EL IN
TE
GR
AT
ED
AN
NU
AL R
EP
OR
T 2
01
5
1. SIGNIFICANT ACCOUNTING POLICIES continued
Revenue recognition continued
The main categories of revenue and the bases of recognition are as follows:
(a) Prepaid and postpaid SIM cards
Revenue is recognised when the significant risks and rewards of ownership are transferred to the customer, and when the entity no longer retains continuing managerial involvement to the degree usually associated with ownership.
Activation bonuses received from the networks are recognised when the SIM card is activated on the relevant cellular network. Ongoing revenue and other incentives are recognised once certain criteria have been met. The point of activation is determined by the relevant cellular networks. For this category of revenue the Group acts as a principal.
(b) Sales of prepaid airtime
Sales of prepaid airtime are recognised when the Group sells the airtime to the customer. Sales are recorded based on the price specified in the sales contracts, net of discounts at the time of sale. The Group accounts for the sale of prepaid airtime based on the substance of the arrangement. Where the Group acts in its capacity as principal for the sale of airtime (for instance where the Group bears inventory risk), revenue is recognised as the fair value of the consideration receivable net of discounts and taxes. Revenue is recognised at the point at which risks and rewards are transferred to the customer and the Group retains neither continuing managerial involvement to the degree usually associated with ownership nor effective control over the prepaid airtime.
Where the Group is acting in its capacity as an agent in the sale of prepaid airtime (for instance where the Group does not bear any inventory risk), the amount of revenue recorded is the fair value of commission received or receivable.
(c) Sales of postpaid airtime
Sales of postpaid airtime are recognised on airtime contracted to be delivered to customers for a period of time and billed on a monthly basis in arrears. Revenue is recognised when the significant risks and rewards of ownership are transferred to the customer, and when the entity no longer retains continuing managerial involvement to the degree usually associated with ownership.
Where the Group acts in its capacity as principal for the sale of postpaid airtime, revenue is recognised as the fair value of the consideration receivable net of discounts. Where the Group is acting in its capacity as an agent in the sale of postpaid airtime, revenue is recorded upfront as the fair value of commission received or receivable.
(d) Sales of handsets, tablets and other devices
Revenue is recognised at the point at which risks and rewards are transferred to the customer and the Group retains neither continuing managerial involvement to the degree usually associated with ownership nor effective control over the handsets. For this category of revenue the Group acts as a principal.
(e) Sales of services
Sales of services are recognised in the accounting period in which the services are rendered, by reference to completion of the specific transaction assessed on the basis of the actual service provided as a proportion of the total services to be provided. These services include location-based services, SMS transaction services, media, call centre and data transaction revenue, and technology revenue. For this category of revenue the Group acts as a principal.

NOTES TO THE GROUP ANNUAL FINANCIAL STATEMENTS CONTINUED
For the year ended 31 May 2015
116
BLU
E L
AB
EL IN
TE
GR
AT
ED
AN
NU
AL R
EP
OR
T 2
01
5
1. SIGNIFICANT ACCOUNTING POLICIES continued
Revenue recognition continued
(f) Electricity commission
Commissions on the sale of prepaid electricity are recognised when the Group sells electricity to the customer on behalf of the utility suppliers. Commissions are recorded based on agreed rates per the contracts. For this category of revenue the Group acts as an agent.
Employee benefits
(a) Equity compensation benefit
The Group operates an equity-settled forfeitable share incentive plan, under which the entity receives services from employees as consideration for equity instruments of the Group. The fair value of the services received in exchange for the grant of forfeitable shares is recognised as an expense. The total amount to be expensed is determined by the fair value of the forfeitable shares granted. The total amount expensed is recognised over the vesting period, which is the period over which all of the vesting conditions are to be satisfied. At each reporting date, the entity recognises the impact of any shares that have been forfeited prior to the end of the vesting period, if any, in the statement of comprehensive income with a corresponding adjustment to equity.
The subsidiaries procure the shares in order to settle the award, but these are accounted for as a purchase of shares in the holding company, and only once the shares vest as the performance conditions are met would the share be derecognised. When shares are derecognised, the investment in shares in BLT will be credited and equity will be debited as a contribution to the shareholder.
(b) Bonus plans
The Group recognises a liability and an expense for bonuses. A liability is recognised where the Group is contractually obliged or where there is a past practice that has created a constructive obligation.
(c) Leave pay accrual
The Group recognises a liability and an expense for leave. The accrued liability is determined by valuing all future leave expected to be taken and payments expected to be made in respect of benefits.
Interest income
Interest income is recognised on a time-proportion basis using the effective interest rate method. When a receivable is impaired, the Group reduces the carrying amount to its recoverable amount, being the estimated future cash flow discounted at original effective interest rate of the instrument, and continues unwinding the discount as interest income. Interest income on impaired loans is recognised using the original effective interest rate.
Dividend distribution
Dividend distribution to the Company’s shareholders is recognised as a liability in the Group and Company’s financial statements in the period in which they are approved by the shareholders.
Distributions of non-cash assets received from subsidiary companies are recognised as a dividend at the fair value of the non-cash assets received.
Core net profit
Core net profit is a non-IFRS measure used by the Group in evaluating the Group’s performance. This supplements the IFRS measures. Core net profit is calculated by adjusting net profit for the year with the amortisation of intangible assets that arise as a consequence of the purchase price allocations completed in terms of IFRS 3 – Business Combinations.
Reconciliation of core net profit to relevant IFRS measures are presented in note 22 (core HEPS) and note 31 (segmental summary).

NOTES TO THE GROUP ANNUAL FINANCIAL STATEMENTS CONTINUED
For the year ended 31 May 2015
117
BLU
E L
AB
EL IN
TE
GR
AT
ED
AN
NU
AL R
EP
OR
T 2
01
5
2. CRITICAL ACCOUNTING ESTIMATES AND ASSUMPTIONS
The Group makes estimates and assumptions concerning the future. The resulting accounting estimates will, by definition, seldom equal the related actual results. The estimates and assumptions that have a significant risk of causing a material adjustment to the carrying amounts of assets and liabilities within the next financial year are discussed below.
(a) Assessment of goodwill for impairment
The Group tests annually whether goodwill has suffered any impairment, in accordance with the accounting policy. The recoverable amounts of cash-generating units have been determined based on value-in-use calculations. These calculations require the use of estimates. Refer to note 5 for details on these estimates.
(b) Equity compensation benefit
In determining the number of forfeitable shares that will vest due to performance conditions being met, management assesses the attrition rates of staff based on the grades of staff that have been granted awards as well as the historic staff turnover.
(c) Income taxes
As with any enterprise, the Group faces uncertainties in the markets in which it operates and over which it has little or no control. The Group is subject to income tax in numerous jurisdictions and judgement is required in determining the provision for tax.
There are transactions and calculations for which the ultimate tax determination is uncertain during the ordinary course of business. Amounts accrued are based on management’s interpretation of country-specific tax law and the likelihood of settlement. Where the final tax outcome of these matters is different from the amounts that were initially recorded, such differences will impact the current income tax and deferred tax provisions in the period in which such determination is made.
Deferred tax assets are recognised to the extent that it is probable that taxable income will be available in the future against which these can be utilised. Future taxable profits are estimated based on business plans which include estimates and assumptions regarding economic growth, interest rates, inflation and competitive forces.
Changes in the estimates of the consideration could result in the recognition of material adjustments in future periods.
(d) Valuation of intangible assets acquired as part of a business combination
The fair values of all identifiable intangible assets acquired as part of a business combination are determined using recognised valuation techniques. Such techniques often rely on forecasts of future cash flows and the use of appropriate discount rates that reflect the risk factors associated with the cash flows.

NOTES TO THE GROUP ANNUAL FINANCIAL STATEMENTS CONTINUED
For the year ended 31 May 2015
118
BLU
E L
AB
EL IN
TE
GR
AT
ED
AN
NU
AL R
EP
OR
T 2
01
5
2. CRITICAL ACCOUNTING ESTIMATES AND ASSUMPTIONS continued
(d) Valuation of intangible assets acquired as part of a business combination continued
These valuations are based on information at the time of the acquisition and the expectations and assumptions that have been deemed reasonable by the Group’s management. The risk exists that the underlying assumptions or events associated with such assets will not occur as projected. For these reasons, among others, the actual cash flows may vary from forecasts of future cash flows.
(e) Assessment of principal versus agent
Details of whether Blue Label Telecoms acts as a principal or an agent in certain of its transactions is set out in the revenue recognition note. This assessment requires an analysis of whether Blue Label Telecoms carries inventory risk and the customer’s credit risk, whether Blue Label Telecoms has the latitude to establish pricing and whether Blue Label Telecoms has the primary responsibility for providing the goods or services to the customer.
(f) Purchased starter pack bases and postpaid starter pack bases
The relative size of the Group’s purchased starter pack bases and postpaid starter pack bases makes the judgements surrounding the estimated useful lives and residual values critical to the Group’s financial position and performance. Useful lives are reviewed on an annual basis with the effects of any changes in estimate accounted for on a prospective basis. The residual values of these assets are assumed to be zero. The current useful life of these bases is estimated to be seven to 10 years, based on management’s estimates and taking into account historical experience as well as future events which may impact the useful lives.
(g) Assessment of investment in joint ventures for impairment
The Group tests annually whether investment in joint ventures has suffered any impairment, in accordance with the accounting policy. The recoverable amounts of the investment in joint ventures has been determined based on value-in-use calculations. These calculations require the use of estimates. Refer to note 6 for details on these estimates.
(h) Applicability of IFRS 10 – Consolidated Financial Statements
The Group has assessed the requirements of IFRS 10 against shareholder and management agreements and concluded that it does not change the reporting on subsidiary companies that are consolidated.
(i) Assessment of investments for impairment
The Company tests annually whether investments have suffered any impairment, in accordance with the accounting policy. The recoverable amounts of cash-generating units have been determined based on value-in-use calculations. These calculations require the use of estimates. Refer to note 6 of the Company financial statements for details on these estimates.

NOTES TO THE GROUP ANNUAL FINANCIAL STATEMENTS CONTINUED
For the year ended 31 May 2015
119
BLU
E L
AB
EL IN
TE
GR
AT
ED
AN
NU
AL R
EP
OR
T 2
01
5
2. CRITICAL ACCOUNTING ESTIMATES AND ASSUMPTIONS continued
(j) Classification of significant joint arrangements
Joint arrangements are all arrangements where two or more parties contractually agree to share control of the arrangement, which only exists when decisions about the relevant activities require unanimous consent of the parties sharing control. Joint ventures are joint arrangements whereby the parties that have joint control of the arrangement have rights to the net assets of the arrangement.
The Group exercises judgement in determining the classification of its joint arrangements.
Blue Label Mexico S.A. de C.V.
The Group holds an effective interest of 46.64% in the issued ordinary share capital of Blue Label Mexico S.A. de C.V. The joint arrangement provides the Group and the other parties to the agreement with rights to the net assets of the entity. The investment is classified as a joint venture as unanimous approval of the shareholders is required for decisions.
2DFine Holdings Mauritius
The Group holds an effective interest of 50% in the issued ordinary share capital of 2DFine Holdings Mauritius. The joint arrangement provides the Group and the other parties to the agreement with rights to the net assets of the entity. The investment is classified as a joint venture as unanimous approval of the shareholders is required for decisions.
Supa Pesa Africa (Mauritius) Limited
The Group holds an effective interest of 50% in the issued ordinary share capital of Supa Pesa (Mauritius) Limited. The joint arrangement provides the Group and the other parties to the agreement with rights to the net assets of the entity. The investment is classified as a joint venture as unanimous approval of the shareholders is required for decisions.
(k) Classification of significant associates
Associates are all entities over which the Group has significant influence but not control, generally accompanying a shareholding of between 20% and 50% of the voting rights.
Oxigen Services India Private Limited (Oxigen Services India)
Blue Label Telecoms acting through its wholly owned subsidiary, Gold Label Investments, acquired a 50% interest in 2DFine Holdings Mauritius. The investment is classified as a joint venture as unanimous approval of the shareholders is required for decisions. 2DFine Holdings Mauritius holds 37.22% of Oxigen Services India. In terms of IFRS, an entity does not aggregate its interests held through associates and joint ventures when assessing for control as BLT through this relationship cannot direct the financial and operating policies of Oxigen Services India. Therefore, even though BLT has an effective interest of 55.83% in Oxigen Services India, the Group neither controls nor jointly controls Oxigen Services India.
The Group has the right to appoint two directors out of a total of five. Therefore we have concluded that the Group has significant influence over the financial and operating policies of Oxigen Services India.
(l) Assessment of probabilities on contingent purchase arrangements
Management has assessed the probabilities on the contingent purchase arrangements. Refer to note 6 and note 26 for details.

NOTES TO THE GROUP ANNUAL FINANCIAL STATEMENTS CONTINUED
120
BLU
E L
AB
EL IN
TE
GR
AT
ED
AN
NU
AL R
EP
OR
T 2
01
5
For the year ended 31 May 2015
3. FINANCIAL RISKS
In the course of its business, the Group is exposed to a number of financial risks: credit risk, liquidity risk and market risk (including foreign currency, interest rate and other price risks). This note presents the Group’s objectives, policies and processes for managing its financial risk and capital.
Risk management is monitored and managed by key personnel of each entity in the Group on a daily basis based on their specific operational requirements.
Credit risk
Credit risk arises because a counterparty may fail to meet its obligations to the Group.
The Group is exposed to credit risk on financial assets mainly in respect of trade receivables, loan receivables and cash and cash equivalents.
Trade receivables consist primarily of invoiced amounts from normal trading activities. The Group has a diversified customer base and policies are in place to ensure sales are made to customers with an appropriate credit history and payment history. Individual credit limits are set for each customer and the utilisation of these credit limits is monitored regularly. Customers cannot exceed their set credit limit, without specific Senior Management approval. Such approval is assessed and granted on a case-by-case basis. Management regularly reviews the debtors age analysis and follows up on long-outstanding debtors. Where necessary, a provision for impairment is made. A portion of the Group’s customer base is made up of major retailers and wholesalers with the balance of the customer base being widely dispersed.
The risk of starter pack receivables is assessed as low due to the fact that annuity income can be utilised in the settlement of the receivable balances and are recoverable within a period which may exceed 12 months.
Loans are only granted to holders with an appropriate credit history, taking into account the holder’s financial position and past experience.
The Group places cash and cash equivalents with major banking groups and quality institutions that have high credit ratings.
The Group has significant concentrations of credit risk with Investec Bank Limited in line with its treasury function.
The Group’s maximum credit risk exposure is the carrying amount of all financial assets on the statement of financial position and sureties provided with the maximum amount the Group could have to pay if the sureties are called on, amounting to R62 million (2014: R1.9 million). The Group holds collateral in the form of sureties in respect of 50% of the loan receivable from 2DFine Holdings Mauritius. Refer to note 29.

For the year ended 31 May 2015
121
BLU
E L
AB
EL IN
TE
GR
AT
ED
AN
NU
AL R
EP
OR
T 2
01
5
NOTES TO THE GROUP ANNUAL FINANCIAL STATEMENTS CONTINUED
3. FINANCIAL RISKS continued
The Group considers its maximum exposure per class, without taking into account any collateral and financial guarantees, to be as follows:
2014 R’000
Loans receivable
Group 1 — —
Group 2 74 083 44 973
Group 3 219 1 378
74 302 46 351
Loans to associates and joint ventures
Group 1 13 900 —
Group 2 193 186 153 800
Group 3 — —
207 086 153 800
Trade receivables
Group 1 10 699 14 783
Group 2 2 619 334 2 117 891
Group 3 18 504 18 113
Total unimpaired trade receivables 2 648 537 2 150 787
Refer to note 9 for a breakdown of the provision raised for trade receivables. The effect of discounting of the trade receivables is not taken into account in the table above.
The Group has subordinated a portion of its loan to a joint venture in favour of other creditors, to the value of R45 million.
The rating groups for counterparties are categorised as follows:
Group 1 – New customers/related parties (less than six months).Group 2 – Existing customers/related parties (more than six months) with no defaults in the past. Group 3 – Existing customers/related parties (more than six months) with some defaults in the past.
All defaults were fully recovered or are in the process of being recovered.
2015R’000
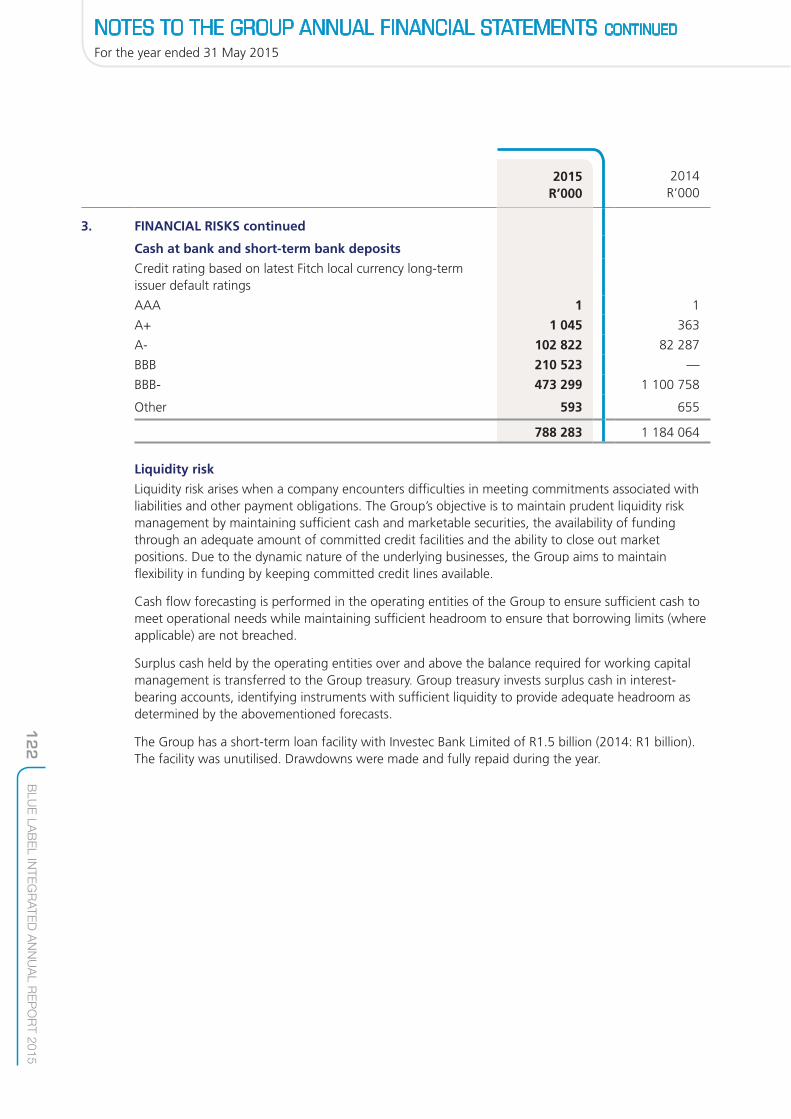
NOTES TO THE GROUP ANNUAL FINANCIAL STATEMENTS CONTINUED
For the year ended 31 May 2015
122
BLU
E L
AB
EL IN
TE
GR
AT
ED
AN
NU
AL R
EP
OR
T 2
01
5
2014 R’000
3. FINANCIAL RISKS continued
Cash at bank and short-term bank deposits
Credit rating based on latest Fitch local currency long-term issuer default ratings
AAA 1 1
A+ 1 045 363
A- 102 822 82 287
BBB 210 523 —
BBB- 473 299 1 100 758
Other 593 655
788 283 1 184 064
Liquidity risk
Liquidity risk arises when a company encounters difficulties in meeting commitments associated with liabilities and other payment obligations. The Group’s objective is to maintain prudent liquidity risk management by maintaining sufficient cash and marketable securities, the availability of funding through an adequate amount of committed credit facilities and the ability to close out market positions. Due to the dynamic nature of the underlying businesses, the Group aims to maintain flexibility in funding by keeping committed credit lines available.
Cash flow forecasting is performed in the operating entities of the Group to ensure sufficient cash to meet operational needs while maintaining sufficient headroom to ensure that borrowing limits (where applicable) are not breached.
Surplus cash held by the operating entities over and above the balance required for working capital management is transferred to the Group treasury. Group treasury invests surplus cash in interest-bearing accounts, identifying instruments with sufficient liquidity to provide adequate headroom as determined by the abovementioned forecasts.
The Group has a short-term loan facility with Investec Bank Limited of R1.5 billion (2014: R1 billion). The facility was unutilised. Drawdowns were made and fully repaid during the year.
2015R’000

NOTES TO THE GROUP ANNUAL FINANCIAL STATEMENTS CONTINUED
For the year ended 31 May 2015
123
BLU
E L
AB
EL IN
TE
GR
AT
ED
AN
NU
AL R
EP
OR
T 2
01
5
3. FINANCIAL RISKS continued
Liquidity risk continued
The facility bears certain debt covenants. The Group has not been in breach in respect of these covenants. The Group has pledged certain securities in respect of this facility. Refer to notes 9, 11 and 12.
The Company and a subsidiary company issued a cross surety in respect of an overdraft facility in the amount of R19.85 million (2014: R19.85 million) in favour of FNB, a division of First National Bank Limited (FNB). This facility was unutilised as at 31 May 2015. In addition, the Company and four of its subsidiaries issued a cross surety in the amount of R1.3 million in respect of credit card facilities granted by FNB.
The table below analyses the Group’s non-derivative financial liabilities into relevant maturity groupings based on the remaining period at the statement of financial position date to the contractual maturity date.
The amounts disclosed in the table are the contractual undiscounted cash flows.
Maturity of financial liabilities
2015
Non-interest-bearing borrowings 16 087 — — — —
Trade and other payables* 1 947 194 904 244 89 650 73 133 —
Total 1 963 281 904 244 89 650 73 133 —
2014
Non-interest-bearing borrowings 12 437 — — — —
Interest-bearing borrowings 2 653 — — — —
Trade and other payables* 1 580 441 1 258 679 46 408 4 482 —
Total 1 595 531 1 258 679 46 408 4 482 —
* Trade and other payables exclude non-financial instruments, being VAT and certain amounts included within accruals and sundry creditors.
Less thanone month
or ondemand
R’000
More thanone month
but notexceeding
one yearR’000
Payable in:More than
one yearbut not
exceedingtwo years
R’000
More thantwo years
but notexceedingfive years
R’000
More thanfive years
R’000

NOTES TO THE GROUP ANNUAL FINANCIAL STATEMENTS CONTINUED
For the year ended 31 May 2015
124
BLU
E L
AB
EL IN
TE
GR
AT
ED
AN
NU
AL R
EP
OR
T 2
01
5
3. FINANCIAL RISKS continued
Market risk
Market risk is the risk that changes in market prices (interest rate and currency risk) will affect the Group’s income or the value of its holding of financial instruments. The objective of market risk management is to manage and control market risk exposures within acceptable parameters, while optimising the return.
The Group is exposed to risks from movements in foreign exchange rates and interest rates that affect its assets, liabilities and anticipated future transactions. The Group is not exposed to significant levels of price risk.
Fair value estimation
Fair value measurement hierarchy: • Level 1: fair value based on quoted prices (unadjusted) in active markets for identical assets or
liabilities; • Level 2: fair value based on inputs other than quoted prices included within level 1 that are
observable for the asset or liability, either directly (that is, as prices) or indirectly (that is, derived from prices); or
• Level 3: fair value based on inputs for the asset or liability that are not based on observable market data (that is, unobservable inputs).
Contingent consideration, included in trade and other payables, are level 3 financial liabilities.
Changes in level 3 instruments are as follows:
2014 R’000
Contingent consideration
Opening balance 22 607 3 030
Acquisition of Panacea Proprietary Limited — 6 155
Acquisition of Retail Mobile Credit Specialists Proprietary Limited — 15 132
Acquisition of Viamedia Proprietary Limited 84 783 —
Acquisition of Supa Pesa Africa (Mauritius) Limited 29 851 —
Acquisition of Supa Pesa South Africa Proprietary Limited 100 —
Settlements (19 515) (1 800)
Gains or losses recognised in profit or loss 6 076 90
Closing balance 123 902 22 607
Total gains or losses for the period included in profit or loss for liabilities held at the end of the reporting period, under:
Other income (923) (827)
Interest paid 6 999 917
Change in unrealised gains or losses for the period included in profit or loss for liabilities held at the end of the reporting period 2 052 917
2015R’000

NOTES TO THE GROUP ANNUAL FINANCIAL STATEMENTS CONTINUED
For the year ended 31 May 2015
125
BLU
E L
AB
EL IN
TE
GR
AT
ED
AN
NU
AL R
EP
OR
T 2
01
5
3. FINANCIAL RISKS continued
Cash flow and fair value interest rate risk
The Group’s cash flow interest rate risk arises from loans receivable, cash and cash equivalents and borrowings carrying interest at variable rates. The Group is not exposed to fair value interest rate risk as the Group does not have any fixed interest-bearing instruments carried at fair value.
As part of the process of managing the Group’s exposure to interest rate risk, interest rate characteristics of new borrowings and the refinancing of existing borrowings are positioned according to expected movements in interest rates.
Foreign currency risk
The Group is exposed to foreign currency risk from transactions and translation. Transaction exposure arises because affiliated companies undertake transactions in currencies other than their functional currency. Translation exposure arises where affiliated companies have a functional currency other than the rand.
The Group manages its exposure to foreign currency risk by ensuring that the net foreign currency exposure remains within acceptable levels. Hedging instruments may be used in certain instances to reduce risks arising from foreign currency fluctuations.
IFRS 7 – Sensitivity Analysis
The Group has used a sensitivity analysis technique that measures the estimated change to the statement of comprehensive income of either an instantaneous increase or decrease of 1% (100 basis points) in market interest rates or a 10% strengthening or weakening of the rand against all other currencies, from the rates applicable at 31 May 2015, for each class of financial instrument with all other variables remaining constant. This analysis is for illustrative purposes only, as in practice market rates rarely change in isolation.
Interest rate sensitivity
The interest rate sensitivity analysis is based on the following assumptions: • Changes in market interest rates affect the interest income or expense of variable interest financial
instruments; • Changes in market interest rates only affect interest income or expense in relation to financial
instruments with fixed interest rates if these are recognised at fair value; and • Under these assumptions, a 1% increase or decrease in market interest rates at 31 May 2015
would increase or decrease profit before tax by R8.5 million (2014: R13.6 million).

NOTES TO THE GROUP ANNUAL FINANCIAL STATEMENTS CONTINUED
For the year ended 31 May 2015
126
BLU
E L
AB
EL IN
TE
GR
AT
ED
AN
NU
AL R
EP
OR
T 2
01
5
3. FINANCIAL RISKS continued
Foreign currency sensitivity
Financial instruments by currency
ZARR’000
USDR’000
NgNR’000
GBPR’000
TotalR’000
2015
Financial assets
Cash and cash equivalents 787 365 1 045 1 — 788 411
Trade and other receivables* 2 723 842 97 — 18 071 2 742 010
Loans receivable 74 302 — — — 74 302
Loans to associates and joint ventures 13 900 193 186 — — 207 086
3 599 409 194 328 1 18 071 3 811 809
Financial liabilities
Non-interest-bearing borrowings 16 087 — — — 16 087
Trade and other payables* 3 013 412 171 638 — 3 014 221
3 029 499 171 638 — 3 030 308
Net financial position 569 910 194 157 (637) 18 071 781 501
2014
Financial assets
Cash and cash equivalents 1 183 767 363 1 — 1 184 131
Trade and other receivables* 2 190 568 262 — — 2 190 830
Loans receivable 46 351 — — — 46 351
Loans to associates and joint ventures 305 153 495 — — 153 800
3 420 991 154 120 1 — 3 575 112
Financial liabilities
Non-interest-bearing borrowings 12 437 — — — 12 437
Interest-bearing borrowings 2 653 — — — 2 653
Trade and other payables* 2 888 914 261 730 105 2 890 010
2 904 004 261 730 105 2 905 100
Net financial position 516 987 153 859 (729) (105) 670 012
* Trade and other receivables and trade and other payables exclude non-financial instruments.
With a 10% strengthening or weakening in the rand against all other currencies, profit before tax would have decreased or increased by R21.2 million. In the prior year, with a 10% strengthening or weakening in the rand against all other currencies, profit before tax would have decreased or increased by R15.3 million.
ZARR’000
USDR’000
NgNR’000
GBPR’000
TotalR’000

NOTES TO THE GROUP ANNUAL FINANCIAL STATEMENTS CONTINUED
For the year ended 31 May 2015
127
BLU
E L
AB
EL IN
TE
GR
AT
ED
AN
NU
AL R
EP
OR
T 2
01
5
3. FINANCIAL RISKS continued
Capital risk
The Group’s objectives when managing capital are to safeguard the Group’s ability to continue as a going concern in order to provide returns for shareholders and benefits for other stakeholders and to maintain an optimal capital structure to reduce the cost of capital.
In order to maintain or adjust this capital structure, the Company may issue new shares, adjust the amount of dividends paid to shareholders, return capital to shareholders or sell assets to reduce debt.
The Group defines capital as capital and reserves and non-current borrowings. The Group is not subject to externally imposed capital requirements.
There were no changes to the Group’s approach to capital management during the year.

NOTES TO THE GROUP ANNUAL FINANCIAL STATEMENTS CONTINUED
For the year ended 31 May 2015
128
BLU
E L
AB
EL IN
TE
GR
AT
ED
AN
NU
AL R
EP
OR
T 2
01
5
4. PROPERTY, PLANT AND EQUIPMENT
Year ended 31 May 2015
Opening carrying amount 16 561 2 245 7 342
Additions 17 834 1 202 3 992
Acquisition of subsidiary 1 428 89 —
Disposals (116) — (875)
Disposal of subsidiary (64) — —
Depreciation charge (12 596) (976) (2 616)
Closing carrying amount 23 047 2 560 7 843
At 31 May 2015
Cost 72 529 10 835 14 974
Accumulated depreciation (49 312) (7 571) (7 131)
Accumulated impairments (170) (704) —
Carrying amount 23 047 2 560 7 843
Year ended 31 May 2014
Opening carrying amount 13 772 3 157 7 509
Additions 11 755 438 2 558
Acquisition of subsidiary 503 116 —
Disposals (337) (18) (226)
Depreciation charge (9 114) (1 337) (2 499)
Impairment charges* (18) (111) —
Closing carrying amount 16 561 2 245 7 342
At 31 May 2014
Cost 54 808 9 551 13 492
Accumulated depreciation (38 077) (6 602) (6 150)
Accumulated impairments (170) (704) —
Carrying amount 16 561 2 245 7 342
* All impairment charges in the prior year related to Datacel Direct Proprietary Limited, the fixed assets of which were considered not recoverable and scrapped at net book value. These impairment charges solely related to the Solutions segment.
There are no property, plant and equipment assets that are encumbered.
The residual values of buildings are estimated to be higher than the carrying value and therefore there is no depreciation charge.
Computerequipment
R’000
Furnitureand fittings
R’000
Motorvehicles
R’000

NOTES TO THE GROUP ANNUAL FINANCIAL STATEMENTS CONTINUED
For the year ended 31 May 2015
129
BLU
E L
AB
EL IN
TE
GR
AT
ED
AN
NU
AL R
EP
OR
T 2
01
5
1 033 17 447 46 713 106 798 4 955 97 200
338 1 145 25 516 3 128 163 — 53 318
50 12 — — — — 1 579
(23) — (2 666) — — (856) (4 536)
— — — — — — (64)
(414) (6 644) (17 361) (9) (197) — (40 813)
984 11 960 52 202 3 225 764 4 099 106 684
7 254 48 275 124 391 3 242 1 026 4 099 286 625
(5 850) (35 877) (68 602) (17) (262) — (174 622)
(420) (438) (3 587) — — — (5 319)
984 11 960 52 202 3 225 764 4 099 106 684
1 202 23 606 36 891 114 42 1 832 88 125
518 710 26 396 — 813 3 123 46 311
108 — — — — — 727
(42) — (235) — — — (858)
(753) (6 869) (16 339) (8) (57) — (36 976)
— — — — — — (129)
1 033 17 447 46 713 106 798 4 955 97 200
7 014 47 584 112 793 114 864 4 955 251 175
(5 561) (29 699) (61 493) (8) (66) — (147 656)
(420) (438) (4 587) — — — (6 319)
1 033 17 447 46 713 106 798 4 955 97 200
Officeequipment
R’000
Leaseholdimprove-
mentsR’000
Terminalsand vending
machinesR’000
Mediaequipment
R’000
Plant andmachinery
R’000Buildings
R’000TotalR’000

NOTES TO THE GROUP ANNUAL FINANCIAL STATEMENTS CONTINUED
For the year ended 31 May 2015
130
BLU
E L
AB
EL IN
TE
GR
AT
ED
AN
NU
AL R
EP
OR
T 2
01
5
GoodwillR’000
TrademarksR’000
CustomerlistingR’000
5. INTANGIBLE ASSETS AND GOODWILL
Year ended 31 May 2015
Opening carrying amount 423 384 1 298 1 031
Additions — — —
Acquisition of subsidiary 185 967 — —
Disposals — — —
Disposal of subsidiary (2 742) — —
Amortisation charge — (677) (265)
Closing carrying amount 606 609 621 766
At 31 May 2015
Cost 637 476 6 835 33 306
Accumulated amortisation (4 747) (6 214) (32 540)
Accumulated impairments (26 120) — —
Carrying amount 606 609 621 766
Year ended 31 May 2014
Opening carrying amount 217 635 1 975 1 482
Additions — — 159
Acquisition of subsidiary 205 749 — —
Disposals — — —
Amortisation charge — (677) (610)
Impairment charges — — —
Closing carrying amount 423 384 1 298 1 031
At 31 May 2014
Cost 454 250 6 835 33 306
Accumulated amortisation (4 746) (5 537) (32 275)
Accumulated impairments (26 120) — —
Carrying amount 423 384 1 298 1 031
* Included in the amortisation charge is an amount of R73.5 million (2014: R69.8 million) in respect of the purchased starter pack bases and postpaid bases, which is charged to the changes in inventories of finished goods line in the statement of comprehensive income.
** The postpaid base acquired included a warranty clause pertaining to the initial performance of the base. The Group was entitled to a warranty refund on the initial cost of the base, which is disclosed as a reduction in the cost of the asset.
*** This represents independently distributed starter pack bases and postpaid bases purchased. The remaining amortisation periods range between 19 months and 91 months.
GoodwillR’000
TrademarksR’000
CustomerlistingR’000
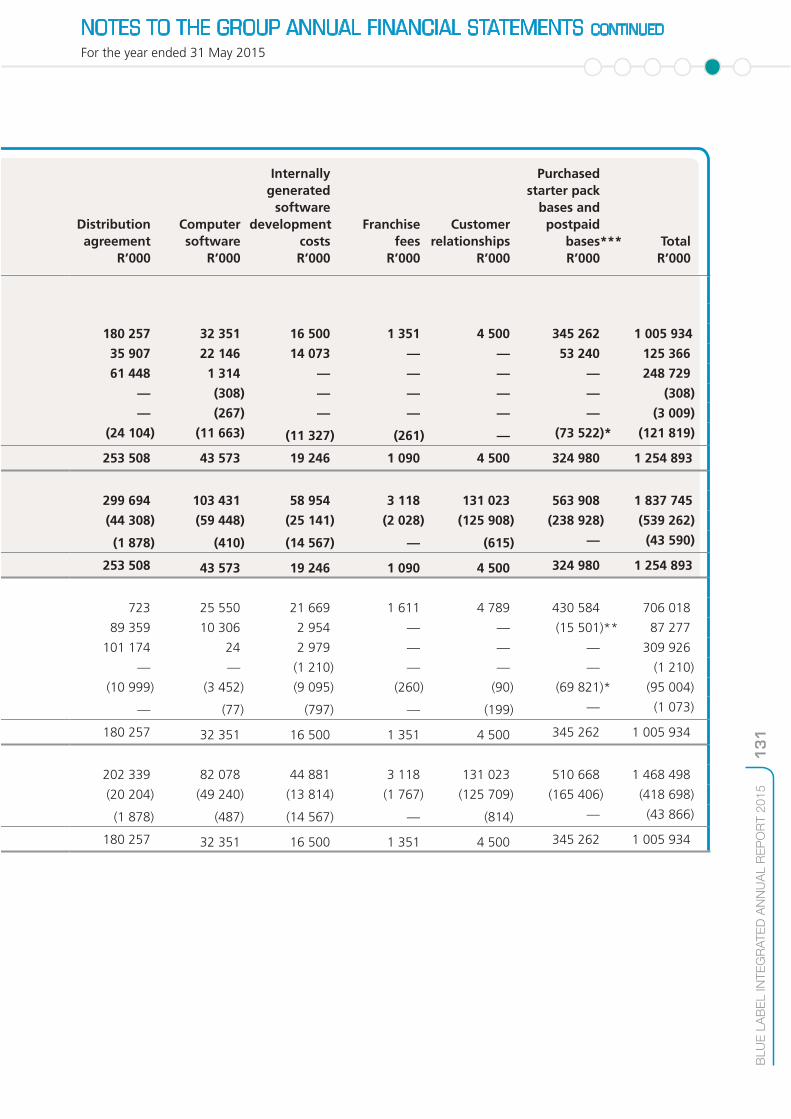
NOTES TO THE GROUP ANNUAL FINANCIAL STATEMENTS CONTINUED
For the year ended 31 May 2015
131
BLU
E L
AB
EL IN
TE
GR
AT
ED
AN
NU
AL R
EP
OR
T 2
01
5
Distributionagreement
R’000
Computersoftware
R’000
Internallygenerated
softwaredevelopment
costsR’000
Franchisefees
R’000
Customerrelationships
R’000
Purchased***starter pack
bases andpost–paid
basesR’000
TotalR’000
180 257 32 351 16 500 1 351 4 500 345 262 1 005 934
35 907 22 146 14 073 — — 53 240 125 366
61 448 1 314 — — — — 248 729
— (308) — — — — (308)
— (267) — — — — (3 009)
(24 104) (11 663) (11 327) (261) — (73 522)* (121 819)
253 508 43 573 19 246 1 090 4 500 324 980 1 254 893
299 694 103 431 58 954 3 118 131 023 563 908 1 837 745
(44 308) (59 448) (25 141) (2 028) (125 908) (238 928) (539 262)
(1 878) (410) (14 567) — (615) — (43 590)
253 508 43 573 19 246 1 090 4 500 324 980 1 254 893
723 25 550 21 669 1 611 4 789 430 584 706 018
89 359 10 306 2 954 — — (15 501)** 87 277
101 174 24 2 979 — — — 309 926
— — (1 210) — — — (1 210)
(10 999) (3 452) (9 095) (260) (90) (69 821)* (95 004)
— (77) (797) — (199) — (1 073)
180 257 32 351 16 500 1 351 4 500 345 262 1 005 934
202 339 82 078 44 881 3 118 131 023 510 668 1 468 498
(20 204) (49 240) (13 814) (1 767) (125 709) (165 406) (418 698)
(1 878) (487) (14 567) — (814) — (43 866)
180 257 32 351 16 500 1 351 4 500 345 262 1 005 934
Distributionagreement
R’000
Computersoftware
R’000
Internallygenerated
softwaredevelopment
costsR’000
Franchisefees
R’000
Customerrelationships
R’000
Purchasedstarter pack
bases andpostpaid
bases***R’000
TotalR’000
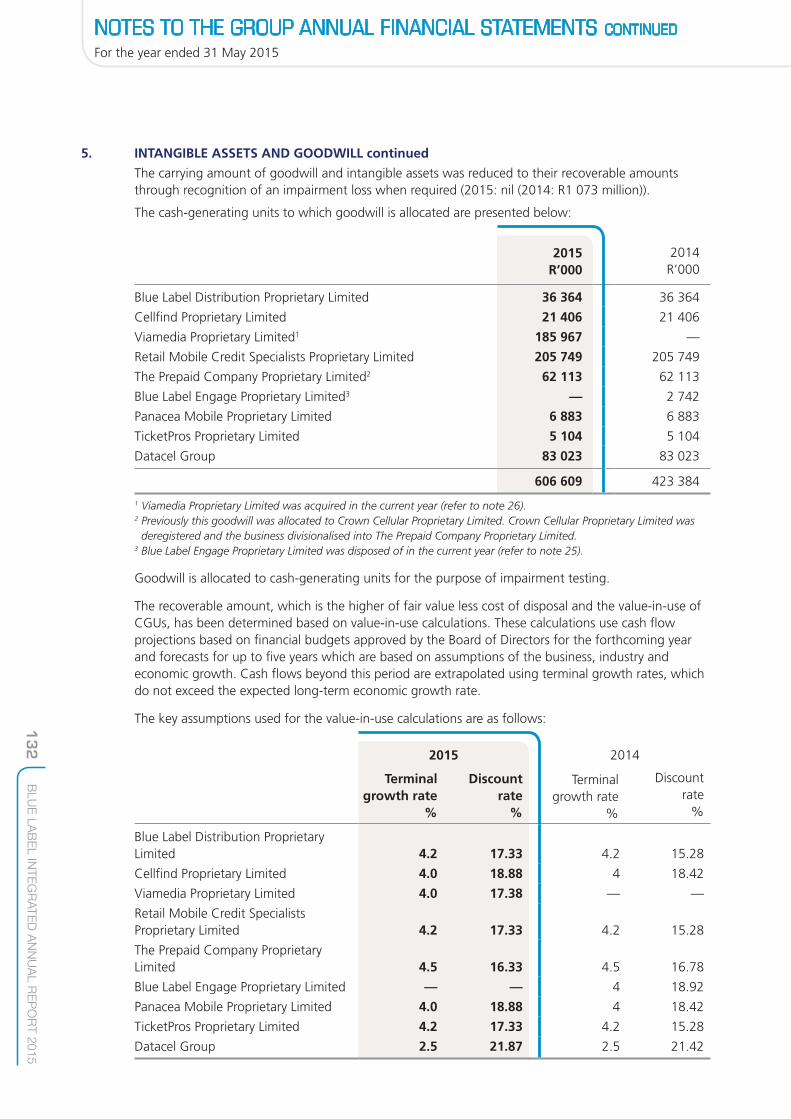
NOTES TO THE GROUP ANNUAL FINANCIAL STATEMENTS CONTINUED
For the year ended 31 May 2015
132
BLU
E L
AB
EL IN
TE
GR
AT
ED
AN
NU
AL R
EP
OR
T 2
01
5
5. INTANGIBLE ASSETS AND GOODWILL continued
The carrying amount of goodwill and intangible assets was reduced to their recoverable amounts through recognition of an impairment loss when required (2015: nil (2014: R1 073 million)).
The cash-generating units to which goodwill is allocated are presented below:
2014 R’000
Blue Label Distribution Proprietary Limited 36 364 36 364
Cellfind Proprietary Limited 21 406 21 406
Viamedia Proprietary Limited1 185 967 —
Retail Mobile Credit Specialists Proprietary Limited 205 749 205 749
The Prepaid Company Proprietary Limited2 62 113 62 113
Blue Label Engage Proprietary Limited3 — 2 742
Panacea Mobile Proprietary Limited 6 883 6 883
TicketPros Proprietary Limited 5 104 5 104
Datacel Group 83 023 83 023
606 609 423 384
1 Viamedia Proprietary Limited was acquired in the current year (refer to note 26).2 Previously this goodwill was allocated to Crown Cellular Proprietary Limited. Crown Cellular Proprietary Limited was
deregistered and the business divisionalised into The Prepaid Company Proprietary Limited.3 Blue Label Engage Proprietary Limited was disposed of in the current year (refer to note 25).
Goodwill is allocated to cash-generating units for the purpose of impairment testing.
The recoverable amount, which is the higher of fair value less cost of disposal and the value-in-use of CGUs, has been determined based on value-in-use calculations. These calculations use cash flow projections based on financial budgets approved by the Board of Directors for the forthcoming year and forecasts for up to five years which are based on assumptions of the business, industry and economic growth. Cash flows beyond this period are extrapolated using terminal growth rates, which do not exceed the expected long-term economic growth rate.
The key assumptions used for the value-in-use calculations are as follows:
2014
Terminalgrowth rate
%
Discountrate
%
Blue Label Distribution Proprietary Limited 4.2 17.33 4.2 15.28
Cellfind Proprietary Limited 4.0 18.88 4 18.42
Viamedia Proprietary Limited 4.0 17.38 — —
Retail Mobile Credit Specialists Proprietary Limited 4.2 17.33 4.2 15.28
The Prepaid Company Proprietary Limited 4.5 16.33 4.5 16.78
Blue Label Engage Proprietary Limited — — 4 18.92
Panacea Mobile Proprietary Limited 4.0 18.88 4 18.42
TicketPros Proprietary Limited 4.2 17.33 4.2 15.28
Datacel Group 2.5 21.87 2.5 21.42
2015R’000
2015
Terminal growth rate
%
Discountrate
%

NOTES TO THE GROUP ANNUAL FINANCIAL STATEMENTS CONTINUED
For the year ended 31 May 2015
133
BLU
E L
AB
EL IN
TE
GR
AT
ED
AN
NU
AL R
EP
OR
T 2
01
5
5. INTANGIBLE ASSETS AND GOODWILL continued
The discount rates used are pre-tax and reflect specific risks relating to the relevant companies. The growth rate is used to extrapolate cash flows beyond the budget period.
For The Prepaid Company Proprietary Limited and TicketPros Proprietary Limited if one or more of the inputs were changed to a reasonable possible alternative assumption, there would be no impairments that would have to be recognised.
For the remaining balances of goodwill, the discount rate used when calculating the value-in-use calculations would need to be increased by the following amounts before any impairments would need to be recognised:
Blue Label Distribution Proprietary Limited 7.3Cellfind Proprietary Limited 1.7Viamedia Proprietary Limited 3.8Retail Mobile Credit Specialists Proprietary Limited 11.1Panacea Mobile Proprietary Limited 15.3Datacel Group 6.7
The goodwill balances did not result in impairment charges for the year when compared to recoverable amounts (2014: nil).
2014 R’000
6. INVESTMENTS IN AND LOANS TO ASSOCIATES AND JOINT VENTURES
Cost and share of reserves at the beginning of the year 444 309 396 721
Acquisition of associates and joint ventures 81 475 89 316Share of losses from associates and joint ventures (79 338) (56 873)Share of results after tax (75 745) (53 558)Amortisation of intangible assets (4 990) (4 604)Deferred tax on intangible assets amortisation 1 397 1 289
Foreign currency translation reserve (10 497) 26 099Equity compensation benefit 548 164Dividends received (1 388) (11 118) Disposal of associate (93 623) —
Cost and share of reserves at the end of the year 341 486 444 309
Loans at the beginning of the year 153 800 127 441
Loans granted to associates and joint ventures 77 601 99 217Loan granted to joint venture capitalised (50 033) (89 316)*
Unrealised foreign exchange profit on loans to associates and joint ventures 25 718 16 458
Loans at the end of the year 207 086 153 800
Closing net book value 548 572 598 109
* On 10 September 2013, a loan of R85.8 million was advanced to Blue Label Mexico S.A. de C.V. (BLM). This loan was capitalised on 18 December 2013. The difference of R3.5 million relates to foreign exchange movements.
Increase indiscount
rate%
2015R’000
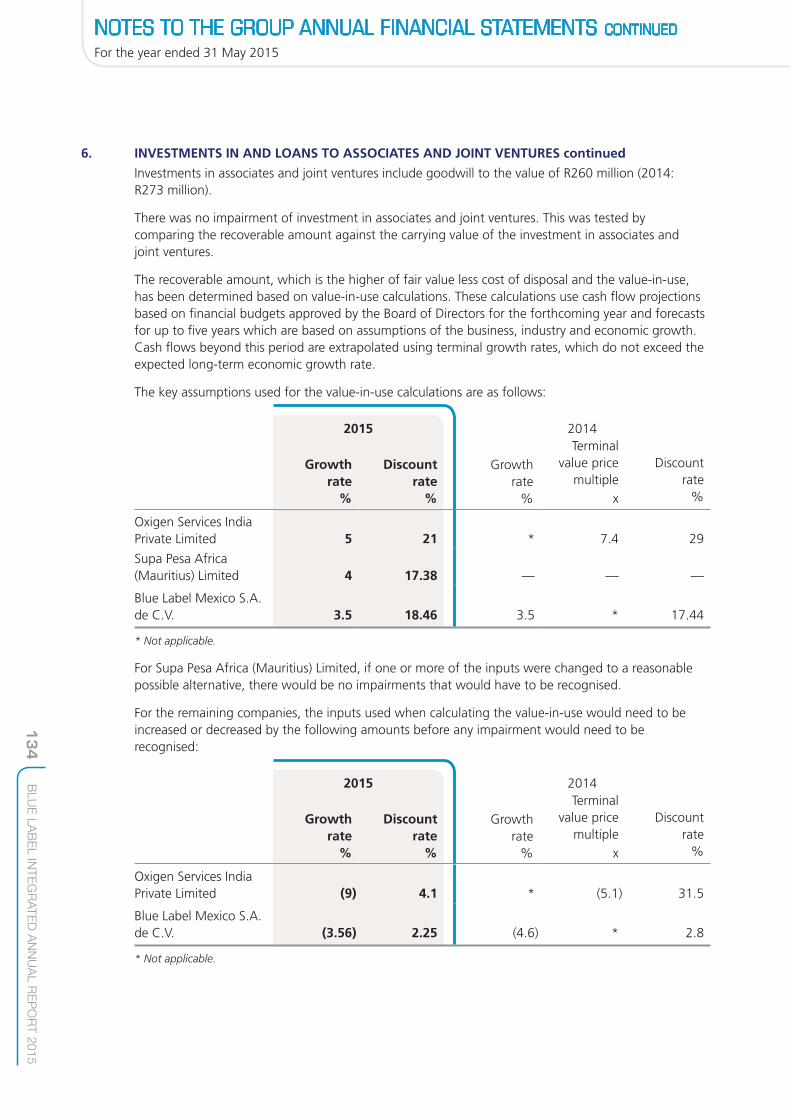
NOTES TO THE GROUP ANNUAL FINANCIAL STATEMENTS CONTINUED
For the year ended 31 May 2015
134
BLU
E L
AB
EL IN
TE
GR
AT
ED
AN
NU
AL R
EP
OR
T 2
01
5
6. INVESTMENTS IN AND LOANS TO ASSOCIATES AND JOINT VENTURES continued
Investments in associates and joint ventures include goodwill to the value of R260 million (2014: R273 million).
There was no impairment of investment in associates and joint ventures. This was tested by comparing the recoverable amount against the carrying value of the investment in associates and joint ventures.
The recoverable amount, which is the higher of fair value less cost of disposal and the value-in-use, has been determined based on value-in-use calculations. These calculations use cash flow projections based on financial budgets approved by the Board of Directors for the forthcoming year and forecasts for up to five years which are based on assumptions of the business, industry and economic growth. Cash flows beyond this period are extrapolated using terminal growth rates, which do not exceed the expected long-term economic growth rate.
The key assumptions used for the value-in-use calculations are as follows:
2014
Growth rate
%
Terminalvalue price
multiplex
Discountrate
%
Oxigen Services India Private Limited 5 21 * 7.4 29
Supa Pesa Africa (Mauritius) Limited 4 17.38 — — —
Blue Label Mexico S.A. de C.V. 3.5 18.46 3.5 * 17.44
* Not applicable.
For Supa Pesa Africa (Mauritius) Limited, if one or more of the inputs were changed to a reasonable possible alternative, there would be no impairments that would have to be recognised.
For the remaining companies, the inputs used when calculating the value-in-use would need to be increased or decreased by the following amounts before any impairment would need to be recognised:
2014
Growth rate
%
Terminalvalue price
multiplex
Discountrate
%
Oxigen Services India Private Limited (9) 4.1 * (5.1) 31.5
Blue Label Mexico S.A. de C.V. (3.56) 2.25 (4.6) * 2.8
* Not applicable.
2015
Growth rate
%
Discountrate
%
2015
Growth rate
%
Discountrate
%

NOTES TO THE GROUP ANNUAL FINANCIAL STATEMENTS CONTINUED
For the year ended 31 May 2015
135
BLU
E L
AB
EL IN
TE
GR
AT
ED
AN
NU
AL R
EP
OR
T 2
01
5
6. INVESTMENTS IN AND LOANS TO ASSOCIATES AND JOINT VENTURES continued
Loans to associates and joint ventures
Interestrate
2014 R’000
Oxigen Services India Private Limited Libor + 1.50% 29 552 25 068
Blue Label Mexico S.A. de C.V. 4.50% — 1 054
2DFine Holdings Mauritius* 10% 163 634 127 373
Supa Pesa South Africa Proprietary Limited 11% 7 900 —
Lornanox Proprietary Limited 0% 6 000 —
Forensic Intelligence Data Solutions Proprietary Limited — 305
207 086 153 800
* Refer to note 29 for details on the surety relating to this loan.
The loans are neither past due nor impaired with a low risk of default. Refer to note 3 for more details.
Loans to associates and joint ventures are repayable on demand.
Shares in associates and joint ventures acquired during the year
EffectiveDate acquired percentage
Supa Pesa Africa (Mauritius) Limited Joint venture 1 March 2015 50
Supa Pesa South Africa Proprietary Limited Joint venture 1 March 2015 50
Lornanox Proprietary Limited Associate 22 January 2015 40
Mpower Softcomm Private Limited Associate 1 June 2014 21.6
Blue Label Mexico S.A. de C.V. Joint venture 1 September 2014 1.07
During the year, Supa Pesa Africa (Mauritius) Limited and Supa Pesa South Africa Proprietary Limited were acquired for a consideration of R30 million and R50 000 respectively. Lornanox Proprietary Limited was acquired for a consideration of 80 cents.
The R30 million acquisition price of Supa Pesa Africa (Mauritius) Limited includes a cash element of R0.1 million and a contingent consideration of R37.5 million if certain profit warranties are achieved. The first three amounts of R9.83 million (R29.5 million in total) are based on the profit of Supa Pesa Africa (Mauritius) Limited for the years ended 31 May 2016, 31 May 2017 and 31 May 2018. The fourth amount of R8 million is based on the cumulative profits for the year ending 31 May 2018.
The potential undiscounted amount of all future payments that the Group could be required to make under this arrangement is between Rnil and R37.5 million.
The fair value of the contingent consideration arrangement of R29.9 million was estimated by applying the income approach. The fair value estimates are based on a discount rate of 9.25%. For all profit targets management has assumed a probability of 100%. In determining these probabilities management has assessed the cash flow projections based on financial budgets approved by the Board and Directors for the forthcoming three years which are based on assumptions of the business, industry and economic growth.
Gold Label Investments Proprietary Limited and 2DFine Holdings Investments Mauritius each received 14.4% shares in Mpower Softcomm Private Limited as part of a demerger transaction in Oxigen Services India Private Limited. This was received by way of a dividend to the value of R1.4 million each.
In the current year, there was a further capital contribution of R50 million to BLM. This comprised R49 million loaned in September 2014 together with the R1 million loan outstanding at the beginning of the financial year. This resulted in a dilution of shares held by an outside shareholder increasing our shareholding to 46.64%.
2015R’000

NOTES TO THE GROUP ANNUAL FINANCIAL STATEMENTS CONTINUED
For the year ended 31 May 2015
136
BLU
E L
AB
EL IN
TE
GR
AT
ED
AN
NU
AL R
EP
OR
T 2
01
5
6. INVESTMENTS IN AND LOANS TO ASSOCIATES AND JOINT VENTURES continued
Shares in associates and joint ventures acquired during the prior year continued
EffectiveDate acquired percentage
Forensic Intelligence Data Solutions Proprietary Limited Associate 1 June 2013 25
Blue Label Mexico S.A. de C.V. Joint venture 1 January 2014 0.57
During the prior year Forensic Intelligence Data Solutions Proprietary Limited was acquired for a consideration of 25 cents.
In the prior year, there was a further capital contribution of R89.3 million to BLM. This resulted in a dilution of shares held by an outside shareholder increasing our shareholding to 45.57%.
Shares in associates disposed of during the current year
EffectiveDate disposed percentage
Smart Voucher Limited trading as Ukash Associate 1 April 2015 17.25
Ukash was disposed of in April 2015. The proceeds on this disposal was R112.4 million and the profit recorded in the statement of comprehensive income was R37.2 million including the foreign currency translation reserve that was recycled to profit or loss.
The proceeds of R112.4 million include a cash component of R94.9 million and a contingent receivable of R17.5 million. The contingent consideration arrangement requires the acquirer to pay in cash to the Group an additional amount of R18.1 million if certain warranties are achieved. The amounts are receivable in four six-month intervals commencing 30 September 2015.
The potential undiscounted amount of all future receipts that the Group could receive is between Rnil and R18.1 million (£nil and £1 million).
The fair value of the contingent consideration arrangement of R17.5 million was estimated by applying the income approach. The fair value estimates are based on a discount rate of 1.5% based on the United Kingdom prime lending rate. For all four warranties management has assumed a probability of 98% based on the historical knowledge of the business and the warranties appearing achievable.
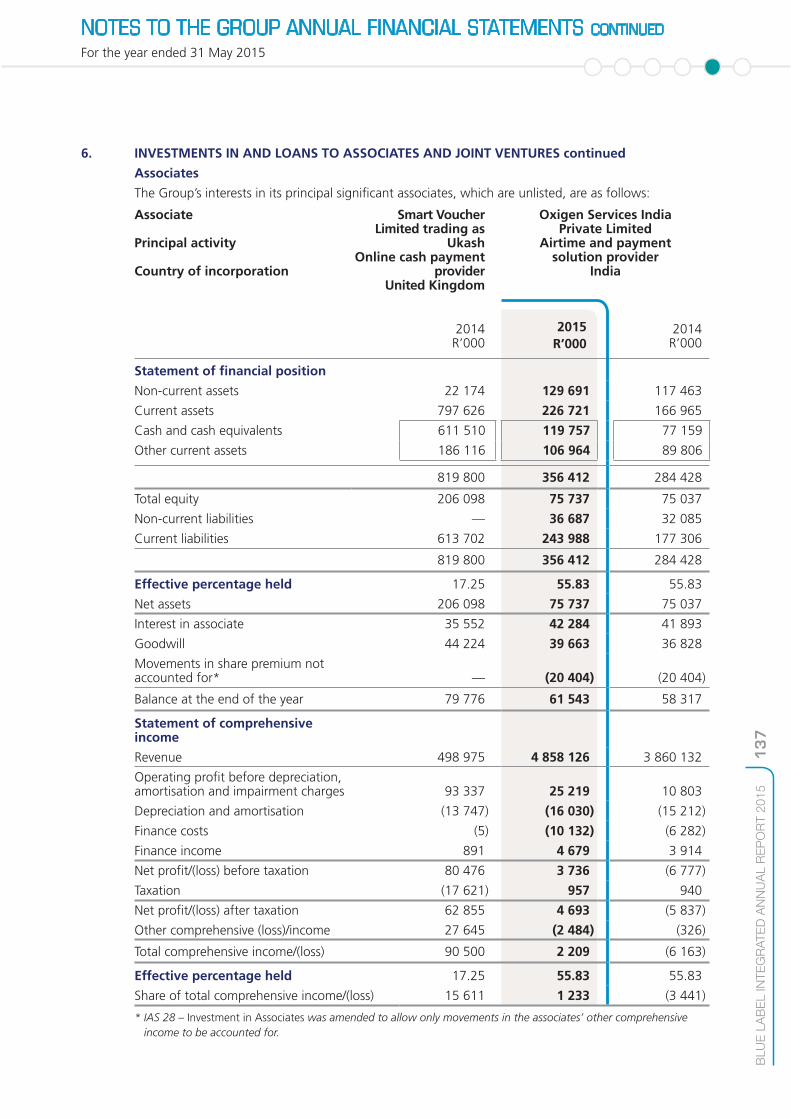
NOTES TO THE GROUP ANNUAL FINANCIAL STATEMENTS CONTINUED
For the year ended 31 May 2015
137
BLU
E L
AB
EL IN
TE
GR
AT
ED
AN
NU
AL R
EP
OR
T 2
01
5
6. INVESTMENTS IN AND LOANS TO ASSOCIATES AND JOINT VENTURES continued
Associates
The Group’s interests in its principal significant associates, which are unlisted, are as follows:
Associate
Principal activity
Country of incorporation
Smart Voucher Limited trading as
Ukash Online cash payment
provider United Kingdom
Oxigen Services India Private Limited
Airtime and payment solution provider
India
2014 R’000
2014 R’000
Statement of financial position
Non-current assets 22 174 129 691 117 463
Current assets 797 626 226 721 166 965
Cash and cash equivalents 611 510 119 757 77 159
Other current assets 186 116 106 964 89 806
819 800 356 412 284 428
Total equity 206 098 75 737 75 037
Non-current liabilities — 36 687 32 085
Current liabilities 613 702 243 988 177 306
819 800 356 412 284 428
Effective percentage held 17.25 55.83 55.83
Net assets 206 098 75 737 75 037
Interest in associate 35 552 42 284 41 893
Goodwill 44 224 39 663 36 828
Movements in share premium not accounted for* — (20 404) (20 404)
Balance at the end of the year 79 776 61 543 58 317
Statement of comprehensive income
Revenue 498 975 4 858 126 3 860 132
Operating profit before depreciation, amortisation and impairment charges 93 337 25 219 10 803
Depreciation and amortisation (13 747) (16 030) (15 212)
Finance costs (5) (10 132) (6 282)
Finance income 891 4 679 3 914
Net profit/(loss) before taxation 80 476 3 736 (6 777)
Taxation (17 621) 957 940
Net profit/(loss) after taxation 62 855 4 693 (5 837)
Other comprehensive (loss)/income 27 645 (2 484) (326)
Total comprehensive income/(loss) 90 500 2 209 (6 163)
Effective percentage held 17.25 55.83 55.83
Share of total comprehensive income/(loss) 15 611 1 233 (3 441)
* IAS 28 – Investment in Associates was amended to allow only movements in the associates’ other comprehensive income to be accounted for.
2015R’000

NOTES TO THE GROUP ANNUAL FINANCIAL STATEMENTS CONTINUED
For the year ended 31 May 2015
138
BLU
E L
AB
EL IN
TE
GR
AT
ED
AN
NU
AL R
EP
OR
T 2
01
5
6. INVESTMENTS IN AND LOANS TO ASSOCIATES AND JOINT VENTURES continued
Associates continued
The Group’s interest in its other associates, which are unlisted, are as follows:
AssociatesCountry of
incorporation
Non-currentassetsR’000
CurrentassetsR’000
2015
Lornanox Proprietary Limited South Africa — 6 000
Mpower Softcomm Private Limited India 17 700 7 288
Forensic Intelligence Data Solutions Proprietary Limited South Africa 1 328 3 063
2014
Forensic Intelligence Data Solutions Proprietary Limited South Africa 1 932 1 911
There are no contingent liabilities relating to the Group’s interest in associates.
For details on related party transactions, refer to note 29.
Country ofincorporation
Non-currentassetsR’000
CurrentassetsR’000

NOTES TO THE GROUP ANNUAL FINANCIAL STATEMENTS CONTINUED
For the year ended 31 May 2015
139
BLU
E L
AB
EL IN
TE
GR
AT
ED
AN
NU
AL R
EP
OR
T 2
01
5
Non-current
liabilitiesR’000
Currentliabilities
R’000Revenues
R’000Profit/(loss)
R’000
Totalcompre-hensive
profit/(loss)R’000
Effectivepercentage
interestheld
R’000
Net bookvalueR’000
— 6 000 — — — 40 6 000
282 12 801 23 262 1 323 2 227 21.6 1 711
— 2 011 2 641 11 908 11 908 20.25 —
— 13 372 3 260 (9 529) (9 529) 20.25 —
Non-current
liabilitiesR’000
Currentliabilities
R’000Revenues
R’000Profit/(loss)
R’000
Totalcompre-hensive
profit/(loss)R’000
Effectivepercentage
interestheld
%
Carrying value of
investmentR’000

NOTES TO THE GROUP ANNUAL FINANCIAL STATEMENTS CONTINUED
For the year ended 31 May 2015
140
BLU
E L
AB
EL IN
TE
GR
AT
ED
AN
NU
AL R
EP
OR
T 2
01
5
6. INVESTMENTS IN AND LOANS TO ASSOCIATES AND JOINT VENTURES continued
Set out below is the summarised financial information of the Group’s significant joint ventures
Joint venture Blue Label Mexico S.A. de C.V.
2DFine Holdings Mauritius
Supa Pesa Africa
(Mauritius) Limited
Principal activity Distributor of terminals to vend e-tokens of value
Investment holding company
Content provider
Country of incorporation Mexico Mauritius Mauritius
2014R’000
2014R’000
Statement of financial position
Non-current assets 214 368 268 512 118 463 102 171 8 207
Current assets 150 609 160 525 45 1 6 906
Cash and cash equivalents 46 320 79 353 1 1 —
Other current assets 104 289 81 172 44 — 6 906
364 977 429 037 118 508 102 172 15 113
Total equity 261 721 359 853 (47 611) (26 965) 5 380
Non-current liabilities 8 482 10 407 — — 8 207
Current liabilities 94 773 58 777 166 120 129 137 1 526
Trade and other payables 93 564 58 487 191 456 1 154
Other current liabilities 1 209 290 165 929 128 681 372
103 255 429 037 166 120 102 172 9 733
Effective percentage held 46.64 45.57 50 50 50
Net assets 261 721 359 853 (47 611) (26 965) 5 380
Share capital and share premium (737 792) 637 728 * * *
(476 071) (277 875) (47 611) (26 965) 5 380
Interest in joint venture (222 040) (126 628) (23 806) (13 483) 2 690
Goodwill 185 434 190 994 — — 31 215
Capital funding 304 175 254 142 — — —
Balance at the end of the year 267 569 318 508 (23 806) (13 483) 33 905
* Less than R1 000.
2015R’000
2015R’000
2015R’000

NOTES TO THE GROUP ANNUAL FINANCIAL STATEMENTS CONTINUED
For the year ended 31 May 2015
141
BLU
E L
AB
EL IN
TE
GR
AT
ED
AN
NU
AL R
EP
OR
T 2
01
5
6. INVESTMENTS IN AND LOANS TO ASSOCIATES AND JOINT VENTURES continued
Joint venture Blue Label Mexico S.A. de C.V.
2DFine Holdings Mauritius
Supa Pesa Africa
(Mauritius) Limited
Principal activity Distributor of terminals to vend e-tokens of value
Investment holding company
Content provider
Country of incorporation Mexico Mauritius Mauritius
2014R’000
2014R’000
Statement of comprehensive income
Revenue 3 526 421 2 865 340 — — 8 110
Operating loss before depreciation, amortisation and impairment charges (124 452) (78 915) (907) (685) 5 900
Depreciation, amortisation and impairment (68 275) (50 386) — — —
Finance costs — (5 955) (14 240) (11 786) (420)
Finance income 1 719 1 194 — — —
Net (loss)/profit before taxation (191 008) (134 062) (15 147) (12 471) 5 480
Taxation (2 671) (430) — — (164)
Net (loss)/profit after taxation (193 679) (134 492) (15 147) (12 471) 5 316
Other comprehensive (loss)/income (14 765) 15 265 (5 499) (959) 64
Total comprehensive (loss)/income (208 444) (119 227) (20 646) (13 430) 5 380
Effective percentage held 46.64 45.57 50 50 50
Share of total comprehensive income (92 749)# (53 942)# (10 323) (6 715) 2 690
# During the year BLT increased its holding by 1.07% to 46.64% in BLM. In the prior year BLT increased its shareholding by 0.57% to 45.57% in BLM.
Blue Label Telecoms Limited has guaranteed 45% of the amount owed by BLM to Radiomovil Dipsa S.A. de C.V. (trading as Telcel). At year-end there is no balance due to them by BLM.
There are no other contingent liabilities relating to the Group’s interest in joint ventures.
For details on related party transactions, refer to note 29.
2015R’000
2015R’000
2015R’000

NOTES TO THE GROUP ANNUAL FINANCIAL STATEMENTS CONTINUED
For the year ended 31 May 2015
142
BLU
E L
AB
EL IN
TE
GR
AT
ED
AN
NU
AL R
EP
OR
T 2
01
5
6. INVESTMENTS IN AND LOANS TO ASSOCIATES AND JOINT VENTURES continued
The Group’s interests in its other joint ventures, which are unlisted, are as follows:
Countryof
incorporation
Non-currentassetsR’000
CurrentassetsR’000
2015
Supa Pesa South Africa Proprietary Limited South Africa 142 1 186
Datacision Proprietary Limited South Africa * 14 513
2014
Datacision Proprietary Limited South Africa 455 11 350
* Less than R1 000.
Country ofincorporation
Non-currentassetsR’000
CurrentassetsR’000

NOTES TO THE GROUP ANNUAL FINANCIAL STATEMENTS CONTINUED
For the year ended 31 May 2015
143
BLU
E L
AB
EL IN
TE
GR
AT
ED
AN
NU
AL R
EP
OR
T 2
01
5
Non-current
liabilitiesR’000
Currentliabilities
R’000Revenues
R’000ProfitR’000
Totalcompre-hensive
lossR’000
Effectivepercentage
interestheld
R’000
Net bookvalueR’000
8 429 378 2 180 * * 37.5 8 000
2 4 199 22 454 3 174 3 174 40.5 464
— 4 667 22 961 3 516 3 516 40.5 1 494
Non-current
liabilitiesR’000
Currentliabilities
R’000Revenues
R’000ProfitR’000
Totalcompre-hensive
profit/(loss)R’000
Effectivepercentage
interestheld
%
Carrying value of
investmentR’000

NOTES TO THE GROUP ANNUAL FINANCIAL STATEMENTS CONTINUED
For the year ended 31 May 2015
144
BLU
E L
AB
EL IN
TE
GR
AT
ED
AN
NU
AL R
EP
OR
T 2
01
5
2014 R’000
7. LOANS RECEIVABLE
Interest-free loans 41 041 25 710
Interest-bearing loans receivable 33 261 20 641
74 302 46 351
Less: Amounts included in current portion of loans receivable (44 569) (27 850)
29 733 18 501
All loans receivable are unsecured. Interest-bearing loans bear interest at a range of between prime and prime plus 2%. Interest-free loans amounting to R32.1 million and interest-bearing loans amounting to R1.3 million are repayable within five years.
The loans receivable are neither past due nor impaired with a low risk of default. Of this amount, R19 million (2014: R24 million) relates to loans receivable from related parties, which are interest free. Refer to note 29.
8. STARTER PACK ASSETS
Balance at the beginning of the year 3 317 3 688
Additions 5 951 1 513
Impairments* (1 419) (1 520)
Disposals* (1 462) (364)
At the end of the year 6 387 3 317
Less: Amounts included in current portion of starter pack assets (1 938) (1 010)
4 449 2 307
* These impairments and disposals are charged to the statement of comprehensive income and are included in changes in inventories of finished goods. The impairments represent the value of starter packs that management considers the probability of activation to be low. The disposals represent starter packs that have been activated during the year.
2015R’000
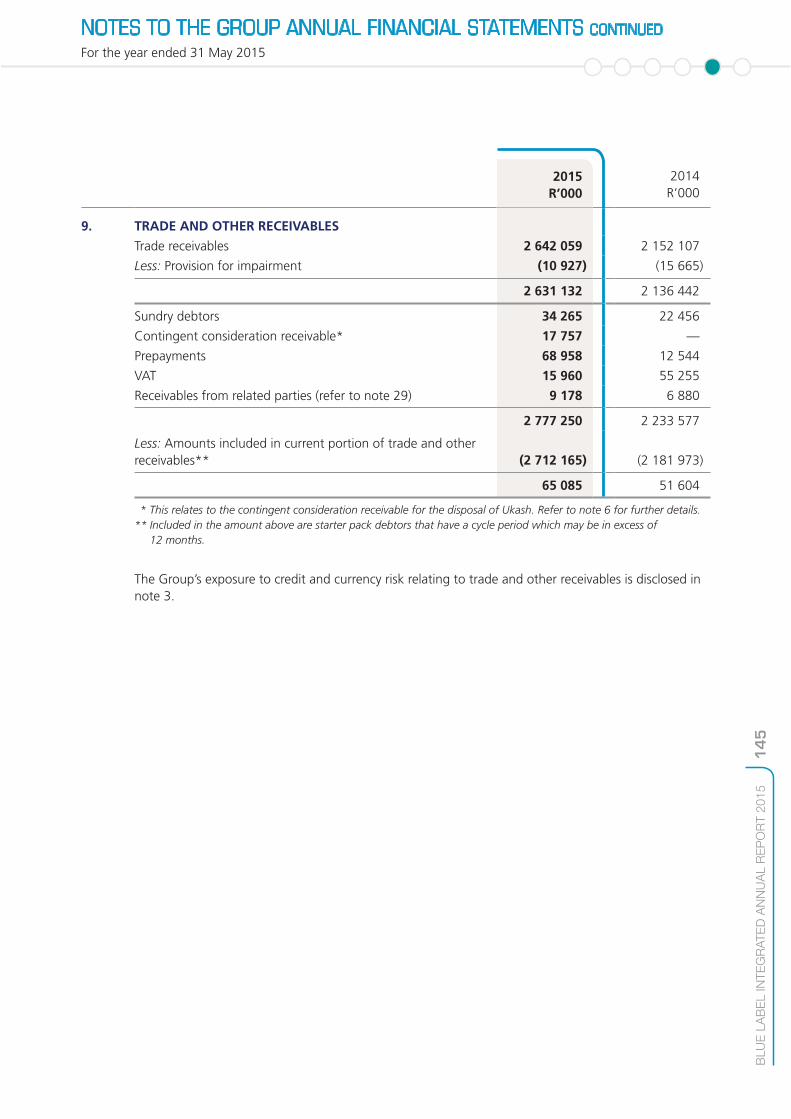
For the year ended 31 May 2015
145
BLU
E L
AB
EL IN
TE
GR
AT
ED
AN
NU
AL R
EP
OR
T 2
01
5
NOTES TO THE GROUP ANNUAL FINANCIAL STATEMENTS CONTINUED
2014R’000
9. TRADE AND OTHER RECEIVABLES
Trade receivables 2 642 059 2 152 107
Less: Provision for impairment (10 927) (15 665)
2 631 132 2 136 442
Sundry debtors 34 265 22 456
Contingent consideration receivable* 17 757 —
Prepayments 68 958 12 544
VAT 15 960 55 255
Receivables from related parties (refer to note 29) 9 178 6 880
2 777 250 2 233 577
Less: Amounts included in current portion of trade and other receivables** (2 712 165) (2 181 973)
65 085 51 604
* This relates to the contingent consideration receivable for the disposal of Ukash. Refer to note 6 for further details. ** Included in the amount above are starter pack debtors that have a cycle period which may be in excess of
12 months.
The Group’s exposure to credit and currency risk relating to trade and other receivables is disclosed in note 3.
2015R’000

NOTES TO THE GROUP ANNUAL FINANCIAL STATEMENTS CONTINUED
For the year ended 31 May 2015
146
BLU
E L
AB
EL IN
TE
GR
AT
ED
AN
NU
AL R
EP
OR
T 2
01
5
9. TRADE AND OTHER RECEIVABLES continued
31 May 2015
Fully performing 2 515 633 — 2 515 633
Past due by one to 30 days 50 545 111 50 434
Past due by 31 to 60 days 28 742 98 28 644
Past due by 61 to 90 days 26 154 310 25 844
Past due by more than 90 days 38 390 9 408 28 982
2 659 464 9 927 2 649 537
Portfolio impairment 1 000 (1 000)
2 659 464 10 927 2 648 537
31 May 2014
Fully performing 2 127 087 — 2 127 087
Past due by one to 30 days 18 045 166 17 879
Past due by 31 to 60 days 4 349 601 3 748
Past due by 61 to 90 days 3 010 406 2 604
Past due by more than 90 days 13 961 8 030 5 931
2 166 452 9 203 2 157 249
Portfolio impairment 6 462 (6 462)
2 166 452 15 665 2 150 787
Receivables in respect of starter pack debtors are included in fully performing debtors above.
Trade receivables are discounted at a discount rate of 9.25% per annum (2014: 9% per annum) based on average debtors’ days outstanding. The effect of discounting of the trade receivables balance which amounts to R8.227 million (2014: R7.465 million) is not taken into account in the above table.
The trade receivables that are neither past due nor impaired relate to independent customers for whom there is no recent history of default.
Sundry debtors are considered to be fully performing.
GrossR’000
ImpairmentR’000
NetR’000

NOTES TO THE GROUP ANNUAL FINANCIAL STATEMENTS CONTINUED
For the year ended 31 May 2015
147
BLU
E L
AB
EL IN
TE
GR
AT
ED
AN
NU
AL R
EP
OR
T 2
01
5
2014R’000
9. TRADE AND OTHER RECEIVABLES continued
Provision for impairment of receivables
Balance at the beginning of the year 15 665 7 639
Allowances made during the year 6 994 5 097
Acquisition/(disposal) of subsidiaries — 6 462
Amounts utilised and reversal of unutilised amounts (11 732) (3 533)
At 31 May 10 927 15 665
Impairment of receivables is determined after assessing the nature of the customer, their geographic location and specific circumstances.
The Group believes that the above provision for impairment of receivables sufficiently covers the risk of default.
There is a cession of trade receivables of R2.485 billion (2014: R2.011 billion) in favour of Investec Bank Limited as security for facilities referred to in note 3.
2015R’000

NOTES TO THE GROUP ANNUAL FINANCIAL STATEMENTS CONTINUED
For the year ended 31 May 2015
148
BLU
E L
AB
EL IN
TE
GR
AT
ED
AN
NU
AL R
EP
OR
T 2
01
5
Capitalallowances
R’000
FairvaluegainsR’000
10. DEFERRED TAXATION
At 31 May 2013 (85) 13 308
Charged/(credited) to statement of comprehensive income 511 (3 907)
Acquisition of subsidiary — 28 329
At 31 May 2014 426 37 730
Charged/(credited) to statement of comprehensive income (104) (6 950)
Disposal of subsidiary — —
Acquisition of subsidiary — 17 205
At 31 May 2015 322 47 985

NOTES TO THE GROUP ANNUAL FINANCIAL STATEMENTS CONTINUED
For the year ended 31 May 2015
149
BLU
E L
AB
EL IN
TE
GR
AT
ED
AN
NU
AL R
EP
OR
T 2
01
5
ProvisionsR’000
TaxlossesR’000
PrepaymentsR’000
Unrealisedforeign
exchangedifferences
R’000OtherR’000
TotalR’000
(17 066) (10 947) 1 802 6 056 342 (6 590)
8 394 (9 110) 528 1 479 (449) (2 554)
(2 327) — — — — 26 002
(10 999) (20 057) 2 330 7 535 (107) 16 858
(8 084) (1 275) 395 6 875 (1 128) (10 271)
51 159 (371) — 161 —
(139) — — — — 17 066
(19 171) (21 173) 2 354 14 410 (1 074) 23 653

NOTES TO THE GROUP ANNUAL FINANCIAL STATEMENTS CONTINUED
For the year ended 31 May 2015
150
BLU
E L
AB
EL IN
TE
GR
AT
ED
AN
NU
AL R
EP
OR
T 2
01
5
2014R’000
10. DEFERRED TAXATION continued
Deferred tax asset comprises:
Capital allowances (121) (344)
Provisions (19 681) (10 999)
Tax losses (21 173) (20 057)
Other (1 967) (2 525)
Total deferred tax asset (42 942) (33 925)
Deferred tax liability comprises:
Capital allowances 443 770
Fair value gains 47 985 37 730
Provisions 510 —
Prepayments 2 354 2 330
Unrealised foreign exchange differences 14 410 7 535
Other 893 2 418
Total deferred tax liability 66 595 50 783
Net deferred tax 23 653 16 858
The analysis of deferred tax assets and deferred tax liabilities is as follows:
Deferred tax assets
Deferred tax assets to be recovered after more than 12 months (561) 96
Deferred tax assets to be recovered within 12 months (30 237) (24 748)
Net deferred tax asset (30 798) (24 652)
Deferred tax liabilities
Deferred tax liabilities to be recovered after more than 12 months 42 306 28 758
Deferred tax liabilities to be recovered within 12 months 12 145 12 752
Net deferred tax liability 54 451 41 510
Net deferred tax 23 653 16 858
Where deferred tax assets have been recognised in respect of entities which have incurred losses in the current or prior years, a formal process of assessment of the future profitability of the entity has been performed based on detailed budgets and cash flow forecasts. As a result, management believes that the current tax losses will be utilised within one to five years.
Deferred tax assets are recognised for tax losses carried forward to the extent that the realisation of the related tax benefit through future taxable profits is probable. The Group did not recognise deferred income tax assets of R42.6 million (2014: R37.1 million) in respect of losses amounting to R152.3 million (2014: R132.6 million) that can be carried forward against future taxable income.
There is no withholding tax that would be payable on any dividends received from the Group’s associates and joint ventures and therefore no deferred tax has been raised in this regard.
2015R’000
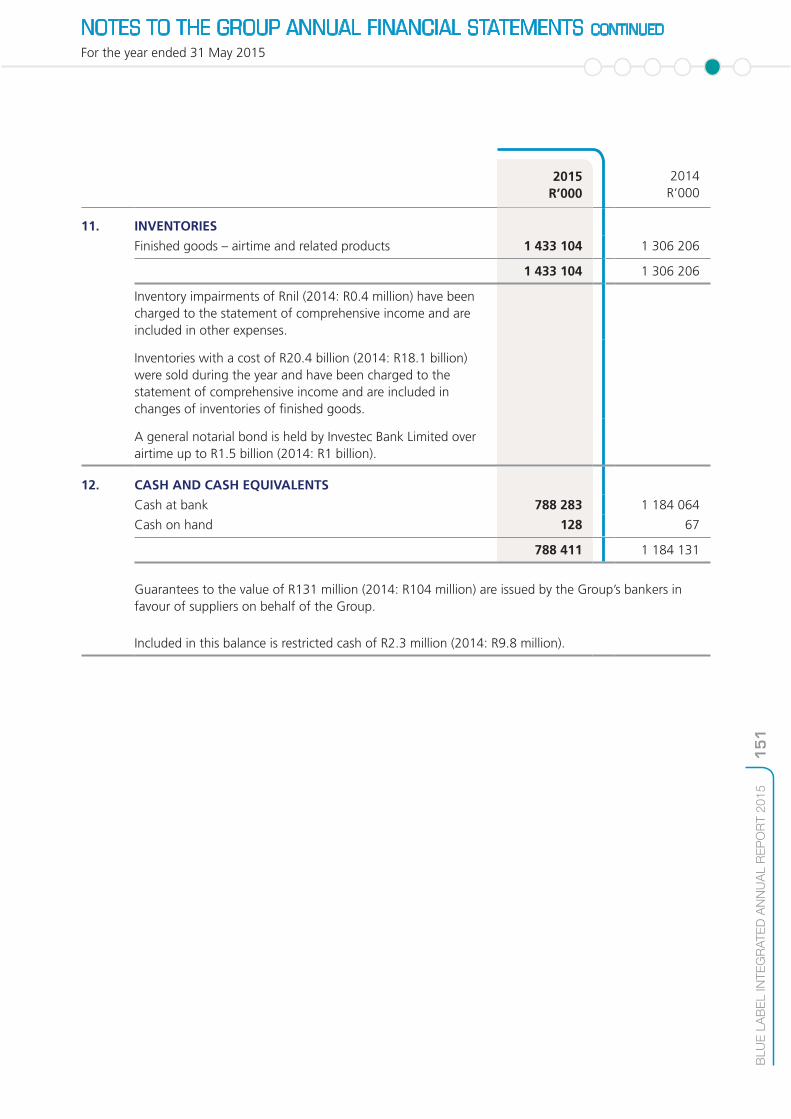
NOTES TO THE GROUP ANNUAL FINANCIAL STATEMENTS CONTINUED
For the year ended 31 May 2015
151
BLU
E L
AB
EL IN
TE
GR
AT
ED
AN
NU
AL R
EP
OR
T 2
01
5
2014 R’000
11. INVENTORIES
Finished goods – airtime and related products 1 433 104 1 306 206
1 433 104 1 306 206
Inventory impairments of Rnil (2014: R0.4 million) have been charged to the statement of comprehensive income and are included in other expenses.
Inventories with a cost of R20.4 billion (2014: R18.1 billion) were sold during the year and have been charged to the statement of comprehensive income and are included in changes of inventories of finished goods.
A general notarial bond is held by Investec Bank Limited over airtime up to R1.5 billion (2014: R1 billion).
12. CASH AND CASH EQUIVALENTS
Cash at bank 788 283 1 184 064
Cash on hand 128 67
788 411 1 184 131
Guarantees to the value of R131 million (2014: R104 million) are issued by the Group’s bankers in favour of suppliers on behalf of the Group.
Included in this balance is restricted cash of R2.3 million (2014: R9.8 million).
2015R’000
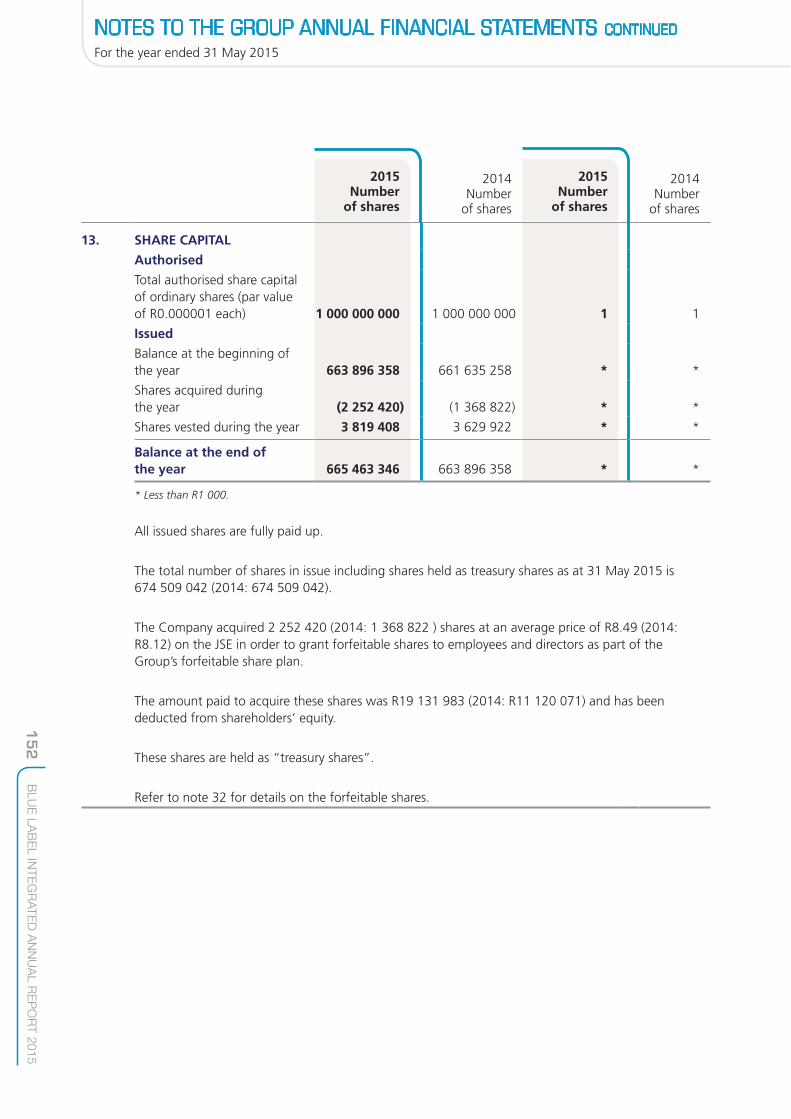
NOTES TO THE GROUP ANNUAL FINANCIAL STATEMENTS CONTINUED
For the year ended 31 May 2015
152
BLU
E L
AB
EL IN
TE
GR
AT
ED
AN
NU
AL R
EP
OR
T 2
01
5
2014Number
of shares
2014Number
of shares
13. SHARE CAPITAL
Authorised
Total authorised share capital of ordinary shares (par value of R0.000001 each) 1 000 000 000 1 000 000 000 1 1
Issued
Balance at the beginning of the year 663 896 358 661 635 258 * *
Shares acquired during the year (2 252 420) (1 368 822) * *
Shares vested during the year 3 819 408 3 629 922 * *
Balance at the end of the year 665 463 346 663 896 358 * *
* Less than R1 000.
All issued shares are fully paid up.
The total number of shares in issue including shares held as treasury shares as at 31 May 2015 is 674 509 042 (2014: 674 509 042).
The Company acquired 2 252 420 (2014: 1 368 822 ) shares at an average price of R8.49 (2014: R8.12) on the JSE in order to grant forfeitable shares to employees and directors as part of the Group’s forfeitable share plan.
The amount paid to acquire these shares was R19 131 983 (2014: R11 120 071) and has been deducted from shareholders’ equity.
These shares are held as “treasury shares”.
Refer to note 32 for details on the forfeitable shares.
2015Number
of shares
2015Number
of shares

NOTES TO THE GROUP ANNUAL FINANCIAL STATEMENTS CONTINUED
For the year ended 31 May 2015
153
BLU
E L
AB
EL IN
TE
GR
AT
ED
AN
NU
AL R
EP
OR
T 2
01
5
2014 R’000
14. TRADE AND OTHER PAYABLES
Trade payables 2 671 779 2 702 789
Accruals 70 103 69 103
Employee benefits 61 740 32 269
Sundry creditors 20 974 14 299
Deferred revenue 1 221 16 343
Contingent consideration (refer to note 3) 123 902 22 607
VAT 16 675 5 850
Payables to related parties (refer to note 29) 7 828 5 816
2 974 222 2 869 076
Less: Amounts included in current portion of trade and other payables (2 831 000) (2 818 898)
143 222 50 178
Trade payables are discounted at a discount rate of 9.25% per annum (2014: 9% per annum) based on average creditors’ days outstanding. The effect of discounting of the trade receivables balance amounts to R18.513 million (2014: R22.172 million).
2015R’000

NOTES TO THE GROUP ANNUAL FINANCIAL STATEMENTS CONTINUED
For the year ended 31 May 2015
154
BLU
E L
AB
EL IN
TE
GR
AT
ED
AN
NU
AL R
EP
OR
T 2
01
5
2014 R’000
15. PROVISIONS
Unredeemed electricity provision
Opening balance 17 504 19 029
Additions 687 421 617 853
Used during the year (686 051) (619 378)
18 874 17 504
Less: Amounts included in current portion of provisions (18 874) (17 504)
— —
The unredeemed electricity provision raised represents the value of electricity vouchers sold and unredeemed as at year-end, payable by the Group to the municipalities on redemption by the end customer.
Redemption is dependent on activation by customers. This is expected to occur within the first quarter of the following financial year.
Onerous contracts
Opening balance 6 985 —
Acquisition of subsidiary — 7 406
Additions 3 621 —
Used during the year (6 647) (421)
Reversed (1 342) —
2 617 6 985
Less: Amounts included in current portion of provisions (2 617) (6 273)
— 712
The onerous contracts relate to line subscriptions for which the Group is contracted to incur unavoidable charges that are expected to exceed the related economic benefits to be received. A provision is raised due to the uncertainty associated with the amount of net outflow for each subscription.
The provision will be used over the period of each subscription which in no case exceeds 12 months.
2015R’000

NOTES TO THE GROUP ANNUAL FINANCIAL STATEMENTS CONTINUED
For the year ended 31 May 2015
155
BLU
E L
AB
EL IN
TE
GR
AT
ED
AN
NU
AL R
EP
OR
T 2
01
5
2014 R’000
16. BORROWINGS
Interest-bearing borrowings — 2 653
Non-interest-bearing borrowings 16 087 12 437
16 087 15 090
Less: Amounts included in current portion of borrowings (16 087) (15 090)
— —
The Group did not default on any loans or breach any terms of the underlying agreements during the period. Borrowings are unsecured and are repayable on demand. Interest-bearing borrowings in the prior year bore interest at prime plus 2%. Included in borrowings is R4.7 million owing to related parties, which is interest free (refer to note 29).
17. REVENUE
Prepaid airtime 20 203 059 18 187 650
Postpaid airtime 127 030 38 294
Prepaid and postpaid SIM cards 701 223 582 618
Services 442 600 276 018
Electricity commission 201 170 153 460
Handsets, tablets and other devices 178 886 83 570
Other revenue* 190 254 80 056
22 044 222 19 401 666
* Other revenue primarily comprises meter installations, data, device rentals and ticket sales.
18. EMPLOYEE COMPENSATION AND BENEFIT EXPENSE
Salaries and wages 329 447 286 212
Bonuses 53 038 34 563
Equity compensation benefit 24 290 11 069
Other 673 698
407 448 332 542
Average number of employees for the year was 1 271 (2014: 1 186).
2015R’000

NOTES TO THE GROUP ANNUAL FINANCIAL STATEMENTS CONTINUED
For the year ended 31 May 2015
156
BLU
E L
AB
EL IN
TE
GR
AT
ED
AN
NU
AL R
EP
OR
T 2
01
5
2014R’000
19. OPERATING PROFIT
The following items have been charged/(credited) in arriving at operating profit:
Acquisition-related costs 1 971 2 901
Advertising and promotional expenses 14 252 19 173
Amortisation of intangible assets** 121 819 95 004
Audit fees – services as auditors 14 188 14 367
Audit fees – other 491 1 578
Bank charges 6 478 7 670
Communication costs 7 394 5 143
Consulting fees 29 645 25 230
Courier and postage 3 962 4 103
Depreciation 40 813 36 976
Foreign exchange profit* (20 443) (16 458)
Impairment of loans 4 907 1 761
Impairment of trade receivables 14 463 4 164
Impairment of trade receivables – provision (4 738) 1 564
Impairment of intangible assets — 1 073
Impairment of property, plant and equipment — 129
Impairment of inventory — 411
Insurance 7 067 7 081
IT infrastructure costs and computer-related costs 21 117 22 756
Legal fees 14 701 25 311
Local travel 6 559 6 157
Profit on disposal of subsidiaries* (3 962) —
Profit on disposal of associates* (37 238) —
Management fees paid 5 624 5 324
Management fees received* (736) (879)
Motor vehicle expenses 9 484 9 500
Operating lease rentals – equipment 1 731 2 367
Operating lease rentals – premises 33 692 31 093
Overseas travel 5 536 3 194
Printing and stationery 1 547 1 826
Profit on disposal of property, plant and equipment* (1 707) (287)
Repairs and maintenance 5 759 11 273
* Included in other income on the Group statement of comprehensive income.** Included in the amortisation charge is an amount of R73.5 million (2014: R69.8 million) in respect of the purchased
starter pack bases and postpaid bases, which is charged to the changes in inventories of finished goods line in the statement of comprehensive income.
2015R’000

NOTES TO THE GROUP ANNUAL FINANCIAL STATEMENTS CONTINUED
For the year ended 31 May 2015
157
BLU
E L
AB
EL IN
TE
GR
AT
ED
AN
NU
AL R
EP
OR
T 2
01
5
2014R’000
20. FINANCE COSTS/(INCOME)
Finance costs
– Bank 54 71
– Loans 60 557 21 465
– Other 7 353 1 457
– Discounting of payables 165 201 143 883
233 165 166 876
Finance income
– Bank (13 458) (24 153)
– Loans (2 522) (1 449)
– Other (14 741) (13 205)
– Discounting of receivables (142 326) (117 443)
(173 047) (156 250)
Net finance costs 60 118 10 626
21. TAXATION
Current tax 275 768 208 996
Current year 276 297 209 055
Adjustment in respect of prior years (529) (59)
Deferred tax (10 271) (2 554)
Current year (9 845) (2 278)
Adjustment in respect of prior years (426) (276)
265 497 206 442
Profit before tax 846 690 655 357
Tax at 28% 237 073 183 500
Income not subject to tax (16 116) (8 852)
Expenses not deductible for tax purposes 6 681 7 053
Capital gains tax 8 698 (840)
Utilisation of previously unrecognised tax losses — (71)
Tax effect of assessed losses not recognised 7 901 9 695
Share of losses from associates and joint ventures 22 215 15 924
Adjustment in respect of prior years (955) (335)
Effect of different tax dispensations — 368
Tax charge 265 497 206 442
Effective tax rate 31% 32%
2015R’000
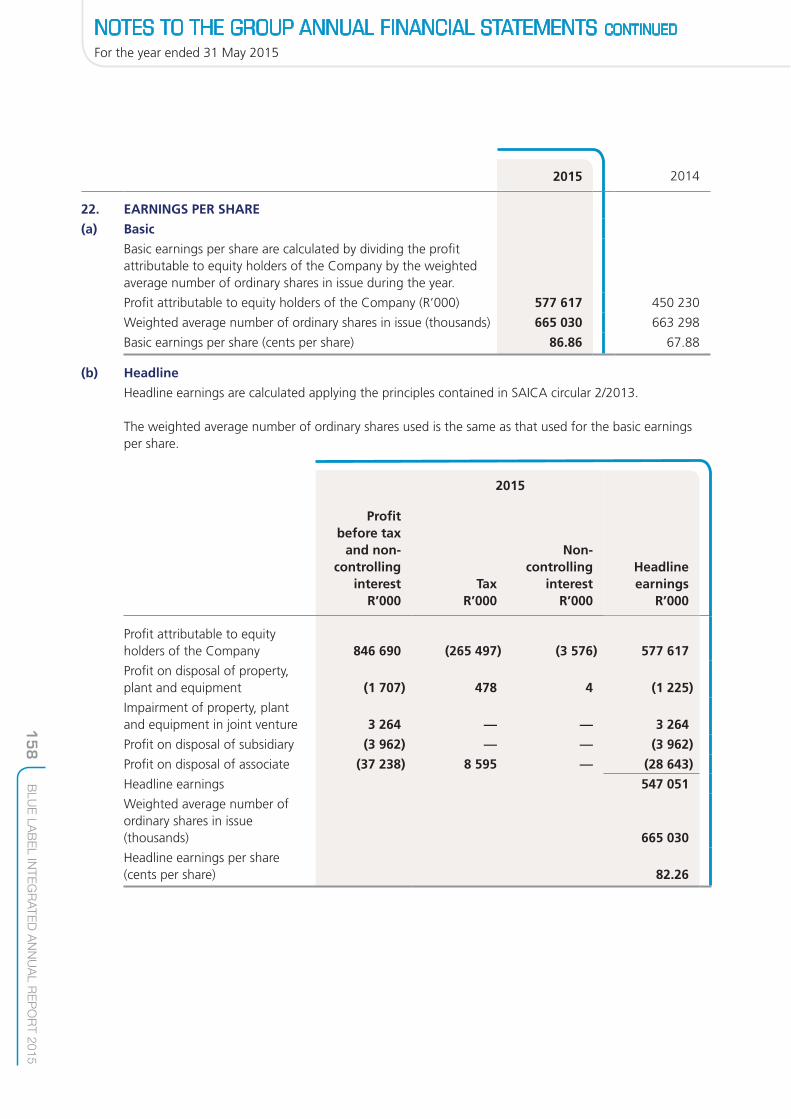
NOTES TO THE GROUP ANNUAL FINANCIAL STATEMENTS CONTINUED
For the year ended 31 May 2015
158
BLU
E L
AB
EL IN
TE
GR
AT
ED
AN
NU
AL R
EP
OR
T 2
01
5
2014
22. EARNINGS PER SHARE
(a) Basic
Basic earnings per share are calculated by dividing the profit attributable to equity holders of the Company by the weighted average number of ordinary shares in issue during the year.
Profit attributable to equity holders of the Company (R’000) 577 617 450 230
Weighted average number of ordinary shares in issue (thousands) 665 030 663 298
Basic earnings per share (cents per share) 86.86 67.88
(b) Headline
Headline earnings are calculated applying the principles contained in SAICA circular 2/2013.
The weighted average number of ordinary shares used is the same as that used for the basic earnings per share.
2015
Profitbefore tax
and non-controlling
interestR’000
TaxR’000
Non-controlling
interestR’000
Profit attributable to equity holders of the Company 846 690 (265 497) (3 576) 577 617
Profit on disposal of property, plant and equipment (1 707) 478 4 (1 225)
Impairment of property, plant and equipment in joint venture 3 264 — — 3 264
Profit on disposal of subsidiary (3 962) — — (3 962)
Profit on disposal of associate (37 238) 8 595 — (28 643)
Headline earnings 547 051
Weighted average number of ordinary shares in issue (thousands) 665 030
Headline earnings per share (cents per share) 82.26
2015
Headlineearnings
R’000

NOTES TO THE GROUP ANNUAL FINANCIAL STATEMENTS CONTINUED
For the year ended 31 May 2015
159
BLU
E L
AB
EL IN
TE
GR
AT
ED
AN
NU
AL R
EP
OR
T 2
01
5
22. EARNINGS PER SHARE continued
(b) Headline continued
2014
Profitbefore taxand non-
controllinginterest
R’000Tax
R’000
Non-controlling
interestR’000
Headlineearnings
R’000
Profit attributable to equity holders of the Company 655 357 (206 442) 1 315 450 230
Profit on disposal of property, plant and equipment (287) 80 — (207)
Impairment of property, plant and equipment 129 (36) — 93
Impairment of intangible assets 1 073 (300) — 773
Headline earnings 450 889
Weighted average number of ordinary shares in issue (thousands) 663 298
Headline earnings per share (cents per share) 67.98

NOTES TO THE GROUP ANNUAL FINANCIAL STATEMENTS CONTINUED
For the year ended 31 May 2015
160
BLU
E L
AB
EL IN
TE
GR
AT
ED
AN
NU
AL R
EP
OR
T 2
01
5
22. EARNINGS PER SHARE continued
(c) Diluted – basic and headline
Diluted earnings per share are calculated by adjusting the number of ordinary shares outstanding to assume conversion of all dilutive potential ordinary shares. The dilutive potential ordinary shares of the Company are the forfeitable shares granted. For this calculation, an adjustment is made for the number of shares that would be issued on vesting under the forfeitable share plan.
2014R’000
Basic earnings (R’000) 577 617 450 230
Dilutive instrument (R’000) (5 603) (695)
Diluted earnings (R’000) 572 014 449 535
Weighted average number of ordinary shares in issue (thousands) 665 030 663 298
Adjusted for forfeitable shares (thousands) 7 672 9 014
Weighted average number of ordinary shares for diluted earnings (thousands) 672 702 672 312
Diluted basic earnings per share (cents per share) 85.03 66.86
Headline earnings (R’000) 547 051 450 889
Dilutive instrument (R’000) (5 603) (695)
Diluted headline earnings (R’000) 541 448 450 194
Weighted average number of ordinary shares for diluted headline earnings (thousands) 672 702 672 312
Diluted headline earnings per share (cents) 80.49 66.96
(d) Core
Core earnings per share is calculated after adding back the amortisation of intangible assets as a consequence of the purchase price allocations completed in terms of IFRS 3(R) – Business Combinations.
Reconciliation between net profit for the period and core net profit for the period:
Net profit for the period (R’000) 577 617 450 230
Amortisation on intangibles raised through business combinations net of tax and non-controlling interest (R’000) 18 961 10 372
Core net profit for the period (R’000) 596 578 460 602
Weighted average number of ordinary shares in issue (thousands) 665 030 663 298
Core earnings per share (cents per share) 89.71 69.44
2015R’000

NOTES TO THE GROUP ANNUAL FINANCIAL STATEMENTS CONTINUED
For the year ended 31 May 2015
161
BLU
E L
AB
EL IN
TE
GR
AT
ED
AN
NU
AL R
EP
OR
T 2
01
5
2014R’000
23. CASH GENERATED BY OPERATIONS
Reconciliation of operating profit to cash generated by operating activities:
Operating profit 986 146 722 856
Adjustments for:
Depreciation of property, plant and equipment 40 813 36 976
Amortisation of intangible assets 121 819 95 004
Impairment of property, plant and equipment — 129
Impairment of intangible assets — 1 073
Discounting of receivables recognised in revenue 142 326 117 443
Discounting of payables recognised in changes in inventories of finished goods (165 201) (143 883)
Impairment of loans 4 907 1 761
Profit on disposal of property, plant and equipment (1 707) (287)
Profit on disposal of subsidiary (3 962) —
Profit on disposal of associates (37 238) —
Equity compensation benefit expense 24 290 11 069
Net unrealised forex profit (25 718) (16 458)
Changes in working capital (excluding the effects of acquisitions and disposals):
(Increase)/decrease in inventories (123 152) 552 305
Increase in trade and other receivables (538 269) (669 602)
Increase in trade and other payables 2 500 423 461
Decrease/(increase) in loans receivable 5 322 (3 209)
(Increase)/decrease in starter pack assets (3 070) 370
429 806 1 129 008
24. TAXATION PAID
Balance outstanding at the beginning of the year 25 323 36 071
Taxation charge 275 768 208 996
Acquisition of subsidiaries (19 403) 3 726
Translation differences (24) 68
Balance outstanding at the end of the year (36 169) (25 323)
245 495 223 538
2015R’000
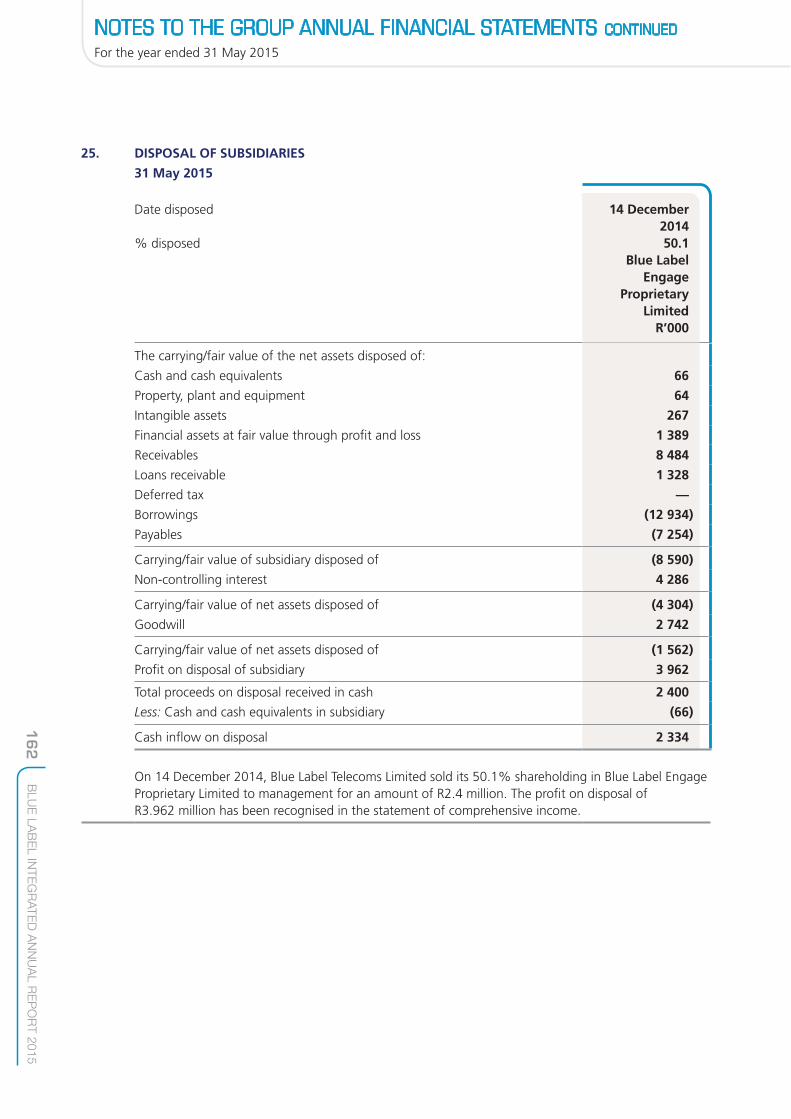
For the year ended 31 May 2015
162
BLU
E L
AB
EL IN
TE
GR
AT
ED
AN
NU
AL R
EP
OR
T 2
01
5
NOTES TO THE GROUP ANNUAL FINANCIAL STATEMENTS CONTINUED
25. DISPOSAL OF SUBSIDIARIES
31 May 2015
Date disposed
% disposed
14 December 201450.1
Blue Label Engage
Proprietary Limited
R’000
The carrying/fair value of the net assets disposed of:
Cash and cash equivalents 66
Property, plant and equipment 64
Intangible assets 267
Financial assets at fair value through profit and loss 1 389
Receivables 8 484
Loans receivable 1 328
Deferred tax —
Borrowings (12 934)
Payables (7 254)
Carrying/fair value of subsidiary disposed of (8 590)
Non-controlling interest 4 286
Carrying/fair value of net assets disposed of (4 304)
Goodwill 2 742
Carrying/fair value of net assets disposed of (1 562)
Profit on disposal of subsidiary 3 962
Total proceeds on disposal received in cash 2 400
Less: Cash and cash equivalents in subsidiary (66)
Cash inflow on disposal 2 334
On 14 December 2014, Blue Label Telecoms Limited sold its 50.1% shareholding in Blue Label Engage Proprietary Limited to management for an amount of R2.4 million. The profit on disposal of R3.962 million has been recognised in the statement of comprehensive income.

For the year ended 31 May 2015
163
BLU
E L
AB
EL IN
TE
GR
AT
ED
AN
NU
AL R
EP
OR
T 2
01
5
NOTES TO THE GROUP ANNUAL FINANCIAL STATEMENTS CONTINUED
26. BUSINESS COMBINATIONS
Acquisition of subsidiary
Date acquired
% acquired
At 31 May 2015 R’000Assets 103 383
Liabilities 53 917
Revenue since acquisition 153 754
Profit after tax since acquisition 34 826
Had the acquisition of subsidiary taken place at the beginning of the financial year, it would have contributed R191.2 million to revenue and R47.5 million to net profit after tax. The actual contribution to revenue and net profit after tax for the year was R153.8 million and R34.8 million respectively.
The fair value of the net assets approximated the assets acquired on acquisition date.
ViamediaProprietary
LimitedMobile
content and value-added
services provider1 September
201475

NOTES TO THE GROUP ANNUAL FINANCIAL STATEMENTS CONTINUED
For the year ended 31 May 2015
164
BLU
E L
AB
EL IN
TE
GR
AT
ED
AN
NU
AL R
EP
OR
T 2
01
5
26. BUSINESS COMBINATIONS continued
Acquisition of subsidiary continued
ViamediaProprietary
LimitedR’000
Bank overdraft (13 086)
Property, plant and equipment 1 579
Intangible assets** 62 762
Receivables 15 800
Inventories 619
Receiver of revenue receivable 19 403
Deferred tax** (17 066)
Payables (12 424)
Fair value of subsidiaries acquired 57 587
Non-controlling interests* (14 397)
Fair value of net assets acquired 43 190
Goodwill 185 967
Total purchase consideration 229 157
Contingent consideration (84 783)
Settled in cash 144 374
Plus: Bank overdraft of subsidiary 13 086
Cash flow on acquisition 157 460
* The non-controlling interest acquired is measured using the proportionate share of the recognised amounts of Viamedia’s identifiable net assets.
** Included in additions in note 5 is R61.4 million of Databases which relate to the purchase price allocations performed for Viamedia Proprietary Limited in terms of IFRS 3(R) – Business Combinations. Deferred tax to the value of R17.2 million was raised on recognition of this intangible asset.

NOTES TO THE GROUP ANNUAL FINANCIAL STATEMENTS CONTINUED
For the year ended 31 May 2015
165
BLU
E L
AB
EL IN
TE
GR
AT
ED
AN
NU
AL R
EP
OR
T 2
01
5
26. BUSINESS COMBINATIONS continued
Acquisition of subsidiary continued
Viamedia Proprietary Limited (Viamedia) was purchased with the objective of affording the Group access to new channels for the distribution of both Viamedia and Group products and services.
In most business acquisitions, there is a part of the cost that is not capable of being attributed in accounting terms to identifiable assets and liabilities acquired and is therefore recognised as goodwill. In the case of the acquisition of Viamedia, this goodwill is underpinned by a number of elements, which individually cannot be quantified. Most significant among these is the opportunity that the distribution network affords the Group.
The contingent consideration arrangement requires Blue Label Telecoms Limited to pay in cash the former owner of Viamedia, an additional amount of R215.6 million if certain profit warranties are achieved. The first three amounts of R24.1 million are based on the profits of Viamedia for the year ended 31 May 2015 and years ending 31 May 2016 and 31 May 2017. The fourth and fifth amounts of R30.9 million and R112.5 million are based on the profits of Viamedia for the three years ending 31 May 2017.
The potential undiscounted amount of all future payments that the Group could be required to make under this arrangement is between Rnil and R215.6 million.
The fair value of the contingent consideration arrangement of R84.8 million was estimated by applying the income approach. The fair value estimates are based on a discount rate of 9%. For the first, second, third and fourth profit targets management has assumed a probability of 100%. For the fifth profit target management has assumed a probability of 0%. In determining these probabilities management has assessed the cash flow projections based on financial budgets approved by the board of directors for the forthcoming three years which are based on assumptions of the business, industry and economic growth.

NOTES TO THE GROUP ANNUAL FINANCIAL STATEMENTS CONTINUED
For the year ended 31 May 2015
166
BLU
E L
AB
EL IN
TE
GR
AT
ED
AN
NU
AL R
EP
OR
T 2
01
5
27. NON-CONTROLLING INTERESTS
Set out below is the summarised financial information relating to each subsidiary that has non-controlling interests that are material to the Group. The amounts disclosed for each subsidiary are before inter-company eliminations with other companies in the Group.
SubsidiaryPrincipal place of businessSegment
Transaction junctionRSA
SA distribution
NCI %2015
40R’000
201440
R’000
Summarised balance sheet as at 31 May
Non-current assets 15 956 17 496
Current assets 22 744 25 421
Total assets 38 700 42 917
Capital and reserves 32 653 16 598
Non-current liabilities 791 1 263
Current liabilities 5 256 25 056
Total equity and liabilities 38 700 42 917
Accumulated NCI 13 061 6 639
Summarised statement of comprehensive income for the period ended 31 May
Revenue 54 040 41 524
Total comprehensive income/(loss) for the year 16 055 17 810
Comprehensive income/(loss) allocated to NCI 6 422 7 124
Summarised cash flows for the period ended 31 May
Cash flows from operating activities 17 299 15 501
Cash flows from investing activities (883) (2 160)
Cash flows from financing activities (21 817) (5 276)
Net (decrease)/increase in cash and cash equivalents (5 401) 8 065
Dividends paid to NCI — —
* The APS group consists of African Prepaid Services Proprietary Limited and African Prepaid Services Nigeria Limited. The NCI percentage is 10% and 30.09% respectively.
** Viamedia was acquired 1 September 2014. These results reflect the nine-month period ended May 2015.

NOTES TO THE GROUP ANNUAL FINANCIAL STATEMENTS CONTINUED
For the year ended 31 May 2015
167
BLU
E L
AB
EL IN
TE
GR
AT
ED
AN
NU
AL R
EP
OR
T 2
01
5
APS GroupRSA and Nigeria
International distribution
Blue Label DataSolutions
RSASolutions
ViamediaRSA
Mobile**
2015*
R’000
2014*
R’000
201519
R’000
201419
R’000
201525
R’000
2014 —
R’000
— — 6 973 3 166 105 307 —
38 720 36 825 30 038 57 220 —
38 720 43 798 33 204 162 527 —
(129 088) (109 108) 27 518 23 973 92 050 —
51 700 26 222 680 856 16 560 —
77 426 83 606 15 600 8 375 53 917 —
38 720 43 798 33 204 162 527 —
(29 187) (26 000) 5 228 4 555 23 013 —
— — 100 170 92 111 153 754 —
(19 980) (34 019) 22 198 21 385 33 167 —
(7 688) (12 125) 4 217 4 063 8 292 —
(19 539) (31 341) 26 398 13 509 33 929 —
— — (75) (603) (1 506) —
19 530 31 321 (19 446) (9 350) (5 755) —
(9) (20) 6 877 3 556 26 668 —
— — 3 544 1 805 — —

NOTES TO THE GROUP ANNUAL FINANCIAL STATEMENTS CONTINUED
For the year ended 31 May 2015
168
BLU
E L
AB
EL IN
TE
GR
AT
ED
AN
NU
AL R
EP
OR
T 2
01
5
28. TRANSACTIONS WITH NON-CONTROLLING INTERESTS
Disposal of interest in subsidiary without loss of control
In September 2009 Ventury Proprietary Limited sold 26% of its stake in Cigicell Proprietary Limited to Sangrilor Proprietary Limited. The Group previously did not recognise this disposal and accounted for Cigicell Proprietary Limited as a wholly owned subsidiary until the purchase consideration was settled by Sangrilor Proprietary Limited. The purchase consideration was settled through the declaration of dividends by Cigicell Proprietary Limited on 1 April 2015.
The effect of changes in the ownership interest of Cigicell Limited on the equity attributable to owners of the company during the year is summarised as follows:
R'000
Carrying amount of non-controlling interest acquired (7 132)
Consideration received from non-controlling interest —
Decrease in Group’s capital and reserves before non-controlling interest (7 132)
29. RELATED PARTY TRANSACTIONS
For details of subsidiaries, associates and joint ventures, refer to note 33. For details of the Company’s Directors, refer to the Directors’ report. ZOK Cellular Proprietary Limited, BSC Technologies Proprietary Limited, Black Ginger 59 Proprietary Limited, Dataforce Trading 240 Proprietary Limited, Moneyline 311 Proprietary Limited, PLL Investments Proprietary Limited, aloeCap Proprietary Limited, Unihold Group Proprietary Limited, Wildekrans Trust, Stylco Proprietary Limited, Wildekrans Wine Estate Proprietary Limited, Wireless Business Solutions Proprietary Limited, iBurst Proprietary Limited, Parkrun Southern Africa Proprietary Limited, Bordelo Properties Proprietary Limited, Blu’s Brothers Proprietary Limited, Liquid NFC Proprietary Limited, Stax Technologies Proprietary Limited, and Ellerine Bros. Proprietary Limited are related parties due to Directors’ shareholdings and the companies having certain common directorships.
For details of the shareholdings in the Company, refer to the Directors’ report.
For details of emoluments to Directors, who are regarded as key management, refer to note 30.
The following transactions were carried out with related parties and all relate to continued operations:
2015R’000
2014R’000
Sales to related parties
BSC Technologies Proprietary Limited — 443
Blue Label Mexico S.A. de C.V. 9 922 5 053
Datacision Proprietary Limited 206 112
iBurst Proprietary Limited 752 732
Mpower Softcomm Private Limited 4 —
Smart Voucher Limited trading as Ukash — 24
Stax Technologies Proprietary Limited 272 49
Stylco Proprietary Limited 636 2 907
ZOK Cellular Proprietary Limited 2 428 3 448
2015R’000

NOTES TO THE GROUP ANNUAL FINANCIAL STATEMENTS CONTINUED
For the year ended 31 May 2015
169
BLU
E L
AB
EL IN
TE
GR
AT
ED
AN
NU
AL R
EP
OR
T 2
01
5
2015R’000
2014R’000
29. RELATED PARTY TRANSACTIONS continued
Purchases from related parties
Black Ginger 59 Proprietary Limited 14 074 12 498
Blu’s Brothers Proprietary Limited — 245
BSC Technologies Proprietary Limited — 211
Datacision Proprietary Limited 293 —
Forensic Intelligence Data Solutions Proprietary Limited 2 —
Mpower Softcomm Private Limited 1 —
PLL Investments Proprietary Limited 27 —
Smart Voucher Limited trading as Ukash — 28
Stax Technologies Proprietary Limited 252 62
Stylco Proprietary Limited 7 939 3 935
Wildekrans Wine Estate Proprietary Limited 4 5
Wireless Business Solutions Proprietary Limited 6 292 16 593
ZOK Cellular Proprietary Limited 69 946 62 947
Interest received from related parties
2DFine Holdings Mauritius (refer to note 6) 14 269 11 795
Blue Label Mexico S.A. de C.V. (refer to note 6) — 1 017
Supa Pesa South Africa Proprietary Limited (refer to note 6) 217 —
Management fees received from related parties
Blue Label Mexico S.A. de C.V. — 250
Datacision Proprietary Limited 545 387
Forensic Intelligence Data Solutions Proprietary Limited 192 270
Rent paid to related parties
Ellerine Bros. Proprietary Limited 6 875 6 222
Dataforce Trading 240 Proprietary Limited 253 2 776
Moneyline 311 Proprietary Limited 6 875 6 222
PLL Investments Proprietary Limited 1 526 1 363
Wildekrans Trust 3 087 —
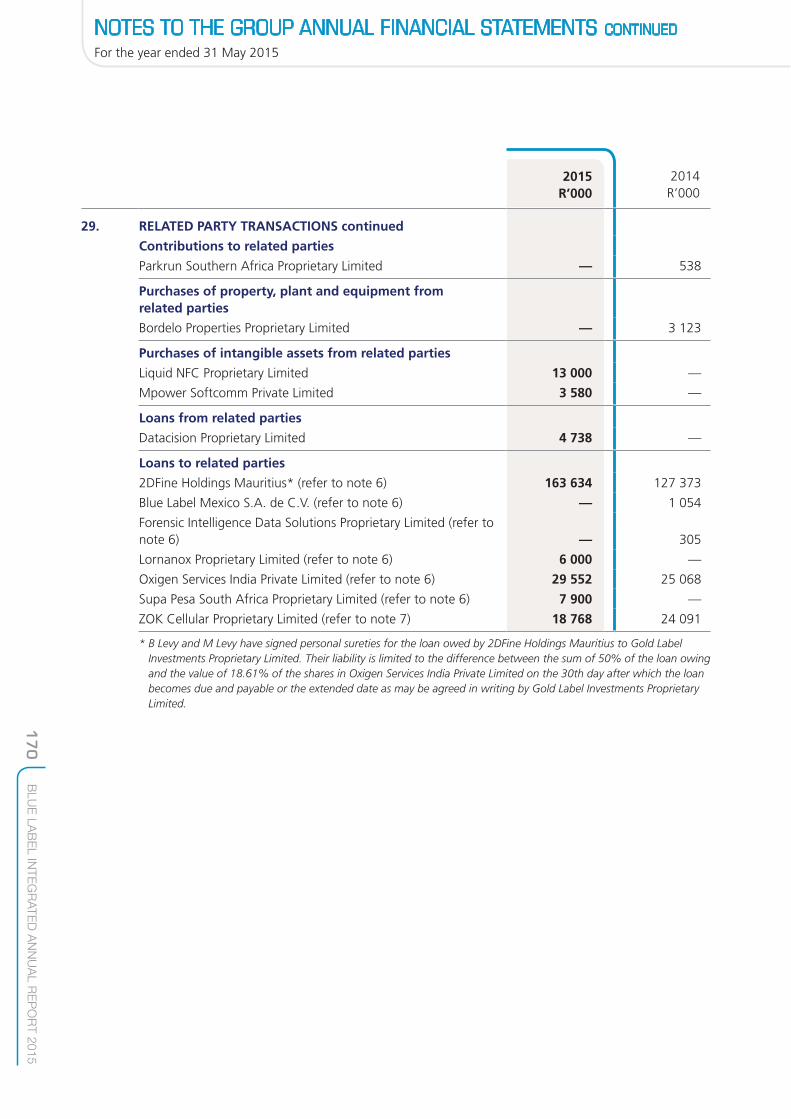
NOTES TO THE GROUP ANNUAL FINANCIAL STATEMENTS CONTINUED
For the year ended 31 May 2015
170
BLU
E L
AB
EL IN
TE
GR
AT
ED
AN
NU
AL R
EP
OR
T 2
01
5
2015R’000
2014R’000
29. RELATED PARTY TRANSACTIONS continued
Contributions to related parties
Parkrun Southern Africa Proprietary Limited — 538
Purchases of property, plant and equipment from related parties
Bordelo Properties Proprietary Limited — 3 123
Purchases of intangible assets from related parties
Liquid NFC Proprietary Limited 13 000 —
Mpower Softcomm Private Limited 3 580 —
Loans from related parties
Datacision Proprietary Limited 4 738 —
Loans to related parties
2DFine Holdings Mauritius* (refer to note 6) 163 634 127 373
Blue Label Mexico S.A. de C.V. (refer to note 6) — 1 054
Forensic Intelligence Data Solutions Proprietary Limited (refer to note 6) — 305
Lornanox Proprietary Limited (refer to note 6) 6 000 —
Oxigen Services India Private Limited (refer to note 6) 29 552 25 068
Supa Pesa South Africa Proprietary Limited (refer to note 6) 7 900 —
ZOK Cellular Proprietary Limited (refer to note 7) 18 768 24 091
* B Levy and M Levy have signed personal sureties for the loan owed by 2DFine Holdings Mauritius to Gold Label Investments Proprietary Limited. Their liability is limited to the difference between the sum of 50% of the loan owing and the value of 18.61% of the shares in Oxigen Services India Private Limited on the 30th day after which the loan becomes due and payable or the extended date as may be agreed in writing by Gold Label Investments Proprietary Limited.

NOTES TO THE GROUP ANNUAL FINANCIAL STATEMENTS CONTINUED
For the year ended 31 May 2015
171
BLU
E L
AB
EL IN
TE
GR
AT
ED
AN
NU
AL R
EP
OR
T 2
01
5
2015R’000
2014R’000
29. RELATED PARTY TRANSACTIONS continued
Amounts due from related parties included in trade receivables
Black Ginger 59 Proprietary Limited 3 987 1 456
Blue Label Mexico S.A. de C.V. 1 943 5 314
Datacision Proprietary Limited 3 165 46
iBurst Proprietary Limited 57 62
Stax Technologies Proprietary Limited 24 —
ZOK Cellular Proprietary Limited 2 2
9 178 6 880
Amounts due to related parties included in trade payables
aloeCap Proprietary Limited — 44
Black Ginger 59 Proprietary Limited 4 517 131
Datacision Proprietary Limited 98 1 149
KM Ellerine — 84
LM Nestadt — 211
Moneyline 311 Proprietary Limited 2 110 —
Mpower Softcomm Private Limited 901 —
NN Lazarus — 133
PLL Investments Proprietary Limited 141 2
Smart Voucher Limited trading as Ukash — 360
Stylco Proprietary Limited 3 —
Unihold Group Proprietary Limited — 195
JS Vilakazi — 71
Wireless Business Solutions Proprietary Limited 58 3 436
7 828 5 816
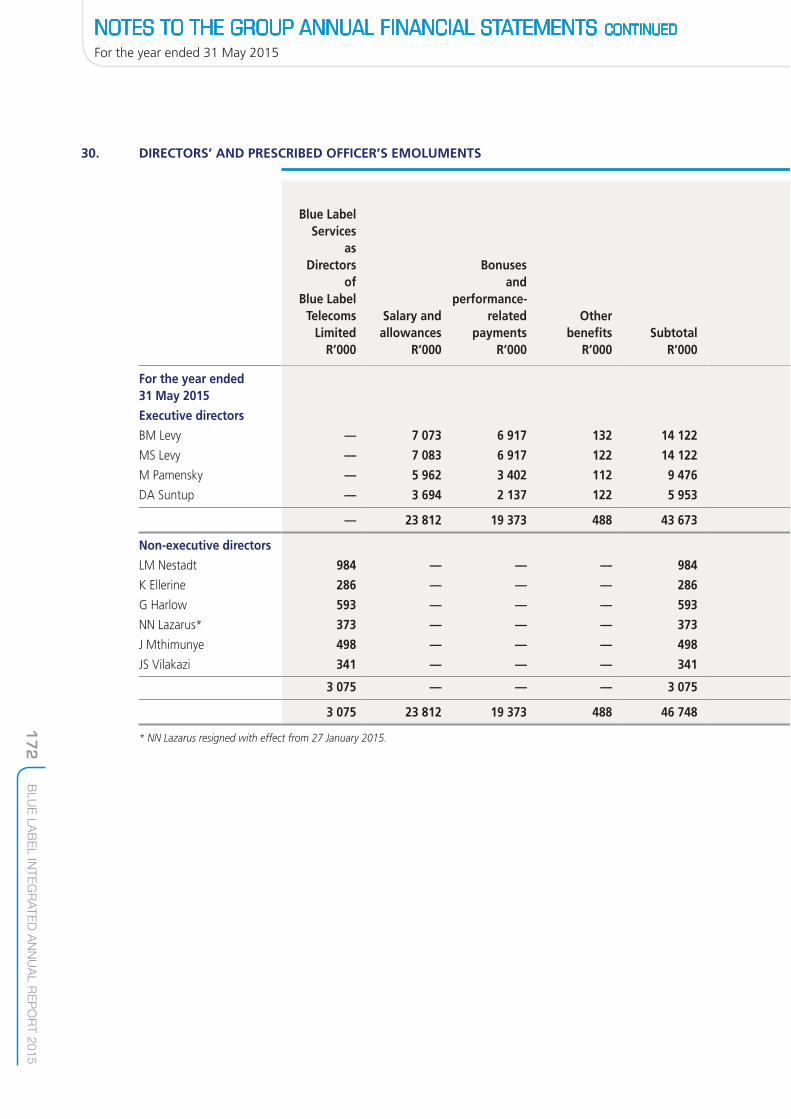
NOTES TO THE GROUP ANNUAL FINANCIAL STATEMENTS CONTINUED
For the year ended 31 May 2015
172
BLU
E L
AB
EL IN
TE
GR
AT
ED
AN
NU
AL R
EP
OR
T 2
01
5
30. DIRECTORS’ AND PRESCRIBED OFFICER’S EMOLUMENTS
Blue LabelServices
asDirectors
ofBlue Label
TelecomsLimited
R’000
Salary andallowances
R’000
Bonusesand
performance-related
paymentsR’000
Otherbenefits
R’000Subtotal
R’000
For the year ended 31 May 2015
Executive directors
BM Levy — 7 073 6 917 132 14 122
MS Levy — 7 083 6 917 122 14 122
M Pamensky — 5 962 3 402 112 9 476
DA Suntup — 3 694 2 137 122 5 953
— 23 812 19 373 488 43 673
Non-executive directors
LM Nestadt 984 — — — 984
K Ellerine 286 — — — 286
G Harlow 593 — — — 593
NN Lazarus* 373 — — — 373
J Mthimunye 498 — — — 498
JS Vilakazi 341 — — — 341
3 075 — — — 3 075
3 075 23 812 19 373 488 46 748
* NN Lazarus resigned with effect from 27 January 2015.

NOTES TO THE GROUP ANNUAL FINANCIAL STATEMENTS CONTINUED
For the year ended 31 May 2015
173
BLU
E L
AB
EL IN
TE
GR
AT
ED
AN
NU
AL R
EP
OR
T 2
01
5
Services asDirectors
ofsubsidiaries
ofBlue Label
TelecomsLimited
R’000
Salary andallowances
fromsubsidiaries
R’000
Bonusesand
performance-related
paymentsfrom
subsidiariesR’000
Retirementand
relatedbenefits
fromsubsidiaries
R’000
Corporate finance and
legal fees for services
renderedto
Blue LabelTelecoms
GroupR’000
TotalR’000
Fair valueof
forfeitablesharesR’000
— — — — — 14 122 7 189
— — — — — 14 122 7 189
— — — — — 9 476 6 061
— — — — — 5 953 3 349
— — — — — 43 673 23 788
— — — — — 984
— — — — — 286
473 — — — — 1 066
— — — — 7 524 7 897
21 — — — — 519
— — — — — 341
494 — — — 7 524 11 093
494 — — — 7 524 54 766 23 788

NOTES TO THE GROUP ANNUAL FINANCIAL STATEMENTS CONTINUED
For the year ended 31 May 2015
174
BLU
E L
AB
EL IN
TE
GR
AT
ED
AN
NU
AL R
EP
OR
T 2
01
5
30. DIRECTORS’ AND PRESCRIBED OFFICER’S EMOLUMENTS continued
Blue LabelServices
asDirectors
ofBlue LabelTelecoms
LimitedR’000
Salary andallowances
R’000
Bonusesand
performance-related
paymentsR’000
Otherbenefits
R’000Subtotal
R’000
For the year ended 31 May 2014
Executive directors
BM Levy — 6 677 — 120 6 797
MS Levy — 6 686 — 111 6 797
M Pamensky — 5 637 — 94 5 731
DB Rivkind* — 1 455 — 27 1 482
DA Suntup — 1 530 — 58 1 588
— 21 985 — 410 22 395
Non-executive directors
LM Nestadt 843 — — — 843
K Ellerine 264 — — — 264
G Harlow 540 — — — 540
NN Lazarus 523 — — — 523
J Mthimunye 373 — — — 373
JS Vilakazi 309 — — — 309
2 852 — — — 2 852
Prescribed officer
DA Suntup* — 1 428 — 54 1 482
— 1 428 — 54 1 482
2 852 23 413 — 464 26 729
* DB Rivkind resigned with effect from 14 November 2013. DA Suntup was appointed a Director on 14 November 2013.
The fair value of forfeitable shares per Director has been included.
No Director has a notice period of more than one year.
No Director’s service contract includes predetermined compensation as a result of termination that would exceed one year’s salary and benefits.
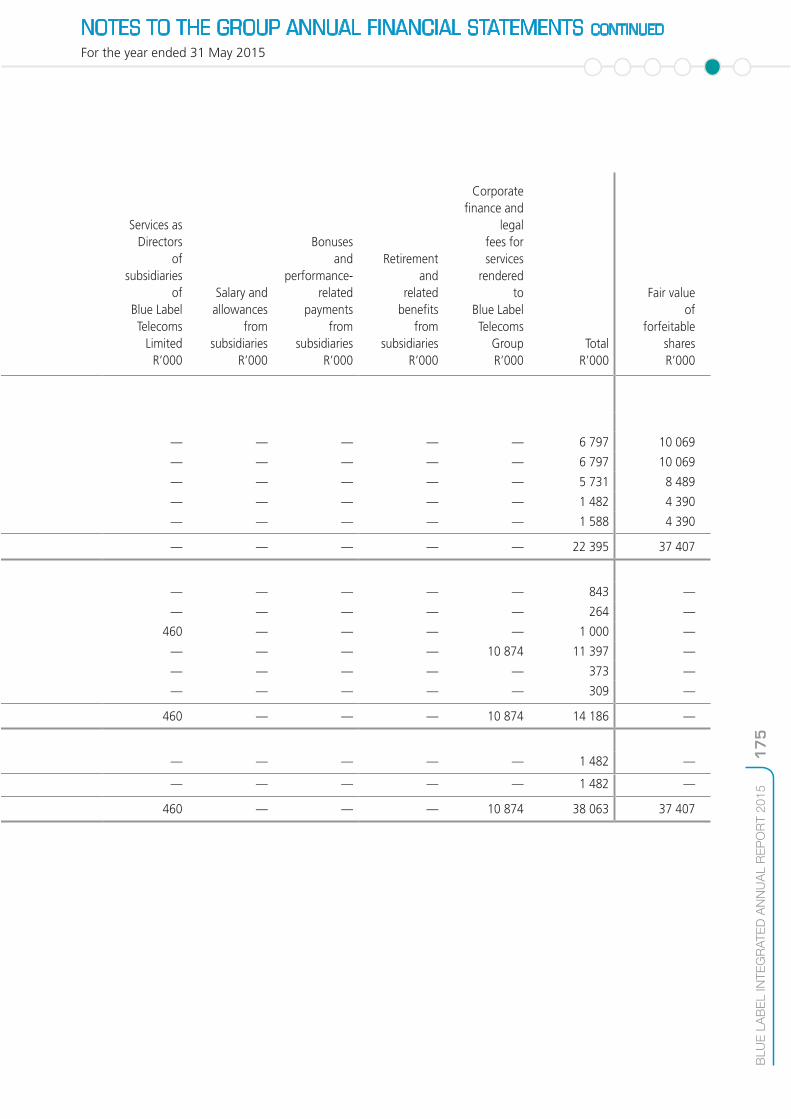
NOTES TO THE GROUP ANNUAL FINANCIAL STATEMENTS CONTINUED
For the year ended 31 May 2015
175
BLU
E L
AB
EL IN
TE
GR
AT
ED
AN
NU
AL R
EP
OR
T 2
01
5
Services asDirectors
ofsubsidiaries
ofBlue LabelTelecoms
LimitedR’000
Salary andallowances
fromsubsidiaries
R’000
Bonusesand
performance-related
paymentsfrom
subsidiariesR’000
Retirementand
relatedbenefits
fromsubsidiaries
R’000
Corporate finance and
legalfees forservices
renderedto
Blue LabelTelecoms
GroupR’000
TotalR’000
Fair valueof
forfeitablesharesR’000
— — — — — 6 797 10 069
— — — — — 6 797 10 069
— — — — — 5 731 8 489
— — — — — 1 482 4 390
— — — — — 1 588 4 390
— — — — — 22 395 37 407
— — — — — 843 —
— — — — — 264 —
460 — — — — 1 000 —
— — — — 10 874 11 397 —
— — — — — 373 —
— — — — — 309 —
460 — — — 10 874 14 186 —
— — — — — 1 482 —
— — — — — 1 482 —
460 — — — 10 874 38 063 37 407

NOTES TO THE GROUP ANNUAL FINANCIAL STATEMENTS CONTINUED
For the year ended 31 May 2015
176
BLU
E L
AB
EL IN
TE
GR
AT
ED
AN
NU
AL R
EP
OR
T 2
01
5
30. DIRECTORS’ AND PRESCRIBED OFFICER’S EMOLUMENTS continued
Issue dateIssue price
R Vesting date
Forfeitable share scheme per Director and prescribed officer
For the year ended 31 May 2015
BM Levy 1 October 2011 4.5 31 August 2014
BM Levy 3 September 2012 6.71 31 August 2015
BM Levy 2 September 2013 8.75 31 August 2016
BM Levy 3 September 2014 8.9 31 August 2017
MS Levy 1 October 2011 4.5 31 August 2014
MS Levy 3 September 2012 6.71 31 August 2015
MS Levy 2 September 2013 8.75 31 August 2016
MS Levy 3 September 2014 8.9 31 August 2017
MV Pamensky 1 October 2011 4.5 31 August 2014
MV Pamensky 3 September 2012 6.71 31 August 2015
MV Pamensky 2 September 2013 8.75 31 August 2016
MV Pamensky 3 September 2014 8.9 31 August 2017
DA Suntup 1 October 2011 4.5 31 August 2014
DA Suntup 3 September 2012 6.71 31 August 2015
DA Suntup 2 September 2013 8.75 31 August 2016
DA Suntup 3 September 2014 8.9 31 August 2017

NOTES TO THE GROUP ANNUAL FINANCIAL STATEMENTS CONTINUED
For the year ended 31 May 2015
177
BLU
E L
AB
EL IN
TE
GR
AT
ED
AN
NU
AL R
EP
OR
T 2
01
5
Awardsoutstanding
as at thebeginning
of the year
Numberof sharesawarded
Awardsforfeited
duringthe year
Awardsvestedduring
the year
Balanceas at
the endof the year
470 507 — — (470 507) —
334 474 — — — 334 474
271 883 — — — 271 883
— 283 339 — — 283 339
1 076 864 283 339 — (470 507) 889 696
470 507 — — (470 507) —
334 474 — — — 334 474
271 883 — — — 271 883
— 283 339 — — 283 339
1 076 864 283 339 — (470 507) 889 696
396 667 — — (396 667) —
281 982 — — — 281 982
229 214 — — — 229 214
— 238 872 — — 238 872
907 863 238 872 — (396 667) 750 068
205 139 — — (205 139) —
145 829 — — — 145 829
118 540 — — — 118 540
— 150 067 — — 150 067
469 508 150 067 — (205 139) 414 436

NOTES TO THE GROUP ANNUAL FINANCIAL STATEMENTS CONTINUED
For the year ended 31 May 2015
178
BLU
E L
AB
EL IN
TE
GR
AT
ED
AN
NU
AL R
EP
OR
T 2
01
5
30. DIRECTORS’ AND PRESCRIBED OFFICER’S EMOLUMENTS continued
Issue date
Issue price
RVesting
date
Forfeitable share scheme per Director and prescribed officer
For the year ended 31 May 2014
BM Levy 1 September 2010 4.7 31 August 2013
BM Levy 1 October 2011 4.5 31 August 2014
BM Levy 3 September 2012 6.71 31 August 2015
BM Levy 2 September 2013 8.75 31 August 2016
MS Levy 1 September 2010 4.7 31 August 2013
MS Levy 1 October 2011 4.5 31 August 2014
MS Levy 3 September 2012 6.71 31 August 2015
MS Levy 2 September 2013 8.75 31 August 2016
MV Pamensky 1 September 2010 4.7 31 August 2013
MV Pamensky 1 October 2011 4.5 31 August 2014
MV Pamensky 3 September 2012 6.71 31 August 2015
MV Pamensky 2 September 2013 8.75 31 August 2016
DB Rivkind 1 September 2010 4.7 31 August 2013
DB Rivkind 1 October 2011 4.5 31 August 2014
DB Rivkind 3 September 2012 6.71 31 August 2015
DB Rivkind 2 September 2013 8.75 31 August 2016
DA Suntup 1 September 2010 4.7 31 August 2013
DA Suntup 1 October 2011 4.5 31 August 2014
DA Suntup 3 September 2012 6.71 31 August 2015
DA Suntup 2 September 2013 8.75 31 August 2016

NOTES TO THE GROUP ANNUAL FINANCIAL STATEMENTS CONTINUED
For the year ended 31 May 2015
179
BLU
E L
AB
EL IN
TE
GR
AT
ED
AN
NU
AL R
EP
OR
T 2
01
5
Awardsoutstanding
as at thebeginning
of the year
Numberof sharesawarded
Awardsforfeited
duringthe year
Awardsvestedduring
the year
Balanceas at
the endof the year
450 486 — (16 910) (433 576) —
470 507 — — — 470 507
334 474 — — — 334 474
— 271 883 — — 271 883
1 255 467 271 883 (16 910) (433 576) 1 076 864
450 486 — (16 910) (433 576) —
470 507 — — — 470 507
334 474 — — — 334 474
— 271 883 — — 271 883
1 255 467 271 883 (16 910) (433 576) 1 076 864
379 787 — (14 256) (365 531) —
396 667 — — — 396 667
281 982 — — — 281 982
— 229 214 — — 229 214
1 058 436 229 214 (14 256) (365 531) 907 863
196 409 — (7 372) (189 037) —
205 139 — — — 205 139
145 829 — — — 145 829
— 118 540 — — 118 540
547 377 118 540 (7 372) (189 037) 469 508
196 409 — (7 372) (189 037) —
205 139 — — — 205 139
145 829 — — — 145 829
— 118 540 — — 118 540
547 377 118 540 (7 372) (189 037) 469 508
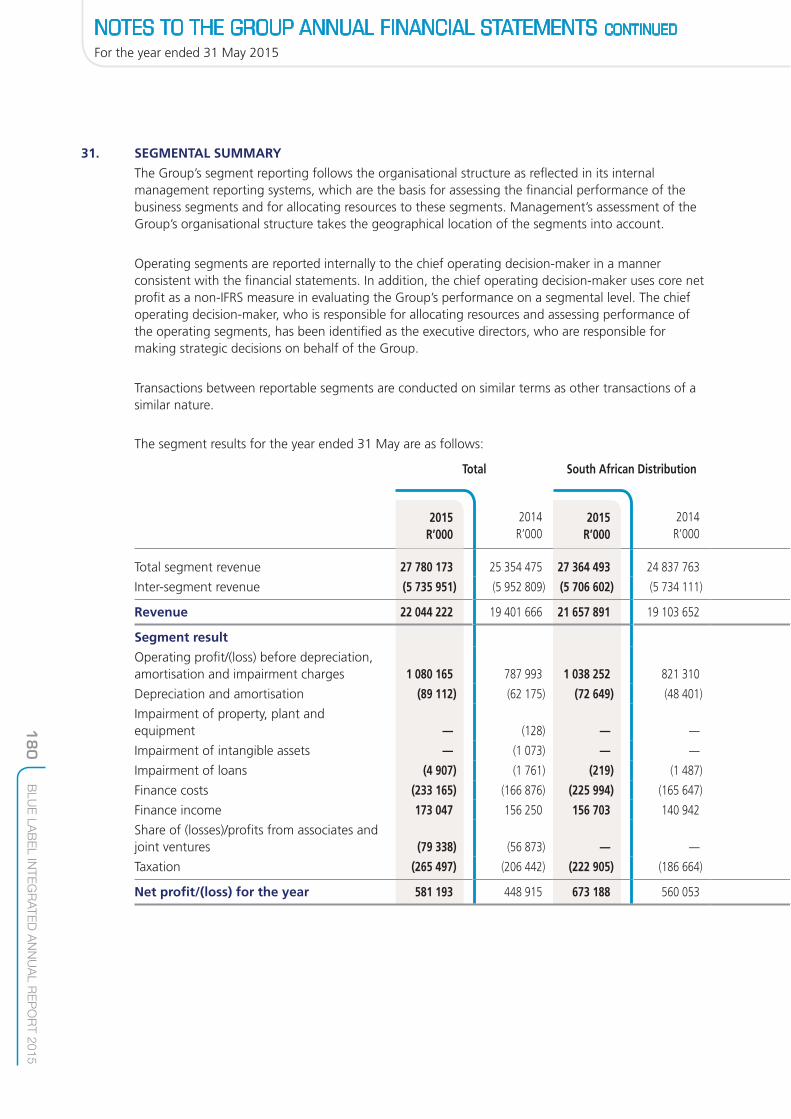
NOTES TO THE GROUP ANNUAL FINANCIAL STATEMENTS CONTINUED
For the year ended 31 May 2015
180
BLU
E L
AB
EL IN
TE
GR
AT
ED
AN
NU
AL R
EP
OR
T 2
01
5
31. SEGMENTAL SUMMARY
The Group’s segment reporting follows the organisational structure as reflected in its internal management reporting systems, which are the basis for assessing the financial performance of the business segments and for allocating resources to these segments. Management’s assessment of the Group’s organisational structure takes the geographical location of the segments into account.
Operating segments are reported internally to the chief operating decision-maker in a manner consistent with the financial statements. In addition, the chief operating decision-maker uses core net profit as a non-IFRS measure in evaluating the Group’s performance on a segmental level. The chief operating decision-maker, who is responsible for allocating resources and assessing performance of the operating segments, has been identified as the executive directors, who are responsible for making strategic decisions on behalf of the Group.
Transactions between reportable segments are conducted on similar terms as other transactions of a similar nature.
The segment results for the year ended 31 May are as follows:
Total South African Distribution
2014R’000
2014R’000
Total segment revenue 27 780 173 25 354 475 27 364 493 24 837 763
Inter-segment revenue (5 735 951) (5 952 809) (5 706 602) (5 734 111)
Revenue 22 044 222 19 401 666 21 657 891 19 103 652
Segment result
Operating profit/(loss) before depreciation, amortisation and impairment charges 1 080 165 787 993 1 038 252 821 310
Depreciation and amortisation (89 112) (62 175) (72 649) (48 401)
Impairment of property, plant and equipment — (128) — —
Impairment of intangible assets — (1 073) — —
Impairment of loans (4 907) (1 761) (219) (1 487)
Finance costs (233 165) (166 876) (225 994) (165 647)
Finance income 173 047 156 250 156 703 140 942
Share of (losses)/profits from associates and joint ventures (79 338) (56 873) — —
Taxation (265 497) (206 442) (222 905) (186 664)
Net profit/(loss) for the year 581 193 448 915 673 188 560 053
2015R’000
2015R’000

NOTES TO THE GROUP ANNUAL FINANCIAL STATEMENTS CONTINUED
For the year ended 31 May 2015
181
BLU
E L
AB
EL IN
TE
GR
AT
ED
AN
NU
AL R
EP
OR
T 2
01
5
International Distribution Mobile Solutions Corporate
2014R’000
2014R’000
2014R’000
2014R’000
— — 251 085 350 783 164 595 165 929 — —
— — (10 917) (198 165) (18 432) (20 533) — —
— — 240 168 152 618 146 163 145 396 — —
35 379 (13 961) 51 359 34 273 40 831 29 257 (85 656) (82 886)
— — (7 068) (3 407) (2 877) (3 331) (6 518) (7 036)
— — — — — (128) — —
— — — (1 073) — — — —
(4 688) (274) — — — — — —
(152) (392) (733) (61) (2) (1) (6 284) (775)
7 190 11 274 1 322 1478 449 485 7 383 2 071
(81 267) (56 249) 2 658 — (729) (624) — —
(14 701) (3 700) (15 732) (7 672) (9 480) (9 049) (2 679) 643
(58 239) (63 302) 31 806 23 538 28 192 16 609 (93 754) (87 983)
2015R’000
2015R’000
2015R’000
2015R’000
At 31 May 2015, the Group is managed on the basis of five main business segments: • South African Distribution, which includes the distribution of physical and virtual prepaid airtime
and electricity of the South African mobile/fixed-line network operators and utility suppliers, and the distribution of starter packs in South Africa.
• International Distribution, which includes international distribution of physical and virtual prepaid airtime in India and Mexico, and payment solutions in India. This segment also incorporates the Africa Prepaid Services group.
• Mobile, which includes the provision of a complete mobile transactional ecosystem and services provisioning platform delivering mobile-centric products and services through any mobile channel, including location-based and WASP services, and music and digital content provision.
• Solutions, which include marketing of cellular and financial products and services through outbound telemarketing and other channels, provides inbound customer care and technical support, and markets data and analytics services.
• Corporate, which performs the head office administration function.

NOTES TO THE GROUP ANNUAL FINANCIAL STATEMENTS CONTINUED
For the year ended 31 May 2015
182
BLU
E L
AB
EL IN
TE
GR
AT
ED
AN
NU
AL R
EP
OR
T 2
01
5
Total South African Distribution
2014R’000
2014R’000
31. SEGMENTAL SUMMARY continued
Reconciliation of net profit for the year to core net profit for the year
Net profit/(loss) for the year 581 193 448 915 673 188 560 053
Amortisation of intangibles raised through business combinations net of tax 19 628 10 625 13 389 6 323
Core net profit/(loss) for the year 600 821 459 540 686 577 566 376
Core net profit/(loss) for the year attributable to:
Equity holders of parent 596 578 460 602 684 756 558 996
Non-controlling interest 4 243 (1 062) 1 821 7 379
Non-cash items
Net profit/(loss) on sale of subsidiaries 3 691 — — —
Net profit on disposal of associates 18 771 — — —
Discounting of receivables 142 326 117 444 142 326 116 783
Discounting of payables (165 201) (143 882) (165 201) (143 882)
The segment assets and liabilities at 31 May are as follows:
Assets excluding investments in associates and joint ventures 6 478 248 5 904 778 5 890 188 5 651 680
Investments in associates and joint ventures 548 572 598 109 — —
Total assets 7 026 820 6 502 887 5 890 188 5 651 680
Additions to non-current assets
Property, plant and equipment 54 897 47 038 44 673 42 678
Intangible assets and goodwill 374 095 397 203 344 909 388 280
Investment in associates 51 424 — — —
Investment in joint ventures 30 051 — — —
Total liabilities (3 108 839) (2 978 898) (2 781 588) (2 838 621)
Segmental summary
The Company is domiciled in the Republic of South Africa. The result of its revenue from external customers in South Africa is R22.044 billion (2014: R19.402 billion), and the total revenue from external customers from other countries is nil (2014: nil).
2015R’000
2015R’000

NOTES TO THE GROUP ANNUAL FINANCIAL STATEMENTS CONTINUED
For the year ended 31 May 2015
183
BLU
E L
AB
EL IN
TE
GR
AT
ED
AN
NU
AL R
EP
OR
T 2
01
5
International Distribution Mobile Solutions Corporate
2014R’000
2014R’000
2014R’000
2014R’000
(58 239) (63 302) 31 806 23 538 28 192 16 609 (93 754) (87 983)
3 593 3 315 2 646 987 — — — —
(54 646) (59 987) 34 452 24 525 28 192 16 609 (93 754) (87 983)
(46 958) (47 862) 28 559 24 904 23 975 12 547 (93 754) (87 983)
(7 688) (12 125) 5 893 (378) 4 217 4 062 — —
— — — — — — 3 691 —
18 771 — — — — — — —
— — — 661 — — — —
— — — — — — — —
(22 250) (40 235) 407 401 96 420 151 077 134 592 51 832 62 321
500 203 596 611 41 905 — 464 1 498 6 000 —
477 953 556 376 449 306 96 420 151 541 136 090 57 832 62 321
— — 8 257 3 306 1 657 912 310 142
— — 27 722 7 239 1 445 1 651 19 33
51 424 — — — — — — —
— — 30 051 — — — — —
(26 792) (24 401) (147 536) (76 359) (18 011) (15 767) (134 912) (23 750)
The total non-current assets other than financial instruments and deferred tax assets located in South Africa is R1.483 billion (2014: R1.164 billion), and the total non-current assets located in other countries is R459 million (2014: R555 million).
The South African Distribution segment includes revenues of R3.717 billion and R3.541 billion earned from two external customers.
2015R’000
2015R’000
2015R’000
2015R’000

NOTES TO THE GROUP ANNUAL FINANCIAL STATEMENTS CONTINUED
For the year ended 31 May 2015
184
BLU
E L
AB
EL IN
TE
GR
AT
ED
AN
NU
AL R
EP
OR
T 2
01
5
32. EQUITY COMPENSATION BENEFIT
Forfeitable shares
During the year 2 937 836 (2014: 2 782 541) forfeitable shares were granted to executive directors and qualifying employees (participant). The participant will forfeit the forfeitable shares if he/she ceases to be an employee of an employer company before the vesting date or if the specified performance conditions have not been met, unless otherwise specified by the rules or determined by the Board. In the event that the participant is not in the employ of the Group, or the performance conditions are not met, the shares allocated to the participant will be forfeited and will either be sold on the open market by the escrow agent and the proceeds will be returned to the participating employer, or may be retained by the Group for future awards.
Dividends declared in respect of these forfeitable shares are held in escrow until such time as the performance conditions are met and the shares have vested. Shares forfeited during the vesting period will forfeit any dividends pertaining to such shares. A dividend of 27 cents (2014: 25 cents) per ordinary share was declared on 19 August 2014 (2014: 18 August 2013).
The performance condition for the fourth award of forfeitable shares vesting on 31 August 2014 is as follows: • 25% of the shares constituting the allocation are awarded for retention purposes and shall vest if
the employee is still employed within the Group at the vesting date (31 August 2014). • 25% of the shares constituting the allocation will vest on the achievement by individual employees
of their individual key performance indicators. • 50% of the shares constituting the allocation will vest if the Group’s core HEPS are equal to or
exceed the core HEPS per ordinary share at the beginning of the performance period, 1 June 2011, by the percentage change in the CPI over the performance period, plus 15%. There is no linear vesting to this portion of the allocation.
The performance condition for the fifth award vesting on 31 August 2015 of forfeitable shares is as follows: • 40% of the awards are allocated towards retention. In order to receive this portion of the allocation
the employee is required to be employed within the Group at the vesting date (31 August 2015). • 60% of the awards are allocated on the basis of 50% for growth in core headline earnings per
share and 10% for shareholder returns.
The 50% for growth in core headline earnings will be based on the following achievements: • If growth is 5% above CPI over three years, 20% of the 50% will vest. • If growth is 10% above CPI over three years, an additional 50% (i.e. a total of 70%) of the 50%
will vest. • If growth is 25% above CPI over three years, a further 30% (i.e. a total of 100%) of the 50%
will vest.
The 10% for shareholder return will be based on a 10% compounded growth in the share price over the three-year vesting period measured with reference to the weighted average price per share during the month of the commencement of the allocation and the weighted average share price for the month during which the vesting takes place, plus dividends over the three-year period.
For the year ended 31 May 2015
185
BLU
E L
AB
EL IN
TE
GR
AT
ED
AN
NU
AL R
EP
OR
T 2
01
5
NOTES TO THE GROUP ANNUAL FINANCIAL STATEMENTS CONTINUED
32. EQUITY COMPENSATION BENEFIT continued
The performance condition for the sixth award vesting on 31 August 2016 of forfeitable shares is as follows: • 40% of the awards are allocated towards retention. In order to receive this portion of the allocation
the employee is required to be employed within the Group at the vesting date (31 August 2016). • 60% of the awards are allocated on the basis of 50% for growth in core headline earnings per
share and 10% for shareholder returns.
The 50% for growth in core headline earnings will be based on the following achievements: • If growth is 5% above CPI over three years, 20% of the 50% will vest. • If growth is 10% above CPI over three years, an additional 50% (i.e. a total of 70%) of the 50%
will vest. • If growth is 25% above CPI over three years, a further 30% (i.e. a total of 100%) of the 50% will
vest.
The 10% for shareholder return will be based on a 10% compounded growth in the share price over the three-year vesting period measured with reference to the weighted average price per share during the month of the commencement of the allocation and the weighted average share price for the month during which the vesting takes place, plus dividends over the three-year period.
The performance condition for the seventh award vesting on 31 August 2017 of forfeitable shares is as follows: • 40% of the awards are allocated towards retention. In order to receive this portion of the allocation
the employee is required to be employed within the Group at the vesting date (31 August 2017). • 60% of the awards are allocated on the basis of 50% for growth in core headline earnings per
share and 10% for shareholder returns.
The 50% for growth in core headline earnings will be based on the following achievements: • If growth is 5% above CPI over three years, 20% of the 50% will vest. • If growth is 10% above CPI over three years, an additional 50% (i.e. a total of 70%) of the 50%
will vest. • If growth is 25% above CPI over three years, a further 30% (i.e. a total of 100%) of the 50% will
vest.
The 10% for shareholder return will be based on a 10% compounded growth in the share price over the three-year vesting period measured with reference to the weighted average price per share during the month of the commencement of the allocation and the weighted average share price for the month during which the vesting takes place, plus dividends over the three-year period.

NOTES TO THE GROUP ANNUAL FINANCIAL STATEMENTS CONTINUED
For the year ended 31 May 2015
186
BLU
E L
AB
EL IN
TE
GR
AT
ED
AN
NU
AL R
EP
OR
T 2
01
5
32. EQUITY COMPENSATION BENEFIT continued
Movements in the number of forfeitable shares outstanding during the year are as follows:
Grant date Vesting dateNumber
of shares
Fair valueof grant
R’000
At 31 May 2013 11 636 710 60 857
Third award 3 824 824 17 977
Fourth award 4 315 783 19 421
Fifth award 3 496 103 23 459
Granted during the year 2 782 541 24 347
Sixth award 2 September 2013 31 August 2016 2 782 541 24 347
Shares forfeited during the year (1 074 880) (5 724)
Third award (194 902) (916)
Fourth award (496 374) (2 234)
Fifth award (383 604) (2 574)
Shares vested during the year (3 629 922) (17 061)
Third award 31 August 2013 (3 629 922) (17 061)
At 31 May 2014 9 714 449 62 419
Fourth award 3 819 409 17 187
Fifth award 3 112 499 20 885
Sixth award 2 782 541 24 347
Granted during the year 2 937 836 26 147
Seventh award 3 September 2014 31 August 2017 2 937 836 26 147
Shares forfeited during the year (419 998) (3 346)
Fifth award (161 233) (1 082)
Sixth award (258 765) (2 264)
Shares vested during the year (3 819 409) (17 187)
Fourth award 31 August 2014 (3 819 409) (17 187)
At 31 May 2015 8 412 878 68 033
Fifth award 2 951 266 19 803
Sixth award 2 523 776 22 083
Seventh award 2 937 836 26 147
Refer to note 18 for the expense recognised in the statement of comprehensive income relating to the equity compensation benefits.
The fair value of the shares is based on the value paid for the shares on the open market at grant date.
The total number of forfeitable shares issued to executive directors during the period is 955 617 (2014: 1 010 060).
The share-based payment expense in relation to these executive directors is R8.9 million (2014: R5.6 million).
Refer to note 30 for details per Director.

For the year ended 31 May 2015
187
BLU
E L
AB
EL IN
TE
GR
AT
ED
AN
NU
AL R
EP
OR
T 2
01
5
NOTES TO THE GROUP ANNUAL FINANCIAL STATEMENTS CONTINUED
33. COMMITMENTS
Future operating lease commitments
The Group leases various offices under non-cancellable operating lease agreements.
The lease terms are between one and five years, and the majority of lease agreements are renewable at the end of the lease period at market rates.
The Group also leases various equipment under cancellable operating lease agreements.
The Group is required to give six months’ notice for the termination of the majority of these agreements.
The lease expenditure charged to the statement of comprehensive income during the year is disclosed in note 19.
The future aggregate minimum lease payments under non-cancellable operating leases are as follows:
2014R’000
Premises
Payable within one year 27 512 29 434
Payable in two to five years 29 663 53 526
Payable in greater than five years — 348
Equipment
Payable within one year 293 416
Payable in two to five years 204 342
Payable in greater than five years — —
57 672 84 066
Future funding commitments
The Group has committed to provide funding of R109.4 million to certain joint ventures and associates.
The commitments are non-binding but have been undertaken with a reasonable expectation of fulfilment.
2015R’000

NOTES TO THE GROUP ANNUAL FINANCIAL STATEMENTS CONTINUED
For the year ended 31 May 2015
188
BLU
E L
AB
EL IN
TE
GR
AT
ED
AN
NU
AL R
EP
OR
T 2
01
5
Country
Number ofissued
ordinaryshares
Percentageheld
34. INTEREST IN SUBSIDIARIES, ASSOCIATES AND JOINT VENTURES
2015
Subsidiaries
Directly held:
Subsidiaries of Blue Label Telecoms Limited
Activi Deployment Services Proprietary Limited RSA 100 100
Africa Prepaid Services Proprietary Limited RSA 420 90
Africa Prepaid Services Nigeria Limited Nigeria 10 000 000 24.01
Airtime Xpress Proprietary Limited RSA 200 100
Blue Label Distribution Proprietary Limited RSA 100 100
Blue Label One Proprietary Limited RSA 300 100
Blue Label Investments Proprietary Limited RSA 1 200 000 100
BLT USA Inc. USA 100 100
Budding Trade 1170 Proprietary Limited RSA 100 100
Cellfind Proprietary Limited RSA 1 000 100
Datacel Direct Proprietary Limited RSA 100 100
Kwikpay SA Proprietary Limited RSA 100 100
Panacea Mobile Proprietary Limited RSA 100 100
Simigenix Proprietary Limited RSA 120 100
The Prepaid Company Proprietary Limited RSA 10 000 100
The Post Paid Company Proprietary Limited RSA 200 100
TicketPros Proprietary Limited RSA 250 100
Transaction Junction Proprietary Limited RSA 120 60
Uninex Proprietary Limited RSA 100 100
Ventury Group Proprietary Limited RSA 2 000 100
Viamedia Proprietary Limited RSA 3 230 000 75
Virtual Voucher Proprietary Limited RSA 200 100
Country
Number ofissued
ordinaryshares
Percentageheld

NOTES TO THE GROUP ANNUAL FINANCIAL STATEMENTS CONTINUED
For the year ended 31 May 2015
189
BLU
E L
AB
EL IN
TE
GR
AT
ED
AN
NU
AL R
EP
OR
T 2
01
5
Country
Number ofissued
ordinaryshares
Percentageheld
34. INTEREST IN SUBSIDIARIES, ASSOCIATES AND JOINT VENTURES continued
2015 continued
Subsidiaries continued
Indirectly held:
Subsidiary of Blue Label Investments Proprietary Limited
Gold Label Investments Proprietary Limited RSA 1 000 100
Subsidiary of The Prepaid Company Proprietary Limited
Retail Mobile Credit Specialists Proprietary Limited RSA 42 431 100
Subsidiary of Ventury Group Proprietary Limited
Cigicell Proprietary Limited RSA 100 74
Subsidiary of Africa Prepaid Services Proprietary Limited
Africa Prepaid Services Nigeria Limited Nigeria 10 000 000 51
Subsidiaries of Datacel Direct Proprietary Limited
Blue Label Call Centre Proprietary Limited RSA 300 100
CNS Call Centre Proprietary Limited RSA 1 000 100
Velociti Proprietary Limited RSA 1 000 100
Blue Label Data Solutions Proprietary Limited RSA 100 81
Subsidiary of 2DFine Holdings Mauritius
2DFine Investments Mauritius Mauritius 1 100
Subsidiaries of Blue Label Mexico S.A. de C.V.
SGC Servicios Y Gestion Corporation S.A. de C.V. Mexico 500 99.8
Connecta Systems LLC USA 1 000 100
Pagacel S.A. de C.V. Mexico 500 99.8
Transipago S.A. de C.V. Mexico 500 99.8
Associate of Blue Label Telecoms Limited
Lornanox Proprietary Limited RSA 120 40
Country
Number ofissued
ordinaryshares
Percentageheld

NOTES TO THE GROUP ANNUAL FINANCIAL STATEMENTS CONTINUED
For the year ended 31 May 2015
190
BLU
E L
AB
EL IN
TE
GR
AT
ED
AN
NU
AL R
EP
OR
T 2
01
5
Country
Number ofissued
ordinaryshares
Percentageheld
34. INTEREST IN SUBSIDIARIES, ASSOCIATES AND JOINT VENTURES continued
2015 continued
Subsidiaries continued
Indirectly held:
Associates of Gold Label Investments Proprietary Limited
Oxigen Services India Private Limited India 14 244 294 37.22
Mpower Softcomm Private Limited India 16 286 14.4*
Associate of Blue Label Data Solutions Proprietary Limited
Forensic Intelligence Data Solutions Proprietary Limited RSA 100 25
Associate of 2DFine Investments Mauritius
Mpower Softcomm Private Limited India 16 286 14.4*
Joint venture of Blue Label Telecoms Limited
Blue Label Mexico S.A. de C.V. Mexico 9 200 46.64**
Joint venture of Blue Label Data Solutions Proprietary Limited
Datacision Proprietary Limited RSA 100 50
Joint venture of Gold Label Investments Proprietary Limited
2DFine Holdings Mauritius Mauritius 2 50
Joint venture of 2DFine Investments Mauritius
Oxigen Services India Private Limited India 14 244 294 37.22**
Joint venture of Viamedia Proprietary Limited
Supa Pesa Africa (Mauritius) Limited Mauritius 100 50
Supa Pesa South Africa Proprietary Limited RSA 200 50
* Significant influence is demonstrated by the Company as a result of representation on the Board of Directors.** Joint control is demonstrated by the composition of and decision-making powers afforded to the Board of
Directors.
Country
Number ofissued
ordinaryshares
Percentageheld
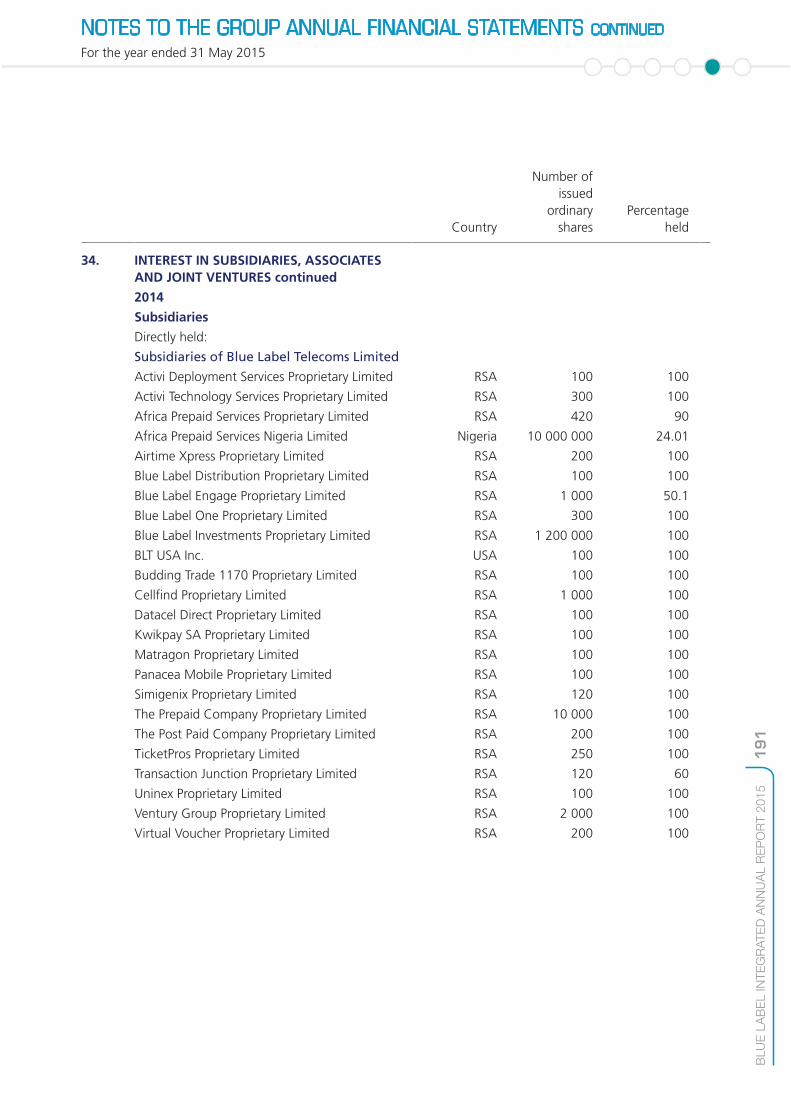
NOTES TO THE GROUP ANNUAL FINANCIAL STATEMENTS CONTINUED
For the year ended 31 May 2015
191
BLU
E L
AB
EL IN
TE
GR
AT
ED
AN
NU
AL R
EP
OR
T 2
01
5
Country
Number ofissued
ordinaryshares
Percentageheld
34. INTEREST IN SUBSIDIARIES, ASSOCIATES AND JOINT VENTURES continued
2014
Subsidiaries
Directly held:
Subsidiaries of Blue Label Telecoms Limited
Activi Deployment Services Proprietary Limited RSA 100 100
Activi Technology Services Proprietary Limited RSA 300 100
Africa Prepaid Services Proprietary Limited RSA 420 90
Africa Prepaid Services Nigeria Limited Nigeria 10 000 000 24.01
Airtime Xpress Proprietary Limited RSA 200 100
Blue Label Distribution Proprietary Limited RSA 100 100
Blue Label Engage Proprietary Limited RSA 1 000 50.1
Blue Label One Proprietary Limited RSA 300 100
Blue Label Investments Proprietary Limited RSA 1 200 000 100
BLT USA Inc. USA 100 100
Budding Trade 1170 Proprietary Limited RSA 100 100
Cellfind Proprietary Limited RSA 1 000 100
Datacel Direct Proprietary Limited RSA 100 100
Kwikpay SA Proprietary Limited RSA 100 100
Matragon Proprietary Limited RSA 100 100
Panacea Mobile Proprietary Limited RSA 100 100
Simigenix Proprietary Limited RSA 120 100
The Prepaid Company Proprietary Limited RSA 10 000 100
The Post Paid Company Proprietary Limited RSA 200 100
TicketPros Proprietary Limited RSA 250 100
Transaction Junction Proprietary Limited RSA 120 60
Uninex Proprietary Limited RSA 100 100
Ventury Group Proprietary Limited RSA 2 000 100
Virtual Voucher Proprietary Limited RSA 200 100
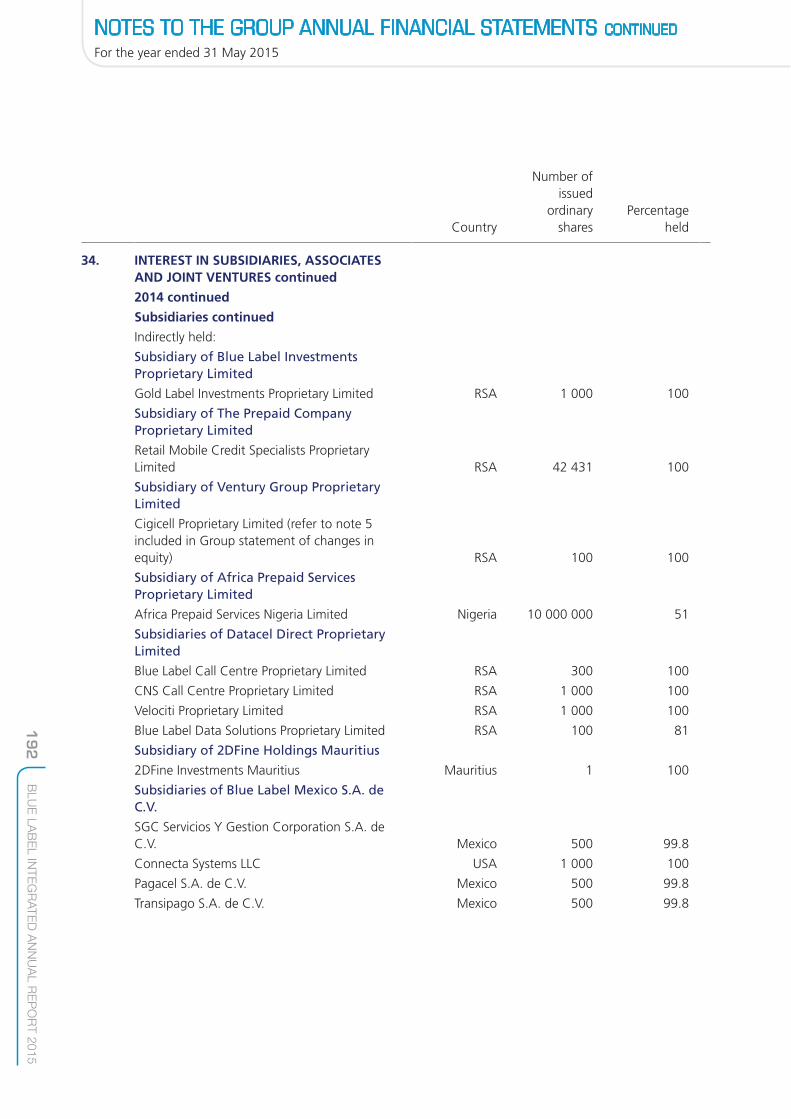
NOTES TO THE GROUP ANNUAL FINANCIAL STATEMENTS CONTINUED
For the year ended 31 May 2015
192
BLU
E L
AB
EL IN
TE
GR
AT
ED
AN
NU
AL R
EP
OR
T 2
01
5
Country
Number ofissued
ordinaryshares
Percentageheld
34. INTEREST IN SUBSIDIARIES, ASSOCIATES AND JOINT VENTURES continued
2014 continued
Subsidiaries continued
Indirectly held:
Subsidiary of Blue Label Investments Proprietary Limited
Gold Label Investments Proprietary Limited RSA 1 000 100
Subsidiary of The Prepaid Company Proprietary Limited
Retail Mobile Credit Specialists Proprietary Limited RSA 42 431 100
Subsidiary of Ventury Group Proprietary Limited
Cigicell Proprietary Limited (refer to note 5 included in Group statement of changes in equity) RSA 100 100
Subsidiary of Africa Prepaid Services Proprietary Limited
Africa Prepaid Services Nigeria Limited Nigeria 10 000 000 51
Subsidiaries of Datacel Direct Proprietary Limited
Blue Label Call Centre Proprietary Limited RSA 300 100
CNS Call Centre Proprietary Limited RSA 1 000 100
Velociti Proprietary Limited RSA 1 000 100
Blue Label Data Solutions Proprietary Limited RSA 100 81
Subsidiary of 2DFine Holdings Mauritius
2DFine Investments Mauritius Mauritius 1 100
Subsidiaries of Blue Label Mexico S.A. de C.V.
SGC Servicios Y Gestion Corporation S.A. de C.V. Mexico 500 99.8
Connecta Systems LLC USA 1 000 100
Pagacel S.A. de C.V. Mexico 500 99.8
Transipago S.A. de C.V. Mexico 500 99.8

NOTES TO THE GROUP ANNUAL FINANCIAL STATEMENTS CONTINUED
For the year ended 31 May 2015
193
BLU
E L
AB
EL IN
TE
GR
AT
ED
AN
NU
AL R
EP
OR
T 2
01
5
Country
Number ofissued
ordinaryshares
Percentageheld
34. INTEREST IN SUBSIDIARIES, ASSOCIATES AND JOINT VENTURES continued
2014 continued
Subsidiaries continued
Indirectly held:
Associates of Gold Label Investments Proprietary Limited
Smart Voucher Limited trading as Ukash United 57 375 861 17.25*
Kingdom
Oxigen Services India Private Limited India 14 244 294 37.22
Associates of Blue Label Data Solutions Proprietary Limited
Dual Data Proprietary Limited RSA 100 50
Forensic Intelligence Data Solutions Proprietary Limited RSA 100 25
Joint venture of Blue Label Telecoms Limited
Blue Label Mexico S.A. de C.V. Mexico 9 200 45.57**
Joint venture of Blue Label Data Solutions Proprietary Limited
Datacision Proprietary Limited RSA 100 50
Joint venture of Gold Label Investments Proprietary Limited
2DFine Holdings Mauritius Mauritius 2 50
Joint venture of 2DFine Investments Mauritius
Oxigen Services India Private Limited India 14 244 294 37.22**
* Significant influence is demonstrated by the Company as a result of representation on the Board of Directors.** Joint control is demonstrated by the composition of and decision-making powers afforded to the Board of
Directors.
35. SUBSEQUENT EVENTS
A final dividend of R209.1 million (31 cents per ordinary share) was declared for the year ended 31 May 2015, payable on Monday, 14 September 2015, to shareholders recorded in the register at the close of business on Friday, 11 September 2015.
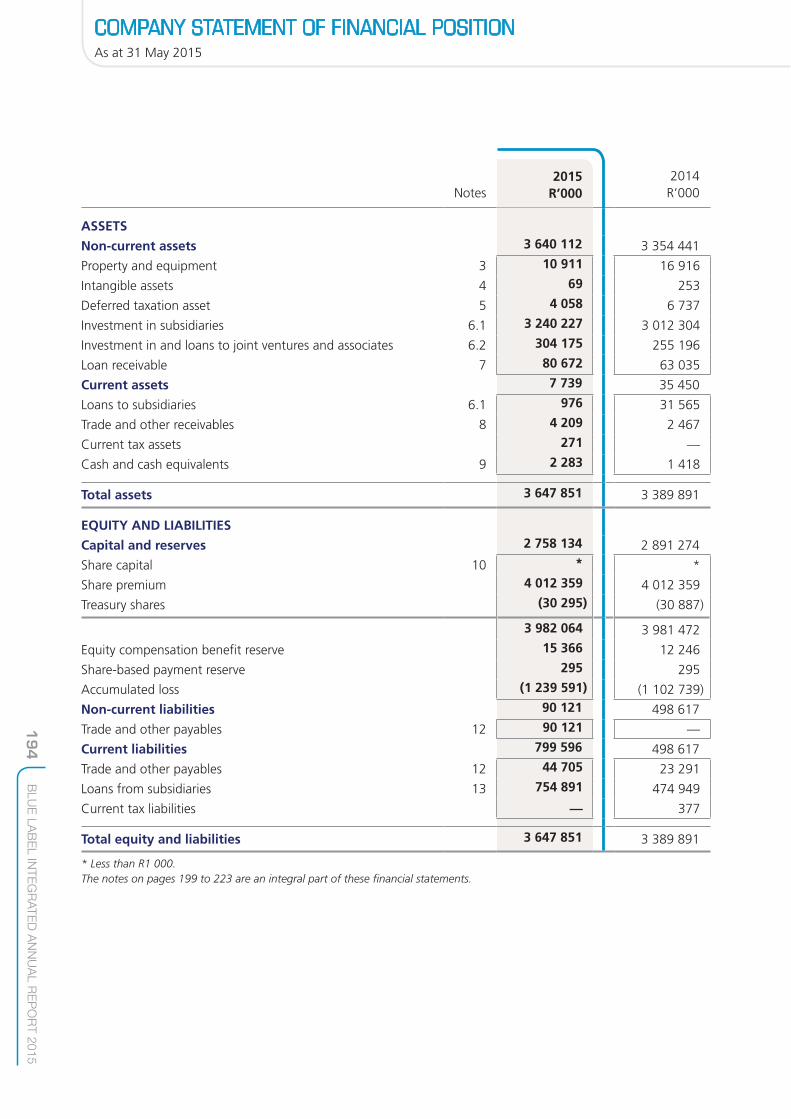
194
BLU
E L
AB
EL IN
TE
GR
AT
ED
AN
NU
AL R
EP
OR
T 2
01
5
As at 31 May 2015
COMPANY STATEMENT OF FINANCIAL POSITION
Notes 2014R’000
ASSETS
Non-current assets 3 640 112 3 354 441
Property and equipment 3 10 911 16 916
Intangible assets 4 69 253
Deferred taxation asset 5 4 058 6 737
Investment in subsidiaries 6.1 3 240 227 3 012 304
Investment in and loans to joint ventures and associates 6.2 304 175 255 196
Loan receivable 7 80 672 63 035
Current assets 7 739 35 450
Loans to subsidiaries 6.1 976 31 565
Trade and other receivables 8 4 209 2 467
Current tax assets 271 —
Cash and cash equivalents 9 2 283 1 418
Total assets 3 647 851 3 389 891
EQUITY AND LIABILITIES
Capital and reserves 2 758 134 2 891 274
Share capital 10 * *
Share premium 4 012 359 4 012 359
Treasury shares (30 295) (30 887)
3 982 064 3 981 472
Equity compensation benefit reserve 15 366 12 246
Share-based payment reserve 295 295
Accumulated loss (1 239 591) (1 102 739)
Non-current liabilities 90 121 498 617
Trade and other payables 12 90 121 —
Current liabilities 799 596 498 617
Trade and other payables 12 44 705 23 291
Loans from subsidiaries 13 754 891 474 949
Current tax liabilities — 377
Total equity and liabilities 3 647 851 3 389 891
* Less than R1 000.The notes on pages 199 to 223 are an integral part of these financial statements.
2015R’000

For the year ended 31 May 2015
195
BLU
E L
AB
EL IN
TE
GR
AT
ED
AN
NU
AL R
EP
OR
T 2
01
5
COMPANY STATEMENT OF COMPREHENSIVE INCOME
Notes 2014R’000
Other income 142 245 96 837
Employee compensation and benefit expense 14 (85 186) (55 702)
Depreciation, amortisation and impairment charges (6 518) (7 019)
Other expenses (8 110) (64 389)
Operating profit/(loss) 15 42 431 (30 273)
Finance costs 16 (6 284) (775)
Finance income 16 11 797 7 806
Net profit/(loss) before taxation 47 944 (23 242)
Taxation 17 (2 679) 535
Net profit/(loss) for the year 45 265 (22 707)
Other comprehensive income for the year, net of tax — —
Total comprehensive profit/(loss) for the year 45 265 (22 707)
The notes on pages 199 to 223 are an integral part of these financial statements.
2015R’000
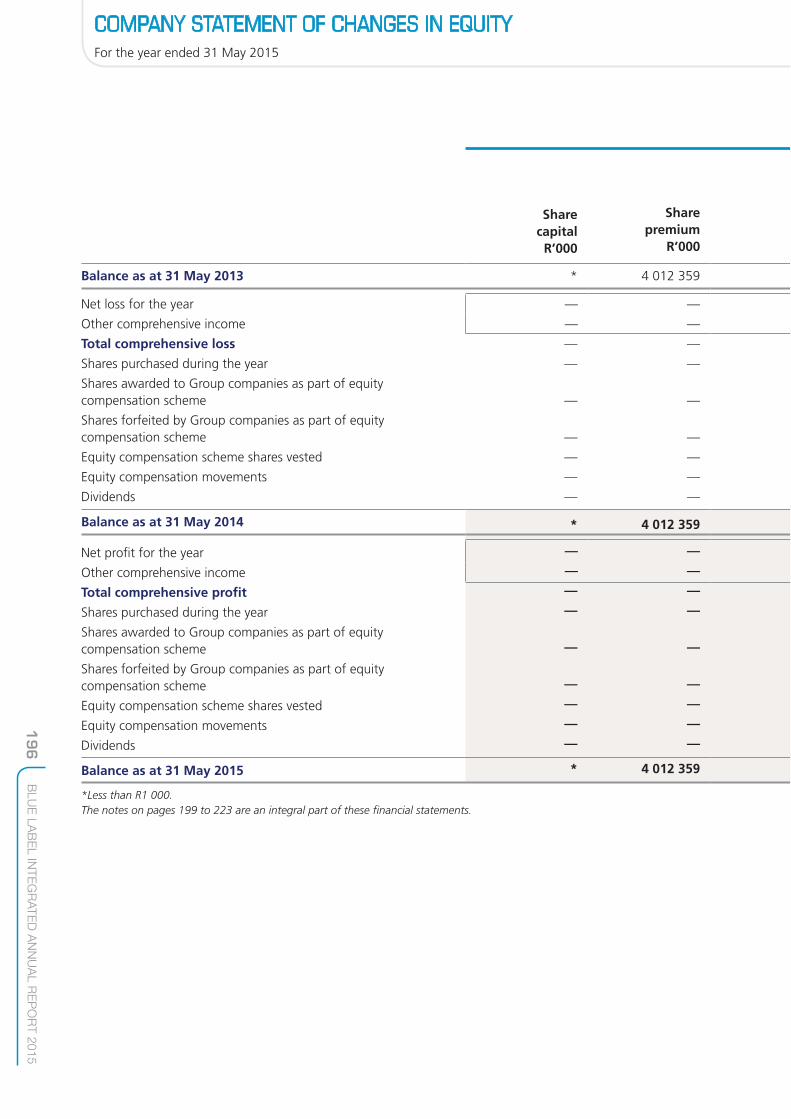
For the year ended 31 May 2015
196
BLU
E L
AB
EL IN
TE
GR
AT
ED
AN
NU
AL R
EP
OR
T 2
01
5
COMPANY STATEMENT OF CHANGES IN EQUITY
Balance as at 31 May 2013 * 4 012 359
Net loss for the year — —
Other comprehensive income — —
Total comprehensive loss — —
Shares purchased during the year — —
Shares awarded to Group companies as part of equity compensation scheme — —
Shares forfeited by Group companies as part of equity compensation scheme — —
Equity compensation scheme shares vested — —
Equity compensation movements — —
Dividends — —
Balance as at 31 May 2014 * 4 012 359
Net profit for the year — —
Other comprehensive income — —
Total comprehensive profit — —
Shares purchased during the year — —
Shares awarded to Group companies as part of equity compensation scheme — —
Shares forfeited by Group companies as part of equity compensation scheme — —
Equity compensation scheme shares vested — —
Equity compensation movements — —
Dividends — —
Balance as at 31 May 2015 * 4 012 359
*Less than R1 000.The notes on pages 199 to 223 are an integral part of these financial statements.
Share capitalR’000
Sharepremium
R’000

For the year ended 31 May 2015
197
BLU
E L
AB
EL IN
TE
GR
AT
ED
AN
NU
AL R
EP
OR
T 2
01
5
COMPANY STATEMENT OF CHANGES IN EQUITY CONTINUED
(39 403) 15 815 295 (911 405) 3 077 661
— — — (22 707) (22 707)
— — — — —
— — — (22 707) (22 707)
(11 120) — — — (11 120)
14 370 — — — 14 370
(3 275) — — — (3 275)
8 541 (8 541) — — —
— 4 972 — — 4 972
— — — (168 627) (168 627)
(30 887) 12 246 295 (1 102 739) 2 891 274
— — — 45 265 45 265
— — — — — — — — 45 265 45 265
(19 131) — — — (19 131)
14 915 — — — 14 915
(3 346) — — — (3 346) 8 154 (8 154) — — —
— 11 274 — — 11 274
— — — (182 117) (182 117)
(30 295) 15 366 295 (1 239 591) 2 758 134
Treasury shares
Equitycompensation
benefit reserve
R’000
Share-based payment
reserveR’000
Accumulatedloss
R’000
TotalequityR’000
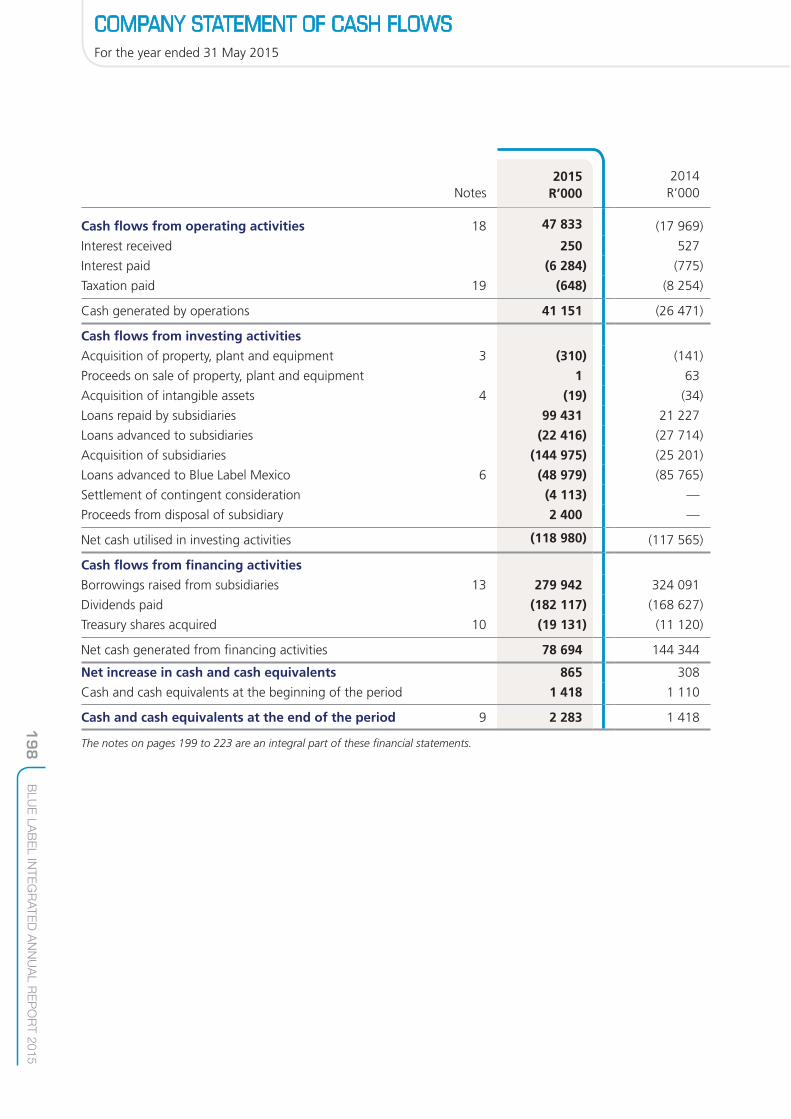
For the year ended 31 May 2015
198
BLU
E L
AB
EL IN
TE
GR
AT
ED
AN
NU
AL R
EP
OR
T 2
01
5
COMPANY STATEMENT OF CASH FLOWS
Notes 2014R’000
Cash flows from operating activities 18 47 833 (17 969)
Interest received 250 527
Interest paid (6 284) (775)
Taxation paid 19 (648) (8 254)
Cash generated by operations 41 151 (26 471)
Cash flows from investing activities
Acquisition of property, plant and equipment 3 (310) (141)
Proceeds on sale of property, plant and equipment 1 63
Acquisition of intangible assets 4 (19) (34)
Loans repaid by subsidiaries 99 431 21 227
Loans advanced to subsidiaries (22 416) (27 714)
Acquisition of subsidiaries (144 975) (25 201)
Loans advanced to Blue Label Mexico 6 (48 979) (85 765)
Settlement of contingent consideration (4 113) —
Proceeds from disposal of subsidiary 2 400 —
Net cash utilised in investing activities (118 980) (117 565)
Cash flows from financing activities
Borrowings raised from subsidiaries 13 279 942 324 091
Dividends paid (182 117) (168 627)
Treasury shares acquired 10 (19 131) (11 120)
Net cash generated from financing activities 78 694 144 344
Net increase in cash and cash equivalents 865 308
Cash and cash equivalents at the beginning of the period 1 418 1 110
Cash and cash equivalents at the end of the period 9 2 283 1 418
The notes on pages 199 to 223 are an integral part of these financial statements.
2015R’000

For the year ended 31 May 2015
199
BLU
E L
AB
EL IN
TE
GR
AT
ED
AN
NU
AL R
EP
OR
T 2
01
5
NOTES TO THE COMPANY ANNUAL FINANCIAL STATEMENTS
1. ACCOUNTING POLICIES AND CRITICAL ACCOUNTING ESTIMATES AND ASSUMPTIONS
The accounting policies and critical accounting estimates and assumptions applied to the Company annual financial statements are consistent with the Group accounting policies as detailed on pages 97 to 117.
2. FINANCIAL RISKS
In the course of its business, the Company is exposed to a number of financial risks: credit risk, liquidity risk and market risk (including foreign currency and other price risk). This note presents the Company’s objectives, policies and processes for managing its financial risk and capital.
Credit riskCredit risk arises because a counterparty may fail to meet its obligations to the Company. The Company is exposed to credit risks on financial instruments such as receivables, loans receivable and cash.
Trade and other receivables consist primarily of invoiced amounts owing from related parties. The recoverability of these amounts are regularly monitored with reference to the counterparties’ financial performance. Where necessary, a provision for impairment is made.
The Company places cash and cash equivalents with major banking groups and quality institutions that have high credit ratings.
Loans are only granted to holders with an appropriate credit history, taking into account the holder’s financial position and past experience.
The Company’s maximum credit risk exposure is the carrying amount of all financial assets on the statement of financial position and sureties provided with the maximum amount the Company could have to pay if the sureties are called on amounting to R1.5 billion (2014: R1 billion).

NOTES TO THE COMPANY ANNUAL FINANCIAL STATEMENTS CONTINUED
For the year ended 31 May 2015
200
BLU
E L
AB
EL IN
TE
GR
AT
ED
AN
NU
AL R
EP
OR
T 2
01
5
2014R’000
2. FINANCIAL RISKS continued
Loans to subsidiaries and joint venture
Group 1 — —
Group 2 976 32 619
Group 3 — —
976 32 619
Loans receivable
Group 1 — —
Group 2 80 672 63 035
Group 3 — —
80 672 63 035
Trade receivables
Counterparties without external credit rating
Group 1 — —
Group 2 3 592 —
Group 3 — —
Total unimpaired trade receivables 3 592 —
The rating groups for counterparties without external credit ratings are categorised as follows:
Group 1 – New customers/related parties (less than six months).
Group 2 – Existing customers/related parties (more than six months) with no defaults in the past.
Group 3 – Existing customers/related parties (more than six months) with some defaults in the past. All defaults were fully recovered.
Cash at bank and short-term bank deposits
Credit rating based on latest Fitch local currency long-term issuer default ratings.
2014R’000
BBB 2 088 —
BBB- 195 1 418
2 283 1 418
2015R’000
2015R’000
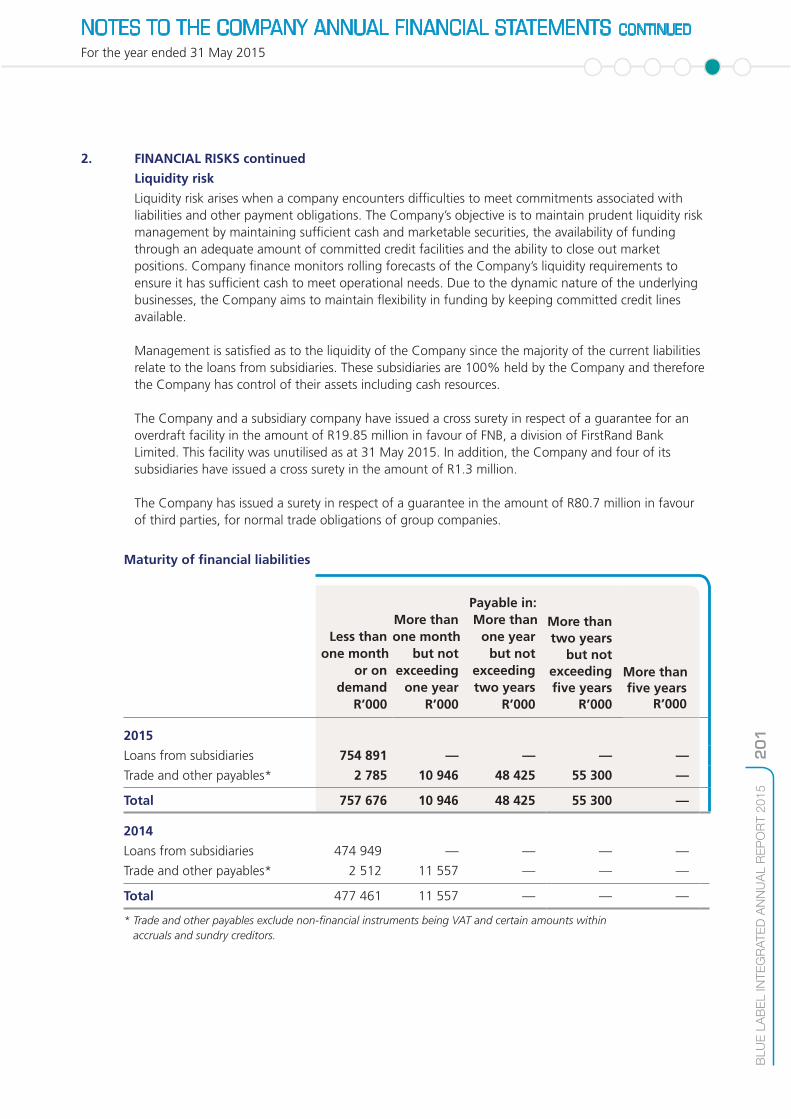
NOTES TO THE COMPANY ANNUAL FINANCIAL STATEMENTS CONTINUED
For the year ended 31 May 2015
201
BLU
E L
AB
EL IN
TE
GR
AT
ED
AN
NU
AL R
EP
OR
T 2
01
5
2. FINANCIAL RISKS continued
Liquidity risk
Liquidity risk arises when a company encounters difficulties to meet commitments associated with liabilities and other payment obligations. The Company’s objective is to maintain prudent liquidity risk management by maintaining sufficient cash and marketable securities, the availability of funding through an adequate amount of committed credit facilities and the ability to close out market positions. Company finance monitors rolling forecasts of the Company’s liquidity requirements to ensure it has sufficient cash to meet operational needs. Due to the dynamic nature of the underlying businesses, the Company aims to maintain flexibility in funding by keeping committed credit lines available.
Management is satisfied as to the liquidity of the Company since the majority of the current liabilities relate to the loans from subsidiaries. These subsidiaries are 100% held by the Company and therefore the Company has control of their assets including cash resources.
The Company and a subsidiary company have issued a cross surety in respect of a guarantee for an overdraft facility in the amount of R19.85 million in favour of FNB, a division of FirstRand Bank Limited. This facility was unutilised as at 31 May 2015. In addition, the Company and four of its subsidiaries have issued a cross surety in the amount of R1.3 million.
The Company has issued a surety in respect of a guarantee in the amount of R80.7 million in favour of third parties, for normal trade obligations of group companies.
Maturity of financial liabilities
Less than one month
or on demand
R’000
More than one month
but not exceeding
one year R’000
Payable in: More than
one year but not
exceeding two years
R’000
More than two years
but not exceeding five years
R’000
2015
Loans from subsidiaries 754 891 — — — —
Trade and other payables* 2 785 10 946 48 425 55 300 —
Total 757 676 10 946 48 425 55 300 —
2014
Loans from subsidiaries 474 949 — — — —
Trade and other payables* 2 512 11 557 — — —
Total 477 461 11 557 — — —
* Trade and other payables exclude non-financial instruments being VAT and certain amounts within accruals and sundry creditors.
More than five years
R’000

NOTES TO THE COMPANY ANNUAL FINANCIAL STATEMENTS CONTINUED
For the year ended 31 May 2015
202
BLU
E L
AB
EL IN
TE
GR
AT
ED
AN
NU
AL R
EP
OR
T 2
01
5
2. FINANCIAL RISKS continued
Market risk
Market risk is the risk that changes in market prices (interest rate and currency risk) will affect the Company’s income or the value of its holding of financial instruments. The objective of market risk management is to manage and control market risk exposures within acceptable parameters, while optimising the return.
The Company is exposed to risks from movements in foreign exchange rates and interest rates that affect its assets, liabilities and anticipated future transactions.
Fair value measurement hierarchy: • Level 1: fair value based on quoted prices (unadjusted) in active markets for identical assets or
liabilities; • Level 2: fair value based on inputs other than quoted prices included within level 1 that are
observable for the asset or liability, either directly (that is, as prices) or indirectly (that is, derived from prices); or
• Level 3: fair value based on inputs for the asset or liability that are not based on observable market data (that is, unobservable inputs).
Contingent consideration, included in trade and other payables, are level 3 financial liabilities.
Changes in level 3 instruments are as follows:
2014 R’000
Contingent consideration
Opening balance 7 256 3 030
Acquisition of Panacea Proprietary Limited — 6 155
Acquisition of Viamedia Proprietary Limited 84 783 —
Settlements (4 113) (1 800)
Gains and losses recognised in profit or loss 5 354 (129)
Closing balance 93 280 7 256
Total gains or losses for the period included in profit or loss for liabilities held at the end of the reporting period, under:
Other income (923) (827)
Interest paid 6 277 698
Change in unrealised gains or losses for the period included in profit or loss for liabilities held at the end of the reporting period 1 382 698
2015R’000
NOTES TO THE COMPANY ANNUAL FINANCIAL STATEMENTS CONTINUED
For the year ended 31 May 2015
203
BLU
E L
AB
EL IN
TE
GR
AT
ED
AN
NU
AL R
EP
OR
T 2
01
5
2. FINANCIAL RISKS continued
Cash flow and fair value interest rate risk
The Company's cash flow interest rate risk arises from loans receivable and cash and cash equivalents. The Company is not exposed to fair value interest rate risk as the Company does not have any fixed interest-bearing instruments carried at fair value nor any interest-bearing borrowings.
As part of the process of managing the Company’s exposure to interest rate risk, interest rate characteristics of new borrowings and the refinancing of existing borrowings are positioned according to expected movements in interest rates.
Foreign currency risk
The Company is exposed to foreign currency risk from transactions. Transaction exposure arises due to the Company granting loans to affiliated companies in foreign currencies.
The Company manages its exposure to foreign currency risk by ensuring that the net foreign currency exposure remains within acceptable levels. Hedging instruments are used in certain instances to reduce risks arising from foreign currency fluctuations. The Company did not enter into any forward exchange contracts during the period under review.
IFRS 7 – Sensitivity Analysis
The Company has used a sensitivity analysis technique that measures the estimated change to the statement of comprehensive income of either an instantaneous increase or decrease of 1% (100 basis points) in market interest rates or a 10% strengthening or weakening of the rand against all other currencies, from the rates applicable at 31 May 2015, for each class of financial instrument with all other variables remaining constant. This analysis is for illustrative purposes only, as in practice market rates rarely change in isolation.
Interest rate risks
The interest rate sensitivity analysis is based on the following assumptions: • Changes in market interest rates affect the interest income or expense of variable interest financial
instruments; and • Changes in market interest rates only affect interest income or expense in relation to financial
instruments with fixed interest rates if these are recognised at fair value.
Under these assumptions, a 1% increase or decrease in market interest rates at 31 May 2015 would increase or decrease profit before tax by R22 830 (2014: R655 070).

NOTES TO THE COMPANY ANNUAL FINANCIAL STATEMENTS CONTINUED
For the year ended 31 May 2015
204
BLU
E L
AB
EL IN
TE
GR
AT
ED
AN
NU
AL R
EP
OR
T 2
01
5
2. FINANCIAL RISKS continued
Foreign currency risk
Financial instruments by currency
2015 2014ZAR
R’000USD
R’000Total
R’000ZAR
R’000USD
R’000Total
R’000
Financial assets
Cash 2 283 — 2 283 1 418 — 1 418
Trade and other receivables* 3 592 — 3 592 177 — 177
Loans to subsidiaries and associates 976 976 31 565 1 054 32 619
Loans receivable — 80 672 80 672 — 63 035 63 035
6 851 80 672 87 523 33 160 64 089 97 249
Financial liabilities
Non-interest-bearing borrowings 754 891 — 754 891 474 949 — 474 949
Trade and other payables* 117 456 — 117 456 14 069 — 14 069
872 347 — 872 347 489 018 — 489 018
Net financial position (865 496) 80 672 (784 824) (455 858) 64 089 (391 769)
* Trade and other receivables and trade and other payables exclude non-financial instruments.
With a 10% strengthening or weakening in the rand against the US dollar, profit before tax would increase or decrease by R8.1 million respectively.
Capital risk
The Company’s objectives when managing capital are to safeguard the Company’s ability to continue as a going concern in order to provide returns for shareholders and benefits for other stakeholders and to maintain an optimal capital structure to reduce the cost of capital. Although the Company is in a deficit position, the value of its significant subsidiary exceeds the carrying value.
In order to maintain or adjust this capital structure, the Company may issue new shares, adjust the amount of dividends paid to shareholders, return capital to shareholders or sell assets to reduce debt.
The Company defines capital as capital and reserves and non-current borrowings.
The Company is not subject to externally imposed capital requirements. There were no changes to the Company’s approach to capital management during the year.
Fair value measurement
For all short-term financial assets and liabilities, the carrying amount is regarded as an approximation of the fair value.
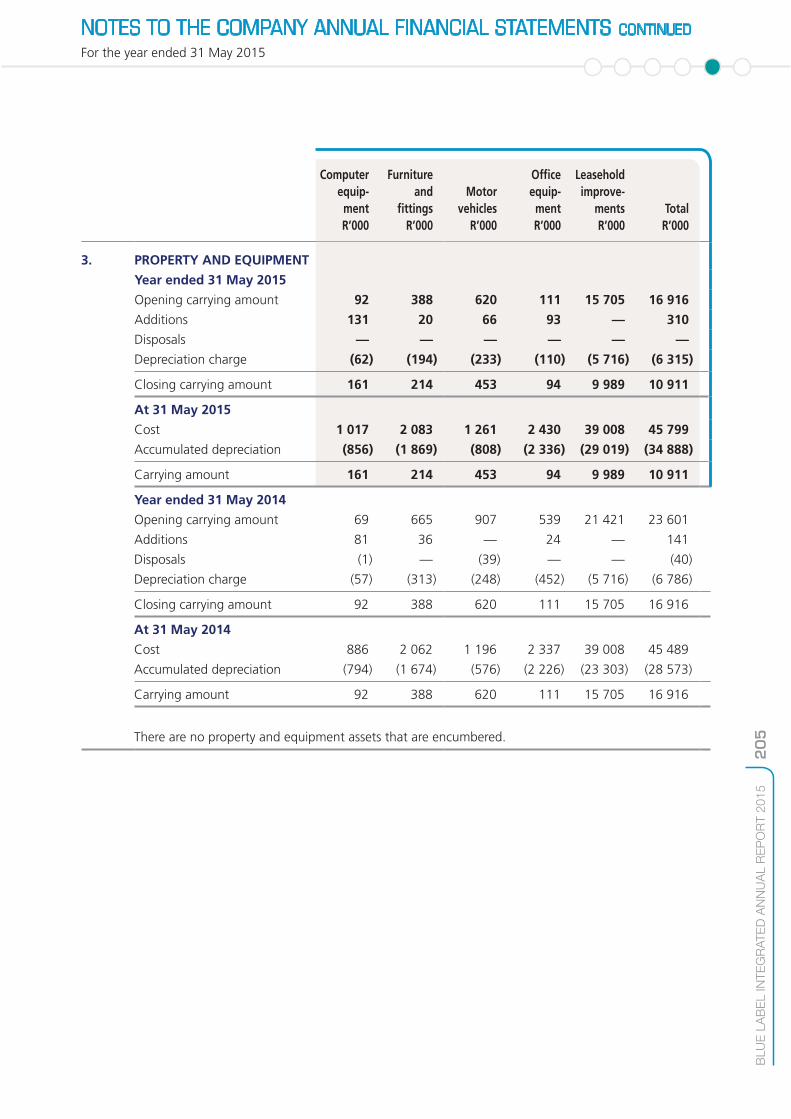
NOTES TO THE COMPANY ANNUAL FINANCIAL STATEMENTS CONTINUED
For the year ended 31 May 2015
205
BLU
E L
AB
EL IN
TE
GR
AT
ED
AN
NU
AL R
EP
OR
T 2
01
5
3. PROPERTY AND EQUIPMENT
Year ended 31 May 2015
Opening carrying amount 92 388 620 111 15 705 16 916
Additions 131 20 66 93 — 310
Disposals — — — — — —
Depreciation charge (62) (194) (233) (110) (5 716) (6 315)
Closing carrying amount 161 214 453 94 9 989 10 911
At 31 May 2015
Cost 1 017 2 083 1 261 2 430 39 008 45 799
Accumulated depreciation (856) (1 869) (808) (2 336) (29 019) (34 888)
Carrying amount 161 214 453 94 9 989 10 911
Year ended 31 May 2014
Opening carrying amount 69 665 907 539 21 421 23 601
Additions 81 36 — 24 — 141
Disposals (1) — (39) — — (40)
Depreciation charge (57) (313) (248) (452) (5 716) (6 786)
Closing carrying amount 92 388 620 111 15 705 16 916
At 31 May 2014
Cost 886 2 062 1 196 2 337 39 008 45 489
Accumulated depreciation (794) (1 674) (576) (2 226) (23 303) (28 573)
Carrying amount 92 388 620 111 15 705 16 916
There are no property and equipment assets that are encumbered.
Computerequip-mentR’000
Furnitureand
fittingsR’000
Motorvehicles
R’000
Officeequip-mentR’000
Leaseholdimprove-
mentsR’000
TotalR’000
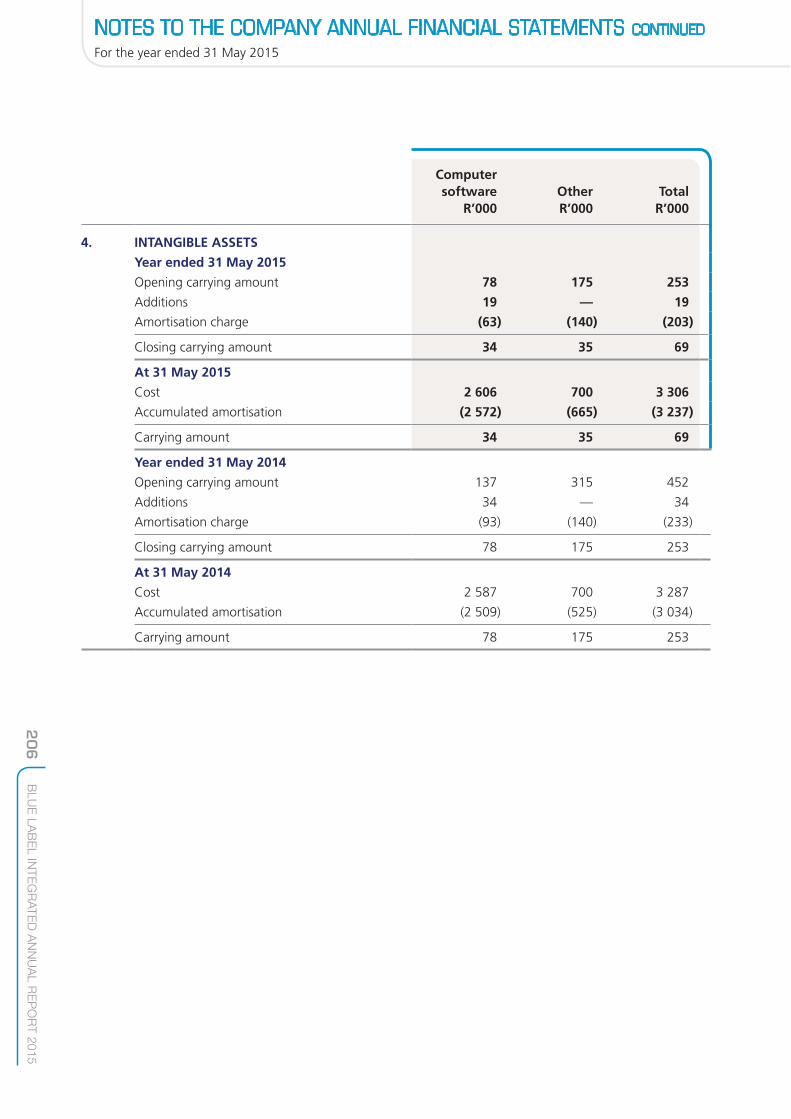
NOTES TO THE COMPANY ANNUAL FINANCIAL STATEMENTS CONTINUED
For the year ended 31 May 2015
206
BLU
E L
AB
EL IN
TE
GR
AT
ED
AN
NU
AL R
EP
OR
T 2
01
5
4. INTANGIBLE ASSETS
Year ended 31 May 2015
Opening carrying amount 78 175 253
Additions 19 — 19
Amortisation charge (63) (140) (203)
Closing carrying amount 34 35 69
At 31 May 2015
Cost 2 606 700 3 306
Accumulated amortisation (2 572) (665) (3 237)
Carrying amount 34 35 69
Year ended 31 May 2014
Opening carrying amount 137 315 452
Additions 34 — 34
Amortisation charge (93) (140) (233)
Closing carrying amount 78 175 253
At 31 May 2014
Cost 2 587 700 3 287
Accumulated amortisation (2 509) (525) (3 034)
Carrying amount 78 175 253
Computer software
R’000OtherR’000
TotalR’000
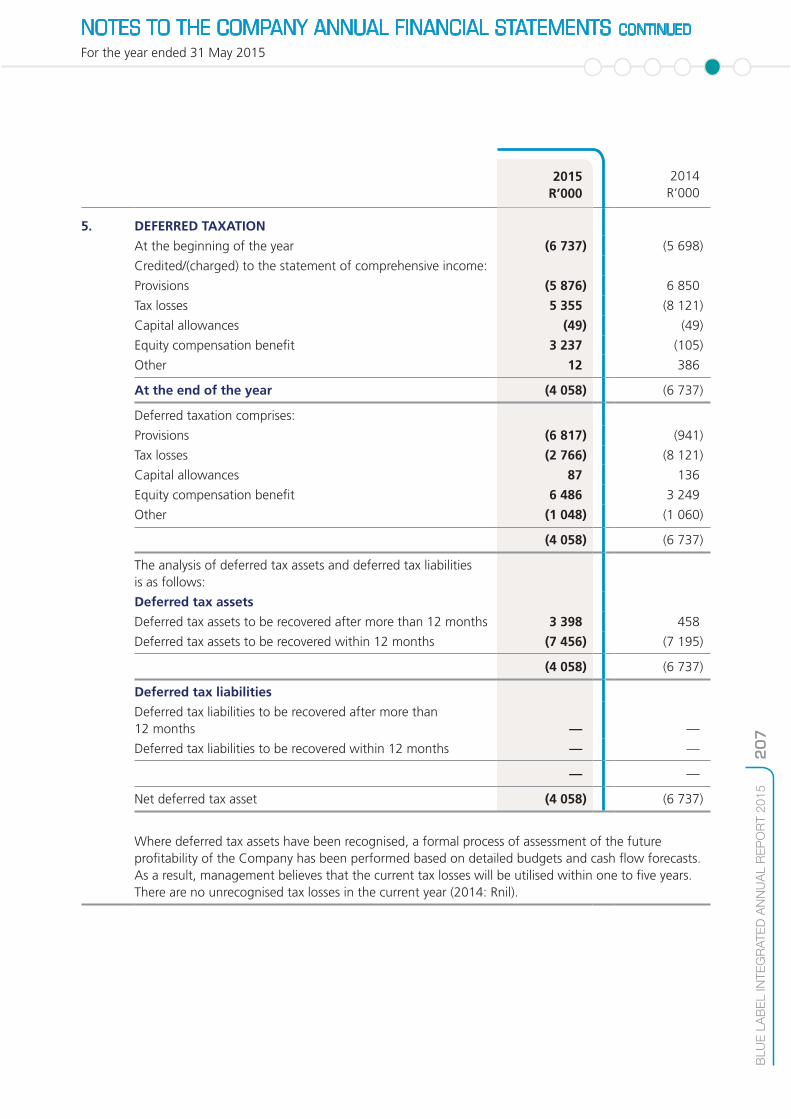
NOTES TO THE COMPANY ANNUAL FINANCIAL STATEMENTS CONTINUED
For the year ended 31 May 2015
207
BLU
E L
AB
EL IN
TE
GR
AT
ED
AN
NU
AL R
EP
OR
T 2
01
5
2014R’000
5. DEFERRED TAXATION
At the beginning of the year (6 737) (5 698)
Credited/(charged) to the statement of comprehensive income:
Provisions (5 876) 6 850
Tax losses 5 355 (8 121)
Capital allowances (49) (49)
Equity compensation benefit 3 237 (105)
Other 12 386
At the end of the year (4 058) (6 737)
Deferred taxation comprises:
Provisions (6 817) (941)
Tax losses (2 766) (8 121)
Capital allowances 87 136
Equity compensation benefit 6 486 3 249
Other (1 048) (1 060)
(4 058) (6 737)
The analysis of deferred tax assets and deferred tax liabilities is as follows:
Deferred tax assets
Deferred tax assets to be recovered after more than 12 months 3 398 458
Deferred tax assets to be recovered within 12 months (7 456) (7 195)
(4 058) (6 737)
Deferred tax liabilities
Deferred tax liabilities to be recovered after more than 12 months — —
Deferred tax liabilities to be recovered within 12 months — —
— —
Net deferred tax asset (4 058) (6 737)
Where deferred tax assets have been recognised, a formal process of assessment of the future profitability of the Company has been performed based on detailed budgets and cash flow forecasts. As a result, management believes that the current tax losses will be utilised within one to five years. There are no unrecognised tax losses in the current year (2014: Rnil).
2015R’000

NOTES TO THE COMPANY ANNUAL FINANCIAL STATEMENTS CONTINUED
For the year ended 31 May 2015
208
BLU
E L
AB
EL IN
TE
GR
AT
ED
AN
NU
AL R
EP
OR
T 2
01
5
2014R’000
6. INVESTMENTS IN GROUP COMPANIES AND RELATED LOANS6.1 Investments in and loans to subsidiaries
Shares at cost less amounts written off 3 240 227 3 012 304Loans owing by subsidiaries less amounts written off 976 31 565
3 241 203 3 043 869
In the current year Viamedia Proprietary Limited was acquired. Refer to note 26 of the Group annual financial statements.
In the current year Blue Label Engage Proprietary Limited was disposed of for R2.4 million. The loss on disposal of R333 676 is included in other expenses in the statement of comprehensive income. Refer to note 25 of the Group annual financial statements.
Details are reflected below:
2015Activi Deployment Services Proprietary Limited 5 060 — — Africa Prepaid Services Proprietary Limited 61 520 87 898 (149 418) Africa Prepaid Services Nigeria Limited 14 000 28 740 (42 740) Blue Label Distribution Proprietary Limited** 194 000 — — Blue Label Investments Proprietary Limited 108 416 — — Blue Label One Proprietary Limited 40 000 — — BLT USA Inc. 307 — — Budding Trade Proprietary Limited** 6 000 — — Cellfind SA Proprietary Limited 290 000 — (141 841) Cigicell Proprietary Limited 295 — — Datacel Direct Proprietary Limited 150 000 — (16 073) Gold Label Investments Proprietary Limited 29 400 95 683 (121 148) Kwikpay SA Proprietary Limited** 22 500 — — Matragon Proprietary Limited** * — — Panacea Mobile Proprietary Limited 27 480 — — Simigenix Proprietary Limited * — — The Post Paid Company Proprietary Limited** 1 500 — — The Prepaid Company Proprietary Limited** 2 150 215 — — TicketPros Proprietary Limited** 14 700 — — Transaction Junction Proprietary Limited 4 200 — — Uninex Proprietary Limited * 976 — Velociti Proprietary Limited 7 185 — — Ventury Group Proprietary Limited** 98 406 — — Viamedia Proprietary Limited 229 158 — — Virtual Voucher Proprietary Limited** 44 784 — —
3 499 126 213 297 (471 220)
* Less than R1 000.** These investments have been pledged as security to Investec Bank Limited in terms of the facility. For details on
percentage held, country of incorporation and issued shares, refer to note 34 in the Group notes. Refer to notes 15 and 21 for details on impairments.
All loans are interest free and repayable on demand.
2015R’000
Shares atcost
Loansowing by
subsidiariesR’000
Provisionfor
impairmentR’000
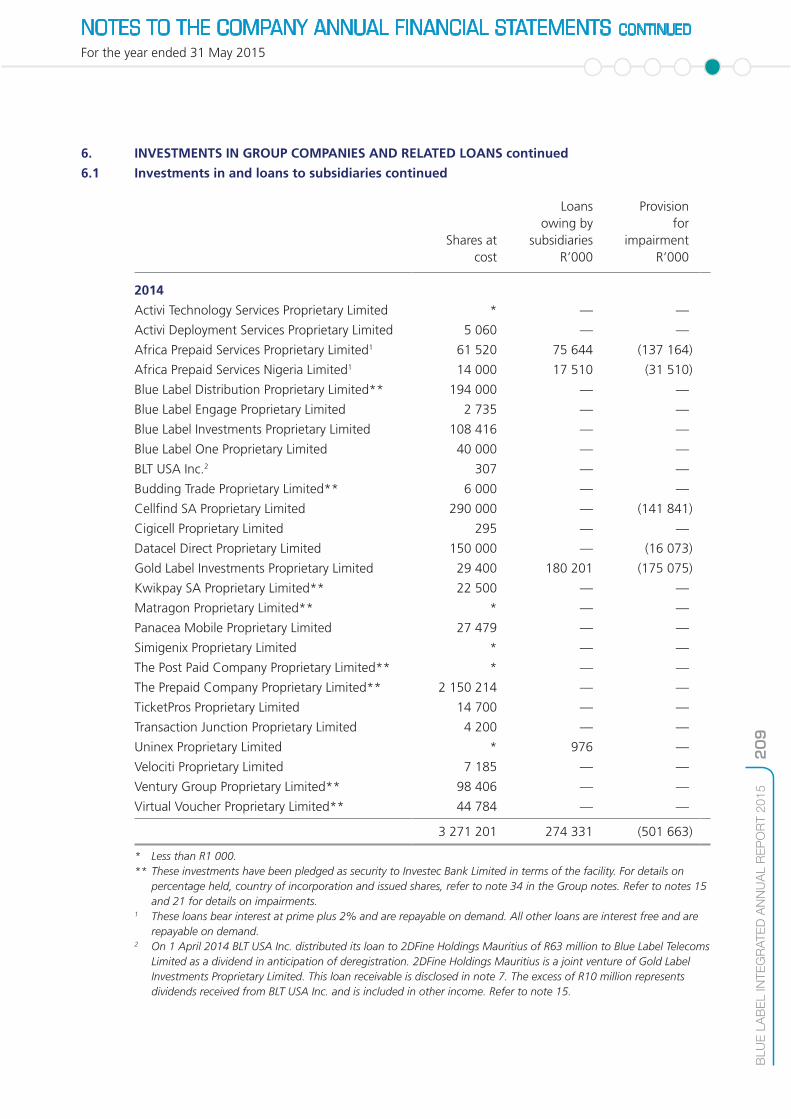
NOTES TO THE COMPANY ANNUAL FINANCIAL STATEMENTS CONTINUED
For the year ended 31 May 2015
209
BLU
E L
AB
EL IN
TE
GR
AT
ED
AN
NU
AL R
EP
OR
T 2
01
5
6. INVESTMENTS IN GROUP COMPANIES AND RELATED LOANS continued
6.1 Investments in and loans to subsidiaries continued
Shares atcost
Loansowing by
subsidiariesR’000
Provisionfor
impairmentR’000
2014
Activi Technology Services Proprietary Limited * — —
Activi Deployment Services Proprietary Limited 5 060 — —
Africa Prepaid Services Proprietary Limited1 61 520 75 644 (137 164)
Africa Prepaid Services Nigeria Limited1 14 000 17 510 (31 510)
Blue Label Distribution Proprietary Limited** 194 000 — —
Blue Label Engage Proprietary Limited 2 735 — —
Blue Label Investments Proprietary Limited 108 416 — —
Blue Label One Proprietary Limited 40 000 — —
BLT USA Inc.2 307 — —
Budding Trade Proprietary Limited** 6 000 — —
Cellfind SA Proprietary Limited 290 000 — (141 841)
Cigicell Proprietary Limited 295 — —
Datacel Direct Proprietary Limited 150 000 — (16 073)
Gold Label Investments Proprietary Limited 29 400 180 201 (175 075)
Kwikpay SA Proprietary Limited** 22 500 — —
Matragon Proprietary Limited** * — —
Panacea Mobile Proprietary Limited 27 479 — —
Simigenix Proprietary Limited * — —
The Post Paid Company Proprietary Limited** * — —
The Prepaid Company Proprietary Limited** 2 150 214 — —
TicketPros Proprietary Limited 14 700 — —
Transaction Junction Proprietary Limited 4 200 — —
Uninex Proprietary Limited * 976 —
Velociti Proprietary Limited 7 185 — —
Ventury Group Proprietary Limited** 98 406 — —
Virtual Voucher Proprietary Limited** 44 784 — —
3 271 201 274 331 (501 663)
* Less than R1 000.** These investments have been pledged as security to Investec Bank Limited in terms of the facility. For details on
percentage held, country of incorporation and issued shares, refer to note 34 in the Group notes. Refer to notes 15 and 21 for details on impairments.
1 These loans bear interest at prime plus 2% and are repayable on demand. All other loans are interest free and are repayable on demand.
2 On 1 April 2014 BLT USA Inc. distributed its loan to 2DFine Holdings Mauritius of R63 million to Blue Label Telecoms Limited as a dividend in anticipation of deregistration. 2DFine Holdings Mauritius is a joint venture of Gold Label Investments Proprietary Limited. This loan receivable is disclosed in note 7. The excess of R10 million represents dividends received from BLT USA Inc. and is included in other income. Refer to note 15.

NOTES TO THE COMPANY ANNUAL FINANCIAL STATEMENTS CONTINUED
For the year ended 31 May 2015
210
BLU
E L
AB
EL IN
TE
GR
AT
ED
AN
NU
AL R
EP
OR
T 2
01
5
6. INVESTMENTS IN GROUP COMPANIES AND RELATED LOANS continued
6.1 Investments in and loans to subsidiaries continued
In the current year Viamedia Proprietary Limited was acquired. Refer to note 26 in the Group notes for details of these acquisitions.
In the current year Blue Label Engage was disposed of for R2.4 million. The loss on disposal of R333 676 is included in other expenses in the statement of comprehensive income. Refer to note 25 of the Group notes for further details.
2014R’000
6.2 Investments in and loans to joint ventures and associates
Shares as at the beginning of the year 254 142 164 826
Acquisition of joint venture and associate 50 033 89 316
Shares as at the end of the year 304 175 254 142
Loans at the beginning of the year 1 054 —
Loan granted to joint venture capitalised (50 033) (89 316)
Loans granted to joint venture 48 979 86 819
Unrealised foreign exchange profit on loans to joint ventures — 3 551
Loans at the end of the year — 1 054
Closing net book value 304 175 255 196
On 10 September 2013 a loan of R85.8 million was advanced to Blue Label Mexico S.A. de C.V. (BLM). This loan was capitalised on 18 December 2013. The difference of R3.5 million relates to foreign exchange movements.
There was no impairment of investment in joint ventures. The terminal growth rates applied was 3.5% (2014: 3.5%). The weighted average cost of capital used to discount these cash flows was 18.46% (2014: 17.44%). The discount rates used are pre-tax and reflect specific risks relating to the relevant companies.
The discount rate used when calculating the value-in-use calculations would need to be increased by 2.25% before any impairments would need to be recognised. Refer to note 6 of the Group annual financial statements.
2015R’000

NOTES TO THE COMPANY ANNUAL FINANCIAL STATEMENTS CONTINUED
For the year ended 31 May 2015
211
BLU
E L
AB
EL IN
TE
GR
AT
ED
AN
NU
AL R
EP
OR
T 2
01
5
6. INVESTMENTS IN GROUP COMPANIES AND RELATED LOANS continued
6.2 Investments in and loans to joint ventures and associates continued
Loans to joint venture
Interestrate
2014R’000
Blue Label Mexico S.A. de C.V. 4.50% — 1 054
— — 1 054
The loans are neither past due nor impaired with a low risk of default.
Loans to joint ventures have no fixed terms of repayment.
Shares in associate and joint venture acquired during the year:
Dateacquired
Country ofincorporation
Percentageinterest
acquired
Lornanox Proprietary Limited Associate 22 January 2015
South Africa 40
Blue Label Mexico S.A. de C.V.* Joint venture 1 September2014
Mexico 1.07
* In the current year, there was a further capital contribution of R50 million to BLM. This comprised R49 million loaned in September 2014 together with the R1 million loan outstanding at the beginning of the financial year. This resulted in a dilution of shares held by an outside shareholder increasing our shareholding to 46.64%.
2015
Blue Label Mexico S.A. de C.V. 334 270 94 773 3 526 421 (186 156)
Lornanox Proprietary Limited — — — —
2014
Blue Label Mexico S.A. de C.V. 393 801 58 777 2 865 340 (131 465)
2015R’000
AssetsR’000
LiabilitiesR’000
RevenuesR’000
LossR’000
2014R’000
7. LOAN RECEIVABLE
Interest-bearing loan receivable 80 672 63 035
80 672 63 035
Interest-bearing loans bear interest at 10% per annum.
The loans receivable are neither past due nor impaired with a low risk of default. Loan receivable balance is from a related party (refer to note 21).
2015R’000
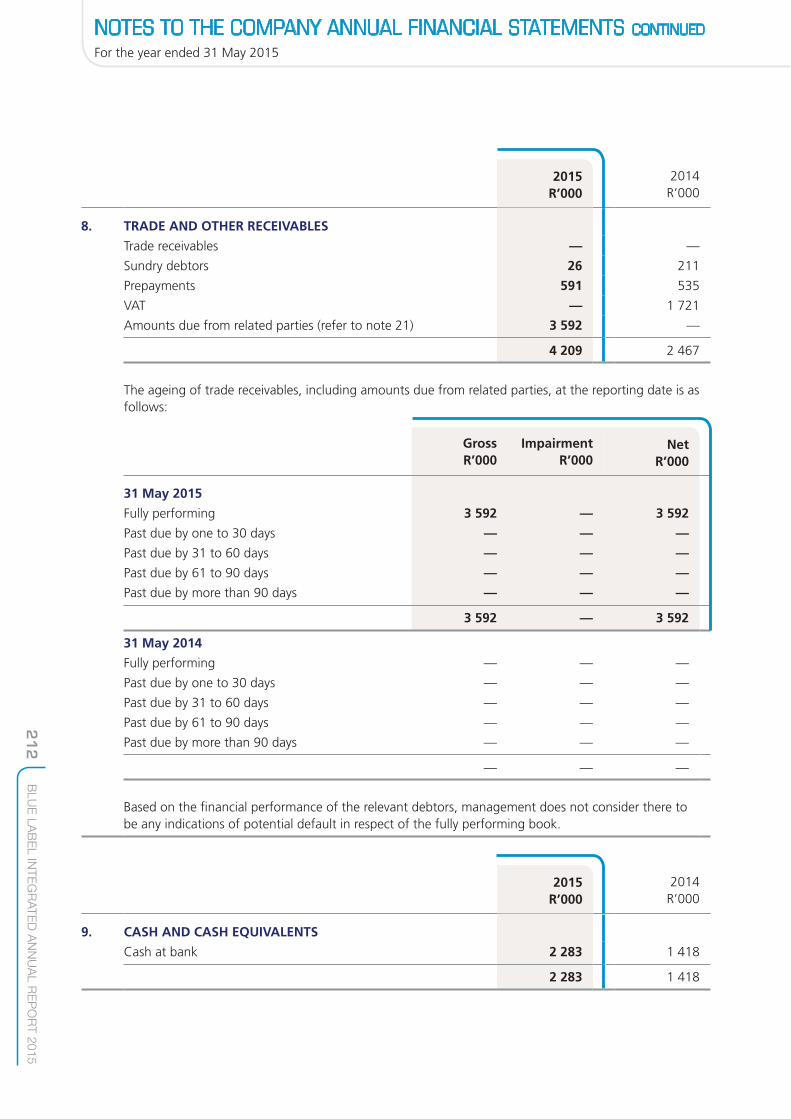
NOTES TO THE COMPANY ANNUAL FINANCIAL STATEMENTS CONTINUED
For the year ended 31 May 2015
212
BLU
E L
AB
EL IN
TE
GR
AT
ED
AN
NU
AL R
EP
OR
T 2
01
5
2015R’000
2014R’000
8. TRADE AND OTHER RECEIVABLES
Trade receivables — —
Sundry debtors 26 211
Prepayments 591 535
VAT — 1 721
Amounts due from related parties (refer to note 21) 3 592 —
4 209 2 467
The ageing of trade receivables, including amounts due from related parties, at the reporting date is as follows:
GrossR’000
ImpairmentR’000
NetR’000
31 May 2015
Fully performing 3 592 — 3 592
Past due by one to 30 days — — —
Past due by 31 to 60 days — — —
Past due by 61 to 90 days — — —
Past due by more than 90 days — — —
3 592 — 3 592
31 May 2014
Fully performing — — —
Past due by one to 30 days — — —
Past due by 31 to 60 days — — —
Past due by 61 to 90 days — — —
Past due by more than 90 days — — —
— — —
Based on the financial performance of the relevant debtors, management does not consider there to be any indications of potential default in respect of the fully performing book.
2015R’000
2014R’000
9. CASH AND CASH EQUIVALENTS
Cash at bank 2 283 1 418
2 283 1 418
2015R’000
NetR’000

NOTES TO THE COMPANY ANNUAL FINANCIAL STATEMENTS CONTINUED
For the year ended 31 May 2015
213
BLU
E L
AB
EL IN
TE
GR
AT
ED
AN
NU
AL R
EP
OR
T 2
01
5
2015Number
of shares
2014Number
of shares2015
R’0002014R’000
10. SHARE CAPITAL
Authorised
Total authorised share capital of ordinary shares (par value of R0.000001 each) 1 000 000 000 1 000 000 000 1 1
Issued
Balance at the beginning of the year 663 896 358 661 635 258 * *
Shares acquired during the year (2 252 420) (1 368 822) * *
Shares vested during the year – Blue Label Telecoms Limited 1 811 995 1 817 292 * *
Shares vested during the year – Blue Label Telecoms Limited
subsidiaries 2 007 413 1 812 630 * *
Balance at the end of the year 665 463 346 663 896 358 * *
* Less than R1 000.
All issued shares are fully paid up.
The total number of shares in issue, including shares held as treasury shares as at 31 May 2015, is 674 509 042 (2014: 674 509 042).
The Company acquired 2 252 420 (2014: 1 368 822 ) shares at an average price of R8.49 (2014: R8.12) on the JSE in order to grant forfeitable shares to employees and Directors.
The amount paid to acquire these shares was R19 131 983 (2014: R11 120 071) and has been deducted from shareholders’ equity.
These shares are held as “treasury shares”. Refer to note 11 for details on the forfeitable shares.
2015R’000
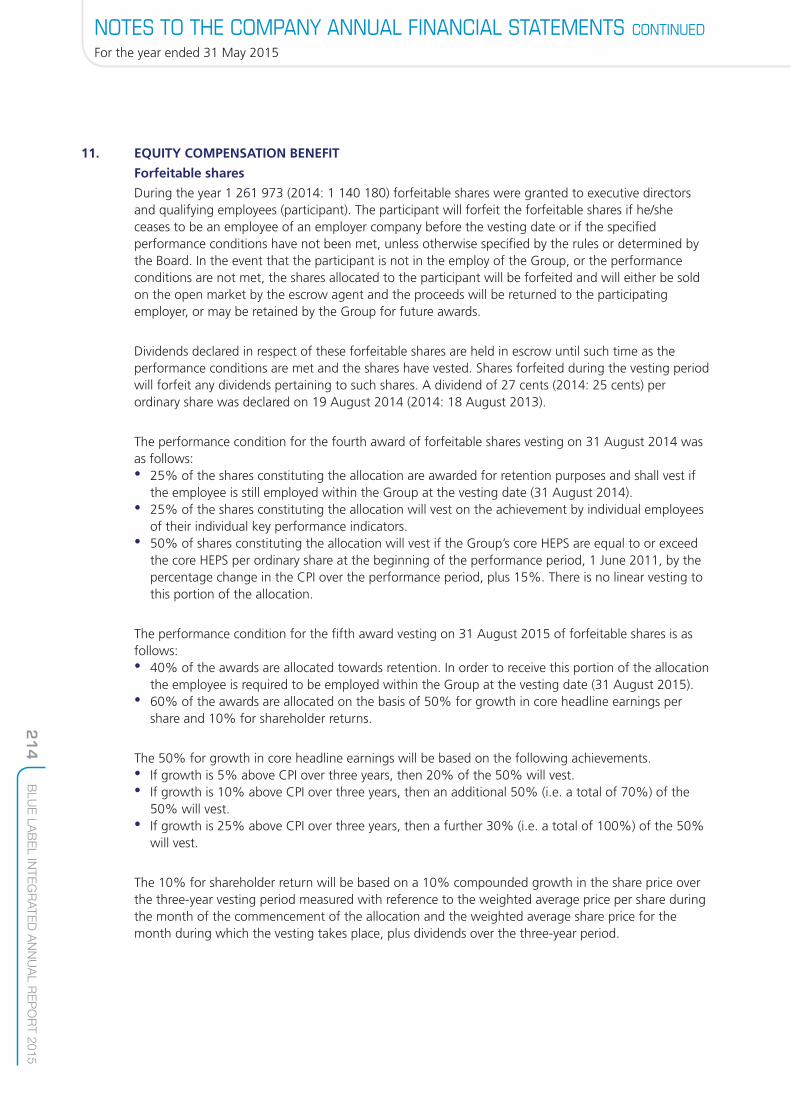
For the year ended 31 May 2015
214
BLU
E L
AB
EL IN
TE
GR
AT
ED
AN
NU
AL R
EP
OR
T 2
01
5
NOTES TO THE COMPANY ANNUAL FINANCIAL STATEMENTS CONTINUED
11. EQUITY COMPENSATION BENEFIT
Forfeitable shares
During the year 1 261 973 (2014: 1 140 180) forfeitable shares were granted to executive directors and qualifying employees (participant). The participant will forfeit the forfeitable shares if he/she ceases to be an employee of an employer company before the vesting date or if the specified performance conditions have not been met, unless otherwise specified by the rules or determined by the Board. In the event that the participant is not in the employ of the Group, or the performance conditions are not met, the shares allocated to the participant will be forfeited and will either be sold on the open market by the escrow agent and the proceeds will be returned to the participating employer, or may be retained by the Group for future awards.
Dividends declared in respect of these forfeitable shares are held in escrow until such time as the performance conditions are met and the shares have vested. Shares forfeited during the vesting period will forfeit any dividends pertaining to such shares. A dividend of 27 cents (2014: 25 cents) per ordinary share was declared on 19 August 2014 (2014: 18 August 2013).
The performance condition for the fourth award of forfeitable shares vesting on 31 August 2014 was as follows: • 25% of the shares constituting the allocation are awarded for retention purposes and shall vest if
the employee is still employed within the Group at the vesting date (31 August 2014). • 25% of the shares constituting the allocation will vest on the achievement by individual employees
of their individual key performance indicators. • 50% of shares constituting the allocation will vest if the Group’s core HEPS are equal to or exceed
the core HEPS per ordinary share at the beginning of the performance period, 1 June 2011, by the percentage change in the CPI over the performance period, plus 15%. There is no linear vesting to this portion of the allocation.
The performance condition for the fifth award vesting on 31 August 2015 of forfeitable shares is as follows: • 40% of the awards are allocated towards retention. In order to receive this portion of the allocation
the employee is required to be employed within the Group at the vesting date (31 August 2015). • 60% of the awards are allocated on the basis of 50% for growth in core headline earnings per
share and 10% for shareholder returns.
The 50% for growth in core headline earnings will be based on the following achievements. • If growth is 5% above CPI over three years, then 20% of the 50% will vest. • If growth is 10% above CPI over three years, then an additional 50% (i.e. a total of 70%) of the
50% will vest. • If growth is 25% above CPI over three years, then a further 30% (i.e. a total of 100%) of the 50%
will vest.
The 10% for shareholder return will be based on a 10% compounded growth in the share price over the three-year vesting period measured with reference to the weighted average price per share during the month of the commencement of the allocation and the weighted average share price for the month during which the vesting takes place, plus dividends over the three-year period.
NOTES TO THE COMPANY ANNUAL FINANCIAL STATEMENTS CONTINUED
For the year ended 31 May 2015
215
BLU
E L
AB
EL IN
TE
GR
AT
ED
AN
NU
AL R
EP
OR
T 2
01
5
11. EQUITY COMPENSATION BENEFIT continued
Forfeitable shares continued
The performance condition for the sixth award vesting on 31 August 2016 of forfeitable shares is as follows: • 40% of the awards are allocated towards retention. In order to receive this portion of the allocation
the employee is required to be employed within the Group at the vesting date (31 August 2016). • 60% of the awards are allocated on the basis of 50% for growth in core headline earnings per
share and 10% for shareholder returns.
The 50% for growth in core headline earnings will be based on the following achievements: • If growth is 5% above CPI over three years, then 20% of the 50% will vest. • If growth is 10% above CPI over three years, then an additional 50% (i.e. a total of 70%) of the
50% will vest. • If growth is 25% above CPI over three years, then a further 30% (i.e. a total of 100%) of the 50%
will vest.
The 10% for shareholder return will be based on a 10% compounded growth in the share price over the three-year vesting period measured with reference to the weighted average price per share during the month of the commencement of the allocation and the weighted average share price for the month during which the vesting takes place, plus dividends over the three-year period.
The performance condition for the seventh award vesting on 31 August 2017 of forfeitable shares is as follows: • 40% of the awards are allocated towards retention. In order to receive this portion of the allocation
the employee is required to be employed within the Group at the vesting date (31 August 2017). • 60% of the awards are allocated on the basis of 50% for growth in core headline earnings per
share and 10% for shareholder returns.
The 50% for growth in core headline earnings will be based on the following achievements: • If growth is 5% above CPI over three years, 20% of the 50% will vest. • If growth is 10% above CPI over three years, an additional 50% (i.e. a total of 70%) of the 50%
will vest. • If growth is 25% above CPI over three years, a further 30% (i.e. a total of 100%) of the 50% will
vest.
The 10% for shareholder return will be based on a 10% compounded growth in the share price over the three-year vesting period measured with reference to the weighted average price per share during the month of the commencement of the allocation and the weighted average share price for the month during which the vesting takes place, plus dividends over the three-year period.

NOTES TO THE COMPANY ANNUAL FINANCIAL STATEMENTS CONTINUED
For the year ended 31 May 2015
216
BLU
E L
AB
EL IN
TE
GR
AT
ED
AN
NU
AL R
EP
OR
T 2
01
5
11. EQUITY COMPENSATION BENEFIT continued
Forfeitable shares continued
Movements in the number of forfeitable shares outstanding during the year are as follows:
At 31 May 2013 5 379 330 27 792
Third award 1 888 167 8 874
Fourth award 2 039 590 9 178
Fifth award 1 451 573 9 740
Granted during the year 1 140 180 9 977
Sixth award 2 September 2013 31 August 2016 1 140 180 9 977
Shares forfeited during the year (461 206) (2 449)
Third award (70 875) (333)
Fourth award (227 595) (1 024)
Fifth award (162 737) (1 092)
Shares vested during the year (1 817 292) (8 541)
Third award 31 August 2013 (1 817 292) (8 541)
At 31 May 2014 4 241 011 26 779
Fourth award 1 811 995 8 154
Fifth award 1 288 836 8 648
Sixth award 1 140 180 9 977
Granted during the year 1 261 973 11 232
Seventh award 3 September 2014 31 August 2017 1 261 973 11 232
Shares vested during the year (1 811 995) (8 154)
Fourth award 31 August 2014 (1 811 995) (8 154)
At 31 May 2015 3 690 989 29 857
Fifth award 1 288 836 8 648
Sixth award 1 140 180 9 977
Seventh award 1 261 973 11 232
Refer to note 14 for the expense recognised in the statement of comprehensive income relating to the equity compensation benefits.
The fair value of the shares is based on the value paid for the shares on the open market at grant date.
The total number of forfeitable shares issued to executive directors during the period is 955 617 (2014: 1 010 060).
The share-based payment expense in relation to these executive directors is R8.9 million (2014: R5.6 million).
Included in this is R659 000 (2014: R659 000) paid by subsidiaries.
Refer to note 30 of the Group annual financial statements for details per Director.
Grant date
Vesting date
Number of shares
Fair valueof grant
R’000
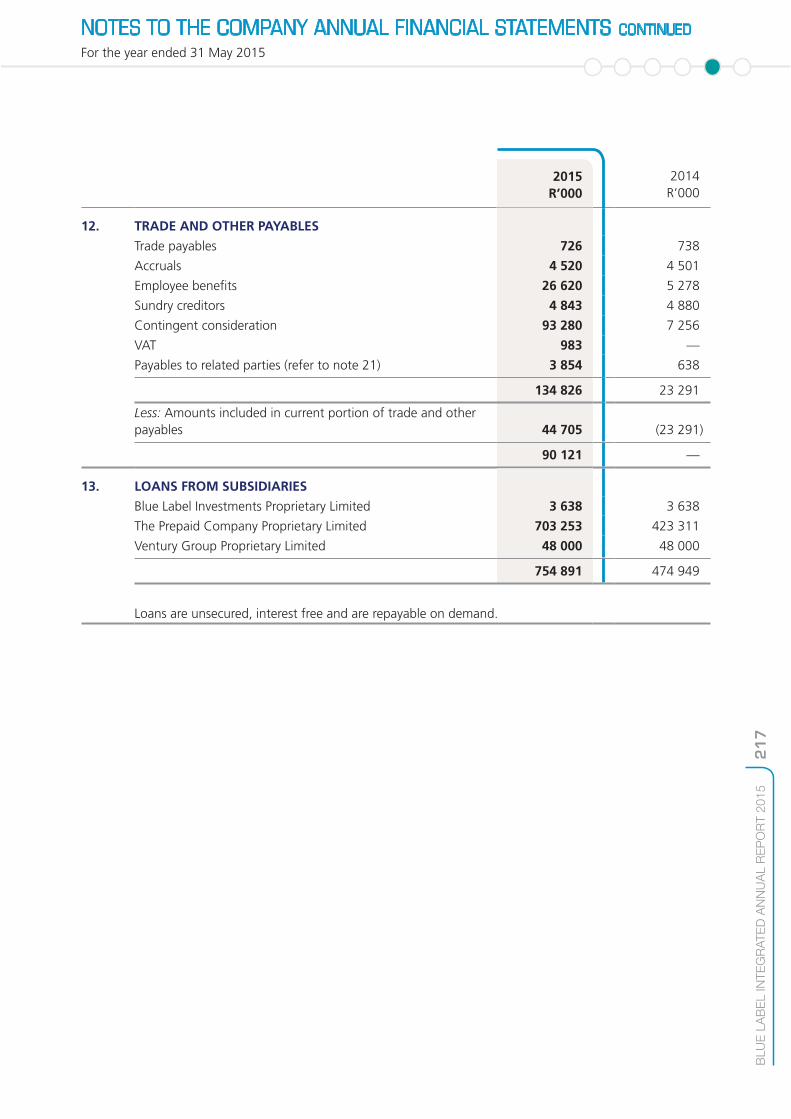
For the year ended 31 May 2015
217
BLU
E L
AB
EL IN
TE
GR
AT
ED
AN
NU
AL R
EP
OR
T 2
01
5
NOTES TO THE COMPANY ANNUAL FINANCIAL STATEMENTS CONTINUED
2014R’000
12. TRADE AND OTHER PAYABLES
Trade payables 726 738
Accruals 4 520 4 501
Employee benefits 26 620 5 278
Sundry creditors 4 843 4 880
Contingent consideration 93 280 7 256
VAT 983 —
Payables to related parties (refer to note 21) 3 854 638
134 826 23 291
Less: Amounts included in current portion of trade and other payables 44 705 (23 291)
90 121 —
13. LOANS FROM SUBSIDIARIES
Blue Label Investments Proprietary Limited 3 638 3 638
The Prepaid Company Proprietary Limited 703 253 423 311
Ventury Group Proprietary Limited 48 000 48 000
754 891 474 949
Loans are unsecured, interest free and are repayable on demand.
2015R’000
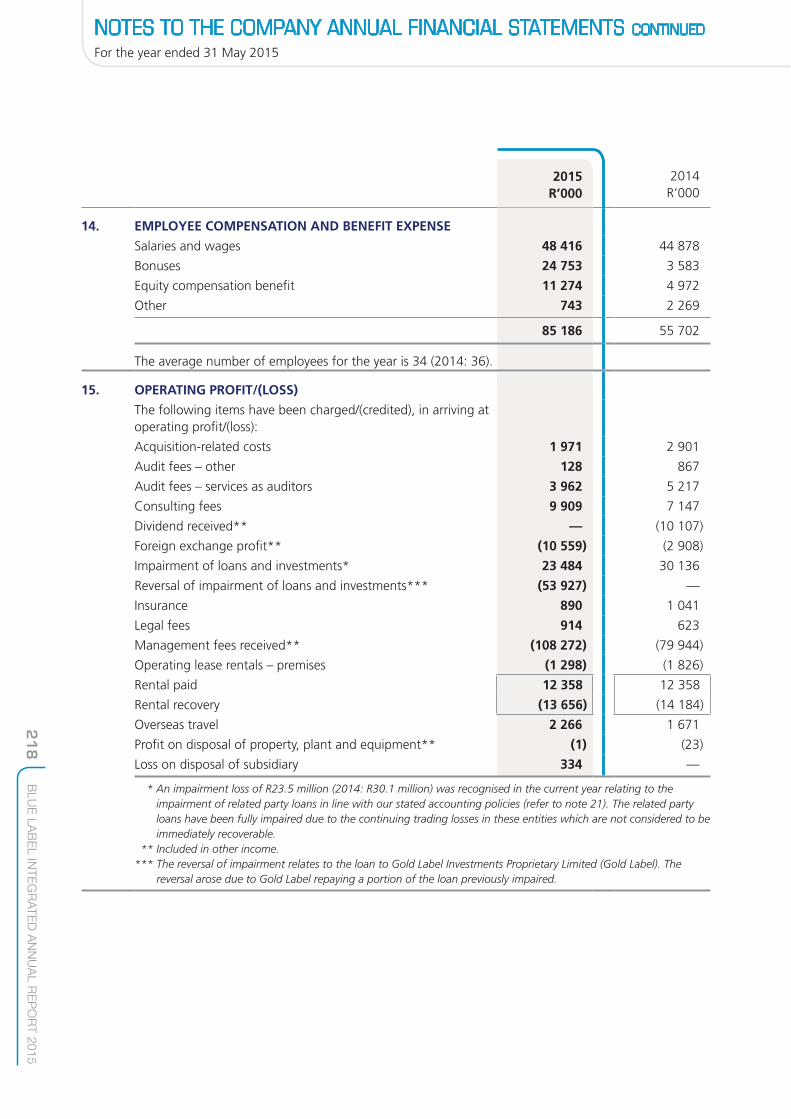
For the year ended 31 May 2015
218
BLU
E L
AB
EL IN
TE
GR
AT
ED
AN
NU
AL R
EP
OR
T 2
01
5
NOTES TO THE COMPANY ANNUAL FINANCIAL STATEMENTS CONTINUED
2014R’000
14. EMPLOYEE COMPENSATION AND BENEFIT EXPENSE
Salaries and wages 48 416 44 878
Bonuses 24 753 3 583
Equity compensation benefit 11 274 4 972
Other 743 2 269
85 186 55 702
The average number of employees for the year is 34 (2014: 36).
15. OPERATING PROFIT/(LOSS)
The following items have been charged/(credited), in arriving at operating profit/(loss):
Acquisition-related costs 1 971 2 901
Audit fees – other 128 867
Audit fees – services as auditors 3 962 5 217
Consulting fees 9 909 7 147
Dividend received** — (10 107)
Foreign exchange profit** (10 559) (2 908)
Impairment of loans and investments* 23 484 30 136
Reversal of impairment of loans and investments*** (53 927) —
Insurance 890 1 041
Legal fees 914 623
Management fees received** (108 272) (79 944)
Operating lease rentals – premises (1 298) (1 826)
Rental paid 12 358 12 358
Rental recovery (13 656) (14 184)
Overseas travel 2 266 1 671
Profit on disposal of property, plant and equipment** (1) (23)
Loss on disposal of subsidiary 334 —
* An impairment loss of R23.5 million (2014: R30.1 million) was recognised in the current year relating to the impairment of related party loans in line with our stated accounting policies (refer to note 21). The related party loans have been fully impaired due to the continuing trading losses in these entities which are not considered to be immediately recoverable.
** Included in other income.*** The reversal of impairment relates to the loan to Gold Label Investments Proprietary Limited (Gold Label). The
reversal arose due to Gold Label repaying a portion of the loan previously impaired.
2015R’000

For the year ended 31 May 2015
219
BLU
E L
AB
EL IN
TE
GR
AT
ED
AN
NU
AL R
EP
OR
T 2
01
5
NOTES TO THE COMPANY ANNUAL FINANCIAL STATEMENTS CONTINUED
2014R’000
16. FINANCE COSTS/(INCOME)
Finance costs
– Bank 1 1
– Other 6 283 774
6 284 775
Finance income
– Bank (210) (527)
– Loans (11 586) (7 279)
– Other — —
(11 797) (7 806)
Net finance income (5 513) (7 031)
17. TAXATION
Current tax — 505
Current year — —
Adjustment in respect of prior year — 505
Deferred tax 2 679 (1 040)
Current year 2 608 (1 040)
Adjustment in respect of prior year 71 —
2 679 (535)
Tax rate reconciliation
Net profit/(loss) before tax 47 944 (23 242)
Tax at 28% 13 424 (6 508)
Income not subject to tax (309) (3 882)
Income of a capital nature (6 219) —
Impairment reversal (8 524) —
Expenditure not deductible for tax purposes 4 236 10 190
Adjustment in respect of prior year 71 505
Capital gains tax — (840)
2 679 (535)
Effective tax rate 6% 2%
2015R’000

For the year ended 31 May 2015
220
BLU
E L
AB
EL IN
TE
GR
AT
ED
AN
NU
AL R
EP
OR
T 2
01
5
NOTES TO THE COMPANY ANNUAL FINANCIAL STATEMENTS CONTINUED
2014R’000
18. CASH GENERATED/(UTILISED) BY OPERATIONS
Reconciliation of operating loss to cash flows from operating activities
Operating profit/(loss) 42 431 (30 273)
Adjustments for:
Dividends received — (10 107)
Depreciation of property, plant and equipment 6 315 6 786
Amortisation on intangible assets 203 233
Impairment of loans and investments 23 484 30 136
Reversal of impairment of loans and investments (53 927) —
Profit on disposal of property, plant and equipment (1) (23)
Loss on disposal of subsidiaries 334 —
Equity compensation benefit expense 11 274 4 972
Net unrealised foreign exchange profit (10 503) (2 864)
Changes in working capital:
(Increase)/decrease in trade and other receivables (1 742) 4 723
Increase/(decrease) in trade and other payables 29 965 (21 552)
47 833 (17 969)
19. TAXATION PAID
Balance outstanding at the beginning of the year 377 8 126
Taxation charge — 505
Balance outstanding at the end of the year 271 (377)
648 8 254
20. COMMITMENTS
Future operating lease commitments for:
Premises
Payable within one year 15 195 13 751
Payable in two to five years 12 270 27 465
Payable in greater than five years — —
27 465 41 216
Future funding commitments
The Company has committed to provide funding of R36.4 million to a joint venture.
The commitment is non-binding but has been undertaken with a reasonable expectation of fulfilment.
2015R’000

For the year ended 31 May 2015
221
BLU
E L
AB
EL IN
TE
GR
AT
ED
AN
NU
AL R
EP
OR
T 2
01
5
NOTES TO THE COMPANY ANNUAL FINANCIAL STATEMENTS CONTINUED
21. RELATED PARTY TRANSACTIONS
Related party relationships
For details of subsidiaries and joint ventures, refer to note 33 in the Group notes.
For details of the Company’s Directors, refer to the Directors’ report.
ZOK Cellular Proprietary Limited, BSC Technologies Proprietary Limited, Black Ginger 59 Proprietary Limited, Moneyline 311 Proprietary Limited, aloeCap Proprietary Limited, Stylco Proprietary Limited, Wildekrans Wine Estate Proprietary Limited, Stax Technologies Proprietary Limited, and Ellerine Bros. Proprietary Limited are related parties due to Directors’ shareholdings and the companies having certain common directorships.
For details of the shareholdings in the Company, refer to the Directors’ report.
For details of emoluments to Directors, who are regarded as key management, refer to note 29 of the Group annual financial statements and remuneration report.
The following transactions were carried out with related parties:
20152014R’000
Purchases from related parties
Black Ginger 59 Proprietary Limited 6 659 6 115
BSC Technologies Proprietary Limited — 65
Cellfind SA Proprietary Limited 15 14
Stax Technologies Proprietary Limited 144 26
Stylco Proprietary Limited 50 —
The Prepaid Company Proprietary Limited — 2
Wildekrans Wine Estate Proprietary Limited — 1
ZOK Cellular Proprietary Limited 11 20
Interest received from related parties
Africa Prepaid Services Proprietary Limited 3 128 4 462
Africa Prepaid Services Nigeria Limited 1 286 1 273
2DFine Holdings Mauritius 7 135 527
Blue Label Mexico S.A. de C.V. (18) 1 017
Management fees received from related parties
Activi Deployment Services Proprietary Limited 106 97
Blue Label Distribution Proprietary Limited 3 678 3 343
Blue Label Mexico S.A. de C.V. — 250
Blue Label One Proprietary Limited 540 1 200
Cellfind SA Proprietary Limited 3 827 3 479
Cigicell Proprietary Limited 3 295 2 996
Datacel Direct Proprietary Limited 720 483
The Prepaid Company Proprietary Limited 96 000 68 000
Transaction Junction Proprietary Limited 106 97
2015R’000
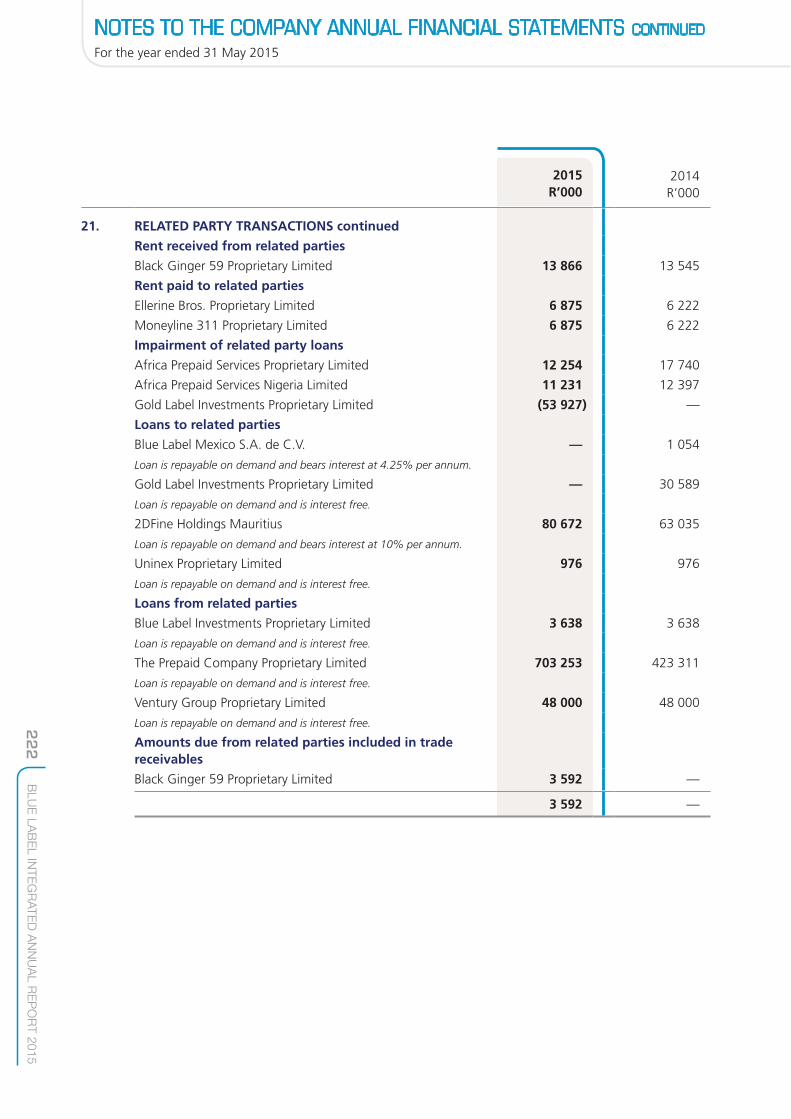
NOTES TO THE COMPANY ANNUAL FINANCIAL STATEMENTS CONTINUED
For the year ended 31 May 2015
222
BLU
E L
AB
EL IN
TE
GR
AT
ED
AN
NU
AL R
EP
OR
T 2
01
5
20152014R’000
21. RELATED PARTY TRANSACTIONS continued
Rent received from related parties
Black Ginger 59 Proprietary Limited 13 866 13 545
Rent paid to related parties
Ellerine Bros. Proprietary Limited 6 875 6 222
Moneyline 311 Proprietary Limited 6 875 6 222
Impairment of related party loans
Africa Prepaid Services Proprietary Limited 12 254 17 740
Africa Prepaid Services Nigeria Limited 11 231 12 397
Gold Label Investments Proprietary Limited (53 927) —
Loans to related parties
Blue Label Mexico S.A. de C.V. — 1 054
Loan is repayable on demand and bears interest at 4.25% per annum.
Gold Label Investments Proprietary Limited — 30 589
Loan is repayable on demand and is interest free.
2DFine Holdings Mauritius 80 672 63 035
Loan is repayable on demand and bears interest at 10% per annum.
Uninex Proprietary Limited 976 976
Loan is repayable on demand and is interest free.
Loans from related parties
Blue Label Investments Proprietary Limited 3 638 3 638
Loan is repayable on demand and is interest free.
The Prepaid Company Proprietary Limited 703 253 423 311
Loan is repayable on demand and is interest free.
Ventury Group Proprietary Limited 48 000 48 000
Loan is repayable on demand and is interest free.
Amounts due from related parties included in trade receivables
Black Ginger 59 Proprietary Limited 3 592 —
3 592 —
2015R’000

NOTES TO THE COMPANY ANNUAL FINANCIAL STATEMENTS CONTINUED
For the year ended 31 May 2015
223
BLU
E L
AB
EL IN
TE
GR
AT
ED
AN
NU
AL R
EP
OR
T 2
01
5
20152014R’000
21. RELATED PARTY TRANSACTIONS continued
Amounts due to related parties included in trade payables
aloeCap Proprietary Limited — 44
Black Ginger 59 Proprietary Limited 1 745 —
KM Ellerine — 84
NN Lazarus — 133
LM Nestadt — 211
Moneyline 311 Proprietary Limited 2 110 —
Unihold Group Proprietary Limited — 95
JS Vilakazi — 71
3 855 638
2015R’000

224
BLU
E L
AB
EL IN
TE
GR
AT
ED
AN
NU
AL R
EP
OR
T 2
01
5
For the year ended 31 May 2015
ANNEXURE TO THE COMPANY ANNUAL FINANCIAL STATEMENTS
SHAREHOLDER ANALYSIS
Shareholder spread
1 – 1 000 shares 767 32.83 340 220 0.05
1 001 – 10 000 shares 962 41.18 3 502 312 0.52
10 001 – 100 000 shares 342 14.64 12 061 420 1.79
100 001 – 1 000 000 shares 181 7.75 63 723 702 9.45
1 000 001 shares and over 84 3.60 594 881 388 88.19
Totals 2 336 100.00 674 509 042 100.00
Distribution of shareholders
Banks 49 2.10 83 926 458 12.44
Close corporations 27 1.16 273 234 0.04
Empowerment 1 0.04 6 863 0.00
Endowment funds 18 0.77 1 875 582 0.28
Individuals 1 768 75.68 144 703 959 21.45
Insurance companies 24 1.03 13 226 946 1.96
Investment companies 8 0.34 13 388 324 1.98
Medical schemes 7 0.30 999 035 0.15
Mutual funds 87 3.72 170 124 195 25.22
Other corporations 10 0.43 47 199 0.01
Private companies 58 2.48 134 813 653 19.99
Public companies 4 0.17 2 413 723 0.36
Retirement funds 117 5.01 64 122 348 9.51
Treasury stock 2 0.09 9 059 727 1.34
Trusts 156 6.68 35 527 796 5.27
Totals 2 336 100.00 674 509 042 100.00
Public/non-public shareholders
Non-public shareholders 22 0.95 290 049 102 43.00
Directors and associates 19 0.82 180 989 375 26.83
Strategic holdings (more than 10%) 1 0.04 100 000 000 14.83
Treasury stock 2 0.09 9 059 727 1.34
Public shareholders 2 314 99.05 384 459 940 57.00
Totals 2 336 100.00 674 509 042 100.00
Number ofshareholdings %
Number of shares %

For the year ended 31 May 2015
225
BLU
E L
AB
EL IN
TE
GR
AT
ED
AN
NU
AL R
EP
OR
T 2
01
5
ANNEXURE TO THE COMPANY ANNUAL FINANCIAL STATEMENTS CONTINUED
SHAREHOLDER ANALYSIS continued
Major holders holding 2% or more (directly or indirectly)
Allan Gray’s clients 158 372 252 23.48
Shotput Investments Proprietary Limited* 100 000 000 14.83
Levy, BM (includes CFDs) 83 821 468 12.43
Levy, MS (includes CFDs) 76 414 059 11.33
Sanlam 21 072 820 3.12
Nedbank Group 18 723 574 2.78
Deutsche Bank 16 189 510 2.40
Peregrine 15 049 854 2.23
36ONE Asset Management 14 907 865 2.21
Grandeur Peak Global Advisors 14 480 320 2.15
Dimensional Fund Advisors 14 418 661 2.14
Government Employees Pension Fund 13 488 848 2.00
Totals 546 939 231 81.09
* A discretionary trust, of which Kevin Ellerine is one of a number of potential beneficiaries, holds an interest in Shotput Investments Proprietary Limited. The indirect beneficial shareholding of Kevin Ellerine as disclosed per the Directors’ Report refers to his effective shareholding in Lucystat Investments Proprietary Limited.
Number of shares %

NOTICE OF ANNUAL GENERAL MEETING
226
BLU
E L
AB
EL IN
TE
GR
AT
ED
AN
NU
AL R
EP
OR
T 2
01
5
BLUE LABEL TELECOMS LIMITED
(Incorporated in the Republic of South Africa)
(Registration number: 2006/022679/06)
Share code: BLU ISIN: ZAE000109088
(Blue Label or the Company)
All terms defined in the integrated annual report 2015, to which this Notice of Annual General Meeting is
attached, shall bear the same meanings when used in this Notice of Annual General Meeting.
NOTICE OF ANNUAL GENERAL MEETING
Notice is hereby given to Blue Label shareholders recorded in the Company’s securities register on Friday,
23 October 2015, that the eighth Annual General Meeting of shareholders of Blue Label Telecoms Limited will
be held in the boardroom, Blue Label corporate offices, 75 Grayston Drive, Sandton, on Friday, 27 November
2015 at 10:00 (South African time) (AGM), to conduct such business as may lawfully be dealt with at the AGM
and to consider and, if deemed fit, pass, with or without modification, the ordinary and special resolutions set
out hereunder in the manner required by the Companies Act, as read with the Listings Requirements.
In terms of section 63(1) of the Act, meeting participants (including proxies) will be required to provide
reasonably satisfactory identification before being entitled to participate in or vote at the AGM. Forms of
identification that will be accepted include original and valid identity documents, driving licences and passports.
RECORD DATES, PROXIES AND VOTING
In terms of sections 59(1)(a) and (b) of the Act, the Board of the Company has set the record date for the
purpose of determining which shareholders are entitled to: • receive notice of the AGM (being the date on which a shareholder must be registered in the Company’s
shareholders’ register in order to receive notice of the AGM) as Friday, 23 October 2015; and • participate in and vote at the AGM (being the date on which a shareholder must be registered in the
Company’s shareholders’ register in order to participate in and vote at the AGM) as Friday, 20 November
2015.
Certificated shareholders or own-name dematerialised shareholders may attend and vote at the AGM, or
alternatively appoint a proxy to attend, speak and, in respect of the applicable resolution(s), vote in their stead
by completing the attached form of proxy and returning it to the transfer secretaries at the address given in the
form of proxy by no later than 10:00 on Wednesday, 25 November 2015.
Shareholders who have dematerialised their shares, other than those shareholders who have dematerialised
their shares with own-name registration, should contact their CSDP or broker in the manner and within the
time stipulated in the agreement entered into between them and their CSDP or broker: to furnish them with
their voting instructions; or in the event that they wish to attend the AGM, to obtain the necessary letter of
representation to do so.
NOTICE OF ANNUAL GENERAL MEETING CONTINUED
227
BLU
E L
AB
EL IN
TE
GR
AT
ED
AN
NU
AL R
EP
OR
T 2
01
5
On a show of hands, every shareholder present in person or represented by proxy and entitled to vote shall have
only one vote irrespective of the number of shares such shareholder holds. On a poll, every shareholder, present
in person or represented by proxy and entitled to vote, shall be entitled to that proportion of the total votes in
the Company which the aggregate amount of the nominal value of the shares held by such shareholder bears
to the aggregate amount of the nominal value of all shares issued by the Company.
Certificated Blue Label shareholders or own-name dematerialised shareholders who are entitled to attend and
vote at the AGM are entitled to appoint a proxy to attend, participate in and vote at the AGM in their stead.
A proxy need not also be a shareholder of the Company. The completion of a form of proxy will not preclude
a shareholder from attending the AGM.
ELECTRONIC PARTICIPATION
Please note that Blue Label will provide for participation by way of electronic communication in the AGM, as set
out in section 63 of the Act. In this regard, please refer to the notes on page 234 at the end of this notice.
When reading the resolutions below, please refer to the explanatory notes on pages 232 to 234.
PRESENTATION OF ANNUAL FINANCIAL STATEMENTS AND REPORTS
The audited Group and Company annual financial statements, including the external auditors’, Audit, Risk and
Compliance Committee’s and Directors’ reports for the year ended 31 May 2015, have been distributed as
required and will be presented to shareholders at the AGM.
The complete set of audited Group and Company annual financial statements, together with the above
mentioned reports, are set out on pages 92 to 223 of this integrated annual report. The Audit, Risk and
Compliance Committee’s report is set out on pages 65 to 68.
ORDINARY RESOLUTIONS
In terms of sections 62(3)(c) and 65(7) of the Act, unless otherwise specified, in order for each of the following
ordinary resolutions to be passed, each resolution must be supported by more than 50% (fifty percent) of the
voting rights exercised.
Director appointed during the year
1. Ordinary resolution number 1: Election of Mr Y Mahomed as a Director of the Company
Resolved that Mr Y Mahomed, be and is hereby elected as a Director of the Company with immediate
effect.
A brief biography of Mr Y Mahomed is on page 20 of this integrated annual report.

228
BLU
E L
AB
EL IN
TE
GR
AT
ED
AN
NU
AL R
EP
OR
T 2
01
5
NOTICE OF ANNUAL GENERAL MEETING CONTINUED
Director retiring by rotation
2. Ordinary resolution number 2: Re-election of Mr GD Harlow as a Director of the Company
Resolved that Mr GD Harlow, who was first appointed to the Board on 5 October 2007 and who retires in
terms of the Memorandum of Incorporation, and who is eligible and available for re-election, is re-elected
as a Director of the Company with immediate effect.
A brief biography of Mr GD Harlow is on page 20 of this integrated annual report.
3. Ordinary resolution number 3: Re-election of Mr SJ Vilakazi as a Director of the Company
Resolved that Mr SJ Vilakazi, who was first appointed to the Board on 19 October 2011 and who retires in
terms of the Memorandum of Incorporation, and who is eligible and available for re-election, is re-elected
as a Director of the Company with immediate effect.
A brief biography of Mr SJ Vilakazi is on page 20 of this integrated annual report.
4. Ordinary resolution number 4: Re-election of Mr KM Ellerine as a Director of the Company
Resolved that Mr KM Ellerine, who was first appointed to the Board on 8 December 2009 and who retires
in terms of the Memorandum of Incorporation, and who is eligible and available for re-election, is
re-elected as a Director of the Company with immediate effect.
A brief biography of Mr KM Ellerine is on page 21 of this integrated annual report.
5. Ordinary resolution number 5: Reappointment of external auditors
Resolved that on the recommendation of the current Audit, Risk and Compliance Committee of the
Company, PricewaterhouseCoopers Incorporated, is reappointed as independent registered auditor of the
Company for the ensuing year until the conclusion of the next AGM of the Company.
6. Ordinary resolution number 6: Election of Mr JS Mthimunye as a member and chairman of the
Audit, Risk and Compliance Committee for the year ending 31 May 2016
Resolved that, in terms of section 94(2) of the Act, Mr JS Mthimunye, an independent non-executive
director of the Company, is elected as a member and the Chairman of the Audit, Risk and Compliance
Committee.
A brief biography of Mr JS Mthimunye is on page 20 of this integrated annual report.
229
BLU
E L
AB
EL IN
TE
GR
AT
ED
AN
NU
AL R
EP
OR
T 2
01
5
NOTICE OF ANNUAL GENERAL MEETING CONTINUED
7. Ordinary resolution number 7: Election of Mr GD Harlow as a member of the Audit, Risk and
Compliance Committee for the year ending 31 May 2016
Resolved that, in terms of section 94(2) of the Act, but subject to his election as a Director of the Company
in terms of original resolution number 2, Mr GD Harlow, an independent non-executive director of the
Company, is elected as a member of the Audit, Risk and Compliance Committee.
A brief biography of Mr GD Harlow is on page 20 of this integrated annual report.
8. Ordinary resolution number 8: Election of Mr SJ Vilakazi as a member of the Audit, Risk and
Compliance Committee for the year ending 31 May 2016
Resolved that, in terms of section 94(2) of the Act, but subject to his election as a Director of the Company
in terms of original resolution number 3, Mr SJ Vilakazi, an independent non-executive director of the
Company, is elected as a member of the Audit, Risk and Compliance Committee.
A brief biography of Mr SJ Vilakazi is on page 20 of this integrated annual report.
9. Ordinary resolution number 9: Directors’ authority to implement ordinary and special resolutions
Resolved that each and every Director of the Company is authorised to do all such things and sign all such
documents as may be necessary for or incidental to the implementation of the ordinary and special
resolutions passed at the AGM.
ADVISORY VOTE
There is no minimum percentage of voting rights required for an advisory vote to be adopted.
As a non-binding advisory vote, the Company’s remuneration policy (excluding the remuneration of non-
executive directors and members of Committees of the Board for their services as Directors and members
of such committees) as set out on pages 61 to 63 of the integrated annual report, is endorsed.
SPECIAL RESOLUTIONS
In terms of sections 62(3)(c) and 65(9)of the Act, the minimum percentage of voting rights required for each
of the following special resolutions to be passed is 75% of the voting rights exercised.

230
BLU
E L
AB
EL IN
TE
GR
AT
ED
AN
NU
AL R
EP
OR
T 2
01
5
NOTICE OF ANNUAL GENERAL MEETING CONTINUED
1. Special resolution number 1: Non-executive directors’ remuneration
Resolved that in terms of section 66(9) of the Act, the following remuneration shall be payable to the
non-executive directors for their services as Directors for the period 1 June 2015 to 31 May 2016:
Services as Directors Current fee Proposed fee
– Chairman of the Board (per annum) R893 262 R946 858
– Board members (per meeting) R40 899 R43 353
Audit, Risk and Compliance Committee (per meeting)
– Chairman R56 804 R60 212
– Member R34 083 R36 128
Remuneration and Nomination Committee (per meeting)
– Chairman R45 443 R48 170
– Member R27 267 R28 903
Investment Committee (per meeting)
– Chairman R34 083 R36 128
– Member R20 450 R21 677
Transformation, Social and Ethics Committee (per meeting)
– Chairman R34 083 R36 128
– Member R20 450 R21 677
Ad hoc Committee (per meeting)
– Chairman R34 083 R36 128
– Member R20 450 R21 677

NOTICE OF ANNUAL GENERAL MEETING CONTINUED
231
BLU
E L
AB
EL IN
TE
GR
AT
ED
AN
NU
AL R
EP
OR
T 2
01
5
2. Special resolution number 2: General authority to repurchase shares
Resolved that pursuant to the MoI, the Company or any of its subsidiaries are hereby authorised by way of
a general approval, from time to time, to acquire ordinary shares in the share capital of the Company in
accordance with the Act and the Listings Requirements, provided that:
(a) the number of its own ordinary shares acquired by the Company in any one financial year shall not
exceed 20% (twenty percent) of the ordinary shares in issue at the date on which this resolution is
passed;
(b) this authority shall lapse on the earlier of the date of the next AGM of the Company or the date
15 (fifteen) months after the date on which this resolution is passed;
(c) the Board has resolved to authorise the acquisition and that the Group will satisfy the solvency and
liquidity test immediately after the acquisition and that since the test was done there have been no
material changes to the financial position of the Group;
(d) the acquisition must be effected through the order book operated by the JSE trading system and
done without any prior understanding or arrangement between the Company and the counterparty;
(e) the Company only appoints one agent to effect any acquisition(s) on its behalf;
(f) the price paid per ordinary share may not be greater than 10% (ten percent) above the weighted
average of the market value of the ordinary shares for the 5 (five) business days immediately
preceding the date on which an acquisition is made;
(g) the number of shares acquired by subsidiaries of the Company shall not exceed 10% (ten percent)
in the aggregate of the number of issued shares in the Company at the relevant times;
(h) the acquisition of shares by the Company or its subsidiaries may not be effected during a prohibited
period, as defined in the Listings Requirements; and
(i) an announcement containing full details of such acquisitions of shares will be published as soon
as the Company and/or its subsidiaries have acquired shares constituting, on a cumulative basis
3% (three percent) of the number of shares in issue at the date of the meeting at which this
special resolution is considered and if approved, passed, and for each 3% (three percent) in
aggregate of the initial number acquired thereafter.
The Listings Requirements require, in terms of paragraph 11.26, the following disclosures, which appear in this
integrated annual report: • Major shareholders – refer to pages 224 and 225. • Material change – there were no material changes. • Share capital of the Company – refer to page 152. • Responsibility statement – refer to page 85.
By order of the Board
J Van Eden
Group Company Secretary
Sandton
30 October 2015
232
BLU
E L
AB
EL IN
TE
GR
AT
ED
AN
NU
AL R
EP
OR
T 2
01
5
NOTICE OF ANNUAL GENERAL MEETING CONTINUED
EXPLANATORY NOTES
Presentation of the annual financial statements
In terms of section 61(8)(a) of the Act, the Directors’ report, audited Group and Company annual financial
statements for the immediately preceding financial year and the Audit, Risk and compliance Committee report
is to be presented to shareholders at the AGM.
Ordinary resolution numbers 1 to 4 (inclusive): Election and re-election of Directors
The Company’s Memorandum of Incorporation states that, any person appointed to fill a casual vacancy or as
an addition to the Board shall retain office only until the following AGM of the Company and shall then retire
and be eligible for election. Mr Y Mahomed retires from the Board in accordance with article 25.5 of the
Company’s Memorandum of Incorporation.
In accordance with the Memorandum of Incorporation, one-third of the Directors is required to retire at each
AGM and may offer themselves for re-election. Messrs GD Harlow, SJ Vilakazi and KM Ellerine retire by rotation
at the AGM in accordance with article 25.17 of the Memorandum of Incorporation, and have offered
themselves for re-election. Brief biographies of Directors are on pages 20 and 21 of this integrated
annual report.
The Board is satisfied with the performance of each of the Directors standing for election and re-election as
appropriate and that they will continue to make an effective and valuable contribution to the Company and
to the Board.
The Board recommends to shareholders that they should vote in favour of the re-election of the Directors
referred to in ordinary resolution numbers 1 to 4 (inclusive).
Ordinary resolution number 5: Reappointment of external auditors
In terms of section 90(1) of the Act, each year at its AGM, the Company must appoint an auditor meeting the
requirements of section 90(2) of the Act.
PwC has expressed its willingness to continue in office and this resolution proposes the reappointment of PwC
as the Company’s auditors until its next AGM. In addition, Mr D Storm is appointed as the individual registered
auditor for the ensuing year as contemplated in section 90(3) of the Act.
The Audit, Risk and Compliance Committee has satisfied itself that the proposed auditors, PwC and
Mr D Storm, are independent of the Company in accordance with sections 90 and 94 of the Act and the
applicable rules of the International Federation of Accountants.
The Audit, Risk and Compliance Committee has recommended the reappointment of PwC as independent
registered auditor of Blue Label for the 2016 financial year.

NOTICE OF ANNUAL GENERAL MEETING CONTINUED
233
BLU
E L
AB
EL IN
TE
GR
AT
ED
AN
NU
AL R
EP
OR
T 2
01
5
Ordinary resolution numbers 6 to 8 (inclusive): Election of Audit, Risk and Compliance Committee members
In terms of section 94(2) of the Act, each Audit Committee member must be elected by shareholders at an
AGM. King III likewise requires shareholders of a public company to elect each member of an audit committee
at an AGM.
In terms of Regulation 42 of the Companies Regulations, 2011, relating to the Act, at least one-third of the
members of the Company’s Audit, Risk and Compliance Committee at any particular time must have academic
qualifications, or experience in economics, law, corporate governance, finance, accounting, commerce, industry,
public affairs or human resource management. Each of the proposed members is duly qualified, as is evident
from the biographies of each member, as contained on pages 20 and 21 of this integrated annual report.
Ordinary resolution number 9: Directors’ authority to implement ordinary and special resolutions
The reason for ordinary resolution number 9 is to authorise any Director of the Company to do all things
necessary to implement the ordinary and special resolutions passed at the AGM and to sign all such
documentation required to give effect and to record the ordinary and special resolutions.
Advisory vote: Endorsement of the remuneration policy
King III requires a company to table its remuneration policy for a non-binding advisory vote by shareholders at
its AGM. This vote enables shareholders to endorse the remuneration policy adopted for executive directors.
The Blue Label remuneration policy is contained on pages 61 to 63 of this integrated annual report.
The advisory vote is of a non-binding nature only and therefore failure to pass this resolution will not have any
legal consequences relating to existing arrangements. However, the Board will take cognisance of the outcome
of the vote when considering the Company’s remuneration policy and the remuneration of executive directors.
Special resolution number 1: Non-executive directors’ remuneration
Special resolution number 1 is proposed to enable the Company to comply with the provisions of sections
65(11)(h), 66(8) and 66(9) of the Act, which stipulate that remuneration to Directors for their services as
Directors may be paid only in accordance with a special resolution approved by shareholders.
Special resolution number 1 thus requires shareholders to approve the fees payable to the Company’s
non-executive directors for the period 1 June 2015 to 31 May 2016.
Full particulars of all remuneration paid to non-executive directors for their services as Directors as well as
remuneration paid for consulting services rendered, are contained on pages 172 and 173 of this integrated
annual report.

234
BLU
E L
AB
EL IN
TE
GR
AT
ED
AN
NU
AL R
EP
OR
T 2
01
5
NOTICE OF ANNUAL GENERAL MEETING CONTINUED
Special resolution number 2: General authority to repurchase shares
Special resolution number 2 seeks to allow the Group, by way of a general authority, to acquire its own issued
shares (reducing the total number of ordinary shares of the Company in issue in the case of an acquisition by
the Company of its own shares). Any decision by the Directors to use the general authority to acquire shares
of the Company will be taken with regard to the prevailing market conditions, share price, cash needs of the
Group, together with various other factors, and in compliance with the Act, Listings Requirements and the
Memorandum of Incorporation.
The Directors are of the opinion that the renewal of this general authority is in the best interests of the
Company as it allows the Group to repurchase the securities issued by the Company through the order book
of the JSE should market conditions and price justify such action.
Electronic participation at the AGM
(a) Shareholders wishing to participate electronically in the AGM are required to:
(i) deliver written notice to the Company at 75 Grayston Drive, corner Benmore Road, Morningside
Extension 5, 2196 (marked for the attention of the Group Company Secretary) that they wish to
participate via electronic communication at the AGM; or
(ii) register on the Company’s website at www.bluelabeltelecoms.co.za, where a link to the registration
page will be placed, by no later than 10:00 on Wednesday, 25 November 2015 (electronic notice).
(b) In order for the electronic notice to be valid it must contain:
(i) if the Blue Label shareholder is an individual, a certified copy of his/her identity document and/or
driving licence and/or passport;
(ii) if the Blue Label shareholder is not an individual, a certified copy of a resolution or letter of
representation by the relevant entity and a certified copy of the identity documents and/or passports
of the persons who passed the relevant resolution or signed the relevant letter of representation.
The letter of representation or resolution must set out from whom the relevant entity is authorised
to represent the entity at the AGM via electronic communication;
(iii) a valid e-mail address and/or facsimile number (contact address/number); and
(iv) if the shareholder wishes to vote via electronic communication, set out that the shareholder wishes
to vote via electronic communication. By no later than 24 (twenty-four) hours before the AGM the
Company shall use its reasonable endeavours to notify a shareholder at its contact address/number
who has delivered a valid electronic notice, of the relevant details through which the shareholder
can participate via electronic communication.
(c) Should a shareholder wish to participate in the AGM by way of electronic communication as aforesaid, the
shareholder, or his/her/its proxy/ies, will be required to dial in on the date and commencement time of the
AGM. The dial-in facility will be linked to the venue at which the AGM will take place. The dial-in facility
will enable all persons to participate electronically in the AGM in this manner (and as contemplated in
section 63(2) of the Act) and to communicate concurrently with each other without an intermediary, and
to participate reasonably effectively in the AGM. The costs borne by the shareholder or his/her/its proxy/ies
in relation to the dial-in facility will be for his/her/its own account.

235
BLU
E L
AB
EL IN
TE
GR
AT
ED
AN
NU
AL R
EP
OR
T 2
01
5
FORM OF PROXY
BLUE LABEL TELECOMS LIMITED(Incorporated in the Republic of South Africa)(Registration number: 2006/022679/06)Share code: BLU ISIN: ZAE000109088(Blue Label or the Company)
For use by certificated shareholders or own-name dematerialised shareholders at the Annual General Meeting of the Company to be held at 10:00 on Friday, 27 November 2015 at the registered office of Blue Label, 75 Grayston Drive, corner Benmore Road, Morningside Extension 5, Johannesburg (AGM).
If dematerialised shareholders, other than own-name dematerialised shareholders have not been contacted by their Central Securities Depository Participant (CSDP) or broker with regard to how they wish to cast their vote, they should contact their CSDP or broker and instruct their CSDP or broker as to how they wish to cast their vote at the AGM in order for their CSDP or broker to vote in accordance with such instructions. If dematerialised shareholders, other than own-name dematerialised shareholders, have not been contacted by their CSDP or broker it would be advisable for them to contact their CSDP or broker, as the case may be, and furnish them with their instructions. Dematerialised shareholders who are not own-name dematerialised shareholders and who wish to attend the AGM must obtain their necessary letter of representation from their CSDP or broker, as the case may be and submit same to the transfer secretaries, Computershare Investor Services Proprietary Limited, 70 Marshall Street, Johannesburg, 2001 (PO Box 61051, Marshalltown, 2107), to be received by no later than 10:00, on Wednesday, 25 November 2015. This must be done in terms of the agreement entered into between the dematerialised shareholder and their CSDP or broker. If the CSDP or broker, as the case may be, does not obtain instructions from such dematerialised shareholders, it will be obliged to act in terms of the mandate furnished to it, or if the mandate is silent in this regard, to abstain from voting. Such dematerialised shareholders, other than own-name dematerialised shareholders, must not complete this form of proxy and should read note 10 of the overleaf.
Full name: I/We (BLOCK LETTERS) of (address)
Telephone: (Work) (area code:) Telephone: (Home) (area code:)
Fax: (area code:) Cell number:
being the holder(s) of Blue Label shares hereby appoint:
1. or failing him/her,
2. or failing him/her,
3. the Chairman of the AGM, as my/our proxy to vote for me/us on my/our behalf at the AGM of Blue Label shareholders to be held at 10:00 on Friday, 27 November 2015 or any adjournment thereof as follows:
Resolution For Against Abstain
Ordinary resolution number 1: Election of Mr Y Mahomed as a Director of the Company
Ordinary resolution number 2: Re-election of Mr GD Harlow as a Director of the Company
Ordinary resolution number 3: Re-election of Mr SJ Vilakazi as a Director of the Company
Ordinary resolution number 4: Re-election of Mr KM Ellerine as a Director of the Company
Ordinary resolution number 5: Reappointment of external auditors
Ordinary resolution number 6: Election of Mr JS Mthimunye as a member and Chairman of the Audit, Risk and Compliance Committee
Ordinary resolution number 7: Election of Mr GD Harlow as a member of the Audit, Risk and Compliance Committee
Ordinary resolution number 8: Election of Mr SJ Vilakazi as a member of the Audit, Risk and Compliance Committee
Ordinary resolution number 9: Directors’ authority to implement ordinary and special resolutions
Non-binding advisory vote: Endorsement of the remuneration policy
Special resolution number 1: Non-executive directors’ remuneration
Special resolution number 2: General authority to repurchase shares
Signed at this day of 2015
Signature
Assisted by (if applicable)
Please read the notes on the reverse side hereof.A shareholder entitled to attend and vote at the AGM may appoint one or more persons as his/her/its proxy to attend, speak or vote in his/her/its stead at the AGM. A proxy need not be a shareholder of the Company.
On a show of hands, every shareholder shall have one vote (irrespective of the number of shares held). On a poll, every shareholder shall have, for each share held by him/her/it that proportion of the total votes in the Company which the aggregate amount of the nominal value of that share held by him/her/it bears to the aggregate amount of the nominal value of all the shares issued by the Company.

236
BLU
E L
AB
EL IN
TE
GR
AT
ED
AN
NU
AL R
EP
OR
T 2
01
5
NOTES TO THE FORM OF PROXY
1. A shareholder may insert the name of a proxy or the names of two alternative proxies of his/her/its choice
in the spaces provided with or without deleting “the Chairman of the AGM”, but any such deletion must
be initialled by the Blue Label shareholder. The person whose name appears first on the form of proxy and
who is present at the AGM will be entitled to act as proxy to the exclusion of those whose names follow.
2. Please insert with an “X” or insert the number of shares in the relevant spaces according to how you wish
your votes to be cast. If you wish to cast your votes in respect of a lesser number of Blue Label shares
exercisable by you, insert the number of Blue Label shares held in respect of which you wish to vote. Failure
to comply with the above will be deemed to authorise and compel the Chairman, if the Chairman is an
authorised proxy, to vote in favour of the resolutions, or to authorise any other proxy to vote for or against
the resolutions or abstain from voting as he/she/it deems fit, in respect of all the shareholders’ votes
exercisable thereat. A shareholder or his/her/its proxy is not obliged to use all the votes exercisable by the
shareholder or his/her/its proxy, but the total of the votes cast and in respect whereof abstention is
recorded may not exceed the total of the votes exercisable by the shareholder or his/her/its proxy.
3. Forms of proxy must be lodged with the transfer secretaries, at 70 Marshall Street, Johannesburg, 2001
(PO Box 61051, Marshalltown, 2107), to be received by no later than 10:00 on Wednesday, 25 November
2015.
4. Any alteration or correction made to this form of proxy must be initialled by the signatory/ies.
5. Documentary evidence establishing the authority of a person signing this form of proxy in a representative
capacity must be attached to this form of proxy unless previously recorded by the transfer secretaries or
waived by the Chairman of the AGM.
6. The completion and lodging of this form of proxy will not preclude the relevant shareholder from attending
the AGM and speaking and voting in person thereat to the exclusion of any proxy appointed in terms
hereof, should such shareholder wish to do so.
7. The Chairman of the AGM may accept or reject any form of proxy which is completed and/or received
other than in accordance with these notes and instructions, provided that the Chairman is satisfied as to
the manner in which the shareholder wishes to vote.
8. Where there are joint holders of shares:
8.1 any such persons may vote at the AGM in respect of such joint shares as if he/she/it were solely
entitled thereto;
8.2 any one holder may sign this form of proxy; and
8.3 if more than one such joint holders are present or represented at the AGM, the vote/s of the senior
shareholder (for that purpose seniority will be determined by the order in which the names of
shareholders appear in the register) who tenders a vote (whether in person or by proxy) will be
accepted to the exclusion of the vote(s) of the other joint shareholder/s.

237
BLU
E L
AB
EL IN
TE
GR
AT
ED
AN
NU
AL R
EP
OR
T 2
01
5
NOTES TO THE FORM OF PROXY CONTINUED
9. Own-name dematerialised shareholders will be entitled to attend the AGM in person or, if they are unable
to attend and wish to be represented thereat, must complete and return the attached form of proxy to the
transfer secretaries in accordance with the time specified on the form of proxy.
10. Shareholders who hold shares through a nominee should advise their nominee or, if applicable, their CSDP
or broker timeously of their intention to attend and vote at the AGM or to be represented by proxy thereat
in order for their nominee or, if applicable, their CSDP or broker to provide them with the necessary letter
of representation to do so or should provide their nominee or, if applicable, their CSDP or broker timeously
with their voting instruction should they not wish to attend the AGM in person, in order for their nominee
to vote in accordance with their instruction at the AGM.
11. A vote given in terms of an instrument of proxy shall be valid in relation to the AGM notwithstanding the
death of the person granting it, the transfer of the shares in respect of which the vote is given, unless an
intimation in writing of such death or transfer is received by the transfer secretaries, before the
commencement of the AGM.
12. Where this form of proxy is signed under power of attorney, such power of attorney must accompany this
form of proxy, unless previously recorded by the transfer secretaries or unless this requirement is waived by
the Chairman of the AGM.
13. A minor or any other person under legal incapacity must be assisted by his/her parent or guardian, as
applicable, unless the relevant documents establishing his/her capacity are produced or have been
registered by Blue Label or the transfer secretaries.
14. Unless revoked, an appointment of a proxy pursuant to this form of proxy remains valid only until the end
of the AGM or any postponement or adjournment of the AGM. This form of proxy shall be valid at any
resumption of a postponed or adjourned meeting to which it relates although this form of proxy shall not
be used at the resumption of the postponed or adjourned AGM if it could not be used at the AGM for any
reason other than it was not lodged timeously for the AGM. This form of proxy shall, in addition to the
authority conferred by the Act, except insofar as it provides otherwise, be deemed to confer the power
generally to act at the meeting in question, subject to any specific direction contained in this form of proxy
as to the manner of voting.

238
BLU
E L
AB
EL IN
TE
GR
AT
ED
AN
NU
AL R
EP
OR
T 2
01
5
NOTES TO THE FORM OF PROXY CONTINUED
Summary of the rights established in terms of section 58 of the Act
For purposes of this summary, “shareholder” shall have the meaning ascribed thereto in the Act.
1. At any time, a shareholder of a company is entitled to appoint an individual, including an individual who is
not a shareholder of that company, as a proxy, to:
1.1 participate in, and speak and vote at, a shareholders’ meeting on behalf of the shareholder; or
1.2 give or withhold written consent on behalf of such shareholder in relation to a decision contemplated
in section 60 of the Act.
2. A proxy appointment must be in writing, dated and signed by the relevant shareholder, and such proxy
appointment remains valid for one year after the date upon which the proxy was signed, or any longer
or shorter period expressly set out in the appointment, unless it is revoked in a manner contemplated in
section 58(4)(c) of the Act or expires earlier as contemplated in section 58(8)(d) of the Act.
3. Except to the extent that the Memorandum of Incorporation of a company provides otherwise:
3.1 a shareholder of the relevant company may appoint two or more persons concurrently as proxies, and
may appoint more than one proxy to exercise voting rights attached to different securities held by such
shareholder;
3.2 a proxy may delegate his authority to act on behalf of a shareholder to another person, subject to any
restriction set out in the instrument appointing the proxy; and
3.3 a copy of the instrument appointing a proxy must be delivered to the relevant company, or to any
other person on behalf of the relevant company, before the proxy exercises any rights of the
shareholder at a shareholders’ meeting.
4. Irrespective of the form of instrument used to appoint a proxy, the appointment of the proxy is suspended
at any time and to the extent that the shareholder who appointed that proxy chooses to act directly and in
person in the exercise of any rights as a shareholder of the relevant company.
5. Unless the proxy appointment expressly states otherwise, the appointment of a proxy is revocable. If the
appointment of a proxy is revocable, a shareholder may revoke the proxy appointment by cancelling it in
writing, or making a later inconsistent appointment of a proxy, and delivering a copy of the revocation
instrument to the proxy and the Company.
6. The revocation of a proxy appointment constitutes a complete and final cancellation of the proxy’s
authority to act on behalf of the relevant shareholder as of the later of the date: (a) stated in the revocation
instrument, if any; or (b) upon which the revocation instrument is delivered to the proxy and the relevant
company as required in section 58(4)(c)(ii) of the Act.
239
BLU
E L
AB
EL IN
TE
GR
AT
ED
AN
NU
AL R
EP
OR
T 2
01
5
NOTES TO THE FORM OF PROXY CONTINUED
7. If the instrument appointing a proxy or proxies has been delivered to the relevant company, as long as
that appointment remains in effect, any notice that is required by the Act or the relevant company’s
Memorandum of Incorporation to be delivered by such company to the shareholder, must be delivered by
such company to the shareholder, or to the proxy or proxies, if the shareholder has directed the relevant
company to do so in writing and paid any reasonable fee charged by the Company for doing so.
8. A proxy is entitled to exercise, or abstain from exercising, any voting right of the relevant shareholder
without direction, except to the extent that the Memorandum of Incorporation, or the instrument
appointing the proxy provide otherwise.
9. If a company issues an invitation to shareholders to appoint one or more persons named by such company
as a proxy, or supplies a form of instrument for appointing a proxy:
9.1 such invitation must be sent to every shareholder who is entitled to notice of the meeting at which
the proxy is intended to be exercised;
9.2 the invitation, or form of instrument supplied by the relevant company, must: (a) bear a reasonably
prominent summary of the rights established in section 58 of the Act; (b) contain adequate blank
space, immediately preceding the name or names of any person or persons named in it, to enable a
shareholder to write in the name and, if so desired, an alternative name of a proxy chosen by such
shareholder; and (c) provide adequate space for the shareholder to indicate whether the appointed
proxy is to vote in favour or against the applicable resolution/s to be put at the relevant meeting, or
is to abstain from voting;
9.3 the Company must not require that the proxy appointment be made irrevocable; and
9.4 the proxy appointment remains valid only until the end of the relevant meeting at which it was
intended to be used, unless revoked as contemplated in section 58(5) of the Act.
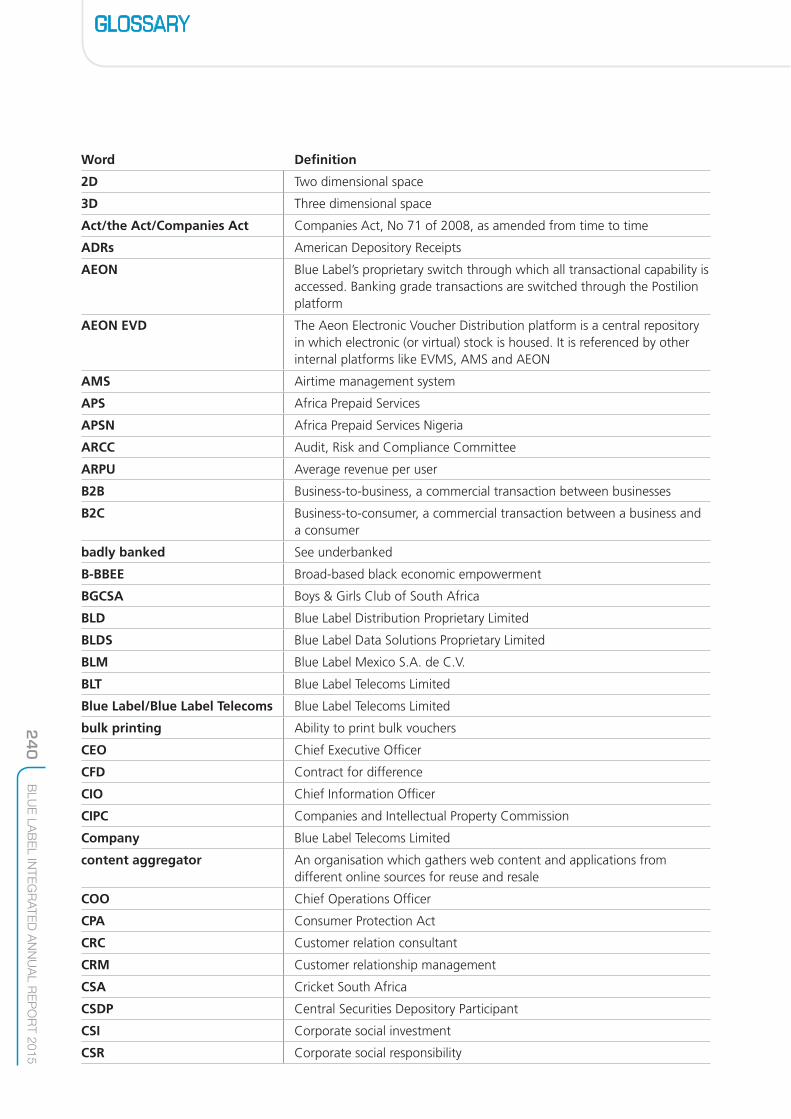
240
BLU
E L
AB
EL IN
TE
GR
AT
ED
AN
NU
AL R
EP
OR
T 2
01
5
GLOSSARY
Word Definition
2D Two dimensional space
3D Three dimensional space
Act/the Act/Companies Act Companies Act, No 71 of 2008, as amended from time to time
ADRs American Depository Receipts
AEON Blue Label’s proprietary switch through which all transactional capability is accessed. Banking grade transactions are switched through the Postilion platform
AEON EVD The Aeon Electronic Voucher Distribution platform is a central repository in which electronic (or virtual) stock is housed. It is referenced by other internal platforms like EVMS, AMS and AEON
AMS Airtime management system
APS Africa Prepaid Services
APSN Africa Prepaid Services Nigeria
ARCC Audit, Risk and Compliance Committee
ARPU Average revenue per user
B2B Business-to-business, a commercial transaction between businesses
B2C Business-to-consumer, a commercial transaction between a business and a consumer
badly banked See underbanked
B-BBEE Broad-based black economic empowerment
BGCSA Boys & Girls Club of South Africa
BLD Blue Label Distribution Proprietary Limited
BLDS Blue Label Data Solutions Proprietary Limited
BLM Blue Label Mexico S.A. de C.V.
BLT Blue Label Telecoms Limited
Blue Label/Blue Label Telecoms Blue Label Telecoms Limited
bulk printing Ability to print bulk vouchers
CEO Chief Executive Officer
CFD Contract for difference
CIO Chief Information Officer
CIPC Companies and Intellectual Property Commission
Company Blue Label Telecoms Limited
content aggregator An organisation which gathers web content and applications from different online sources for reuse and resale
COO Chief Operations Officer
CPA Consumer Protection Act
CRC Customer relation consultant
CRM Customer relationship management
CSA Cricket South Africa
CSDP Central Securities Depository Participant
CSI Corporate social investment
CSR Corporate social responsibility
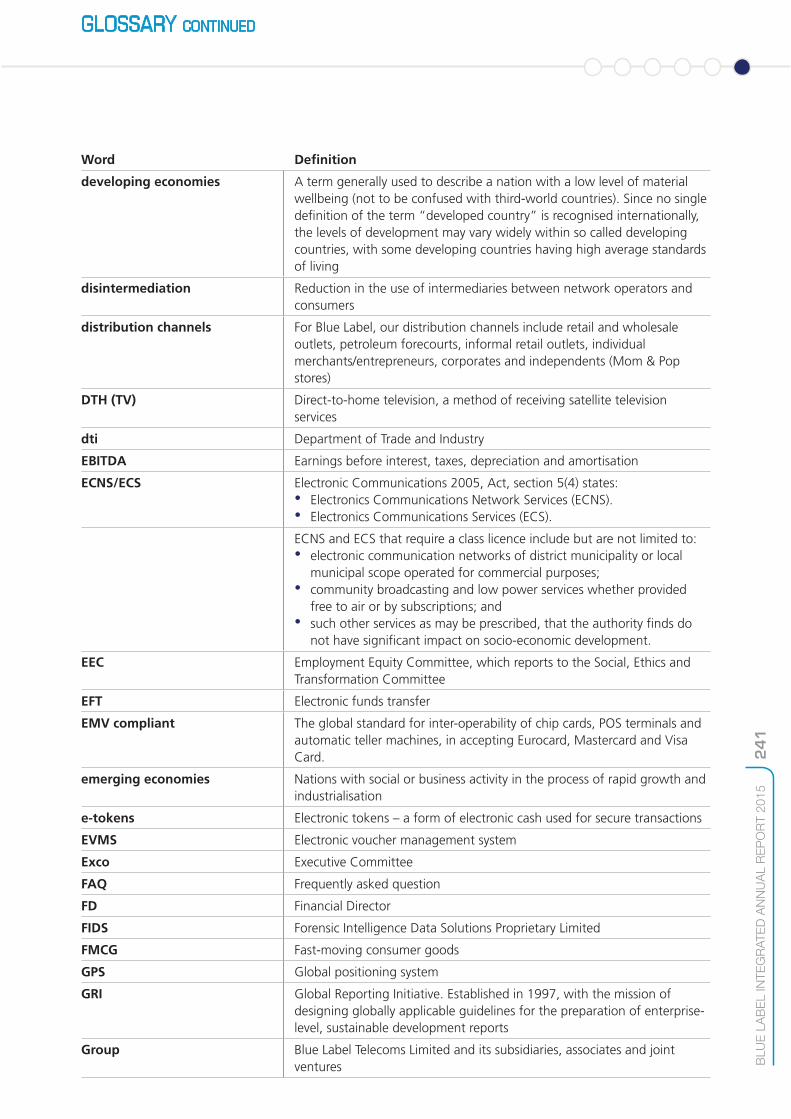
241
BLU
E L
AB
EL IN
TE
GR
AT
ED
AN
NU
AL R
EP
OR
T 2
01
5
GLOSSARY CONTINUED
Word Definition
developing economies A term generally used to describe a nation with a low level of material wellbeing (not to be confused with third-world countries). Since no single definition of the term “developed country” is recognised internationally, the levels of development may vary widely within so called developing countries, with some developing countries having high average standards of living
disintermediation Reduction in the use of intermediaries between network operators and consumers
distribution channels For Blue Label, our distribution channels include retail and wholesale outlets, petroleum forecourts, informal retail outlets, individual merchants/entrepreneurs, corporates and independents (Mom & Pop stores)
DTH (TV) Direct-to-home television, a method of receiving satellite television services
dti Department of Trade and Industry
EBITDA Earnings before interest, taxes, depreciation and amortisation
ECNS/ECS Electronic Communications 2005, Act, section 5(4) states: • Electronics Communications Network Services (ECNS). • Electronics Communications Services (ECS).
ECNS and ECS that require a class licence include but are not limited to: • electronic communication networks of district municipality or local
municipal scope operated for commercial purposes; • community broadcasting and low power services whether provided
free to air or by subscriptions; and • such other services as may be prescribed, that the authority finds do
not have significant impact on socio-economic development.
EEC Employment Equity Committee, which reports to the Social, Ethics and Transformation Committee
EFT Electronic funds transfer
EMV compliant The global standard for inter-operability of chip cards, POS terminals and automatic teller machines, in accepting Eurocard, Mastercard and Visa Card.
emerging economies Nations with social or business activity in the process of rapid growth and industrialisation
e-tokens Electronic tokens – a form of electronic cash used for secure transactions
EVMS Electronic voucher management system
Exco Executive Committee
FAQ Frequently asked question
FD Financial Director
FIDS Forensic Intelligence Data Solutions Proprietary Limited
FMCG Fast-moving consumer goods
GPS Global positioning system
GRI Global Reporting Initiative. Established in 1997, with the mission of designing globally applicable guidelines for the preparation of enterprise-level, sustainable development reports
Group Blue Label Telecoms Limited and its subsidiaries, associates and joint ventures
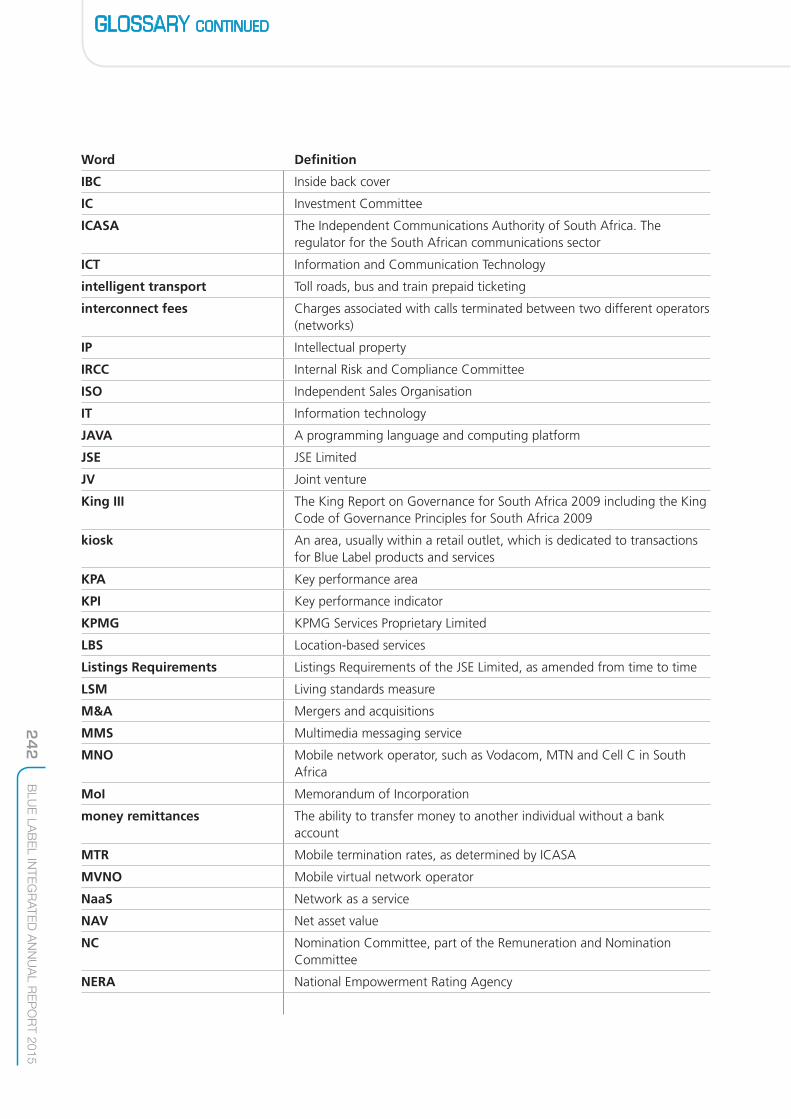
242
BLU
E L
AB
EL IN
TE
GR
AT
ED
AN
NU
AL R
EP
OR
T 2
01
5
GLOSSARY CONTINUED
Word Definition
IBC Inside back cover
IC Investment Committee
ICASA The Independent Communications Authority of South Africa. The regulator for the South African communications sector
ICT Information and Communication Technology
intelligent transport Toll roads, bus and train prepaid ticketing
interconnect fees Charges associated with calls terminated between two different operators (networks)
IP Intellectual property
IRCC Internal Risk and Compliance Committee
ISO Independent Sales Organisation
IT Information technology
JAVA A programming language and computing platform
JSE JSE Limited
JV Joint venture
King III The King Report on Governance for South Africa 2009 including the King Code of Governance Principles for South Africa 2009
kiosk An area, usually within a retail outlet, which is dedicated to transactions for Blue Label products and services
KPA Key performance area
KPI Key performance indicator
KPMG KPMG Services Proprietary Limited
LBS Location-based services
Listings Requirements Listings Requirements of the JSE Limited, as amended from time to time
LSM Living standards measure
M&A Mergers and acquisitions
MMS Multimedia messaging service
MNO Mobile network operator, such as Vodacom, MTN and Cell C in South Africa
MoI Memorandum of Incorporation
money remittances The ability to transfer money to another individual without a bank account
MTR Mobile termination rates, as determined by ICASA
MVNO Mobile virtual network operator
NaaS Network as a service
NAV Net asset value
NC Nomination Committee, part of the Remuneration and Nomination Committee
NERA National Empowerment Rating Agency
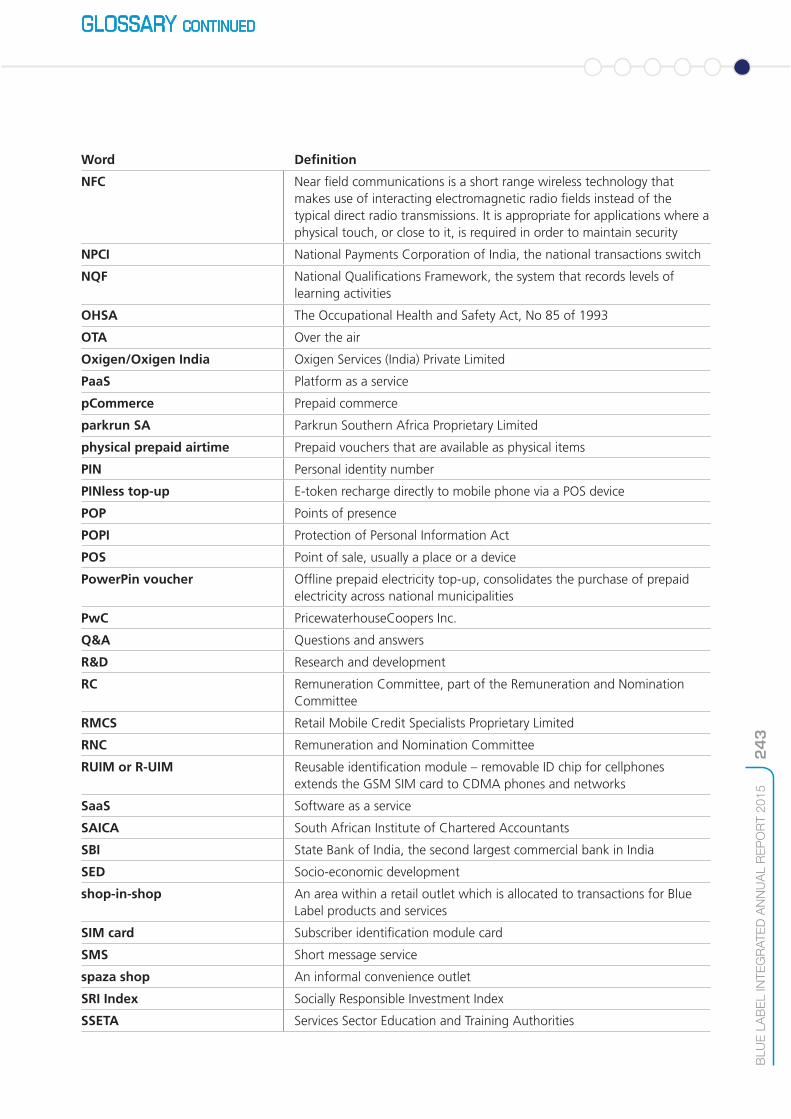
243
BLU
E L
AB
EL IN
TE
GR
AT
ED
AN
NU
AL R
EP
OR
T 2
01
5
GLOSSARY CONTINUED
Word Definition
NFC Near field communications is a short range wireless technology that makes use of interacting electromagnetic radio fields instead of the typical direct radio transmissions. It is appropriate for applications where a physical touch, or close to it, is required in order to maintain security
NPCI National Payments Corporation of India, the national transactions switch
NQF National Qualifications Framework, the system that records levels of learning activities
OHSA The Occupational Health and Safety Act, No 85 of 1993
OTA Over the air
Oxigen/Oxigen India Oxigen Services (India) Private Limited
PaaS Platform as a service
pCommerce Prepaid commerce
parkrun SA Parkrun Southern Africa Proprietary Limited
physical prepaid airtime Prepaid vouchers that are available as physical items
PIN Personal identity number
PINless top-up E-token recharge directly to mobile phone via a POS device
POP Points of presence
POPI Protection of Personal Information Act
POS Point of sale, usually a place or a device
PowerPin voucher Offline prepaid electricity top-up, consolidates the purchase of prepaid electricity across national municipalities
PwC PricewaterhouseCoopers Inc.
Q&A Questions and answers
R&D Research and development
RC Remuneration Committee, part of the Remuneration and Nomination Committee
RMCS Retail Mobile Credit Specialists Proprietary Limited
RNC Remuneration and Nomination Committee
RUIM or R-UIM Reusable identification module – removable ID chip for cellphones extends the GSM SIM card to CDMA phones and networks
SaaS Software as a service
SAICA South African Institute of Chartered Accountants
SBI State Bank of India, the second largest commercial bank in India
SED Socio-economic development
shop-in-shop An area within a retail outlet which is allocated to transactions for Blue Label products and services
SIM card Subscriber identification module card
SMS Short message service
spaza shop An informal convenience outlet
SRI Index Socially Responsible Investment Index
SSETA Services Sector Education and Training Authorities

244
BLU
E L
AB
EL IN
TE
GR
AT
ED
AN
NU
AL R
EP
OR
T 2
01
5
GLOSSARY CONTINUED
Word Definition
telco Telecommunications
ticketing For events and transport, includes sport, travel, entertainment, lifestyle and expos
touch points Devices through which consumers are able to purchase Blue Label products and services
TPC The Prepaid Company Proprietary Limited
TPPC The Post Paid Company Proprietary Limited
transactional services Includes money transfers, payments of bills and the like
unbanked People without bank accounts
underbanked/badly banked People with poor access to mainstream financial services, such as banks and therefore rely on alternative financial services or alternatively people with bank accounts who do not make effective use of the broader services offered by the bank – they merely deposit and withdraw cash from their accounts
UniPIN Universal PIN for prepaid electricity
USSD Unstructured supplementary service data
value added Measure of wealth the Group has created in its operation by “adding value” to the cost of products and services
VAS Value-added services
Viamedia Viamedia Proprietary Limited
virtual distributor Distribution of e-tokens of value in electronic format
virtual prepaid airtime Airtime top-up in an electronic format
WAP Wireless application protocol
WASP Wireless application service provider
WASPA Wireless Application Service Providers Association
ZOK ZOK Cellular Proprietary Limited
ADMINISTRATION
DIRECTORSLM Nestadt (Chairman)*, BM Levy, MS Levy, KM Ellerine**, GD Harlow*, Y Mahomed*, JS Mthimunye* MV Pamensky, DA Suntup, SJ Vilakazi*
* Independent non-executive** Non-executive
COMPANY SECRETARYJ van Eden
SPONSORInvestec Bank Limited
COMMERCIAL BANKERFirst National Bank
EXTERNAL AUDITORPricewaterhouseCoopers Inc.
INTERNAL AUDITORKPMG Services Proprietary Limited
AMERICAN DEPOSITORY RECEIPT (ADR) PROGRAMMECusip No: 095648101Ticker name: BULBYADR to ordinary share: 1:10DepositoryBNY Mellon 101 Barclay StreetNew York NY 10286 USA
BLUE LABEL TELECOMS LIMITED(Incorporated in the Republic of South Africa)Registration number 2006/022679/06
Registered address: 75 Grayston Drive, Corner Benmore Road, Morningside Ext 5, Sandton, 2196Postal address: PO Box 652261, Benmore, 2010Contacts: +27 11 523 3000/[email protected]/www.bluelabeltelecoms.co.za
JSE SHARE CODEBLU
ISINZAE000109088(Blue Label or BLT or the Company or the Group)
BASTION GRAPHICS

www.bluelabeltelecoms.co.za