intech-reinforcement effects of cnts for polymer based nano composites
TRANSCRIPT

8/3/2019 InTech-Reinforcement Effects of Cnts for Polymer Based Nano Composites
http://slidepdf.com/reader/full/intech-reinforcement-effects-of-cnts-for-polymer-based-nano-composites 1/26
7
Reinforcement Effects of CNTsfor Polymer-Based Nanocomposites
Yuan Li, Yaolu Liu and Ning HuChiba University
Japan
1. Introduction
With large aspect ratio, high strength and stiffness, carbon nanotubes (CNTs) have beenwidely used as the reinforcement for polymer-based nanocomposites with prospectiveapplication in aerospace engineering, automotive industry, etc. Generally, there are twotypical representatives: three-phase hybrid CFRP laminates (CNT/Polymer/CF) and two-phase CNT-reinforced polymer (CNT/Polymer) nanocomposites.For three-phase hybrid CFRP laminates which use CNTs to improve the interlaminarmechanical properties of CFRP laminates, the fabrication methods can be categorized intothe following three ways:i. Matrix reinforcement, which uses the two-phase CNT/Polymer nanocomposites as the
matrix for CFRP plies before lay-up [Yokozeki et al., 2007; Karapappas et al., 2009; Inamet al., 2010];
ii. Filler reinforcement, which employs the CNT-grafted carbon fibres as reinforcement fillerfor CFRP plies before lay-up [Thostenson et al., 2002; Veedu et al., 2006; He et al., 2007;Kepple et al., 2008];
iii. Interface reinforcement, which adds CNTs into the interface between CFRP plies duringlay-up [Garcia et al., 2008; Arai et al., 2008].
Although great progress has been made for the first two ways, less work is reported on thethird one.Therefore, in the present work, a newly simple fabrication method, i.e.,Powder method wasdeveloped to disperse the CNTs at the interface between CFRP plies. The improvement of interlaminar mechanical properties was investigated by DCB (double cantilever bending) tests and
FEM (finite element method) analysis.Fortwo-phase CNT/Polymer nanocomposites , numerous experimental investigations havebeen carried out on the reinforcement effect of CNTs addition in thermosetting ones, e.g.epoxy [Schadler et al., 1998; Gojny et al., 2005; Ci & Bai, 2006], polyimide [Ogasawara et al2004; Jiang et al., 2005], and phenolic [Tai et al., 2004], as well as thermoplastic ones, e.g.polypropylene (PP) [Bhattacharyya et al., 2003; Chang et al., 2005], polystyrene (PS)[Thostenson & Chou, 2002; Chang et al., 2006], polymethylmethacrylate (PMMA) [Cooper etal., 2002; Lee et al., 2006] and polyether ether kentone (PEEK) [Deng et al., 2007;Bangarusampath et al., 2009]. However, the reported improvement of mechanical propertiesof these nanocomposites is far more less than the expectation because of poor dispersion,difficult alignment of CNTs, and weak interface between CNT and polymer matrix, which

8/3/2019 InTech-Reinforcement Effects of Cnts for Polymer Based Nano Composites
http://slidepdf.com/reader/full/intech-reinforcement-effects-of-cnts-for-polymer-based-nano-composites 2/26
Carbon Nanotubes – Polymer Nanocomposites130
are involved in geometrical properties of CNTs themselves, polymer properties, fabricationmethod of CNT/Polymer nanocomposites.To overcome these obstacles, various efforts, such as ultrasonication [Safadi et al., 2002; Dinget al., 2003], surface treatment [Curran et al. 1999; Vigolo et al., 2000; Gojny et al., 2003]shear mixing [Andrews et al., 2002], bi/tri-axial rolling [Rosca & Hoa, 2009; Gojny et al.,2004], extrusion [Cooper et al., 2002; Wong et al., 2003], and their combination, have beenfirstly made to effectively achieve good dispersion of CNTs in polymer. Moreover, severaltechniques have been proposed to control CNTs alignment using shear [Ajayan et al., 1994],elongation [Jin et al., 1998], melt processing [Haggenmueller et al., 2000], as well as magneticfield [Kimura et al., 2003] or electrical spinning [Sen et al., 2004]. Furthermore, greatprogress has been made on the investigation of the interfacial properties. For example, directCNT pull-out experiments were made in telescope electron microscopy (TEM) [Qian et al.,2000; Deng, 2008], or by atomic force microscopy (AFM) [Barber et al., 2003, 2004], Ramaspectroscopy [Schadler et al., 1998], scanning probe microscope (SPM) [Cooper et al., 2002].However, difficult manipulation in nano-scale and measurement on force/displacementmakes large data scattering inevitable, which makes numerical simulation a powerfulalternative approach. Continuum mechanical, molecular mechanics (MM), conventional orab initio molecular dynamics (MD), or their combinations, have also been attempted toinvestigate the interfacial properties. For instance, some continuum mechanics based models(e.g. cohesive zone model [Jiang et al., 2006], shear lag model [Xiao & Zhang, 2004; Gao & L2005; Tsai & Lu, 2009], and pull-out model [Lau, 2003; Natsuki et al., 2007]) were developedto investigate the interfacial properties between CNT and polymer matrix. Compared withNatsuki’s suggestion [Natsuki et al., 2007] of that maximum interfacial shear stress (ISS)occurs at the pull-out end of CNT, Gao [Gao & Li, 2005] predicted that ISS approachesmaximum at the two ends of CNT, but keeps zero at the middle part. On the other hand,
most of MM/MD simulations [Lordi & Yao, 2000; Liao & Li, 2001; Frankland et al., 2002;Gou et al., 2004; Zheng et al., 2009; Al-Ostaz et al., 2008; Chowdhury & Okabe, 2007]assumed constant ISS during the whole pull-out process with uniform distribution along thecontact surface between CNT and polymer. Obviously, the above totally differentdistribution forms of ISS leads to great confusion in understanding the inherent interfacialcharacteristics of CNT/Polymer nanocomposites. Moreover, all of the previous MM/MDsimulations are limited to a specified SWCNT with a fixed length and diameter. Theinfluences of CNTs’ dimension on the pull-out behaviour have never been investigated.Therefore, in the present work, the other focus is put on the clarification of interfacial propertiesbetween CNT and polymer matrix, in which the effects of CNTs’ dimension (i.e. nanotube length,diameter and wall number) were explored for the first time. Moreover, the obtained interfacial
properties were combined with the theoretical model of continuum mechanics to develop a sequentialmulti-scale model for predicting the overall mechanical properties of CNT/Polymer nanocomposites,which were verified using tensile tests and SENB (single-edge notched bending) tests.Here, two commercial CNTs products, i.e. MWCNT-7 (Nano Carbon Technologies Co., Ltd. Japan) and VGCF® (Showa Denko K.K., Japan) as shown in Fig. 1, were employed asreinforcement fillers at the interface of conventional CFRP laminates to fabricate three-phasehybrid CFRP laminates, and in epoxy to fabricate two-phase CNT/Polymernanocomposites, respectively. The average diameter of VGCF® is around two times higherthan that of MWCNT-7. Moreover, wall thickness of VGCF® is larger, while the central wallis much smaller than that of MWCNT-7. The corresponding geometrical and mechanicalproperties of these two CNTs are listed in Table 1.

8/3/2019 InTech-Reinforcement Effects of Cnts for Polymer Based Nano Composites
http://slidepdf.com/reader/full/intech-reinforcement-effects-of-cnts-for-polymer-based-nano-composites 3/26
Reinforcement Effects of CNTs for Polymer-Based Nanocomposites 131
(a) VGCF® (b) MWCNT-7Fig. 1. TEM pictures of two commercial CNTs
CFRP prepregs Commercial CNTs VGCF® MWCNT-7Matrix #2500 Radiusr f (nm) 75 32.5
PAN-based CF T700S Lengthl f ( m) 15 (10~20) 7.5 (5~10)Young’s modulus (GPa) Density f (kg/m3) 2.0 2.1Fibre direction 116.8 Young’s modulus
E f (GPa)516.5
(273~760)850
[Demczyk et al., 2002]Transversedirection 8.83 Tensile strength
ultf (MPa)3100
(2700~3500)1.5 105
[Demczyk et al., 2002]
Table 1. Properties of CFRP prepregs and two commercial CNTs
2. Three-phase hybrid CFRP laminates
Powder method was developed to disperse CNTs directly at the interface between CFRPprepregs to fabricate three-phase hybrid CFRP laminates. The improvement on theinterlaminar mechanical properties was confirmed by DCB tests and FEM analysis.
2.1 DCB experiments2.1.1 Materials and specimen fabricationThe CFRP prepregs (T700S/#2500 Toray, Co. Ltd., Japan) were used, where their physicaland mechanical properties are also given in Table 1.Here, CNTs, as the reinforcement at interface, was dispersed at the mid-plane ofunidirectional [0˚ /0 ˚ ]14 CFRP laminates during the hand lay-up process, where a simplefabrication method with low cost, i.e.powder method , was employed. The detailed processis described in Fig. 2 as below.a. Initially, 14 pieces of CFRP plies were stacked together to form two pieces of [0˚ ]7CFRP
unidirectional sublaminates, respectively;b. CNTs powder was spread by half on the surface of lower sublaminate using a sifter
with mesh size about 70m. The zigzagged spreading path makes the distribution ofCNTs at the interface as consistent as possible;
c. The left half of CNTs powder was spread after placing a 25m thick polyamide film(Kapton, Toray Co. Ltd., Japan) to make an initial crack;

8/3/2019 InTech-Reinforcement Effects of Cnts for Polymer Based Nano Composites
http://slidepdf.com/reader/full/intech-reinforcement-effects-of-cnts-for-polymer-based-nano-composites 4/26
Carbon Nanotubes – Polymer Nanocomposites132
d. The upper sublaminate was piled up;e. Finally, it was put into an autoclave for 3 hours at the temperature of 130˚ C to cure.The obtained laminates are typed in Table 2 according to CNTs’ area density A at theinterface. Obviously, the measured thicknesses of formed CNTs interlayertI increaseslinearly with area density A. For reference, base CFRP laminates were also fabricated.
Fig. 2. Powder method
Reinforcement A (g/m2) Notation tI ( m)
VGCF®10 CFRP/VGCF(10) 7020 CFRP/VGCF(20) 14030 CFRP/VGCF(30) 210
MWCNT-75 CFRP/MWCNT(5) 6610 CFRP/MWCNT(10) 9720 CFRP/MWCNT(20) 148
Table 2. Fabricated hybrid CFRP laminates
2.1.2 DCB test procedureTo evaluate Mode-I interlaminar fracture toughness, DCB tests were carried out using auniversal material testing machine (AG-100kNE, Shimazu Co. Ltd, Japan) at 20˚ C accordingto Japanese Industrial Standards (JIS K7086). Five specimens for each type were cut from thefabricated laminates, where marked lines were painted on side surface for crack lengthmeasurement. The specimens were approximately 20mm wide and 120mm long, with theinitial crack of 34mm. The thickness of hybrid CFRP laminates was thicker than that of baseCFRP laminates with 3.14mm due to the formed CNTs interlayer. The crosshead speed was0.5mm/min. Tests were terminated when the increment of crack lengtha reaches 70mm.

8/3/2019 InTech-Reinforcement Effects of Cnts for Polymer Based Nano Composites
http://slidepdf.com/reader/full/intech-reinforcement-effects-of-cnts-for-polymer-based-nano-composites 5/26
Reinforcement Effects of CNTs for Polymer-Based Nanocomposites 133
2.1.3 Mode-I interlaminar fracture toughnessFrom the obtained load-COD (crack opening displacement) curves of the above varioustypes of hybrid CFRP laminates, the average critical load at crack growth, i.e. peak loadPc,are plotted in Fig. 3a which shows the obvious increase. The highestPc occurs atCFRP/VGCF(20) and CFRP/MWCNT(10) , which are about 41% and 17% higher than thatof base CFRP laminates, respectively. Obviously, VGCF®performs better than MWCNT-7.SincePc is dominated by Mode-I interlaminar fracture toughnessGIC and interlaminartensile strengthN , it is anticipated thatGIC and N also increase. The averageGIC and fractureresistanceGIR are demonstrated in Fig. 3b and Fig. 3c. Note thatGIR is the average valuewhen the crack length varies from 20mm to 60mm in the obtained R-curves. In Fig. 3b, thereare 96% and 58% increase ofGIC for CFRP/VGCF(20) and CFRP/VGCF(10), respectively,which can be considered as the optimal addition. In Fig. 3c, CFRP/VGCF(20) has the highestGIR, which is about 25% higher than that of base CFRP laminates. However, the effect ofMWCNT onGIR is unpromising. The largest value occurs at CFRP/MWCNT(5) whichincreases only 6%. Moreover, there is even minor negative influence for some cases onGIR.
(a) Peak load (b) Mode-I fracture toughness
(c) Mode-I fracture resistanceFig. 3. Reinforcement effects of two commercial CNTs in three-phase hybrid CFRP laminatesThe reinforcement mechanism can be explained from crack propagation process observedby an optical microscopy. At the initial stage, crack initiates from crack tip at the CNTsinterlayer for all cases (Fig. 4a), which explains the increase ofGIC . Moreover, for
8/3/2019 InTech-Reinforcement Effects of Cnts for Polymer Based Nano Composites
http://slidepdf.com/reader/full/intech-reinforcement-effects-of-cnts-for-polymer-based-nano-composites 6/26
Carbon Nanotubes – Polymer Nanocomposites134
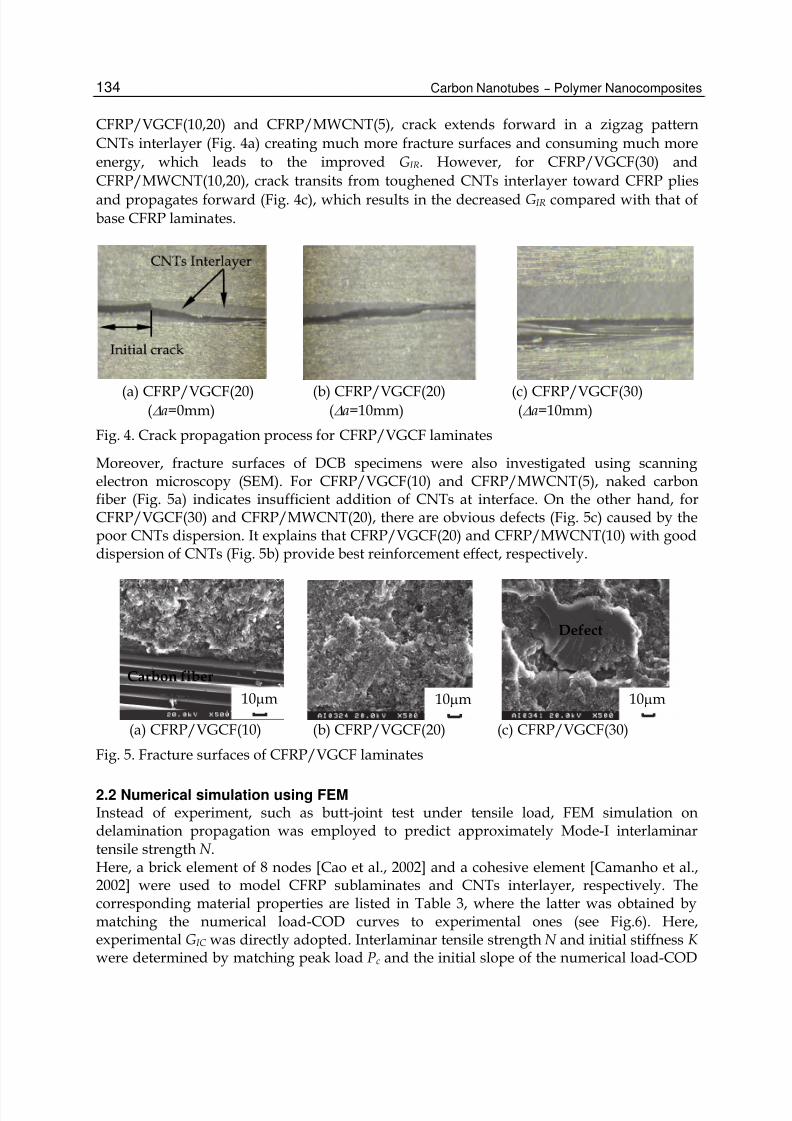
CFRP/VGCF(10,20) and CFRP/MWCNT(5), crack extends forward in a zigzag patternCNTs interlayer (Fig. 4a) creating much more fracture surfaces and consuming much moreenergy, which leads to the improvedGIR. However, for CFRP/VGCF(30) andCFRP/MWCNT(10,20), crack transits from toughened CNTs interlayer toward CFRP pliesand propagates forward (Fig. 4c), which results in the decreasedGIR compared with that ofbase CFRP laminates.
(a) CFRP/VGCF(20) (b) CFRP/VGCF(20) (c) CFRP/VGCF(30)( a=0mm) (a=10mm) (a=10mm)Fig. 4. Crack propagation process for CFRP/VGCF laminatesMoreover, fracture surfaces of DCB specimens were also investigated using scanningelectron microscopy (SEM). For CFRP/VGCF(10) and CFRP/MWCNT(5), naked carbonfiber (Fig. 5a) indicates insufficient addition of CNTs at interface. On the other hand, forCFRP/VGCF(30) and CFRP/MWCNT(20), there are obvious defects (Fig. 5c) caused by thepoor CNTs dispersion. It explains that CFRP/VGCF(20) and CFRP/MWCNT(10) with gooddispersion of CNTs (Fig. 5b) provide best reinforcement effect, respectively.
(a) CFRP/VGCF(10) (b) CFRP/VGCF(20) (c) CFRP/VGCF(30)Fig. 5. Fracture surfaces of CFRP/VGCF laminates
2.2 Numerical simulation using FEMInstead of experiment, such as butt-joint test under tensile load, FEM simulation ondelamination propagation was employed to predict approximately Mode-I interlaminartensile strengthN .Here, a brick element of 8 nodes [Cao et al., 2002] and a cohesive element [Camanho et al.,2002] were used to model CFRP sublaminates and CNTs interlayer, respectively. Thecorresponding material properties are listed in Table 3, where the latter was obtained bymatching the numerical load-COD curves to experimental ones (see Fig.6). Here,experimentalGIC was directly adopted. Interlaminar tensile strengthN and initial stiffnessK were determined by matching peak loadPc and the initial slope of the numerical load-COD
10 m
Defect
10 m10 mCarbon fiber

8/3/2019 InTech-Reinforcement Effects of Cnts for Polymer Based Nano Composites
http://slidepdf.com/reader/full/intech-reinforcement-effects-of-cnts-for-polymer-based-nano-composites 7/26
Reinforcement Effects of CNTs for Polymer-Based Nanocomposites 135
curves before the peak load, respectively. In Table 3, althoughN increases with CNTsaddition, which are about 75% and 50% higher than that of base CFRP laminates,respectively, there is no any difference among them for different CNTs addition. This can beattributed to that peak load is mainly dominated byGIC whileN influences it slightly.In conclusion, the improvement of interlaminar tensile strengthN was confirmed by FEMsimulation, and the correctness of experimentalGIC was verified from good consistencebetween numerical and experimental results (Fig.6).
Brick element Cohesive element N (MPa) K (N/mm3) GIC (kJ/m2)E11(GPa) 120 CFRP 20 3.510-3 0.221
E22=E33(GPa) 8.8 CFRP/VGCF(10) 35 3.510-3 0.318G12=G13(GPa) 6.0 CFRP/VGCF(20) 35 3.510-3 0.432
G23(GPa) 3.7 CFRP/VGCF(30) 35 3.510-3 0.302 12= 13 0.25 CFFRP/MWCNT(5) 30 3.510-3 0.296
23 0.45 CFFRP/MWCNT(10) 30 3.510-3
0.350CFFRP/MWCNT(20) 30 3.510-3 0.337Table 3. Material properties for brick element and cohesive element in FEM simulation
Fig. 6. Comparison of experimental and numerical load-COD curves for CFRP/VGCF(30)
3. Two-phase CNT/Polymer nanocomposites
Pull-out simulations based on MM were carried out to investigate the interfacial propertiesbetween CNT and polymer matrix, which were further incorporated into the theoreticalmodel of continuum mechanics to develop a sequential multi-scale model for predicting theoverall mechanical properties of two-phase CNT/Polymer nanocomposites. The presentmethod is expected to be applied in CNT-reinforced nanocomposites with various matrices(e.g. metal, ceramics, etc.), which provides useful information for material design.
3.1 Pull-out simulation on Interfacial properties between CNT and polymer matrixTo investigate the interfacial properties between CNT and polymer matrix in two-phaseCNT/Polymer nanocomposites only due to van der Waals (vdW) interactions, a series ofCNT pull-out simulations from polyethylene (PE) matrix were carried out. Here, the

8/3/2019 InTech-Reinforcement Effects of Cnts for Polymer Based Nano Composites
http://slidepdf.com/reader/full/intech-reinforcement-effects-of-cnts-for-polymer-based-nano-composites 8/26
Carbon Nanotubes – Polymer Nanocomposites136
condensed phase optimization molecular potentials for atomistic simulation studies(COMPASS) force field [Sun, 1998] was employed to calculate the systematic potentialenergy, which has been broadly testified for CNT itself and CNT-reinforced nanocompositesbecause of providing reliable results as compared with more accurate tight-binding or abinitio density functional theory based methods. The PE was chosen as matrix because itsstructural simplicity can effectively reduce the computational cost. Moreover, PE as arepresentative polymer matrix can give a general picture of the possible interfacialbehaviour of various CNT-reinforced polymer nanocomposites. The simulation cell wascomposed of a fragment of CNT totally embedded inside PE matrix. TakingSWCNT(5,5)/PE nanocomposites as a benchmark, the processes of model building and CNTpull-out are described in detail in the following.
3.1.1 Model buildingThe unit cell of simulation system, which was of periodic boundary conditions iny-z plane,was initialized by randomly generating 36 PE chains with initial density of 1.2g/cm3 surrounding an open-ended SWCNT(5,5). Each PE chain had 20 repeating units of –CH2.The length and diameter of the SWCNT(5,5) fragment werel=4.92nm andD=0.68nm,respectively. Note that the unsaturated boundary effect was avoided by adding hydrogenatoms at both ends of the SWCNT. The hydrogen atom had charge of +0.1268e and theconnected carbon atom had charge of -0.1268e, which made the SWCNT neutral. Thecorresponding computational cell constructed was in the range of 2.69nm2.69nm 4.9nm inwhich the volume fraction of SWCNT wasV f =9.0vol.%. Note that the size of computationalcell atx axis (i.e. the axial direction of CNT) had to be set large enough to eliminate theinteraction among polymer itself [Marietta-Tondin, 2006]. As shown in Fig. 7a, the vacuumlayer was set for the CNT pull-out without extending the cell. The size of vacuum layer was
about the sum of the cut-off distance of vdW interaction (0.95nm) and nanotube length.The equilibrated structure of SWCNT/PE nanocomposites in Fig. 7 was obtained as follows:1. While holding SWCNT as a rigid, by virtue of MD simulations, the model was first put
into a constant-temperature, constant-volume (NVT) ensemble for 50ps and then aconstant-temperature, constant-pressure (NPT) ensemble for another 50ps withtemperature ofT =298K, pressure ofP=10atm, and time step oft=1fs after the initialminimization. The purpose of this step is to slowly compress the structure of the PE togenerate an initial amorphous matrix with correct density and low residual stress.
2. The nanocomposite system was further put into NVT ensemble and equilibrated for50ps at the same time step oft=1fs with releasing all rigid constraints on SWCNT. Thisstep is to create a zero initial stress state.
3. Finally, the nanocomposite system was minimized again using MM to obtain theequilibrated configuration in vacuum.
The equilibrated separation distanceh between SWCNT and PE matrix due to vdWinteraction was about 0.23nm in the present work as shown in Fig. 7b, which is very close tothe value of 0.18nm obtained by Han et al. [Han & Elliott, 2007] for SWCNT/PMMAnanocomposites. The difference can be attributed to the different types of polymer.
3.1.2 Pull-out processThe pull-out simulations of SWCNT from PE matrix were carried out by applyingdisplacement-controlled load on the atoms at the right end of CNT. The displacement

8/3/2019 InTech-Reinforcement Effects of Cnts for Polymer Based Nano Composites
http://slidepdf.com/reader/full/intech-reinforcement-effects-of-cnts-for-polymer-based-nano-composites 9/26
Reinforcement Effects of CNTs for Polymer-Based Nanocomposites 137
(CNT:l=4.92nm,D=0.68nm, C atoms: purple, H atoms: grey) Fig. 7. Equilibrated structure of simulation cell for SWCNT(5,5)/PE nanocompositesincrement along the axial (x-axis) direction of CNT wasx=0.2nm. Snap shots of the atomconfigurations for SWCNT/PE nanocomposites system during the pull-out process areshown in Fig. 8. Note that the deformation of PE matrix during the pull-out process wasneglected by fixing the matrix to reduce the computational cost, since it was confirmednumerically that the influence of the enforced conditions on polymer was very small.After each pull-out step, the molecular structure was relaxed to obtain the minimumsystematic potential energyE by MM. The potential energies of the SWCNT/PEnanocomposites were monitored and recorded during the whole pull-out process, whichwill be discussed in the following.
(a)x = 0 (b)x = 1nm
(c) x = 3nm (d)x = 5nmFig. 8. Snap shots of CNT pull-out from PE matrix
3.1.3 Variation of potential energy during pull-outIn view of that the work done by the pull-out force equals energy increment ofnanocomposite system at each pull-out step, the trend of potential energy variation, and theenergy increment at each pull-out step becomes very important for analyzing thecorresponding pull-out force, and the ISS between CNT and polymer matrix.The obtained systematic potential energyE during the pull-out is shown in Fig. 9a, whichincreases gradually accompanied with the CNT pull-out. This trend is just identical to all ofthe previous simulation results of CNT/Polymer nanocomposites [Liao & Li, 2001;Frankland et al., 2002; Gou et al., 2004; Zheng et al., 2009].

8/3/2019 InTech-Reinforcement Effects of Cnts for Polymer Based Nano Composites
http://slidepdf.com/reader/full/intech-reinforcement-effects-of-cnts-for-polymer-based-nano-composites 10/26
Carbon Nanotubes – Polymer Nanocomposites138
(a) Potential energyE (b) Energy increment E
Fig. 9. Variation ofE and E during the pull-out of SWCNT(5,5)Generally, this variation ofE can be divided into four parts, i.e. the variation of potentialenergy in polymer matrix; the variation of potential energy of CNT; the variation ofinterfacial bonding energy between CNT and polymer matrix; and possible thermaldissipation. Since the polymer was fixed during the pull-out process and the potentialenergy change of CNT was very small as confirmed in our computations, the variation ofE in the present simulation can be mainly attributed to the variation of interfacial bondingenergy between CNT and polymer matrix by neglecting thermal dissipation.Taking an example of the above SWCNT(5,5) pull-out from PE matrix, the calculated energyincrement E versus pull-out displacementx is shown by pink balls in Fig.9b, where threesuccessive stages can be discerned: in initial stageI , E increases sharply; after that,E goesthrough a long and platform stageII , followed by final descent stageIII until the completepull-out. As plotted, the total energy change during the pull-out (i.e., the pull-out energy)and the average energy increment in stageII are referred to as E and EII , respectively.Moreover, stageI and stageIII have the same approximate range ofa=1.0nm which is veryclose to the cut-off distance of vdW interaction. This trend is surprisingly coincident withthat observed sliding behaviour among nested walls in a MWCNT [Li et al., 2010]. Theobvious severe fluctuation of energy increment may be attributed to the non-uniformity ofpolymer matrix in the length direction of CNT. Note that the pull-out energy may also becalculated by using the developed continuum theoretical model for short-fibre reinforcedcomposites (e.g. [Fu & Lauke, 1997]), which plays important role in predicting the fracture
toughness of the composites.On this basis, the effects of CNTs’ dimensions on interfacial properties of CNT/Polymernanocomposites, were explored for the first time by comparing the energy increment ofseveral CNTs with different nanotube length, diameter, or wall number.
3.1.4 Effects of CNTs’ dimension
3.1.4.1 Effect of nanotube length
The variation of energy increment corresponding to the pull-out of several SWCNTs(5,5)with different lengths, are plotted in Fig. 10. Just as that in Fig. 9b, three distinct stages areclearly observed for each case. Moreover, among these three curves, there is no obvious

8/3/2019 InTech-Reinforcement Effects of Cnts for Polymer Based Nano Composites
http://slidepdf.com/reader/full/intech-reinforcement-effects-of-cnts-for-polymer-based-nano-composites 11/26
Reinforcement Effects of CNTs for Polymer-Based Nanocomposites 139
change in the magnitude of the platform stageII related to the stable CNT pull-out, whichindicates that EII is independent of nanotube length.
Fig. 10. Effect of nanotube length on energy increment of SWCNT(5,5)Due to this length-independent behaviour ofEII , the length ofl0=3.44nm was employed forall CNTs in the following simulations.3.1.4.2 Effect of nanotube diameter
The energy incrementE corresponding to the pull-out of several SWCNTs with differentdiameters are illustrated in Fig. 11a, which increases with nanotube diameter. BothE and
EII were found to increase linearly with nanotube diameterD as shown in Fig. 11b, whichcan be fitted as follows:
E=277.79D+62.39 (1)
EII =19.29D+4.27 (2)whereD has the unit of nm, E and EII have the unit of kcal/mol. This linear correlationcan be explained by the increase of interfacial atoms accompanied with the increase ofnanotube diameter. Note that the formula of Eq. (1) for calculating the pull-out energy isonly applicable for the pull-out of CNT with the length ofl0=3.44nm, in contrast to thelength-independent behaviour ofEII . In view of that E increases with nanotube length,for a real SWCNT with length oflr which is far longer than the present lengthl0, E can beestimated as follows
E* = E+ EII (lr -l0)/ x (l0<lr ) (3)wherelr is of the unit of nm, and the displacement increment here isx=0.2nm. Note that
E represents the pull-out energy of SWCNT with length ofl0=3.44nm which can becalculated by Eq. (1).In a word, the average increment in stageII ( EII ) during the pull-out process of thearmchair SWCNT from polymer matrix, corresponding to the interfacial properties betweenCNT and polymer matrix, is independent of nanotube length, but proportional to nanotube
E II

8/3/2019 InTech-Reinforcement Effects of Cnts for Polymer Based Nano Composites
http://slidepdf.com/reader/full/intech-reinforcement-effects-of-cnts-for-polymer-based-nano-composites 12/26
Carbon Nanotubes – Polymer Nanocomposites140
(a) Variation of energy increment (b) Dependence of energy increment on diameterFig. 11. Effect of nanotube diameter on energy increment of SWCNT(5,5)diameter, which is similar to that for the sliding among nested walls in a MWCNT [Li et al.,2010]. Moreover, by using Eqs (1-3), the pull-out energyE and average energy incrementin stageII EII for the pull-out of any armchair SWCNT can be predicted.3.1.4.3 Effect of wall number
To investigate the effect of wall numbern, three MWCNTs with different wall number wereembedded in PE matrix: SWCNT(15,15) withn=1, DWCNT(15,15)/(10,10) withn=2, andTWCNT(15,15)/(10,10)/(5,5) withn=3. The corresponding nanocomposites are referred toas: SWCNT/PE, DWCNT/PE, TWCNT/PE, respectively. Note that the above three CNTshave the same outermost wall with diameter ofD0=2.03nm and length ofl0=3.44nm.
The corresponding energy incrementE are plotted in Fig. 12, whose average value in stageII ( EII ) are listed in Table 4. From this table, it can be found that theEII for DWCNT/PE isabout 20% higher than that for SWCNT/PE. However, there is only a minor change ofEII
between DWCNT/PE and TWCNT/PE. The reason can be explained by the increase ofdistance between newly inserted inner walls and the interface. As the vdW interaction ismostly dependent on the distance, the longer the distance is, the weaker the induced vdWinteraction is.
Fig. 12. Effect ofn on energy increment
E II
E II

8/3/2019 InTech-Reinforcement Effects of Cnts for Polymer Based Nano Composites
http://slidepdf.com/reader/full/intech-reinforcement-effects-of-cnts-for-polymer-based-nano-composites 13/26
Reinforcement Effects of CNTs for Polymer-Based Nanocomposites 141
Therefore, EII for the MWCNT (n≥ 2) pull-out can be approximately estimated as 1.2 timesof that for corresponding SWCNT, which is actually the outermost wall of the MWCNT. Tosome extent, this finding is consistent with the reports of Schadler [Schadler et al., 1998] whoconcluded that only the outer walls are loaded in tension for CNT/Epoxy nanocompositesbased on the observation of Raman spectrum.Moreover, the calculated energy increment in the present simulation on the CNT pull-outfrom polymer matrix is compared with the reports [Li et al., 2010] on the pull-out ofoutermost wall in the same MWCNT as listed in Table 4. Obviously, the former is smallerthan the latter. It may indicate that even for some CNTs with fractured outer walls in theCNT/PE nanocomposites, the CNT is easier to be pulled out from matrix instead of that thefractured outer walls are pulled out against the corresponding inner walls.
Model EII (kcal/mol)
CNT Pull-outfrom PESWCNT/PE 43.07DWCNT/PE 51.13TWCNT/PE 52.71
Pull-out of theoutermost wall
DWCNT 55.11TWCNT 59.32
Table 4. Comparison of EII for two types of pull-out
3.1.5 Pull-out forceIn practical CNT/Polymer nanocomposites, the real pull-out force can be contributed fromthe following factors [Bal & Samal, 2007; Wong et al., 2003]: vdW interaction between CNTand PE matrix, possible chemical bonding between CNT and PE matrix, mechanicalinterlocking resulted by local non-uniformity of nanocomposites, such as waviness of CNT,mismatch in coefficient of thermal expansion, statistical atomic defects, etc. Consequently,the pull-out force can be divided into two parts, i.e.,F =F vdW +F m. Here,F vdW is the componentfor overcoming the vdW interaction at the interface which can be calculated by thefollowing Eq. (4); andF m is the frictional sliding force caused by the other factors stated. Themagnitudes of these two parts strongly depend on the interfacial state and CNT dimension.For almost perfect interface,F vdW dominates the pull-out force. On the other hand, for thecase of chemical bonding or mechanical interlocking, which in general occurs easily for largeCNTs,F m mainly contributes to the total pull-out force. In the present study, onlyF vdW andthe related ISS for perfect interface are considered as mentioned in the beforehand work.According to that the work done by the pull-out force at each pull-out step is equal to theenergy increment of nanocomposites, the corresponding pull-out force for the stable CNTpull-out stage should be also independent of nanotube length, but proportional to nanotubediameter, just as energy increment is.From the obtained energy incrementEII in Eq. (2) and pull-out displacement increment of
x=0.2nm, we can get the pull-out force as follows:
F II = EII / x= (0.67D+0.15) (4)whereF II and D have the units of nN and nm, respectively. The value of represents theeffect of wall number, which is 1.0 for SWCNT and 1.2 for MWCNT with consideration ofthe contribution of the inner walls.

8/3/2019 InTech-Reinforcement Effects of Cnts for Polymer Based Nano Composites
http://slidepdf.com/reader/full/intech-reinforcement-effects-of-cnts-for-polymer-based-nano-composites 14/26
Carbon Nanotubes – Polymer Nanocomposites142
3.1.6 Interfacial shear stress (ISS) and surface energy densityBased on the above discussions, the corresponding ISS and surface energy density areanalyzed in the following.The pull-out force is equilibrated with the axial component of vdW interaction whichinduces the ISS. Conventionally, if we employ the common assumption of constant ISS withuniform distribution along the embedded CNT, the pull-out forceF II will vary with theembedded length of CNT, which is obviously contradict with the above length-independentreports of EII . For the extreme case of CNT with infinite length, the ISS tends to be zero,which is physically unreasonable. This indicates that the conventional assumption of ISS isimproper for the perfect interface of CNT/PE nanocomposites. Therefore, in view of theabove characteristic of the variation of energy incrementEII , such as that the range of stageI or stageIII is around 1.0nm, it is concluded that the ISS is distributed solely at each end ofembedded CNT within the range ofa=1.0nm at the beginning of stageII or the end of stageI . In view of the dependence of vdW force upon the distance between two atoms, the ISS ateach end of the embedded CNT which is induced by the variation of vdW force, should atfirst increase sharply and then decrease slowly to zero after reaching the maximum. Here,by assuming its uniform distribution within two end regions for simplicity, the effective ISScan be derived as
II =F II /(2 Da) (5)By using Eqs. (1-5), the pull-out energyE, the average pull-out forceF II and the ISS II forCNT/PE nanocomposites can be calculated. As shown in Fig. 13a, the calculated ISS isfound to decrease initially with nanotube diameter and saturate at the value of 106.7MPa forSWCNT/PE nanocomposites. For MWCNT/PE, the saturated value is 128MPa, which isabout 1.2 times of that for SWCNT/PE, both of which has the same outermost wall.
On the other hand, in view of that two new surface regions are generated at the two ends ofCNT after each pull-out step, the corresponding surface energy should be equal to theenergy increment EII by neglecting thermal dissipation. Therefore, the surface energydensity can be calculated as
II = EII /(2 D x)=F II /(2 D) (6)
(a) Interfacial shear stress (ISS) (b) Surface energy densityFig. 13. Dependence of ISS and surface energy density on nanotube diameter

8/3/2019 InTech-Reinforcement Effects of Cnts for Polymer Based Nano Composites
http://slidepdf.com/reader/full/intech-reinforcement-effects-of-cnts-for-polymer-based-nano-composites 15/26
Reinforcement Effects of CNTs for Polymer-Based Nanocomposites 143
As shown in Fig. 13b, the surface energy density has the same trend as the ISS, whichinitially decreases slightly as nanotube diameter increases and finally converges at the valueof 0.11N/m. This value is very close to the previous reports of 6-8meV/Å2 (i.e., 0.09-0.12N/m) [Lordi & Yao, 2000] and 0.15 kcal/molÅ2 (i.e., 0.1 N/m) [Al-Ostaz et al., 2008] forSWCNT/PE nanocomposites, which indicates the effectiveness of the present simulation.
3.1.7 Comparison with previous reportsThe predicted ISS in the present study as given in Table 5 is obviously higher than that inthe previous reports [Frankland et al., 2002; Zheng et al., 2009; Al-Ostaz et al.] which iscalculated from
=2 E/( Dl2) (7)The reason of this big difference is that the assumption of the constant ISS with uniformdistribution along the total embedded length of CNT employed in previous numerical
simulation, which has been verified to be unreasonable here.
Ref.SWCNT Experimental reports Present predictionD
(nm)l
(nm)E*
(kcal/mol) *
(MPa)E*
(kcal/mol)
(MPa)[Frankland et al., 2002] 1.36 5.3 2.7 707.4 123.9
[Zheng et al., 2009] 1.36 5.9 ~500 33 798.8 123.9[Al-Ostaz et al., 2008] 0.78 4.2 224 133 352.2 137
Table 5. Prediction in previous simulations for SWCNT/PE nanocompositesFor the pull-out force, the calculated values using the proposed formulae of Eqs.(1-4) arecompared with that reported in direct CNT pull-out experiments at nano-scale from severaldifferent polymer matrices, as shown in Table 6. Obviously, the reported pull-out forces aremuch higher than the calculated values only when vdW interactions are considered at theinterface between CNT and polymer matrix, although severe experimental data scatteringhas been observed which may be caused by manipulation process or force/displacementmeasurement. The reason can be attributed to the following factors.Firstly, if we take into account the curvature of CNT (Fig. 14a), the necessary pull-out forcewill increase. Considering a special case with the highest probability where an inclinedangle between the axial direction of CNT and the pull-out direction is 45˚ (Fig. 14b), the
Fig. 14. Simplified model for the pull-out of curved and oblique CNT

8/3/2019 InTech-Reinforcement Effects of Cnts for Polymer Based Nano Composites
http://slidepdf.com/reader/full/intech-reinforcement-effects-of-cnts-for-polymer-based-nano-composites 16/26
Carbon Nanotubes – Polymer Nanocomposites144
Ref. Matrix MWCNT Pull-out force (N)D (nm) Exp. Prediction
[Deng, 2008] PEEK 49 1.04 0.0489 8.6 0.07
[Barber et al., 2003] PE-butene 80 0.85 0.07
[Cooper et al., 2002] Epoxy8.2 3.8 0.0111 2.8 0.01
13.4 0.6/2.3 0.0124 6.8/12.8 0.2
Table 6. Prediction of previous experiments for MWCNT/Polymer nanocompositescorresponding pull-out force will increase about 40%. By observing the data in Table 6, thisincrease effect is still too small compared with the experimental data.Secondly, for the effect of the pressure or residual stress in nanocomposites, a simple
representative volume element (RVE) model (Fig. 15a) was constructed to perform FEManalysis. This continuum mechanics based computation is valid, at least qualitatively whenthe diameter of CNT is over several tens of nanometers. Assuming the symmetricalstructure, the quarter part of interface region (i.e. the blue part in Fig. 15b) was employed.
(a) Simplified composite model (b) FEM model of interfaceFig. 15. Simplified FEM model of interface between CNT and matrixThe inner wall surface of the interface region was fixed as boundary condition, whichrepresents the rigid CNT. The uniform static pressure was applied on the outer wall ofinterface region. Two values of Young’s modulusEi for the interface region wereconsidered, i.e., 1GPa and 3GPa. The corresponding FEM model is shown in Fig. 15b, wherethe size of element size was taken as 0.05nm for convergence and accuracy.
The relationship of strain energy density and the applied pressure p is shown in Fig. 16, inwhich strain energy increases by the power of square with p. It can be found that a large
pressure p can only cause very small increase of strain energy density , which indicates thatthe effect of pressure or residual stress is not as strong as we expected. In general, theresidual stress in polymer nanocomposites ranges from 25.0MPa to 40.0MPa. For instance,for the case ofEi=1GPa of interface region, by applying for the pressure of 30.0MPa, thestrain energy density is around 2.8510-5N/m, which is still much smaller than the surfaceenergy density of II =0.11N/m caused by vdW interaction as stated previously. It means thatthe pressure or residual stress in polymer nanocomposite system is not a dominant factor.The above discussion leads to an important conclusion, i.e., the interface properties betweenCNT and polymer matrix contributed by vdW interaction is quite minor for the real

8/3/2019 InTech-Reinforcement Effects of Cnts for Polymer Based Nano Composites
http://slidepdf.com/reader/full/intech-reinforcement-effects-of-cnts-for-polymer-based-nano-composites 17/26
Reinforcement Effects of CNTs for Polymer-Based Nanocomposites 145
Fig. 16. Relationship between applied pressure and strain energy densityCNT pull-out from polymer matrix. Therefore, to accurately evaluate the interfacialproperties for real case, it is necessary to incorporate the effects of frictional sliding causedby mechanical interlocking, atomic statistical defects, or chemical bonding. Moreover, foreffectively improving the interfacial properties and therefore the mechanical properties ofbulk nanocomposites, it is vital to incorporate into chemical bonding and mechanicalinterlocking, which will be the topic in the future.Note that although the type of polymer will influence the value of ISS which is notdiscussed in the present work, the characteristics of pull-out force and the corresponding ISSwill be similar to those discussed in CNT/PE nanocomposites here.
3.2 Characterization on overall mechanical properties of CNT/PolymernanocompositesTo investigate the overall mechanical properties of CNT/Polymer nanocomposites, tensiletests and SENB tests were carried out, in which MWCNT-7 and VGCF® were used asreinforcement filler, respectively. Moreover, a sequential multi-scale model was developedby incorporating the interfacial properties between CNT and polymer matrix obtained fromprevious pull-out simulations into the conventional continuum theory, which connects theinterfacial properties to overall mechanical properties of CNT/Polymer nanocomposites.
3.2.1 Mechanical tests for CNT/Epoxy nanocompositesEpoxy resin jER806 (Japan Epoxy Resins Co., Ltd., Japan) and the hardener Tohmide-245LP(Fuji Kasei Kogyou Co., Ltd., Japan) were used to prepare the polymer matrix with theweight ration of 100:62. According to the weight fractionW f of reinforcements, two groupsof nanocomposites were fabricated: MWCNT/Epoxy withW f of MWCNT-7 varying at 2, 3,4%, and VGCF/Epoxy withW f of VGCF® varying at 2, 4, 6%. The fabrication process asshown in Fig. 17 is described below:1. The epoxy resin was first heated to 60˚ C in an oven to decrease the viscosity for its
better miscibility with MWCNTs;2. Then the CNTs were dispersed into the epoxy resin using the planetary centrifugal
mixer at 2000rpm for 10min;

8/3/2019 InTech-Reinforcement Effects of Cnts for Polymer Based Nano Composites
http://slidepdf.com/reader/full/intech-reinforcement-effects-of-cnts-for-polymer-based-nano-composites 18/26
Carbon Nanotubes – Polymer Nanocomposites146
3. After adding the hardener, the mixture was agitated for another 10 min at 1000rpm;4. Subsequently, the mixture was poured into the silicon mould for a pre-curing process
with 12h at room temperature, followed by a post-curing process which was performedat 80˚ C in the oven for 6h.
Fig. 17. Fabrication of MWCNT/Epoxy nanocomposites for mechanical tests
(a) Young’s modulus (b) Tensile strengthFig. 18. Comparison of theoretical and experimental Young’s modulus and tensile strength
Fig. 19. Experimental fracture toughnessAccording to ASTM D638 (Type V) and ASTM D5045 standards, tensile tests and SENB testswere preformed. Three specimens of the above fabricated composites at a specified CNTloading were prepared. A universal materials testing machine (Instron 5567) was used with
Epoxy
MWCNT Hardener

8/3/2019 InTech-Reinforcement Effects of Cnts for Polymer Based Nano Composites
http://slidepdf.com/reader/full/intech-reinforcement-effects-of-cnts-for-polymer-based-nano-composites 19/26
Reinforcement Effects of CNTs for Polymer-Based Nanocomposites 147
a cross-head speed of 0.25mm/min. The Poisson’s ratio of nanocomposites measured intensile tests by using bi-axial strain gages was directly used in the evaluation of fracturetoughness in SENB tests.The obtained Young’s modulusEc, tensile strength c of MWCNT/epoxy and VGCF/Epoxynanocomposites are plotted in Fig. 18. As shown in Fig. 18a, the largest increase of 31% and36% inEc from 2.14GPa of neat epoxy occur at 4wt% loading for MWCNT/Epoxy and at6wt% loading for VGCF/Epoxy, respectively. In Fig. 18b, c increases obviously fornanocomposites. At 4wt% loading, the highest increases are 14.1% for MWCNT/Epoxy and
(a) MWCNT/Epoxy (3wt%) (b) MWCNT/Epoxy (4wt%)
(c) VGCF/Epoxy (4wt%) (d) VGCF/Epoxy (6wt%)
(e) MWCNT/Epoxy (2wt%)Fig. 20. SEM pictures of SENB specimens
Aggregates
Pull-out

8/3/2019 InTech-Reinforcement Effects of Cnts for Polymer Based Nano Composites
http://slidepdf.com/reader/full/intech-reinforcement-effects-of-cnts-for-polymer-based-nano-composites 20/26
Carbon Nanotubes – Polymer Nanocomposites148
23.1% for VGCF/Epoxy from 39.4MPa of neat epoxy. The effect of VGCF in c is slightlybetter than that of MWCNT. Moreover, c decreases slightly when the addition is over 4wt%for VGCF/Epoxy. However, there is no obvious saturation trend in c even at 4wt% loadingof MWCNT, which means that c may be enhanced with further addition of MWCNT. Thecorresponding Mode-I fracture toughnessGIC is given in Fig. 19, a remarkable increase, i.e.85.5% can be identified for 2wt% MWCNT loading, although the effect of VGCF toGIC isunpromising.In order to clarify the reinforcement mechanism, SEM observations were performed on thefracture surfaces of SENB specimens as shown in Fig. 20. Even there are some smallaggregates at a high loading, e.g. 4wt% in Fig. 20(b), good dispersion of MWCNT or VGCFcan be identified, which leads to the increase ofE and b in both nanocomposites. As shownin Fig. 19, 6wt% VGCF leads to the lowestGIC while 2wt% MWCNT provides the highest GIC . However, it is difficult to distinguish them through the fracture surfaces from Fig. 20 (d)and (e), although the former demonstrates a clear brittle fracture feature. One possible
reason for the increase ofGIC in 2wt% MWCNT may be there are more pull-out holes ofMWCNT, which improves the fracture toughness.
3.2.2 Theoretical prediction on tensile properties of MWCNT/Polymer nanocompositesWith consideration of fibre length and fibre orientation distribution, Cox’s shear-lag model[Cox, 1952; Krenchel, 1964] predicts the longitudinal modulus of short-fiber reinforcedcomposites as
E= o lE f V f +Em(1-V f ) (8)whereV f is the volume fraction of fiber,E f and Em are Young’s moduli of nanofiller and
matrix, respectively. The orientation efficiency factor o is 1/5 for three-dimensional randomdistribution, and the nanofiller length efficiency factor l was given in Ref. [Cox, 1952]. Thepredicted Young’s modulus is also plotted in Fig. 18(a), which is a bit higher thanexperimental ones, especially for higher nanofiller loadings, which may be caused by thedifficult dispersion of nanofiller in experiments.For short-fiber reinforced composites under the assumption of iso-strain state in the fibersand matrix, Fukuda and Chou [Fukuda & Chou, 1982] developed a probabilistic theory asfollows
0
0
1 1 ( )2
1 ( )2
cultf f m f c
f ultc f
ultf f m f cc
lV C V l l
l
lV C V l l
l
(9)
wherel f is the length of fiber, ultf the tensile strength of fiber,'m the matrix stress at thefailure of composites, andC 0 the orientation factor which is 1/8 in the case of three-dimensional random array model. The critical lengthlc is defined as [Kelly & Tyson, 1965]
lc= ultlr f V f / y (10)wherer f is the fiber radius, and y is the shear strength of fiber/matrix interface.
8/3/2019 InTech-Reinforcement Effects of Cnts for Polymer Based Nano Composites
http://slidepdf.com/reader/full/intech-reinforcement-effects-of-cnts-for-polymer-based-nano-composites 21/26
Reinforcement Effects of CNTs for Polymer-Based Nanocomposites 149
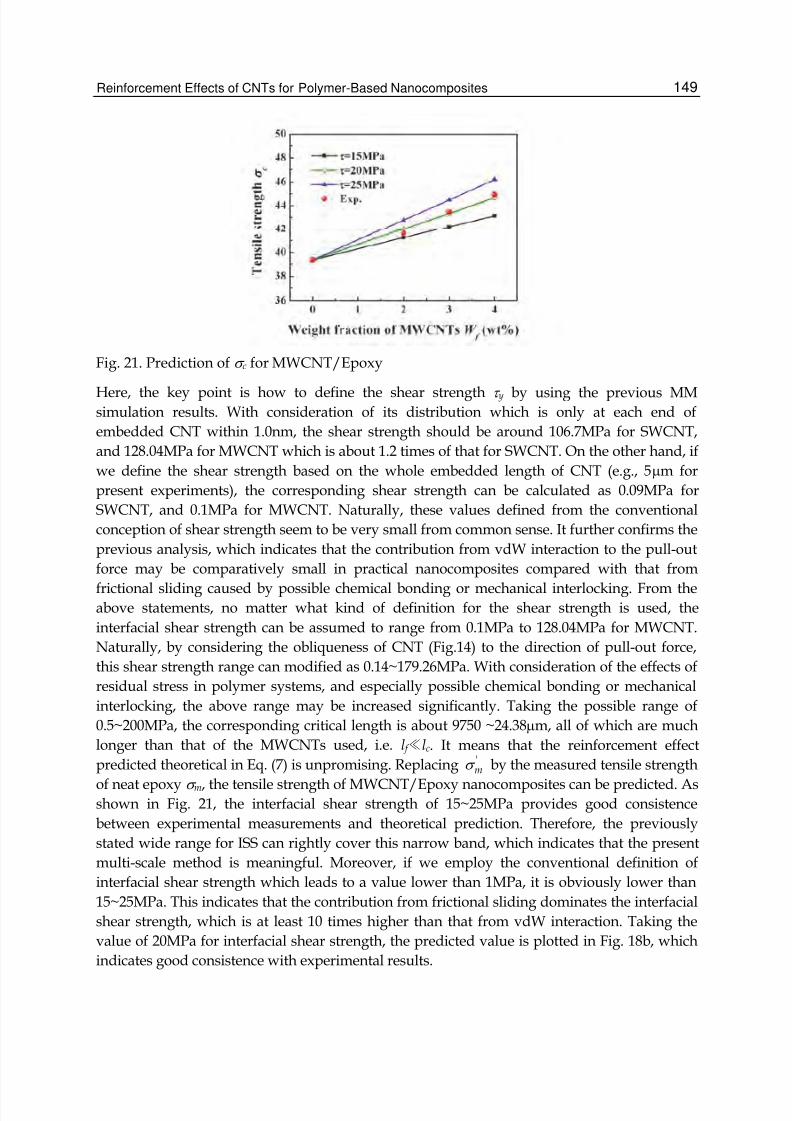
Fig. 21. Prediction of c for MWCNT/Epoxy
Here, the key point is how to define the shear strength y by using the previous MMsimulation results. With consideration of its distribution which is only at each end ofembedded CNT within 1.0nm, the shear strength should be around 106.7MPa for SWCNT,and 128.04MPa for MWCNT which is about 1.2 times of that for SWCNT. On the other hand, ifwe define the shear strength based on the whole embedded length of CNT (e.g., 5m forpresent experiments), the corresponding shear strength can be calculated as 0.09MPa forSWCNT, and 0.1MPa for MWCNT. Naturally, these values defined from the conventionalconception of shear strength seem to be very small from common sense. It further confirms theprevious analysis, which indicates that the contribution from vdW interaction to the pull-outforce may be comparatively small in practical nanocomposites compared with that from
frictional sliding caused by possible chemical bonding or mechanical interlocking. From theabove statements, no matter what kind of definition for the shear strength is used, theinterfacial shear strength can be assumed to range from 0.1MPa to 128.04MPa for MWCNT.Naturally, by considering the obliqueness of CNT (Fig.14) to the direction of pull-out force,this shear strength range can modified as 0.14~179.26MPa. With consideration of the effects ofresidual stress in polymer systems, and especially possible chemical bonding or mechanicalinterlocking, the above range may be increased significantly. Taking the possible range of0.5~200MPa, the corresponding critical length is about 9750 ~24.38m, all of which are muchlonger than that of the MWCNTs used, i.e.l f ≪ lc. It means that the reinforcement effectpredicted theoretical in Eq. (7) is unpromising. Replacing'
m by the measured tensile strength
of neat epoxy m, the tensile strength of MWCNT/Epoxy nanocomposites can be predicted. Asshown in Fig. 21, the interfacial shear strength of 15~25MPa provides good consistencebetween experimental measurements and theoretical prediction. Therefore, the previouslystated wide range for ISS can rightly cover this narrow band, which indicates that the presentmulti-scale method is meaningful. Moreover, if we employ the conventional definition ofinterfacial shear strength which leads to a value lower than 1MPa, it is obviously lower than15~25MPa. This indicates that the contribution from frictional sliding dominates the interfacialshear strength, which is at least 10 times higher than that from vdW interaction. Taking thevalue of 20MPa for interfacial shear strength, the predicted value is plotted in Fig. 18b, whichindicates good consistence with experimental results.

8/3/2019 InTech-Reinforcement Effects of Cnts for Polymer Based Nano Composites
http://slidepdf.com/reader/full/intech-reinforcement-effects-of-cnts-for-polymer-based-nano-composites 22/26
Carbon Nanotubes – Polymer Nanocomposites150
4. Conclusion
The above research results clearly clarify the different reinforcement effects of two kinds ofCNTs (i.e., MWCNT-7 and VGCF®) in two types of nanocomposites (i.e., three-phase hybrid
CFRP laminates and two-phase CNT/Polymer nanocomposites).For three-phase hybrid CFRP laminates , a new simple fabrication method powder methodwas developed to disperse CNTs at the interface between CFRP plies. DCB experiments andFEM analysis were carried out which verifies the significant improvement of interlaminarmechanical properties.Fortwo-phase CNT/Polymer nanocomposites , the interfacial properties between CNT andpolymer matrix was clarified, where the effects of nanotube length, diameter and wallnumber were explored for the first time. Moreover, the obtained interfacial mechanicalproperties were incorporated into the continuum mechanics to develop a sequential multi-scale model, which predicts the overall mechanical properties of nanocomposites andindicates the relationship between the interfacial properties and overall mechanical
properties.
5. Acknowledgment
This work is partly supported by two Grand-in-Aids for Scientific Research (No. 19360045and No. 22360044) from the Japanese Ministry of Education, Culture, Sports, Science andTechnology. The authors acknowledge Prof. C. B. Fan (Beijing Institute of Technology,China) for kindly providing the computational resources.
6. References
Ajayan, P.M.; Stephan, O.; Colliex, C. & Trauth, D. (1994) Aligned Carbon Nanotube ArraysFormed by Cutting a Polymer Resin-nanotube Composite.Science, Vol. 265, pp1212.
Al-Ostaz, A.; Pal, G.; Mantena, P.R.; Cheng, A. (2008) Molecular Dynamics Simulation ofSWCNT-Polymer Nanocomposite and its Constituents. Journal of Materials Science, Vol. 43, pp 164-173.
Andrews, R.; Jacques, D.; Minot, M. & Rantell, T. (2002) Fabrication of Carbon MultiwallNanotube/Polymer Composites by Shear Mixing. Macromolecular Materials andEngineering, Vol. 287, pp 395-403.
Arai, M.; Noro, Y.; Sugimoto, K. & Endo M. (2008) Mode I and Mode II InterlaminarFracture Toughness of CFRP Laminates Toughened by Carbon NanofiberInterlayer.Composites Science and Technology,Vol. 68, pp 516-525.Bal, S. & Samal, S.S. (2007) Carbon Nanotube Reinforced Polymer Composites - A State ofArt.Bulletin of Materials Science,Vol. 30, No. 4, pp 379-386.
Bangarusampath, D.S.; Ruckdaschel, H.; Altstadat, V.; Sandler, J.K.W.; Garray, D.& ShafferM.S.P. (2009) Rheology and Properties of Melt-Processed Poly (ether ether ketone)/Multi-Wall Carbon Nanotube Composites.Polymer, Vol. 50, pp 5803- 5811.
Barber, A.H.; Cohen, S.R.; Kenig, S. & Wagner, H.D. (2003) Measurement of CarbonNanotube-Polymer Interfacial Strength. Applied Physics Letters, Vol. 82, No. 23, pp4140-4142.

8/3/2019 InTech-Reinforcement Effects of Cnts for Polymer Based Nano Composites
http://slidepdf.com/reader/full/intech-reinforcement-effects-of-cnts-for-polymer-based-nano-composites 23/26
Reinforcement Effects of CNTs for Polymer-Based Nanocomposites 151
Barber, A.H.; Cohen, S.R.; Kenig, S. & Wagner, H.D. (2004) Interfacial Fracture EnergyMeasurements for Multi-walled Carbon Nanotubes Pulled from a Polymer Matrix.Composite Science and Technology,Vol. 64, pp 2283-2289.
Bhattacharyya, A.R.; Sreekumar, T.V.; Liu, T.; Kumar, S.; Ericson, L.M.; Hauge, R.H. &Smalley, R.E. (2003) Crystallization and Orientation Studies inPolypropylene/Single Wall Carbon Nanotube Composite.Polymer, Vol. 44, pp2373-2377.
Camanho, P.P. & Davila, C.G. (2002) Mixed-mode Decohesion Finite Elements for theSimulation of Delamination in Composite Materials. NASA/TM, pp. 211737.
Cao, Y.; Hu, N.; Lu, J.; Fukunaga, H. & Yao, Z. (2002) A 3D Brick Element based on Hu-Washizu Variational Principle for Mesh Distortion.International Journal for Numerical Methods in Engineering, Vol. 53, pp 2529-2548.
Chowdhury, S.C. & Okabe, T. (2007) Computer Simulation of Carbon Nanotube Pull-outfrom Polymer by the Molecular Dynamics Method.Composites Part A, Vol. 38, pp747-754.
Chang, T.E.; Jensen, L.R.; Kisliuk, A.; Pipes, R.B.; Pyrz, R. & Sokolov, A.P. (2005) MicroscopMechanism of Reinforcement in Single-Wall Carbon Nanotube/PolypropyleneNanocomposite.Polymer, Vol. 46, pp 439-444.
Chang, T.E.; Kisliuk, A.; Rhodes, S.M.; Brittain, W.J. & Sokolov, A.P. (2006) Conductivityand Mechanical Properties of Well-Dispersed Single-Wall Carbon Nanotube/Polystyrene Composite.Polymer, Vol. 47, pp 7740-7746.
Ci, L. & Bai, J. (2006) The Reinforcement Role of Carbon Nanotues in Epoxy Compositeswith Different Matrix Stiffness.Composite Science and Technology,Vol. 66, pp 599-603.
Cooper, C.A.; Ravich, D.; Lips, D.; Mayer, J. & Wagner, H.D. (2002) Distribution and
Alignment of Carbon Nanotubes and Nanofibrils in a Polymer Matrix.CompositeScience and Technology,Vol. 62, pp 1105-1112.Cooper, C.A.; Cohen, S.R.; Barber, A.H. & Wagner, H.D. (2002) Detachment of Nanotubes
from a Polymer Matrix. Applied Physics Letters, Vol. 81, No. 20, pp 3873-3875.Cox, H.L. (1952) The Elasticity and Strength of Paper and Other fibrous Materials.British
Journal of Applied Physics,Vol. 3, pp 72-79.Curran, S.; Davey, A.P.; Coleman, J.; Dalton, A.; McCarthy, B.; Maier, S.; Drury, A.; Gray, D.
Brennan, M.; Ryder, K.; Chapelle, M.L.; Journet, C.; Bernier, P.; Byrne, H.J.; Carroll,D.; Ajayan, P.M.; Lefrant, S.; Blau, W. (1999) Evolution and Evalution of thePolymer/Nanotube Composite.Synthetic Metals, Vol. 103, pp 2559-2562.
Demczyk, B.G.; Wang, Y.M.; Cumings, J.; Hetman, M.; Han, W.; Zettl, A.; Ritchie, R.O.
(2002) Direct Mechanical Measurement of the Tensile Strength and Elastic Modulusof Multiwalled Carbon Nanotubes. Materials Science and Engineering A, Vol. 334, pp173-178.
Deng, F.; Ogasawara, T. & Takeda, N. (2007) Experimental Characterization of Poly (EtherEther Ketone)/Multi-Wall Carbon Nanotube Composites.Key Engineering Materials, Vol. 334-335, pp 721-724.
Deng, F. (2008) Investigation of the Interfacial Bonding and Deformation Mechanism of theNano Composites Containing Carbon Nanotubes. Tokyo University. PhDDissertation.

8/3/2019 InTech-Reinforcement Effects of Cnts for Polymer Based Nano Composites
http://slidepdf.com/reader/full/intech-reinforcement-effects-of-cnts-for-polymer-based-nano-composites 24/26
Carbon Nanotubes – Polymer Nanocomposites152
Ding, W.; Eitan, A.; Fisher, FT.; Chen, X.; Dikin, D.A.; Andrews, R.; Brinson, L.C.; SchadlerL.S. & Ruoff, R.S. (2003) Direct Observation of Polymer Sheathing in CarbonNanotube-Polycarbonate Composites.Nano Letters, Vol. 3, No. 11, pp 1593-1597.
Frankland, S.J.V.; Caglar, A.; Brenner, D.W. & Griebel, M. (2002) Molecular Simulation of theInfluence of Chemical Cross-links on the Shear Strength of Carbon Nanotube-Polymer Interfaces. Journal of Physical Chemistry B,Vol. 106, pp 3046-3048.
Fu, S.Y. & Lauke, B. (1997) The Fiber Pull-out Energy of Misaligned Short Fibre Composites. Journal of Materials Science,Vol. 32, pp 1985-1993
Gao, X.L. & Li, K. (2005) A Shear-lag Model for Carbon Nanotube-Reinforced PolymerComposites.International Journal of Solids and Structures, Vol. 42, pp 1649- 1667.
Garcia, E.J.; Wardle, B.L. & Hart, A.J. (2008) Joining Prepreg Composite Interfaces withAligned Carbon Nanotubes.Composites Part A, Vol. 39, pp 1065-1070.
Gojny, F.H.; Nastalczyk, J.; Roslaniec, Z. & Schulte, K. (2003) Surface Modified Multi-WalledCarbon Nanotubes in CNT/Epoxy-Composites.Chemical Physics Letters, Vol. 370,pp 820-824.
Gojny, F.H.; Wichmann, M.H.G.; Fiedler, B. & Schulte, K. (2005) Influence of DifferentCarbon Nanotubes on the Mechanical Properties of Epoxy Matrix Composites - AComparative Study.Composite Science and Technology,Vol. 65, pp 2300- 2313.
Gojny, F.H.; Wichmann, M.H.G.; Kopke, U.; Fiedler, B. & Schulte, K. (2004) CarbonNanotube-Reinforced Epoxy-Composites: Enhanced Stiffness and FractureToughness at Low Nanotube Content.Composite Science and Technology,Vol. 64, pp2363-2371.
Gou, J.; Minaie, B.; Wang, B.; Liang, Z. & Zhang, C. (2004) Computational and ExperimentalStudy of Interfacial Bonding of Single-walled Nanotube Reinforced Composites.Computational Materials Science, Vol. 31, pp 225-236.
Haggenmueller, R.; Gommans, H.H.; Rinzler, A.G.; Fischer, J.E. & Winey, K.I. (2000)Aligned Single-wall Carbon Nanotubes in Composites by Melt Processing methods.Chemical Physics Letters,Vol. 330, No.10, pp 219-225.
Han, Y. & Elliott, J. (2007) Molecular Dynamics Simulations of the Elastic Properties ofPolymer/Carbon Nanotube Composites.Computational Materials Science, Vol. 39,No. 2, pp 315-323.
He, X.; Zhang, F.; Wang, R. & Liu, W. (2007) Preparation of a Carbon Nanotube/CarbonFiber Multi-Scale Reinforcement by Grafting Multi-walled Carbon Nanotubes ontothe Fibers.Carbon, Vol. 45, pp 2559-2563.
Inam, F.; Wong, D.W.Y.; Kuwata, M. & Peijs, T. (2010) Multiscale Hybrid Micro-Nanocomposites based on Carbon Nanotubes and Carbon Fibers.Journal of
Nanomaterials. (In press) Jiang, X.; Bin, Y. & Matsuo M. (2005) Electrical and Mechanical Properties of Polyimide-Carbon Nanotubes Composites Fabricated by In Situ Polymerization.Polymer, Vol.46, pp 7418-7424.
Jiang, L.Y.; Huang, Y.; Jiang, H.; Ravichandran, G.; Gao, H.; Hwang, K.C. & Liu, B. (2006) ACohesive Law for Carbon Nanotube/Polymer Interfaces based on the van derWaals Force. Journal of the Mechanics and Physics of Solids,Vol. 54, pp 2436- 2452.
Jin, L.; Bower, C. & Zhou, O. (1998) Alignment of Carbon Nanotube in a Polymer Matrix byMechanical Stretching. Applied Physics Letters, Vol. 73, No. 9, pp1197-1193.

8/3/2019 InTech-Reinforcement Effects of Cnts for Polymer Based Nano Composites
http://slidepdf.com/reader/full/intech-reinforcement-effects-of-cnts-for-polymer-based-nano-composites 25/26
Reinforcement Effects of CNTs for Polymer-Based Nanocomposites 153
Karapappas, P.; Vavouliotis, A.; Tsotra, P. & Kostopoulos, V. (2009) Enhanced FractureProperties of Carbon Reinforced Composites by the Addition of Multi-Wall CarbonNanotubes. Journal of Composite Materials, Vol. 43, No. 9, pp 977-985.
Kelly, A. & Tyson, W.R. (1965) Tensile Properties of Fiber-reinforced Metals:Copper/Tungsten and Copper/Molybdenum. Journal of the Mechanics and Physics of Solids, Vol. 13, pp 329-350.
Kepple, K.L.; Sanborn, G.P.; Lacasse, P.A.; Gruenberg, K.M. & Ready, W.J. (2008) ImprovedFracture Toughness of Carbon Fiber Composite Functionalized with Multi WalledCarbon Nanotubes.Carbon, Vol. 46, pp 2026-2033.
Fukuda, H. & Chou, T.W. (1982) A Probabilistic Theory of the Strength of Short-fiberComposites with Variable Fiber Length and Orientation.Journal of Materials Science, Vol. 17, pp 1003.
Kimura, T.; Ago, H.; Tobita, M.; Ohshima, S.; Kyotani, M. & Yumura, M. (2003) PolymerComposites of Carbon Nanotubes Aligned by a Magnetic Field.Advanced Materials,Vol. 14, No. 19, pp 1380-1383.
Krenchel, H. (1964) Fibre Reinforcement. Akademisk Forlag. Copenhagen.Lau, K. (2003) Interfacial Bonding Characteristics of Nanotube/Polymer Composites.
Chemical Physics Letters,Vol. 370, pp 399-405.Lee, W.; Lee, S. & Kim C. (2006) The Mechanical Properties of MWNT/PMMA
Nanocomposites Fabricated by Modified Injection Molding.Composite Structures, Vol. 76, pp 406-410.
Li, Y.; Hu, N.; Yamamoto, G.; Wang, Z.; Hashida, T.; Asanuma, H.; Dong, C.; Okabe, T.;Arai, M. & Fukunaga, H. (2010) Molecular Mechanics Simulation of the SlidingBehavior between Nested Walls in a Multi-walled Carbon Nanotube.Carbon, Vol.48, pp 2934-2940.
Liao, K. & Li S. (2001) Interfacial Characteristics of a Carbon Nanotube-PolystyreneComposite System. Applied Physics Letters, Vol. 79, No. 25, pp 4225-4227.Lordi, V. & Yao, N. (2000) Molecular Mechanics of Binding in Carbon-Nanotube-Polymer
Composites. Journal of Materials Research, Vol. 15, No. 12, pp 2770-2779.Marietta-Tondin, O. (2006) Molecular Modelling of Nanotube Composite Materials:
Interface Formation, Interfacial Strength, and Thermal Expansion. The Florida StateUniversity. PhD Dissertation.
Natsuki, T.; Wang, F.; Ni, Q.Q. & Endo, M. (2007) Interfacial Stress Transfer of Fiber Pulloutfor Carbon Nanotubes with a Composite Coating. Journal of Materials Science,Vol.42, pp 4191-4196.
Ogasawara, T.; Ishida, Y.; Ishikawa, T. & Yokota, R. (2004) Characterization of Multi-walled
Carbon Nanotube/Phenylethynyl Termainated Polyimide Composites.Composite:Part A, Vol. 35, pp 67-74.Qian, D.; Dickey, E.C.; Andrews, R. & Rantell, T. (2000) Load Transfer and Deformation
Mechanisms in Carbon Nanotube-Polystyrene Composites. Applied Physics Letters, Vol. 76, No. 20, pp 2868-2870.
Rosca, I.D. & Hoa, S.V. (2009) Highly Conductive Multiwall Carbon Nanotube and EpoxyComposites Produced by Three-roll Milling.Carbon, Vol. 47, pp 1958-1968.
Safadi, B.; Andrews, R. & Grulke, E.A. (2002) Multiwalled Carbon Nanotube PolymerComposites: Synthesis and Characterization of Thin Films.Journal of AppliedPolymer Science,Vol. 84, pp 2660-2669.

8/3/2019 InTech-Reinforcement Effects of Cnts for Polymer Based Nano Composites
http://slidepdf.com/reader/full/intech-reinforcement-effects-of-cnts-for-polymer-based-nano-composites 26/26
Carbon Nanotubes – Polymer Nanocomposites154
Schadler, L.S.; Giannaris, S.C. & Ajayan, P.M. (1998) Load Transfer in Carbon NanotubeEpoxy Composites.Applied Physics Letters,Vol. 73, No. 26, pp 3842-3844.
Sen, R.; Zhao, B.; Perea, D.; Itkis, M.E.; Hu, H.; Love, J.; Bekyarova, E. & Haddon, R.C. (200Preparation of Single-walled Carbon Nanotube Reinforced Polystyrene andPolyurethane Nanofibers and Membranes by Electrospinning.Nano Letters, Vol. 4,No. 3, pp 459-464.
Sun, H. (1998) COMPASS: An ab Initio Force-Field Optimized for Condensed-PhaseApplications - Overview with Details on Alkane and Benzene Compounds.Journalof Physical Chemistry B,Vol. 102, No. 38, pp 7338-7364.
Tai, N.; Yeh, M. & Liu J. (2004) Enhancement of the Mechanical Properties of CarbonNanotube/Phenolic Composites using a Carbon Nanotube Network as theReiforcement.Carbon, Vol. 42, pp 2735-2777.
Thostenson, E.T.; Li, W.Z.; Wang, D.Z.; Ren, Z.F. & Chou, T.W. (2002) CarbonNanotube/Carbon Fiber Hybrid Multiscale Composites. Journal of Applied Physics,Vol. 91, No. 9, pp 6034-6037.
Thostenson, E.T. & Chou TW. (2002) Aligned Multi-walled Carbon Nanotube-ReinforcedComposites: Processing and Mechanical Characterization. Journal of Physics D, Vol.35, pp L77-L80.
Tsai, J. & Lu, T. (2009) Investigating the Load Transfer Efficiency in Carbon NanotubesReinforced Nanocomposites.Composite Structures, Vol. 90, pp 172-179.
Veedu, V.P.; Cao, A.; Li, X.; Ma, K.; Soldano, C.; Kar, S.; Ajayan, P.M. & Ghasemi-Nejhad,M.N. (2006) Multifunctional Composites using Reinforced Laminae with Carbon-nanotube Forests.Nature Materials, Vol. 5, pp 457-462.
Vigolo, B.; Penicaud, A.; Coulon, C.; Sauder, C.; Pailler, R.; Journet, C.; Bernier, P. & Poulin,P. (2000) Macroscopic Fibers and Ribbons of Oriented Carbon Nanotubes.Science,
Vol. 290, No. 17, pp 1331-1334.Wong, M.; Paramsothy, M.; Xu, XJ.; Ren, Y.; Li, S. & Liao, K. (2003) Physical Interactions aCarbon Nanotube-Polymer Interface.Polymer, Vol. 44, pp 7757-7764.
Xiao, K.Q. & Zhang, L.C. (2004) The Stress Transfer Efficiency of a Single-walled CarbonNanotube in Epoxy Matrix. Journal of Materials Science, Vol. 39, pp 4481-4486.
Yokozeki, T.; Iwahori, Y. & Ishiwata, S. (2007) Matrix Cracking Behaviors in CarbonFiber/Epoxy Laminates Filled with Cup-stacked Carbon Nanotubes (CSCNTs).Composites Part A, Vol. 38, pp 917-924.
Zheng, Q.; Xia, D.; Xue, Q.; Yan, K.; Gao, X. & Li Q. (2009) Computational Analysis of Effeof Modification on the Interfacial Characteristics of a Carbon Nanotube-Polyethylene Composites System. Applied Surface Science,Vol. 255, pp 3524-3543.