intech-pollution and air quality in t rgovi te municipality and its surroundings romania
TRANSCRIPT

1
Pollution and Air Quality in Târgovişte Municipality and Its Surroundings (Romania)
Pehoiu Gica and Murărescu Ovidiu “Valahia” University of Târgovişte
Romania
1. Introduction
Târgovişte Municipality is situated in the High Plain of Târgovişte, at an average absolute
altitude of 280 m. The town has an administrative area of 4,681 ha, in which the
constructible area includes 1,966 ha; within the latter, 100.7 ha represent green area (Fig.1).
Fig. 1. Geographical position of Târgovişte Plain (1) in Ialomi_a Plain (2) and Romania (3).
www.intechopen.com

Air Pollution – Monitoring, Modelling, Health and Control
2
Târgovişte had a population of 88,119 inhabitants in the year 2010 - representing 54.06% of the total urban population of Dâmbovi_a County and 16.63% of the total population of the county -, the density of the town’s population being of 1,882.4 inhabitants/km2 (Statistical Yearbook of Dâmbovi_a County, 2010).
This old industrial center has developed and diversified concomitantly to the general development of the economy (after the year 1968, on the occasion of the new administrative-territorial division, Târgovişte became political-administrative center of the county). It is during this period that the industrial platform, with several economic units and new branches appeared, completing the town’s industrial profile; this profile has undergone significant changes after the year 1990. Here, at present, there are nationally important industrial units, on the platform situated in the south-west of the town. They actually represent the main sources with a potential impact on the air quality in Târgovişte municipality and its neighborhood. Among these, one can mention: SC Mechel SA, in the metallurgical domain, producing special steels, SC Upet SA (now being restructured), SC Nemo SA, focused on machine building, SC Swarco - Vicas SA, producing paints and varnish, SC O_el Inox SA, laminating steels, SC Cromsteel SA, a company based on chroming processes, SC Romlux SA, an industrial unit producing light fixtures and others (Pehoiu, 2003; Pehoiu et al., 2005).
Doiceşti commune is situated near Târgovişte municipality; this commune also holds some industrial units, of which Uzina Electrică (the Power Station), using black oil and brown coal as fuels to generate electricity, SC Nubiola România SRL, a company producing whiteners and green chrome oxide - SO2 and possibly a sulfuretted hydrogen source in the process of sulphur combustion needed to obtain ultramarine -, SC Soceram SA, a company producing bricks and ceramic materials.
Fieni Town, situated in the north of the political-administrative center of Dâmbovi_a County, is remarkable through its industrial units: SC Carpatcement Holding SA, a producer of building materials (cement) and SC Carmeuse Holding SRL (lime producer), which represent the main sources of environmental degradation for the locality of Fieni and its surroundings (Pehoiu, 2008).
Târgovişte Town is a significant consumer of resources and at the same time a major producer of polluting emissions, resulting mainly from: industrial activity, intensification of road traffic and generation of high quantities of waste.
2. Working methodology
In order to analyze the air quality status and the effects of the air pollution in a mainly industrial town that has gone through important structural modifications after 1990, when we analyzed the pollutants’ dispersion, we took into account as well the role of the climatic factors (wind – its speed and directions, atmospheric humidity, atmospheric calm, hydrometeors - fog, air temperature).
The air analysis network component pertaining to Dâmbovi_a County is managed by the Departmental Agency for Environmental Protection - AEP (Agen_ia Jude_eană pentru Protec_ia Mediului) and includes fixed monitoring stations in the localities Târgovişte (Fig. 2) and Fieni (an automatic station each), and one in Doiceşti, with manual sampling of the pollutants and analysis in the laboratory, by means of which the specialists monitor the
www.intechopen.com

Pollution and Air Quality in Târgovişte Municipality and Its Surroundings (Romania)
3
concentrations of the dusts in suspension and of the gaseous pollutants (ammonia, nitrogen oxides, sulphur dioxide, sulphuretted hydrogen, formaldehyde).
Fig. 2. Map of the air monitoring locations in Târgovişte municipality (AEP Târgovişte).
At present, the monitoring of the air quality in these points supposes the continual gathering of daily samples from the atmosphere (24 h), followed by the analysis of the samples in the laboratory. This kind of analysis allows to highlight the dangerous concentrations for the population’s health in due time. The data obtained following the measurements serve to create databases and to elaborate reports or informative bulletins in the aftermath of the occurrence of eventual pollution episodes.
Excepting the meteorological parameters, a series of polluting indicators were monitored, such as: benzene, carbon monoxide, sulphur dioxide, nitrogen oxides, lead, heavy metals etc. These pollutants were gathered from several manual sampling points distributed around the town, including the residential and the industrial areas.
In order to determine the quantities of dusts and polluting emissions present in the atmosphere and influencing the air quality status, the polluting agents were separated depending on the area they influence (for instance, the dusts emitted in the atmosphere by a series of metallurgical companies are carried over two residential quarters in the south-east of the town.
Following the comparative analysis of the polluting components, during the last few years one can notice a slight improvement of the air quality compared to the previous period in point of dusts-caused pollution. In the areas in which they are monitored in the atmosphere, gaseous pollutants (nitrogen dioxide, sulphur dioxide, ammonia, sulphuretted hydrogen, formaldehyde, oxidant substances, and carbon monoxide) are not present in concentrations over the limits allowed by the present legislation.
The pollutants to be monitored, the measurement methods, the limit values (LV), the alert and information thresholds and the criteria for situating the monitoring points are established by the national legislation concerning the atmospheric protection, being in agreement with the demands of the European regulations.
The realizations concerning the development of the air quality monitoring network in Dâmbovi_a County during the period 2007-2010 consisted in:
www.intechopen.com

Air Pollution – Monitoring, Modelling, Health and Control
4
- remodeling and adapting the environmental laboratories for the installation of new laboratory equipments; installing these equipments; instructing the personnel;
- completing the endowment of the automated air quality monitoring stations from Târgovişte and Fieni.
AEP Dâmbovi_a monitored the level of the dusts in suspension in the area of Târgovişte, by
means of its four sampling stations. In the municipality, the indicator of breathable dusts
was monitored in the PM10 fraction in the quarter Micro XII (2 representative points for the
dusts resulted from SC Mechel SA Târgovişte) and the Civic Center – representative for the
dusts resulted from road traffic and other sources after dispersion (SC Mechel SA) – where
the indicator monitored was that of total dusts in suspension.
3. Air quality
The air is the environmental factor constituting the most rapid support favoring the pollutants’
transportation in the environment. Air pollution has many and significant negative effects on
the population’s health and may damage as well the flora and fauna in general.
Air quality depends on the emissions that end up in the air coming from stationary and
mobile sources (road traffic), mainly in big cities, as well as on the pollutants’ transport on
longer distances.
The automated stations and the manual sampling points are situated in representative areas
in point of pollution, in the localities mentioned, as follows:
Automated station DB-1, situated in Târgovişte municipality, Vlad ^epeş Str., no. 6 C (in the courtyard of the Social Care Center “Sfânta Maria”), coordinates: 25028’41.6’’; 44054’58.39’’;
Automated station DB-2, situated in Fieni Town, Teilor Str., no. 20 (in the town’s central park), coordinates: 25025’18.30’’; 45007’52.98’’;
Fixed manual sampling point in Târgovişte - PM10 fraction, in the Micro XII station, point 1, Constructorilor Str., no. 21 (Procor headquarters, industrial platform);
Fixed manual sampling point in Doiceşti (CFR Station) – gaseous pollutants (sulphur dioxide - SO2, nitrogen dioxide - NO2, sulphuretted hydrogen - H2S and hexavalent chromium – expressed as CrO3) and total dusts in suspension (TSP). The gaseous pollutants determinations in the point Doiceşti continue to be carried out in agreement with the analysis methods mentioned by STAS 12574/1987.
Settleable dusts are monitored by means of measurements in six fixed points situated in the following locations:
- Târgovişte - 3 sampling points – point 1 Micro XII, AEP headquarters, and Micro XI (DB-1 station);
- Doiceşti - 1 sampling point - CFR Train Station; - Fieni - 2 sampling points - point 1 (Fieni Park) and point 2, DB-2 station.
3.1 Atmospheric pollutants
Benzene
General features:
www.intechopen.com
Pollution and Air Quality in Târgovişte Municipality and Its Surroundings (Romania)
5
- - Very light aromatic compound, volatile and water-soluble; - - 90% of the benzene present in the air comes from road traffic; - - The rest of 10% comes from fuel evaporation during its storage and distribution.
Effects on heath: carcinogenic substance, classified into the A1 toxicity class, known as carcinogenic for man. It produces negative effects on the central nervous system.
Measurement methods: the method of reference for measuring benzene is that of sampling by aspiration into an absorbing cartridge, followed by gas-chromatographic determination, standardized at present by the European Committee for Standardization (CEN).
Carbon monoxide
General features. At room temperature, carbon monoxide is a colorless, odorless, tasteless gas, of both natural and anthropic origin. Carbon monoxide is formed mainly through the incomplete burning of fossil fuels.
Natural sources: forest burning, volcanic emissions, electric discharges.
Anthropic sources: it is formed mainly through the incomplete burning of fossil fuels, steel and pig iron production, oil refinement, and road, air and railroad traffic.
Carbon monoxide can accumulate up to a dangerous level especially during the period of atmospheric calm during winter and spring (this gas being much more stable from a chemical viewpoint at low temperatures), when the burning of fossil fuels attains a maximum level. Produced by natural sources, it is very rapidly dispersed in a wide area, and consequently does not affect human health.
Effects on people’s health. It is a toxic gas, being lethal in high concentrations (at concentrations of about 100 mg/m3) through the reduction of the blood’s capacity to transport oxygen, with consequences on the respiratory and cardiovascular system.
At relatively low concentrations, it affects the central nervous system, weakens the pulse rate, diminishing the blood volume distributed in the organism, and at the same time it reduces visual acuity and physical capacity. Being exposed for a short period of time, one may experience acute fatigue. At the same time, it may trigger respiratory difficulties, chest pains in people with cardiovascular diseases, determining as well irritability, migraines, rapid respiration, lack of coordination, nausea, dizziness, confusion, and can reduce the ability to concentrate.
The population segments most affected by the exposure to carbon monoxide are represented by children, elderly, people with respiratory and cardiovascular diseases, anemic people and smokers.
Effects on plants. At concentrations normally encountered when monitoring the atmosphere, carbon monoxide does not affect the plants, the animals or the environment.
Measurement methods: the reference method for measuring carbon monoxide is the non-dispersive infrared (NDIR) spectrometric method: ISO 4224.
Sulphur dioxide
General features. Sulphur dioxide is a colorless, bitter, non-flammable gas, with a penetrating odor that irritates the eyes and the respiratory system.
www.intechopen.com

Air Pollution – Monitoring, Modelling, Health and Control
6
Natural sources: volcanic eruptions, marine phytoplankton, bacterial fermentation in the marshy areas, oxidation of the gas containing sulphur resulted from biomass decomposition.
Anthropic sources: population’s heating systems, when the fuel used is not methane,
thermoelectric power stations, industrial processes (siderurgy, refinery, sulfuric acid
production), cellulose industry and, to a lesser extent, the emissions coming from diesel
engines.
Effects on people’s health. Depending on its concentration and the period of exposure, sulphur
dioxide has different effects on human health. The exposure to a high concentration of
sulphur dioxide during a short period of time can cause severe respiratory difficulties.
Particularly affected are: people with asthma, children, elderly and people with chronic
respiratory diseases. The exposure to a low concentration of sulphur dioxide for a long lapse
of time can result in infections of the respiratory system. Sulphur dioxide can interfere with
the dangerous effects of the ozone.
Effects on plants. Sulphur dioxide clearly affects many plant species, the negative effect on
their structure and tissues being visible with the naked eye. Some of the most sensitive
plants are: pine, vegetables, red and black acorns, white ash, lucerne, blackberries.
Effects on the environment. In the atmosphere, it contributes to the acidification of the
precipitations, with toxic effects on the vegetation and on the soil. The increase of the
sulphur dioxide concentration accelerates metals’ corrosion, because of the formation of
acids. Sulphur oxides can erode: stones, brick-and-mortar, paints, fibers, paper, skin and
electric components.
Measurement methods: the standard sulphur dioxide analysis method is the one pointed out
in ISO/FDIS 10498 (standard project) named “Aer înconjurător - determinarea dioxidului de
sulf” (“Surrounding air – sulphur dioxide determination”) - UV fluorescence method.
Ozone
General features: very oxidant, very reactive gas, with chocking smell. It is concentrated in the
stratosphere and assures our protection against the UV radiation, which is damaging for
life. The ozone present on the soil level acts as a component of the “photochemical smog”. It
appears following a reaction that involves mainly nitrogen oxides and volatile organic
compounds.
Effects on health. The ozone concentration at ground level causes respiratory system and
eye irritation. High ozone concentrations can trigger a reduction of the respiratory
function.
Effects on the environment: It is responsible for certain damages caused to the vegetation
through the atrophy of certain tree species in the urban areas.
Measurement methods. The standard methods for the ozone analysis and for the calibration of
the ozone-related tools are:
- analysis method: UV photometric method (ISO 13964); - calibration method: UV reference photometer (ISO 13964, VDI 2468, B1.6).
www.intechopen.com

Pollution and Air Quality in Târgovişte Municipality and Its Surroundings (Romania)
7
Nitrogen oxides
General features. Nitrogen oxides represent a group of very reactive gases, containing nitrogen and oxygen in variable quantities. Most of these gases have no color and no smell.
The main nitrogen oxides are:
- nitrogen monoxide (NO), a colorless and odorless gas; - nitrogen dioxide (NO2), a brown-reddish gas, with a strong, choking smell.
Combined with the air particles, nitrogen dioxide can form a brown-reddish layer. In the
presence of solar light, nitrogen oxides can react as well with hydrocarbons forming
photochemical oxidants. Nitrogen oxides are responsible for acid rains, which affect the
terrestrial surface and the aquatic ecosystem.
Anthropic sources: they appear in the combustion process, when fuels are burnt at high
temperatures, but most often they are the result of road traffic, industrial activities, and
electric energy production. Nitrogen oxides are responsible for: smog and acid rains
formation, water quality deterioration, greenhouse effect, and reduced visibility in the urban
areas.
Effects on people’s health. Nitrogen dioxide is known as a very toxic gas both for people and
for animals (its degree of toxicity is four times higher than that of the nitrogen monoxide).
Being exposed to high concentrations can be fatal, while low concentrations affect the
pulmonary tissue. The population exposed to this type of pollutants can experience
respiratory difficulties, respiratory irritations, and pulmonary dysfunction. A durable
exposure to a low concentration can destroy the pulmonary tissues, leading to pulmonary
emphysema. The most affected people through the exposure to this pollutant are children.
Effects on plants and animals. The exposure to this pollutant produces serious damage to the
vegetation, by whitening or destroying the plants’ tissues, and reducing their growth
rhythm. The exposure to nitrogen oxides can cause pulmonary diseases with animals
(resembling pulmonary emphysema), while the exposure to nitrogen dioxide can reduce the
animals’ immunity, causing diseases such as pneumonia and flu.
Other effects. Nitrogen oxides contribute to the formation of acid rains and favor nitrate
storage into the soil, which can alter the ecological balance of the environment. At the same
time, they can cause tissue deterioration, paints discoloring and metal degradation.
Measurement methods: the standard method for nitrogen dioxide and nitrogen oxides analysis
is mentioned in ISO 7996/1985 - “Aer înconjurător - determinarea concentra_iei masive de
oxizi de azot” (“Surrounding air – the determination of massive nitrogen oxides
concentration”), being chemiluminescence.
Lead and other toxic metals: Pb, Cd, As and Hg
General features. Toxic metals come from coal, fuel, domestic waste combustion etc. and from
certain industrial procedures. They are generally found as particles (except for mercury
which is gaseous). Metals are stored in the body and trigger short and/or long term toxic
effects. In case of exposure to high concentrations they can affect the nervous system, and
the renal, hepatic and respiratory functions.
www.intechopen.com

Air Pollution – Monitoring, Modelling, Health and Control
8
Measurement methods:
- the standard method for lead sampling is the same as the sampling method for PM10;
- the standard method for lead analysis is the one mentioned in ISO 9855/1993 “Aer
înconjurător - determinarea con_inutului de plumb din aerosolii colecta_i pe filter”
(“Surrounding air – determination of particulate lead content from aerosols collected on
filter”);
- method - atomic absorption spectroscopy.
- the standard method for measuring the concentrations of arsenic, cadmium and nickel
in the surrounding air is about to be standardized by the European Committee for
Standardization (CEN) and relies on manual sampling of the PM10 fraction (described
by the EN 12341 standard).
Heavy metals
In Dâmbovi_a County, including the area of Târgovişte municipality and its surroundings,
heavy metal emissions come from: combustion of gaseous fuels, road traffic (to a large
extent) (a special role going to the use of fuels with lead derivatives as additives),
metallurgical industry activities, building materials industry, and burning of dangerous
(hospital) wastes (to a lesser extent).
The determinations for lead, arsenic, cadmium and nickel were carried out starting from
breathable dusts - PM10 fraction -, and for chromium from total dusts in suspension. They
were carried out using the automated DB1 and DB2 stations and the manual sampling
station situated on the industrial platform in the southwest of Târgovişte municipality; for
chromium, other determinations were also carried out in the locality of Doiceşti (Table 1 and
Fig. 3-6).
Fig. 3. Average annual concentrations: lead in the year 2009 (g/m3).
0.6
0.5
0.4
0.3
0.2
0.1
0 Industrial platform
Târgovişte DB 1 DB 2
average year 2009
LV/2009
www.intechopen.com

Pollution and Air Quality in Târgovişte Municipality and Its Surroundings (Romania)
9
Fig. 4. Average annual concentrations: arsenic in the year 2009 (ng/m3).
Fig. 5. Average annual concentrations: cadmium in the year 2009 (ng/m3).
Fig. 6. Average annual concentrations: nickel in the year 2009 (ng/m3).
7
6
5
4
3
2
1
0
8
7
6
5
4
3
2
1
0
25
20
15
10
5
0
average year 2009
LV/2009
LV/2009 average year
2009
Industrial platform Târgovişte
DB 1 DB 2
Industrial platform Târgovişte
DB 1 DB 2
LV/2009 average year 2009
Industrial platform Târgovişte
DB 1 DB 2
www.intechopen.com

Air Pollution – Monitoring, Modelling, Health and Control
10
Station No. of valid data Data collecting (%) Average Maximum Median LEAD (g/m3)
DB1 285 78.08 0.0246 0.1623 0.0115
Industrial platform
105 28.77 0.0916 0.5712 0.0628
DB2 307 84.11 0.0205 0.0867 0.0140 ARSENIC (ng/m3)
DB1 232 63.56 0.6237 15.9719 0.0888
Industrial platform
89 24.38 5.5645 49.9795 1.7821
DB2 251 68.77 1.7854 34.0692 0.0972 CADMIUM (ng/m3)
DB1 232 63.56 0.9870 10.2118 0.1801
Industrial platform
89 24.38 7.2788 83.9098 1.7728
DB2 251 68.77 1.5757 9.7392 0.9380 NICKEL (ng/m3)
DB1 232 6356 3.2938 29.5864 0.2516
Industrial platform
89 24.38 10.5071 119.8768 0.0000
DB2 235 64.38 5.4799 51.4799 2.2764 CHROMIUM (mg/m3)
Doiceşti 193 52.88 0.000033 0.000091 0.00002
9
Table 1. Values for heavy metals in the year 2009 (source: AEP Dâmbovi_a).
One can notice an overpassing of the yearly limit value for the protection of human health at the manual station situated on the industrial platform of Târgovişte municipality, for the indicator cadmium, under the reserve that in the year 2009 the data collecting was of 24.4% (89 measurements). The other indicators monitored did not go over the annual limit value (lead, arsenic, zinc) or the maximum admitted daily concentration (chromium). The main polluting units are: SC Cromsteel SA and SC Mechel SA from Târgovişte municipality.
The tropospheric ozone and other photochemical oxidants
The inventory, according to the order 524/2000, of the sources and of the emissions highlights the following pollutants accumulation concerning the category of volatile organic compounds (VOCs) emitted in the atmosphere during the years 2007-2009 (Table 2):
Year Total emissions in Dâmboviţa County (t/year)
Total VOCs NMVOCs (non-methane volatile organic compounds) CH4 (methane)
2007 89127.67 14919.671 74208
2008 19177.99 8451.86 10726.13 2009 15739.2 4075.69 11663.48
Table 2. Tropospheric ozone emissions and other photochemical oxidants (source: AEP Dâmbovi_a).
www.intechopen.com
Pollution and Air Quality in Târgovişte Municipality and Its Surroundings (Romania)
11
So, at present, one can notice a decrease of the non-methane volatile organic compounds,
more precisely by 72.7% in 2009 compared to 2007, while concerning methane, a quite
significant increase of the quantities emitted during the same periods was recorded,
especially because of the increase of the number of cars and of the road traffic
intensification, especially in the urban area (Murărescu & Pehoiu, 2009; Pehoiu, 2006).
3.2 Stationary air quality monitoring points
Pollution with dusts in suspension
As we have mentioned before, in the area of Târgovişte municipality there are:
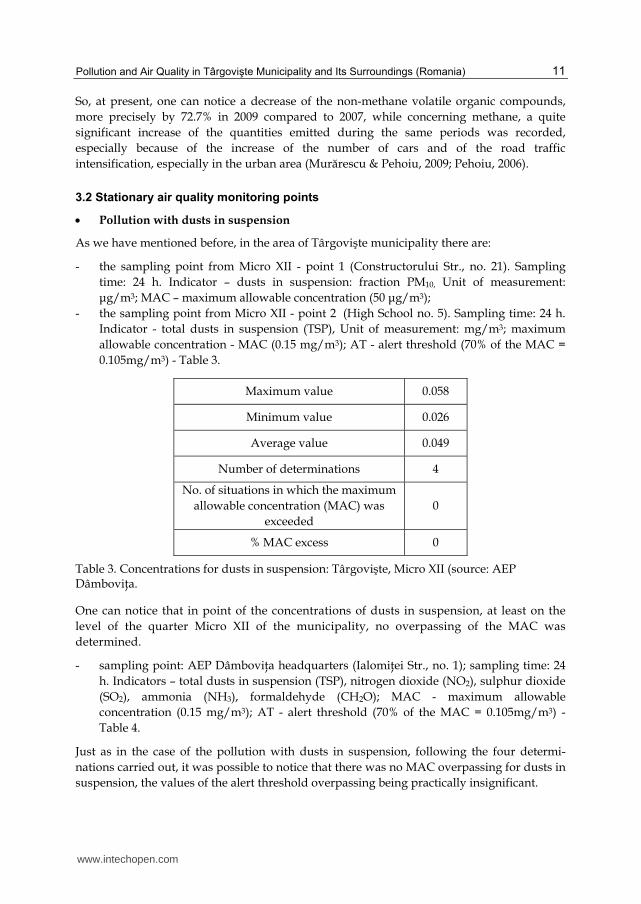
- the sampling point from Micro XII - point 1 (Constructorului Str., no. 21). Sampling
time: 24 h. Indicator – dusts in suspension: fraction PM10, Unit of measurement:
μg/m3; MAC – maximum allowable concentration (50 μg/m3);
- the sampling point from Micro XII - point 2 (High School no. 5). Sampling time: 24 h.
Indicator - total dusts in suspension (TSP), Unit of measurement: mg/m3; maximum
allowable concentration - MAC (0.15 mg/m3); AT - alert threshold (70% of the MAC =
0.105mg/m3) - Table 3.
Maximum value 0.058
Minimum value 0.026
Average value 0.049
Number of determinations 4
No. of situations in which the maximum
allowable concentration (MAC) was
exceeded
0
% MAC excess 0
Table 3. Concentrations for dusts in suspension: Târgovişte, Micro XII (source: AEP Dâmbovi_a.
One can notice that in point of the concentrations of dusts in suspension, at least on the
level of the quarter Micro XII of the municipality, no overpassing of the MAC was
determined.
- sampling point: AEP Dâmbovi_a headquarters (Ialomi_ei Str., no. 1); sampling time: 24
h. Indicators – total dusts in suspension (TSP), nitrogen dioxide (NO2), sulphur dioxide
(SO2), ammonia (NH3), formaldehyde (CH2O); MAC - maximum allowable
concentration (0.15 mg/m3); AT - alert threshold (70% of the MAC = 0.105mg/m3) -
Table 4.
Just as in the case of the pollution with dusts in suspension, following the four determi-
nations carried out, it was possible to notice that there was no MAC overpassing for dusts in
suspension, the values of the alert threshold overpassing being practically insignificant.
www.intechopen.com

Air Pollution – Monitoring, Modelling, Health and Control
12
TSP NO2 SO2 NH3 CH2O
Measurement units mg/m3 mg/m3 mg/m3 mg/m3 mg/m3
Maximum value 0.054 0.0085 0.0016 0.0049 0.0020
Minimum value 0.026 0.0070 0.0009 0.0036 0.0007
Average value 0.040 0.0076 0.0014 0.0041 0.0011
No. of determinations 4 4 4 4 4
MAC 0.15 0.1 0.25 0.1 0.012
No. of MAC overpassing 0 0 0 0 0
% MAC overpassing 0 0 0 0 0
AT 0.105 0.07 0.175 0.07 0.0084
No. of AT overpassing 0 0 0 0 0
% AT overpasing 0 0 0 0 0
Table 4. Concentrations of dusts in suspension AEP Dâmbovi_a (source: AEP Dâmbovi_a).
- sampling point: Micro VI (Unirii Blvd., no. 6)
Sampling time: 24 h. Indicators - nitrogen dioxide (NO2), sulphur dioxide (SO2), ammonia
(NH3); MAC - maximum allowable concentration, AT - alert threshold (Table 5).
NO2 SO2 NH3
Measurement units mg/m3 mg/m3 mg/m3
Maximum value 0.0124 0.0025 0.0062
Minimum value 0.0090 0.0018 0.0029
Average value 0.0108 0.0021 0.0048
No. of determinations 4 4 4
MAC 0.1 0.25 0.1
No. of MAC overpassing
0 0 0
% MAC overpassing 0 0 0
AT 0.07 0.175 0.07
No. of AT overpassing 0 0 0
% AT overpasing 0 0 0
Table 5. Concentrations presented by AEP Dâmbovi_a.
The four determinations realized in the sampling point quarter Micro VI of Târgovişte
municipality highlight the overpassing of the maximum allowable concentrations for all the
pollutants, accompanied by the overpassing of the alert threshold, yet in very low
percentages.
www.intechopen.com

Pollution and Air Quality in Târgovişte Municipality and Its Surroundings (Romania)
13
AEP monitored the level of the dusts in suspension, in the area of Târgovişte, by means of
its three sampling stations: AEP Târgovişte (representative for road traffic), Micro XII
(representative for dusts resulted from SC Mechel Târgovişte), Civic Center (representative
for dusts resulted from road traffic and other sources after dispersion (SC Mechel SA, SC
UPET SA).
Following four determinations, we noticed that the values of the average concentrations in
24 hours went over the MAC (0.15 mg/m3) in all the three sampling points. The frequency
of the average overpassing in 24 h for the area of Târgovişte is of 13.94%, the maximum
overpassing being of 0.267 mg/m3 (in the point AEP headquarters) compared to 0.15 mg/m3
(MAC).
The values of the average yearly concentrations were above the annual MAC (0.075 mg/m3)
in all the three sampling points and globally in the area of Târgovişte (0.116 mg/m3). The
main reasons are the dust emissions containing iron oxides and ferrous metals (SC Mechel
SA), but also the intense road traffic.
In order to observe the air quality status and the pollution in the north of Târgovişte
municipality, the sampling points from the industrial area of Doiceşti were taken into
account as well, having as sampling point the locality’s train station, also because the wind
direction determines the transport of the dusts from this location to the municipality, along
the valley of Ialomi_a River. Sampling time: 24 h. Indicators - nitrogen dioxide (NO2),
sulphur dioxide (SO2), sulphuretted hydrogen (H2S), Cr6+, total dusts in suspension (TSP);
MAC - maximum allowable concentration; AT - alert threshold (70% of the MAC = 0.105
mg/m3) - Table 6 and Fig. 7.
TSP NO2 SO2 H2S CrO3
Measurement units mg/m3 mg/m3 mg/m3 mg/m3 mg/m3
Maximum value 0.057 0.0204 0.0033 0.0045 0.0001000
Minimum value 0.029 0.0087 0.0013 0.0017 0.0000840
Average value 0.037 0.0132 0.0020 0.0028 0.0000893
No. of determinations 4 4 4 4 4
MAC 0.15 0.1 0.25 0.008 0.0015
No. of MAC
overpassing 0 0 0 0 0
% MAC overpassing 0 0 0 0 0
AT 0.105 0.07 0.175 0.0056 0.0010
No. of AT overpassing 0 0 0 0 0
Table 6. Concentrations reported in the point Doiceşti Trains Station (source: AEP Dâmbovi_a).
www.intechopen.com

Air Pollution – Monitoring, Modelling, Health and Control
14
Fig. 7. Evolution of the concentrations of total dusts in suspension during the years 2001-2009 (TSP) - mg/m3
In Doiceşti locality, one monitored the level of the pollution with settleable dusts, nitrogen
dioxide, sulphur dioxide, sulphuretted hydrogen, dusts in suspension, given the specific
emissions from the main polluting economic agents in the area: U.E. Doiceşti, which uses
black oil and brown coal as fuel to generate electricity and SC Nubiola România SRL (a
company producing whiteners and green chrome oxide) - the SO2 and possibly a sulfuretted
hydrogen source in the process of sulphur combustion needed to obtain ultramarine.
Other potential pollutants are SC. Soceram SA (producer of bricks, ceramic materials) and
road traffic. The evolution of the concentrations of total dusts in suspension, during the
period 2001 - 2009, clearly highlights the diminution in the atmosphere of these polluting
emissions, both for the municipality and for Doiceşti locality.
Pollution with settleable dusts
AEP supervises the level of the settleable dusts in the areas of Târgovişte and Doiceşti. Under exceptional conditions of air masses transportation along Ialomi_a River, settleable
dusts from the industrial area of Fieni can end up in Târgovişte and its surroundings. That is
why we consider it necessary to include Fieni locality as well in the present study. In these
areas, a characteristic feature is the pollution with dusts, the main polluting sources being:
- in Târgovişte: SC Mechel SA, SC Upet SA and to a lesser extent the road traffic; the major impact is felt under the form of dusts in suspension;
- in Doicesti: UE Doiceşti, SC Soceram SA, road traffic; given the emissions’ features, the major impact is felt under the form of settleable dusts. Dusts in suspension have been monitored in the area starting with June 2002.
- in Fieni: SC Carpatcement Holding SA (producer of lime and cement); the major impact is felt at the same time under the form of settleable dusts. Dusts in suspension have been monitored in the area starting with March 2003.
0.16
0.14
0.12
0.1
0.08
0.06
0.04
0.02
0 2001 2002 2003 2004 2005 2006 2007 2008 2009
Târgovişte Doiceşti MAC/year
www.intechopen.com

Pollution and Air Quality in Târgovişte Municipality and Its Surroundings (Romania)
15
Concerning each locality, the average annual quantities of settleable dusts did not go over
the annual MAC (204 t/km2/year) in none of them, yet in different sampling points the
annual average values have been exceeded, namely in the points situated in inhabited areas
in which the impact of the dusts emissions from the sources is high (Fig. 8).
Fig. 8. Evolution of the concentrations of settleable dusts during the years 2001-2009
(mg/m3).
3.3 Experimental results and syntheses concerning the automatic monitoring of the emissions of atmospheric pollutants
Târgovişte area
For the indicator dusts in suspension - the PM10 fraction - (Procor headquarters, industrial
platform), on 13 occasions one recorded values above the limit value (50 μg/m3) in 24
hours (out of the 15 measurements carried out). In the year 2009, the level of dusts in
suspension was analyzed in the localities Târgovişte (PM10 - manual station located on the
industrial platform and industrial automatic station - DB1), Doiceşti (total dusts in
suspension (TSP) - manual station) and Fieni (industrial automatic station - DB2) - Table 7
and Fig. 9-13.
18
16
14
12
10
8
6
4
2
0
Târgovişte Doiceşti Fieni
MAC/month 2001 2002 2003 2004 2005 2006 2007 2008 2009
www.intechopen.com

Air Pollution – Monitoring, Modelling, Health and Control
16
Station No. of valid data
Data collecting
(%)
No. of data >LV
Frequency of the
overpassing (%)
Average (g/m3)
Maximum (g/m3)
Median (g/m3)
Percentile 98 (g/m3)
TÂRGOVIŞTE
DB1, automatic
272 74.52 6 2.21 19.665 55.373 15.634 48.942
DB1, gravimetric
286 78.36 1 0.35 19.594 50.150 19.079 43.848
Industrial platform,
gravimetric 142 38.90 87 61.27 57.629 118.387 57.364 106.567
DOICEŞTI
Train Station
194 53.15 0 0 0.063 0.148 0.059 0.136
FIENI
DB2, automatic
335 91.78 11 3.28 22.101 89.920 19.425 55.581
DB2, gravimetric
307 84.11 8 2.61 18.739 75.043 15.808 53.060
Table 7. Indicators PM10 per 24 h in 2009 (source: AEP Dâmbovi_a).
Fig. 9. Maximums/24h of the PM10 indicator, measured gravimetrically (months) - year
2009, compared to LV/24h (g/m3).
125
100
75
50
25
0 I II III IV V VI VII VIII IX X XI XII
DB1 DB2 Industrial platform
LV
www.intechopen.com

Pollution and Air Quality in Târgovişte Municipality and Its Surroundings (Romania)
17
Fig. 10. Monthly frequencies of the exceeding of the LV/24h – dusts in suspension (PM10) in
the year 2009 (%).
Fig. 11. Average annual concentrations of the PM10 indicator, measured gravimetrically
(g/m3).
100
90
80
70
60
50
40
30
20
10
0
I II III IV V VI VII VIII IX X XI XII Industrial platform DB1 DB2
70
60
50
40
30
20
10
0 Industrial platform DB1 DB2
average year 2009 LV/2009
www.intechopen.com

Air Pollution – Monitoring, Modelling, Health and Control
18
Fig. 12. Maximums/24h of the TSP indicator in Doiceşti Commune - year 2009 (g/m3).
0
5
10
15
20
25
30
35
I II III IV V VI VII VIII IX X XI XII
Months
Fig. 13. Monthly frequencies for the exceeding of the AT/24h, Doiceşti locality, TSP indicator (%), year 2009.
According to the values recorded for the PM10 indicator, in April 2009, one can notice the increase of the frequency for the exceeding of the limit value to 86.7% (compared to 37.5%, the previous month), the average monthly concentration being of 68.7 μg/ m3, compared to 52.6 μg/ m3 in March the same year (Table 8).
0.16
0.14
0.12
0.1
0.08
0.06
0.04
0.02
0 I II III IV V VI VII VIII IX X XI XII
MonthsDoiceşti MAC
www.intechopen.com

Pollution and Air Quality in Târgovişte Municipality and Its Surroundings (Romania)
19
Maximum value of the concentration (μg/m3)
Minimum value of the concentration (μg/ m3)
Average of the values recorded
(μg/ m3)
Frequency of the overpassing of
the LV%
92.2 34.5 68.7 86.7%
Table 8. Average, maximum, minimum monthly quantities for settleable dusts and the frequencies for the exceeding of the monthly MAC (Micro XII, point 1, Târgovişte).
At the Automatic station DB-1, Micro 11, Târgovişte, no exceeding of the limit value for the indicator PM10 gravimetric, the average monthly value being of 20.73 μg/m3 (Fig. 14).
Fig. 14. Evolution of the concentrations of breathable dusts - PM10 fraction, Târgovişte,
Micro XII, manual station (g/m3), years 2005-2009.
The dusts concentration in the atmosphere in the sampling area is influenced by the input from nearby sources (activities in the domain of building materials) and of the nearby sources from a distance of about 1 km (activities such as steel production, slag processing etc.). At the same time, the PM10
concentration can have high values depending on the
evolution of the meteorological phenomena: high relative humidity (RH), atmospheric pressure and wind intensity may lead to the appearance of “peaks” of the PM10
concentrations, because they can favor the agglomeration of the particles.
In Târgovişte municipality, the main sources generating dust emissions (with significant impact in the area around their activity) are the activities of the economic agents from the area of the industrial platform, which operate in the metallurgical domain, in the domain of metallic ware, road transport, building materials, concrete production and road traffic.
In the case of gaseous pollutants, at the Automatic monitoring station DB-1 there was no exceeding of the limit values or the information thresholds for the average hourly or daily concentrations for the indicators monitored. The main sources emitting gaseous pollutants in the area of Târgovişte, with a potential impact on the air quality are: metallurgical
80
70
60
50
40
30
20
10
0 2005 2006 2007 2008 2009
Average/year LV/year
www.intechopen.com

Air Pollution – Monitoring, Modelling, Health and Control
20
companies, industrial companies that use solvents, economic agents operating in the domain of metallic ware, road transport, building materials, fuel distribution stations and road traffic.
4. Air quality status
In Târgovişte municipality one monitors daily concentrations (sampling time: 24 h) for the
indicators: breathable dusts, respectively the fraction with the diameter <10μm (PM10),
settleable dusts, highlighting the quantity of (settleable) dusts deposited during a 30-day
interval on a 1 m2 area, this being a characteristic indicator for highlighting the pollution
with heavy particles in suspension, which are later on deposited on the ground.
At the same time, the automatic station DB-1 Târgovişte, which continually monitors
meteorological parameters (temperature, wind speed, wind direction, solar radiation
intensity, precipitations quantity, atmospheric pressure), gaseous pollutants (nitrogen
oxides, sulphur dioxide, carbon monoxide, tropospheric ozone) and dusts in suspension
(breathable - PM10 fraction) transmits the data, in real time, to the panels dedicated to public
information (external panel - Prefecture Plateau of Târgovişte - and internal panel - AEP
Dâmbovi_a headquarters) - Fig. 15.a-b.
In Doiceşti locality, air quality is monitored by supervising the indicators total dusts in
suspension, settleable dusts and gaseous pollutants (sampling point: manual/urban
station).
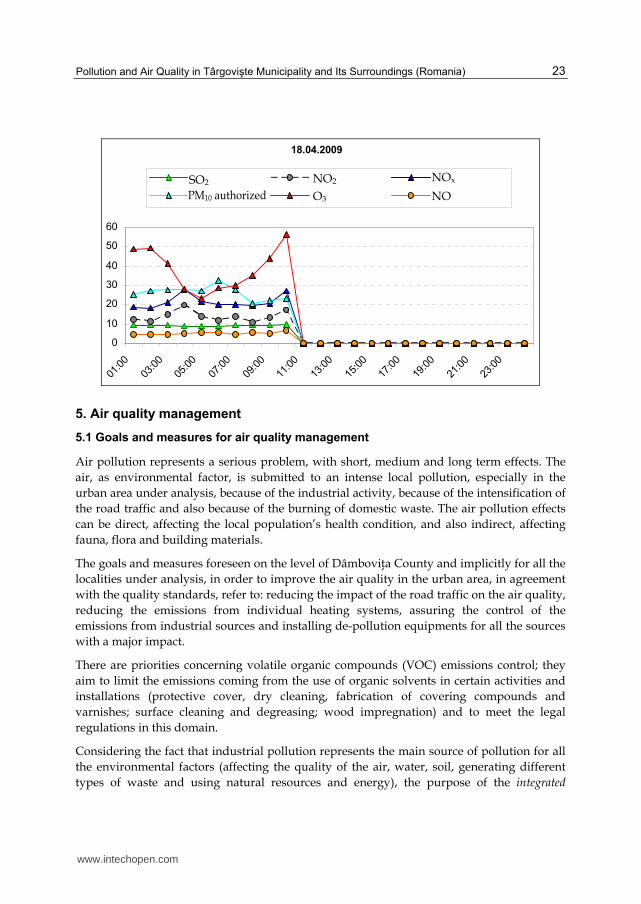
4.1 Examples of chronological series recorded during a day, (April 1-2 and 18, 2009),
at the automatic station DB-1 Târgovişte (concentration in g/m3)
1.04.2009
0
2
4
6
8
10
12
14
01:0
0
03:0
0
05:0
0
07:0
0
09:0
0
11:0
0
13:0
0
15:0
0
17:0
0
19:0
0
21:0
0
23:0
0
Dioxid de sulf Dioxid de azot Oxizi de azot
PM10 - aut Ozon Monoxid de azot
SO2
PM10 authorized
NO2
O3
NOx
NO
www.intechopen.com

Pollution and Air Quality in Târgovişte Municipality and Its Surroundings (Romania)
21
2.04.2009
0
5
10
15
20
25
30
35
40
45
01:0
0
03:0
0
05:0
0
07:0
0
09:0
0
11:0
0
13:0
0
15:0
0
17:0
0
19:0
0
21:0
0
23:0
0
Dioxid de sulf Dioxid de azot Oxizi de azot
PM10 - aut Ozon Monoxid de azot
18.04.2009
0
10
20
30
40
50
60
70
80
01:0
0
03:0
0
05:0
0
07:0
0
09:0
0
11:0
0
13:0
0
15:0
0
17:0
0
19:0
0
21:0
0
23:0
0
Dioxid de sulf Dioxid de azot Oxizi de azot
PM10 - aut Ozon Monoxid de azot
SO2
PM10 authorized
NO2
O3
NOx
NO
SO2
PM10 authorized
NO2
O3
NOx
NO
www.intechopen.com

Air Pollution – Monitoring, Modelling, Health and Control
22
0
2
4
6
8
10
12
14
1.04.2009
Dioxid de sulf Dioxid de azot Oxizi de azot
PM10 - aut Ozon Monoxid de azot
0
10
20
30
40
50
60
70
80
90
100
2.04.2009
Dioxid de sulf Dioxid de azot Oxizi de azot
PM10 - aut Ozon Monoxid de azot
SO2
PM10 authorized
NO2
O3
NOx
NO
SO2
PM10 authorized
NO2
O3
NOx
NO
www.intechopen.com
Pollution and Air Quality in Târgovişte Municipality and Its Surroundings (Romania)
23
18.04.2009
0
10
20
30
40
50
60
01:0
0
03:0
0
05:0
0
07:0
0
09:0
0
11:0
0
13:0
0
15:0
0
17:0
0
19:0
0
21:0
0
23:0
0
Dioxid de sulf Dioxid de azot Oxizi de azot
PM10 - aut Ozon Monoxid de azot
5. Air quality management
5.1 Goals and measures for air quality management
Air pollution represents a serious problem, with short, medium and long term effects. The
air, as environmental factor, is submitted to an intense local pollution, especially in the
urban area under analysis, because of the industrial activity, because of the intensification of
the road traffic and also because of the burning of domestic waste. The air pollution effects
can be direct, affecting the local population’s health condition, and also indirect, affecting
fauna, flora and building materials.
The goals and measures foreseen on the level of Dâmbovi_a County and implicitly for all the
localities under analysis, in order to improve the air quality in the urban area, in agreement
with the quality standards, refer to: reducing the impact of the road traffic on the air quality,
reducing the emissions from individual heating systems, assuring the control of the
emissions from industrial sources and installing de-pollution equipments for all the sources
with a major impact.
There are priorities concerning volatile organic compounds (VOC) emissions control; they
aim to limit the emissions coming from the use of organic solvents in certain activities and
installations (protective cover, dry cleaning, fabrication of covering compounds and
varnishes; surface cleaning and degreasing; wood impregnation) and to meet the legal
regulations in this domain.
Considering the fact that industrial pollution represents the main source of pollution for all
the environmental factors (affecting the quality of the air, water, soil, generating different
types of waste and using natural resources and energy), the purpose of the integrated
SO2
PM10 authorized
NO2
O3
NOx
NO
www.intechopen.com

Air Pollution – Monitoring, Modelling, Health and Control
24
environmental protection system is the implementation of preventive measures or the
emissions reduction with the purpose of protecting the environment as a whole.
The industrial branch with the highest impact on the environmental factors is metallurgical
industry, the air quality being affected by: emissions resulted from raw matter preparation
(iron melting), final products processing, raw matter and auxiliary products transport and
storage.
A significant impact on the environmental factors comes from the building materials
industry as well (through the existence of the previously mentioned economic agents); their
specific activities determine the elimination of large quantities of dusts and green house
effect gases in the atmosphere.
On the level of Dâmbovi_a County, eleven environmental authorizations have been issued
concerning the emissions of green house effect gases, for installations under the regulations
of the EU-ETS (EU - Emission Trading System) Directive, for the period 2008-2012 (The
directive 87/2003/CE was adopted by the Romanian legislation through the governmental
decision H.G. no.780/2006)1.
The integrated authorizations contain demands and limit values regarding the emissions,
which try to make sure that all the adequate preventive measures for the environmental
protection have been taken. The limit values concerning emissions are established based on
the best available techniques. In order to support the EU member states in the application of
the IPPC (International Plant Protection Convention) Directive, among the member states
and the afferent industry, there has been an information exchange concerning the BAT - Best
Available Techniques. The purpose of this information exchange is to balance differences on
a technological level in the European Community and to promote universal limit values and
techniques.
In the areas affected by industrial pollution, through adjustment programs annexed to the
environmental authorizations emitted for the polluting economic agents, one established
measures for the reduction of the industrial activities’ impact on the environmental
quality. They are found as well in the Local Action Plan for the Environement of
Dâmbovi_a County (Planul Local de Ac_iune pentru Mediu al Jude_ului Dâmbovi_a),
reviewed even since the year 2007. Among the local economic agents concerned there are:
SC Mechel SA, SC Termica S.A, SC O_elinox SA, all from Târgovişte, SC Termoelectrica
SA Bucureşti – the branch of Doiceşti, SC Soceram SA Bucureşti - the branch of Doiceşti, SC Carmeuse Holding SRL – working point of Fieni, SC Carpatcement Holding SA - the
branch of Fieni.
Following the approval by the National Agency for Environmental Protection (Agen_ia
Na_ională pentru Protec_ia Mediului - ANPM) of the Propositions of measure plans for
1A certificate concerning the green house effect gases emissions represents the title giving an installation the right to emit a ton of carbon dioxide equivalent during a definite period; it is valid for meeting the goal of the governmental decision H.G no. 780/2006 and transferable under the conditions foreseen by this normative act.
www.intechopen.com

Pollution and Air Quality in Târgovişte Municipality and Its Surroundings (Romania)
25
green house effect gases emissions monitoring and reporting for the year 2010, the
environmental authorizations concerning this type of emissions were reviewed.
The joint implementation (JI), according to the Kyoto Protocol, concerning the advantages of
the project for Târgovişte municipality, considered the following aspects:
- producing non-polluting electric and thermal energy using modern, reliable
installations, with high energetic efficiency;
- assuring the necessary thermal energy for the municipality of Târgovişte from its own
source for the following 20 years;
- realizing 1,959,461 Euro worth investments in the infrastructure without using funds
from the state budget;
- creating new jobs;
- encouraging other foreign investments in the municipality.
The ERU 04/04 Contract was concluded between Senter Novem Agency from Holland,
from the part of the Government of Holland, and SC Nuon Energy Romania SRL Sibiu,
Romania - Project Developer, on September 28, 2004. In the year 2010 a transfer agreement
was concluded on the basis of the ERU 04/40 Contract from SC Nuon Energy Romania
SRL to SC Termica SA Târgovişte. The emission reductions generated by the project
beginning with January 1, 2010 are dealt with by SC Termica SA Târgovişte and the
above-mentioned Hollandese agency (Local Plan of Action for Environment of Dâmbovi_a
County, 2010).
6. The air quality in relation to the population’s health condition
The environment in which people live is first of all defined by the quality of the air, of the
water, of the soil, of the dwellings, of the foods they eat, and of the environment in which
they deploy their activity. Closely connected to these factors, influenced or determined
immediately or after a certain period of time is the population’s health condition.
The evaluation of the population’s health condition consists in the identification of the
hazard factors that in the urban area have an influence on: air quality; potable water supply;
gathering and removing liquid and solid residues of any nature; urban noise; habitat –
improper conditions (noise, light, population agglomeration etc.); services quality (of all
types) provided to the population (Pehoiu et al., 2006).
Knowing and determining some environmental hazard factors is particularly important and
may constitute one of the most valuable activities related to the promotion and maintaining
of the population’s health condition (Pehoiu &n Murărescu, 2009).
The action of the environmental factors on human health is very diverse. When the pollution
intensity is higher, the action on organisms is immediate. However, more often than not,
their action has a low intensity, determining a chronic, long-term action, the quantification
of the effect becoming difficult to achieve. The atmospheric pollution in general and
especially the exposure to dusts in suspension produces diseases of the respiratory,
digestive, osteo-muscular and nervous systems and of the sensory organs, affecting all the
age groups; however, when it comes to children, it determines an early predisposition to
www.intechopen.com

Air Pollution – Monitoring, Modelling, Health and Control
26
respiratory diseases and bronchial asthma. The irritating capacity of the dusts in suspension
increases when, in the air, there are other irritating respiratory pollutants, such as SO2 and
NO2, as a synergic effect comes into operation from the SO2 - dusts in suspension and NO2 -
dusts in suspension (Table 9).
Types of diseases Number of occurrences
1. Diseases of the respiratory system, of which:
- acute bronchitis - chronic bronchitis - bronchial asthma
1963 123 110
2. Digestive diseases 8168
3. Cardiovascular diseases 4841
4. Endocrine and metabolic diseases 2966
5. Malignant tumors, of which: - pulmonary cancer
21
6. Congenital malformations 16
7. Renal system diseases 7962
8. Flu 43
Table 9. Specific morbidity on the level of the year 2009 in the urban area of Dâmbovi_a County (source: Public Health Direction of Dâmbovi_a County).
In the prevention of diseases caused by the exposure of the population to different
atmospheric pollutants, a special importance goes to their prophylaxis. In this sense, one
should have in view the maintaining of the concentration of the toxic substances from the
environment under the level of the maximum allowable concentrations (MAC) stipulated in
the norms (STAS).
7. Conclusions
In Dâmbovi_a County and implicitly in Târgovişte municipality and its surroundings, the
distribution of the sampling equipments available and the organization of the air quality
monitoring network was carried out in the sense of assuring especially the monitoring of the
areas most likely to be affected by impact pollution.
The pollutants to be monitored, the methods of measurement, the limit values, the alert and
the information thresholds and the criteria for the location of the monitoring points are
established by the national legislation concerning the atmospheric protection and meet the
requirements foreseen by the European regulations.
The air quality has undergone a slight improvement compared to the previous years from
the viewpoint of the pollution with different dusts.
www.intechopen.com

Pollution and Air Quality in Târgovişte Municipality and Its Surroundings (Romania)
27
The gaseous pollutants (nitrogen dioxide, sulphur dioxide, ammonia, sulphuretted hydrogen, formaldehyde, oxidant substances, and carbon monoxide) are not present in the atmosphere in concentrations above the allowable limits in the areas in which they are monitored.
The dominant pollution is represented by dusts in suspension (in the area of Târgovişte, in Doiceşti and its surroundings), and by pollution with settleable dusts in Fieni area.
8. References
Agen_ia Na_ională pentru Protec_ia Mediului (National Agency for Environment Protection), statistical data, 2000-2010, Bucharest, Romania.
Anuarul statistic al judeţului Dâmboviţa (Statistical Yearbook of Dâmbovi_a County), 2000-2010, Târgovişte, Romania.
Direc_ia de Sănătate Publică Dâmbovi_a (Public Health Department Dâmbovi_a), statistical data, 2000-2010, Târgovişte, Romania.
Direc_ia Jude_eană de Statistică Dâmbovi_a (Statistical Department of Dâmbovi_a County), statistical data, 2000-2010, Târgovişte, Romania.
Ministerul Mediului şi Pădurilor (Ministry of Environment and Forestry), statistical data, 2000-2010, Târgovişte, Romania.
Murărescu, O.; Pehoiu, G. (2009). Integrated management of environmental pollution due tu the County Dâmbovi_a industrial activiy. Annals - Food Science and Technology, Vol. 10, Issue 2, 2009, pp. 681-686, ISSN 2065-2828, “Valahia” University, Târgovişte, Romania.
Pehoiu, G. (2003). Câmpia Înaltă a Târgoviştei. Studiu de geografie umană şi economică (Târgovişte High Plain. Study of Human and Economical Geography), Cetatea de Scaun, ISBN 973-7925-01-7, Târgovişte, Romania.
Pehoiu, G. (2006). Actual aspects related to the quality of the air in the county Dâmbovi_a, in report with the status of health of the population. International Multidisciplinary Symposium „Universitaira Sempro 2006”, Ingineria mediului (Environment Engineering), ISSN: 1842-4449, Petroşani, 2006.
Pehoiu, G.; Muică, C.; Sencovici, M. (2006). Geografia mediului cu elemente de ecologie (Environment Geography with Elements of Ecology), Transversal, ISBN (10) 973-7798-32-5, ISBN: (13) 978-973-7798-32-9, Târgovişte, Romania.
Pehoiu G.; Murărescu O. (2009). Climate Change Impact on Environment and Health of the Population in Dâmbovi_a County, Romania, Proceedings of the 2nd WSEAS International Conference on Climate Changes, Global Warming, Biological Problems (CGB ’09), ISSN:1790-5095, ISBN: 978-960-474-136-6, Morgan State University, Baltimore, USA, November 7-9, 2009.
Pehoiu G.; Simion T.; Murărescu O.M. (2005). Climat urbain, et la pollution de l’air dans les villes industrielles. Etude de cas - La ville de Târgovişte (Roumanie). XVIIIe Colloque Internationale de Climatologie, Genova, 7-11 septembrie 2005. In: Climat urbain, ville et architecture, ed. Gerardo Brancucci, pp. 39-42, Laboratoire de Géomorphologie Apliquée, Département Polis, Université de Gênes, Retrieved from http://climato.ulg.ac.be/doc/AIC-table.pdf.
www.intechopen.com

Air Pollution – Monitoring, Modelling, Health and Control
28
Pehoiu G. (2008). The impact of human activities on environmental quality in Dâmbovi_a county. In Present Environment and Sustainable Development, Vol. 2, pp. 283-296, „Alexandru Ioan Cuza” University, ISSN 1843-5971, Iaşi, Romania.
Planul Local de Acţiune pentru Mediu al Judeţului Dâmboviţa (Local Plan of Action for Environment of Dâmbovi_a County), 2010, Târgovişte, Romania.
Agen_ia pentru Protec_ia Mediului - Dâmbovi_a (Agency for Environmental Protection - Dâmbovi_a County), Raport privind starea mediului în judeţul Dâmboviţa (Report regarding state of the environment in Dâmbovi_a County), 2000-2010, Târgovişte, Romania.
www.intechopen.com

Air Pollution - Monitoring, Modelling, Health and ControlEdited by Dr. Mukesh Khare
ISBN 978-953-51-0381-3Hard cover, 254 pagesPublisher InTechPublished online 21, March, 2012Published in print edition March, 2012
InTech EuropeUniversity Campus STeP Ri Slavka Krautzeka 83/A 51000 Rijeka, Croatia Phone: +385 (51) 770 447 Fax: +385 (51) 686 166www.intechopen.com
InTech ChinaUnit 405, Office Block, Hotel Equatorial Shanghai No.65, Yan An Road (West), Shanghai, 200040, China
Phone: +86-21-62489820 Fax: +86-21-62489821
Air pollution has always been a trans-boundary environmental problem and a matter of global concern for pastmany years. High concentrations of air pollutants due to numerous anthropogenic activities influence the airquality. There are many books on this subject, but the one in front of you will probably help in filling the gapsexisting in the area of air quality monitoring, modelling, exposure, health and control, and can be of great helpto graduate students professionals and researchers. The book is divided in two volumes dealing with variousmonitoring techniques of air pollutants, their predictions and control. It also contains case studies describingthe exposure and health implications of air pollutants on living biota in different countries across the globe.
How to referenceIn order to correctly reference this scholarly work, feel free to copy and paste the following:
Pehoiu Gica and Murărescu Ovidiu (2012). Pollution and Air Quality in Târgovişte Municipality and ItsSurroundings (Romania), Air Pollution - Monitoring, Modelling, Health and Control, Dr. Mukesh Khare (Ed.),ISBN: 978-953-51-0381-3, InTech, Available from: http://www.intechopen.com/books/air-pollution-monitoring-modelling-health-and-control/air-quality-and-pollution-in-ta-rgovis-te-municipality-and-the-surrounding-area-romania-