int. j. mass spectrom. ion proc., 1988, 83, 45-70
TRANSCRIPT
International Journal of Mass Spectrometry and Ion Processes, 83 (1988) 45-70Elsevier Science Publishers B.V., Amsterdam - Printed in The Netherlands
45
KINETIC ENERGY DISTRIBUTION OF IONSGENERATED BY LASER IONIZATION SOURCES
A. VERTES, P. JUHASZ, P. JAN1 and A. CZITROVSZKY
Central Research Institute for Physics of the Hungarian Academy of Sciences, P.O. Box 49,H-1525 Budapest 114 (Hungary)
(First received 8 June 1987; in final form 10 August 1987)
ABSTRACT
The time of flight (TOF) method has been utilized to measure kinetic energy distributionsof ions generated by laser ionization sources. Measurements were carried out on carbon foiltargets with pulses from a Q-switched ruby laser in the power density range from 10h to 10’”W cm-‘.
The onset of plasma formation and appearance of positive and negative energy ions wereobserved. Interference of neighbouring lines could be resolved by decreasing the lightintensity down to the plasma formation threshold.
The energy spectrum consisted of a positive energy peak and negative energy tail centeredaround the ideal symmetrical peak. The appearance of these characteristics depended on thelaser power density applied.
The positive energy part of the energy spectrum was related to the shock wave due to laserheating of the foil while the negative energy part could be explained by post-ionization ofneutrals in the accelerating region. Shock fitting according to Godunov served as a roughestimate for plasma hydrodynamics, while an optical and charge transfer model as a possibledescription of the negative part of the energy spectrum were discussed. Encouraging correla-tions between measured and calculated data were found.
INTRODUCTION
Increasing efforts have been devoted towards understanding the basicprocesses and mechanism of ion formation in laser ionization sources [1,2].This trend is due to the widespread application of laser ionization massspectrometers and their use for local microanalysis and material characteri-zation.
Former investigations of laser light interaction with solid targets focusedon nuclear fusion ignition [3] and construction of heavy-ion sources [4].Based on refs. 3 and 4, the main factors governing ion formation are lightwavelength, laser intensity distribution in space, laser intensity as a function
016%1176/88/$03.50 0 1988 Elsevier Science Publishers B.V.
46
Light I( r,t 1
/---
Electric field
‘\ \ Plasma front
I
L Z
Ti (r.t)
Target
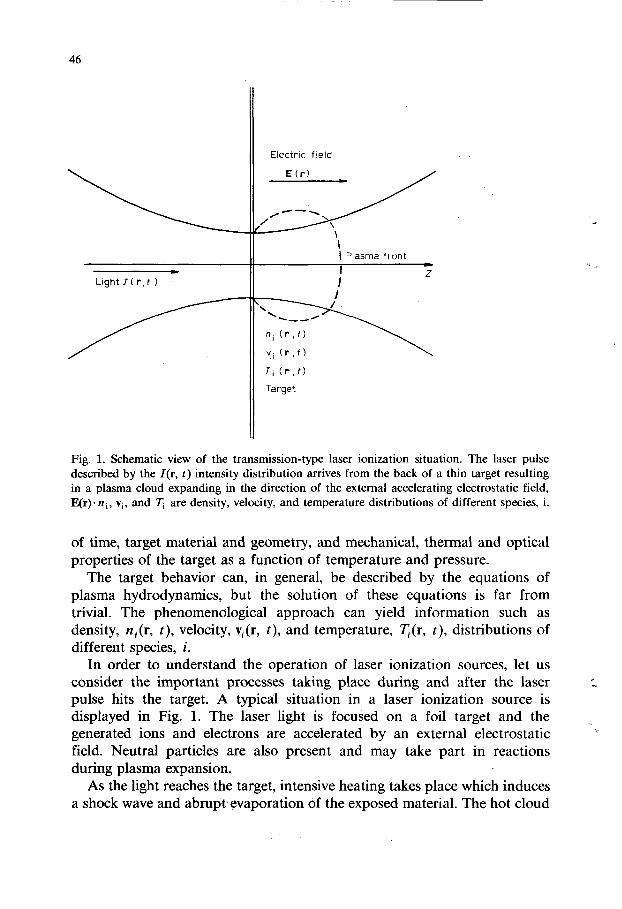
Fig. 1. Schematic view of the transmission-type laser ionization situation. The laser pulse described by the Z(r, t) intensity distribution arrives from the back of a thin target resulting in a plasma cloud expanding in the direction of the external accelerating electrostatic field, E(r). ni, vi, and Ti are density, velocity, and temperature distributions of different species, i.
of time, target material and geometry, and mechanical, thermal and optical properties of the target as a function of temperature and pressure.
The target behavior can, in general, be described by the equations of plasma hydrodynamics, but the solution of these equations is far from trivial. The phenomenological approach can yield information such as density, n,(r, t), velocity, vi(r, t), and temperature, q(r, t), distributions of different species, i.
In order to understand the operation of laser ionization sources, let us consider the important processes taking place during and after the laser pulse hits the target. A typical situation in a laser ionization source is displayed in Fig. 1. The laser light is focused on a foil target and the generated ions and electrons are accelerated by an external electrostatic field. Neutral particles are also present and may take part in reactions during plasma expansion.
As the light reaches the target, intensive heating takes place which induces a shock wave and abrupt evaporation of the exposed material. The hot cloud
47
of particles is partly ionized and absorbs energy further, undergoing rapid expansion at the same time. Since electrons play a primary role in energy absorption and they are at least 1800 times lighter than any positive ion, they gain much higher velocity, leaving the ions behind. This produces space charge effects which may limit the ion current and lead to a kinetic energy spread for the ions.
There is also scattering of ions on oppositely charged particles and on neutrals; this scattering causes a negative shift in the mean of the kinetic energy and reactive events like charge transfer or ion/molecule reactions. Production of ions in these reactions at positions different from the target plane is manifested in reduced acceleration by the drawout field, i.e. possible appearance of “negative energy” ions.
Our present aim is, therefore, to measure and recognize relations between features of ion kinetic energy distributions and properties of the laser plasma or at least confirm the presence or lack of certain effects.
So far, there have been two main types of experiment in which the energy distribution of laser-generated ions was examined: one type is based on some kind of energy filter, such as the electrostatic sector or on some kind of energy discriminator, such as the ion reflector [5-lo]; the other type is based on the simple time of flight principle or on its combination with the retarding potential method [ll-131.
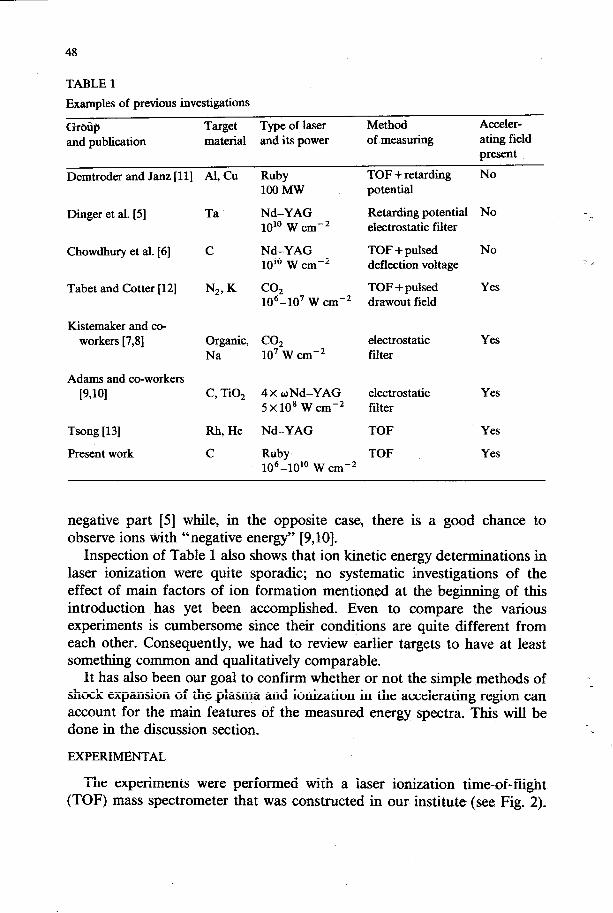
Representative examples of former investigations are listed in Table 1 together with information on target material, type of laser and power density of shots, and on the method of measuring the ion energy distributions.
It is interesting to compare the above methods from the point of view of providing direct information on the energy distributions. With the exception of the simple TOF method, one has the serious drawback of needing repetitive measurements. To obtain the distribution of ion energies, one has to repeat the experiment with different tuning of the energy filter or different setting of the retarding potential for a number of times. During this process, the conditions for ion generation may, and do, vary considerably so if reliable data are to be obtained, extensive signal averaging is necessary.
On the other hand, the TOF method provides the whole distribution from a single shot, although other factors like cross correlations from different mass ions frequently hamper the evaluation. It is also important to mention that only fast detection and recording of single transient ion currents has made possible the revival of the TOF technique.
There is another important distinction between the different experiments, namely the presence or absence of an accelerating field in the neighborhood of ion formation. This factor plays an important role in the shape of the measured distributions. As a rule, one can say that, where there is no accelerating field present, the energy spectrum of the ions does not contain a
48
TABLE 1
Examples of previous investigations
Group Target Type of laser Method Acceier-
and publication material and its power of .measuring ating field present
Demtroder and Janz [ll] Al, Cu Ruby TOF + retarding No 1OOMW potential
Dinger et al. [5]
Chowdhury et al. [6]
Tabet and Cotter [12]
Kistemaker and co- workers [7,8]
Adams and co-workers
[9,101
Tsong [13]
Present work
Ta Nd-YAG Retarding potential No 10” W cm-’ electrostatic filter
C Nd-YAG TOF + pulsed No 10’s w cm2 deflection voltage
N,,K CO2 TOF + pulsed Yes 106-lo7 w cm-2 drawout field
Organic, CO, electrostatic Na lo7 W cmp2 filter
Yes
C, TiO, 4 x wNd-YAG electrostatic Yes 5X10’ W cme2 filter
Rh, He Nd-YAG TOF Yes
C Ruby TOF Yes 106-10’o W crne2
negative part [5] while, in the opposite case, there is a good chance to observe ions tith “negative energy” [9,10].
Inspection of Table 1 also shows that ion kinetic energy determinations in laser ionization were quite sporadic; no systematic investigations of the effect of main factors of ion formation mentioned at the beginning of this introduction has yet been accomplished. Even to compare the various experiments is cumbersome since their conditions are quite different from each other. Consequently, we had to review earlier targets to have at least something common and qualitatively comparable.
It has also been our goal to confirm whether or not the simple methods of shock expansion of the plasma and ionization in the accelerating region can account for the main features of .the measured energy spectra. This will be done in the discussion section.
EXPERIMFNTAL
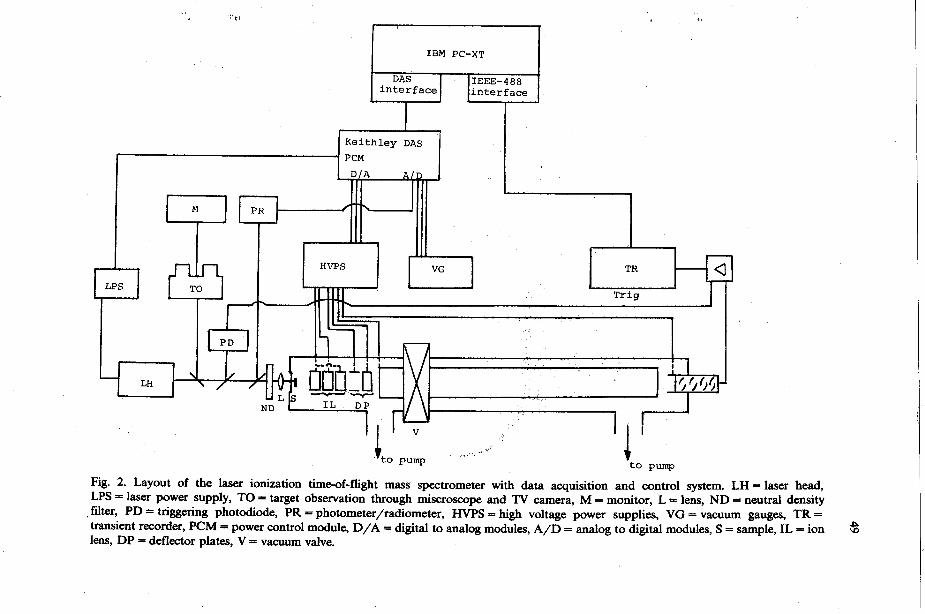
The experiments were performed with a laser ionization time-of-flight (TOF) mass spectrometer that was constructed in our institute (see Fig. 2).
IBM PC-XT
Keithley DAS
TR
Trig
to Pump
Fig. 2. Layout of the laser ionization time-of-flight mass spectrometer with data acquisition and control system. LH = laser head, LPS = laser power supply, TO = target observation through miscroscope and TV camera, M = monitor, L = lens, ND = neutral density filter, PD = triggering photodiode, PR = photometer/radiometer, HVPS = high voltage power supplies, VG = vacuum gauges, TR = transient recorder, PCM = power control module, D/A = digital to analog modules, A/D = analog to digital modules, S = sample, IL = ion lens, DP = deflector plates, V = vacuum valve.

50
The drift region of the accelerated ions was a 3.1 m long flight tube and was separated by a valve which enabled us to restart the vacuum system relatively quickly following the insertion of a new sample. Both halves of the vacuum system were pumped by rotary and diffusion pumps, but on the ion source side, we had to employ a diffusion pump of larger pumping speed (750 dm3 mm-i) for the sake of fast restart. In the ion source a pressure of 2 x 10e6 mbar was obtained whilst on the detector side, even lower values were measured.
Laser-induced positive ions were drawn out from the plasma by a - 3.1 kV accelerating voltage which drove the ions through an aperture 4 mm in diameter into a direction focusing ion lens. This ions lens was a symmetrical or einzel lens also used in the LAMMA 500 1141 instruments. Optimal transmission of the einzel lens was adjusted with the help of our earlier calculations [15] and by means of experiments using a continuous ion emitter. This method of optimization was described by Mauney. and Adams [9]. Behind the ion lens, two pairs of deflector plates provided the correct deflection in both directions perpendicular to ion flight. The role of these plates turned out to be insignificant since their optimal potential lay very close to the accelerating voltage.
The samples were ionized by pulses from a ruby laser [16] (X = 0.694 pm) supplied with a passive Q-switch (phthalocyanine dissolved in nitrobenzene) used at its ground frequency. We measured its pulse shape, which is plotted
00 t
0 60 120 180 240 300
Time(ns)
Fig. 3. Pulse shape of Q-switched ruby laser at 0.5 mJ energy. The passive Q-switch is phthalocyanine dissolved in nitrobenzene. The concentration of the solution, the thickness of the cuvette, and the pumping energy are optimized to achieve maximum output power at single pulse mode.
51
in Fig. 3. The signal was captured by a 100 MHz fast digitizing oscilloscope 1171. Maximum output power was achieved by adjusting the phthalocyanine concentration, the thickness of the Q-switch, and the power of pumping to the limit where double laser pulses almost appeared. It can be seen in Fig. 3 that the pulse length was about 56 ns determined at half width. The laser system was complemented with a microscope and with a camera-monitor system that aided the selection of the target area.
Laser impulses were divided by two beam splitters (90% transmission each). The first served to generate a trigger signal for the measurement by a fast photodiode after appropriate filtering and the second to monitor the laser power. For this purpose we employed a radiometer/photometer supp- lemented with a pulse integrator unit [18].
In this way, we were able to measure the energy of each laser shot directly. The analog output of the radiometer was later digitized and read to a microcomputer. The laser beam was focused on to the specimen by means of an ultra large working distance objective [19] whose focal diameter was about 12 pm at low laser energies. This diameter became somewhat larger while we increased the laser power by some four orders of magnitude.
Selection of the target area was accomplished by moving the objective in front of the quartz window covering the specimen. Close to the ion optical axis, translation in the x, y, and z directions was possible.
Ions leaving the drift region hit the entrance window of the detector, an electron multiplier [20]. The current signal from the ions was transformed into a voltage signal on a 50 n resistor and the latter was connected to a 20 dB preamplifier with 50 MHz bandwidth. The amplified signal was captured by an 8 kbyte transient recorder at 20 ns sampling rate (this device was developed in our institute). Thus, we could cover a mass range from 1 to 1500 u. Data were recorded with 8 bit resolution with linear or semi-loga- rithmic characteristics, optionally. This latter extended the dynamic range from 1: 256 to 1: 704 at the price of lower accuracy in the range of more intensive signals. The transient recorder was triggered by the signal from the photodiode. In some cases, we used the 100 MHz digitizing oscilloscope to zoom on to specific parts of the spectrum.
Calibrating constants reflecting the time shift of the recording measured from the laser pulse, c2, and the flight time of the unit mass ion, ci, could be accurately determined. We used the TOF calibration formula.
t = c,/Gp + c2 0)
where t, m, and z are flight time, mass, and charge of the ion, respectively. The whole experimental system was computer controlled. With the excep-
tion of target selection, each device was connected to the central controller which was an IBM-PC/XT supplemented with two interface cards: an
52
interface to a data acquisition system [21] and an IEEE-488 interface card. Hamlling of the transient recorder was carried out by the fast handshake capability of the IEEE-488 interface that facilitated fast data transfer between peripheral and computer at about 100 kbyte s-l rate. Handhg of the other devices was carried out with the powerful data acquisition system of the Keithley, Series 500. High power voltage supplies were remote controlled by analog outputs from the data acquisition system at 16 bit precision. Signals from vacuum gauges as well as from the radiometer/ photometer were led to A/D inputs of the system and digitized at 14 bit accuracy. The operation of the laser power supply was also programmed by precisely timing the arm, fin-e and turn on)off signals using the power control module of the Keithley DAS. This provided good reproducibility in the operation of the ion source.
The measurement control and data processing software was developed in our laboratory based on the integrated scientific environment ASYST [22]. By using this code supplemented with a few machine language subroutines, a complete measurement cycle needed less than 9 s which included 7 s waiting time for charging the capacitor plates of the laser power supply and 2 s for the readout and decoding of the data in the transient recorder.
For the experiments, we used carbon foils mounted on an electronmicro- scope grid. The vacuum-evaporated carbon layers were removed from their glass substrate and deposited on the grid by the floating technique. The grids were 400 or 200 mesh in. - ’ type and made from copper. These grids were analyzed by spark source mass spectrometry, giving confirmation that they contained no impurities in significant quantity. Carbon foils of 25 nm thickness from glass plates were floated off in water. Copper grids were washed with acetone and ammonium hydroxide and were dropped on to the floating foil and then picked out from the water surface.
The experimental results consisted of a series of mass spectra from carbon foils recorded at different laser power densities in transmission geometry, i.e. incidence of the laser pulse and draw out of ions took place on opposite sides of the specimen. Variation of laser power density was accomplished by consecutive insertion of neutral density filters.
We were able to investigate peak shapes as a function of the laser power density over a range of four orders of magnitude down to the plasma formation threshold. The actual values of power density were calculated from the transmittance of the filters of the lens and of the beam splitters positioned between the laser and specimen, from the spotsize and from the output of the radiometer/photometer.
Photographs of the perforations on the target were taken on a separate photomicrographic system, [23]. Dimensions of the objects could be de- termined using objective and ocular micrometers.

53
RESULTS AND DISCUSSION
Systematic measurements were carried out on numerous carbon foils using the different supporting grids. Q-switch and pumping energy settings were the same throughout; light intensity was reduced by applying a neutral density filter set immediately in front of the focusing lens. Since the laser power showed considerable fluctuations, we had to perform a large number of control experiments.
A typical example of a spectrum at high and at low laser power is shown in Fig. 4. High power density means 1Oro W cmm2, while low power density means lo6 W cme2. The C+ ion appears only in the high-power spectrum, while the other two very broad peaks cannot be identified from that spectrum alone. When compared with the low power case, it became obvious that the main species produced in the plasma are the m/z = 24, m/z = 41, m/z = 42, and m/z = 43 ions.
The assignment of the m/z = 24 peak is C;, while the other three peaks are probably C,Hf , C,Hz and C,Hq. Possible sources of these hydro- genated ions are either contamination of the target or reaction of the carbon foil particles with the residual gas in the ion source that do not modify significantly the characteristics of peak shapes (mainly H- and/or H+-trans-
(b)
Fig. 4. Timeof-flight laser ionization mass spectrum of carbon foil target at two different light power densities. High laser power (a) corresponds to 10” W cm-* while lower (b) corresponds to lo6 W cm-* values. Narrowing of ion energy distributions with decreasing laser power is evident; however, some structure of the peaks at low power still remains.
54
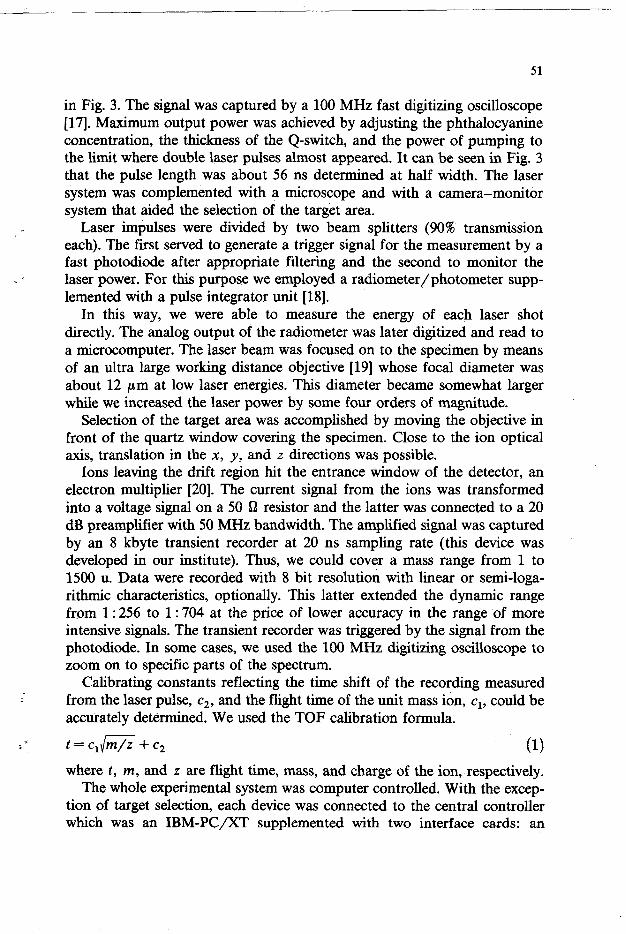
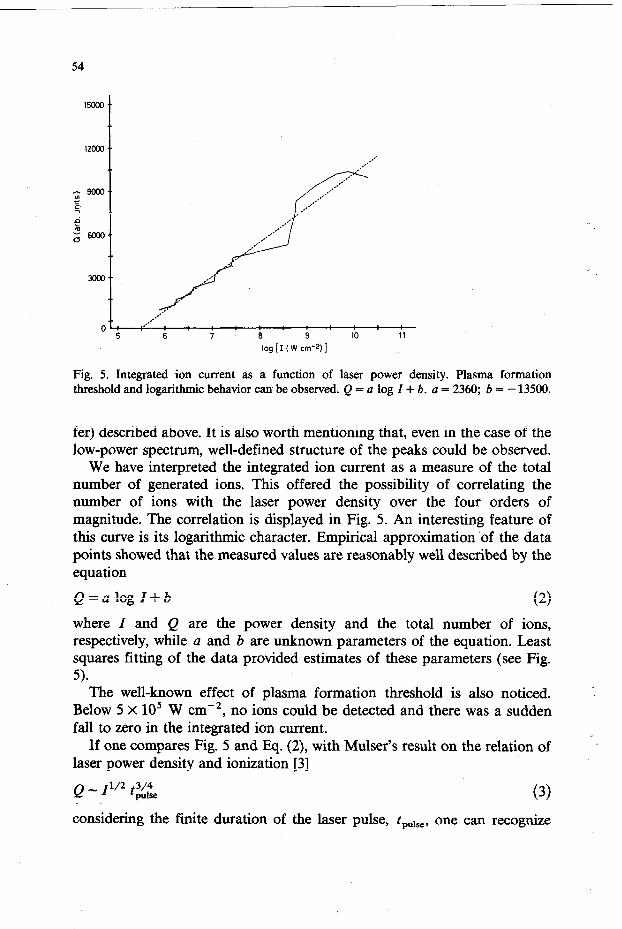
log [I (W m-2)]
Fig. 5. Integrated ion current as a function of laser power density. Plasma formation threshold and logarithmic behavior can be observed. Q = a log I + b. a = 2360; b = - 13500.
fer) described above. It is also worth mentioning that, even in the case of the low-power spectrum, well-defined structure of the peaks could be observed.
We have interpreted the integrated ion current as a measure of the total number of generated ions. This offered the possibility of correlating the number of ions with the laser power density over the four orders of magnitude. The correlation is displayed in Fig. 5. An interesting feature of this curve is its logarithmic character. Empirical approximation ‘of the data points showed that the measured values are reasonably well described by the equation
Q=alogl+b (2)
where I and Q are the power density and the total number of ions, respectively, while a and b are unknown parameters of the equation. Least squares fitting of the data provided estimates of these parameters (see Fig.
5). The well-known effect of plasma formation threshold is also noticed.
Below 5 X lo5 W cm-*, no ions could be detected and there was a sudden fall to zero in the integrated ion current.
If one compares Fig. 5 and Eq. (2), with Mulser’s result on the relation of laser power density and ionization [3]
Q - I”* t;& (3) considering the finite duration of the laser pulse, t+,, one can recognize

56
By constant structure we mean definite wave-like deformations with almost constant wavelength. This effect is probably due tc heating of the foil, either by lateral heat conduction in the foil and/or by light absorption from the outer regions of the laser beam where the power density was not high enough to reach the plasma formation threshold. Most probably both mechanisms contribute to the rippling structure observed.
The other feature of note is the shape of the perforations. In the power range of our investigations, circular holes are burnt in the film (as one can see on the right of Fig. 6). However, with high-intensity shots, the perfora- tions are more squarelike, reflecting the increasing influence of the copper grid as a boundary condition. In this case, the cylindrical symmetry is lost and the problem can no longer be handled in one dimension. One can use this effect as a direct and early indication of the influence of the grid on the experiment.
After inspecting the total amount of ions and the properties of the perforation on the target, let us reconsider the spectra and try to resolve the energy distribution of the specific ions from the time-of-flight peak shapes.
Using the basic relation between flight time and kinetic energy and some elementary arithmetic, one can derive the transformation formula
where t, is the flight time if the initial kinetic energy of the ions, E’, equals zero, and E, is the energy gained from the accelerating field.
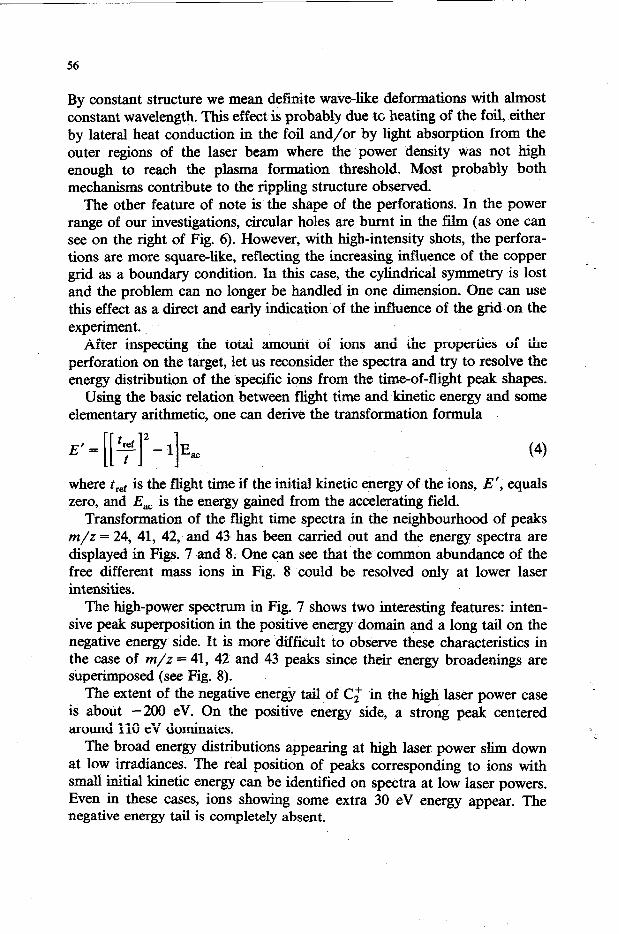
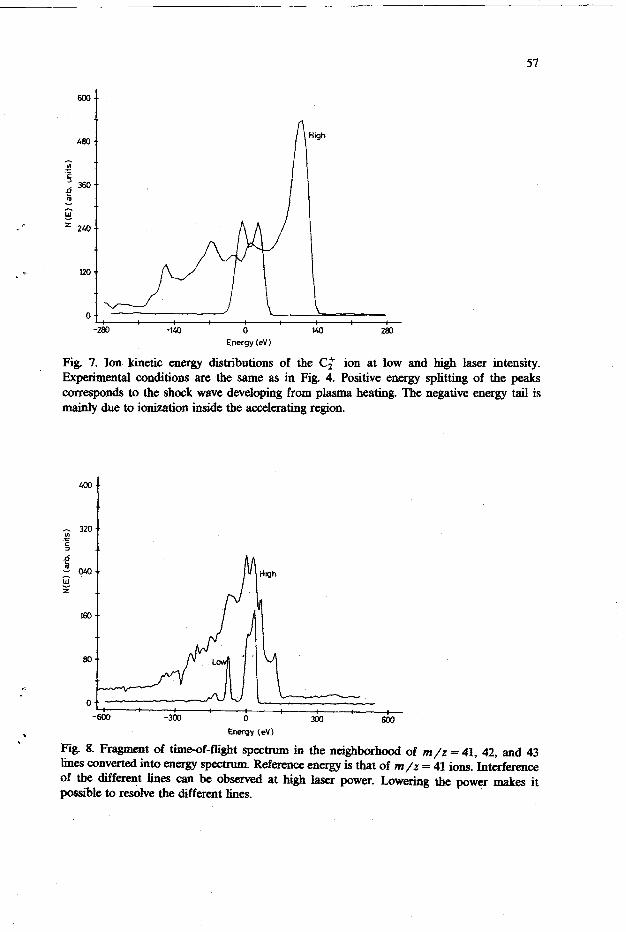
Transformation of the flight time spectra in the neighbourhood of peaks m/z = 24, 41, 42, and 43 has been carried out and the energy spectra are displayed in Figs. 7 and 8. One can see that ‘the common abundance of the free different mass ions in Fig. 8 could be resolved only at lower laser intensities.
The high-power spectrum in Fig. 7 shows two interesting features: inten- sive peak superposition in the positive energy domain and a long tail on the negative energy side. It is more difficult to observe these characteristics in the case of m/z = 41, 42 and 43 peaks since their energy broadenings are superimposed (see Fig. 8).
The extent of the negative energy tail of Cl “in the high laser power case is about -200 eV. On the positive energy side, a strong peak centered around 110 eV dominates.
The broad energy distributions appearing at high laser power slim down at low irradiances. The real position of peaks corresponding to ions with small initial kinetic energy can be identified on spectra at low laser powers. Even in these cases, ions showing some extra 30 eV energy appear. The negative energy tail is completely absent.
57
.-
. =
Em--
480 .-
G .Z s
d 360..
b
i;
z 240..
120 . .
0 ..
-280 -140 0 lb0 280
Energy (eV)
Fig. 7. Ion, kinetic energy distributions of the Cc ion at low and high laser intensity. Experimental conditions are the same as in Fig. 4. Positive energy splitting of the peaks corresponds to the shock wave developing from plasma heating. The negative energy tail is mainly due to ionization inside the accelerating region.
160
60
0
High
;:
-600 -300 0 xx) MXI
\ Energy (eV) /
Fig. 8. Fragment of timeof-fIight spectrum in the neighborhood of m/z = 41, 42, and 43 lines converted into energy spectrum. Reference energy is that of m/z = 41 ions. Interference of the different line-s can be observed at high laser power. Lowering the power makes it possible to resolve the different lines.
58
The following section will discuss the possible origins of the common features of the observed peaks, namely the positive energy maximum and the negative energy tail superimposed on the ideal symmetric peak. Among others, their cause can be laser-induced shock wave in the target and optical and chemical ways of ionization outside the target plane in the accelerating region. From the numerous spectra, it became clear that the maximum on the positive energy side is directly correlated to the laser power, while the negative energy tail shows fluctuations in magnitude and extent according to the actual focusing conditions. This observation gave us the impression that the negative energy tail must have some relation to the beam geometry in the light-target interaction region, while the positive energy maximum depends mainly on the amplitude of the laser beam.
Laser-induced shock wave in the target
The main contribution to peak broadening in the case of laser ionization is expected to be from plasma expansion during and after the laser pulse. This effect occurs necessarily because the plasma from a solid target is initially overdense and reflects the incident laser beam very strongly [3]. Extensive absorption occurs only when the plasma has expanded to some extent and its density has decreased below the critical density. At the critical density, the plasma frequency, wr, defined as
4ane2 “’ wp= -
[ 1 m, (5)
in c.g.s. units 1241, is equal to the (angular) frequency of the laser pulse. Here e and m, are the charge and the rest mass of the electron and n is their number density. In the actual experiments, the number density of C atoms amounted to about 102= cme3 so the plasma frequency was 5.62 x lOI s-l, while the frequency of the ruby laser was 2.72 X lOi s-l. From these data, we found that the C plasma had to expand to a thickness of 0.1 pm to reach the critical density (assuming slab geometry for the expansion).
Light absorption from an intensive laser pulse leads to a severe shock wave travelling along the beam path. Thus, production of ions with a surplus of kinetic energy is expected.
Subsequent expansion during the laser pulse results in ion formation well ahead of the target plane inside the accelerating region. In this way, it is possible to interpret the “negative energy tail” of the broadened peaks shown in Figs. 7 and 8:
Therefore, we had to estimate the velocity of shock displacement and the extent of plasma expansion during the 56 ns laser pulse. The best way to treat this problem is to accomplish a full hydrodynamic calculation which
59
also incorporates the effect of laser absorption and reflection. Such a calculation was beyond the scope of our present work so we were satisfied with a semi-quantitative approximation.
From the viewpoint of fluid dynamics, this problem resembles a simihuity flow, with a discontinuity in the initial conditions [25]: a compressed volume of gas expands into vacuum (here we consider the experimental vacuum, i.e. 10m6 mbar). A shock wave propagates toward the lower-pressure region and a rarefaction wave propagates backwards into the higher-pressure region. In the ion source, the situation can be modelled as follows: at time t = 0, two phases are present, the compressed vaporized and partially ionized bulk
I material, and the vacuum. These phases are separated by an immense discontinuity in the hydrodynamic observables which will evolve into a giant shock wave.
Shock waves in which the pressure drop amounts to nine orders of magnitude have to be handled with special methods; unmodified hydrody- namic equations do not give even an approximate description of the shock evolution [26]. The most widespread method is to incorporate shock treat- ment into the differential equations of hydrodynamics by introducing artifi- cial viscosity. This method was developed by von Neumann and Richtmyer [27]. Another possibility is the use of Godunov’s shock fitting procedure that reflects the physical principles of shock wave propagation far better than does the artificial viscosity method [28,29]. The third possibility is to utilize the similarity property of the flow that provides an approximate and general description of the flow but, so far as details (primarily from the physical point of view) are concerned, it is not too precise [30,31].
Our aim was to model the main characteristics of the observed peaks. For this purpose, we assumed that the plasma expansion is approximated by a constant expansion speed. There is no evidence that expansion speed is constant, but there are two effects that balance each other to a certain extent: decline of pressure during an isothermal expansion causes the velocity of expansion decrease, on the other hand a steep rise of temperature in the large density region due to laser absorption makes the velocity of expansion increase. Therefore, these effects acting against each other main- tain an expansion velocity which is slowly varying in time and, to a first
.V. approximation, it may be considered constant for a period as short as 56 ns. The quantity we were searching for was the flow velocity of volume elements
t closely behind the shock front. Here we refer to the excellent discussion of i shock waves in ref. 25.
In a shock wave exhibiting ideal flow, all the hydrodynamic variables are discontinuous (including entropy and velocity component perpendicular to the shock front). It is important to stress that the velocity of the shock front and the velocity of a fluid element behind the shock wave are different.

60
From a discontinuity in the initial conditions, in general a shock wave runs into the lower-pressure region (its propagating velocity always exceeds the local sound velocity) and a rarefaction wave runs into the higher-pressure region (propagating exactly with the local sound velocity). Therefore, the region in front of the shock wave is not perturbed by the shock wave; observables in this region are taken to be equal to their initial “vacuum” values. Observables behind the shock wave are perturbed by it, so they do not coincide with the initial bulk values. In the following discussion the index 1 labels initial values of observables in the sample being heated by the laser light, and the index 2 labels the initial values of observables on the vacuum side.
In the case of inviscid flow, there are six parameters to be determined: density, p; velocity of flow, u* (this is the quantity we are searching for); pressure, p *; internal energy per unit mass (characterized by the tempera- ture, T); velocity of the shock front; and entropy jump in the shock wave. For the six unknowns, we have the three Rankine-Hugoniot conditions which require the continuity of matter, momentum, and energy current densities in the shock wave, as well as the isentropic condition and wave relation for the rarefaction wave and the equation of state (the ideal gas law was used). From these six relations (not detailed here), Godunov et al. [28] derived the compact system of equations
p* = BP1 +AP*+AB(P* -P2)
A+B
u*_ Av,+Bv,+P,-P, - A+B
A={~[(Y+l)p*+(Y-l)p,]p,}1’2 ifp*Zpi
where y is the specific heat ratio (for a monoatomic ideal gas y = 5/3) and pi denotes the mass density ,,of species 1. The expressions for B are the same as for A, but index 1 has to be replaced by index 2. This system of equations needs to be solved iteratively: from a trial p*, we calculate A and B and get a new value of p* and u* in a loop until the desired accuracy is achieved.
We have calculated peak broadening due to shock wave effects: ions formed at time t = 0 gain extra kinetic energy (beyond that from the electrostatic field) that corresponds to their expansion velocity. On the other hand, ions formed at f > 0 come from inside the accelerating region, i.e. they will show an energy deficit corresponding to the position of formation in the accelerating field. This deficit can overcompensate the energy surplus due to the shock wave.
61
.
i;;I 24 ..
E __ Ill 0 ; 16 .. C ::
f
_.
.E 12 ..
E g .. lz
6 .
0 ..
0 3 6 9 12 15
Temperature (104K)
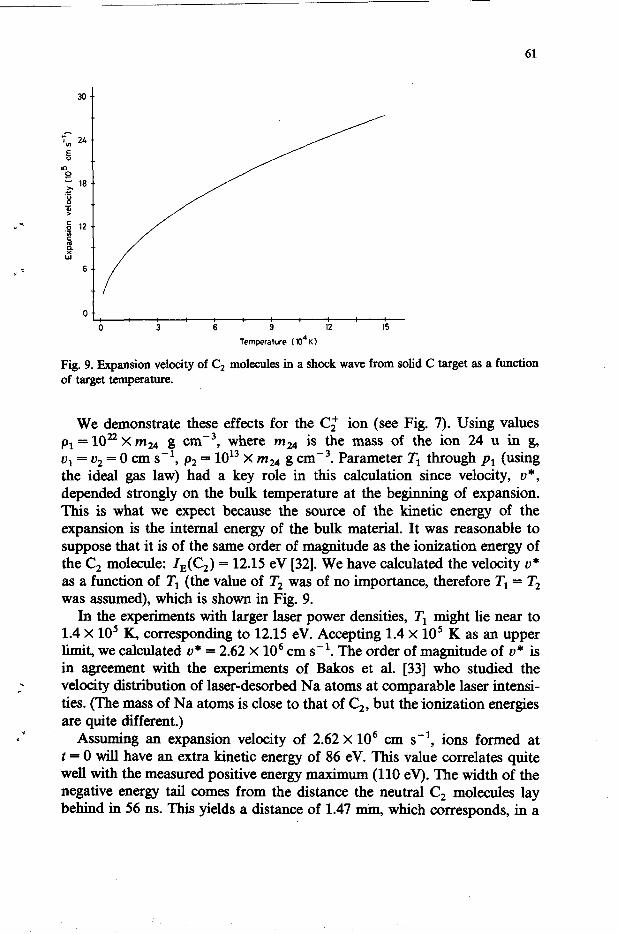
Fig. 9. Expansion velocity of C2 molecules in a shock wave from solid C target as a function of target temperature.
We demonstrate these effects for the Cl ion (see Fig. 7). Using values pi = 1O22 X Iy1.24 g. cm -3, where rnM is the mass of the ion 24 u in g, ui = u2 = 0 cm s-l, p2 = 1013 x ma g cmv3. Parameter Tl through p1 (using the ideal gas law) had a key role in this calculation since velocity, u*, depended strongly on the bulk temperature at the beginning of expansion. This is what we expect because the source of the kinetic energy of the expansion is the internal energy of the bulk material. It was reasonable to suppose that it is of the same order of magnitude as the ionization energy of the C, molecule: IE(C2) = 12.15 eV [32]. We have calculated the velocity u* as a function of Tl (the value of T, was of no importance, therefore Tl = T, was assumed), which is shown in Fig. 9.
In the experiments with larger laser power densities, Tl might lie near to 1.4 X lo5 K, corresponding to 12.15 eV. Accepting 1.4 X lo5 K as an upper limit, we calculated u* = 2.62 x lo6 cm s-r. The order of magnitude of u* is in agreement with the experiments of Bakos et al. [33] who studied the velocity distribution of laser-desorbed Na atoms at comparable laser intensi- ties. (The mass of Na atoms is close to that of C,, but the ionization energies are quite different.)
Assuming an expansion velocity of 2.62 X lo6 cm s-l, ions formed at t = 0 will have an extra kinetic energy of 86 eV. This value correlates quite well with the measured positive energy maximum (110 ev). The width of the negative energy tail comes from the distance the neutral C, molecules lay behind in 56 ns. This yields a distance of 1.47 mm, which corresponds, in a

62
6200 V cm-’ field, to an energy deficit of - 825 eV. However, in the case of neutrals having receded 1.47 mm from the target plane, there are other effects to take into account: a drop in laser power density due to beam divergence, plasma cloud expansion in directions perpendicular to the accelerating field, and reactions with the accelerated ions. We shah see in the following discussion that the divergence of the laser beam imposes a limit on the region of optical post-ionization, reducing it to about 0.5 mm.
Optical origins of post-ionization processes -,
Among the possible sources of energy deficient ions, we have to consider several effects of optical origin. Since laser pulses are of finite duration, considerable displacement of neutral atoms can occur during this time. The finite depth of field of focusing can also lead to ionization events outside the target plane. Atoms can be ionized in planes behind the target plane, at points where they still experience appreciable strength of the radiation field. Thus, due to the smaller value of the accelerating potential they experience, these ions can contribute to the negative energy tail of the energy spectrum.
2 _
Let us consider an ionization source geometry similar to that of Fig. 1. A single mode Gaussian beam is propagating in the z direction with its beam waist placed at the target plane, which we define as z = 0. The intensity distribution can be factorized to functions depending on time and space variables as
I(& Y, z, t)=m)X~b, Y, 4 00)
Strictly speaking, such a factorization is valid only in the case of small absorption during the propagation. Otherwise, a Beer-type treatment would be necessary
I,,(z, t) = I, exp[ -jcr(z, t) dz] 01)
where (Y(z, t) is the local light absorption coefficient. We made use of the cylindrical symmetry of the problem leaving only one space variable. To include absorption effects in the description, we would need detailed plasma density profiles which are not available at present. Since the target is extremely thin, it may be a good approximation if we neglect absorption effects in the present analysis.
Referring to the measured pulse shape (see Fig. 3), we can write, for the small depth of field region
IO(t) = IO exp [-4hr2[$]2] (12) where T is the full width at half maximum of the light pulse in time.
63
Position (m-111
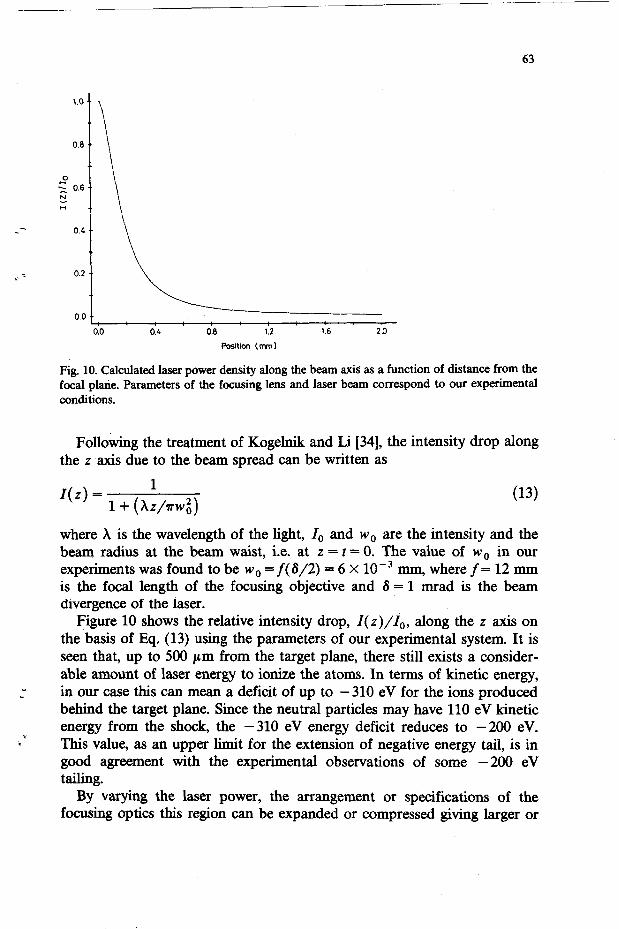
Fig. 10. Calculated laser power density along the beam axis as a function of distance from the focal plarie. Parameters of the focusing lens and laser beam correspond to our experimental conditions.
Following the treatment of Kogelnik and Li [34], the intensity drop along the z axis due to the beam spread can be written as
1
1(Z) = 1+ (hz/lr?q 03)
where A is the wavelength of the light, I,-, and w0 are the intensity and the beam radius at the beam waist, i.e. at z = t = 0. The value of w. in our experiments was found to be w. = f( S/2) = 6 X 10e3 mm, where f = 12 mm is the focal length of the focusing objective and 6 = 1 mrad is the beam divergence of the laser.
Figure 10 shows the relative intensity drop, I( z)/I,, along the z axis on the basis of Eq, (13) using the parameters of our experimental system. It is seen that, up to 500 pm from the target plane, there still exists a consider- able amount of laser energy to ionize the atoms. In terms of kinetic energy,
c in our case this can mean a deficit of up to - 310 eV for the ions produced behind the target plane. Since the neutral particles may have 110 eV kinetic energy from the shock, the Y - 310 eV energy deficit reduces to -200 eV.
L This value, as an upper limit for the extension of negative energy tail, is in good agreement with the experimental observations of some -200 eV tailing.
By varying the laser power, the arrangement or specifications of the focusing optics this region can be expanded or compressed giving larger or

64
smaller negative energy tails for the spectrum. In fact, this is what we observed experimentally (see Figs. 7 and 8).
Effect of symmetric charge transfer
Secondary chemical processes may be a further source of peak broadening observable in mass spectra. The situation is similar to that of optical post-ionization: the energy deficit of the ions is correlated to the position of formation in the accelerating field.
It is reasonable to expect that the majority of secondary ions come from binary collisions, so the rate of formation will show second-order kinetics if the density of reacting partners are comparable. An exact theory should first determine the dynamic model of the process. The quantity that characterizes the probability of collisions yielding secondary ions is the cross-section of the process being considered. Knowing the relative kinetic energy of colli- sion and energy distribution functions of colliding partners, one is able to calculate the phenomenological rate constants. The rate of formation of secondary ions, obviously depends also on the local densities of the re- actants. For multifarious demonstrations and applications of this procedure, see ref. 35.
’ .
As an example of secondary processes, we discuss the possible role of symmetric resonant charge transfer. According to conclusions from numer- ous experimental studies, symmetric resonant charge transfer usually has the largest cross-section among binary reactive collisions. Plenty of theoretical investigations have been published and we refer only to a few reviews [36,37].
We present here a simple calculation with the help of which it will be possible to estimate how important the secondary processes are from the point of view of the peak broadening observed in laser ionization mass spectra.
Let us follow the method of Rapp and Francis [38] to determine the cross-section of the reaction
c,++c,+c,+c; in an external electrostatic field. The cross-section is a function of the relative kinetic energy of the colliding partners. The relative kinetic energy of neutrals and their singly ionized counterparts show a characteristic dependence on the position in the ion source. Knowing the density distribu- tion of ions and neutrals, we should be able to determine the canonical and microcanonical rate constants of charge transfer [35]. In the former case, energy distributions are assumed to be shifted Maxwellians where for neutrals the amount of shift is related to the hydrodynamic velocity and for

65
ions there is also an extra velocity gained from the accelerating field. In the case of microcanonical rate constants, we neglect the Maxwellian character of the energy distribution and the microcanonical distribution is determined from the hydrodynamics and from the effect of the external electrostatic field. Thus, having made a full hydrodynamic calculation, we could model the effect of secondary processes.
c.-
. . L
An alternative way is to incorporate the appropriate rate equations into the hydrodynamic differential equations. A few large computer codes have been published covering this topic but mainly nuclear reactions were taken into account [39,40].
Since we have not solved the hydrodynamic equations, we can make only a rough estimate of the probable effects. Essentially, the Rapp-Francis theory is an adaptation of the impact parameter method extensively used in reaction dynamics [41]. Within the frame of this treatment, relative transla- tions are approximated as classical rectilinear motion. Transition probabili- ties are calculated quantum mechanically. After evaluating the quantum expression for the cross-section and simplifying it, Rapp and Francis derived the formula
CJ = &rb,2 (15)
where b, is a quantity similar to the critical impact parameter and is the solution of the transcendental equation
Here u stands for the relative velocity of the colliding partners, I, is the ionization energy of molecule C,, !. is the Bohr radius and r) = ( IJ13.6)1/2. In this approximation, the state of the colliding system is described by hydrogen-like wave-functions. This treatment is valid in velocity ranges lo8 > u > 105/p cm s-l. p is the reduced mass of the colliding partners in u.
Below the lower limit, rectilinear approximation of the trajectory is no longer valid. Following the approach of Rapp and Francis, we have used, in the low-velocity region, the classical formula
t= *= E. ( Q l/2
V I( 1 11 07)
k which is half of the cross-section of impact collisions described by
c Gioumousis and Stevenson [42]. (Y is the polarizability of the neutral particle.
The microcanonical rate constant, k, is simply related to the cross-section
by k=va 08)
66
2.0
1
0.4 . .
0.0 ..
0.0 1.0 21) 30 4.0 50
Relative velocity (lo6 cm 5-l)
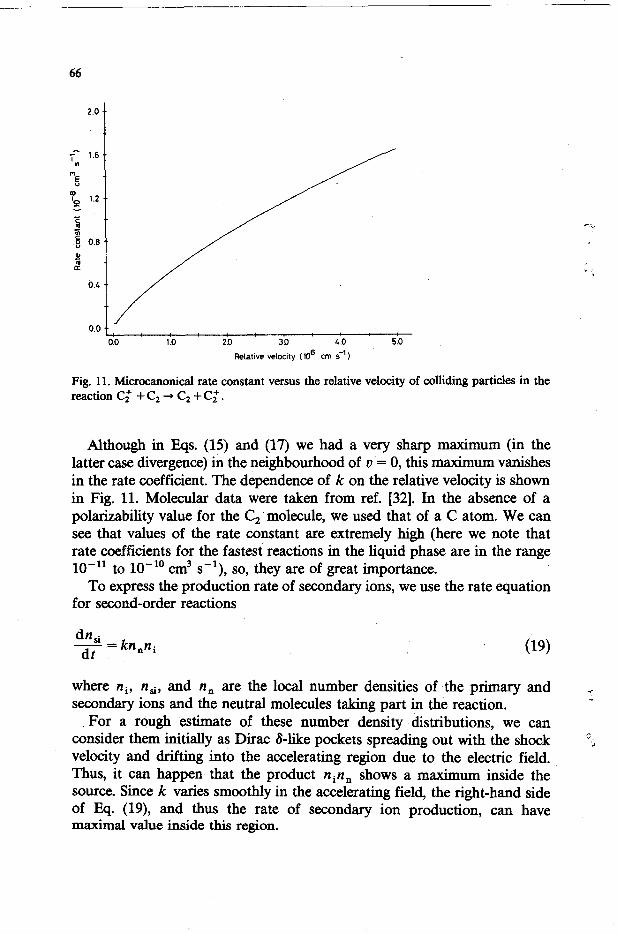
Fig. 11. Microcanonical rate constant versus the relative velocity of colliding particles in the reaction Cc + Cz + C2 + Cz .
Although in Eqs. (15) and (17) we had a very sharp maximum (in the latter case divergence) in the neighbourhood of u = 0, this maximum vanishes in the rate coefficient. The dependence of k on the relative velocity is shown in Fig. 11. Molecular data were taken from ref. [32]. In the absence of a polarizability value for the C; molecule, we used that of a C atom. We can see that values of the rate constant are extremely high (here we note that rate coefficients for the fastest reactions in the liquid phase are in the range lo-” to lo-” cm3 s-l), so, they are of great importance.
To express the production rate of secondary ions, we use the rate equation for second-order reactions
dir. 2 = kn,ni
dt (19)
where ni, nti, and n n are the local number densities of the primary and secondary ions and the neutral molecules taking part in the reaction.
For a rough estimate of these number density distributions, we can consider them initially as Dirac S-like pockets spreading out with the shock velocity and drifting into the accelerating region due to the electric field. Thus, it can happen that the product ninn shows a maximum inside the source. Since k varies smoothly in the accelerating field, the right-hand side of Eq. (19), and thus the rate of secondary ion production, can have maximal value inside this region.
67
On the other hand, however, the position of this maximum varies from time to time: it is drifting forward in the electrostatic field and its magnitude decreases. Therefore, we can ultimately expect a smoothly decaying curve for the total production of secondary ions as a function of position in the source. The consequence for peak shapes is a decaying tail on the energy deficient side.
-*.- Comparing this conclusion with Figs. 7 and 8, we can recognize a
qualitative agreement. More elaborate analysis should take into account the real shape of particle density distributions and that primary ions are formed continuously due to the effect of optical post-ionization. If, for some reason, at certain points of the ion source preferred, a more complex structure expected.
SUMMARY
the production of secondary ions is of their energy distribution would be
A fully automated time-of-flight spectrometer has been built to measure kinetic energy distributions of different ions generated by laser ionization sources. Computer control of all the experimental parameters except x, y, z translation of the focusing lens made possible the fairly stable operation of the source. The data acquired were analyzed and stored by the same computer. The energy resolution of the spectrometer reached several elec- tron volts in the mass range of our interest at the given accelerating voltage.
In order to check previous calculations of Mulser concerning the relation between light power density and total number of generated ions, we mea- sured these quantities using a Q-switched ruby laser and carbon foil target. A power density range from lo6 to 101’ W cmT2 was covered. The plasma formation threshold and logarithmic behavior of the above-mentioned re- lation could be observed. This was markedly different from the square root-type dependence predicted by Mulser.
Microscopic investigation of the morphology of the laser-generated perfo- rations in the foil taught us that the shape of the perforations is closely related to its distance from the supporting grid. In other words, in the vicinity of the supporting grid, the grid itself serves as a boundary condition altering significantly the process of plasma formation. Another feature we recognized was the rippling structure around the perforations. This structure turned out to be,quite stable throughout the observations and its appearance was probably related to lateral thermal deformations.
Energy spectra of m/z = 24, 41, 42 and 43 ions were investigated. Common features of the energy distributions are a strong peak at 30-110 eV on the positive energy side and a long negative tail extending down to - 200
eV on the negative energy side. The extension of peak broadening showed direct correlation with the power density of laser shots. At high power densities, the peaks became broader leading to interference in the case of the m/z = 41, 42 and 43 ions.
Three mechanisms contributing to the production of energy deficient and excess energy ions were discussed in detail. Generation of a shock wave due to laser heating leads to a positive shift in initial kinetic energy. Optical and chemical post-ionization processes produce ions in the accelerating region, which thus gain less energy than those produced in the target plane.
The treatment of the shock wave in our discussion did not involve complete hydrodynamic calculations. We concentrated instead on the de- termination of shock velocity by the method of shock fitting. In this way, an estimate of the particle’s initial kinetic energy became available. Comparison with the experimental energy spectra confirmed that this approach is feasi- ble.
Determination of the light intensity distribution in the vicinity of the target plane is important because of possible post-ionization processes. Measuring the pulse intensity as a function of time and calculating the spatial distribution of the light intensity in the depth of field region of the focusing optics made it possible to estimate the magnitude of this factor. The result of these calculations is convincingly straight: this mechanism of post-ionization may have an important contribution to the production of negative energy ions.
Another possible way to account for energy deficient ions is the effect of charge transfer reactions. The cross-section of symmetric charge transfer was determined by the method of Rapp and Francis. By considering second-order kinetics, an expression for the rate of production of secondary ions in the reaction between Cz and C, was found. Qualitative analysis of the formula showed that, if certain conditions for the distribution of reaction partners are fulfilled, the negative energy tail in the ion kinetic energy distribution can be explained, otherwise a more complex structure in the energy distribu- tion is to be expected.
ACKNOWLEDGEMENTS i-
The authors are grateful and wish to express their sincere appreciation to Professor R. Gijbels (Universitaire Instelling Antwerpen, Antwerp, Belgium) and to Professor J. Bakos (Central Research Institute for Physics, Budapest, Hungary) for reading the manuscript and to M. De Wolf (Universitaire Instelling Antwerpen, Antwerp, Belgium) for kindly providing the carbon foils.

REFERENCES
69
1
2
8
9 10
11 12 13 14 15 16 17 18 19 20 21 22 23 24 25
26
27 28
29
30
31
-32
33
34
F. I-~&&, Springer Series in Chemical Physics, Vol. 25, Springer Verlag, Berlin,
1983, p. 190. F. Hillenkamp, Springer Series in Chemical Physics, Vol. 44, Springer Verlag, Berlin,
1985, p. 471. P. Mu&r, Z. Naturforsch. TeiI A, 25 (1970) 282. H. Yasuda.and T. Sekiguchi, Jpn. J. Appl. Phys., 18 (1979) 2245. R. Dinger, K. Rohr and H. Weber, J. Phys. D, 13 (1980) 2301. S.S. Chowdhury, R.M. Clement and H.T. Miles, J. Phys. E, 13 (1980) 1099. G.J.Q; Van Der Peyl, W.J. Van Der Zande, K. Bederski, A.J.H. Boerboom and P.G. Kistemaker, Int. J. Mass. Spectrom. Ion Phys., 47 (1983) 7. G.J.Q. Van Der Peyl, W.J. Van Der Zande and P.G. Kistemaker, Int. J. Mass Spectrom. Ion Processes, 62 (1984) 51. T. Mauney and F. Adams, Int. J. Mass Spectrom. Ion Processes, 59 (1984) 103. E. Michiels, T. Mauney, F. Adams and R. Gijbels, Int. J. Mass Spectrom. Ion Processes, 61 (1984) 231. W. Demtroder and W. Jam, Plasma Phys., 12 (1970) 691. J.C. Tabet and R.J. Cotter, Int. J. Mass Spectrom. Ion Processes, 54 (1983) 151. T.T. Tsong, Int. J. Mass Spectrom. Ion Processes, 70 (1986) 1. Leybold-Heraeus, Cologne, F.R.G. A. Vertes, P. Juhasz and L. Matus, Int. J. Mass Spectrom. Ion Processes, 73 (1986) 109. Carl Zeiss, Jena, G.D.R., Model LMA 10. Iwatsu, Tokyo, Japan, Model TS8123. EG&G, San Diego, CA, U.S.A., Models 550 and 550-3, respectively. Olympus, Tokyo, Japan, ULWD MsPlan 20, focal length 12 mm. Thorn EMI, Ruislip, Gt. Britain, Type 9643B. KeithIey, Cleveland, OH, U.S.A., Model DAS Series 500. Macmillan Software Company, New York, U.S.A. Olympus, Tokyo, Japan, Model PM-1OAD. P. MuIser, R Sigel and S. Witkowski, Phys. Rep., 6 (1973) 187. L.D. Landau and E.M. Lifshitz, Theoretical Physics, Vol. 6, Addison-Wesley, Reading, MA, 1959, Chap. 9. RD. Richtmyer and K.W. Morton, Finite Difference Methods for Initial Value Problems, Wiley, New York, 1967, pp. 306-338. J. von Neumann and R.D. Richtmyer, J. Appl. Phys., 21 (1950) 232. S.K. Godunov, A.V. Zabrodin and G.P. Prokopov, USSR Comput. Math. Math. Phys., 6 (1961) 1020. M. Holt, Numerical Methods in Fluid Dynamics, Springer Verlag, Berlin, 1978, pp. 28-40.
H. Hors, in H. I-bra (Ed.), Laser Interactions and Related Plasma Phenomena, Vol. 1, Plenum Press, New York, 1970, pp. 365-382. S. Witkowski in H. Hora (Ed.), Laser Interactions and Related Plasma Phenomena, Vol. 1, Plenum Press, New York, 1970, pp. 339-353. A.A. Ibdzig and B.M. Smimow, Reference Data on Atoms, Molecules and Ions, Springer Verlag, Berlin, 1983. J.S. Bakes, G. Burger, P.N. Ignacz, J. Kovacs and I. Stigeti, KFKI Rep. 1986-57/D, Budapest, 1986. H. Kogelnik and T. Li, Appl. Opt., 5 (1968) 1550.

70
35 W.J. Chesnavich and M.T. Bowers, Prog. React. Kinet., 11 (1982) 137. 36 A.B. Weglein and D. Rapp, in M.T. Bowers (Ed.), Gas Phase Ion Chemistry, Vol. 2,
Academic Press, New York, 1979, pp. 299-341. 37 W. Lichten, Adv. Chem. Phys., 13 (1967) 51. 38 D. Rapp and W.E. Francis, J. Chem. Phys., 37 (1962) 2631. 39 J.P. Christiansen, D.E.T.F. Ashby and K.V. Roberts, Comput. Phys. Commtm., 7 (1974)
271. 40 S. Atzeni, Comput. Phys. Commun., 43 (1986) 107. 41 R.D. Levine, Quantum Mechanics of Molecular Rate Processes, Clarendon Press, Oxford,
1969, pp. 231-238. 42 G. Gioumousis and D.P. Stevenson, J. Chem. Phys., 29 (1958) 294.
r 4’
,