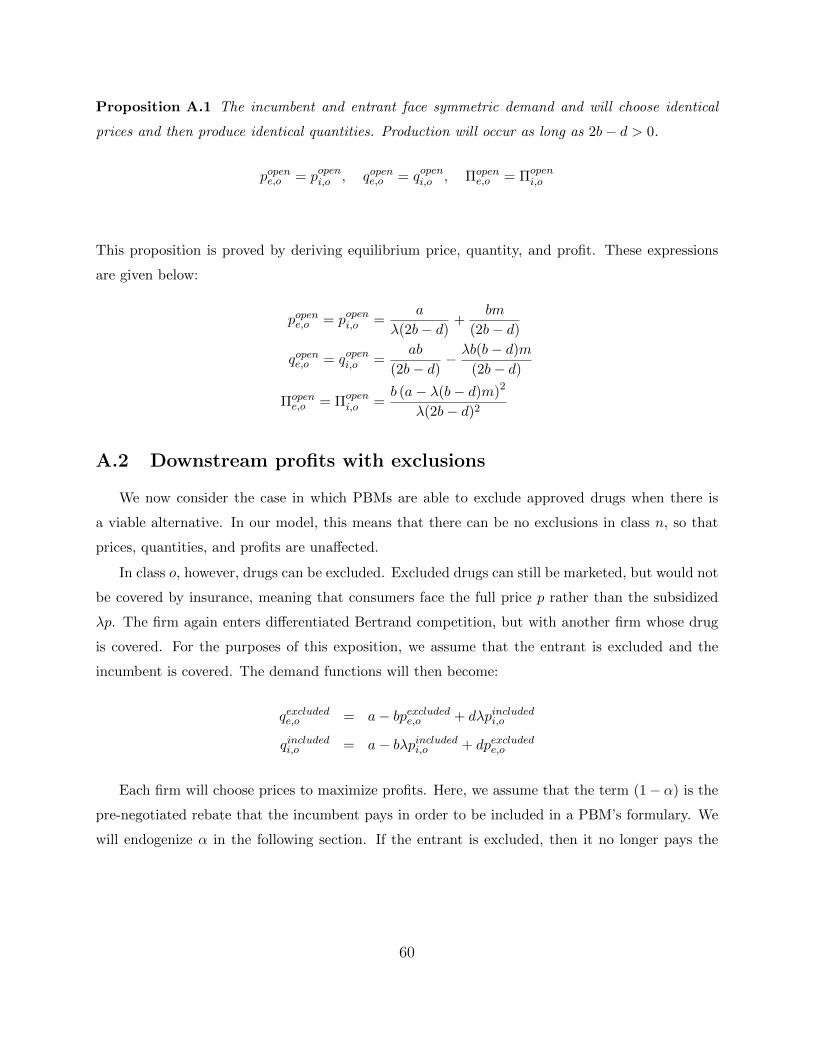
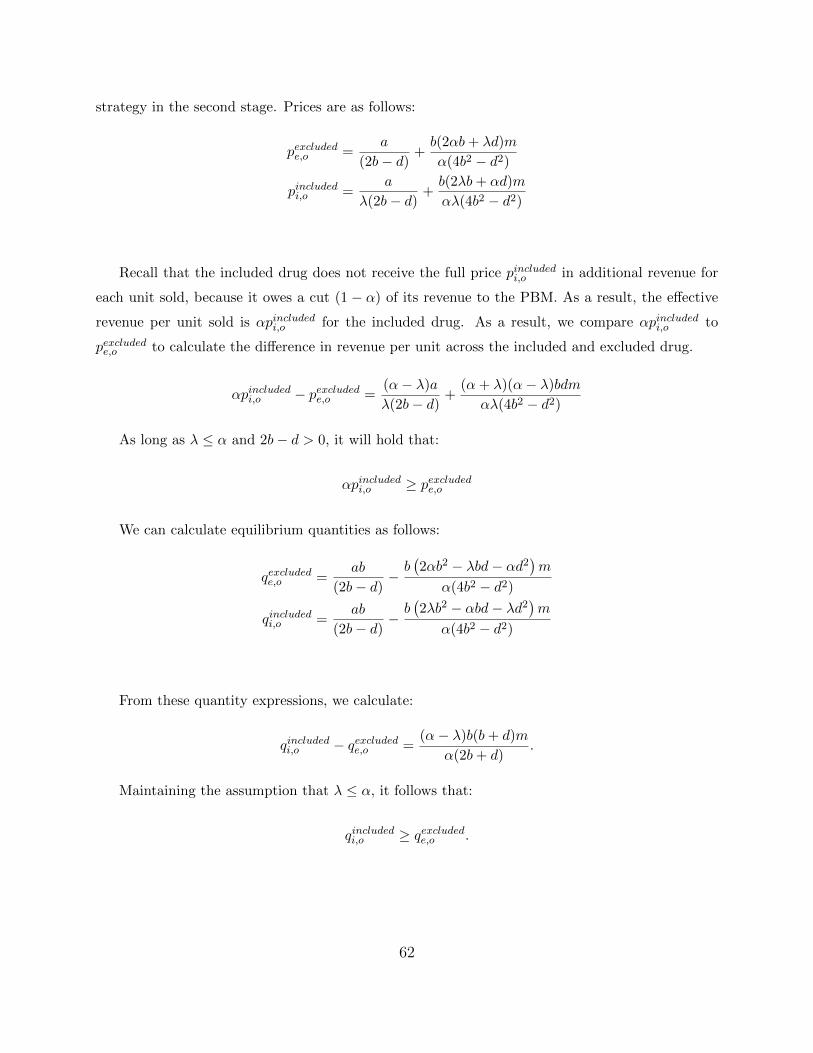
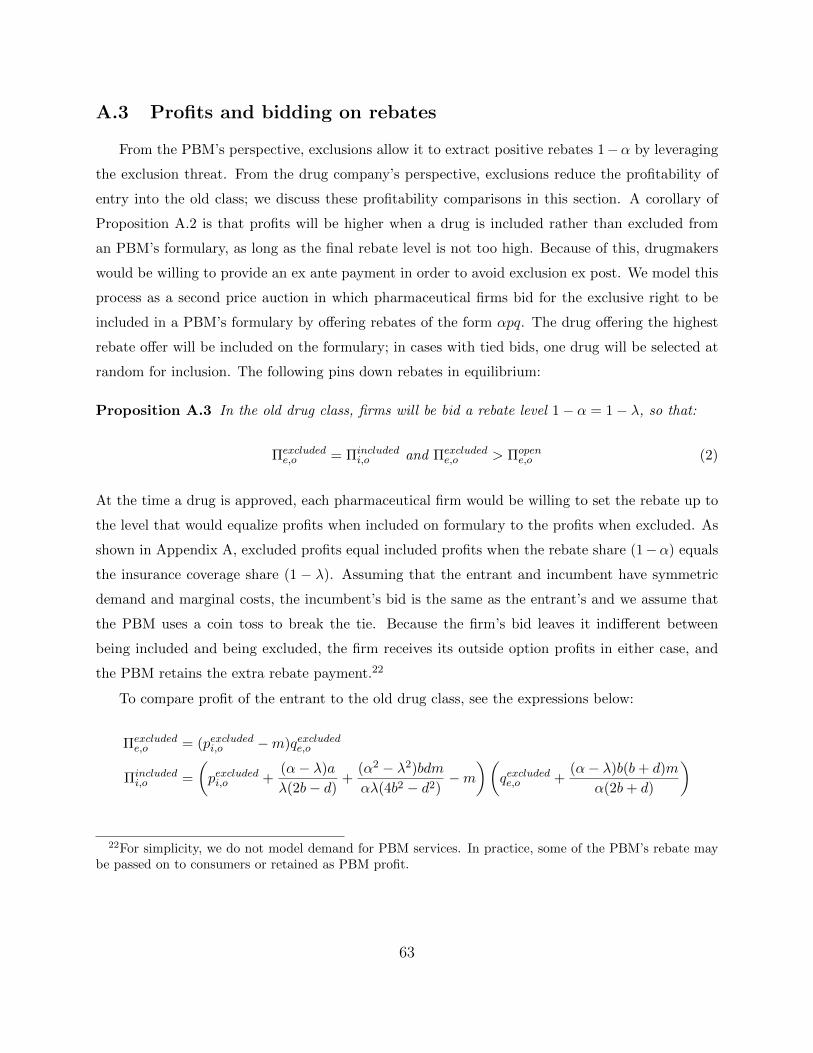
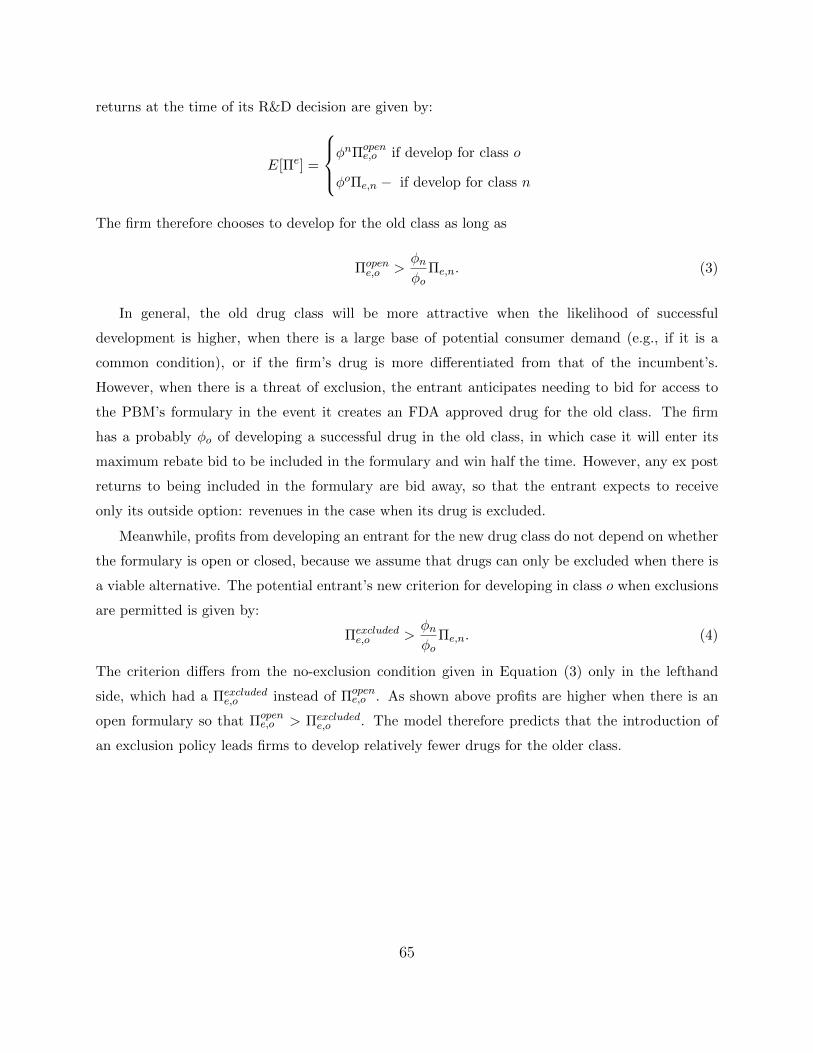
insurance design and pharmaceutical innovation
TRANSCRIPT
Insurance Design and Pharmaceutical Innovationlowast
Leila Aghadagger Soomi Kim Dagger Danielle Li sect
July 9 2020
Abstract
This paper studies how insurance coverage policies affect incentives for
pharmaceutical innovation In the United States the majority of drugs are sold to
Pharmacy Benefit Managers (PBMs) which administer prescription drug plans on
behalf of insurers Beginning in 2012 PBMs began adopting ldquoclosed formulariesrdquo
excluding coverage for certain drugs including many newly approved drugs when
adequate substitutes were available We show that this policy reshaped upstream
RampD activity and led pharmaceutical firms to shift investment away from therapeutic
classes at greater risk of facing coverage exclusions This move translated into a
relative decline in the number of drug candidates that appear more incremental in
their therapeutic contribution that is those in drug classes with more pre-existing
therapies and less scientifically novel research
JEL Codes O31I11
lowastWe are grateful to Jason Abaluck Pierre Azoulay Katherine Baicker Ernst Berndt Alex Frankel ErzoLuttmer Jonathan Skinner Christopher Snyder Scott Stern and Heidi Williams for helpful feedback onthis project
daggerDartmouth College and NBERDaggerMITsectMIT and NBER
Technological innovation is a large driver of rising health spending raising questions as
to whether our current payment systems deliver the right balance between incentives to
innovate and incentives to contain costs While some argue that broad insurance coverage
and generous pricing policies are necessary to sustain valuable RampD investment others
believe that these same policies generate perverse incentives to create expensive products
with little incremental clinical value1 The policy relevance of this debate has grown as
politicians have increasingly called for the federal government to implement value-based
pricing that limits insurance coverage for high-cost low-value treatments Despite its
importance there is limited empirical evidence on how the structure of insurance coverage
shapes incentives for upstream medical innovation
In this paper we study the impact of a major change in coverage policies for private
sector prescription drug plans on upstream pharmaceutical RampD In the United States
prescription drug plans are typically managed by intermediary firms known as Pharmacy
Benefit Managers (PBMs) Traditionally PBMs provide coverage for all FDA-approved
drugs but assign them to different tiers of patient cost-sharing Beginning in 2012 however
PBMs began refusing to provide any coverage for some high price drugs (including many
newly approved drugs) when cheaper generic or branded substitutes already existed Over
the next five years 300 drugs were excluded by at least one of the three largest PBMs
This practice of excluding coverage entirely known as maintaining a ldquoclosed formularyrdquo
can substantially reduce the expected profitability of new drugs For example the high
blood pressure medication Edarbi received FDA approval in 2011 but was almost immediately
excluded by the two largest PBMs CVS Caremark and Express Scripts By September 2013
Edarbirsquos manufacturer the Japanese firm Takeda had decided to sell off its US distribution
rights despite keeping these rights in Japan and in other countries2
Understanding how the downstream policies of PBMs shape upstream pharmaceutical
innovation can inform our understanding of how to design insurance plans that balance
incentives for innovation and cost-containment These lessons gleaned from the policies of
private sector firms provide insight into the possible effects of new policy proposals governing
1For example Stanford (2020) and Zycher (2006) have argued that the innovation benefits of generousdrug payment policies are large while Bagley et al (2015) and Frank and Zeckhauser (2018) highlight therisk that generous drug payments may yield excessive incremental innovation
2In an analysis described in Section 42 we test whether this example generalizes Our results show thatfor each PBM that excludes coverage a drugrsquos sales (as proxied by Medicare Part D claims) falls by 24
1
how public insurers interact with drugmakers3 The largest PBM CVS Caremark manages
benefits for 75 million Americansmdashmore than the number of enrollees in either Medicare or
Medicaid
We begin by showing that the risk of being excluded from a PBMrsquos formulary varies
systematically and predictably across drug classes in particular exclusions are more
common in drug classes with more pre-existing therapeutic options and in classes with a
larger number of patients In the case of Edarbi CVS and Express Scripts both pointed to
a variety of other popular angiotensin II receptor blockers (ARBs) as viable alternatives
even though they were not molecularly equivalent Further the cost savings associated
with excluding Edarbi were potentially very large because they could be realized over many
patients suffering from hypertension Indeed we show show that the greatest number of
exclusions were for drugs aimed at treating diabetes and cardiovascular diseases both areas
responsible for a large share of insurance spending
Next we use this information to build a measure of each drug classrsquos ex-ante risk of facing
exclusions based on its market characteristics prior to the introduction of closed formularies
We show that pharmaceutical RampD fell markedly in drug classes at high risk of exclusions
relative to trends in low risk classes following the introduction of closed formulary policies
We document a 5 decline in the number of new clinical trials and announcements of early
stage development for a one standard deviation increase in ex-ante exclusion risk These
declines impact drug candidates in all phases of development but are largest among earlier
stage drugs
We go on to explore the nature and value of this foregone innovation We first document
a change in the composition of drugs under development RampD declined the most in drug
markets with a high number of existing therapies serving common diseases such as diabetes
and cardiovascular diseases Second we show that exclusions depressed RampD investments in
the least scientifically innovative drug classes those where drug patents are based on older
and less ldquodisruptiverdquo underlying science (Funk and Owen-Smith 2017)
Taken together our results suggest that closed formulary policies altered the demand
risks that drugmakers consider when making RampD investment decisions Prior to this policy
3Congressional Budget Office (2007) predicts that the government will not be able to negotiate lowerprices with drug manufacturers unless it adopts a PBM-pioneered model of providing preferential access forspecific drugs on publicly-run formularies
2
change pharmaceutical firms could expect that their drugs would be covered by insurers
if approved by the FDA In this world firms had strong incentives to develop incremental
drugs aimed at large disease markets because such drugs were the most likely to receive
FDA approval and generate a large base of revenues if approved With the introduction
of closed formularies these incremental drugs became precisely the ones at greatest risk of
being excluded from formularies Our results show that pharmaceutical firms responded
to this change in incentives by shifting resources away from drug classes serving common
diseases with many incumbent therapies Further our results suggest that exclusion policies
shifted research investments away from areas with more ldquome-toordquo development activity and
lower scientific novelty
An important caveat to note is that our econometric approach is based on a
difference-in-differences specification that identifies a relative decline in investment in drug
classes at high exclusion risk compared to lower risk classes A natural welfare-relevant
question is whether this constitutes a total decline in innovative activity or a reallocation
of RampD investment While we cannot answer this question empirically (since it would rely
purely on time series identification) recent research suggests that even large
pharmaceutical firms may face financial frictions In this case a decline in RampD spending
in high exclusion risk classes may generate some degree of reallocation toward other drug
classes that face lower exclusion risk In the absence of frictions exclusion policies would
decrease total investment in new drug innovation
Our paper contributes to a broad literature examining how market incentives shape the
rate and direction of innovative output4 Prior empirical research has documented that
increased demand for drugs spurs new drug development several studies have measured the
impact of public insurance expansions (Acemoglu et al 2006 Blume-Kohout and Sood 2013
Clemens 2013 Dranove et al 2020 Finkelstein 2004 Krieger et al 2017) and demographic
changes (Acemoglu and Linn 2004 Dubois et al 2015) Other research has investigated the
role of regulation patent protection and public procurement showing that stronger patent
protection (Kyle and McGahan 2012) longer periods of market exclusivity (Budish et al
2015) Both ldquopushrdquo and ldquopullrdquo incentives have demonstrated effects on medical innovations
4Here we summarize some of the recent work in this area that focuses on healthcare innovation Directedtechnical change is also an active area of research in environmental economics which studies how investmentin clean and dirty technologies responds to market incentive (eg Aghion et al 2016 Acemoglu et al 2012)
3
including tax credits (Yin 2008) and public procurement incentives (Clemens and Rogers
2020) Our findings build on this earlier empirical work by focusing on a new angle how
changes in the structure of insurance coverage affect the direction of innovative activity
Further our paper provides an empirical analysis of tradeoffs raised by a theoretical literature
on insurance design and innovation (Garber et al 2006 Lakdawalla and Sood 2009)
The rest of the paper proceeds as follows Section 1 introduces the institutional
context Section 2 describes the negotiation between PBMs and drugmakers in more detail
summarizing a theoretical model of how RampD investments may respond to the introduction
of formulary exclusions Section 3 provides an overview of our key data sources covering
exclusions drug development and market characteristics Section 4 describes which drug
classes contain formulary exclusions and reports evidence that exclusions suppress drug
demand Section 5 presents our main findings on how formulary exclusions have reshaped
investments in drug development Section 6 discusses the welfare implications and
Section 7 concludes
1 Institutional Background
In the United States many parties are involved in the process of bringing a drug from
manufacturer to patient wholesalers pharmacies pharmacy benefit managers (PBMs) and
insurers Historically PBMs were only responsible for processing patient claims at the
pharmacy ie verifying the patientrsquos coverage obtaining payment from the insurer and
transmitting that payment to the pharmacy However over time and in concert with a wave
of mergers (Werble 2014) PBMs began playing a more active role in designing prescription
drug plans on behalf of insurers determining which prescription drugs would be covered
under a planrsquos formulary
Figure 1 illustrates the flow of both goods and payments for prescription drugs The
physical path of drugs is simple they are bought by wholesalers who then deliver and sell
them to pharmacies where they are distributed to patients PBMs do not generally enter
the physical supply chain for drugs but they play a major role in coordinating payments
PBMs serve as an intermediary between the insurer and the pharmacy The pharmacy is
paid by two parties it receives a drug co-pay from the patient and a reimbursement from
4
the PBM Meanwhile the PBM collects revenue in two ways First it is reimbursed for
the drug by the patientrsquos insurer who is still the ultimate payee Second the PBM also
receives a rebate from the pharmaceutical firm this is a payment that the pharmaceutical
firm negotiates in return for having their drug included (ideally in a preferred position) on
the PBMrsquos formulary The PBM may pass on a portion of this rebate to the insurer
By 2012 the PBM industry had consolidated to the point that the largest three companies
controlled 62 of the market a share which has continued to grow (Lopez 2019) In this
paper we track the exclusion policies of the three largest firms CVS Caremark Express
Scripts and OptumRx Given their ability to pool patient demand across plans administered
on behalf of multiple insurance companies as well as their influence on formulary design
PBMs have substantial negotiating power with drug manufacturers PBMs may place drugs
into formulary tiers setting higher cost sharing for less preferred drugs Coverage for certain
drugs may require prior authorization from the patientrsquos insurance company Further PBMs
may use step-therapy restrictions and only cover more expensive drugs after cheaper options
have been proven ineffective
Beginning with CVS in 2012 major PBMs began implementing closed formularies
Rather than providing coverage (potentially with some tiering or restrictions) for all drugs
as long as they are FDA-approved PBMs began publishing lists of drugs that their
standard plans would not cover at all directing potential users to lists of recommended
alternatives including similar branded or generic drugs Some major PBMs also designated
closed formularies the default choice implementing a system where PBM customers (ie
insurers) would have to opt out if they wanted to avoid the standard closed formulary
(Reinke 2015) Industry experts describe PBM formulary exclusions as an ldquointegral part of
contract negotiationsrdquo with drug manufacturers (Reinke 2015)
Patients enrolled in prescription drug plans with closed formularies typically receive an
annual mailing notifying them of exclusions for the upcoming year and urging them to change
medications if they are currently taking a drug that is on this list With few exceptions
patients wishing to take an excluded drug would be responsible for paying the full cost at
the pharmacy5
5While patients may be able to access drugs that are excluded by their PBMrsquos formulary the exclusionsintroduce new barriers The patientrsquos insurer may entertain patient-specific appeals for coverage outside ofthe PBMrsquos standard policies The patient may choose to purchase the drug without insurance coverage
5
The PBM industry argues that formulary restrictions reduce insurersrsquo costs (Brennan
2017) but advocates counter that exclusions harm patients by decreasing access to
treatment A 2017 survey conducted by the Doctor-Patients Rights Project reports that a
quarter of insured Americans were denied treatment for chronic illnesses the most common
denial reason was the treatmentrsquos formulary exclusion (The Doctor-Patient Rights Project
2017) Furthermore while PBMsrsquo closed formularies policies implicitly rely on a
ldquoone-size-fits-allrdquo approachmdashchoosing one preferred treatment over other similar
treatmentsmdashdrugs that appear therapeutically equivalent may vary in efficacy and side
effects and a drug that works well for one patient may not be the best drug for another
patient with the same disease (Celgene 2016) We provide more detail on exclusion
practices in Section 4
A natural question is why PBM formulary exclusions became common after 2012 A
complete investigation is beyond the scope of this paper but there is evidence that existing
policies such as prior authorization requirements and the use of ldquostep therapiesrdquo were not
effective at limiting the use of certain expensive medications For example Miller and
Wehrwein (2015) suggest that exclusions may have arisen in response to the growing use of
ldquoco-pay cardsrdquo which are discounts offered by pharmaceutical companies to subsidize
patientsrsquo drug costs Because the insurer still has to pay its share of the drug price co-pay
cards diminished PBMsrsquo ability to steer patients to cheaper drugs In contrast exclusions
provide PBMs with a stronger tool for utilization management that cannot be directly
countered by co-pay cards and other consumer discounts
2 Formulary Exclusions and Upstream Innovation
In this paper we analyze the effect of PBM formulary exclusions on investments in drug
development While closed formularies have direct effects on demand for excluded drugs
they are also likely to affect the pricing of other drugs that face exclusion risk but were not
ultimately excluded Steve Miller the chief medical officer of Express Scripts described the
process of negotiating with pharmaceutical manufacturers as follows
paying the full price out-of-pocket Finally some patients may be able to choose between insurance plansserviced by different PBMs and so could switch to an alternative plan that has not excluded the drug
6
ldquoWe are going to be pitting you all against each other Who is going to give us
the best price If you give us the best price we will move the market share to
you We will move it effectively Wersquoll exclude the other productsrdquo (Miller and
Wehrwein 2015)6
Consistent with the market dynamics described by Garthwaite and Morton (2017) the
exclusion threat increases the PBMrsquos ability to shift consumers across rival products
strengthening their bargaining position In its marketing analysis CVS explicitly argues
that ldquo[f]ormulary is foundational to cost controlrdquo and suggests that the introduction of
formulary exclusions in 2012 led to lower price growth for pharmaceuticals7
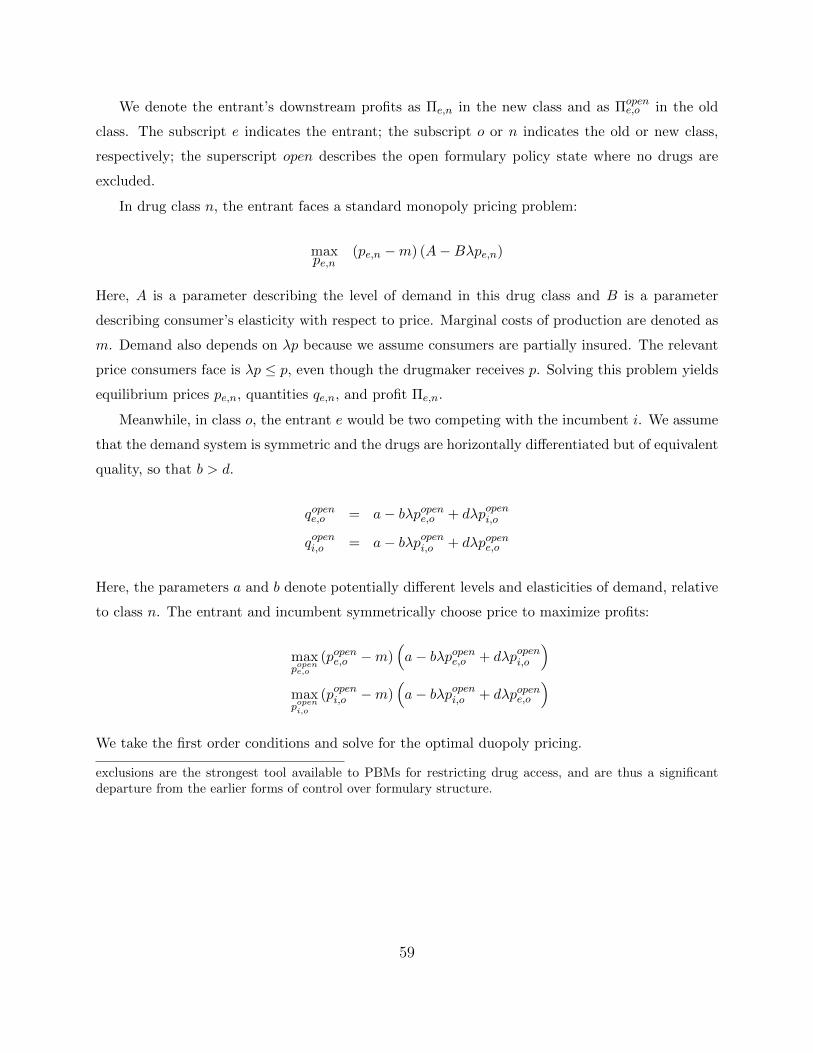
In Appendix A we provide a simple model that formalizes how drug exclusion policies
impact drug firmsrsquo RampD decisions In this model a potential pharmaceutical entrant faces
a choice invest in developing a drug for a ldquonewrdquo drug classmdashthat is one in which no prior
treatments existmdashor invest in developing a drug for an ldquooldrdquo class in which there is an
incumbent therapy available In the absence of exclusions PBMs are required to provide
coverage for all approved drugs if successful a pharmaceutical entrant would become a
monopolist in the new drug class and a duopolist in the old drug class We model closed
formularies as permitting exclusions when a similar substitute is available In the old drug
class the two firms bid on rebate payments to the PBM in order to win exclusive formulary
coverage Exclusions therefore reduce drug revenues in the old drug class where entrants face
exclusion risk and will pay high rebates to the PBM if they succeed in obtaining formulary
coverage These reduced revenues lower the returns to investing RampD dollars into the old
drug class without changing the returns to investing in the new class Our model predicts
that we should see a relative drop in new drug candidates entering markets in which existing
therapies are already available
The welfare implications of this change in drug development incentives are theoretically
ambiguous First losses to pharmaceutical firms can be cast as gains to the PBMs in the
form of higher rebates If PBMs pass some of these cost savings onto consumers then
exclusion policies create a tradeoff between incentives for future innovation and
6In line with this description observers note that within a therapeutic class PBMs are increasinglyselecting a single brand for coverage (Cournoyer and Blandford 2016)
7Source CVSHealth Payor Solutions Insights website httpspayorsolutionscvshealthcom
insightsconsumer-transparency Accessed June 15 2020
7
affordability of current prescription drug coverage Second an overall decrease in drug
development can be welfare enhancing if business stealing effects dominate the benefits of
expanding treatment options (Mankiw and Whinston 1986) This is a possibility in our
setting especially if foregone drug candidates would have otherwise been entrants into
already crowded therapeutic areas
Finally another welfare-relevant consideration is how RampD investment is allocated within
pharmaceutical firms In our model the potential entrant chooses between investing in
the old versus the new class This is likely to be the case when firms face financial or
organizational frictions that limit their ability to invest in all net present value (NPV)
positive projects Under this assumption the introduction of closed formularies generates a
reallocation of RampD dollars away from older drug classes toward newer classes An alternative
model however would have firms investing in all drug candidates with a positive NPV In
this case the introduction of closed formularies would instead lead to an aggregate decline
in RampD investments since exclusions decrease the NPV of investments in older classes but
have no effect in newer classes Our empirical strategy allows us to identify only the relative
change in development across drug classes making it difficult to distinguish between these
possibilities Section 6 discusses the welfare implications and limitations of our analysis in
more depth
3 Data
Our analysis focuses on tracking changes in drug development activity over time and
across drug classes We have assembled four primary data sources (1) PBM formulary
exclusion lists (2) time-varying characteristics of drug markets (3) prescription drug sales
volume and (4) new drug development activity The data we draw from each of these sources
is summarized briefly below
1 Formulary Exclusions We hand-collected data on formulary exclusions published
by CVS Caremark Express Scripts and OptumRX through 2017 Together these
firms account for approximately 70 of the PBM market8 Our data cover ldquostandardrdquo
8When it first closed its formulary in 2012 CVS had a 20 share of the PBM market (Lopez 2018)Express Scripts followed suit in 2014 when its market share was 338 (Health Strategies Group 2015)
8
formulary exclusions these exclusions apply to most health plans administered by a
particular PBM Insurers may elect to provide more expansive coverage by opting out
of the standard formulary but we do not have information on exclusions within these
custom plans9 We match the excluded drugs to their 4-digit Anatomical Therapeutic
Chemical (ATC4) drug class using the First Data Bank data (described below) These
exclusions form the basis of our analysis
2 First Data Bank In order to better understand the characteristics of drugs and drug
classes that experience exclusions we collect data on drug markets and drug pricing
from First Data Bank (FDB) FDB is a commercial dataset primarily marketed to
healthcare organizations that manage formularies It contains information on a drugrsquos
ATC4 classification pricing and the existence of generic substitutes We use this
information to construct additional data on drug markets at the ATC4 level the
number of approved branded and generic drugs in an ATC4 class and measures of
the price of already approved branded and generic drugs10 We use these variables to
predict which drug classes face exclusion risk and as control variables to account for
time-varying market attributes in certain specifications
3 Medicare Part D Data To establish that formulary placement affects drug
demand we document the impact of exclusions on a drugrsquos insurance claim volume in
Section 42 Because sales volume is not measured by FDB we turn to publicly
available data on annual Medicare Part D claims volume by drug11 Most Medicare
Part D plan sponsors contract with PBMs for rebate negotiation and benefit
Finally OptumRx began publishing formulary exclusions in 2016 when its market share was 22 (Fein2017)
9Custom plans are less common because they are likely to be substantially more expensive For exampleon its payer-facing website CVS encourages insurers to choose its standard (closed) formulary for anestimated 29 savings in per member per month drug costs (Brennan 2017)
10We use unit price provided by the manufacturer to FDB Specifically wholesale acquisition unitcost (manufacturerrsquos published catalog or list price to wholesalers) was used where available If thiswas unavailable suggested wholesale unit price (manufacturerrsquos suggested price from wholesalers to theircustomers) was used If this was unavailable then direct unit price (manufacturerrsquos published catalogue orlist price to non-wholesalers) was used Unit refers to the NCPDP billing unit of the product where a unitis defined as a gram each or milliliter
11This data is published annually by the Center for Medicare and Medicaid Studies We accessed it online athttpswwwcmsgovResearch-Statistics-Data-and-SystemsStatistics-Trends-and-Reports
Information-on-Prescription-DrugsHistorical_Data in November 2019
9
management (Government Accountability Office 2019) and many Part D plans
feature closed formularies (Hoadley et al 2011) making Medicare Part D a suitable
context to study the impact of exclusions This data is available from 2012-2017 and
reports the annual number of claims for all drugs with at least 11 claims
4 Cortellis Investigational Drugs Our main analysis studies the impact of formulary
exclusions on drug development We obtain data on pipeline drugs including both
small molecule and biologic drugs from Clarivate Analyticsrsquo Cortellis Investigational
Drugs database (Cortellis) Cortellis tracks drug candidates using data it compiles
from public records company documents press releases financial filings clinical trial
registries and FDA submissions Drug candidates typically enter the Cortellis database
when they enter preclinical development this is often when a drug candidate will
appear in patents or in other documents describing a firmrsquos research pipeline Similarly
because all firms are required to apply for and receive FDA approval to begin human
clinical trials Cortellis has near complete coverage of drug candidates that advance
into human testing
Using Cortellis we track each drugrsquos US-based development across five stages
pre-clinical development phase 1 trials phase 2 trials phase 3 trials and launch
Our primary outcome is the total number of drug candidates within a class that
entered any stage of development each year 12 Table 1 Panel A reports the summary
statistics of development activity across different stages
Throughout most of the paper our unit of analysis is a narrowly defined drug class
following the Anatomical Therapeutic Chemical (ATC) classification system ATC codes
are used to organize medicinal compounds we use an ATC4 (four-digit) level classification
which identifies chemical subgroups that share common therapeutic and pharmacological
properties
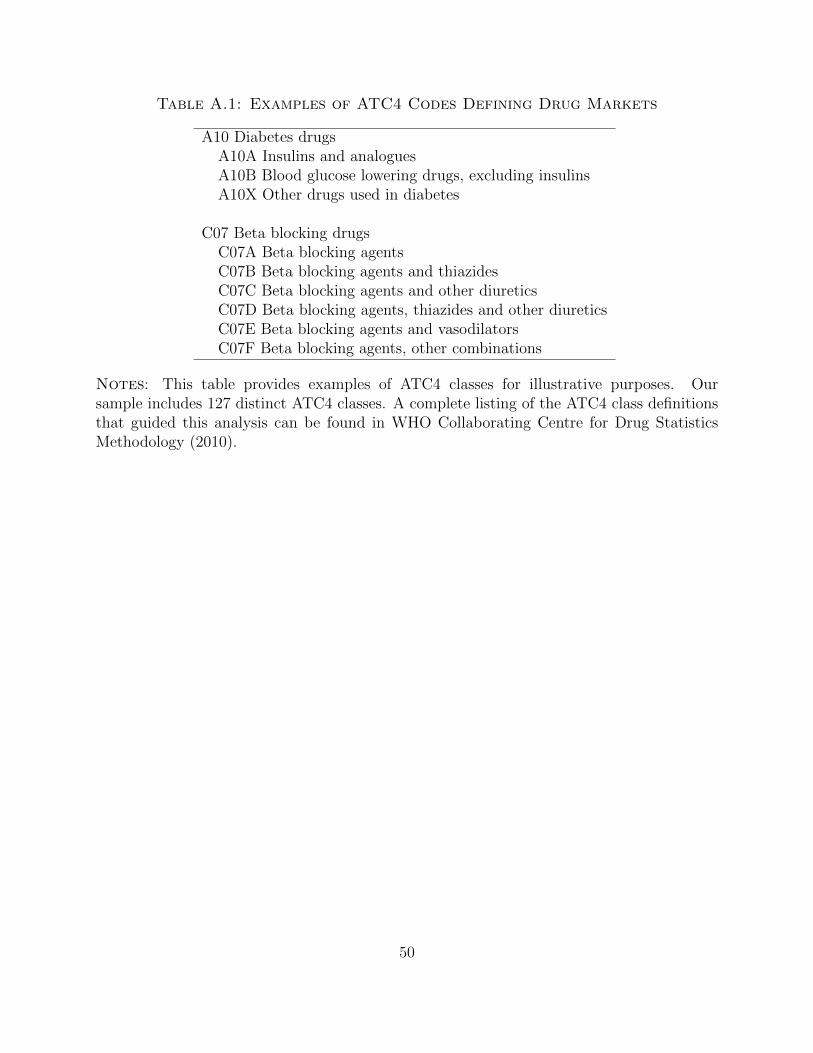
Appendix Table A1 lists several examples of ATC4 designations For example diabetes
drugs fall into 3 distinct ATC4 categories depending on whether the drug is an insulin or
12In cases where we observe a drug in development at a later stage without a recorded date for priordevelopment stages we fill in the earlier stage date to equal the subsequent recorded stage Because theFDA requires each new drug to move through each phase before receiving approval seeing a drug at a laterstage in development is strong evidence that it previously moved through the earlier stages We never filldrug development ldquoforwardrdquo because many drug candidates fail to progress at each stage
10
insulin analogue (ATC4 A10A) a non-insulin blood glucose lowering drug (A10B) or other
diabetes drug (A10X) Cardiovascular drugs span 28 distinct ATC4 categories Narrowing in
on the subgroup of cardiovascular drugs that are beta blocking agents Appendix Table A1
reports 6 distinct ATC4 classes for beta blockers distinguishing whether the beta blocker is
present in isolation or in combination with various other drug types
We interpret an ATC4 drug class as a ldquomarketrdquo where drugs within the class will typically
be partial substitutes for one another We drop ATC4 categories that are not categorized as
drugs in FDB such as medical supplies We also restrict to ATC4 categories that contain
at least one branded drug on the market as of 2011 Finally we drop ATC4 categories with
missing data on prices or the availability of generic and branded drugs as measured in FDB
and ATC4s with missing data on prescription volume as measured in the 2011 Medicare
Expenditure Panel Survey as we need to be able to predict exclusion risk as a function
of these market attributes for our main specification After making these restrictions our
primary sample has 127 ATC4 classes Table 1 Panel B shows the summary statistics of
various market characteristics for our sample ATC4s separately based on whether or not
they experienced exclusions in 2012 or 2013
4 Formulary Exclusions
41 Descriptive statistics
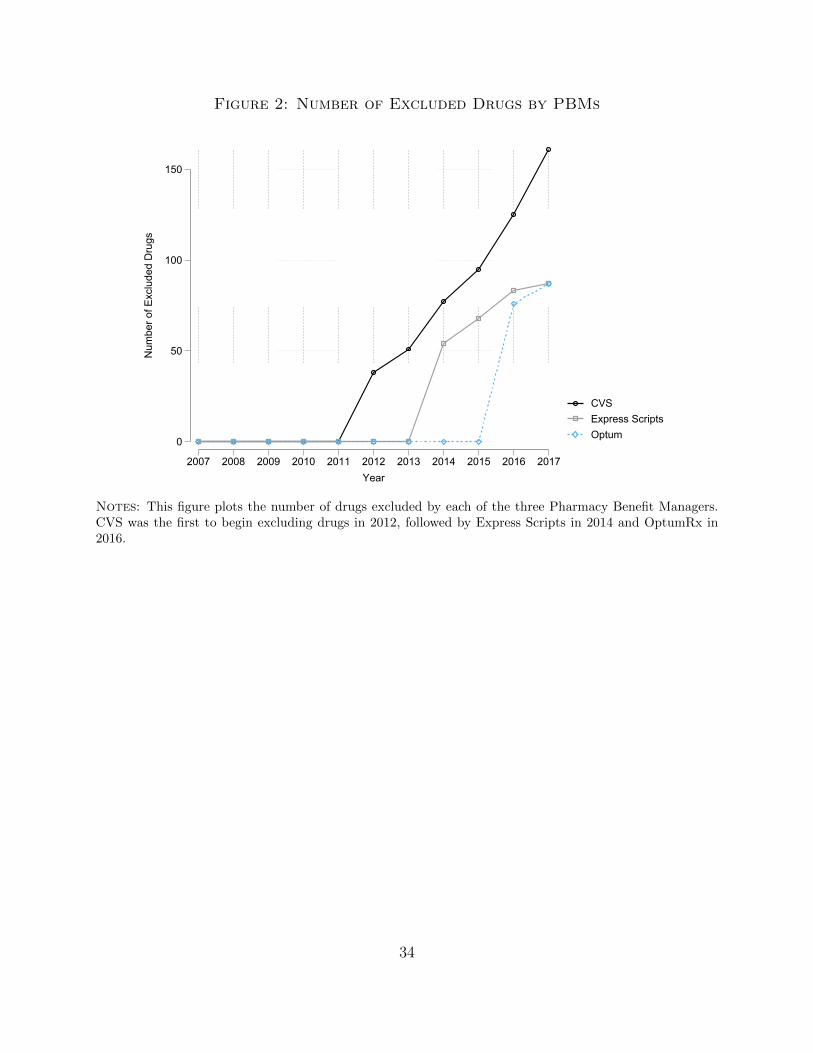
Figure 2 illustrates the rise of drug exclusions over time and across PBMs CVS is the
first major PBM to implement a closed formulary starting with the exclusion of 38 drugs
in 2012 CVS advertises on its payer-facing website ldquo[W]e were the first pharmacy benefit
managerto remove certain high-cost drugs from our Standard Formulary and give
preference to lower-cost clinically appropriate alternatives leading to cost savings for
clientsrdquo13 Over the next six years CVS oversaw a a sustained expansion of exclusions
with more drugs being added to its exclusion lists each year Express Scripts introduced its
exclusion list in 2014 followed by OptumRx in 2016 By 2017 a total of 300 drugs were
ever excluded by at least one of the three major PBMs 75 of these excluded drugs had
13httpspayorsolutionscvshealthcomprograms-and-servicescost-managementformulary-management
11
no molecularly equivalent generic substitute on the market Figure 3 plots exclusions by
disease category at the drug level Each bubble represents a disease category in a year and
the size of the bubble reflects the number of drugs excluded by at least one PBM in that
category From the outset diabetes drugs have consistently been the most frequently
excluded Other diseases with high numbers of exclusions include cardiovascular
endocrine and respiratory diseases
The introduction of exclusion policies represented a major shift in market facing drug
manufacturers with the scope and frequency of exclusions expanding steadily over time For
instance PBMs began to contravene a prior ldquogentlemenrsquos agreementrdquo to keep cancer drugs
off exclusion lists (The Doctor-Patient Rights Project 2017) Starting in 2016 CVS and
Express Scripts excluded fluorouracil creams (which treat skin cancer and pre-cancer skin
conditions) In 2017 CVS expanded its exclusion list to oncology drugs excluding drugs
such as Gleevec and Tasigna (which treat chronic myelogenous leukemia) and Nilandron and
Xtandi (which treat prostate cancer)14
In the remainder of this section we analyze the effect of exclusions on drug sales and
describe how exclusion risk differs across markets as defined by drug therapeutic classes
42 The impact of exclusions on drug sales
A PBMrsquos formulary choice has a substantial impact on patientsrsquo drug utilization A
large body of work has documented that patient demand for drugs is elastic to the
out-of-pocket price suggesting that eliminating insurance coverage for excluded drugs will
suppress demand15 Recent evidence from plans that switch to the restrictive CVS
formulary find evidence of therapy discontinuation for patients on excluded drugs
(Shirneshan et al 2016) While CVS was the first PBM to implement a closed formulary
in 2012 an older literature examined individual insurance planrsquos formulary choices These
earlier formulary coverage decisions affect many fewer patients than the national PBM
14Coverage of cancer drugs was mandated for privately administered Medicare Part D plans but was notmandated for private plans in general When CVS began excluding cancer drugs in 2017 the PBM stipulatedthat this restriction would only affect new patients (The Doctor-Patient Rights Project 2017)
15For example the following papers find evidence of negative price elasticities for drugs as a function ofinsurance cost-sharing Abaluck et al (2018) Einav et al (2017) Choudhry et al (2011) Thiebaud et al(2008) Tamblyn et al (2001)
12
formularies we study here but are likely to have similar effects on the drug choices of
enrolled patients This research has found that closed formularies induce patients to switch
away from excluded drugs (Motheral and Henderson 1999 Huskamp et al 2003) and
reduced healthcare spending (Chambers et al 2016) Further doctors who treat many
patients insured with restrictive formularies are less likely to prescribe excluded drugs even
to patients with open formulary insurance plans (Wang and Pauly 2005)
To test whether these patterns hold in our setting we investigate the link between PBM
formulary exclusions and drug sales using data on prescription drug claims from Medicare
Part D from 2012-2017 We estimate the impact of exclusions on claims for drugs that were
already on the market and had Part D claims using a model that includes drug fixed effects
and controls for year and time-varying market characteristics Because Medicare Part D
regulation over this period disallowed formulary exclusions from six protected drug classes
this analysis studies the 161 excluded drugs that are not in a protected class16
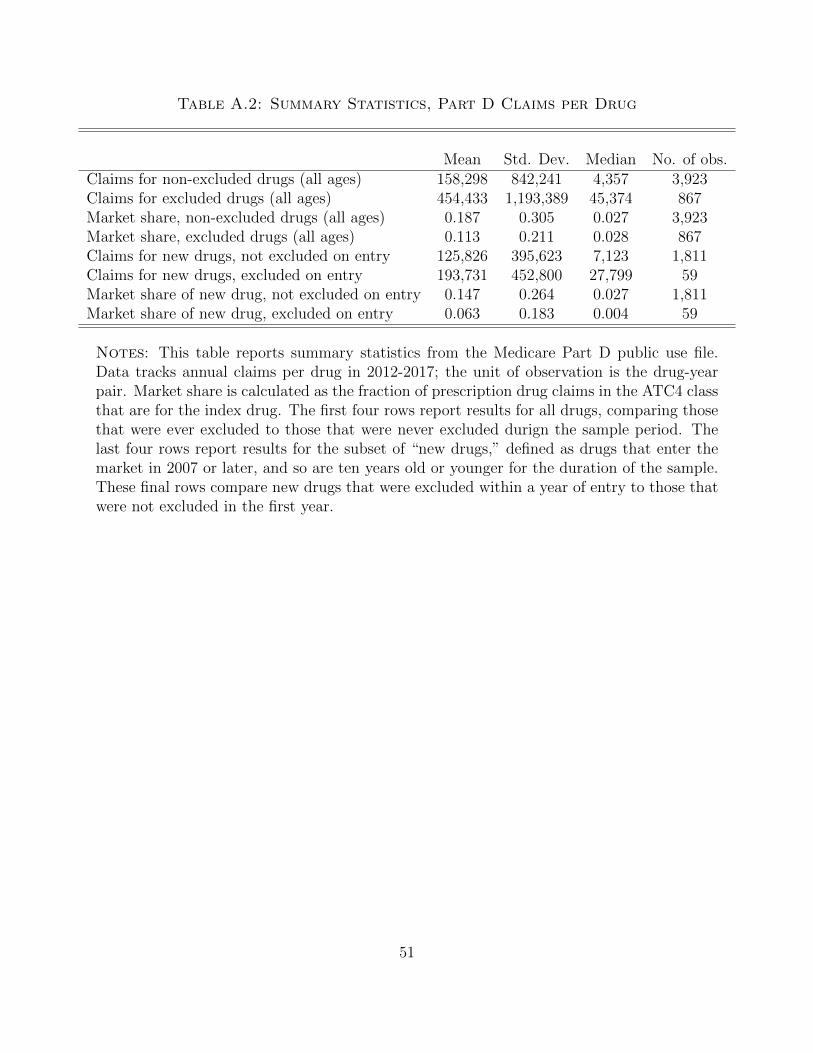
The distribution of Part D claims per drug is highly right-skewed Appendix Table A2
reports that the mean number of annual Part D claims per drug is 158298 for non-excluded
drugs while the median is 4357 Drugs that eventually receive an exclusion have an even
higher mean (454433) consistent with the evidence from our FDB analysis that exclusions
typically target high-volume drugs Due to the high variance of prescription volume our
primary outcome in the regression analysis is the natural log of the drugrsquos claim count
Regression results reported in Table 2 find that each additional excluding PBM
decreases a drugrsquos prescription volume by 24 (eminus0274 minus 1) This coefficient is identified
from within-drug changes in formulary exclusion status since the estimating equation
includes drug-specific fixed effects to control for the drugrsquos baseline popularity and as well
as drug age times calendar year fixed effects to capture lifecycle patterns Additional controls
for time-varying demand for the drug class captured with ATC4 X calendar year fixed
effects do not attenuate the estimate these results are reported in Column 2 As an
alternative outcome we consider the impact of exclusions on the excluded drugrsquos market
share (ie share of total Medicare Part D claims) within the ATC4 class We find very
16The protected classes are antidepressants antipsychotics anticonvulsants antineoplastic agentsantiretroviral agents and immunosupressants Of the 181 excluded drugs prescribed in Part D only 20fall into these classes
13
similar results each additional excluding PBM reduces a drugrsquos market share by 20
percent
This analysis of exclusion impact will tend to overstate the magnitude of these effects on
excluded drugs if patients substitute from excluded drugs to non-excluded drugs within the
same ATC4 category These spillovers will inflate prescription volume in the ldquocontrol grouprdquo
of non-excluded drugs increasing the difference between excluded and non-excluded drugs
We take these results as informative of the direction of exclusion impact but measuring
the full set of cross-drug substitution elasticities (which are likely to be very heterogeneous
across drug classes) is beyond the scope of this project Another limitation of this analysis
is that it cannot measure prescription drug sales that are not claimed in Medicare Part
D if formulary exclusions leads patients to pay fully out-of-pocket for the drugs without
requesting insurance coverage we will not have a record of it in our data
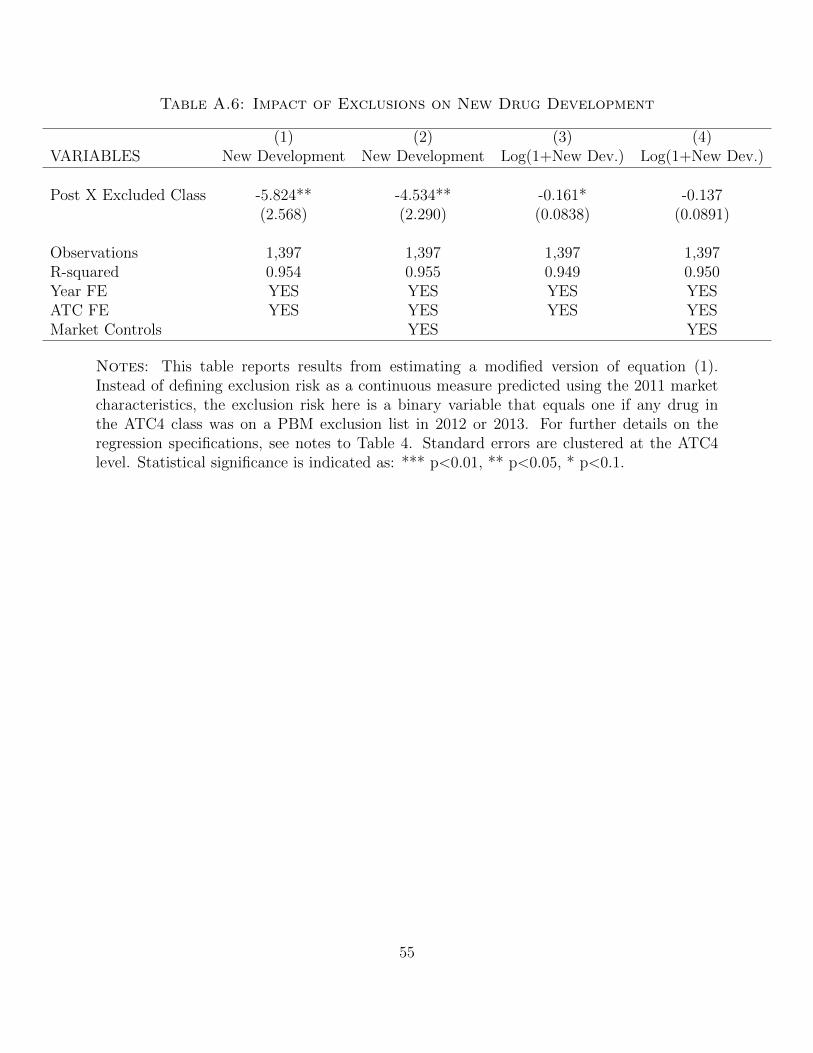
In Appendix Table A3 we investigate whether the immediate exclusion of newly released
drugs depresses drug diffusion relative to the diffusion of other drugs in the same ATC4 class
These estimates suggest that formulary exclusion depresses prescription volume of new drugs
by 68 (eminus1147 minus 1) although the estimates are noisier because they focus on a small set of
13 drugs that face immediate exclusion by at least one PBM within 1 year of FDA approval
43 Predictors of formulary exclusion risk
Twelve percent of ATC4 drug classes experienced exclusions in 2012 and 2013 the first
two years of the closed formulary policy Having provided evidence that exclusions harm
revenues we next examine the factors that predict exclusion risk Prior descriptions of
PBMsrsquo exclusion strategy have for example argued that exclusions target drugs that have
escalated price increases limited clinical evidence or target an overly broad patient
population (Cournoyer and Blandford 2016)
To examine which characteristics predict exclusions at the drug-market level we regress
an indicator for whether a drug class experiences exclusions in 2012 or 2013 on various ATC4
level market characteristics Using data from FDB described in Section 3 we construct the
following measures of potential predictors of exclusion risk for 127 ACT4 classes measures
of the availability of therapeutic alternatives such as the number of existing branded drugs
approved within an ATC4 the number of existing generics within the same class or the
14
number of finer-grained ATC7 subclasses (which indicate specific chemical substances) We
also measure the expected size of the patient population by using information on total
prescription volume across all drugs in a given ATC4 class this information is calculated
from the 2011 Medicare Expenditure Panel Survey Finally we collect data on the price of
already approved branded and generic drugs keeping in mind that price data do not reflect
the rebates that manufactures often pay to PBMs All of these market characteristics are
from 2011 before the introduction of first exclusions in 2012
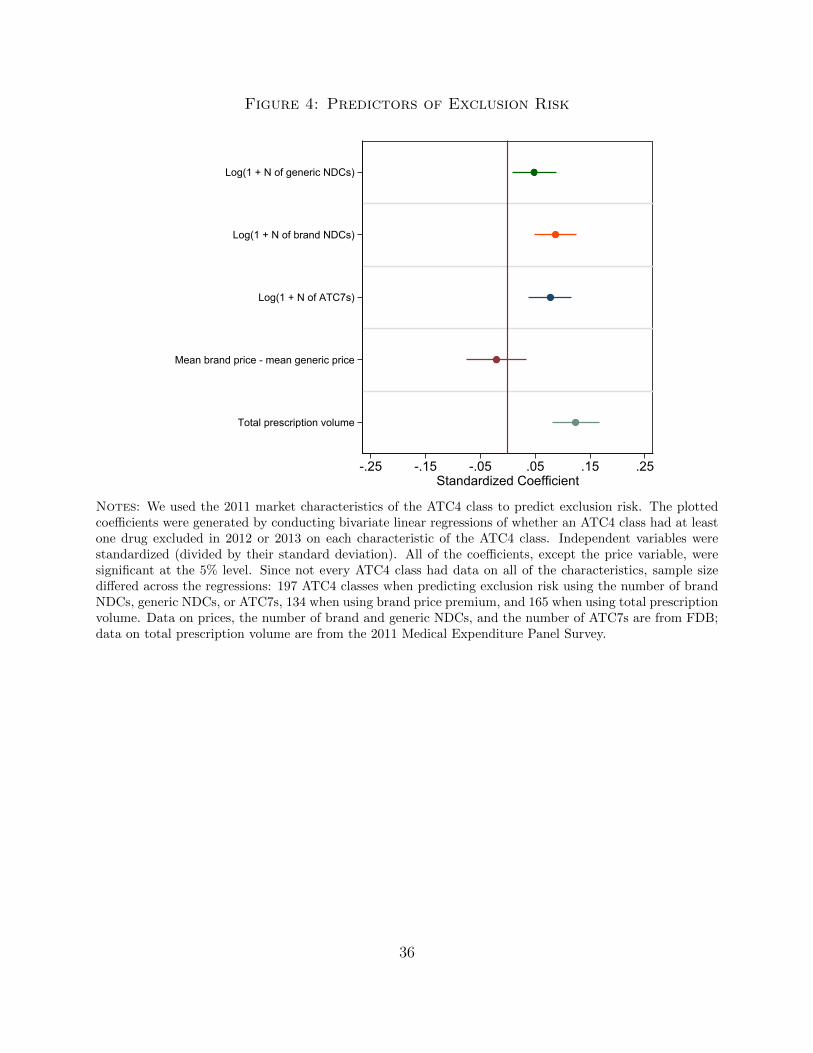
Figure 4 plots the coefficients of bivariate linear regressions of exclusion on each drug
class characteristic these regressions estimate how standardized market characteristics
predict the probability of having at least one exclusion in the ATC4 class in 2012 or 2013
We find that drug classes with higher prescription volume and more existing treatment
options (measured as the number of distinct drugs on the market) are more likely to
experience exclusions These patterns are consistent with the contemporaneous analysis of
industry experts Mason Tenaglia vice president of IMS Health described formulary
exclusions as targeting ldquome-too drugsrdquo with multiple therapeutic substitutes (Reinke
2015) In an interview the chief medical officer of Express Scripts echoed this strategy of
targeting me-too drugs and further described a focus on excluding drugs with a larger
number of prescribed patients ldquo[T]herersquos no reason to go after trivial drugs that arenrsquot
going to drive savingsrdquo (Miller and Wehrwein 2015) We find no statistically significant
relationship between drug prices in the class and exclusion risk but because our data does
not measure prices net of rebates these correlations are difficult to interpret
Having shown that these market characteristics have predictive power we use them to
construct an index of an ATC4 drug classrsquos likelihood of facing exclusions To do so we fit a
logistic regression to predict whether a drug class experience exclusions in 2012 or 2013 as a
function of all of the ATC4 market characteristics (measured as of 2011) For this regression
the unit of observation is a single ATC4 drug class c We then use the regressionrsquos fitted
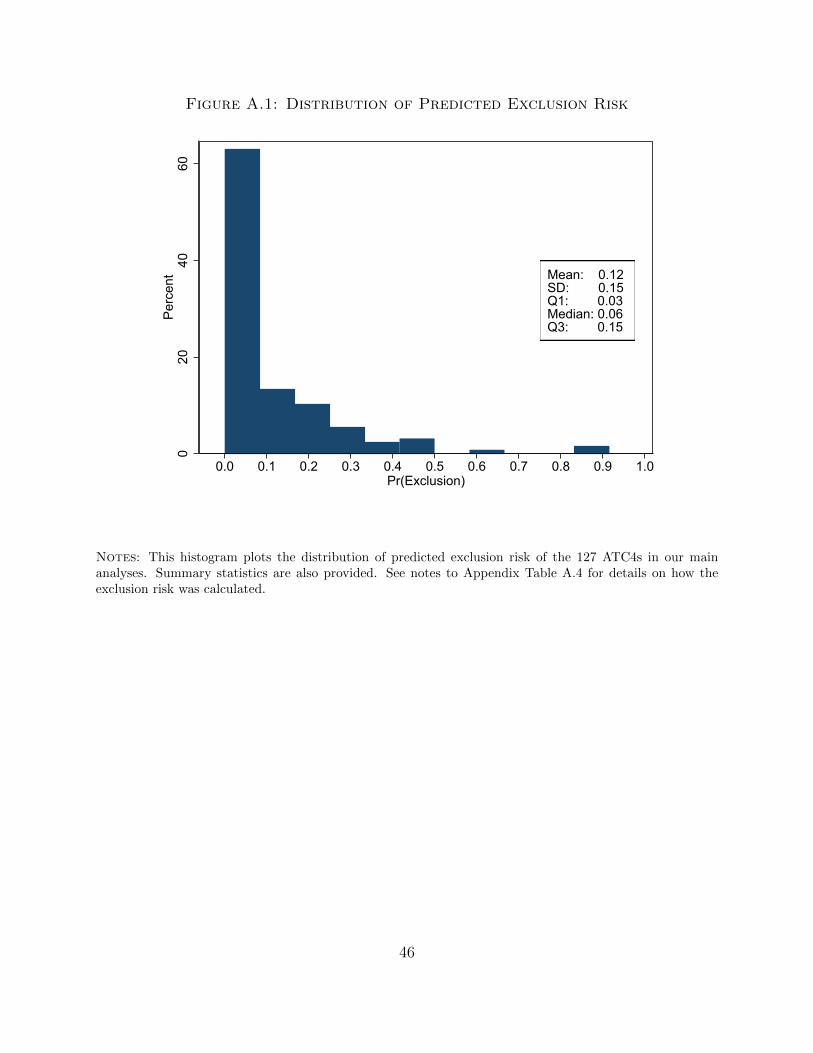
values to construct the predicted exclusion risk of each ATC4 Pr(Excluded)c Appendix
Table A4 shows the results of this exercise and Appendix Figure A1 plots the resulting
distribution of predicted exclusions
The goal of our analysis is to understand how exclusion risk affects upstream RampD
decisions Our theory predicts that changes to upstream investments are shaped by the
15
expected net present value (NPV) of projects in a drug class exclusions can decrease NPV
either because firms anticipate that the new drug may be excluded or because firms
anticipate that they will have to pay high rebates in order to avoid exclusions Our primary
analysis defines treatment exposure as predicted exclusion risk in order to consider the
impact of exclusions not only on drug classes with realized exclusions but also on classes
with similar market characteristics where high rebates may be paid to avoid exclusions
We test whether our measure of exclusion risk has empirical validity by asking whether
predicted exclusion risk fit from 2012 and 2013 exclusion lists correlates with subsequent
exclusions in 2014-2017 Table 3 shows that our measure of exclusion risk has out-of-sample
prediction power In Column 1 we show that a 1 standard deviation increase in exclusion risk
(estimated based on 2012 and 2013 exclusions) correlates with a 17 percent point increase in
the likelihood that an ATC4 class experiences exclusions in later periods In Column 2 we
repeat this exercise restricting to the subset of ATC4s that do not experience any exclusions
during the first wave of exclusions in 2012 and 2013 This set includes drug classes that are
actually at a very low risk of experiencing exclusions (in which case we would not expect them
to see future exclusions) as well as those that were at high risk but which were able to avoid
early exclusions perhaps by offering higher rebates Among this set of drug classes with no
early exclusions our measure of predicted exclusion risk is still significantly correlated with
future exclusions This result suggests that exclusions followed a consistent and predictable
pattern over our study period and that market characteristics can form valid out-of-sample
predictions of at-risk drug classes
5 The Impact of Exclusion Risk on Subsequent Drug
Development
In our model we predict that exclusion risk decreases the NPV of projects in more
affected drug classes and therefore dampens upstream investments in these areas This
logic is echoed by pharmaceutical executives AstroZeneca leaders for example describe
meeting ldquopayer criteria required for global reimbursementrdquo as a crucial input into their
decisions about RampD investment (Morgan et al 2018) In this section we use our measure
16
of drug-class exclusion risk to study how upstream firmsrsquo investment strategies respond to
exclusion risk
51 Empirical strategy
Our main specification compares drug development behavior across ATC4 drug classes
that vary in their ex-ante risk of exclusion before and after the rise of closed formulary
policies
Developmentct = β1Pr(Excluded)c times I(Year ge 2012) + Xγ + δc + δt + ect (1)
In Equation (1) Developmentct refers to various measures of the number of new drug
candidates in drug class c at time t (measured annually) We define a drug classrsquos extent of
treatment using Pr(Excluded)c described above in Section 43 In Section 53 we show
that our results are robust to an alternative definition of treatment that uses data on
realized exclusions rather than exclusion risk
To interpret our primary coefficient of interest β1 as the causal impact of drug exclusions
on development activity we must assume that development activity in ATC4s with different
predicted degrees of exclusion risk would have followed parallel trends in the absence of
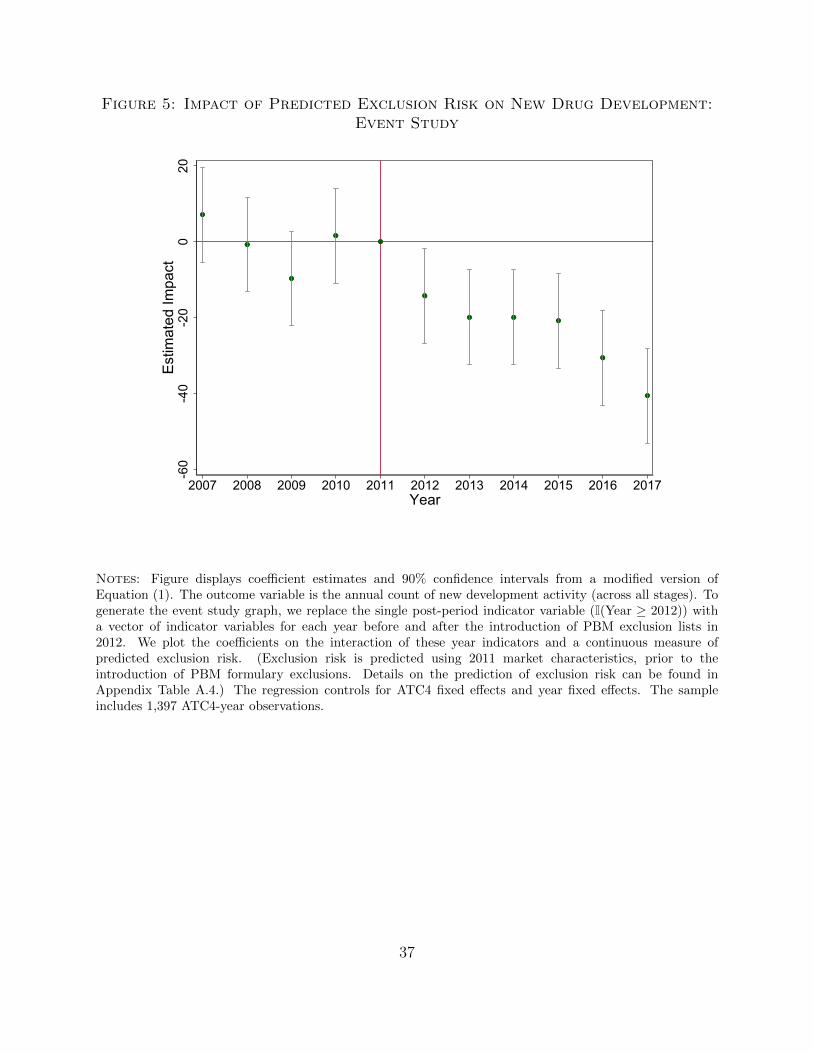
formulary exclusions We use event study graphs over a 5 year pre-period to assess the
plausibility of this assumption These graphs are based on a modified version of Equation
(1) which replaces the single indicator variable for being in the post period (I(Year ge 2012))
with a vector of indicator variables for each year before and after the introduction of PBM
exclusion lists in 2012
52 Main results
We begin by studying how trends in drug development activity vary across ATC4
classes as a function of formulary exclusion risk Figure 5 shows the
difference-in-differences results in an event study framework There appears to be little
difference in drug development across excluded and non-excluded ATC4s prior to 2011
suggesting that the parallel trends assumption is supported in the pre-period Development
17
activity across excluded and non-excluded drug classes begins to diverge in 2012 and these
differences grow until 2017 the last full year of our sample
Table 4 presents our main regression results The outcome is the total number of drug
candidates within a class that entered any stage of development each year In Column 1
we estimate that a one standard deviation increase in the risk that the class has formulary
exclusions leads to 36 fewer advanced drug candidates each year from a mean of 306
advancing candidates17 In Column 2 we include controls for a variety of time-varying
market conditions at the ATC4 class level the number of approved drugs in that class
the number of approved generic drugs the mean price of branded drugs minus the mean
price of generic drugs and the number of ATC7 subclasses (which indicate specific chemical
substances) with approved drugs Adding these controls lowers our estimate slightly from
36 to 33 fewer drug candidates per 1 standard deviation increase in class exclusion risk We
find similar results after log-transforming the outcome suggesting that development activity
declines by 5-6 in excluded classes for every 1 standard deviation increase in class exclusion
risk as reported in columns 3 and 4
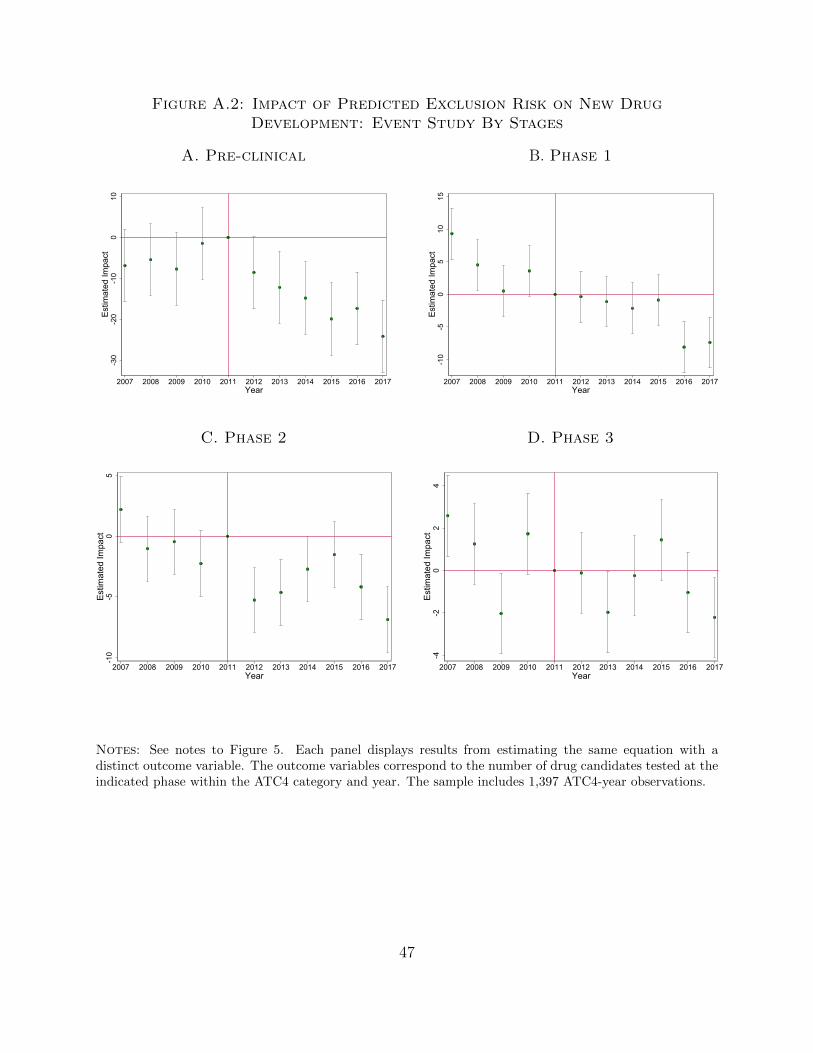
Table 5 decomposes the total effect by drug development stage In Table 5 we find the
largest percent declines for earlier stage drugs Exponentiating the reported coefficients we
estimate a 7 decline in new pre-clinical candidates for every 1 standard deviation increase
in the probability that the class has exclusions as compared to a decline in advancing
candidates of 5 in Phase 1 5 in Phase 2 and 4 in Phase 3 We find consistent results
when measuring the outcome in levels (rather than logs) and report these results in Appendix
Table A5 and Appendix Figure A2 The patterns in the event study difference-in-differences
plots are very similar across development stages
We interpret these findings in the context of the drug development process where Phase
1 trials generally assess safety Phase 2 trials provide preliminary evidence of efficacy and
Phase 3 trials are the large-scale expensive trials that firms rely upon to generate data for
FDA approval Of these investment stages Phase 3 trials are the most costly with average
costs estimated over $250 million per drug in 2013 dollars (DiMasi et al 2016) Given that
the marginal cost of continuing to develop a candidate drug remains high through the end of
17As reported in Appendix Figure A1 the standard deviation of the probability the class faces exclusionsis 015 Using the coefficient reported in Table 4 we calculate minus2403 lowast 015 = minus36
18
phase 3 trial stage it is sensible that firms would be more likely to drop drug candidates even
at this relatively late stage Further a drug is more likely to be excluded from formularies if
it offers few benefits relative to existing treatments Phase 2 trials provide the first evidence
of clinical efficacy If a drug shows only marginal promise then a firm concerned about the
possibility of exclusions may choose to end its development efforts rather than committing
to very expensive Phase 3 trials
In contrast we find no effect for new drug launches at the point when a drug has
completed Phase 3 trials the bulk of RampD expenses are already sunk As a result concerns
about coverage would be less likely to impact a firmrsquos launch decisions Over time we would
expect that launches would also fall in affected drug classes as the pipeline narrows but
given the long time lags in bringing a drug through each development stage this effect would
not be immediate
53 Robustness checks
In this section we show that our results are robust to alternative choices for defining
exclusion risk linking drug candidates to drug classes and calculating standard errors
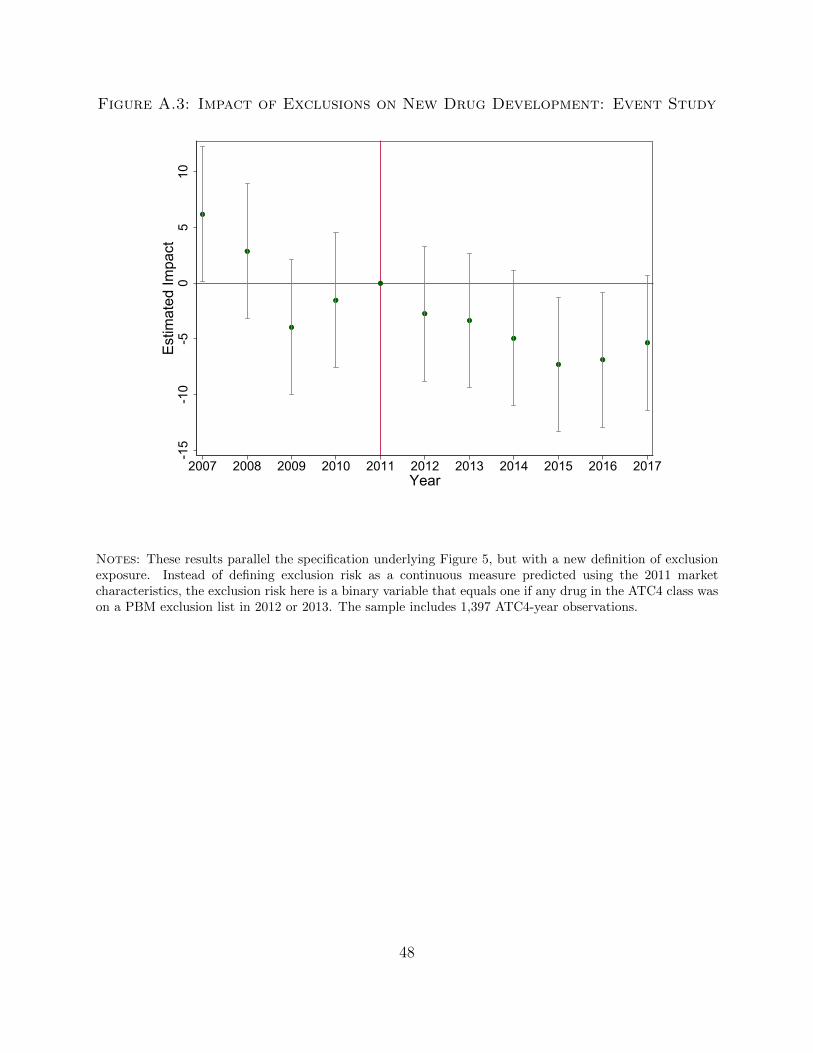
First we show that our results are consistent when we apply an alternative definition of
a drug classrsquos exclusion risk In our primary analysis we use 2011 ATC4 market level
characteristics to predict exclusion risk An alternative approach would be to look at
realized exclusions and ask whether drug classes that actually experienced exclusions saw
reductions in development Appendix Figure A3 and Appendix Table A6 presents results
using a binary definition of treatment (whether or not an ATC4 class actually experienced
an exclusion in 2012 or 2013) and show a similar pattern of results as our main analysis
Second we show that our results are robust to the method we use to match drug
candidates to drug classes In our primary analysis we match drug candidates to ATC4
drug classes using a direct linkage when Cortellis provides it (in 43 of cases) in cases
where direct linking is not possible we rely on indirect linking based on using a drug
candidatersquos area of therapeutic application (ICD9) combined with an ICD9-ATC4
crosswalk Appendix B provides further details on how we linked the drug candidates from
Cortellis to ATC4 classes Appendix Tables A7 and Appendix Figure A4 show that our
19
results are similar when either using only direct linkages (Panel A) or only indirect linkages
(Panel B)
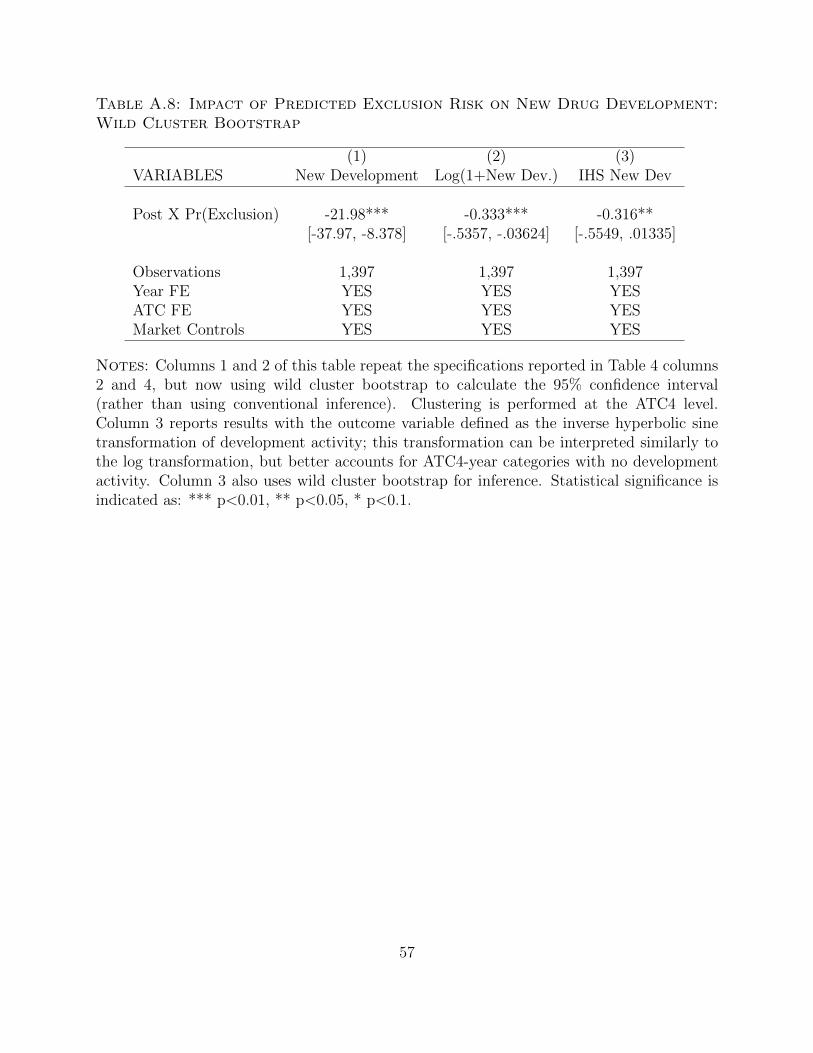
Finally conventional inference can over-reject when the number of treated clusters is
small so we also implement a correction using the wild cluster bootstrap (Cameron et al
2008 Djogbenou et al 2019) In Appendix Table A8 we report 95 confidence intervals
calculated with the wild cluster bootstrap for our main regression results our findings
remain statistically significant In this table we also present robustness to using the
inverse hyperbolic sine function rather than log transformation to better account for ATC4
categories with no development in some years Results are very close to the log
transformed outcomes reported in the main text and remain statistically significant
54 Classifying foregone innovation across drug classes
In this section we describe the drug classes and types of projects that experienced the
greatest declines in RampD as a result of formulary exclusions To assess the decline in drug
development for each ATC4 drug class we compare the number of candidates we predict
would have been developed in the absence of exclusions to the number we predict in the
presence of exclusions This analysis examines how exclusions impact the allocation of
RampD resources across drug classes that vary in their size competitiveness or level of
scientific novelty We focus on allocation across drug classes because our theoretical
framework formalized in Appendix A predicts that exclusions will affect the relative
investments in drug development across classes18
Our analysis is based on the specification reported in Table 4 Column 4 this is our
preferred specification because it controls for a battery of time-varying drug class
observables and generates the most conservative point estimate To measure predicted new
drug candidates in the presence of exclusions we calculate the fitted value prediction of
drug development activity for every year of the post-period To recover the predicted new
drug candidates absent exclusions we repeat this exercise after setting the treatment
variable Pr(Excluded)c times I(Year ge 2012) equal to zero for all observations We use these
18The impact of exclusion policies within a drug class are less obvious while it is possible that exclusionsmay change the characteristics of promoted molecules within a drug class these effects may be smaller andmore difficult to measure Because ATC4 drug classes already represent relatively narrow categories thereis limited scope to change the scientific novelty of investment within the class for example
20
predictions as the basis for calculating the percent decline in development activity
attributable to exclusion risk We then compare the predicted decline in development
activity across several ATC4 drug class characteristics measured before the introduction of
the formulary exclusions
Availability of existing therapies amp market size
For our first counterfactual comparison we divide drug classes into terciles based on the
number of existing therapies as measured by the number of distinct drugs available within
that class as of 2011 Figure 6 Panel A compares predicted drug development activity to the
counterfactual development levels predicted to have occurred absent exclusions Consistent
with our model we see the largest declines in drug classes with more existing therapies
among drug classes in the top tercile of available therapies exclusions depress development
by nearly 8 By contrast exclusions depress development by less than 2 for drug classes
in the bottom tercile of pre-existing therapies This result indicates that formulary exclusions
lead firms to reduce their investments in drugs that are more likely to be incremental entrants
to more crowded therapeutic areas
In Figure 6 Panel B we perform the same analysis splitting drug classes by market size as
measured by the volume of prescriptions filled in 2011 (estimated from the MEPS data) We
find that formulary exclusions disproportionately impact drug development in therapeutic
classes with many patients For drug classes in the top tercile of prescription volume drug
development is predicted to decline by more than 10 after the introduction of formulary
exclusions
Disease category
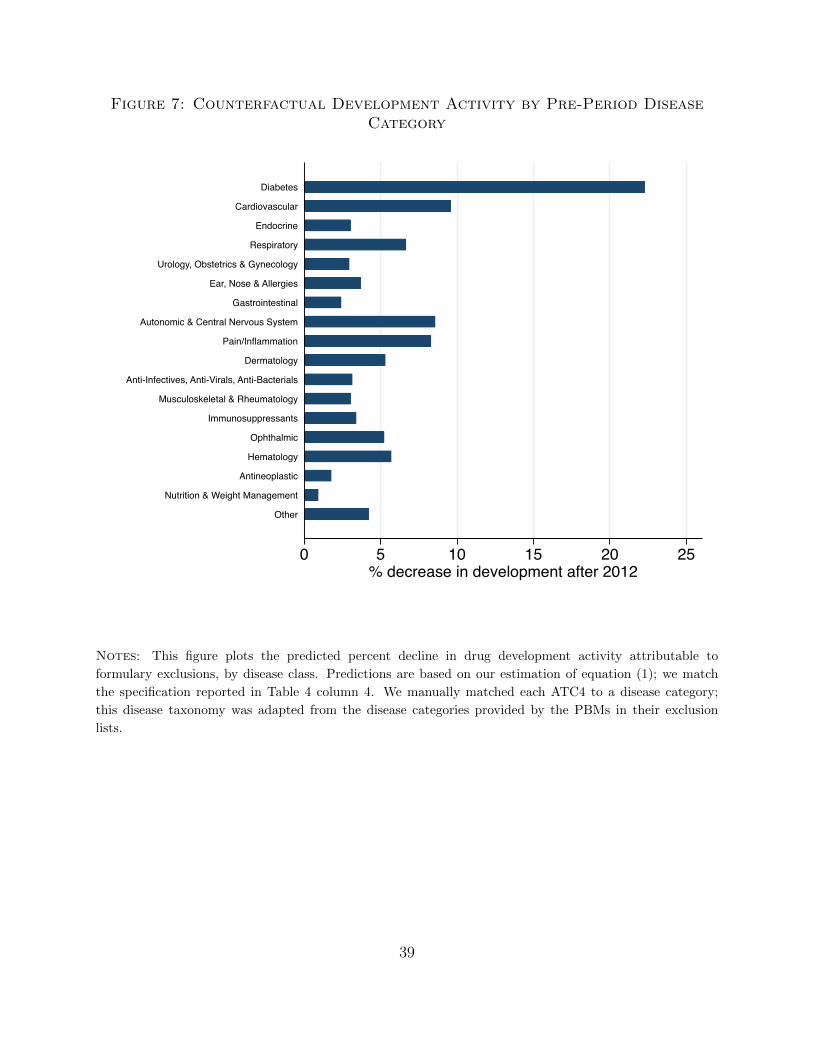
Next Figure 7 explores the extent of foregone innovation across therapeutic areas To
do so we map ATC4 drug classes into disease categories and calculate the percentage
change in drug development from the counterfactual predicted absent exclusions Our
results indicate that closed formulary policies generated substantial declines in
development across a range of disease classes led by diabetes where we predict more than
a 20 decline in the number of new drug candidates The next set of affected disease
categories predicted to lose 8-10 of new drug candidates includes cardiovascular
21
respiratory autonomic amp central nervous system and paininflammation related
conditions Meanwhile we find little evidence of significant declines in development
activity for many acute diseases such as infections viruses and cancers
This set of evidence is consistent with the hypothesis that closed formulary policies reduce
firmsrsquo incentives to develop additional treatments in large markets where new drugs may
face a high likelihood of exclusion This creates a tension while foregone innovations are
likely to be incremental in the sense that the most impacted drug classes already have many
existing treatment options they are also likely to have benefited more patients because the
most impacted drug classes also had the largest base of prescribed patients
Scientific novelty
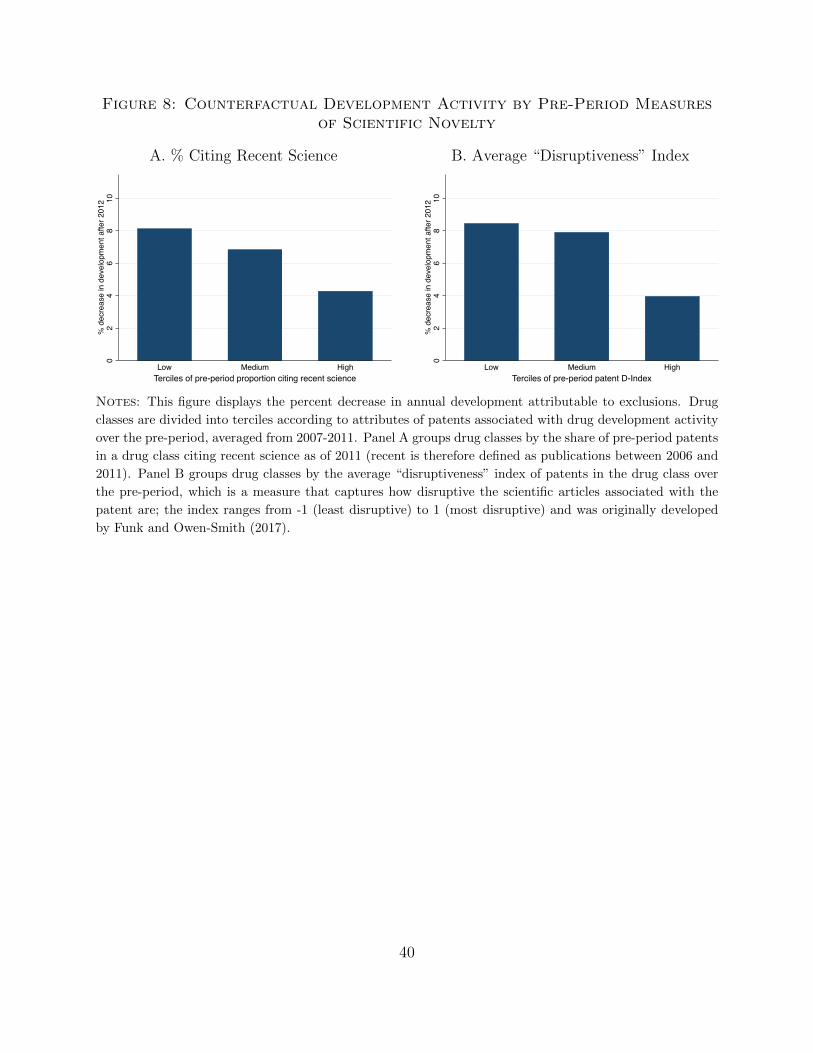
Finally we examine the relative effect that formulary exclusions had on RampD investment
across areas with differing measures of scientific novelty To assess scientific novelty we match
drug candidates within an ATC4 class to the scientific articles cited by their underlying
patents making use of patent-to-science linkages created by Marx and Fuegi (2020) We
then create two measures of the scientific novelty of research in a drug class (averaged
over 2007-2011) First we calculate how often patents in a drug class cited recent science
defined as articles under 5 years old as of 2011 In Panel A of Figure 8 we find that
exclusions generate twice as large a decline in RampD in drug classes that were rarely citing
recent science in the policy pre-period compared to those that were (8 vs 4 predicted
declines respectively)
Second we measure how ldquodisruptiverdquo research in a drug class is likely to be To do
this for each of the scientific article cited by the underlying patents of the drugs we follow
Funk and Owen-Smith (2017) and measure how many of a focal articlersquos forward citations
also cite the focal articlersquos backward citations This ldquodisruptivenessrdquo index ranging from -1
(consolidating) to 1 (destabilizing) captures the idea that a research article that represents
a paradigm shift will generate forward citations that will not cite the breakthrough articlersquos
backward citations In contrast a review article that consolidates a knowledge domain will
receive forward citations that will also cite the same citations as the review article In
Figure 8 Panel B we report predicted changes in drug development as a function of how
22
disruptive the patents underlying the drugs were in this class over the pre-period (proxied by
the average disruptiveness index of the cited science) Formulary exclusions spurred larger
reductions in development in drug classes citing the least disruptive research
Together these results suggest that exclusions encouraged a relative shift in RampD dollars
toward investment in drug classes engaging with more recent novel science
6 Discussion
So far we have shown that closed formulary policies lead pharmaceutical firms to invest
less in RampD for areas more likely to face exclusions This response results in a shift in
development across drug classes away from large markets (in terms of available therapies and
prescription volume) and common disease classes treating chronic conditions such as heart
diseases and diabetes Moreover our evidence also indicates that RampD effort shifts away
from drug classes with older and less disruptive underlying science Overall these results
suggest that exclusions direct upstream research away from more incremental treatments
As discussed in Section 2 the welfare implications of this behavior are theoretically
ambiguous There are two key considerations First exclusions reduced development of
drugs for crowded markets what is the value of this sort of forgone incremental innovation
Second when investment declines in high-exclusion risk classes relative to other classes does
this contribute to an aggregate decline in pharmaceutical RampD or is some of the investment
redirected to innovation in other drug classes within the sector
Regarding the first question assessing the value of late entrants to a drug class is difficult
because even incremental drugs can reduce side effects improve compliance by being easier to
take or generate price competition and improve access (Regnier 2013 Hult 2014) Further
even if the new drugs never make it to market incremental drug candidates may generate
scientific spillovers leading to further innovation over a longer time horizon
Second our empirical approach cannot test for aggregate changes in development activity
which would be identified solely by time-series trends By estimating equation (1) we isolate
the relative change in development activity in drug categories with exclusions compared to
the changes in non-excluded categories These differences could come from a combination of
23
absolute declines in RampD for excluded classes or it could come from a shift in development
from classes with high- to low-exclusion risk
Absent financial frictions we would expect that the introduction of closed formularies
would decrease the expected value of investments in drug classes at high risk of facing
exclusions but should have little to no impact on the net present value for drugs in classes
at low risk of facing exclusions In such a world we would interpret our results as leading
to an absolute decline in drug RampD However a large finance literature has shown both
theoretically and empirically that even publicly traded firms often behave as though they
face financial frictions (Myers and Majluf 1984 Froot et al 1993 Brown et al 2009) This
is especially true in pharmaceuticals and other RampD intensive sectors where intellectual
property is more difficult to collateralize or value (Fernandez et al 2012 Kerr and Nanda
2015 Krieger et al 2019) For example it is common for firms to set their RampD budgets
by allocating a percentage of revenues from the previous year
In the event that exclusion policies generate some degree of reallocation away from
older drug areas toward newer ones a welfare analysis would need to take into account the
relative value of research in these areas In our case this would require weighing the value
of additional incremental innovations aimed at larger markets against the value of
earlier-in-class innovations for less common conditions19
7 Conclusion
Amid rising public pressure government and private payers are looking for ways to
contain drug prices while maintaining incentives for innovation In this paper we study how
the design of downstream insurance policiesmdashnamely those related to drug coveragemdashimpact
upstream investments in pharmaceutical RampD
We find that drug classes facing a one standard deviation greater risk of experiencing
exclusions see a 5 decline in drug development activity following the introduction of
closed formulary policies These declines in development activity occur at each stage of the
19Moreover if exclusion policies have positive spillovers on development in non-excluded categories (egdue to within-firm investment reallocation) our estimates will tend to overstate the magnitude of the totaldecline in RampD investment in excluded categories By contrast if exclusion policies have negative spilloverson non-excluded categories (eg due to a fall in revenue reducing available development dollar) our estimateswill tend to understate the magnitude of the investment decline in excluded categories
24
development process from pre-clinical through Phase 3 trials In aggregate our results
suggest that PBMs wielded the threat of formulary exclusion in a way that shifted the
relative allocation of RampD effort away from incremental treatments for common conditions
such as heart diseases and diabetes as well as away from drug classes with many existing
therapies on the market and older less novel underlying science
Taken together our results provide strong evidence that insurance design influences
pharmaceutical RampD Leaving aside the specifics of which drug classes faced greater
exclusion risk in our setting an overarching point that our paper makes is that
pharmaceutical firms anticipate downstream payment policies and shift their upstream
RampD efforts accordingly Viewed from a public policy perspective this finding opens the
door for insurance design to be included as a part of the broader toolkit that policymakers
use to encourage and direct investments in innovation In particular public policy related
to innovation has almost exclusively focused on ways that the public sector can directly
influence the returns to RampD such as through patents tax credits research funding or
other direct subsidies Our results suggest that in addition managers and policymakers
can use targeted coverage limitationsmdashfor example those generated by value-based
pricingmdashto shift RampD efforts away from drugs with limited incremental clinical value
The limitations of our analysis suggest several important directions for future work First
our identification strategy allows us to document a relative decline in RampD in high exclusion
risk categories more research is needed in order to assess the extent to which policies that
limit the profitability of a specific class of drugs generate aggregate declines in RampD or
induce reallocations toward other areas Second it remains a challenge to place an accurate
value on the innovation that is forgone as a result of the exclusion practices we study While
we focus on the availability of existing treatments prescription volume and measures of
scientific novelty these are not complete descriptions of the clinical and scientific importance
of potentially foregone drugs Third because we cannot directly observe drug price rebates
we cannot directly quantify the reductions in revenue precipitated by formulary exclusion
policies Finally as formulary exclusion policies continue to expandmdashtoward smaller drug
markets and those in which there are fewer therapeutic substitutesmdashadditional research will
be needed to see if our findings extrapolate to those settings
25
References
Abaluck J J Gruber and A Swanson (2018) Prescription drug use under medicare
part d A linear model of nonlinear budget sets Journal of Public Economics 164
106ndash138
Acemoglu D P Aghion L Bursztyn and D Hemous (2012) The environment and
directed technical change American Economic Review 102 (1) 131ndash66
Acemoglu D D Cutler A Finkelstein and J Linn (2006) Did medicare induce
pharmaceutical innovation American Economic Review 96 (2) 103ndash107
Acemoglu D and J Linn (2004) Market size in innovation theory and evidence from
the pharmaceutical industry The Quarterly Journal of Economics 119 (3) 1049ndash1090
Aghion P A Dechezlepretre D Hemous R Martin and J Van Reenen (2016) Carbon
taxes path dependency and directed technical change Evidence from the auto
industry Journal of Political Economy 124 (1) 1ndash51
Bagley N A Chandra and A Frakt (2015) Correcting Signals for Innovation in Health
Care Brookings Institution
Blume-Kohout M E and N Sood (2013) Market size and innovation Effects of Medicare
Part D on pharmaceutical research and development Journal of Public Economics 97
327ndash336
Brennan T (2017 August) 2018 Formulary strategy Technical report CVS Health
Payor Solutions Online at httpspayorsolutionscvshealthcominsights
2018-formulary-strategy
Brown J R S M Fazzari and B C Petersen (2009) Financing innovation and growth
Cash flow external equity and the 1990s rampd boom The Journal of Finance 64 (1)
151ndash185
Budish E B N Roin and H Williams (2015) Do firms underinvest in long-term
research Evidence from cancer clinical trials American Economic Review 105 (7)
2044ndash85
26
Cameron A C J B Gelbach and D L Miller (2008) Bootstrap-based improvements
for inference with clustered errors The Review of Economics and Statistics 90 (3)
414ndash427
Celgene (2016 September) Prescription plan exclusion lists grow
at patientsrsquo expense Online at httpswwwcelgenecom
patient-prescription-plan-exclusion-lists-grow
Chambers J D P B Rane and P J Neumann (2016) The impact of formulary drug
exclusion policies on patients and healthcare costs Am J Manag Care 22 (8) 524ndash531
Choudhry N K J Avorn R J Glynn E M Antman S Schneeweiss M Toscano
L Reisman J Fernandes C Spettell J L Lee et al (2011) Full coverage
for preventive medications after myocardial infarction New England Journal of
Medicine 365 (22) 2088ndash2097
Claxton G M Rae M Long A Damico G Foster and H Whitmore (2017) Employer
health benefits survey Kaiser Family Foundation and Health Research amp Educational
Trust
Clemens J (2013 December) The effect of US health insurance expansions on medical
innovation Working Paper 19761 National Bureau of Economic Research
Clemens J and P Rogers (2020 January) Demand shocks procurement policies and
the nature of medical innovation Evidence from wartime prosthetic device patents
Working Paper 26679 National Bureau of Economic Research
Congressional Budget Office (2007 April) Medicare prescription drug price negotiation
act of 2007 Technical report Congressional Budget Office Cost Estimate Online
at httpswwwcbogovsitesdefaultfiles110th-congress-2007-2008
costestimates30pdf
Cournoyer A and L Blandford (2016 October) Formulary exclusion
lists create challenges for pharma and payers alike Journal of Clinical
Pathways httpswwwjournalofclinicalpathwayscomarticle
formulary-exclusion-lists-create-challenges-pharma-and-payers-alike
27
DiMasi J A H G Grabowski and R W Hansen (2016) Innovation in
the pharmaceutical industry new estimates of RampD costs Journal of Health
Economics 47 20ndash33
Dixit A (1979) A model of duopoly suggesting a theory of entry barriers The Bell
Journal of Economics 20ndash32
Djogbenou A A J G MacKinnon and M Oslash Nielsen (2019) Asymptotic theory
and wild bootstrap inference with clustered errors Journal of Econometrics 212 (2)
393ndash412
Dranove D C Garthwaite and M I Hermosilla (2020 May) Expected profits and the
scientific novelty of innovation Working Paper 27093 National Bureau of Economic
Research
Dubois P O De Mouzon F Scott-Morton and P Seabright (2015) Market size and
pharmaceutical innovation The RAND Journal of Economics 46 (4) 844ndash871
Einav L A Finkelstein and P Schrimpf (2017) Bunching at the kink implications for
spending responses to health insurance contracts Journal of Public Economics 146
27ndash40
Fein A J (2017 December) The CVS-Aetna deal Five industry and drug
channel implications Technical report Drug Channels Online at httpswww
drugchannelsnet201712the-cvs-aetna-deal-five-industry-andhtml
Fernandez J-M R M Stein and A W Lo (2012 10) Commercializing biomedical
research through securitization techniques Nature Biotechnology 30 (10) 964ndash975
Filzmoser P A Eisl and F Endel (2009) Atc-icd Determination of the reliability for
predicting the icd code from the atc code
Finkelstein A (2004) Static and dynamic effects of health policy Evidence from the
vaccine industry The Quarterly Journal of Economics 119 (2) 527ndash564
Frank R G and R J Zeckhauser (2018 January) High-priced drugs in medicare part
d Diagnosis and potential prescription Working Paper 24240 National Bureau of
Economic Research
28
Froot K A D S Scharfstein and J C Stein (1993 December) Risk Management
Coordinating Corporate Investment and Financing Policies Journal of Finance 48 (5)
1629ndash58
Funk R J and J Owen-Smith (2017) A dynamic network measure of technological
change Management Science 63 (3) 791ndash817
Garber A M C I Jones and P Romer (2006) Insurance and incentives for medical
innovation In Forum for Health Economics amp Policy Volume 9 De Gruyter
Garthwaite C and F S Morton (2017) Perverse market incentives encourage
high prescription drug prices ProMarket Blog Post httpspromarketorg
perversemarket-incentives-encourage-high-prescription-drug-prices
Government Accountability Office (2019 July) Medicare Part D Use of Pharmacy Benefit
Managers and Efforts to Manage Drug Expenditures and Utilization GAO-19-498
httpswwwgaogovassets710700259pdf
Health Strategies Group (2015) 2015 Pharmacy benefit managers research agenda
Technical report httpswwwhealthstrategiescomsitesdefaultfiles
agendas2015_PBM_Research_Agenda_RA_110714pdf
Hoadley J L Summer E Hargrave J Cubanski and T Neuman (2011) Analysis of
medicare prescription drug plans in 2011 and key trends since 2006 Kaiser Family
Foundation Issue Brief The Henry J Kaiser Family Foundation
Hult K J (2014) Incremental innovation and pharmacuetical productivity Technical
report Health Strategies Group
Huskamp H A A M Epstein and D Blumenthal (2003) The impact of a national
prescription drug formulary on prices market share and spending Lessons for
Medicare Health Affairs 22 (3) 149ndash158
Kakani P M Chernew and A Chandra (2020) Rebates in the pharmaceutical industry
Evidence from medicines sold in retail pharmacies in the us Technical report National
Bureau of Economic Research
Kerr W R and R Nanda (2015) Financing innovation Annual Review of Financial
Economics 7 (1) 445ndash462
29
Krieger J D Li and D Papanikolaou (2017) Developing novel drugs Available at SSRN
3095246
Krieger J D Li and D Papanikolaou (2019) Missing novelty in drug development
Technical report National Bureau of Economic Research
Kyle M K and A M McGahan (2012) Investments in pharmaceuticals before and after
TRIPS Review of Economics and Statistics 94 (4) 1157ndash1172
Lakdawalla D and N Sood (2009) Innovation and the welfare effects of public drug
insurance Journal of public economics 93 (3-4) 541ndash548
Lopez L (2018 march) What CVS is doing to mom-and-pop pharmacies in the US
will make your blood boil Business Insider httpswwwbusinessinsidercom
cvs-squeezing-us-mom-and-pop-pharmacies-out-of-business-2018-3
Lopez L (2019 June) States are starting to stand up to rsquothe new big tobaccorsquo
because Washington wonrsquot Business Insider httpswwwbusinessinsidercom
states-tackling-drug-prices-with-pbm-legislation-2017-6
Mankiw N G and M D Whinston (1986) Free entry and social inefficiency The RAND
Journal of Economics 48ndash58
Marx M and A Fuegi (2020 April) Reliance on science Worldwide front-page patent
citations to scientific articles Strategic Management Journal
Miller S and P Wehrwein (2015) A conversation with Steve Miller MD Come in and
talk with us pharma Managed care 24 (4) 27ndash8
Morgan P D G Brown S Lennard M J Anderton J C Barrett U Eriksson
M Fidock B Hamren A Johnson R E March et al (2018) Impact of a
five-dimensional framework on RampD productivity at AstraZeneca Nature Reviews
Drug Discovery 17 (3) 167
Motheral B R and R Henderson (1999) The effect of a closed formulary on prescription
drug use and costs Inquiry 481ndash491
Myers S C and N S Majluf (1984) Corporate financing and investment decisions
when firms have information that investors do not have Journal of Financial
Economics 13 (2) 187ndash221
30
Regnier S (2013) What is the value of ldquome-toordquo drugs Health Care Management
Science 16 (4) 300ndash313
Reinke T (2015) Pbms just say no to some drugsndashbut not to others Managed Care 24 (4)
24ndash25
Shirneshan E P Kyrychenko O Matlin J Avila T Brennan and W Shrank (2016)
Impact of a transition to more restrictive drug formulary on therapy discontinuation
and medication adherence Journal of Clinical Pharmacy and Therapeutics 41 (1)
64ndash69
Stanford J (2020 July) Price controls would throttle biomedical innovation Wall Street
Journal 41
Tamblyn R R Laprise J A Hanley M Abrahamowicz S Scott N Mayo J Hurley
R Grad E Latimer R Perreault et al (2001) Adverse events associated with
prescription drug cost-sharing among poor and elderly persons JAMA 285 (4)
421ndash429
The Doctor-Patient Rights Project (2017 December) The de-list How formulary
exclusion lists deny patients access to essential care Technical report
httpswwwhealthstrategiescomsitesdefaultfilesagendas2015_
PBM_Research_Agenda_RA_110714pdf
Thiebaud P B V Patel and M B Nichol (2008) The demand for statin The effect of
copay on utilization and compliance Health Economics 17 (1) 83ndash97
Wang Y R and M V Pauly (2005) Spillover effects of restrictive drug formularies
on physician prescribing behavior Evidence from medicaid Journal of Economics amp
Management Strategy 14 (3) 755ndash773
Werble C (2014 September) Pharmacy benefit managers Health policy brief Technical
report Health Affairs
WHO Collaborating Centre for Drug Statistics Methodology (2010) Guidelines for atc
classification and ddd assignment Technical report World Health Organization
httpswwwwhoccnofilearchivepublications2011guidelinespdf
31
Yin W (2008) Market incentives and pharmaceutical innovation Journal of Health
Economics 27 (4) 1060ndash1077
Zycher B (2006) The human cost of federal price negotiations the Medicare prescription
drug benefit and pharmaceutical innovation Manhattan Institute Center for Medical
Progress
32
Figure 1 Pharmaceutical Payment and Supply Chain Example
Notes Illustration of the flow funds and prescription drugs for a prescription drug purchase covered bya Medicare Part D Insurance plan Other private insurance plans using PBMs have similar flow of fundsFigure credit to Government Accountability Office (2019)
33
Figure 2 Number of Excluded Drugs by PBMs
0
50
100
150
Num
ber o
f Exc
lude
d D
rugs
2007 2008 2009 2010 2011 2012 2013 2014 2015 2016 2017Year
CVSExpress ScriptsOptum
Notes This figure plots the number of drugs excluded by each of the three Pharmacy Benefit ManagersCVS was the first to begin excluding drugs in 2012 followed by Express Scripts in 2014 and OptumRx in2016
34
Figure 3 Number of Excluded Drugs by Disease Categories
0
1
2
3
4
5
6
7
8
9
10
11
12
13
14
15
16
17
18
19
20
2011 2012 2013 2014 2015 2016 2017 2018
Notes Each bubble represents a disease category in a year and the size of the bubble reflects the numberof drugs that were excluded by CVS Express Scripts or OptumRx in that disease category There were atotal of 300 drugs that were ever excluded from 2012-2017 by at least one of the three PBMs Of these 300excluded drugs we were able to match 260 of them to the First Data Bank data from which we obtainedthe ATC4 data We manually matched each ATC4 to a disease category this disease taxonomy was adaptedfrom the disease categories provided by the PBMs in their exclusion lists
35
Figure 4 Predictors of Exclusion Risk
Log(1 + N of generic NDCs)
Log(1 + N of brand NDCs)
Log(1 + N of ATC7s)
Mean brand price - mean generic price
Total prescription volume
-25 -15 -05 05 15 25Standardized Coefficient
Notes We used the 2011 market characteristics of the ATC4 class to predict exclusion risk The plottedcoefficients were generated by conducting bivariate linear regressions of whether an ATC4 class had at leastone drug excluded in 2012 or 2013 on each characteristic of the ATC4 class Independent variables werestandardized (divided by their standard deviation) All of the coefficients except the price variable weresignificant at the 5 level Since not every ATC4 class had data on all of the characteristics sample sizediffered across the regressions 197 ATC4 classes when predicting exclusion risk using the number of brandNDCs generic NDCs or ATC7s 134 when using brand price premium and 165 when using total prescriptionvolume Data on prices the number of brand and generic NDCs and the number of ATC7s are from FDBdata on total prescription volume are from the 2011 Medical Expenditure Panel Survey
36
Figure 5 Impact of Predicted Exclusion Risk on New Drug DevelopmentEvent Study
-60
-40
-20
020
Estim
ated
Impa
ct
2007 2008 2009 2010 2011 2012 2013 2014 2015 2016 2017Year
Notes Figure displays coefficient estimates and 90 confidence intervals from a modified version ofEquation (1) The outcome variable is the annual count of new development activity (across all stages) Togenerate the event study graph we replace the single post-period indicator variable (I(Year ge 2012)) witha vector of indicator variables for each year before and after the introduction of PBM exclusion lists in2012 We plot the coefficients on the interaction of these year indicators and a continuous measure ofpredicted exclusion risk (Exclusion risk is predicted using 2011 market characteristics prior to theintroduction of PBM formulary exclusions Details on the prediction of exclusion risk can be found inAppendix Table A4) The regression controls for ATC4 fixed effects and year fixed effects The sampleincludes 1397 ATC4-year observations
37
Figure 6 Counterfactual Development Activity by Pre-PeriodAvailability of Existing Therapies amp Market Size
A Reduction in development B Reduction in developmentby number of drugs in class by number of prescriptions in class
02
46
810
d
ecre
ase
in d
evel
opm
ent a
fter 2
012
Low Medium HighTerciles of pre-period no available drugs
02
46
810
d
ecre
ase
in d
evel
opm
ent a
fter 2
012
Low Medium HighTerciles of pre-period no prescriptions
Notes This figure displays the percent decrease in annual development attributable to exclusions
Predictions are based on our estimation of equation (1) we match the specification reported in Table 4
column 4 The figure shows the percent difference between predictions at the ATC4 times year with and
without exclusions averaged over the post-period (2012-2017) In Panel A we group ATC4 drug classes by
terciles of the number of existing drugs in the class (in 2011) data on existing drugs is from First Data
Bank In Panel B we group ATC4 drug classes by the number of prescriptions written in the class (in
2011) data on prescriptions is from the 2011 Medical Expenditure Panel Survey Drug classes are weighted
by the number of drugs with advancing development over the pre-period
38
Figure 7 Counterfactual Development Activity by Pre-Period DiseaseCategory
0 5 10 15 20 25 decrease in development after 2012
Other
Nutrition amp Weight Management
Antineoplastic
Hematology
Ophthalmic
Immunosuppressants
Musculoskeletal amp Rheumatology
Anti-Infectives Anti-Virals Anti-Bacterials
Dermatology
PainInflammation
Autonomic amp Central Nervous System
Gastrointestinal
Ear Nose amp Allergies
Urology Obstetrics amp Gynecology
Respiratory
Endocrine
Cardiovascular
Diabetes
Notes This figure plots the predicted percent decline in drug development activity attributable to
formulary exclusions by disease class Predictions are based on our estimation of equation (1) we match
the specification reported in Table 4 column 4 We manually matched each ATC4 to a disease category
this disease taxonomy was adapted from the disease categories provided by the PBMs in their exclusion
lists
39
Figure 8 Counterfactual Development Activity by Pre-Period Measuresof Scientific Novelty
A Citing Recent Science B Average ldquoDisruptivenessrdquo Index
02
46
810
d
ecre
ase
in d
evel
opm
ent a
fter 2
012
Low Medium HighTerciles of pre-period proportion citing recent science
02
46
810
d
ecre
ase
in d
evel
opm
ent a
fter 2
012
Low Medium HighTerciles of pre-period patent D-Index
Notes This figure displays the percent decrease in annual development attributable to exclusions Drug
classes are divided into terciles according to attributes of patents associated with drug development activity
over the pre-period averaged from 2007-2011 Panel A groups drug classes by the share of pre-period patents
in a drug class citing recent science as of 2011 (recent is therefore defined as publications between 2006 and
2011) Panel B groups drug classes by the average ldquodisruptivenessrdquo index of patents in the drug class over
the pre-period which is a measure that captures how disruptive the scientific articles associated with the
patent are the index ranges from -1 (least disruptive) to 1 (most disruptive) and was originally developed
by Funk and Owen-Smith (2017)
40
Table 1 Summary Statistics
(A) New Drug Development
Mean Std Dev MedianAll 3061 4206 1305Preclincal 1739 2613 664Phase 1 654 884 307Phase 2 457 604 217Phase 3 211 304 104Launch 102 163 031
(B) ATC4 Characteristics
ATC4s with ATC4s withoutATC4 market characteristics in 2011 early exclusions early exclusionsMean N of generic NDCs 7679 3103Mean N of brand NDCs 268 1068Mean N of ATC7s within ATC4 1460 8518Mean brand price - mean generic price 5822 5598Mean total prescription volume (millions) 7046 1763Number of ATC4s 15 112
Notes Panel A summarizes the annual drug development activity from 2007-2011 in theCortellis data The sample includes 1397 ATC4-year observations The panel reports theannual number of drug candidates within an ATC4 class that entered different developmentstages Panel B summarizes ATC4 market characteristics in 2011 Column 1 reports resultsfor ATC4 classes with at least one excluded drug in 2012-2013 Column 2 reports results forATC4s with no exclusions in 2012-2013 Data on pricing and the number of available drugsare from First Data Bank data on on total prescription volume are from the 2011 MedicalExpenditure Panel Survey
41
Table 2 Impact of Exclusions on Prescription Volume
(1) (2) (3) (4)VARIABLES Log(Claims) Log(Claims) Log(Mkt Share) Log(Mkt Share)
Number of Excluding PBMs -0274 -0319 -0220 -0319(00638) (00733) (00809) (00733)
Observations 4626 4391 4626 4391R-squared 0962 0970 0939 0964Drug FE YES YES YES YESCohort X Year FE YES YES YES YESMarket Controls NO YES NO YES
Notes This table estimates the impact of PBM formulary exclusion on the volume ofMedicare Part D insurance claims each column reports a different regression specificationThe unit of observation is a drug times year The outcome variable in columns (1) and (2) is thenatural log of the total number of annual claims the outcome in columns (3) and (4) is theannual market share of the index drug relative to all other drugs in the ATC4 class The keyindependent variable of interest is the number of formularies excluding the drug that yearAll regressions include drug fixed effects and drug age X calendar year fixed effects (Drugage is measured as number of years elapsed since market entry) Specifications (2) and (4)include additional controls for ATC4 class times calendar year fixed effects to account for trendsin demand for different drug classes Data on prescription volume is from Medicare Part D2012-2017 public use files We analyze exclusions on 161 excluded drugs that are prescribedto Medicare Part D enrollees and are not in a protected class Standard errors are clusteredat the drug level Statistical significance is indicated as plt001 plt005 plt01
42
Table 3 Early Exclusion Risk and Later Exclusions
(1) (2)VARIABLES Late Exclusion Late Exclusion
Pr(Exclusion) 0167 0150(00413) (00624)
Observations 127 112R-squared 0116 0050Sample All ATC4s ATC4s without early exclusions
Notes Using a linear probability model we regressed whether ATC4 classes that werehighly predicted to be excluded by 2013 were more likely to be actually excluded laterafter 2013 Early exclusion risk is a continuous measure defined using the same specificationunderlying Table 4 we used 2011 market characteristics of the ATC4 class to predict whetherthe ATC4 class was at risk of exclusion by 2013 We then standardized this early exclusionrisk variable The outcome variable late exclusion is a binary variable that indicates whetherthe ATC4 was on any of the PBMrsquos exclusion list at least once in 2014-2017 Column 1includes all ATC4s while Column 2 drops ATC4s that were actually excluded by 2013Statistical significance is indicated as plt001 plt005 plt01
43
Table 4 Impact of Predicted Exclusion Risk on New Drug Development
(1) (2) (3) (4)VARIABLES New Development New Development Log(1+New Dev) Log(1+New Dev)
Post X Pr(Exclusion) -2403 -2198 -0382 -0333(5894) (6571) (0108) (0115)
Observations 1397 1397 1397 1397R-squared 0956 0956 0949 0950Year FE YES YES YES YESATC FE YES YES YES YESMarket Controls YES YES
Notes This table reports results from estimation of equation (1) each column reports adifferent regression specification The unit of observation is an ATC4 drug class times yearThe outcome variable ldquoNew Developmentrdquo is the annual count of new development activity(across all stages) The treatment variable is a continuous measure of predicted exclusionrisk (Exclusion risk is predicted using 2011 market characteristics prior to the introductionof PBM formulary exclusions Details on the prediction of exclusion risk can be foundin Appendix Table A4) The ldquoPostrdquo period comprises years 2012 and later after theintroduction of PBM formulary exclusions All specifications include year fixed effects andATC4 fixed effects Columns 2 and 4 include time-varying controls for each of the drug classcharacteristics listed in Table 1 Standard errors are clustered at the ATC4 level Statisticalsignificance is indicated as plt001 plt005 plt01
44
Table 5 Impact of Predicted Exclusion Risk on New Drug Development By Stages
(1) (2) (3) (4) (5) (6)VARIABLES Log(1+All) Log(1+Preclincal) Log(1+P1) Log(1+P2) Log(1+P3) Log(1+Launch)
Post X Pr(Exclusion) -0333 -0449 -0331 -0310 -0259 0113(0115) (0101) (0103) (0106) (0101) (0138)
Observations 1397 1397 1397 1397 1397 1397R-squared 0950 0947 0906 0891 0817 0652Year FE YES YES YES YES YES YESATC FE YES YES YES YES YES YESMarket Controls YES YES YES YES YES YESN of Drug Candidates Mean 3061 1739 654 457 211 102
Notes See notes to Table 4 Each column reports a regression with a different outcome variable Column 1 replicates the resultreported in Table 4 column 4 on total development activity The additional columns decompose this affect to explore how drugdevelopment changes at each phase moving from the earliest observed preclinical activity in column 2 through the each phase ofclinical trials and eventual launch on the market Standard errors are clustered at the ATC4 level Statistical significance is indicatedas plt001 plt005 plt01
45
Figure A1 Distribution of Predicted Exclusion Risk
Mean 012SD 015Q1 003Median 006Q3 015
020
4060
Perc
ent
00 01 02 03 04 05 06 07 08 09 10Pr(Exclusion)
Notes This histogram plots the distribution of predicted exclusion risk of the 127 ATC4s in our mainanalyses Summary statistics are also provided See notes to Appendix Table A4 for details on how theexclusion risk was calculated
46
Figure A2 Impact of Predicted Exclusion Risk on New DrugDevelopment Event Study By Stages
A Pre-clinical B Phase 1
-30
-20
-10
010
Estim
ated
Impa
ct
2007 2008 2009 2010 2011 2012 2013 2014 2015 2016 2017Year
-10
-50
510
15Es
timat
ed Im
pact
2007 2008 2009 2010 2011 2012 2013 2014 2015 2016 2017Year
C Phase 2 D Phase 3
-10
-50
5Es
timat
ed Im
pact
2007 2008 2009 2010 2011 2012 2013 2014 2015 2016 2017Year
-4-2
02
4Es
timat
ed Im
pact
2007 2008 2009 2010 2011 2012 2013 2014 2015 2016 2017Year
Notes See notes to Figure 5 Each panel displays results from estimating the same equation with adistinct outcome variable The outcome variables correspond to the number of drug candidates tested at theindicated phase within the ATC4 category and year The sample includes 1397 ATC4-year observations
47
Figure A3 Impact of Exclusions on New Drug Development Event Study
-15
-10
-50
510
Estim
ated
Impa
ct
2007 2008 2009 2010 2011 2012 2013 2014 2015 2016 2017Year
Notes These results parallel the specification underlying Figure 5 but with a new definition of exclusionexposure Instead of defining exclusion risk as a continuous measure predicted using the 2011 marketcharacteristics the exclusion risk here is a binary variable that equals one if any drug in the ATC4 class wason a PBM exclusion list in 2012 or 2013 The sample includes 1397 ATC4-year observations
48
Figure A4 Impact of Predicted Exclusion Risk on New DrugDevelopment Event Study Alternative ATC4 Linking
(A) Directly Linked Approach Only
-60
-40
-20
020
Estim
ated
Impa
ct
2007 2008 2009 2010 2011 2012 2013 2014 2015 2016 2017Year
(B) Indirect Linking Approach Only
-10
-50
510
Estim
ated
Impa
ct
2007 2008 2009 2010 2011 2012 2013 2014 2015 2016 2017Year
Notes These results parallel the specification underlying Figure 5 but with alternative methods for linkingdrug candidates to ATC4 classes In these figures we have replaced our baseline outcome measure ofdevelopment activity with two alternative outcomes that take different approaches to matching In Panel Awe only count track development activity among the subset of drug candidates for which Cortellis directlyreports the drug class In Panel B we impute ATC4s from ICD9 codes for all drug candidates rather thanrelying on Cortellisrsquo reporting of drug class Appendix B provides more details on how the drug candidatesare linked to ATC4s
49
Table A1 Examples of ATC4 Codes Defining Drug Markets
A10 Diabetes drugsA10A Insulins and analoguesA10B Blood glucose lowering drugs excluding insulinsA10X Other drugs used in diabetes
C07 Beta blocking drugsC07A Beta blocking agentsC07B Beta blocking agents and thiazidesC07C Beta blocking agents and other diureticsC07D Beta blocking agents thiazides and other diureticsC07E Beta blocking agents and vasodilatorsC07F Beta blocking agents other combinations
Notes This table provides examples of ATC4 classes for illustrative purposes Oursample includes 127 distinct ATC4 classes A complete listing of the ATC4 class definitionsthat guided this analysis can be found in WHO Collaborating Centre for Drug StatisticsMethodology (2010)
50
Table A2 Summary Statistics Part D Claims per Drug
Mean Std Dev Median No of obsClaims for non-excluded drugs (all ages) 158298 842241 4357 3923Claims for excluded drugs (all ages) 454433 1193389 45374 867Market share non-excluded drugs (all ages) 0187 0305 0027 3923Market share excluded drugs (all ages) 0113 0211 0028 867Claims for new drugs not excluded on entry 125826 395623 7123 1811Claims for new drugs excluded on entry 193731 452800 27799 59Market share of new drug not excluded on entry 0147 0264 0027 1811Market share of new drug excluded on entry 0063 0183 0004 59
Notes This table reports summary statistics from the Medicare Part D public use fileData tracks annual claims per drug in 2012-2017 the unit of observation is the drug-yearpair Market share is calculated as the fraction of prescription drug claims in the ATC4 classthat are for the index drug The first four rows report results for all drugs comparing thosethat were ever excluded to those that were never excluded durign the sample period Thelast four rows report results for the subset of ldquonew drugsrdquo defined as drugs that enter themarket in 2007 or later and so are ten years old or younger for the duration of the sampleThese final rows compare new drugs that were excluded within a year of entry to those thatwere not excluded in the first year
51
Table A3 Impact of Immediate Exclusion on Prescriptions of New Drugs
(1) (2) (3) (4)VARIABLES Log(No of Claims) Log(No of Claims) Log(Market Share) Log(Market Share)
Excluded at Entry -1147 -1193 -1094 -1099(0573) (0591) (0546) (0564)
Observations 1846 383 1846 383R-squared 0532 0442 0463 0339ATC4 FE YES YES YES YESCohort X Year FE YES YES YES YESLimited sample NO YES NO YES
Notes This table investigates the impact of immediate exclusion by one or more PBM onclaims for a new prescription drug Each column reports results from a separate regressionThe regressions include ATC4 fixed effects and drug age X calendar year fixed effectsIdentifying variation comes from the debut of multiple drugs within an ATC4 drug classsome of which are immediately excluded and others are not Immediate exclusion is defined asexclusion in the calendar year immediately following market entry The sample is restrictedto drugs that enter the market in 2007 or later and so are ten years old or younger forthe duration of the sample In columns 2 and 4 the sample is further restricted to onlyATC4 categories that have at least one immediately excluded drug See notes to AppendixTable A2 for more details on the data Standard errors are clustered at the drug levelStatistical significance is indicated as plt001 plt005 plt01
52
Table A4 Predicting Exclusion Risk
(1)VARIABLES Exclusion
Log(1 + N of generic NDCs) -0674(0317)
Log(1 + N of brand NDCs) 0656(0511)
Log(1 + N of ATC7s) 1069(0665)
Mean brand price - mean generic price -000862(000761)
Total prescription volume 170e-08(816e-09)
Observations 128Pseudo R2 0243
Notes We used the above 2011 market characteristics of the ATC4 class to predict exclusionrisk Using a Logit model we regressed whether an AT4 class had at least one drug excludedin 2012 or 2013 on all of the characteristics of the ATC4 class reported above We then usedthe regressionrsquos fitted values to construct predicted exclusion risk of each ATC4 Data onprices the number of brand and generic NDCs and the number of ATC7s are from FDBdata on total prescription volume are from the 2011 Medical Expenditure Panel Survey
53
Table A5 Impact of Predicted Exclusion Risk on New Drug DevelopmentBy Stages Non-Logged
(1) (2) (3) (4) (5) (6)VARIABLES All Preclincal Phase 1 Phase 2 Phase 3 Launch
Post X Pr(Exclusion) -2198 -1105 -6010 -3830 -1098 0220(6571) (3403) (2077) (1349) (0422) (0496)
Observations 1397 1397 1397 1397 1397 1397R-squared 0956 0944 0903 0900 0804 0643Year FE YES YES YES YES YES YESATC FE YES YES YES YES YES YESMarket Controls YES YES YES YES YES YESN of Drug Candidates Mean 3061 1739 654 457 211 102
Notes This table parallels the results reported in Table 5 but using non-logged outcomesEach column explore how drug development changes at each stage moving from the earliestobserved preclinical activity in column 2 through the different stages of clinical trialsStandard errors are clustered at the ATC4 level Statistical significance is indicated as plt001 plt005 plt01
54
Table A6 Impact of Exclusions on New Drug Development
(1) (2) (3) (4)VARIABLES New Development New Development Log(1+New Dev) Log(1+New Dev)
Post X Excluded Class -5824 -4534 -0161 -0137(2568) (2290) (00838) (00891)
Observations 1397 1397 1397 1397R-squared 0954 0955 0949 0950Year FE YES YES YES YESATC FE YES YES YES YESMarket Controls YES YES
Notes This table reports results from estimating a modified version of equation (1)Instead of defining exclusion risk as a continuous measure predicted using the 2011 marketcharacteristics the exclusion risk here is a binary variable that equals one if any drug inthe ATC4 class was on a PBM exclusion list in 2012 or 2013 For further details on theregression specifications see notes to Table 4 Standard errors are clustered at the ATC4level Statistical significance is indicated as plt001 plt005 plt01
55
Table A7 Impact of Predicted Exclusion Risk on New Drug DevelopmentAlternative ATC4 Linking
(A) Directly Linked Approach Only(1) (2) (3) (4)
VARIABLES New Dev New Dev Log(1+New Dev) Log(1+New Dev)
Post X Pr(Exclusion) -2098 -1859 -0370 -0269(6048) (6745) (0132) (0146)
Observations 1397 1397 1397 1397R-squared 0963 0963 0947 0948Year FE YES YES YES YESATC FE YES YES YES YESMarket Controls YES YES
(B) Indirect Linking Approach Only(1) (2) (3) (4)
VARIABLES New Dev New Dev Log(1+New Dev) Log(1+New Dev)
Post X Pr(Exclusion) -4301 -4454 -0229 -0246(1329) (1473) (00836) (00877)
Observations 1397 1397 1397 1397R-squared 0898 0900 0951 0952Year FE YES YES YES YESATC FE YES YES YES YESMarket Controls YES YES
Notes These results parallel the specification underlying Table 4 but with alternativemethods for linking drug candidates to ATC4 classes We have replaced our baseline outcomemeasure of development activity with two alternative outcomes that take different approachesto matching In Panel A we only count track development activity among the subset of drugcandidates for which Cortellis directly reports the drug class In Panel B we impute ATC4sfrom ICD9 codes for all drug candidates rather than relying on Cortellisrsquo reporting of drugclass Appendix B provides more details on how the drug candidates are linked to ATC4sStandard errors are clustered at the ATC4 level Statistical significance is indicated as plt001 plt005 plt01
56
Table A8 Impact of Predicted Exclusion Risk on New Drug DevelopmentWild Cluster Bootstrap
(1) (2) (3)VARIABLES New Development Log(1+New Dev) IHS New Dev
Post X Pr(Exclusion) -2198 -0333 -0316[-3797 -8378] [-5357 -03624] [-5549 01335]
Observations 1397 1397 1397Year FE YES YES YESATC FE YES YES YESMarket Controls YES YES YES
Notes Columns 1 and 2 of this table repeat the specifications reported in Table 4 columns2 and 4 but now using wild cluster bootstrap to calculate the 95 confidence interval(rather than using conventional inference) Clustering is performed at the ATC4 levelColumn 3 reports results with the outcome variable defined as the inverse hyperbolic sinetransformation of development activity this transformation can be interpreted similarly tothe log transformation but better accounts for ATC4-year categories with no developmentactivity Column 3 also uses wild cluster bootstrap for inference Statistical significance isindicated as plt001 plt005 plt01
57
A Theoretical Model
We focus on a potential pharmaceutical entrant that makes RampD decisions on the basis of
expected profitability This firm can make investments in one of two drug classes class o is ldquooldrdquo
in the sense that there is already an approved treatment in that class class n is ldquonewrdquo in the
sense that there are no existing treatments For tractability we assume that there is exactly one
incumbent drug in the old class The pharmaceutical firm pays a fixed cost of drug development K
that is the same for both classes If the firm invests in class o it produces an FDA approved drug
with probability φo for class n this probability is given by φn If successful the entrant competes as
a monopolist in the new drug class and as a Bertrand duopolist in the old drug class For simplicity
we follow Dixit (1979) and adopt a linear demand system with horizontally differentiated products
We assume there is a single PBM that facilitates access to FDA approved drugs by administering
an insurance plan formulary Patients pay a coinsurance fraction λ isin (0 1) for drugs included in
the PBMrsquos formulary but must bear the full cost of drugs that are not
We begin in Section A1 by characterizing pharmaceutical profits in both the old and new drug
classes when formulary exclusions are prohibited Next in Section A2 we introduce formulary
exclusions as a policy change in which PBMs begin granting exclusive contracts to pharmaceutical
firms in exchange for a fixed fraction (1minusα) isin (0 1) of sales revenue from the included drug When
there are two drugs on the market we show that ex post profits are lower for drugmakers when
their drug is excluded from the PBMrsquos formulary because of this they are willing to offer higher
rebates ex ante in order to win the exclusive contract Finally after characterizing downstream
profits associated with approved drugs both with and without exclusions we analyze how the
exclusion policy impact firmsrsquo upstream investment decisions and provide an informal discussion
of welfare implications
A1 Downstream profits without exclusions
In our baseline case we do not allow for exclusions PBMs facilitate access to all FDA approved
drugs If the entrant drug is approved it competes as either a monopolist in class n or as a
differentiated Bertrand duopolist in class o In both cases its drug is included on the PBMrsquos
formulary Because formulary inclusion is guaranteed the PBM cannot extract rebate payments in
the absence of a credible exclusion threat in the context of our simple model20
20In reality PBMs could negotiate rebates in exchange for placement on a preferred formulary tier evenin the absence of exclusions For simplicity we do not include these other tools in our model Crucially
58
We denote the entrantrsquos downstream profits as Πen in the new class and as Πopeneo in the old
class The subscript e indicates the entrant the subscript o or n indicates the old or new class
respectively the superscript open describes the open formulary policy state where no drugs are
excluded
In drug class n the entrant faces a standard monopoly pricing problem
maxpen
(pen minusm) (AminusBλpen)
Here A is a parameter describing the level of demand in this drug class and B is a parameter
describing consumerrsquos elasticity with respect to price Marginal costs of production are denoted as
m Demand also depends on λp because we assume consumers are partially insured The relevant
price consumers face is λp le p even though the drugmaker receives p Solving this problem yields
equilibrium prices pen quantities qen and profit Πen
Meanwhile in class o the entrant e would be two competing with the incumbent i We assume
that the demand system is symmetric and the drugs are horizontally differentiated but of equivalent
quality so that b gt d
qopeneo = aminus bλpopeneo + dλpopenio
qopenio = aminus bλpopenio + dλpopeneo
Here the parameters a and b denote potentially different levels and elasticities of demand relative
to class n The entrant and incumbent symmetrically choose price to maximize profits
maxpopeneo
(popeneo minusm)(aminus bλpopeneo + dλpopenio
)maxpopenio
(popenio minusm)(aminus bλpopenio + dλpopeneo
)We take the first order conditions and solve for the optimal duopoly pricing
exclusions are the strongest tool available to PBMs for restricting drug access and are thus a significantdeparture from the earlier forms of control over formulary structure
59
Proposition A1 The incumbent and entrant face symmetric demand and will choose identical
prices and then produce identical quantities Production will occur as long as 2bminus d gt 0
popeneo = popenio qopeneo = qopenio Πopeneo = Πopen
io
This proposition is proved by deriving equilibrium price quantity and profit These expressions
are given below
popeneo = popenio =a
λ(2bminus d)+
bm
(2bminus d)
qopeneo = qopenio =ab
(2bminus d)minus λb(bminus d)m
(2bminus d)
Πopeneo = Πopen
io =b (aminus λ(bminus d)m)2
λ(2bminus d)2
A2 Downstream profits with exclusions
We now consider the case in which PBMs are able to exclude approved drugs when there is
a viable alternative In our model this means that there can be no exclusions in class n so that
prices quantities and profits are unaffected
In class o however drugs can be excluded Excluded drugs can still be marketed but would not
be covered by insurance meaning that consumers face the full price p rather than the subsidized
λp The firm again enters differentiated Bertrand competition but with another firm whose drug
is covered For the purposes of this exposition we assume that the entrant is excluded and the
incumbent is covered The demand functions will then become
qexcludedeo = aminus bpexcludedeo + dλpincludedio
qincludedio = aminus bλpincludedio + dpexcludedeo
Each firm will choose prices to maximize profits Here we assume that the term (1minus α) is the
pre-negotiated rebate that the incumbent pays in order to be included in a PBMrsquos formulary We
will endogenize α in the following section If the entrant is excluded then it no longer pays the
60
(1minus α) revenue share to the PBM
maxpexcludedeo
(pexcludedeo minusm)(aminus bpexcludedeo + dλpincludedio
)max
pincludedio
(αpincludedio minusm)(aminus bλpincludedio + dpexcludedeo
)Taking first order conditions we can solve for the optimal price quantity and profits for entrant
and incumbent
Proposition A2 When λ le α we have the following expressions for prices and quantities
pexcludedeo le αpincludedio qexcludedeo le qincludedio
The condition λ le α means that the share of revenue retained by the pharmaceutical company
after rebates is greater than the drug coinsurance rate paid by insured consumers21 Under this
assumption the included drug is able to charge a higher price to insurers and still sell more
quantities because formulary placement leads consumers to face a lower out-of-pocket price The
more generous the insurance coverage the larger the price wedge between the included and excluded
drug If marginal costs of production are zero then the two drugs will sell equal quantities the
excluded drugrsquos lower prices will be exactly the amount needed to offset the insurance coverage If
marginal costs are positive then the excluded drug will sell at a lower quantity than the included
drug Finally the expressions above assumed the entrant is excluded but flipping the identity of
the excluded drug will simply swap the comparative statics the excluded drug will have a lower
revenue per unit and lower quantity sold in equilibrium
To prove these propositions we solve for the equilibrium price and quantities taking the rebate
level (1minusα) required for formulary inclusion as given We then solve for the optimal rebate bidding
21Empirical estimates suggest this sufficient condition holds in practice The Kaiser Family Foundationreports average insurance subsidy rates (1 minus λ) for prescription drugs ranging between 62 and 83depending on the drug tier for employer sponsored insurance plans in 2017 (Claxton et al 2017) Theseestimates imply coinsurance rates λ in the range of [017 038] In comparison Kakani et al (2020) estimaterebates of 48 in 2017 suggesting the share of retained revenue α as 052
61
strategy in the second stage Prices are as follows
pexcludedeo =a
(2bminus d)+b(2αb+ λd)m
α(4b2 minus d2)
pincludedio =a
λ(2bminus d)+b(2λb+ αd)m
αλ(4b2 minus d2)
Recall that the included drug does not receive the full price pincludedio in additional revenue for
each unit sold because it owes a cut (1 minus α) of its revenue to the PBM As a result the effective
revenue per unit sold is αpincludedio for the included drug As a result we compare αpincludedio to
pexcludedeo to calculate the difference in revenue per unit across the included and excluded drug
αpincludedio minus pexcludedeo =(αminus λ)a
λ(2bminus d)+
(α+ λ)(αminus λ)bdm
αλ(4b2 minus d2)
As long as λ le α and 2bminus d gt 0 it will hold that
αpincludedio ge pexcludedeo
We can calculate equilibrium quantities as follows
qexcludedeo =ab
(2bminus d)minusb(2αb2 minus λbdminus αd2
)m
α(4b2 minus d2)
qincludedio =ab
(2bminus d)minusb(2λb2 minus αbdminus λd2
)m
α(4b2 minus d2)
From these quantity expressions we calculate
qincludedio minus qexcludedeo =(αminus λ)b(b+ d)m
α(2b+ d)
Maintaining the assumption that λ le α it follows that
qincludedio ge qexcludedeo
62
A3 Profits and bidding on rebates
From the PBMrsquos perspective exclusions allow it to extract positive rebates 1minusα by leveraging
the exclusion threat From the drug companyrsquos perspective exclusions reduce the profitability of
entry into the old class we discuss these profitability comparisons in this section A corollary of
Proposition A2 is that profits will be higher when a drug is included rather than excluded from
an PBMrsquos formulary as long as the final rebate level is not too high Because of this drugmakers
would be willing to provide an ex ante payment in order to avoid exclusion ex post We model this
process as a second price auction in which pharmaceutical firms bid for the exclusive right to be
included in a PBMrsquos formulary by offering rebates of the form αpq The drug offering the highest
rebate offer will be included on the formulary in cases with tied bids one drug will be selected at
random for inclusion The following pins down rebates in equilibrium
Proposition A3 In the old drug class firms will be bid a rebate level 1minus α = 1minus λ so that
Πexcludedeo = Πincluded
io and Πexcludedeo gt Πopen
eo (2)
At the time a drug is approved each pharmaceutical firm would be willing to set the rebate up to
the level that would equalize profits when included on formulary to the profits when excluded As
shown in Appendix A excluded profits equal included profits when the rebate share (1minusα) equals
the insurance coverage share (1 minus λ) Assuming that the entrant and incumbent have symmetric
demand and marginal costs the incumbentrsquos bid is the same as the entrantrsquos and we assume that
the PBM uses a coin toss to break the tie Because the firmrsquos bid leaves it indifferent between
being included and being excluded the firm receives its outside option profits in either case and
the PBM retains the extra rebate payment22
To compare profit of the entrant to the old drug class see the expressions below
Πexcludedeo = (pexcludedio minusm)qexcludedeo
Πincludedio =
(pexcludedio +
(αminus λ)a
λ(2bminus d)+
(α2 minus λ2)bdmαλ(4b2 minus d2)
minusm)(
qexcludedeo +(αminus λ)b(b+ d)m
α(2b+ d)
)
22For simplicity we do not model demand for PBM services In practice some of the PBMrsquos rebate maybe passed on to consumers or retained as PBM profit
63
As shown above as long as α gt λ the included drug makes higher profits Further profits
for the included drug are increasing in α and the difference in profitability between the included
and excluded drug is also increasing in α Profits for the included drug are equal to profits for the
excluded drug when λ = α since at this point the marginal revenue per unit sold is the same for
included and excluded drugs as is the quantity sold The drug company would be willing to bid a
maximum rebate level of up to 1minus α = 1minus λ for inclusion on the formulary
Now we can compare price quantity and profitability of the entrant under the open formulary
regime compared to the closed formulary regime The entrantrsquos price net of the PBM rebate under
the open formulary is higher than the price of the excluded drug in the closed formulary
popeneo minus pexcludedeo =(1minus λ)a
λ(2bminus d)+
(αminus λ)bdm
α(4b2 minus d2)
Under the sufficient condition that λ le α it will hold that the the entrantrsquos drug price is strictly
higher under the open formulary than if it were excluded from coverage
αpopeneo gt pexcludedeo
Further the entrantrsquos quantity sold is also strictly larger under the open formulary than when
it is excluded
qopeneo minus qexcludedeo =(1minus λ)b(bminus d)m
(2b+ d)+
(αminus λ)b2dm
α(4b2 minus d2)
As long as λ le α and b gt d it will also hold that
qopeneo gt qexcludedeo
Because the entrantrsquos price and quantity are both strictly larger under the open formulary than
when the entrant is excluded it follows that entrantrsquos strictly profits are higher under the open
formulary
Πopeneo gt Πexcluded
eo
A4 Upstream investment decisions
A firm will choose whether to invest in the old or new drug class by comparing expected profits
and success rates of drugs in each class When there are no exclusions a potential entrantrsquos expected
64
returns at the time of its RampD decision are given by
E[Πe] =
φnΠopen
eo if develop for class o
φoΠen minus if develop for class n
The firm therefore chooses to develop for the old class as long as
Πopeneo gt
φnφo
Πen (3)
In general the old drug class will be more attractive when the likelihood of successful
development is higher when there is a large base of potential consumer demand (eg if it is a
common condition) or if the firmrsquos drug is more differentiated from that of the incumbentrsquos
However when there is a threat of exclusion the entrant anticipates needing to bid for access to
the PBMrsquos formulary in the event it creates an FDA approved drug for the old class The firm
has a probably φo of developing a successful drug in the old class in which case it will enter its
maximum rebate bid to be included in the formulary and win half the time However any ex post
returns to being included in the formulary are bid away so that the entrant expects to receive
only its outside option revenues in the case when its drug is excluded
Meanwhile profits from developing an entrant for the new drug class do not depend on whether
the formulary is open or closed because we assume that drugs can only be excluded when there is
a viable alternative The potential entrantrsquos new criterion for developing in class o when exclusions
are permitted is given by
Πexcludedeo gt
φnφo
Πen (4)
The criterion differs from the no-exclusion condition given in Equation (3) only in the lefthand
side which had a Πexcludedeo instead of Πopen
eo As shown above profits are higher when there is an
open formulary so that Πopeneo gt Πexcluded
eo The model therefore predicts that the introduction of
an exclusion policy leads firms to develop relatively fewer drugs for the older class
65
B Linking Drug Candidates to ATC4 Classes
We matched the pipeline drug candidates in Cortellis to ATC4 codes in two ways directly via
EphMRA codes and indirectly via ICD9 codes if the EphMRA codes were missing
Direct method matching via EphMRA codes Cortellis links drug candidates to chemical
drug classes (specifically the EphMRA code which is a close derivative of the ATC classification)
Using a manually created crosswalk of EphMRA codes to ATC4 codes we used the EphMRA codes
of the drug candidates to link the drugs to ATC4 classes A drug can be linked to many ATC4
classes and we assigned equal weights of 1 to all ATC4 classes that directly matched to a given
drug through their EphMRA codes
Indirect method matching via ICD9 codes An alternative way to link the drug candidates to
ATC4 classes is through the drugsrsquo areas of therapeutic use (ICD9) provided by Cortellis Using the
drug to ICD9 crosswalk from Cortellis we linked to a crosswalk of ICD9 to ATC4 codes created by
Filzmoser et al (2009) in which the authors assigned a probabilistic match score of ICD9-ATC4
pairs23 Since this results in a drug being matched (indirectly via ICD9) to many ATC4s we
assigned the likelihood of an ATC4 matching to a drug based on the probabilistic match scores
from Filzmoser et al (2009) such that the assigned weights sum to 1 for each drug
For our main analyses we matched the drug candidates to ATC4 codes using the direct method
via EphMRA codes and used the indirect method via ICD9 codes for drugs with missing EphMRA
codes As shown in Appendix Table A7 our results are similar regardless of the linking method
used
23Filzmoser et al (2009) merged a dataset of prescriptions (with ATC4 codes) and a dataset of hospitaladmissions (with ICD9 codes) at the patient-level Since the ATC4 code of a patientrsquos drug matches to manydiagnosis codes of the patient the authors use a frequency-based measure to calculate a probabilistic matchscore of an ICD9-ATC4 pair They conduct this match specific to genderage group of the patients For ouranalysis we take the average match probability across the genderage groups for a given ICD9-ATC4 pair
66
- Institutional Background
- Formulary Exclusions and Upstream Innovation
- Data
- Formulary Exclusions
-
- Descriptive statistics
- The impact of exclusions on drug sales
- Predictors of formulary exclusion risk
-
- The Impact of Exclusion Risk on Subsequent Drug Development
-
- Empirical strategy
- Main results
- Robustness checks
- Classifying foregone innovation across drug classes
-
- Discussion
- Conclusion
- Theoretical Model
-
- Downstream profits without exclusions
- Downstream profits with exclusions
- Profits and bidding on rebates
- Upstream investment decisions
-
- Linking Drug Candidates to ATC4 Classes
-
Technological innovation is a large driver of rising health spending raising questions as
to whether our current payment systems deliver the right balance between incentives to
innovate and incentives to contain costs While some argue that broad insurance coverage
and generous pricing policies are necessary to sustain valuable RampD investment others
believe that these same policies generate perverse incentives to create expensive products
with little incremental clinical value1 The policy relevance of this debate has grown as
politicians have increasingly called for the federal government to implement value-based
pricing that limits insurance coverage for high-cost low-value treatments Despite its
importance there is limited empirical evidence on how the structure of insurance coverage
shapes incentives for upstream medical innovation
In this paper we study the impact of a major change in coverage policies for private
sector prescription drug plans on upstream pharmaceutical RampD In the United States
prescription drug plans are typically managed by intermediary firms known as Pharmacy
Benefit Managers (PBMs) Traditionally PBMs provide coverage for all FDA-approved
drugs but assign them to different tiers of patient cost-sharing Beginning in 2012 however
PBMs began refusing to provide any coverage for some high price drugs (including many
newly approved drugs) when cheaper generic or branded substitutes already existed Over
the next five years 300 drugs were excluded by at least one of the three largest PBMs
This practice of excluding coverage entirely known as maintaining a ldquoclosed formularyrdquo
can substantially reduce the expected profitability of new drugs For example the high
blood pressure medication Edarbi received FDA approval in 2011 but was almost immediately
excluded by the two largest PBMs CVS Caremark and Express Scripts By September 2013
Edarbirsquos manufacturer the Japanese firm Takeda had decided to sell off its US distribution
rights despite keeping these rights in Japan and in other countries2
Understanding how the downstream policies of PBMs shape upstream pharmaceutical
innovation can inform our understanding of how to design insurance plans that balance
incentives for innovation and cost-containment These lessons gleaned from the policies of
private sector firms provide insight into the possible effects of new policy proposals governing
1For example Stanford (2020) and Zycher (2006) have argued that the innovation benefits of generousdrug payment policies are large while Bagley et al (2015) and Frank and Zeckhauser (2018) highlight therisk that generous drug payments may yield excessive incremental innovation
2In an analysis described in Section 42 we test whether this example generalizes Our results show thatfor each PBM that excludes coverage a drugrsquos sales (as proxied by Medicare Part D claims) falls by 24
1
how public insurers interact with drugmakers3 The largest PBM CVS Caremark manages
benefits for 75 million Americansmdashmore than the number of enrollees in either Medicare or
Medicaid
We begin by showing that the risk of being excluded from a PBMrsquos formulary varies
systematically and predictably across drug classes in particular exclusions are more
common in drug classes with more pre-existing therapeutic options and in classes with a
larger number of patients In the case of Edarbi CVS and Express Scripts both pointed to
a variety of other popular angiotensin II receptor blockers (ARBs) as viable alternatives
even though they were not molecularly equivalent Further the cost savings associated
with excluding Edarbi were potentially very large because they could be realized over many
patients suffering from hypertension Indeed we show show that the greatest number of
exclusions were for drugs aimed at treating diabetes and cardiovascular diseases both areas
responsible for a large share of insurance spending
Next we use this information to build a measure of each drug classrsquos ex-ante risk of facing
exclusions based on its market characteristics prior to the introduction of closed formularies
We show that pharmaceutical RampD fell markedly in drug classes at high risk of exclusions
relative to trends in low risk classes following the introduction of closed formulary policies
We document a 5 decline in the number of new clinical trials and announcements of early
stage development for a one standard deviation increase in ex-ante exclusion risk These
declines impact drug candidates in all phases of development but are largest among earlier
stage drugs
We go on to explore the nature and value of this foregone innovation We first document
a change in the composition of drugs under development RampD declined the most in drug
markets with a high number of existing therapies serving common diseases such as diabetes
and cardiovascular diseases Second we show that exclusions depressed RampD investments in
the least scientifically innovative drug classes those where drug patents are based on older
and less ldquodisruptiverdquo underlying science (Funk and Owen-Smith 2017)
Taken together our results suggest that closed formulary policies altered the demand
risks that drugmakers consider when making RampD investment decisions Prior to this policy
3Congressional Budget Office (2007) predicts that the government will not be able to negotiate lowerprices with drug manufacturers unless it adopts a PBM-pioneered model of providing preferential access forspecific drugs on publicly-run formularies
2
change pharmaceutical firms could expect that their drugs would be covered by insurers
if approved by the FDA In this world firms had strong incentives to develop incremental
drugs aimed at large disease markets because such drugs were the most likely to receive
FDA approval and generate a large base of revenues if approved With the introduction
of closed formularies these incremental drugs became precisely the ones at greatest risk of
being excluded from formularies Our results show that pharmaceutical firms responded
to this change in incentives by shifting resources away from drug classes serving common
diseases with many incumbent therapies Further our results suggest that exclusion policies
shifted research investments away from areas with more ldquome-toordquo development activity and
lower scientific novelty
An important caveat to note is that our econometric approach is based on a
difference-in-differences specification that identifies a relative decline in investment in drug
classes at high exclusion risk compared to lower risk classes A natural welfare-relevant
question is whether this constitutes a total decline in innovative activity or a reallocation
of RampD investment While we cannot answer this question empirically (since it would rely
purely on time series identification) recent research suggests that even large
pharmaceutical firms may face financial frictions In this case a decline in RampD spending
in high exclusion risk classes may generate some degree of reallocation toward other drug
classes that face lower exclusion risk In the absence of frictions exclusion policies would
decrease total investment in new drug innovation
Our paper contributes to a broad literature examining how market incentives shape the
rate and direction of innovative output4 Prior empirical research has documented that
increased demand for drugs spurs new drug development several studies have measured the
impact of public insurance expansions (Acemoglu et al 2006 Blume-Kohout and Sood 2013
Clemens 2013 Dranove et al 2020 Finkelstein 2004 Krieger et al 2017) and demographic
changes (Acemoglu and Linn 2004 Dubois et al 2015) Other research has investigated the
role of regulation patent protection and public procurement showing that stronger patent
protection (Kyle and McGahan 2012) longer periods of market exclusivity (Budish et al
2015) Both ldquopushrdquo and ldquopullrdquo incentives have demonstrated effects on medical innovations
4Here we summarize some of the recent work in this area that focuses on healthcare innovation Directedtechnical change is also an active area of research in environmental economics which studies how investmentin clean and dirty technologies responds to market incentive (eg Aghion et al 2016 Acemoglu et al 2012)
3
including tax credits (Yin 2008) and public procurement incentives (Clemens and Rogers
2020) Our findings build on this earlier empirical work by focusing on a new angle how
changes in the structure of insurance coverage affect the direction of innovative activity
Further our paper provides an empirical analysis of tradeoffs raised by a theoretical literature
on insurance design and innovation (Garber et al 2006 Lakdawalla and Sood 2009)
The rest of the paper proceeds as follows Section 1 introduces the institutional
context Section 2 describes the negotiation between PBMs and drugmakers in more detail
summarizing a theoretical model of how RampD investments may respond to the introduction
of formulary exclusions Section 3 provides an overview of our key data sources covering
exclusions drug development and market characteristics Section 4 describes which drug
classes contain formulary exclusions and reports evidence that exclusions suppress drug
demand Section 5 presents our main findings on how formulary exclusions have reshaped
investments in drug development Section 6 discusses the welfare implications and
Section 7 concludes
1 Institutional Background
In the United States many parties are involved in the process of bringing a drug from
manufacturer to patient wholesalers pharmacies pharmacy benefit managers (PBMs) and
insurers Historically PBMs were only responsible for processing patient claims at the
pharmacy ie verifying the patientrsquos coverage obtaining payment from the insurer and
transmitting that payment to the pharmacy However over time and in concert with a wave
of mergers (Werble 2014) PBMs began playing a more active role in designing prescription
drug plans on behalf of insurers determining which prescription drugs would be covered
under a planrsquos formulary
Figure 1 illustrates the flow of both goods and payments for prescription drugs The
physical path of drugs is simple they are bought by wholesalers who then deliver and sell
them to pharmacies where they are distributed to patients PBMs do not generally enter
the physical supply chain for drugs but they play a major role in coordinating payments
PBMs serve as an intermediary between the insurer and the pharmacy The pharmacy is
paid by two parties it receives a drug co-pay from the patient and a reimbursement from
4
the PBM Meanwhile the PBM collects revenue in two ways First it is reimbursed for
the drug by the patientrsquos insurer who is still the ultimate payee Second the PBM also
receives a rebate from the pharmaceutical firm this is a payment that the pharmaceutical
firm negotiates in return for having their drug included (ideally in a preferred position) on
the PBMrsquos formulary The PBM may pass on a portion of this rebate to the insurer
By 2012 the PBM industry had consolidated to the point that the largest three companies
controlled 62 of the market a share which has continued to grow (Lopez 2019) In this
paper we track the exclusion policies of the three largest firms CVS Caremark Express
Scripts and OptumRx Given their ability to pool patient demand across plans administered
on behalf of multiple insurance companies as well as their influence on formulary design
PBMs have substantial negotiating power with drug manufacturers PBMs may place drugs
into formulary tiers setting higher cost sharing for less preferred drugs Coverage for certain
drugs may require prior authorization from the patientrsquos insurance company Further PBMs
may use step-therapy restrictions and only cover more expensive drugs after cheaper options
have been proven ineffective
Beginning with CVS in 2012 major PBMs began implementing closed formularies
Rather than providing coverage (potentially with some tiering or restrictions) for all drugs
as long as they are FDA-approved PBMs began publishing lists of drugs that their
standard plans would not cover at all directing potential users to lists of recommended
alternatives including similar branded or generic drugs Some major PBMs also designated
closed formularies the default choice implementing a system where PBM customers (ie
insurers) would have to opt out if they wanted to avoid the standard closed formulary
(Reinke 2015) Industry experts describe PBM formulary exclusions as an ldquointegral part of
contract negotiationsrdquo with drug manufacturers (Reinke 2015)
Patients enrolled in prescription drug plans with closed formularies typically receive an
annual mailing notifying them of exclusions for the upcoming year and urging them to change
medications if they are currently taking a drug that is on this list With few exceptions
patients wishing to take an excluded drug would be responsible for paying the full cost at
the pharmacy5
5While patients may be able to access drugs that are excluded by their PBMrsquos formulary the exclusionsintroduce new barriers The patientrsquos insurer may entertain patient-specific appeals for coverage outside ofthe PBMrsquos standard policies The patient may choose to purchase the drug without insurance coverage
5
The PBM industry argues that formulary restrictions reduce insurersrsquo costs (Brennan
2017) but advocates counter that exclusions harm patients by decreasing access to
treatment A 2017 survey conducted by the Doctor-Patients Rights Project reports that a
quarter of insured Americans were denied treatment for chronic illnesses the most common
denial reason was the treatmentrsquos formulary exclusion (The Doctor-Patient Rights Project
2017) Furthermore while PBMsrsquo closed formularies policies implicitly rely on a
ldquoone-size-fits-allrdquo approachmdashchoosing one preferred treatment over other similar
treatmentsmdashdrugs that appear therapeutically equivalent may vary in efficacy and side
effects and a drug that works well for one patient may not be the best drug for another
patient with the same disease (Celgene 2016) We provide more detail on exclusion
practices in Section 4
A natural question is why PBM formulary exclusions became common after 2012 A
complete investigation is beyond the scope of this paper but there is evidence that existing
policies such as prior authorization requirements and the use of ldquostep therapiesrdquo were not
effective at limiting the use of certain expensive medications For example Miller and
Wehrwein (2015) suggest that exclusions may have arisen in response to the growing use of
ldquoco-pay cardsrdquo which are discounts offered by pharmaceutical companies to subsidize
patientsrsquo drug costs Because the insurer still has to pay its share of the drug price co-pay
cards diminished PBMsrsquo ability to steer patients to cheaper drugs In contrast exclusions
provide PBMs with a stronger tool for utilization management that cannot be directly
countered by co-pay cards and other consumer discounts
2 Formulary Exclusions and Upstream Innovation
In this paper we analyze the effect of PBM formulary exclusions on investments in drug
development While closed formularies have direct effects on demand for excluded drugs
they are also likely to affect the pricing of other drugs that face exclusion risk but were not
ultimately excluded Steve Miller the chief medical officer of Express Scripts described the
process of negotiating with pharmaceutical manufacturers as follows
paying the full price out-of-pocket Finally some patients may be able to choose between insurance plansserviced by different PBMs and so could switch to an alternative plan that has not excluded the drug
6
ldquoWe are going to be pitting you all against each other Who is going to give us
the best price If you give us the best price we will move the market share to
you We will move it effectively Wersquoll exclude the other productsrdquo (Miller and
Wehrwein 2015)6
Consistent with the market dynamics described by Garthwaite and Morton (2017) the
exclusion threat increases the PBMrsquos ability to shift consumers across rival products
strengthening their bargaining position In its marketing analysis CVS explicitly argues
that ldquo[f]ormulary is foundational to cost controlrdquo and suggests that the introduction of
formulary exclusions in 2012 led to lower price growth for pharmaceuticals7
In Appendix A we provide a simple model that formalizes how drug exclusion policies
impact drug firmsrsquo RampD decisions In this model a potential pharmaceutical entrant faces
a choice invest in developing a drug for a ldquonewrdquo drug classmdashthat is one in which no prior
treatments existmdashor invest in developing a drug for an ldquooldrdquo class in which there is an
incumbent therapy available In the absence of exclusions PBMs are required to provide
coverage for all approved drugs if successful a pharmaceutical entrant would become a
monopolist in the new drug class and a duopolist in the old drug class We model closed
formularies as permitting exclusions when a similar substitute is available In the old drug
class the two firms bid on rebate payments to the PBM in order to win exclusive formulary
coverage Exclusions therefore reduce drug revenues in the old drug class where entrants face
exclusion risk and will pay high rebates to the PBM if they succeed in obtaining formulary
coverage These reduced revenues lower the returns to investing RampD dollars into the old
drug class without changing the returns to investing in the new class Our model predicts
that we should see a relative drop in new drug candidates entering markets in which existing
therapies are already available
The welfare implications of this change in drug development incentives are theoretically
ambiguous First losses to pharmaceutical firms can be cast as gains to the PBMs in the
form of higher rebates If PBMs pass some of these cost savings onto consumers then
exclusion policies create a tradeoff between incentives for future innovation and
6In line with this description observers note that within a therapeutic class PBMs are increasinglyselecting a single brand for coverage (Cournoyer and Blandford 2016)
7Source CVSHealth Payor Solutions Insights website httpspayorsolutionscvshealthcom
insightsconsumer-transparency Accessed June 15 2020
7
affordability of current prescription drug coverage Second an overall decrease in drug
development can be welfare enhancing if business stealing effects dominate the benefits of
expanding treatment options (Mankiw and Whinston 1986) This is a possibility in our
setting especially if foregone drug candidates would have otherwise been entrants into
already crowded therapeutic areas
Finally another welfare-relevant consideration is how RampD investment is allocated within
pharmaceutical firms In our model the potential entrant chooses between investing in
the old versus the new class This is likely to be the case when firms face financial or
organizational frictions that limit their ability to invest in all net present value (NPV)
positive projects Under this assumption the introduction of closed formularies generates a
reallocation of RampD dollars away from older drug classes toward newer classes An alternative
model however would have firms investing in all drug candidates with a positive NPV In
this case the introduction of closed formularies would instead lead to an aggregate decline
in RampD investments since exclusions decrease the NPV of investments in older classes but
have no effect in newer classes Our empirical strategy allows us to identify only the relative
change in development across drug classes making it difficult to distinguish between these
possibilities Section 6 discusses the welfare implications and limitations of our analysis in
more depth
3 Data
Our analysis focuses on tracking changes in drug development activity over time and
across drug classes We have assembled four primary data sources (1) PBM formulary
exclusion lists (2) time-varying characteristics of drug markets (3) prescription drug sales
volume and (4) new drug development activity The data we draw from each of these sources
is summarized briefly below
1 Formulary Exclusions We hand-collected data on formulary exclusions published
by CVS Caremark Express Scripts and OptumRX through 2017 Together these
firms account for approximately 70 of the PBM market8 Our data cover ldquostandardrdquo
8When it first closed its formulary in 2012 CVS had a 20 share of the PBM market (Lopez 2018)Express Scripts followed suit in 2014 when its market share was 338 (Health Strategies Group 2015)
8
formulary exclusions these exclusions apply to most health plans administered by a
particular PBM Insurers may elect to provide more expansive coverage by opting out
of the standard formulary but we do not have information on exclusions within these
custom plans9 We match the excluded drugs to their 4-digit Anatomical Therapeutic
Chemical (ATC4) drug class using the First Data Bank data (described below) These
exclusions form the basis of our analysis
2 First Data Bank In order to better understand the characteristics of drugs and drug
classes that experience exclusions we collect data on drug markets and drug pricing
from First Data Bank (FDB) FDB is a commercial dataset primarily marketed to
healthcare organizations that manage formularies It contains information on a drugrsquos
ATC4 classification pricing and the existence of generic substitutes We use this
information to construct additional data on drug markets at the ATC4 level the
number of approved branded and generic drugs in an ATC4 class and measures of
the price of already approved branded and generic drugs10 We use these variables to
predict which drug classes face exclusion risk and as control variables to account for
time-varying market attributes in certain specifications
3 Medicare Part D Data To establish that formulary placement affects drug
demand we document the impact of exclusions on a drugrsquos insurance claim volume in
Section 42 Because sales volume is not measured by FDB we turn to publicly
available data on annual Medicare Part D claims volume by drug11 Most Medicare
Part D plan sponsors contract with PBMs for rebate negotiation and benefit
Finally OptumRx began publishing formulary exclusions in 2016 when its market share was 22 (Fein2017)
9Custom plans are less common because they are likely to be substantially more expensive For exampleon its payer-facing website CVS encourages insurers to choose its standard (closed) formulary for anestimated 29 savings in per member per month drug costs (Brennan 2017)
10We use unit price provided by the manufacturer to FDB Specifically wholesale acquisition unitcost (manufacturerrsquos published catalog or list price to wholesalers) was used where available If thiswas unavailable suggested wholesale unit price (manufacturerrsquos suggested price from wholesalers to theircustomers) was used If this was unavailable then direct unit price (manufacturerrsquos published catalogue orlist price to non-wholesalers) was used Unit refers to the NCPDP billing unit of the product where a unitis defined as a gram each or milliliter
11This data is published annually by the Center for Medicare and Medicaid Studies We accessed it online athttpswwwcmsgovResearch-Statistics-Data-and-SystemsStatistics-Trends-and-Reports
Information-on-Prescription-DrugsHistorical_Data in November 2019
9
management (Government Accountability Office 2019) and many Part D plans
feature closed formularies (Hoadley et al 2011) making Medicare Part D a suitable
context to study the impact of exclusions This data is available from 2012-2017 and
reports the annual number of claims for all drugs with at least 11 claims
4 Cortellis Investigational Drugs Our main analysis studies the impact of formulary
exclusions on drug development We obtain data on pipeline drugs including both
small molecule and biologic drugs from Clarivate Analyticsrsquo Cortellis Investigational
Drugs database (Cortellis) Cortellis tracks drug candidates using data it compiles
from public records company documents press releases financial filings clinical trial
registries and FDA submissions Drug candidates typically enter the Cortellis database
when they enter preclinical development this is often when a drug candidate will
appear in patents or in other documents describing a firmrsquos research pipeline Similarly
because all firms are required to apply for and receive FDA approval to begin human
clinical trials Cortellis has near complete coverage of drug candidates that advance
into human testing
Using Cortellis we track each drugrsquos US-based development across five stages
pre-clinical development phase 1 trials phase 2 trials phase 3 trials and launch
Our primary outcome is the total number of drug candidates within a class that
entered any stage of development each year 12 Table 1 Panel A reports the summary
statistics of development activity across different stages
Throughout most of the paper our unit of analysis is a narrowly defined drug class
following the Anatomical Therapeutic Chemical (ATC) classification system ATC codes
are used to organize medicinal compounds we use an ATC4 (four-digit) level classification
which identifies chemical subgroups that share common therapeutic and pharmacological
properties
Appendix Table A1 lists several examples of ATC4 designations For example diabetes
drugs fall into 3 distinct ATC4 categories depending on whether the drug is an insulin or
12In cases where we observe a drug in development at a later stage without a recorded date for priordevelopment stages we fill in the earlier stage date to equal the subsequent recorded stage Because theFDA requires each new drug to move through each phase before receiving approval seeing a drug at a laterstage in development is strong evidence that it previously moved through the earlier stages We never filldrug development ldquoforwardrdquo because many drug candidates fail to progress at each stage
10
insulin analogue (ATC4 A10A) a non-insulin blood glucose lowering drug (A10B) or other
diabetes drug (A10X) Cardiovascular drugs span 28 distinct ATC4 categories Narrowing in
on the subgroup of cardiovascular drugs that are beta blocking agents Appendix Table A1
reports 6 distinct ATC4 classes for beta blockers distinguishing whether the beta blocker is
present in isolation or in combination with various other drug types
We interpret an ATC4 drug class as a ldquomarketrdquo where drugs within the class will typically
be partial substitutes for one another We drop ATC4 categories that are not categorized as
drugs in FDB such as medical supplies We also restrict to ATC4 categories that contain
at least one branded drug on the market as of 2011 Finally we drop ATC4 categories with
missing data on prices or the availability of generic and branded drugs as measured in FDB
and ATC4s with missing data on prescription volume as measured in the 2011 Medicare
Expenditure Panel Survey as we need to be able to predict exclusion risk as a function
of these market attributes for our main specification After making these restrictions our
primary sample has 127 ATC4 classes Table 1 Panel B shows the summary statistics of
various market characteristics for our sample ATC4s separately based on whether or not
they experienced exclusions in 2012 or 2013
4 Formulary Exclusions
41 Descriptive statistics
Figure 2 illustrates the rise of drug exclusions over time and across PBMs CVS is the
first major PBM to implement a closed formulary starting with the exclusion of 38 drugs
in 2012 CVS advertises on its payer-facing website ldquo[W]e were the first pharmacy benefit
managerto remove certain high-cost drugs from our Standard Formulary and give
preference to lower-cost clinically appropriate alternatives leading to cost savings for
clientsrdquo13 Over the next six years CVS oversaw a a sustained expansion of exclusions
with more drugs being added to its exclusion lists each year Express Scripts introduced its
exclusion list in 2014 followed by OptumRx in 2016 By 2017 a total of 300 drugs were
ever excluded by at least one of the three major PBMs 75 of these excluded drugs had
13httpspayorsolutionscvshealthcomprograms-and-servicescost-managementformulary-management
11
no molecularly equivalent generic substitute on the market Figure 3 plots exclusions by
disease category at the drug level Each bubble represents a disease category in a year and
the size of the bubble reflects the number of drugs excluded by at least one PBM in that
category From the outset diabetes drugs have consistently been the most frequently
excluded Other diseases with high numbers of exclusions include cardiovascular
endocrine and respiratory diseases
The introduction of exclusion policies represented a major shift in market facing drug
manufacturers with the scope and frequency of exclusions expanding steadily over time For
instance PBMs began to contravene a prior ldquogentlemenrsquos agreementrdquo to keep cancer drugs
off exclusion lists (The Doctor-Patient Rights Project 2017) Starting in 2016 CVS and
Express Scripts excluded fluorouracil creams (which treat skin cancer and pre-cancer skin
conditions) In 2017 CVS expanded its exclusion list to oncology drugs excluding drugs
such as Gleevec and Tasigna (which treat chronic myelogenous leukemia) and Nilandron and
Xtandi (which treat prostate cancer)14
In the remainder of this section we analyze the effect of exclusions on drug sales and
describe how exclusion risk differs across markets as defined by drug therapeutic classes
42 The impact of exclusions on drug sales
A PBMrsquos formulary choice has a substantial impact on patientsrsquo drug utilization A
large body of work has documented that patient demand for drugs is elastic to the
out-of-pocket price suggesting that eliminating insurance coverage for excluded drugs will
suppress demand15 Recent evidence from plans that switch to the restrictive CVS
formulary find evidence of therapy discontinuation for patients on excluded drugs
(Shirneshan et al 2016) While CVS was the first PBM to implement a closed formulary
in 2012 an older literature examined individual insurance planrsquos formulary choices These
earlier formulary coverage decisions affect many fewer patients than the national PBM
14Coverage of cancer drugs was mandated for privately administered Medicare Part D plans but was notmandated for private plans in general When CVS began excluding cancer drugs in 2017 the PBM stipulatedthat this restriction would only affect new patients (The Doctor-Patient Rights Project 2017)
15For example the following papers find evidence of negative price elasticities for drugs as a function ofinsurance cost-sharing Abaluck et al (2018) Einav et al (2017) Choudhry et al (2011) Thiebaud et al(2008) Tamblyn et al (2001)
12
formularies we study here but are likely to have similar effects on the drug choices of
enrolled patients This research has found that closed formularies induce patients to switch
away from excluded drugs (Motheral and Henderson 1999 Huskamp et al 2003) and
reduced healthcare spending (Chambers et al 2016) Further doctors who treat many
patients insured with restrictive formularies are less likely to prescribe excluded drugs even
to patients with open formulary insurance plans (Wang and Pauly 2005)
To test whether these patterns hold in our setting we investigate the link between PBM
formulary exclusions and drug sales using data on prescription drug claims from Medicare
Part D from 2012-2017 We estimate the impact of exclusions on claims for drugs that were
already on the market and had Part D claims using a model that includes drug fixed effects
and controls for year and time-varying market characteristics Because Medicare Part D
regulation over this period disallowed formulary exclusions from six protected drug classes
this analysis studies the 161 excluded drugs that are not in a protected class16
The distribution of Part D claims per drug is highly right-skewed Appendix Table A2
reports that the mean number of annual Part D claims per drug is 158298 for non-excluded
drugs while the median is 4357 Drugs that eventually receive an exclusion have an even
higher mean (454433) consistent with the evidence from our FDB analysis that exclusions
typically target high-volume drugs Due to the high variance of prescription volume our
primary outcome in the regression analysis is the natural log of the drugrsquos claim count
Regression results reported in Table 2 find that each additional excluding PBM
decreases a drugrsquos prescription volume by 24 (eminus0274 minus 1) This coefficient is identified
from within-drug changes in formulary exclusion status since the estimating equation
includes drug-specific fixed effects to control for the drugrsquos baseline popularity and as well
as drug age times calendar year fixed effects to capture lifecycle patterns Additional controls
for time-varying demand for the drug class captured with ATC4 X calendar year fixed
effects do not attenuate the estimate these results are reported in Column 2 As an
alternative outcome we consider the impact of exclusions on the excluded drugrsquos market
share (ie share of total Medicare Part D claims) within the ATC4 class We find very
16The protected classes are antidepressants antipsychotics anticonvulsants antineoplastic agentsantiretroviral agents and immunosupressants Of the 181 excluded drugs prescribed in Part D only 20fall into these classes
13
similar results each additional excluding PBM reduces a drugrsquos market share by 20
percent
This analysis of exclusion impact will tend to overstate the magnitude of these effects on
excluded drugs if patients substitute from excluded drugs to non-excluded drugs within the
same ATC4 category These spillovers will inflate prescription volume in the ldquocontrol grouprdquo
of non-excluded drugs increasing the difference between excluded and non-excluded drugs
We take these results as informative of the direction of exclusion impact but measuring
the full set of cross-drug substitution elasticities (which are likely to be very heterogeneous
across drug classes) is beyond the scope of this project Another limitation of this analysis
is that it cannot measure prescription drug sales that are not claimed in Medicare Part
D if formulary exclusions leads patients to pay fully out-of-pocket for the drugs without
requesting insurance coverage we will not have a record of it in our data
In Appendix Table A3 we investigate whether the immediate exclusion of newly released
drugs depresses drug diffusion relative to the diffusion of other drugs in the same ATC4 class
These estimates suggest that formulary exclusion depresses prescription volume of new drugs
by 68 (eminus1147 minus 1) although the estimates are noisier because they focus on a small set of
13 drugs that face immediate exclusion by at least one PBM within 1 year of FDA approval
43 Predictors of formulary exclusion risk
Twelve percent of ATC4 drug classes experienced exclusions in 2012 and 2013 the first
two years of the closed formulary policy Having provided evidence that exclusions harm
revenues we next examine the factors that predict exclusion risk Prior descriptions of
PBMsrsquo exclusion strategy have for example argued that exclusions target drugs that have
escalated price increases limited clinical evidence or target an overly broad patient
population (Cournoyer and Blandford 2016)
To examine which characteristics predict exclusions at the drug-market level we regress
an indicator for whether a drug class experiences exclusions in 2012 or 2013 on various ATC4
level market characteristics Using data from FDB described in Section 3 we construct the
following measures of potential predictors of exclusion risk for 127 ACT4 classes measures
of the availability of therapeutic alternatives such as the number of existing branded drugs
approved within an ATC4 the number of existing generics within the same class or the
14
number of finer-grained ATC7 subclasses (which indicate specific chemical substances) We
also measure the expected size of the patient population by using information on total
prescription volume across all drugs in a given ATC4 class this information is calculated
from the 2011 Medicare Expenditure Panel Survey Finally we collect data on the price of
already approved branded and generic drugs keeping in mind that price data do not reflect
the rebates that manufactures often pay to PBMs All of these market characteristics are
from 2011 before the introduction of first exclusions in 2012
Figure 4 plots the coefficients of bivariate linear regressions of exclusion on each drug
class characteristic these regressions estimate how standardized market characteristics
predict the probability of having at least one exclusion in the ATC4 class in 2012 or 2013
We find that drug classes with higher prescription volume and more existing treatment
options (measured as the number of distinct drugs on the market) are more likely to
experience exclusions These patterns are consistent with the contemporaneous analysis of
industry experts Mason Tenaglia vice president of IMS Health described formulary
exclusions as targeting ldquome-too drugsrdquo with multiple therapeutic substitutes (Reinke
2015) In an interview the chief medical officer of Express Scripts echoed this strategy of
targeting me-too drugs and further described a focus on excluding drugs with a larger
number of prescribed patients ldquo[T]herersquos no reason to go after trivial drugs that arenrsquot
going to drive savingsrdquo (Miller and Wehrwein 2015) We find no statistically significant
relationship between drug prices in the class and exclusion risk but because our data does
not measure prices net of rebates these correlations are difficult to interpret
Having shown that these market characteristics have predictive power we use them to
construct an index of an ATC4 drug classrsquos likelihood of facing exclusions To do so we fit a
logistic regression to predict whether a drug class experience exclusions in 2012 or 2013 as a
function of all of the ATC4 market characteristics (measured as of 2011) For this regression
the unit of observation is a single ATC4 drug class c We then use the regressionrsquos fitted
values to construct the predicted exclusion risk of each ATC4 Pr(Excluded)c Appendix
Table A4 shows the results of this exercise and Appendix Figure A1 plots the resulting
distribution of predicted exclusions
The goal of our analysis is to understand how exclusion risk affects upstream RampD
decisions Our theory predicts that changes to upstream investments are shaped by the
15
expected net present value (NPV) of projects in a drug class exclusions can decrease NPV
either because firms anticipate that the new drug may be excluded or because firms
anticipate that they will have to pay high rebates in order to avoid exclusions Our primary
analysis defines treatment exposure as predicted exclusion risk in order to consider the
impact of exclusions not only on drug classes with realized exclusions but also on classes
with similar market characteristics where high rebates may be paid to avoid exclusions
We test whether our measure of exclusion risk has empirical validity by asking whether
predicted exclusion risk fit from 2012 and 2013 exclusion lists correlates with subsequent
exclusions in 2014-2017 Table 3 shows that our measure of exclusion risk has out-of-sample
prediction power In Column 1 we show that a 1 standard deviation increase in exclusion risk
(estimated based on 2012 and 2013 exclusions) correlates with a 17 percent point increase in
the likelihood that an ATC4 class experiences exclusions in later periods In Column 2 we
repeat this exercise restricting to the subset of ATC4s that do not experience any exclusions
during the first wave of exclusions in 2012 and 2013 This set includes drug classes that are
actually at a very low risk of experiencing exclusions (in which case we would not expect them
to see future exclusions) as well as those that were at high risk but which were able to avoid
early exclusions perhaps by offering higher rebates Among this set of drug classes with no
early exclusions our measure of predicted exclusion risk is still significantly correlated with
future exclusions This result suggests that exclusions followed a consistent and predictable
pattern over our study period and that market characteristics can form valid out-of-sample
predictions of at-risk drug classes
5 The Impact of Exclusion Risk on Subsequent Drug
Development
In our model we predict that exclusion risk decreases the NPV of projects in more
affected drug classes and therefore dampens upstream investments in these areas This
logic is echoed by pharmaceutical executives AstroZeneca leaders for example describe
meeting ldquopayer criteria required for global reimbursementrdquo as a crucial input into their
decisions about RampD investment (Morgan et al 2018) In this section we use our measure
16
of drug-class exclusion risk to study how upstream firmsrsquo investment strategies respond to
exclusion risk
51 Empirical strategy
Our main specification compares drug development behavior across ATC4 drug classes
that vary in their ex-ante risk of exclusion before and after the rise of closed formulary
policies
Developmentct = β1Pr(Excluded)c times I(Year ge 2012) + Xγ + δc + δt + ect (1)
In Equation (1) Developmentct refers to various measures of the number of new drug
candidates in drug class c at time t (measured annually) We define a drug classrsquos extent of
treatment using Pr(Excluded)c described above in Section 43 In Section 53 we show
that our results are robust to an alternative definition of treatment that uses data on
realized exclusions rather than exclusion risk
To interpret our primary coefficient of interest β1 as the causal impact of drug exclusions
on development activity we must assume that development activity in ATC4s with different
predicted degrees of exclusion risk would have followed parallel trends in the absence of
formulary exclusions We use event study graphs over a 5 year pre-period to assess the
plausibility of this assumption These graphs are based on a modified version of Equation
(1) which replaces the single indicator variable for being in the post period (I(Year ge 2012))
with a vector of indicator variables for each year before and after the introduction of PBM
exclusion lists in 2012
52 Main results
We begin by studying how trends in drug development activity vary across ATC4
classes as a function of formulary exclusion risk Figure 5 shows the
difference-in-differences results in an event study framework There appears to be little
difference in drug development across excluded and non-excluded ATC4s prior to 2011
suggesting that the parallel trends assumption is supported in the pre-period Development
17
activity across excluded and non-excluded drug classes begins to diverge in 2012 and these
differences grow until 2017 the last full year of our sample
Table 4 presents our main regression results The outcome is the total number of drug
candidates within a class that entered any stage of development each year In Column 1
we estimate that a one standard deviation increase in the risk that the class has formulary
exclusions leads to 36 fewer advanced drug candidates each year from a mean of 306
advancing candidates17 In Column 2 we include controls for a variety of time-varying
market conditions at the ATC4 class level the number of approved drugs in that class
the number of approved generic drugs the mean price of branded drugs minus the mean
price of generic drugs and the number of ATC7 subclasses (which indicate specific chemical
substances) with approved drugs Adding these controls lowers our estimate slightly from
36 to 33 fewer drug candidates per 1 standard deviation increase in class exclusion risk We
find similar results after log-transforming the outcome suggesting that development activity
declines by 5-6 in excluded classes for every 1 standard deviation increase in class exclusion
risk as reported in columns 3 and 4
Table 5 decomposes the total effect by drug development stage In Table 5 we find the
largest percent declines for earlier stage drugs Exponentiating the reported coefficients we
estimate a 7 decline in new pre-clinical candidates for every 1 standard deviation increase
in the probability that the class has exclusions as compared to a decline in advancing
candidates of 5 in Phase 1 5 in Phase 2 and 4 in Phase 3 We find consistent results
when measuring the outcome in levels (rather than logs) and report these results in Appendix
Table A5 and Appendix Figure A2 The patterns in the event study difference-in-differences
plots are very similar across development stages
We interpret these findings in the context of the drug development process where Phase
1 trials generally assess safety Phase 2 trials provide preliminary evidence of efficacy and
Phase 3 trials are the large-scale expensive trials that firms rely upon to generate data for
FDA approval Of these investment stages Phase 3 trials are the most costly with average
costs estimated over $250 million per drug in 2013 dollars (DiMasi et al 2016) Given that
the marginal cost of continuing to develop a candidate drug remains high through the end of
17As reported in Appendix Figure A1 the standard deviation of the probability the class faces exclusionsis 015 Using the coefficient reported in Table 4 we calculate minus2403 lowast 015 = minus36
18
phase 3 trial stage it is sensible that firms would be more likely to drop drug candidates even
at this relatively late stage Further a drug is more likely to be excluded from formularies if
it offers few benefits relative to existing treatments Phase 2 trials provide the first evidence
of clinical efficacy If a drug shows only marginal promise then a firm concerned about the
possibility of exclusions may choose to end its development efforts rather than committing
to very expensive Phase 3 trials
In contrast we find no effect for new drug launches at the point when a drug has
completed Phase 3 trials the bulk of RampD expenses are already sunk As a result concerns
about coverage would be less likely to impact a firmrsquos launch decisions Over time we would
expect that launches would also fall in affected drug classes as the pipeline narrows but
given the long time lags in bringing a drug through each development stage this effect would
not be immediate
53 Robustness checks
In this section we show that our results are robust to alternative choices for defining
exclusion risk linking drug candidates to drug classes and calculating standard errors
First we show that our results are consistent when we apply an alternative definition of
a drug classrsquos exclusion risk In our primary analysis we use 2011 ATC4 market level
characteristics to predict exclusion risk An alternative approach would be to look at
realized exclusions and ask whether drug classes that actually experienced exclusions saw
reductions in development Appendix Figure A3 and Appendix Table A6 presents results
using a binary definition of treatment (whether or not an ATC4 class actually experienced
an exclusion in 2012 or 2013) and show a similar pattern of results as our main analysis
Second we show that our results are robust to the method we use to match drug
candidates to drug classes In our primary analysis we match drug candidates to ATC4
drug classes using a direct linkage when Cortellis provides it (in 43 of cases) in cases
where direct linking is not possible we rely on indirect linking based on using a drug
candidatersquos area of therapeutic application (ICD9) combined with an ICD9-ATC4
crosswalk Appendix B provides further details on how we linked the drug candidates from
Cortellis to ATC4 classes Appendix Tables A7 and Appendix Figure A4 show that our
19
results are similar when either using only direct linkages (Panel A) or only indirect linkages
(Panel B)
Finally conventional inference can over-reject when the number of treated clusters is
small so we also implement a correction using the wild cluster bootstrap (Cameron et al
2008 Djogbenou et al 2019) In Appendix Table A8 we report 95 confidence intervals
calculated with the wild cluster bootstrap for our main regression results our findings
remain statistically significant In this table we also present robustness to using the
inverse hyperbolic sine function rather than log transformation to better account for ATC4
categories with no development in some years Results are very close to the log
transformed outcomes reported in the main text and remain statistically significant
54 Classifying foregone innovation across drug classes
In this section we describe the drug classes and types of projects that experienced the
greatest declines in RampD as a result of formulary exclusions To assess the decline in drug
development for each ATC4 drug class we compare the number of candidates we predict
would have been developed in the absence of exclusions to the number we predict in the
presence of exclusions This analysis examines how exclusions impact the allocation of
RampD resources across drug classes that vary in their size competitiveness or level of
scientific novelty We focus on allocation across drug classes because our theoretical
framework formalized in Appendix A predicts that exclusions will affect the relative
investments in drug development across classes18
Our analysis is based on the specification reported in Table 4 Column 4 this is our
preferred specification because it controls for a battery of time-varying drug class
observables and generates the most conservative point estimate To measure predicted new
drug candidates in the presence of exclusions we calculate the fitted value prediction of
drug development activity for every year of the post-period To recover the predicted new
drug candidates absent exclusions we repeat this exercise after setting the treatment
variable Pr(Excluded)c times I(Year ge 2012) equal to zero for all observations We use these
18The impact of exclusion policies within a drug class are less obvious while it is possible that exclusionsmay change the characteristics of promoted molecules within a drug class these effects may be smaller andmore difficult to measure Because ATC4 drug classes already represent relatively narrow categories thereis limited scope to change the scientific novelty of investment within the class for example
20
predictions as the basis for calculating the percent decline in development activity
attributable to exclusion risk We then compare the predicted decline in development
activity across several ATC4 drug class characteristics measured before the introduction of
the formulary exclusions
Availability of existing therapies amp market size
For our first counterfactual comparison we divide drug classes into terciles based on the
number of existing therapies as measured by the number of distinct drugs available within
that class as of 2011 Figure 6 Panel A compares predicted drug development activity to the
counterfactual development levels predicted to have occurred absent exclusions Consistent
with our model we see the largest declines in drug classes with more existing therapies
among drug classes in the top tercile of available therapies exclusions depress development
by nearly 8 By contrast exclusions depress development by less than 2 for drug classes
in the bottom tercile of pre-existing therapies This result indicates that formulary exclusions
lead firms to reduce their investments in drugs that are more likely to be incremental entrants
to more crowded therapeutic areas
In Figure 6 Panel B we perform the same analysis splitting drug classes by market size as
measured by the volume of prescriptions filled in 2011 (estimated from the MEPS data) We
find that formulary exclusions disproportionately impact drug development in therapeutic
classes with many patients For drug classes in the top tercile of prescription volume drug
development is predicted to decline by more than 10 after the introduction of formulary
exclusions
Disease category
Next Figure 7 explores the extent of foregone innovation across therapeutic areas To
do so we map ATC4 drug classes into disease categories and calculate the percentage
change in drug development from the counterfactual predicted absent exclusions Our
results indicate that closed formulary policies generated substantial declines in
development across a range of disease classes led by diabetes where we predict more than
a 20 decline in the number of new drug candidates The next set of affected disease
categories predicted to lose 8-10 of new drug candidates includes cardiovascular
21
respiratory autonomic amp central nervous system and paininflammation related
conditions Meanwhile we find little evidence of significant declines in development
activity for many acute diseases such as infections viruses and cancers
This set of evidence is consistent with the hypothesis that closed formulary policies reduce
firmsrsquo incentives to develop additional treatments in large markets where new drugs may
face a high likelihood of exclusion This creates a tension while foregone innovations are
likely to be incremental in the sense that the most impacted drug classes already have many
existing treatment options they are also likely to have benefited more patients because the
most impacted drug classes also had the largest base of prescribed patients
Scientific novelty
Finally we examine the relative effect that formulary exclusions had on RampD investment
across areas with differing measures of scientific novelty To assess scientific novelty we match
drug candidates within an ATC4 class to the scientific articles cited by their underlying
patents making use of patent-to-science linkages created by Marx and Fuegi (2020) We
then create two measures of the scientific novelty of research in a drug class (averaged
over 2007-2011) First we calculate how often patents in a drug class cited recent science
defined as articles under 5 years old as of 2011 In Panel A of Figure 8 we find that
exclusions generate twice as large a decline in RampD in drug classes that were rarely citing
recent science in the policy pre-period compared to those that were (8 vs 4 predicted
declines respectively)
Second we measure how ldquodisruptiverdquo research in a drug class is likely to be To do
this for each of the scientific article cited by the underlying patents of the drugs we follow
Funk and Owen-Smith (2017) and measure how many of a focal articlersquos forward citations
also cite the focal articlersquos backward citations This ldquodisruptivenessrdquo index ranging from -1
(consolidating) to 1 (destabilizing) captures the idea that a research article that represents
a paradigm shift will generate forward citations that will not cite the breakthrough articlersquos
backward citations In contrast a review article that consolidates a knowledge domain will
receive forward citations that will also cite the same citations as the review article In
Figure 8 Panel B we report predicted changes in drug development as a function of how
22
disruptive the patents underlying the drugs were in this class over the pre-period (proxied by
the average disruptiveness index of the cited science) Formulary exclusions spurred larger
reductions in development in drug classes citing the least disruptive research
Together these results suggest that exclusions encouraged a relative shift in RampD dollars
toward investment in drug classes engaging with more recent novel science
6 Discussion
So far we have shown that closed formulary policies lead pharmaceutical firms to invest
less in RampD for areas more likely to face exclusions This response results in a shift in
development across drug classes away from large markets (in terms of available therapies and
prescription volume) and common disease classes treating chronic conditions such as heart
diseases and diabetes Moreover our evidence also indicates that RampD effort shifts away
from drug classes with older and less disruptive underlying science Overall these results
suggest that exclusions direct upstream research away from more incremental treatments
As discussed in Section 2 the welfare implications of this behavior are theoretically
ambiguous There are two key considerations First exclusions reduced development of
drugs for crowded markets what is the value of this sort of forgone incremental innovation
Second when investment declines in high-exclusion risk classes relative to other classes does
this contribute to an aggregate decline in pharmaceutical RampD or is some of the investment
redirected to innovation in other drug classes within the sector
Regarding the first question assessing the value of late entrants to a drug class is difficult
because even incremental drugs can reduce side effects improve compliance by being easier to
take or generate price competition and improve access (Regnier 2013 Hult 2014) Further
even if the new drugs never make it to market incremental drug candidates may generate
scientific spillovers leading to further innovation over a longer time horizon
Second our empirical approach cannot test for aggregate changes in development activity
which would be identified solely by time-series trends By estimating equation (1) we isolate
the relative change in development activity in drug categories with exclusions compared to
the changes in non-excluded categories These differences could come from a combination of
23
absolute declines in RampD for excluded classes or it could come from a shift in development
from classes with high- to low-exclusion risk
Absent financial frictions we would expect that the introduction of closed formularies
would decrease the expected value of investments in drug classes at high risk of facing
exclusions but should have little to no impact on the net present value for drugs in classes
at low risk of facing exclusions In such a world we would interpret our results as leading
to an absolute decline in drug RampD However a large finance literature has shown both
theoretically and empirically that even publicly traded firms often behave as though they
face financial frictions (Myers and Majluf 1984 Froot et al 1993 Brown et al 2009) This
is especially true in pharmaceuticals and other RampD intensive sectors where intellectual
property is more difficult to collateralize or value (Fernandez et al 2012 Kerr and Nanda
2015 Krieger et al 2019) For example it is common for firms to set their RampD budgets
by allocating a percentage of revenues from the previous year
In the event that exclusion policies generate some degree of reallocation away from
older drug areas toward newer ones a welfare analysis would need to take into account the
relative value of research in these areas In our case this would require weighing the value
of additional incremental innovations aimed at larger markets against the value of
earlier-in-class innovations for less common conditions19
7 Conclusion
Amid rising public pressure government and private payers are looking for ways to
contain drug prices while maintaining incentives for innovation In this paper we study how
the design of downstream insurance policiesmdashnamely those related to drug coveragemdashimpact
upstream investments in pharmaceutical RampD
We find that drug classes facing a one standard deviation greater risk of experiencing
exclusions see a 5 decline in drug development activity following the introduction of
closed formulary policies These declines in development activity occur at each stage of the
19Moreover if exclusion policies have positive spillovers on development in non-excluded categories (egdue to within-firm investment reallocation) our estimates will tend to overstate the magnitude of the totaldecline in RampD investment in excluded categories By contrast if exclusion policies have negative spilloverson non-excluded categories (eg due to a fall in revenue reducing available development dollar) our estimateswill tend to understate the magnitude of the investment decline in excluded categories
24
development process from pre-clinical through Phase 3 trials In aggregate our results
suggest that PBMs wielded the threat of formulary exclusion in a way that shifted the
relative allocation of RampD effort away from incremental treatments for common conditions
such as heart diseases and diabetes as well as away from drug classes with many existing
therapies on the market and older less novel underlying science
Taken together our results provide strong evidence that insurance design influences
pharmaceutical RampD Leaving aside the specifics of which drug classes faced greater
exclusion risk in our setting an overarching point that our paper makes is that
pharmaceutical firms anticipate downstream payment policies and shift their upstream
RampD efforts accordingly Viewed from a public policy perspective this finding opens the
door for insurance design to be included as a part of the broader toolkit that policymakers
use to encourage and direct investments in innovation In particular public policy related
to innovation has almost exclusively focused on ways that the public sector can directly
influence the returns to RampD such as through patents tax credits research funding or
other direct subsidies Our results suggest that in addition managers and policymakers
can use targeted coverage limitationsmdashfor example those generated by value-based
pricingmdashto shift RampD efforts away from drugs with limited incremental clinical value
The limitations of our analysis suggest several important directions for future work First
our identification strategy allows us to document a relative decline in RampD in high exclusion
risk categories more research is needed in order to assess the extent to which policies that
limit the profitability of a specific class of drugs generate aggregate declines in RampD or
induce reallocations toward other areas Second it remains a challenge to place an accurate
value on the innovation that is forgone as a result of the exclusion practices we study While
we focus on the availability of existing treatments prescription volume and measures of
scientific novelty these are not complete descriptions of the clinical and scientific importance
of potentially foregone drugs Third because we cannot directly observe drug price rebates
we cannot directly quantify the reductions in revenue precipitated by formulary exclusion
policies Finally as formulary exclusion policies continue to expandmdashtoward smaller drug
markets and those in which there are fewer therapeutic substitutesmdashadditional research will
be needed to see if our findings extrapolate to those settings
25
References
Abaluck J J Gruber and A Swanson (2018) Prescription drug use under medicare
part d A linear model of nonlinear budget sets Journal of Public Economics 164
106ndash138
Acemoglu D P Aghion L Bursztyn and D Hemous (2012) The environment and
directed technical change American Economic Review 102 (1) 131ndash66
Acemoglu D D Cutler A Finkelstein and J Linn (2006) Did medicare induce
pharmaceutical innovation American Economic Review 96 (2) 103ndash107
Acemoglu D and J Linn (2004) Market size in innovation theory and evidence from
the pharmaceutical industry The Quarterly Journal of Economics 119 (3) 1049ndash1090
Aghion P A Dechezlepretre D Hemous R Martin and J Van Reenen (2016) Carbon
taxes path dependency and directed technical change Evidence from the auto
industry Journal of Political Economy 124 (1) 1ndash51
Bagley N A Chandra and A Frakt (2015) Correcting Signals for Innovation in Health
Care Brookings Institution
Blume-Kohout M E and N Sood (2013) Market size and innovation Effects of Medicare
Part D on pharmaceutical research and development Journal of Public Economics 97
327ndash336
Brennan T (2017 August) 2018 Formulary strategy Technical report CVS Health
Payor Solutions Online at httpspayorsolutionscvshealthcominsights
2018-formulary-strategy
Brown J R S M Fazzari and B C Petersen (2009) Financing innovation and growth
Cash flow external equity and the 1990s rampd boom The Journal of Finance 64 (1)
151ndash185
Budish E B N Roin and H Williams (2015) Do firms underinvest in long-term
research Evidence from cancer clinical trials American Economic Review 105 (7)
2044ndash85
26
Cameron A C J B Gelbach and D L Miller (2008) Bootstrap-based improvements
for inference with clustered errors The Review of Economics and Statistics 90 (3)
414ndash427
Celgene (2016 September) Prescription plan exclusion lists grow
at patientsrsquo expense Online at httpswwwcelgenecom
patient-prescription-plan-exclusion-lists-grow
Chambers J D P B Rane and P J Neumann (2016) The impact of formulary drug
exclusion policies on patients and healthcare costs Am J Manag Care 22 (8) 524ndash531
Choudhry N K J Avorn R J Glynn E M Antman S Schneeweiss M Toscano
L Reisman J Fernandes C Spettell J L Lee et al (2011) Full coverage
for preventive medications after myocardial infarction New England Journal of
Medicine 365 (22) 2088ndash2097
Claxton G M Rae M Long A Damico G Foster and H Whitmore (2017) Employer
health benefits survey Kaiser Family Foundation and Health Research amp Educational
Trust
Clemens J (2013 December) The effect of US health insurance expansions on medical
innovation Working Paper 19761 National Bureau of Economic Research
Clemens J and P Rogers (2020 January) Demand shocks procurement policies and
the nature of medical innovation Evidence from wartime prosthetic device patents
Working Paper 26679 National Bureau of Economic Research
Congressional Budget Office (2007 April) Medicare prescription drug price negotiation
act of 2007 Technical report Congressional Budget Office Cost Estimate Online
at httpswwwcbogovsitesdefaultfiles110th-congress-2007-2008
costestimates30pdf
Cournoyer A and L Blandford (2016 October) Formulary exclusion
lists create challenges for pharma and payers alike Journal of Clinical
Pathways httpswwwjournalofclinicalpathwayscomarticle
formulary-exclusion-lists-create-challenges-pharma-and-payers-alike
27
DiMasi J A H G Grabowski and R W Hansen (2016) Innovation in
the pharmaceutical industry new estimates of RampD costs Journal of Health
Economics 47 20ndash33
Dixit A (1979) A model of duopoly suggesting a theory of entry barriers The Bell
Journal of Economics 20ndash32
Djogbenou A A J G MacKinnon and M Oslash Nielsen (2019) Asymptotic theory
and wild bootstrap inference with clustered errors Journal of Econometrics 212 (2)
393ndash412
Dranove D C Garthwaite and M I Hermosilla (2020 May) Expected profits and the
scientific novelty of innovation Working Paper 27093 National Bureau of Economic
Research
Dubois P O De Mouzon F Scott-Morton and P Seabright (2015) Market size and
pharmaceutical innovation The RAND Journal of Economics 46 (4) 844ndash871
Einav L A Finkelstein and P Schrimpf (2017) Bunching at the kink implications for
spending responses to health insurance contracts Journal of Public Economics 146
27ndash40
Fein A J (2017 December) The CVS-Aetna deal Five industry and drug
channel implications Technical report Drug Channels Online at httpswww
drugchannelsnet201712the-cvs-aetna-deal-five-industry-andhtml
Fernandez J-M R M Stein and A W Lo (2012 10) Commercializing biomedical
research through securitization techniques Nature Biotechnology 30 (10) 964ndash975
Filzmoser P A Eisl and F Endel (2009) Atc-icd Determination of the reliability for
predicting the icd code from the atc code
Finkelstein A (2004) Static and dynamic effects of health policy Evidence from the
vaccine industry The Quarterly Journal of Economics 119 (2) 527ndash564
Frank R G and R J Zeckhauser (2018 January) High-priced drugs in medicare part
d Diagnosis and potential prescription Working Paper 24240 National Bureau of
Economic Research
28
Froot K A D S Scharfstein and J C Stein (1993 December) Risk Management
Coordinating Corporate Investment and Financing Policies Journal of Finance 48 (5)
1629ndash58
Funk R J and J Owen-Smith (2017) A dynamic network measure of technological
change Management Science 63 (3) 791ndash817
Garber A M C I Jones and P Romer (2006) Insurance and incentives for medical
innovation In Forum for Health Economics amp Policy Volume 9 De Gruyter
Garthwaite C and F S Morton (2017) Perverse market incentives encourage
high prescription drug prices ProMarket Blog Post httpspromarketorg
perversemarket-incentives-encourage-high-prescription-drug-prices
Government Accountability Office (2019 July) Medicare Part D Use of Pharmacy Benefit
Managers and Efforts to Manage Drug Expenditures and Utilization GAO-19-498
httpswwwgaogovassets710700259pdf
Health Strategies Group (2015) 2015 Pharmacy benefit managers research agenda
Technical report httpswwwhealthstrategiescomsitesdefaultfiles
agendas2015_PBM_Research_Agenda_RA_110714pdf
Hoadley J L Summer E Hargrave J Cubanski and T Neuman (2011) Analysis of
medicare prescription drug plans in 2011 and key trends since 2006 Kaiser Family
Foundation Issue Brief The Henry J Kaiser Family Foundation
Hult K J (2014) Incremental innovation and pharmacuetical productivity Technical
report Health Strategies Group
Huskamp H A A M Epstein and D Blumenthal (2003) The impact of a national
prescription drug formulary on prices market share and spending Lessons for
Medicare Health Affairs 22 (3) 149ndash158
Kakani P M Chernew and A Chandra (2020) Rebates in the pharmaceutical industry
Evidence from medicines sold in retail pharmacies in the us Technical report National
Bureau of Economic Research
Kerr W R and R Nanda (2015) Financing innovation Annual Review of Financial
Economics 7 (1) 445ndash462
29
Krieger J D Li and D Papanikolaou (2017) Developing novel drugs Available at SSRN
3095246
Krieger J D Li and D Papanikolaou (2019) Missing novelty in drug development
Technical report National Bureau of Economic Research
Kyle M K and A M McGahan (2012) Investments in pharmaceuticals before and after
TRIPS Review of Economics and Statistics 94 (4) 1157ndash1172
Lakdawalla D and N Sood (2009) Innovation and the welfare effects of public drug
insurance Journal of public economics 93 (3-4) 541ndash548
Lopez L (2018 march) What CVS is doing to mom-and-pop pharmacies in the US
will make your blood boil Business Insider httpswwwbusinessinsidercom
cvs-squeezing-us-mom-and-pop-pharmacies-out-of-business-2018-3
Lopez L (2019 June) States are starting to stand up to rsquothe new big tobaccorsquo
because Washington wonrsquot Business Insider httpswwwbusinessinsidercom
states-tackling-drug-prices-with-pbm-legislation-2017-6
Mankiw N G and M D Whinston (1986) Free entry and social inefficiency The RAND
Journal of Economics 48ndash58
Marx M and A Fuegi (2020 April) Reliance on science Worldwide front-page patent
citations to scientific articles Strategic Management Journal
Miller S and P Wehrwein (2015) A conversation with Steve Miller MD Come in and
talk with us pharma Managed care 24 (4) 27ndash8
Morgan P D G Brown S Lennard M J Anderton J C Barrett U Eriksson
M Fidock B Hamren A Johnson R E March et al (2018) Impact of a
five-dimensional framework on RampD productivity at AstraZeneca Nature Reviews
Drug Discovery 17 (3) 167
Motheral B R and R Henderson (1999) The effect of a closed formulary on prescription
drug use and costs Inquiry 481ndash491
Myers S C and N S Majluf (1984) Corporate financing and investment decisions
when firms have information that investors do not have Journal of Financial
Economics 13 (2) 187ndash221
30
Regnier S (2013) What is the value of ldquome-toordquo drugs Health Care Management
Science 16 (4) 300ndash313
Reinke T (2015) Pbms just say no to some drugsndashbut not to others Managed Care 24 (4)
24ndash25
Shirneshan E P Kyrychenko O Matlin J Avila T Brennan and W Shrank (2016)
Impact of a transition to more restrictive drug formulary on therapy discontinuation
and medication adherence Journal of Clinical Pharmacy and Therapeutics 41 (1)
64ndash69
Stanford J (2020 July) Price controls would throttle biomedical innovation Wall Street
Journal 41
Tamblyn R R Laprise J A Hanley M Abrahamowicz S Scott N Mayo J Hurley
R Grad E Latimer R Perreault et al (2001) Adverse events associated with
prescription drug cost-sharing among poor and elderly persons JAMA 285 (4)
421ndash429
The Doctor-Patient Rights Project (2017 December) The de-list How formulary
exclusion lists deny patients access to essential care Technical report
httpswwwhealthstrategiescomsitesdefaultfilesagendas2015_
PBM_Research_Agenda_RA_110714pdf
Thiebaud P B V Patel and M B Nichol (2008) The demand for statin The effect of
copay on utilization and compliance Health Economics 17 (1) 83ndash97
Wang Y R and M V Pauly (2005) Spillover effects of restrictive drug formularies
on physician prescribing behavior Evidence from medicaid Journal of Economics amp
Management Strategy 14 (3) 755ndash773
Werble C (2014 September) Pharmacy benefit managers Health policy brief Technical
report Health Affairs
WHO Collaborating Centre for Drug Statistics Methodology (2010) Guidelines for atc
classification and ddd assignment Technical report World Health Organization
httpswwwwhoccnofilearchivepublications2011guidelinespdf
31
Yin W (2008) Market incentives and pharmaceutical innovation Journal of Health
Economics 27 (4) 1060ndash1077
Zycher B (2006) The human cost of federal price negotiations the Medicare prescription
drug benefit and pharmaceutical innovation Manhattan Institute Center for Medical
Progress
32
Figure 1 Pharmaceutical Payment and Supply Chain Example
Notes Illustration of the flow funds and prescription drugs for a prescription drug purchase covered bya Medicare Part D Insurance plan Other private insurance plans using PBMs have similar flow of fundsFigure credit to Government Accountability Office (2019)
33
Figure 2 Number of Excluded Drugs by PBMs
0
50
100
150
Num
ber o
f Exc
lude
d D
rugs
2007 2008 2009 2010 2011 2012 2013 2014 2015 2016 2017Year
CVSExpress ScriptsOptum
Notes This figure plots the number of drugs excluded by each of the three Pharmacy Benefit ManagersCVS was the first to begin excluding drugs in 2012 followed by Express Scripts in 2014 and OptumRx in2016
34
Figure 3 Number of Excluded Drugs by Disease Categories
0
1
2
3
4
5
6
7
8
9
10
11
12
13
14
15
16
17
18
19
20
2011 2012 2013 2014 2015 2016 2017 2018
Notes Each bubble represents a disease category in a year and the size of the bubble reflects the numberof drugs that were excluded by CVS Express Scripts or OptumRx in that disease category There were atotal of 300 drugs that were ever excluded from 2012-2017 by at least one of the three PBMs Of these 300excluded drugs we were able to match 260 of them to the First Data Bank data from which we obtainedthe ATC4 data We manually matched each ATC4 to a disease category this disease taxonomy was adaptedfrom the disease categories provided by the PBMs in their exclusion lists
35
Figure 4 Predictors of Exclusion Risk
Log(1 + N of generic NDCs)
Log(1 + N of brand NDCs)
Log(1 + N of ATC7s)
Mean brand price - mean generic price
Total prescription volume
-25 -15 -05 05 15 25Standardized Coefficient
Notes We used the 2011 market characteristics of the ATC4 class to predict exclusion risk The plottedcoefficients were generated by conducting bivariate linear regressions of whether an ATC4 class had at leastone drug excluded in 2012 or 2013 on each characteristic of the ATC4 class Independent variables werestandardized (divided by their standard deviation) All of the coefficients except the price variable weresignificant at the 5 level Since not every ATC4 class had data on all of the characteristics sample sizediffered across the regressions 197 ATC4 classes when predicting exclusion risk using the number of brandNDCs generic NDCs or ATC7s 134 when using brand price premium and 165 when using total prescriptionvolume Data on prices the number of brand and generic NDCs and the number of ATC7s are from FDBdata on total prescription volume are from the 2011 Medical Expenditure Panel Survey
36
Figure 5 Impact of Predicted Exclusion Risk on New Drug DevelopmentEvent Study
-60
-40
-20
020
Estim
ated
Impa
ct
2007 2008 2009 2010 2011 2012 2013 2014 2015 2016 2017Year
Notes Figure displays coefficient estimates and 90 confidence intervals from a modified version ofEquation (1) The outcome variable is the annual count of new development activity (across all stages) Togenerate the event study graph we replace the single post-period indicator variable (I(Year ge 2012)) witha vector of indicator variables for each year before and after the introduction of PBM exclusion lists in2012 We plot the coefficients on the interaction of these year indicators and a continuous measure ofpredicted exclusion risk (Exclusion risk is predicted using 2011 market characteristics prior to theintroduction of PBM formulary exclusions Details on the prediction of exclusion risk can be found inAppendix Table A4) The regression controls for ATC4 fixed effects and year fixed effects The sampleincludes 1397 ATC4-year observations
37
Figure 6 Counterfactual Development Activity by Pre-PeriodAvailability of Existing Therapies amp Market Size
A Reduction in development B Reduction in developmentby number of drugs in class by number of prescriptions in class
02
46
810
d
ecre
ase
in d
evel
opm
ent a
fter 2
012
Low Medium HighTerciles of pre-period no available drugs
02
46
810
d
ecre
ase
in d
evel
opm
ent a
fter 2
012
Low Medium HighTerciles of pre-period no prescriptions
Notes This figure displays the percent decrease in annual development attributable to exclusions
Predictions are based on our estimation of equation (1) we match the specification reported in Table 4
column 4 The figure shows the percent difference between predictions at the ATC4 times year with and
without exclusions averaged over the post-period (2012-2017) In Panel A we group ATC4 drug classes by
terciles of the number of existing drugs in the class (in 2011) data on existing drugs is from First Data
Bank In Panel B we group ATC4 drug classes by the number of prescriptions written in the class (in
2011) data on prescriptions is from the 2011 Medical Expenditure Panel Survey Drug classes are weighted
by the number of drugs with advancing development over the pre-period
38
Figure 7 Counterfactual Development Activity by Pre-Period DiseaseCategory
0 5 10 15 20 25 decrease in development after 2012
Other
Nutrition amp Weight Management
Antineoplastic
Hematology
Ophthalmic
Immunosuppressants
Musculoskeletal amp Rheumatology
Anti-Infectives Anti-Virals Anti-Bacterials
Dermatology
PainInflammation
Autonomic amp Central Nervous System
Gastrointestinal
Ear Nose amp Allergies
Urology Obstetrics amp Gynecology
Respiratory
Endocrine
Cardiovascular
Diabetes
Notes This figure plots the predicted percent decline in drug development activity attributable to
formulary exclusions by disease class Predictions are based on our estimation of equation (1) we match
the specification reported in Table 4 column 4 We manually matched each ATC4 to a disease category
this disease taxonomy was adapted from the disease categories provided by the PBMs in their exclusion
lists
39
Figure 8 Counterfactual Development Activity by Pre-Period Measuresof Scientific Novelty
A Citing Recent Science B Average ldquoDisruptivenessrdquo Index
02
46
810
d
ecre
ase
in d
evel
opm
ent a
fter 2
012
Low Medium HighTerciles of pre-period proportion citing recent science
02
46
810
d
ecre
ase
in d
evel
opm
ent a
fter 2
012
Low Medium HighTerciles of pre-period patent D-Index
Notes This figure displays the percent decrease in annual development attributable to exclusions Drug
classes are divided into terciles according to attributes of patents associated with drug development activity
over the pre-period averaged from 2007-2011 Panel A groups drug classes by the share of pre-period patents
in a drug class citing recent science as of 2011 (recent is therefore defined as publications between 2006 and
2011) Panel B groups drug classes by the average ldquodisruptivenessrdquo index of patents in the drug class over
the pre-period which is a measure that captures how disruptive the scientific articles associated with the
patent are the index ranges from -1 (least disruptive) to 1 (most disruptive) and was originally developed
by Funk and Owen-Smith (2017)
40
Table 1 Summary Statistics
(A) New Drug Development
Mean Std Dev MedianAll 3061 4206 1305Preclincal 1739 2613 664Phase 1 654 884 307Phase 2 457 604 217Phase 3 211 304 104Launch 102 163 031
(B) ATC4 Characteristics
ATC4s with ATC4s withoutATC4 market characteristics in 2011 early exclusions early exclusionsMean N of generic NDCs 7679 3103Mean N of brand NDCs 268 1068Mean N of ATC7s within ATC4 1460 8518Mean brand price - mean generic price 5822 5598Mean total prescription volume (millions) 7046 1763Number of ATC4s 15 112
Notes Panel A summarizes the annual drug development activity from 2007-2011 in theCortellis data The sample includes 1397 ATC4-year observations The panel reports theannual number of drug candidates within an ATC4 class that entered different developmentstages Panel B summarizes ATC4 market characteristics in 2011 Column 1 reports resultsfor ATC4 classes with at least one excluded drug in 2012-2013 Column 2 reports results forATC4s with no exclusions in 2012-2013 Data on pricing and the number of available drugsare from First Data Bank data on on total prescription volume are from the 2011 MedicalExpenditure Panel Survey
41
Table 2 Impact of Exclusions on Prescription Volume
(1) (2) (3) (4)VARIABLES Log(Claims) Log(Claims) Log(Mkt Share) Log(Mkt Share)
Number of Excluding PBMs -0274 -0319 -0220 -0319(00638) (00733) (00809) (00733)
Observations 4626 4391 4626 4391R-squared 0962 0970 0939 0964Drug FE YES YES YES YESCohort X Year FE YES YES YES YESMarket Controls NO YES NO YES
Notes This table estimates the impact of PBM formulary exclusion on the volume ofMedicare Part D insurance claims each column reports a different regression specificationThe unit of observation is a drug times year The outcome variable in columns (1) and (2) is thenatural log of the total number of annual claims the outcome in columns (3) and (4) is theannual market share of the index drug relative to all other drugs in the ATC4 class The keyindependent variable of interest is the number of formularies excluding the drug that yearAll regressions include drug fixed effects and drug age X calendar year fixed effects (Drugage is measured as number of years elapsed since market entry) Specifications (2) and (4)include additional controls for ATC4 class times calendar year fixed effects to account for trendsin demand for different drug classes Data on prescription volume is from Medicare Part D2012-2017 public use files We analyze exclusions on 161 excluded drugs that are prescribedto Medicare Part D enrollees and are not in a protected class Standard errors are clusteredat the drug level Statistical significance is indicated as plt001 plt005 plt01
42
Table 3 Early Exclusion Risk and Later Exclusions
(1) (2)VARIABLES Late Exclusion Late Exclusion
Pr(Exclusion) 0167 0150(00413) (00624)
Observations 127 112R-squared 0116 0050Sample All ATC4s ATC4s without early exclusions
Notes Using a linear probability model we regressed whether ATC4 classes that werehighly predicted to be excluded by 2013 were more likely to be actually excluded laterafter 2013 Early exclusion risk is a continuous measure defined using the same specificationunderlying Table 4 we used 2011 market characteristics of the ATC4 class to predict whetherthe ATC4 class was at risk of exclusion by 2013 We then standardized this early exclusionrisk variable The outcome variable late exclusion is a binary variable that indicates whetherthe ATC4 was on any of the PBMrsquos exclusion list at least once in 2014-2017 Column 1includes all ATC4s while Column 2 drops ATC4s that were actually excluded by 2013Statistical significance is indicated as plt001 plt005 plt01
43
Table 4 Impact of Predicted Exclusion Risk on New Drug Development
(1) (2) (3) (4)VARIABLES New Development New Development Log(1+New Dev) Log(1+New Dev)
Post X Pr(Exclusion) -2403 -2198 -0382 -0333(5894) (6571) (0108) (0115)
Observations 1397 1397 1397 1397R-squared 0956 0956 0949 0950Year FE YES YES YES YESATC FE YES YES YES YESMarket Controls YES YES
Notes This table reports results from estimation of equation (1) each column reports adifferent regression specification The unit of observation is an ATC4 drug class times yearThe outcome variable ldquoNew Developmentrdquo is the annual count of new development activity(across all stages) The treatment variable is a continuous measure of predicted exclusionrisk (Exclusion risk is predicted using 2011 market characteristics prior to the introductionof PBM formulary exclusions Details on the prediction of exclusion risk can be foundin Appendix Table A4) The ldquoPostrdquo period comprises years 2012 and later after theintroduction of PBM formulary exclusions All specifications include year fixed effects andATC4 fixed effects Columns 2 and 4 include time-varying controls for each of the drug classcharacteristics listed in Table 1 Standard errors are clustered at the ATC4 level Statisticalsignificance is indicated as plt001 plt005 plt01
44
Table 5 Impact of Predicted Exclusion Risk on New Drug Development By Stages
(1) (2) (3) (4) (5) (6)VARIABLES Log(1+All) Log(1+Preclincal) Log(1+P1) Log(1+P2) Log(1+P3) Log(1+Launch)
Post X Pr(Exclusion) -0333 -0449 -0331 -0310 -0259 0113(0115) (0101) (0103) (0106) (0101) (0138)
Observations 1397 1397 1397 1397 1397 1397R-squared 0950 0947 0906 0891 0817 0652Year FE YES YES YES YES YES YESATC FE YES YES YES YES YES YESMarket Controls YES YES YES YES YES YESN of Drug Candidates Mean 3061 1739 654 457 211 102
Notes See notes to Table 4 Each column reports a regression with a different outcome variable Column 1 replicates the resultreported in Table 4 column 4 on total development activity The additional columns decompose this affect to explore how drugdevelopment changes at each phase moving from the earliest observed preclinical activity in column 2 through the each phase ofclinical trials and eventual launch on the market Standard errors are clustered at the ATC4 level Statistical significance is indicatedas plt001 plt005 plt01
45
Figure A1 Distribution of Predicted Exclusion Risk
Mean 012SD 015Q1 003Median 006Q3 015
020
4060
Perc
ent
00 01 02 03 04 05 06 07 08 09 10Pr(Exclusion)
Notes This histogram plots the distribution of predicted exclusion risk of the 127 ATC4s in our mainanalyses Summary statistics are also provided See notes to Appendix Table A4 for details on how theexclusion risk was calculated
46
Figure A2 Impact of Predicted Exclusion Risk on New DrugDevelopment Event Study By Stages
A Pre-clinical B Phase 1
-30
-20
-10
010
Estim
ated
Impa
ct
2007 2008 2009 2010 2011 2012 2013 2014 2015 2016 2017Year
-10
-50
510
15Es
timat
ed Im
pact
2007 2008 2009 2010 2011 2012 2013 2014 2015 2016 2017Year
C Phase 2 D Phase 3
-10
-50
5Es
timat
ed Im
pact
2007 2008 2009 2010 2011 2012 2013 2014 2015 2016 2017Year
-4-2
02
4Es
timat
ed Im
pact
2007 2008 2009 2010 2011 2012 2013 2014 2015 2016 2017Year
Notes See notes to Figure 5 Each panel displays results from estimating the same equation with adistinct outcome variable The outcome variables correspond to the number of drug candidates tested at theindicated phase within the ATC4 category and year The sample includes 1397 ATC4-year observations
47
Figure A3 Impact of Exclusions on New Drug Development Event Study
-15
-10
-50
510
Estim
ated
Impa
ct
2007 2008 2009 2010 2011 2012 2013 2014 2015 2016 2017Year
Notes These results parallel the specification underlying Figure 5 but with a new definition of exclusionexposure Instead of defining exclusion risk as a continuous measure predicted using the 2011 marketcharacteristics the exclusion risk here is a binary variable that equals one if any drug in the ATC4 class wason a PBM exclusion list in 2012 or 2013 The sample includes 1397 ATC4-year observations
48
Figure A4 Impact of Predicted Exclusion Risk on New DrugDevelopment Event Study Alternative ATC4 Linking
(A) Directly Linked Approach Only
-60
-40
-20
020
Estim
ated
Impa
ct
2007 2008 2009 2010 2011 2012 2013 2014 2015 2016 2017Year
(B) Indirect Linking Approach Only
-10
-50
510
Estim
ated
Impa
ct
2007 2008 2009 2010 2011 2012 2013 2014 2015 2016 2017Year
Notes These results parallel the specification underlying Figure 5 but with alternative methods for linkingdrug candidates to ATC4 classes In these figures we have replaced our baseline outcome measure ofdevelopment activity with two alternative outcomes that take different approaches to matching In Panel Awe only count track development activity among the subset of drug candidates for which Cortellis directlyreports the drug class In Panel B we impute ATC4s from ICD9 codes for all drug candidates rather thanrelying on Cortellisrsquo reporting of drug class Appendix B provides more details on how the drug candidatesare linked to ATC4s
49
Table A1 Examples of ATC4 Codes Defining Drug Markets
A10 Diabetes drugsA10A Insulins and analoguesA10B Blood glucose lowering drugs excluding insulinsA10X Other drugs used in diabetes
C07 Beta blocking drugsC07A Beta blocking agentsC07B Beta blocking agents and thiazidesC07C Beta blocking agents and other diureticsC07D Beta blocking agents thiazides and other diureticsC07E Beta blocking agents and vasodilatorsC07F Beta blocking agents other combinations
Notes This table provides examples of ATC4 classes for illustrative purposes Oursample includes 127 distinct ATC4 classes A complete listing of the ATC4 class definitionsthat guided this analysis can be found in WHO Collaborating Centre for Drug StatisticsMethodology (2010)
50
Table A2 Summary Statistics Part D Claims per Drug
Mean Std Dev Median No of obsClaims for non-excluded drugs (all ages) 158298 842241 4357 3923Claims for excluded drugs (all ages) 454433 1193389 45374 867Market share non-excluded drugs (all ages) 0187 0305 0027 3923Market share excluded drugs (all ages) 0113 0211 0028 867Claims for new drugs not excluded on entry 125826 395623 7123 1811Claims for new drugs excluded on entry 193731 452800 27799 59Market share of new drug not excluded on entry 0147 0264 0027 1811Market share of new drug excluded on entry 0063 0183 0004 59
Notes This table reports summary statistics from the Medicare Part D public use fileData tracks annual claims per drug in 2012-2017 the unit of observation is the drug-yearpair Market share is calculated as the fraction of prescription drug claims in the ATC4 classthat are for the index drug The first four rows report results for all drugs comparing thosethat were ever excluded to those that were never excluded durign the sample period Thelast four rows report results for the subset of ldquonew drugsrdquo defined as drugs that enter themarket in 2007 or later and so are ten years old or younger for the duration of the sampleThese final rows compare new drugs that were excluded within a year of entry to those thatwere not excluded in the first year
51
Table A3 Impact of Immediate Exclusion on Prescriptions of New Drugs
(1) (2) (3) (4)VARIABLES Log(No of Claims) Log(No of Claims) Log(Market Share) Log(Market Share)
Excluded at Entry -1147 -1193 -1094 -1099(0573) (0591) (0546) (0564)
Observations 1846 383 1846 383R-squared 0532 0442 0463 0339ATC4 FE YES YES YES YESCohort X Year FE YES YES YES YESLimited sample NO YES NO YES
Notes This table investigates the impact of immediate exclusion by one or more PBM onclaims for a new prescription drug Each column reports results from a separate regressionThe regressions include ATC4 fixed effects and drug age X calendar year fixed effectsIdentifying variation comes from the debut of multiple drugs within an ATC4 drug classsome of which are immediately excluded and others are not Immediate exclusion is defined asexclusion in the calendar year immediately following market entry The sample is restrictedto drugs that enter the market in 2007 or later and so are ten years old or younger forthe duration of the sample In columns 2 and 4 the sample is further restricted to onlyATC4 categories that have at least one immediately excluded drug See notes to AppendixTable A2 for more details on the data Standard errors are clustered at the drug levelStatistical significance is indicated as plt001 plt005 plt01
52
Table A4 Predicting Exclusion Risk
(1)VARIABLES Exclusion
Log(1 + N of generic NDCs) -0674(0317)
Log(1 + N of brand NDCs) 0656(0511)
Log(1 + N of ATC7s) 1069(0665)
Mean brand price - mean generic price -000862(000761)
Total prescription volume 170e-08(816e-09)
Observations 128Pseudo R2 0243
Notes We used the above 2011 market characteristics of the ATC4 class to predict exclusionrisk Using a Logit model we regressed whether an AT4 class had at least one drug excludedin 2012 or 2013 on all of the characteristics of the ATC4 class reported above We then usedthe regressionrsquos fitted values to construct predicted exclusion risk of each ATC4 Data onprices the number of brand and generic NDCs and the number of ATC7s are from FDBdata on total prescription volume are from the 2011 Medical Expenditure Panel Survey
53
Table A5 Impact of Predicted Exclusion Risk on New Drug DevelopmentBy Stages Non-Logged
(1) (2) (3) (4) (5) (6)VARIABLES All Preclincal Phase 1 Phase 2 Phase 3 Launch
Post X Pr(Exclusion) -2198 -1105 -6010 -3830 -1098 0220(6571) (3403) (2077) (1349) (0422) (0496)
Observations 1397 1397 1397 1397 1397 1397R-squared 0956 0944 0903 0900 0804 0643Year FE YES YES YES YES YES YESATC FE YES YES YES YES YES YESMarket Controls YES YES YES YES YES YESN of Drug Candidates Mean 3061 1739 654 457 211 102
Notes This table parallels the results reported in Table 5 but using non-logged outcomesEach column explore how drug development changes at each stage moving from the earliestobserved preclinical activity in column 2 through the different stages of clinical trialsStandard errors are clustered at the ATC4 level Statistical significance is indicated as plt001 plt005 plt01
54
Table A6 Impact of Exclusions on New Drug Development
(1) (2) (3) (4)VARIABLES New Development New Development Log(1+New Dev) Log(1+New Dev)
Post X Excluded Class -5824 -4534 -0161 -0137(2568) (2290) (00838) (00891)
Observations 1397 1397 1397 1397R-squared 0954 0955 0949 0950Year FE YES YES YES YESATC FE YES YES YES YESMarket Controls YES YES
Notes This table reports results from estimating a modified version of equation (1)Instead of defining exclusion risk as a continuous measure predicted using the 2011 marketcharacteristics the exclusion risk here is a binary variable that equals one if any drug inthe ATC4 class was on a PBM exclusion list in 2012 or 2013 For further details on theregression specifications see notes to Table 4 Standard errors are clustered at the ATC4level Statistical significance is indicated as plt001 plt005 plt01
55
Table A7 Impact of Predicted Exclusion Risk on New Drug DevelopmentAlternative ATC4 Linking
(A) Directly Linked Approach Only(1) (2) (3) (4)
VARIABLES New Dev New Dev Log(1+New Dev) Log(1+New Dev)
Post X Pr(Exclusion) -2098 -1859 -0370 -0269(6048) (6745) (0132) (0146)
Observations 1397 1397 1397 1397R-squared 0963 0963 0947 0948Year FE YES YES YES YESATC FE YES YES YES YESMarket Controls YES YES
(B) Indirect Linking Approach Only(1) (2) (3) (4)
VARIABLES New Dev New Dev Log(1+New Dev) Log(1+New Dev)
Post X Pr(Exclusion) -4301 -4454 -0229 -0246(1329) (1473) (00836) (00877)
Observations 1397 1397 1397 1397R-squared 0898 0900 0951 0952Year FE YES YES YES YESATC FE YES YES YES YESMarket Controls YES YES
Notes These results parallel the specification underlying Table 4 but with alternativemethods for linking drug candidates to ATC4 classes We have replaced our baseline outcomemeasure of development activity with two alternative outcomes that take different approachesto matching In Panel A we only count track development activity among the subset of drugcandidates for which Cortellis directly reports the drug class In Panel B we impute ATC4sfrom ICD9 codes for all drug candidates rather than relying on Cortellisrsquo reporting of drugclass Appendix B provides more details on how the drug candidates are linked to ATC4sStandard errors are clustered at the ATC4 level Statistical significance is indicated as plt001 plt005 plt01
56
Table A8 Impact of Predicted Exclusion Risk on New Drug DevelopmentWild Cluster Bootstrap
(1) (2) (3)VARIABLES New Development Log(1+New Dev) IHS New Dev
Post X Pr(Exclusion) -2198 -0333 -0316[-3797 -8378] [-5357 -03624] [-5549 01335]
Observations 1397 1397 1397Year FE YES YES YESATC FE YES YES YESMarket Controls YES YES YES
Notes Columns 1 and 2 of this table repeat the specifications reported in Table 4 columns2 and 4 but now using wild cluster bootstrap to calculate the 95 confidence interval(rather than using conventional inference) Clustering is performed at the ATC4 levelColumn 3 reports results with the outcome variable defined as the inverse hyperbolic sinetransformation of development activity this transformation can be interpreted similarly tothe log transformation but better accounts for ATC4-year categories with no developmentactivity Column 3 also uses wild cluster bootstrap for inference Statistical significance isindicated as plt001 plt005 plt01
57
A Theoretical Model
We focus on a potential pharmaceutical entrant that makes RampD decisions on the basis of
expected profitability This firm can make investments in one of two drug classes class o is ldquooldrdquo
in the sense that there is already an approved treatment in that class class n is ldquonewrdquo in the
sense that there are no existing treatments For tractability we assume that there is exactly one
incumbent drug in the old class The pharmaceutical firm pays a fixed cost of drug development K
that is the same for both classes If the firm invests in class o it produces an FDA approved drug
with probability φo for class n this probability is given by φn If successful the entrant competes as
a monopolist in the new drug class and as a Bertrand duopolist in the old drug class For simplicity
we follow Dixit (1979) and adopt a linear demand system with horizontally differentiated products
We assume there is a single PBM that facilitates access to FDA approved drugs by administering
an insurance plan formulary Patients pay a coinsurance fraction λ isin (0 1) for drugs included in
the PBMrsquos formulary but must bear the full cost of drugs that are not
We begin in Section A1 by characterizing pharmaceutical profits in both the old and new drug
classes when formulary exclusions are prohibited Next in Section A2 we introduce formulary
exclusions as a policy change in which PBMs begin granting exclusive contracts to pharmaceutical
firms in exchange for a fixed fraction (1minusα) isin (0 1) of sales revenue from the included drug When
there are two drugs on the market we show that ex post profits are lower for drugmakers when
their drug is excluded from the PBMrsquos formulary because of this they are willing to offer higher
rebates ex ante in order to win the exclusive contract Finally after characterizing downstream
profits associated with approved drugs both with and without exclusions we analyze how the
exclusion policy impact firmsrsquo upstream investment decisions and provide an informal discussion
of welfare implications
A1 Downstream profits without exclusions
In our baseline case we do not allow for exclusions PBMs facilitate access to all FDA approved
drugs If the entrant drug is approved it competes as either a monopolist in class n or as a
differentiated Bertrand duopolist in class o In both cases its drug is included on the PBMrsquos
formulary Because formulary inclusion is guaranteed the PBM cannot extract rebate payments in
the absence of a credible exclusion threat in the context of our simple model20
20In reality PBMs could negotiate rebates in exchange for placement on a preferred formulary tier evenin the absence of exclusions For simplicity we do not include these other tools in our model Crucially
58
We denote the entrantrsquos downstream profits as Πen in the new class and as Πopeneo in the old
class The subscript e indicates the entrant the subscript o or n indicates the old or new class
respectively the superscript open describes the open formulary policy state where no drugs are
excluded
In drug class n the entrant faces a standard monopoly pricing problem
maxpen
(pen minusm) (AminusBλpen)
Here A is a parameter describing the level of demand in this drug class and B is a parameter
describing consumerrsquos elasticity with respect to price Marginal costs of production are denoted as
m Demand also depends on λp because we assume consumers are partially insured The relevant
price consumers face is λp le p even though the drugmaker receives p Solving this problem yields
equilibrium prices pen quantities qen and profit Πen
Meanwhile in class o the entrant e would be two competing with the incumbent i We assume
that the demand system is symmetric and the drugs are horizontally differentiated but of equivalent
quality so that b gt d
qopeneo = aminus bλpopeneo + dλpopenio
qopenio = aminus bλpopenio + dλpopeneo
Here the parameters a and b denote potentially different levels and elasticities of demand relative
to class n The entrant and incumbent symmetrically choose price to maximize profits
maxpopeneo
(popeneo minusm)(aminus bλpopeneo + dλpopenio
)maxpopenio
(popenio minusm)(aminus bλpopenio + dλpopeneo
)We take the first order conditions and solve for the optimal duopoly pricing
exclusions are the strongest tool available to PBMs for restricting drug access and are thus a significantdeparture from the earlier forms of control over formulary structure
59
Proposition A1 The incumbent and entrant face symmetric demand and will choose identical
prices and then produce identical quantities Production will occur as long as 2bminus d gt 0
popeneo = popenio qopeneo = qopenio Πopeneo = Πopen
io
This proposition is proved by deriving equilibrium price quantity and profit These expressions
are given below
popeneo = popenio =a
λ(2bminus d)+
bm
(2bminus d)
qopeneo = qopenio =ab
(2bminus d)minus λb(bminus d)m
(2bminus d)
Πopeneo = Πopen
io =b (aminus λ(bminus d)m)2
λ(2bminus d)2
A2 Downstream profits with exclusions
We now consider the case in which PBMs are able to exclude approved drugs when there is
a viable alternative In our model this means that there can be no exclusions in class n so that
prices quantities and profits are unaffected
In class o however drugs can be excluded Excluded drugs can still be marketed but would not
be covered by insurance meaning that consumers face the full price p rather than the subsidized
λp The firm again enters differentiated Bertrand competition but with another firm whose drug
is covered For the purposes of this exposition we assume that the entrant is excluded and the
incumbent is covered The demand functions will then become
qexcludedeo = aminus bpexcludedeo + dλpincludedio
qincludedio = aminus bλpincludedio + dpexcludedeo
Each firm will choose prices to maximize profits Here we assume that the term (1minus α) is the
pre-negotiated rebate that the incumbent pays in order to be included in a PBMrsquos formulary We
will endogenize α in the following section If the entrant is excluded then it no longer pays the
60
(1minus α) revenue share to the PBM
maxpexcludedeo
(pexcludedeo minusm)(aminus bpexcludedeo + dλpincludedio
)max
pincludedio
(αpincludedio minusm)(aminus bλpincludedio + dpexcludedeo
)Taking first order conditions we can solve for the optimal price quantity and profits for entrant
and incumbent
Proposition A2 When λ le α we have the following expressions for prices and quantities
pexcludedeo le αpincludedio qexcludedeo le qincludedio
The condition λ le α means that the share of revenue retained by the pharmaceutical company
after rebates is greater than the drug coinsurance rate paid by insured consumers21 Under this
assumption the included drug is able to charge a higher price to insurers and still sell more
quantities because formulary placement leads consumers to face a lower out-of-pocket price The
more generous the insurance coverage the larger the price wedge between the included and excluded
drug If marginal costs of production are zero then the two drugs will sell equal quantities the
excluded drugrsquos lower prices will be exactly the amount needed to offset the insurance coverage If
marginal costs are positive then the excluded drug will sell at a lower quantity than the included
drug Finally the expressions above assumed the entrant is excluded but flipping the identity of
the excluded drug will simply swap the comparative statics the excluded drug will have a lower
revenue per unit and lower quantity sold in equilibrium
To prove these propositions we solve for the equilibrium price and quantities taking the rebate
level (1minusα) required for formulary inclusion as given We then solve for the optimal rebate bidding
21Empirical estimates suggest this sufficient condition holds in practice The Kaiser Family Foundationreports average insurance subsidy rates (1 minus λ) for prescription drugs ranging between 62 and 83depending on the drug tier for employer sponsored insurance plans in 2017 (Claxton et al 2017) Theseestimates imply coinsurance rates λ in the range of [017 038] In comparison Kakani et al (2020) estimaterebates of 48 in 2017 suggesting the share of retained revenue α as 052
61
strategy in the second stage Prices are as follows
pexcludedeo =a
(2bminus d)+b(2αb+ λd)m
α(4b2 minus d2)
pincludedio =a
λ(2bminus d)+b(2λb+ αd)m
αλ(4b2 minus d2)
Recall that the included drug does not receive the full price pincludedio in additional revenue for
each unit sold because it owes a cut (1 minus α) of its revenue to the PBM As a result the effective
revenue per unit sold is αpincludedio for the included drug As a result we compare αpincludedio to
pexcludedeo to calculate the difference in revenue per unit across the included and excluded drug
αpincludedio minus pexcludedeo =(αminus λ)a
λ(2bminus d)+
(α+ λ)(αminus λ)bdm
αλ(4b2 minus d2)
As long as λ le α and 2bminus d gt 0 it will hold that
αpincludedio ge pexcludedeo
We can calculate equilibrium quantities as follows
qexcludedeo =ab
(2bminus d)minusb(2αb2 minus λbdminus αd2
)m
α(4b2 minus d2)
qincludedio =ab
(2bminus d)minusb(2λb2 minus αbdminus λd2
)m
α(4b2 minus d2)
From these quantity expressions we calculate
qincludedio minus qexcludedeo =(αminus λ)b(b+ d)m
α(2b+ d)
Maintaining the assumption that λ le α it follows that
qincludedio ge qexcludedeo
62
A3 Profits and bidding on rebates
From the PBMrsquos perspective exclusions allow it to extract positive rebates 1minusα by leveraging
the exclusion threat From the drug companyrsquos perspective exclusions reduce the profitability of
entry into the old class we discuss these profitability comparisons in this section A corollary of
Proposition A2 is that profits will be higher when a drug is included rather than excluded from
an PBMrsquos formulary as long as the final rebate level is not too high Because of this drugmakers
would be willing to provide an ex ante payment in order to avoid exclusion ex post We model this
process as a second price auction in which pharmaceutical firms bid for the exclusive right to be
included in a PBMrsquos formulary by offering rebates of the form αpq The drug offering the highest
rebate offer will be included on the formulary in cases with tied bids one drug will be selected at
random for inclusion The following pins down rebates in equilibrium
Proposition A3 In the old drug class firms will be bid a rebate level 1minus α = 1minus λ so that
Πexcludedeo = Πincluded
io and Πexcludedeo gt Πopen
eo (2)
At the time a drug is approved each pharmaceutical firm would be willing to set the rebate up to
the level that would equalize profits when included on formulary to the profits when excluded As
shown in Appendix A excluded profits equal included profits when the rebate share (1minusα) equals
the insurance coverage share (1 minus λ) Assuming that the entrant and incumbent have symmetric
demand and marginal costs the incumbentrsquos bid is the same as the entrantrsquos and we assume that
the PBM uses a coin toss to break the tie Because the firmrsquos bid leaves it indifferent between
being included and being excluded the firm receives its outside option profits in either case and
the PBM retains the extra rebate payment22
To compare profit of the entrant to the old drug class see the expressions below
Πexcludedeo = (pexcludedio minusm)qexcludedeo
Πincludedio =
(pexcludedio +
(αminus λ)a
λ(2bminus d)+
(α2 minus λ2)bdmαλ(4b2 minus d2)
minusm)(
qexcludedeo +(αminus λ)b(b+ d)m
α(2b+ d)
)
22For simplicity we do not model demand for PBM services In practice some of the PBMrsquos rebate maybe passed on to consumers or retained as PBM profit
63
As shown above as long as α gt λ the included drug makes higher profits Further profits
for the included drug are increasing in α and the difference in profitability between the included
and excluded drug is also increasing in α Profits for the included drug are equal to profits for the
excluded drug when λ = α since at this point the marginal revenue per unit sold is the same for
included and excluded drugs as is the quantity sold The drug company would be willing to bid a
maximum rebate level of up to 1minus α = 1minus λ for inclusion on the formulary
Now we can compare price quantity and profitability of the entrant under the open formulary
regime compared to the closed formulary regime The entrantrsquos price net of the PBM rebate under
the open formulary is higher than the price of the excluded drug in the closed formulary
popeneo minus pexcludedeo =(1minus λ)a
λ(2bminus d)+
(αminus λ)bdm
α(4b2 minus d2)
Under the sufficient condition that λ le α it will hold that the the entrantrsquos drug price is strictly
higher under the open formulary than if it were excluded from coverage
αpopeneo gt pexcludedeo
Further the entrantrsquos quantity sold is also strictly larger under the open formulary than when
it is excluded
qopeneo minus qexcludedeo =(1minus λ)b(bminus d)m
(2b+ d)+
(αminus λ)b2dm
α(4b2 minus d2)
As long as λ le α and b gt d it will also hold that
qopeneo gt qexcludedeo
Because the entrantrsquos price and quantity are both strictly larger under the open formulary than
when the entrant is excluded it follows that entrantrsquos strictly profits are higher under the open
formulary
Πopeneo gt Πexcluded
eo
A4 Upstream investment decisions
A firm will choose whether to invest in the old or new drug class by comparing expected profits
and success rates of drugs in each class When there are no exclusions a potential entrantrsquos expected
64
returns at the time of its RampD decision are given by
E[Πe] =
φnΠopen
eo if develop for class o
φoΠen minus if develop for class n
The firm therefore chooses to develop for the old class as long as
Πopeneo gt
φnφo
Πen (3)
In general the old drug class will be more attractive when the likelihood of successful
development is higher when there is a large base of potential consumer demand (eg if it is a
common condition) or if the firmrsquos drug is more differentiated from that of the incumbentrsquos
However when there is a threat of exclusion the entrant anticipates needing to bid for access to
the PBMrsquos formulary in the event it creates an FDA approved drug for the old class The firm
has a probably φo of developing a successful drug in the old class in which case it will enter its
maximum rebate bid to be included in the formulary and win half the time However any ex post
returns to being included in the formulary are bid away so that the entrant expects to receive
only its outside option revenues in the case when its drug is excluded
Meanwhile profits from developing an entrant for the new drug class do not depend on whether
the formulary is open or closed because we assume that drugs can only be excluded when there is
a viable alternative The potential entrantrsquos new criterion for developing in class o when exclusions
are permitted is given by
Πexcludedeo gt
φnφo
Πen (4)
The criterion differs from the no-exclusion condition given in Equation (3) only in the lefthand
side which had a Πexcludedeo instead of Πopen
eo As shown above profits are higher when there is an
open formulary so that Πopeneo gt Πexcluded
eo The model therefore predicts that the introduction of
an exclusion policy leads firms to develop relatively fewer drugs for the older class
65
B Linking Drug Candidates to ATC4 Classes
We matched the pipeline drug candidates in Cortellis to ATC4 codes in two ways directly via
EphMRA codes and indirectly via ICD9 codes if the EphMRA codes were missing
Direct method matching via EphMRA codes Cortellis links drug candidates to chemical
drug classes (specifically the EphMRA code which is a close derivative of the ATC classification)
Using a manually created crosswalk of EphMRA codes to ATC4 codes we used the EphMRA codes
of the drug candidates to link the drugs to ATC4 classes A drug can be linked to many ATC4
classes and we assigned equal weights of 1 to all ATC4 classes that directly matched to a given
drug through their EphMRA codes
Indirect method matching via ICD9 codes An alternative way to link the drug candidates to
ATC4 classes is through the drugsrsquo areas of therapeutic use (ICD9) provided by Cortellis Using the
drug to ICD9 crosswalk from Cortellis we linked to a crosswalk of ICD9 to ATC4 codes created by
Filzmoser et al (2009) in which the authors assigned a probabilistic match score of ICD9-ATC4
pairs23 Since this results in a drug being matched (indirectly via ICD9) to many ATC4s we
assigned the likelihood of an ATC4 matching to a drug based on the probabilistic match scores
from Filzmoser et al (2009) such that the assigned weights sum to 1 for each drug
For our main analyses we matched the drug candidates to ATC4 codes using the direct method
via EphMRA codes and used the indirect method via ICD9 codes for drugs with missing EphMRA
codes As shown in Appendix Table A7 our results are similar regardless of the linking method
used
23Filzmoser et al (2009) merged a dataset of prescriptions (with ATC4 codes) and a dataset of hospitaladmissions (with ICD9 codes) at the patient-level Since the ATC4 code of a patientrsquos drug matches to manydiagnosis codes of the patient the authors use a frequency-based measure to calculate a probabilistic matchscore of an ICD9-ATC4 pair They conduct this match specific to genderage group of the patients For ouranalysis we take the average match probability across the genderage groups for a given ICD9-ATC4 pair
66
- Institutional Background
- Formulary Exclusions and Upstream Innovation
- Data
- Formulary Exclusions
-
- Descriptive statistics
- The impact of exclusions on drug sales
- Predictors of formulary exclusion risk
-
- The Impact of Exclusion Risk on Subsequent Drug Development
-
- Empirical strategy
- Main results
- Robustness checks
- Classifying foregone innovation across drug classes
-
- Discussion
- Conclusion
- Theoretical Model
-
- Downstream profits without exclusions
- Downstream profits with exclusions
- Profits and bidding on rebates
- Upstream investment decisions
-
- Linking Drug Candidates to ATC4 Classes
-