instrumental determination of trace elements in plant tissue by neutron activation analysis and...
TRANSCRIPT

Instrumental Determination of Trace Elements in Plant Tissue by Neutron Activation Analysis and Ge (Li) Gamma-Ray Spectrometry
William A. Hailer,' Louis A. Rancitelli, and J o h n A. Cooper
By use of neutron activation and a large-volume errors associated with chemical determinations. The high-resolution Ge(Li) detector the practicality of samples are freeze-dried, neutron-activated, and determining the concentrations in plant tissue of 15 analyzed by Ge(Li) gamma-ray spectrometry. The elements-Mn, K, Cu, Na, As, Br, P, Rb, Cr, Fe, resulting spectra are reduced by standard techniques Hg, Se, Zn, Cs, and Co-was demonstrated. This in which the corrected counts are compared to a instrumental method, which requires no chemical system of standards to obtain elemental concen- or ashing manipulation, eliminates many inherent trations.
everal studies of the effect of trace element concen- trations on plant growth have been performed S (Kuhn et a/ . , 1961; Monier and Williams, 1949);
however, at present the trace elements essential to plant growth have been only partially defined (Lamb et a/., 1957). As the sensitivity and selectivity of analytical and bioassay techniques are increased, the list of essential trace elements will grow. In addition to the need for essential elements, for some elements there is a certain critical con- centration range for healthy plant development (Lamb et a/., 1957). There are also many interrelated functions associated with trace element concentrations (Bowen, 1966; Mitsui et a/., 1962).
A major limitation t o extensive trace element studies in plant samples has been the lack of practical methods for the measurement of a large group of trace elements in the parts-per-million to parts-per-billion range. Methods of analysis vary from time-consuming wet chemical methods for the individual elements (Horwitz, 1955) to spectro- graphic and flame photometry procedures where several elements may be determined instrumentally (Mathis, 1954; Tipton et ul., 1963; Wenner, 1958). Bedrosian et a/. (1968) indicate that a direct multielement determination by spectrographic analysis is feasible. However, in general the multielement procedures lack selectivity and sensitivity for measuring many trace elements of interest, and they require a wet- or dry-ashing step where the more volatile elements such as Br, Se, and As could be lost. An even more serious problem is random contamination. Where lengthy chemical reduction, such as ashing, is necessary,
Pacific Northwest Laboratory, Battelle Memorial
1 Present address, Department of Chemistry, Washington
Institute, Richland, Wash. 99352
State University, Pullman, Wash. 99163
contamination of samples is always a potential problem. In some cases the trace elements of interest in plant tissue are present in lower concentrations than in pure reagents used for chemical separation (Robertson, 1968).
Over the last decade neutron activation analysis has be- come an increasingly useful tool for trace elemental analy- sis. A chief advantage is sensitivity; for many elements, activation analysis is the most sensitive technique known. Another advantage is that reagent contamination of the sample can be avoided where no pre-irradiation chemical treatment is conducted. Several authors have described methods for multielement measurements in biological ma- terials (Bowen et a/ . , 1963; Lyon, 1964; Wester, 1965) by neutron activation analysis. However, the large amount of radiochemistry required prior to gamma-ray spectrometry in these methods limits their wide applica- tion. A Ge(Li) y-ray spectrometer could greatly extend the selectivity for activation analysis of biological tissue (Perkins et a[., 1967). The purpose of this study was to develop a reasonably simple and essentially contamination- free scheme for the multielement analysis of plant tissue samples by neutron activation and Ge(Li) spectrometry.
SAMPLE PREPARATION
The main emphasis in the study has been to establish method feasibility rather than to relate trace element con- centrations t o environmental or biological parameters. Several special techniques were developed and employed in sample handling and encapsulation prior to irradiation. Pre-irradiation sample preparation was performed in a clean air hood (Agnew Higgins Model 43) to minimize contamination from dust in the air. For samples of high moisture content, such as pears, internal portions were first sectioned out with a Lucite knife; then an inner sec- tion was taken with a Lucite borer (31s-inch diameter by 1-inch length). These samples were placed in preweighed
1036 J. AGR. FOOD CHEM.
polyethylene containers (Nalgene No. 25) which had been cleaned by leaching for 10 minutes with doubly distilled HrO, then 10 minutes with doubly distilled concentrated "03. Grain samples such as beans were placed directly in the irradiation container. Their sample weight was obtained by weighing the containers before and after sample addition. The samples were dehydrated by drying for 2 days in a Thermovac freeze-drying unit ; this elimi- nates the possible loss of volatile elements. Losses of mercury up to 150< in drying biological material at 110" C. have been reported (Wester, 1965). To avoid contamina- tion from the air after the freeze-drying process, air enter- ing the chamber was passed through a sintered-glass filter packed with a Gelman 10-mp pore size filter (Gelman In- strument Co., Chelsea, Mich.). After freeze-drying, the polyethylene containers were taped shut with plastic tape and wrapped in several layers of 0.003-cm. aluminum foil prior to activation. The foil prevented direct contact of the polyethylene containers with the irradiation facility and minimized external contamination of the polyethylene
STANDARDS
The high resolution of the spectrometer systems allowed the use of mixed standard solutions which contain known concentrations of all the elements of interest. Because of chemical incompatibility of some elements, three standard solutions are used.
NEUTRON IRRADIATION
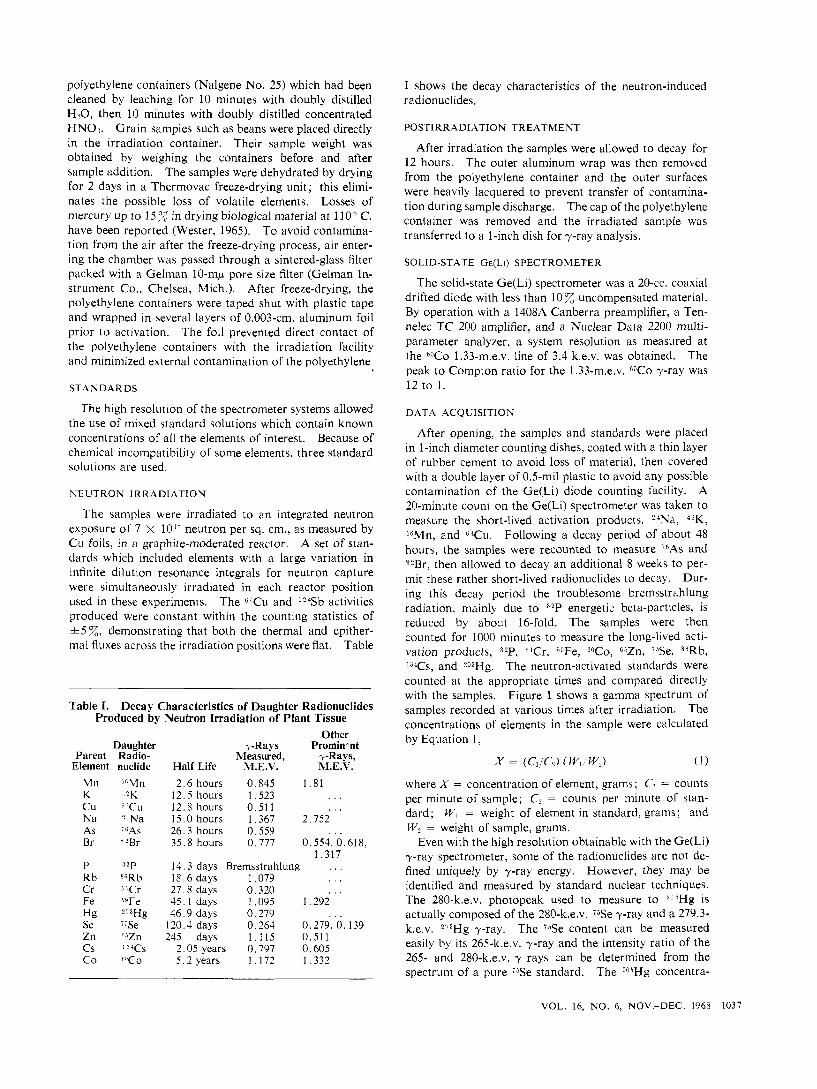
The samples were irradiated t o an integrated neutron exposure of 7 x 10" neutron per sq. cm., as measured by Cu foils, in a graphite-moderated reactor. A set of stan- dards which included elements with a large variation in infinite dilution resonance integrals for neutron capture were simultaneously irradiated in each reactor position used in these experiments. The 64Cu and Iz4Sb activities produced were constant within the counting statistics of * 5 z, demonstrating that both the thermal and epither- mal fluxes across the irradiation positions were flat. Table
Table I. Decay Characteristics of Daughter Radionuclides Produced by Neutron Irradiation of Plant Tissue
Other Daughter -,-Rays Promin-nt
Parent Radio- Measured, ?-Rays, Element nuclide Half Life M.E.V. M.E.V.
M n j8Mn 2.6 hours 0.845 1.81 K I2K 12.5 hours 1.523 . . . Cu "Cu 12.8 hours 0.511 . . . Na 'INa 15.0 hours 1.367 2.752 As ;GAs 26.3 hours 0.559 . . . Br S?Br 35.8 hours 0.777 0.554, 0.618;
1.317 I' :32p 14.3 days Bremsstrahlung . . . R b *"Rb 18.6days 1,079 . . . Cr "Cr 27.8 days 0.320 . . . Fe "Fe 45.1 days 1.095 1.292 Hg ?n3Hg 46.9 days 0.279 . . . Se ' S e 120.4 days 0.264 0.279, 0.139 Zn FzZn 245 days 1.115 0.511 Cs I 3 T s 2.05 years 0,797 0.605 c o " ' C O 5.2years 1.172 1.332
I shows the decay characteristics of the neutron-induced radionuclides.
POSTIRRADIATION TREATMENT
After irradiation the samples were allowed to decay for 12 hours. The outer aluminum wrap was then removed from the polyethylene container and the outer surfaces were heavily lacquered t o prevent transfer of contamina- tion during sample discharge. The cap of the polyethylene container was removed and the irradiated sample was transferred to a 1-inch dish for y-ray analysis.
SOLID-STATE GE(LI) SPECTROMETER
The solid-state Ge(Li) spectrometer was a 20-cc. coaxial drifted diode with less than 10% uncompensated material. By operation with a 1408A Canberra preamplifier, a Ten- nelec TC 200 amplifier, and a Nuclear Data 2200 multi- parameter analyzer, a system resolution as measured at the W o 1.33-m.e.v. line of 3.4 k.e.v. was obtained. The peak t o Compton ratio for the 1.33-m.e.v. 6oCo y-ray was 12 to 1.
DATA ACQUISITION
After opening, the samples and standards were placed in 1-inch diameter counting dishes, coated with a thin layer of rubber cement t o avoid loss of material, then covered with a double layer of 0.5-mil plastic t o avoid any possible contamination of the Ge(Li) diode counting facility. A 20-minute count on the Ge(Li) spectrometer was taken to measure the short-lived activation products, 24Na, 42KK, j6Mn, and e4Ccu. Following a decay period of about 48 hours, the samples were recounted t o measure 7 6 A ~ and 82Br, then allowed t o decay a n additional 8 weeks to per- mit these rather short-lived radionuclides to decay. Dur- ing this decay period the troublesome bremsstrahlung radiation, mainly due t o 32P energetic beta-particles, is reduced by abo:it 16-fold. The samples were then counted for 1000 minutes t o measure the long-lived acti- vation products, 32P, "Cr, "Fe, 60C0, 6[lZn. '"Se, YGRb, I3Cs, and ?n3Hg, The neutron-activated standards were counted at the appropriate times and compared directly with the samples. Figure 1 shows a gamma spectrum of samples recorded at various times after irradiation. The concentrations of elements in the sample were calculated by Equation 1,
where X = concentration of element, grams; Ci = counts per minute of sample; C2 = counts per minute of stan- dard; W1 = weight of element in standard, grams; and W, = weight of sample, grams.
Even with the high resolution obtainable with the Ge(Li) y-ray spectrometer, some of the radionuclides are not de- fined uniquely by y-ray energy. However, they may be identified and measured by standard nuclear techniques. The 280-k.e.v. photopeak used to measure to ?03Hg is actually composed of the 280-k.e.v. %e y-ray and a 279.3- k.e.v. ?03Hg y-ray. The '%e content can be measured easily by its 265-k.e.v. y-ray and the intensity ratio of the 265- and 280-k.e.v. y rays can be determined from the spectrum of a pure YjSe standard. The *n3Hg concentra-
VOL. 16, NO. 6, N0V.-DEC. 1968 1037

tion is then determined from the 280-k.e.v. photopeak after 7jSe correction. Since 32P is a pure beta emitter, no characteristic y-ray peaks appear in the spectrum; however, a large bremsstrahlung continuum is produced. To measure this component a portion of the spectrum free of y-ray peaks is chosen, a Compton correction for higher energy y-rays is made, and the corrected counts are then compared to those observed from a standard irra- diated phosphorus source. Both 64Cu and "Zn have 511-k.e.v. y-rays; hence the counts measured in the 511- k.e.v. peak by the first 20-minute counts are due to both "Cu and 6jZn. When the 1000-minute count is taken after 8 weeks' decay, the "Cu has completely decayed and the 511 peak is due entirely to "Zn. The 61Cu 511 peak can then be corrected for the "Zn contribution. Where the concentration of a trace element was below detection limits, as was the case for many of the jfiAs measurements, "less than" values were reported. These values were ob- tained by choosing a counting rate which if present could have been measured above the background plus Compton level with a statistical error of *50%:. This value was then substituted into Equation 1. The resulting concen- tration was reported as a "less than" value.
RESULTS AND DISCUSSION
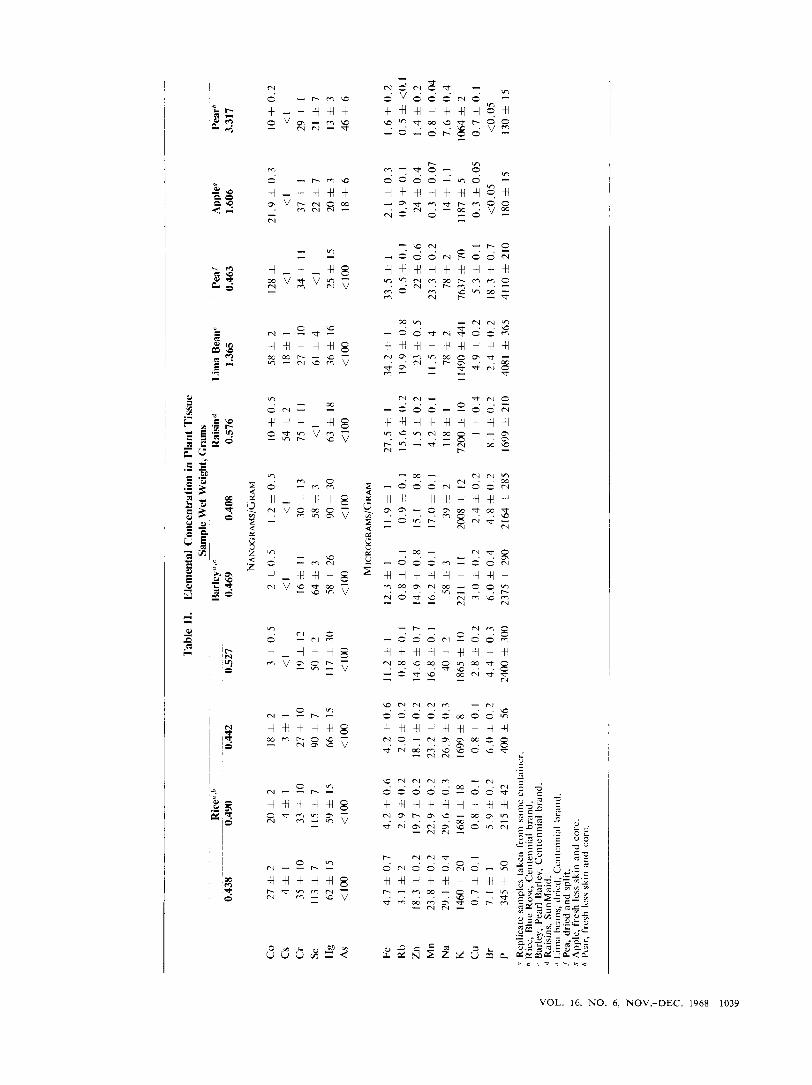
Table I1 shows the elemental concentrations observed in the various plant samples studied. Standard deviations were calculated in the usual manner (Friedlander et nl., 1964). Three samples of rice and barley, from the same container, were analyzed to indicate the average deviation of the mean for the method.
Comparison of replicate samples showed the average deviation about the mean t o be less than 10% for Se, Fe, Zn, Mn, and Cu and less than 25% for the remainder of the elements. In the case of Co, Cs, Cr, P, and Hg the calculated standard deviations based c n counting sta- tistics account for the observed variations. The relatively high deviations of Br, Rb, Na, and K cannot be accounted for by statistical considerations. Since these elements are usually in a highly mobile form, slight variation in growing conditions and/or processing could possibly account for these differences. Investigators such as Neufield (1936) and Schrenk (1964) have shown that variations of a factor of 5 in trace element concentrations are possible for the same type of grain, depending on where and how the samples were grown. The elemental concentrations observed in this study were in the same range as published compilations (Mattice, 1950; Neufield, 1936; Wooster and Black, 1955).
Rather large statistical variations occur with some of the Co, Cs, Se, and Hg concentrations. In the case of C o and Cs the high statistical deviations are due to the lack of a sufficient number of counts from the neutron-activated daughter products. The high statistical deviation as- sociated with Cr and Se is related to a low count rate, but of more importance is the large Compton correction as- sociated with higher energy y-rays and bremsstrahlung from 32P (Table I ) . Hg's high statistical deviation is caused by the above-mentioned Compton and bremsstrah- l u n g corrections and also the necessity of correcting for the overlap of the '"e spectrum. "Zn interference to the "4Cu measurement was in all cases less than 1 % of the 6 4 C ~ ~
1038 J. AGR. FOOD CHEM.
VOL. 16, NO. 6, N0V.-DEC. 1968 1039

counting rate. Since these measurements were made with a 1000-minute count, it would seem unrealistic t o attempt t o improve the statistics by a longer counting period. However, the efficiency and resolution of the Ge(Li) spec- trometers are constantly being improved and detectors with as much as 50z better efficiency and 3 0 z better resolution (measured at 1.33 m.e.v.) than the detector used in this study are now commercially available. Such an improvement in the detector would increase the sensitivity by increasing the counts in the photopeak and reducing the channels over which they are spread.
An important feature of this analytical method is that a large number of what are now considered essential trace elements can be measured simultaneously. Such measure- ments should help t o establish the physiological signifi- cance of these and other trace elements such as Cr: Se, Hg, As, and R b in life processes.
CONCLUSIONS
The actual working time involved in sample preparation and analysis is relatively small, since it invalves only freeze- drying, irradiation, and counting of the sample. The mathematical reduction of the count rate data from the spectrum can be handled manually in about 1 hour for 15 elements. Because a large group of trace elements can be measured simultaneously, the direct applicability of this method t o all manner of plant samples appears certain and will be extremely useful.
LITERATURE CITED Bedrosian, A. J., Skogerboe. R. K., Morrison, G. H.. Arm/.
Bowen, H. J . M., “Trace Elements in Biochemistry,” Academic
Bowen. H. J. M.. Gibbons. D.. “Radioactivation Analvses.”
Clzem. 40, 854 (1968).
Press, New York, 1966.
pp. 166-7, Oxford University Press, Lo?cion. 1963. Friedlander. G., Kennedy, J. W., Miller. J.. Nuclear and Radio-
chemistry,’’ 2nd ed., pp. 166-89. Wiley. New York, 1964. Horwitz, W.. Association of Official Agricultural Chemists,
“Official Methods of Analysis,” 8th ed.. 1955. Kuhn. H., Schaumloffel. E.. Luridwirtscli. Forsch. 14, 82-90
(1961). Lamb, C. A,. Bentley. 0. G.. Beattice, J . M.. Proceedings of
Trace Elements Conference. pp. 1-10. Ohio Agricultural Ex- periment Station. Wooster, Ohio, 1957.
Lyon, W. S. . “Guide to Activation Analysis,” Van Nostrand. Princeton. N. J., 1964.
Mathis, W. T.. Aiiuf. Cliem. 25, 943-7 (1954). Mattice, M., “Bridges’ Food and Beverage Analysis,” 3rd ed..
Lea and Febiger. 1950. Mitsui, S., Kumazawa, K., Yazako, J.. Nippoii Dojo Hiryopki /
Zusslii 31, 451-4 (1962). Monier, S., Williams, L., “Trace Elements in Food,” Wiley,
New York, 1949. Neufield, A. H., C ~ I . J . Res. 14B, 160 (1936). Perkins, R. W., Haller. W. A., Thorp, J. D., “Trace Element
Analysis of Human Lung Tissue by Neutron Activation and Instrumental Analysis,” BNWL-SA-992, IAEA Symposium on Nuclear Activation Techniques in the Life Sciences. Amsterdam. The Netherlands. May 8-13, 1967.
Robertson. D. E.. Airaf. Clrem. 40, 1067 (1968). Schrenk, W. G., Agricultural Experimental Station, Kansas
State University, Manhattan, Kan.. Tech. Bid/. 136 (1964). Tipton, I. H., Cook, M. J., Health Phys. 9, 103-45 (1963). Wenner. V. R., J . Duiry Sri. 41, 761-8 (1958). Wester, P. O., Scurzd. J . Cliii. Lab. Incest. 17, 357-70 (1965). Wooster. H. A., Black. F. C., “Nutritional Data,” H. J. Heinz
Receiced,for reciew April 26, 1968. Accepted Airgiist I S , 1968.
Co., Pittsburgh, Pa., 1955.
1040 J. AGR. FOOD CHEM.