instructions for using this powerpoint template
TRANSCRIPT

1Q21 Update
Fix. Simplify. Perform.
FOR THE 3 MONTHS ENDED 31 DECEMBER 2020WESTPAC BANKING CORPORATIONABN 33 007 457 141
Financial results throughout this presentation are in Australian dollars and are based on cash earnings unless otherwise stated. Refer to the 2020 Full Year Financial Results Presentation and Investor Discussion Pack for definition. All results relating to 1Q21 are on an unaudited basis. This document should be read in conjunction with Westpac’s December 2020 Pillar 3 Report, incorporating the requirements of APS330. Results principally cover and compare the 1Q21 and 2H20 quarterly average periods unless otherwise stated.
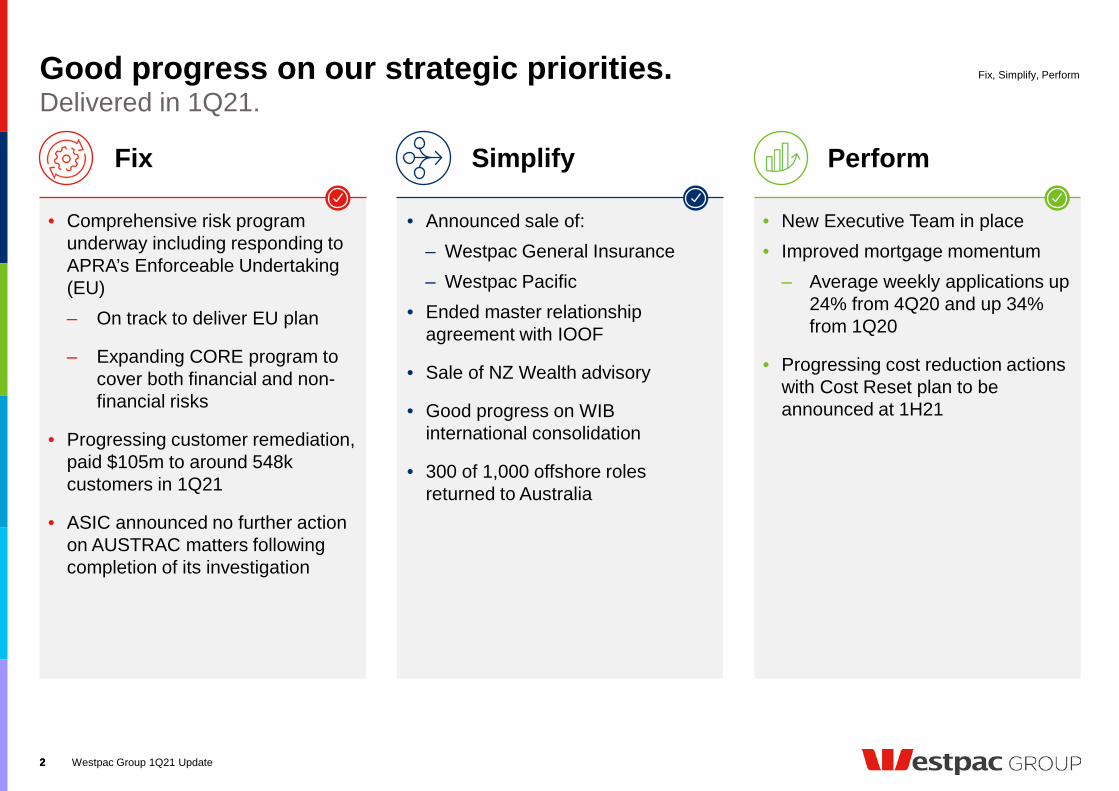
Good progress on our strategic priorities.
Westpac Group 1Q21 Update
Delivered in 1Q21.Fix, Simplify, Perform
2
SimplifyFix Perform
• Comprehensive risk program underway including responding to APRA’s Enforceable Undertaking (EU)‒ On track to deliver EU plan
‒ Expanding CORE program to cover both financial and non-financial risks
• Progressing customer remediation, paid $105m to around 548k customers in 1Q21
• ASIC announced no further action on AUSTRAC matters following completion of its investigation
• Announced sale of:‒ Westpac General Insurance ‒ Westpac Pacific
• Ended master relationship agreement with IOOF
• Sale of NZ Wealth advisory
• Good progress on WIB international consolidation
• 300 of 1,000 offshore roles returned to Australia
• New Executive Team in place• Improved mortgage momentum‒ Average weekly applications up
24% from 4Q20 and up 34% from 1Q20
• Progressing cost reduction actions with Cost Reset plan to be announced at 1H21
2
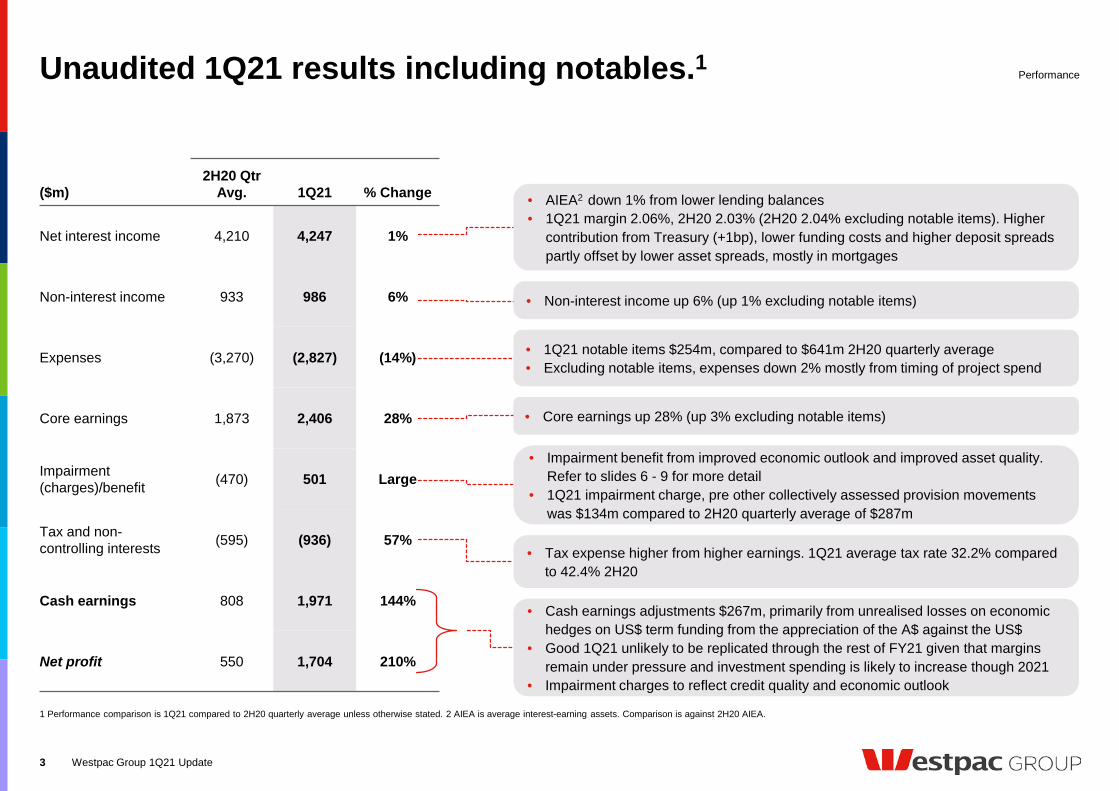
($m)2H20 Qtr
Avg. 1Q21 % Change
Net interest income 4,210 4,247 1%
Non-interest income 933 986 6%
Expenses (3,270) (2,827) (14%)
Core earnings 1,873 2,406 28%
Impairment (charges)/benefit (470) 501 Large
Tax and non-controlling interests (595) (936) 57%
Cash earnings 808 1,971 144%
Net profit 550 1,704 210%
• 1Q21 notable items $254m, compared to $641m 2H20 quarterly average• Excluding notable items, expenses down 2% mostly from timing of project spend
Unaudited 1Q21 results including notables.1
1 Performance comparison is 1Q21 compared to 2H20 quarterly average unless otherwise stated. 2 AIEA is average interest-earning assets. Comparison is against 2H20 AIEA.
Performance
Westpac Group 1Q21 Update3
• AIEA2 down 1% from lower lending balances• 1Q21 margin 2.06%, 2H20 2.03% (2H20 2.04% excluding notable items). Higher
contribution from Treasury (+1bp), lower funding costs and higher deposit spreads partly offset by lower asset spreads, mostly in mortgages
• Impairment benefit from improved economic outlook and improved asset quality. Refer to slides 6 - 9 for more detail
• 1Q21 impairment charge, pre other collectively assessed provision movements was $134m compared to 2H20 quarterly average of $287m
• Cash earnings adjustments $267m, primarily from unrealised losses on economic hedges on US$ term funding from the appreciation of the A$ against the US$
• Good 1Q21 unlikely to be replicated through the rest of FY21 given that margins remain under pressure and investment spending is likely to increase though 2021
• Impairment charges to reflect credit quality and economic outlook
• Non-interest income up 6% (up 1% excluding notable items)
• Tax expense higher from higher earnings. 1Q21 average tax rate 32.2% compared to 42.4% 2H20
• Core earnings up 28% (up 3% excluding notable items)
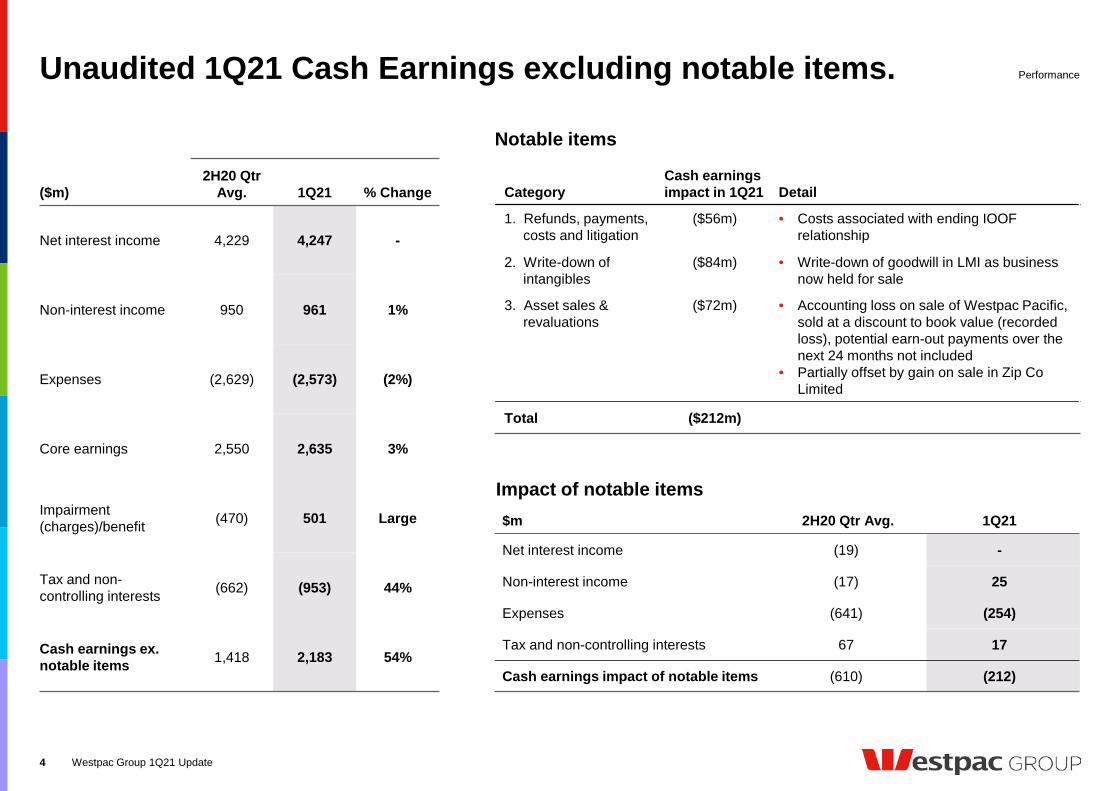
Unaudited 1Q21 Cash Earnings excluding notable items.
CategoryCash earnings impact in 1Q21 Detail
1. Refunds, payments, costs and litigation
($56m) • Costs associated with ending IOOF relationship
2. Write-down of intangibles
($84m) • Write-down of goodwill in LMI as business now held for sale
3. Asset sales & revaluations
($72m) • Accounting loss on sale of Westpac Pacific, sold at a discount to book value (recorded loss), potential earn-out payments over the next 24 months not included
• Partially offset by gain on sale in Zip Co Limited
Total ($212m)
Westpac Group 1Q21 Update4
Performance
($m)2H20 Qtr
Avg. 1Q21 % Change
Net interest income 4,229 4,247 -
Non-interest income 950 961 1%
Expenses (2,629) (2,573) (2%)
Core earnings 2,550 2,635 3%
Impairment (charges)/benefit (470) 501 Large
Tax and non-controlling interests (662) (953) 44%
Cash earnings ex. notable items 1,418 2,183 54%
$m 2H20 Qtr Avg. 1Q21
Net interest income (19) -
Non-interest income (17) 25
Expenses (641) (254)
Tax and non-controlling interests 67 17
Cash earnings impact of notable items (610) (212)
Impact of notable items
Notable items
0.67 0.58 0.440.27 0.20 0.22 0.15 0.14 0.17 0.20 0.26 0.21
0.460.35
0.31
0.260.25 0.33 0.34 0.39
0.48 0.50
0.80 0.75
2.07
1.24
0.85
0.710.54
0.650.56 0.55
0.550.62
0.850.80
3.20
2.17
1.60
1.24
0.99
1.201.05 1.08
1.201.32
1.911.76
Sep-
10
Sep-
12
Sep-
13
Sep-
14
Sep-
15
Sep-
16
Sep-
17
Sep-
18
Sep-
19
Mar
-20
Sep-
20
Dec
-20
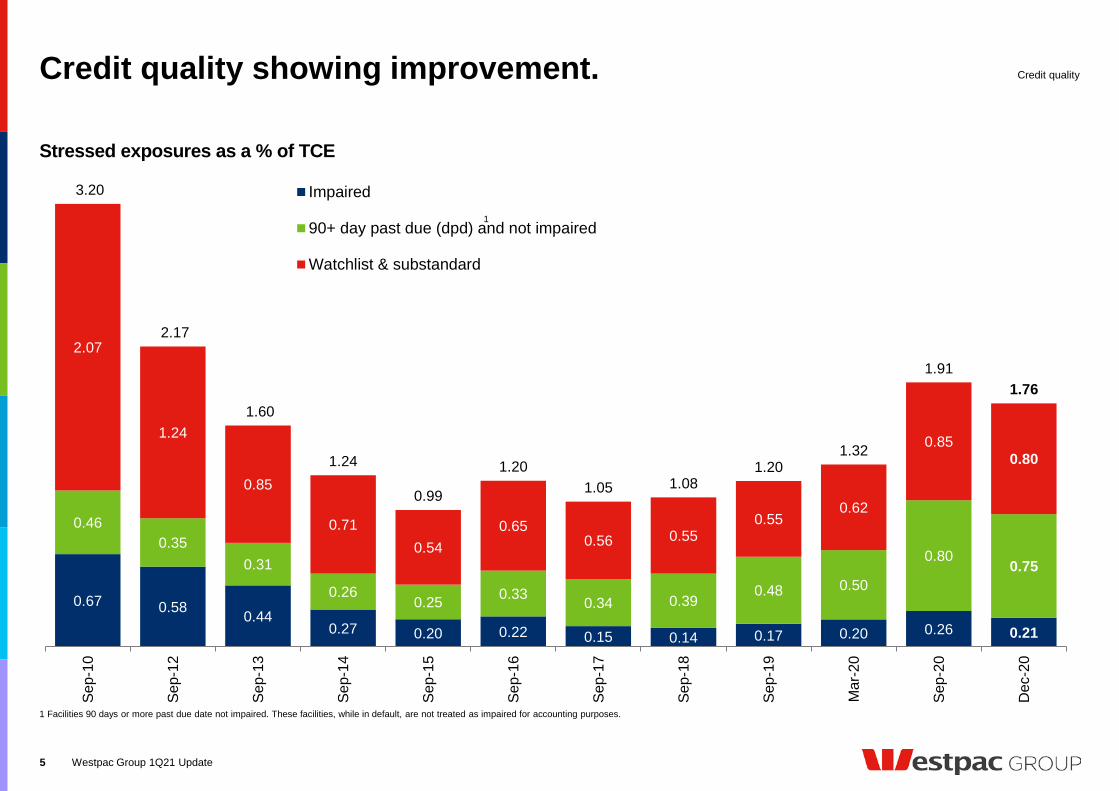
Impaired
90+ day past due (dpd) and not impaired
Watchlist & substandard
Credit quality showing improvement.
Westpac Group 1Q21 Update5
1 Facilities 90 days or more past due date not impaired. These facilities, while in default, are not treated as impaired for accounting purposes.
Stressed exposures as a % of TCE
Credit quality
1
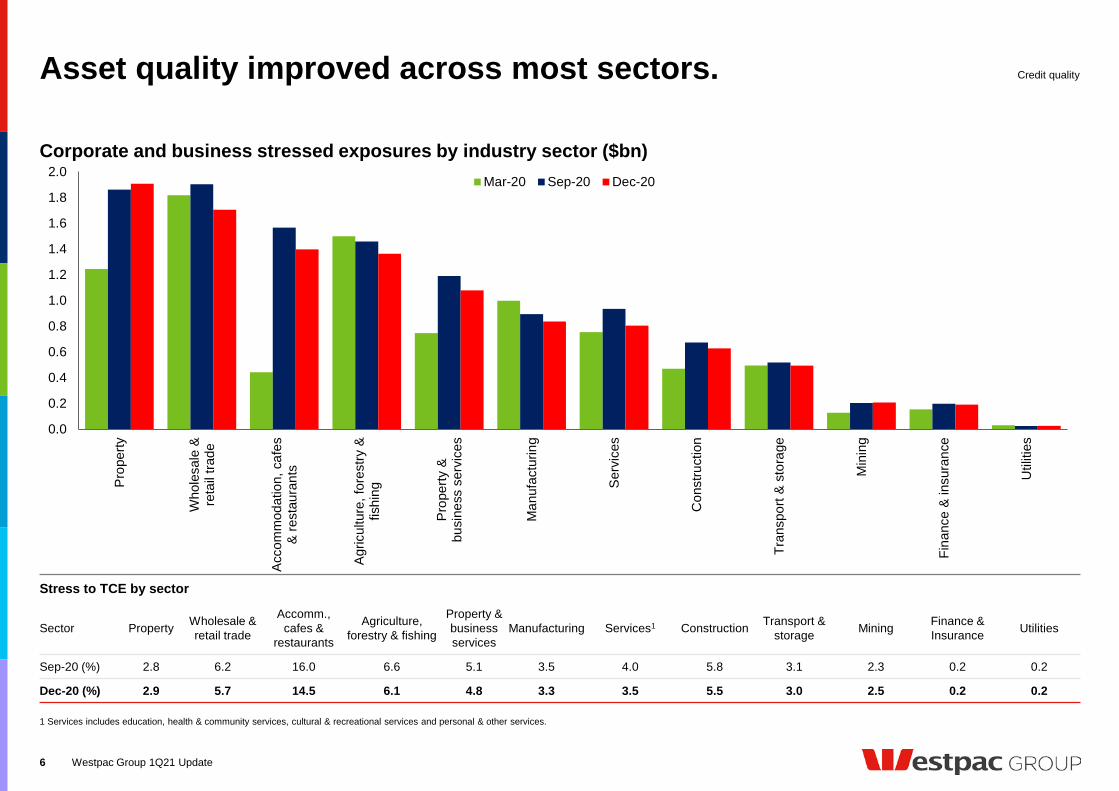
Asset quality improved across most sectors.
6
Corporate and business stressed exposures by industry sector ($bn)
1 Services includes education, health & community services, cultural & recreational services and personal & other services.
Westpac Group 1Q21 Update
0.0
0.2
0.4
0.6
0.8
1.0
1.2
1.4
1.6
1.8
2.0
Prop
erty
Who
lesa
le &
reta
il tra
de
Acco
mm
odat
ion,
caf
es&
rest
aura
nts
Agric
ultu
re, f
ores
try &
fishi
ng
Prop
erty
&bu
sine
ss s
ervi
ces
Man
ufac
turin
g
Serv
ices
Con
stru
ctio
n
Tran
spor
t & s
tora
ge
Min
ing
Fina
nce
& in
sura
nce
Util
ities
Mar-20 Sep-20 Dec-20
Stress to TCE by sector
Sector Property Wholesale & retail trade
Accomm., cafes &
restaurants
Agriculture, forestry & fishing
Property &business services
Manufacturing Services1 Construction Transport & storage Mining Finance &
Insurance Utilities
Sep-20 (%) 2.8 6.2 16.0 6.6 5.1 3.5 4.0 5.8 3.1 2.3 0.2 0.2
Dec-20 (%) 2.9 5.7 14.5 6.1 4.8 3.3 3.5 5.5 3.0 2.5 0.2 0.2
Credit quality
Westpac Group 1Q21 Update
1 Delinquency metrics excludes deferral packages.
7
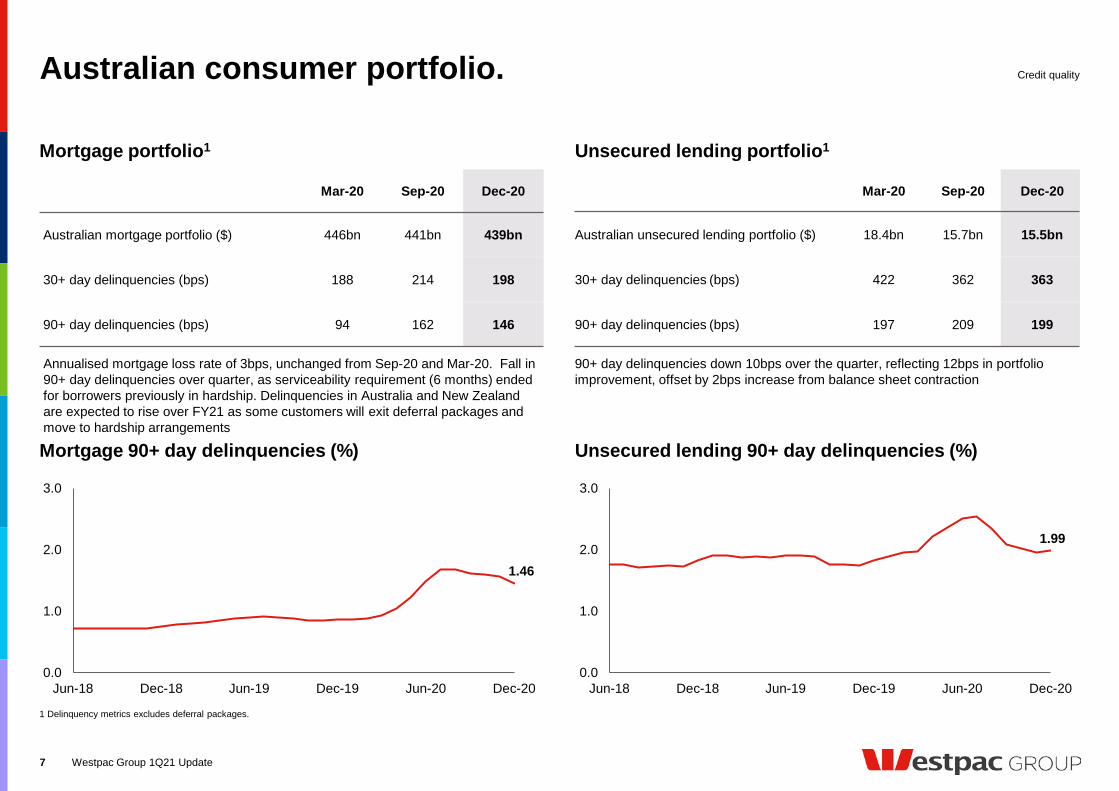
Mortgage portfolio1 Unsecured lending portfolio1
Credit quality
Mar-20 Sep-20 Dec-20
Australian mortgage portfolio ($) 446bn 441bn 439bn
30+ day delinquencies (bps) 188 214 198
90+ day delinquencies (bps) 94 162 146
Annualised mortgage loss rate of 3bps, unchanged from Sep-20 and Mar-20. Fall in 90+ day delinquencies over quarter, as serviceability requirement (6 months) ended for borrowers previously in hardship. Delinquencies in Australia and New Zealand are expected to rise over FY21 as some customers will exit deferral packages and move to hardship arrangements
Mar-20 Sep-20 Dec-20
Australian unsecured lending portfolio ($) 18.4bn 15.7bn 15.5bn
30+ day delinquencies (bps) 422 362 363
90+ day delinquencies (bps) 197 209 199
Unsecured lending 90+ day delinquencies (%)
90+ day delinquencies down 10bps over the quarter, reflecting 12bps in portfolio improvement, offset by 2bps increase from balance sheet contraction
Mortgage 90+ day delinquencies (%)
1.46
0.0
1.0
2.0
3.0
Jun-18 Dec-18 Jun-19 Dec-19 Jun-20 Dec-20
Australian consumer portfolio.
1.99
0.0
1.0
2.0
3.0
Jun-18 Dec-18 Jun-19 Dec-19 Jun-20 Dec-20
0.88
1.65
0.0
1.0
2.0
3.0
Jun-18 Dec-18 Jun-19 Dec-19 Jun-20 Dec-20
90+ day past due (ex-hardship)90+ day past due
0.14
0.34
0.0
1.0
2.0
3.0
Jun-18 Dec-18 Jun-19 Dec-19 Jun-20 Dec-20
90+ day past due (ex-hardship) 90+ day past due
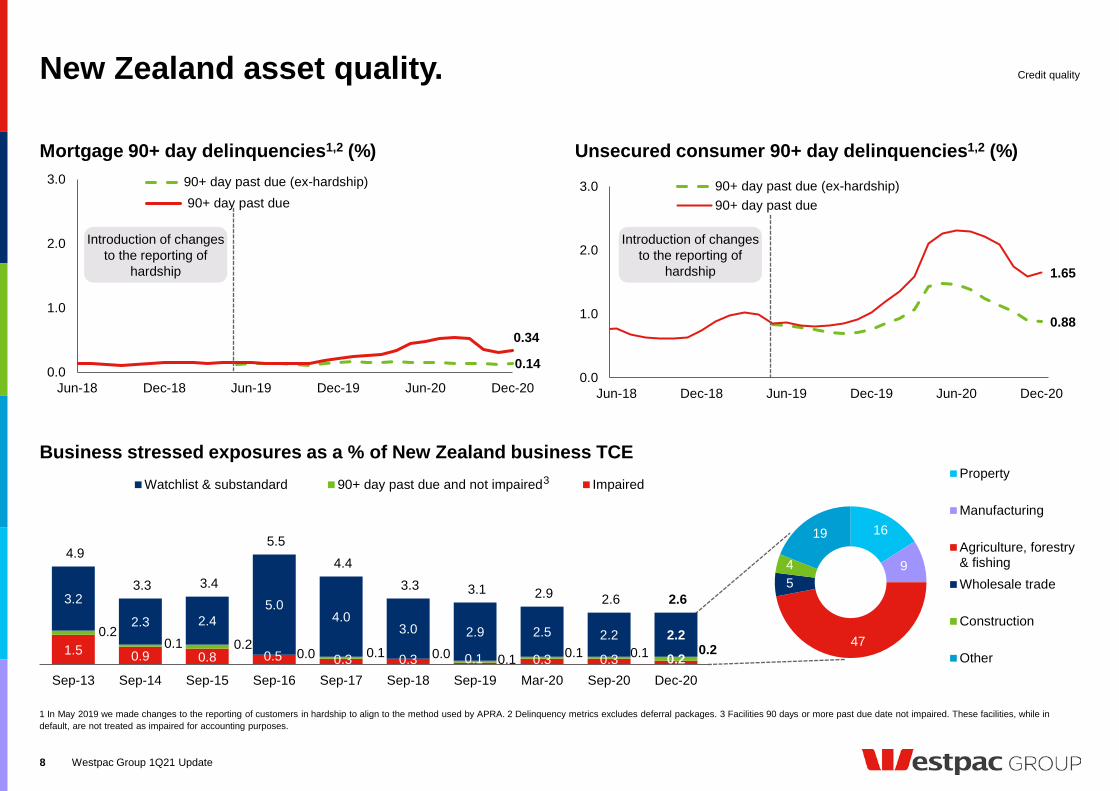
New Zealand asset quality.
Westpac Group 1Q21 Update
Mortgage 90+ day delinquencies1,2 (%) Unsecured consumer 90+ day delinquencies1,2 (%)
Business stressed exposures as a % of New Zealand business TCE
1 In May 2019 we made changes to the reporting of customers in hardship to align to the method used by APRA. 2 Delinquency metrics excludes deferral packages. 3 Facilities 90 days or more past due date not impaired. These facilities, while in default, are not treated as impaired for accounting purposes.
8
Introduction of changes to the reporting of
hardship
Credit quality
1.5 0.9 0.8 0.5 0.3 0.3 0.1 0.3 0.3 0.2
0.20.1 0.2
0.0 0.1 0.0 0.1 0.1 0.1 0.2
3.2
2.3 2.45.0
4.03.0 2.9 2.5 2.2 2.2
4.9
3.3 3.4
5.5 4.4
3.3 3.1 2.9 2.6 2.6
Sep-13 Sep-14 Sep-15 Sep-16 Sep-17 Sep-18 Sep-19 Mar-20 Sep-20 Dec-20
Watchlist & substandard 90+ day past due and not impaired Impaired
16
9
47
54
19
Property
Manufacturing
Agriculture, forestry& fishingWholesale trade
Construction
Other
Introduction of changes to the reporting of
hardship
3
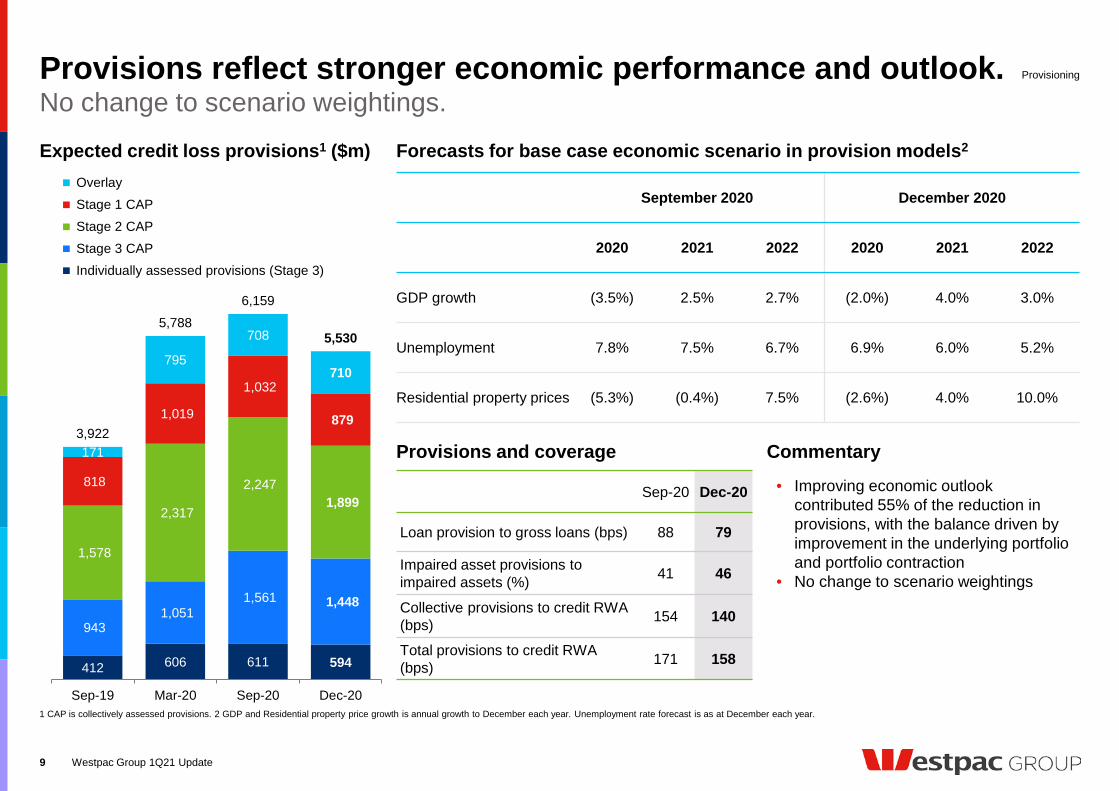
Provisions reflect stronger economic performance and outlook.
Westpac Group 1Q21 Update
Expected credit loss provisions1 ($m)
No change to scenario weightings.Provisioning
9
September 2020 December 2020
2020 2021 2022 2020 2021 2022
GDP growth (3.5%) 2.5% 2.7% (2.0%) 4.0% 3.0%
Unemployment 7.8% 7.5% 6.7% 6.9% 6.0% 5.2%
Residential property prices (5.3%) (0.4%) 7.5% (2.6%) 4.0% 10.0%
Forecasts for base case economic scenario in provision models2
Sep-20 Dec-20
Loan provision to gross loans (bps) 88 79
Impaired asset provisions to impaired assets (%) 41 46
Collective provisions to credit RWA (bps) 154 140
Total provisions to credit RWA (bps) 171 158
Provisions and coverage
1 CAP is collectively assessed provisions. 2 GDP and Residential property price growth is annual growth to December each year. Unemployment rate forecast is as at December each year.
• Improving economic outlook contributed 55% of the reduction in provisions, with the balance driven by improvement in the underlying portfolio and portfolio contraction
• No change to scenario weightings
Commentary
412 606 611 594
943 1,051
1,561 1,448
1,578
2,317
2,247 1,899
818
1,019
1,032
879
171
795
708
710
3,922
5,7886,159
5,530
Sep-19 Mar-20 Sep-20 Dec-20
Overlay Stage 1 CAP Stage 2 CAP Stage 3 CAP Individually assessed provisions (Stage 3)
419
76
Total deferrals at31 Jan 21 (%)
Returned torepayment
Activedeferrals
Restructuredor hardship
100
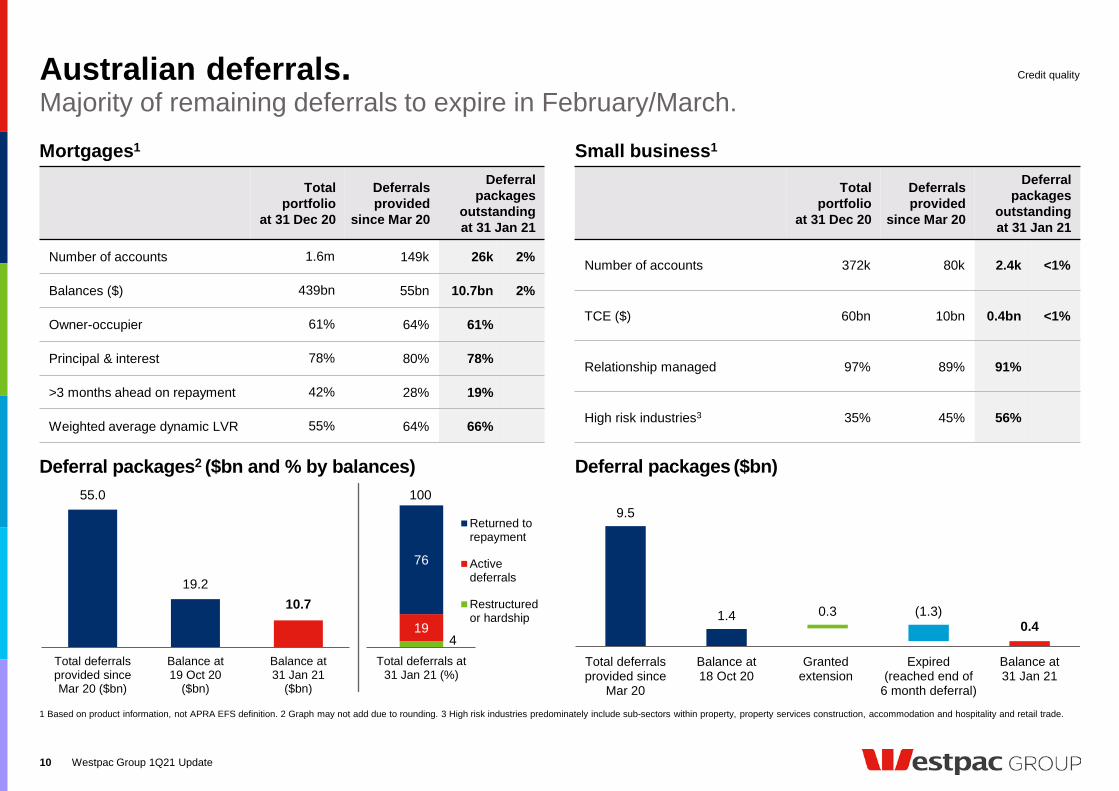
Australian deferrals.
Westpac Group 1Q21 Update10
Mortgages1 Small business1
Deferral packages ($bn)
Majority of remaining deferrals to expire in February/March.
1 Based on product information, not APRA EFS definition. 2 Graph may not add due to rounding. 3 High risk industries predominately include sub-sectors within property, property services construction, accommodation and hospitality and retail trade.
Credit quality
Total portfolio
at 31 Dec 20
Deferrals provided
since Mar 20
Deferral packages
outstandingat 31 Jan 21
Number of accounts 1.6m 149k 26k 2%
Balances ($) 439bn 55bn 10.7bn 2%
Owner-occupier 61% 64% 61%
Principal & interest 78% 80% 78%
>3 months ahead on repayment 42% 28% 19%
Weighted average dynamic LVR 55% 64% 66%
Total portfolio
at 31 Dec 20
Deferrals provided
since Mar 20
Deferral packages
outstandingat 31 Jan 21
Number of accounts 372k 80k 2.4k <1%
TCE ($) 60bn 10bn 0.4bn <1%
Relationship managed 97% 89% 91%
High risk industries3 35% 45% 56%
Deferral packages2 ($bn and % by balances)55.0
19.210.7
Total deferralsprovided sinceMar 20 ($bn)
Balance at19 Oct 20
($bn)
Balance at31 Jan 21
($bn)
9.5
1.4 0.3 (1.3)0.4
Total deferralsprovided since
Mar 20
Balance at18 Oct 20
Grantedextension
Expired(reached end of
6 month deferral)
Balance at31 Jan 21
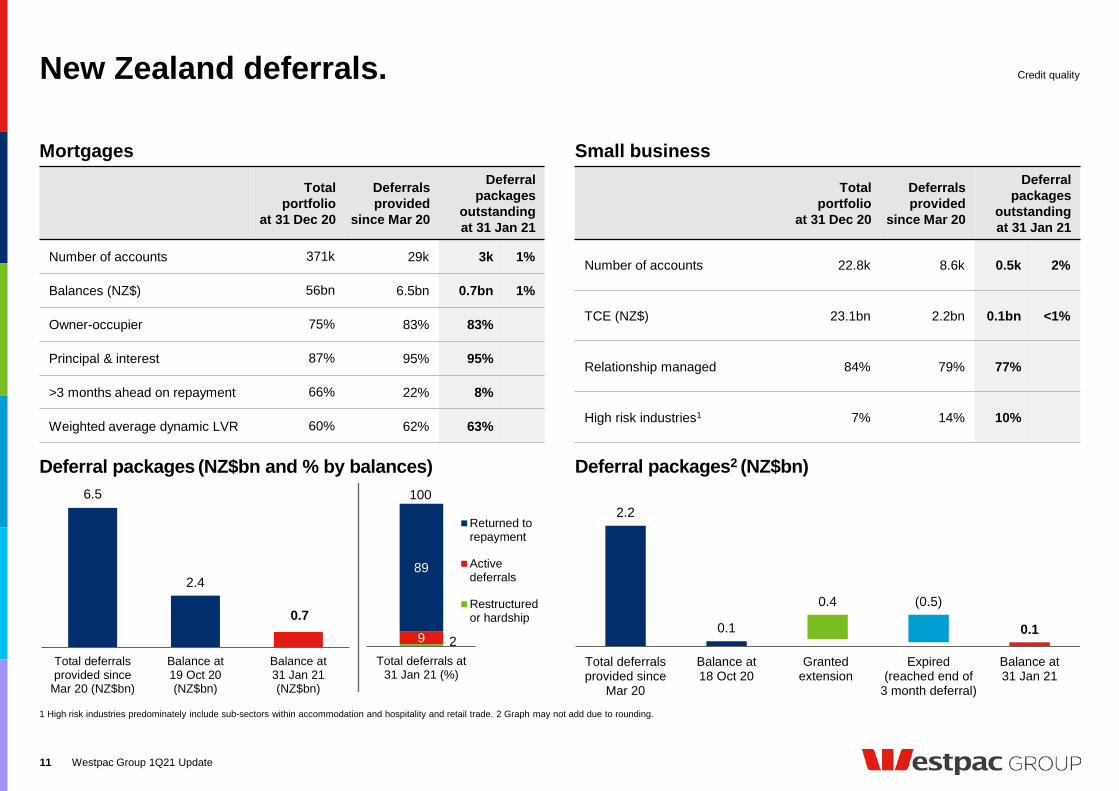
New Zealand deferrals.
Westpac Group 1Q21 Update11
Mortgages Small business
1 High risk industries predominately include sub-sectors within accommodation and hospitality and retail trade. 2 Graph may not add due to rounding.
Credit quality
Deferral packages2 (NZ$bn)Deferral packages (NZ$bn and % by balances)
Total portfolio
at 31 Dec 20
Deferrals provided
since Mar 20
Deferral packages
outstandingat 31 Jan 21
Number of accounts 371k 29k 3k 1%
Balances (NZ$) 56bn 6.5bn 0.7bn 1%
Owner-occupier 75% 83% 83%
Principal & interest 87% 95% 95%
>3 months ahead on repayment 66% 22% 8%
Weighted average dynamic LVR 60% 62% 63%
Total portfolio
at 31 Dec 20
Deferrals provided
since Mar 20
Deferral packages
outstandingat 31 Jan 21
Number of accounts 22.8k 8.6k 0.5k 2%
TCE (NZ$) 23.1bn 2.2bn 0.1bn <1%
Relationship managed 84% 79% 77%
High risk industries1 7% 14% 10%
2.2
0.1
0.4 (0.5)
0.1
Total deferralsprovided since
Mar 20
Balance at18 Oct 20
Grantedextension
Expired(reached end of
3 month deferral)
Balance at31 Jan 21
29
89
Total deferrals at31 Jan 21 (%)
Returned torepayment
Activedeferrals
Restructuredor hardship
1006.5
2.4
0.7
Total deferralsprovided since
Mar 20 (NZ$bn)
Balance at19 Oct 20(NZ$bn)
Balance at31 Jan 21(NZ$bn)
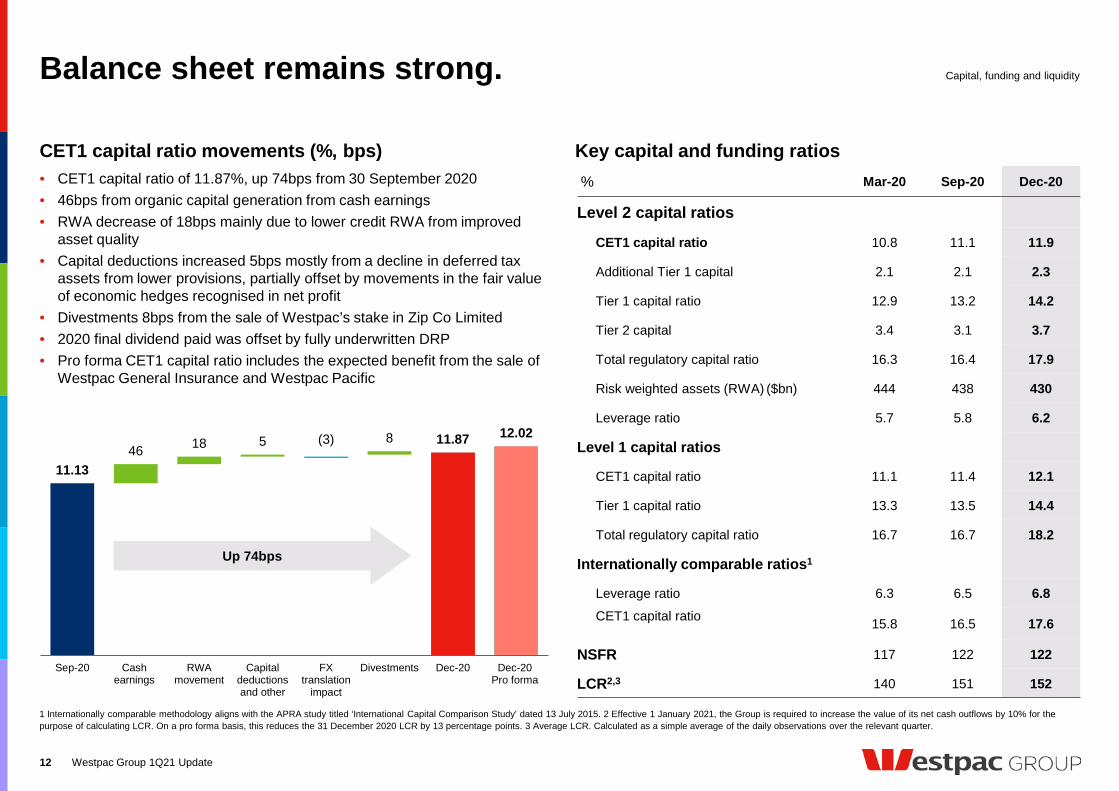
• CET1 capital ratio of 11.87%, up 74bps from 30 September 2020• 46bps from organic capital generation from cash earnings• RWA decrease of 18bps mainly due to lower credit RWA from improved
asset quality • Capital deductions increased 5bps mostly from a decline in deferred tax
assets from lower provisions, partially offset by movements in the fair value of economic hedges recognised in net profit
• Divestments 8bps from the sale of Westpac’s stake in Zip Co Limited• 2020 final dividend paid was offset by fully underwritten DRP • Pro forma CET1 capital ratio includes the expected benefit from the sale of
Westpac General Insurance and Westpac Pacific
Westpac Group 1Q21 Update
CET1 capital ratio movements (%, bps)
Balance sheet remains strong. Capital, funding and liquidity
12
1 Internationally comparable methodology aligns with the APRA study titled ‘International Capital Comparison Study’ dated 13 July 2015. 2 Effective 1 January 2021, the Group is required to increase the value of its net cash outflows by 10% for the purpose of calculating LCR. On a pro forma basis, this reduces the 31 December 2020 LCR by 13 percentage points. 3 Average LCR. Calculated as a simple average of the daily observations over the relevant quarter.
Key capital and funding ratios% Mar-20 Sep-20 Dec-20
Level 2 capital ratios
CET1 capital ratio 10.8 11.1 11.9
Additional Tier 1 capital 2.1 2.1 2.3
Tier 1 capital ratio 12.9 13.2 14.2
Tier 2 capital 3.4 3.1 3.7
Total regulatory capital ratio 16.3 16.4 17.9
Risk weighted assets (RWA) ($bn) 444 438 430
Leverage ratio 5.7 5.8 6.2
Level 1 capital ratios
CET1 capital ratio 11.1 11.4 12.1
Tier 1 capital ratio 13.3 13.5 14.4
Total regulatory capital ratio 16.7 16.7 18.2
Internationally comparable ratios1
Leverage ratio 6.3 6.5 6.8CET1 capital ratio 15.8 16.5 17.6
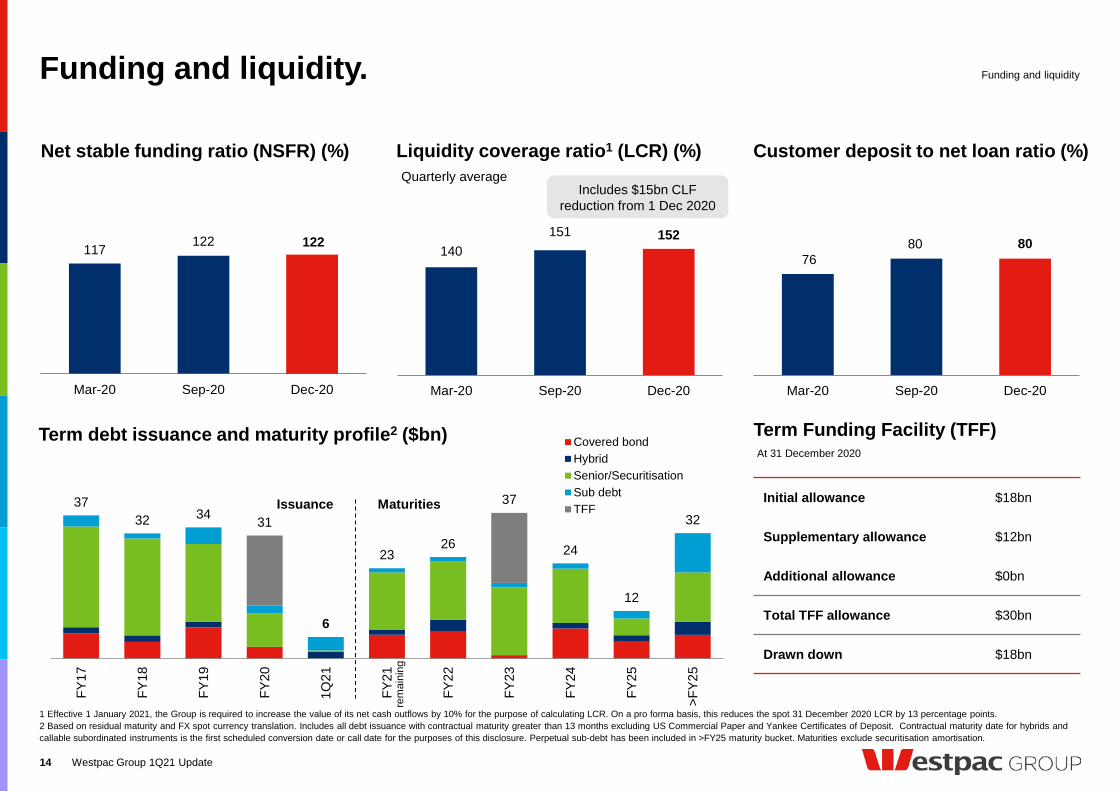
NSFR 117 122 122
LCR2,3 140 151 152
11.1346 18 5 8 11.87(3) 12.02
Sep-20 Cashearnings
RWAmovement
Capitaldeductionsand other
FXtranslation
impact
Divestments Dec-20 Dec-20Pro forma
Up 74bps
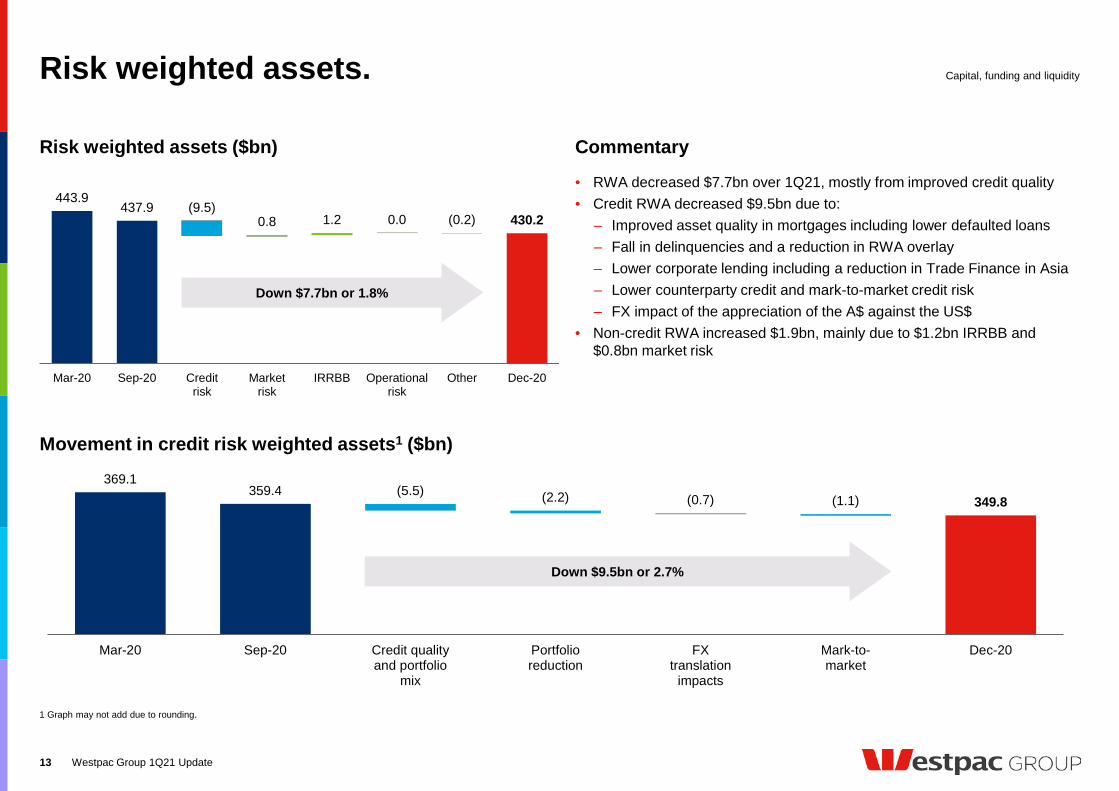
369.1359.4
349.8(5.5) (2.2) (0.7) (1.1)
Mar-20 Sep-20 Credit qualityand portfolio
mix
Portfolioreduction
FXtranslation
impacts
Mark-to-market
Dec-20
Risk weighted assets.
Westpac Group 1Q21 Update
• RWA decreased $7.7bn over 1Q21, mostly from improved credit quality • Credit RWA decreased $9.5bn due to:
‒ Improved asset quality in mortgages including lower defaulted loans‒ Fall in delinquencies and a reduction in RWA overlay‒ Lower corporate lending including a reduction in Trade Finance in Asia‒ Lower counterparty credit and mark-to-market credit risk ‒ FX impact of the appreciation of the A$ against the US$
• Non-credit RWA increased $1.9bn, mainly due to $1.2bn IRRBB and $0.8bn market risk
443.9437.9
0.8 1.2 0.0 430.2(9.5)
(0.2)
Mar-20 Sep-20 Creditrisk
Marketrisk
IRRBB Operationalrisk
Other Dec-20
Down $7.7bn or 1.8%
Risk weighted assets ($bn)
Movement in credit risk weighted assets1 ($bn)
Capital, funding and liquidity
13
Commentary
1 Graph may not add due to rounding.
Down $9.5bn or 2.7%
Funding and liquidity.
Westpac Group 1Q21 Update
Funding and liquidity
14
Customer deposit to net loan ratio (%)Liquidity coverage ratio1 (LCR) (%)
140151 152
Mar-20 Sep-20 Dec-20
117 122 122
Mar-20 Sep-20 Dec-20
Term Funding Facility (TFF)
Initial allowance $18bn
Supplementary allowance $12bn
Additional allowance $0bn
Total TFF allowance $30bn
Drawn down $18bn
7680 80
Mar-20 Sep-20 Dec-20
Net stable funding ratio (NSFR) (%)
1 Effective 1 January 2021, the Group is required to increase the value of its net cash outflows by 10% for the purpose of calculating LCR. On a pro forma basis, this reduces the spot 31 December 2020 LCR by 13 percentage points.2 Based on residual maturity and FX spot currency translation. Includes all debt issuance with contractual maturity greater than 13 months excluding US Commercial Paper and Yankee Certificates of Deposit. Contractual maturity date for hybrids and callable subordinated instruments is the first scheduled conversion date or call date for the purposes of this disclosure. Perpetual sub-debt has been included in >FY25 maturity bucket. Maturities exclude securitisation amortisation.
Quarterly average
At 31 December 2020
3732 34 31
6
2326
37
24
12
32
FY17
FY18
FY19
FY20
1Q21
FY21
FY22
FY23
FY24
FY25
>FY2
5
Covered bondHybridSenior/SecuritisationSub debtTFF
Term debt issuance and maturity profile2 ($bn)
Issuance Maturities
rem
aini
ng
Includes $15bn CLF reduction from 1 Dec 2020

Financial results throughout this presentation are in Australian dollars and are based on cash earnings unless otherwise stated. Refer to the 2020 Full Year Financial Results Presentation and Investor Discussion Pack for definition. All results relating to 1Q21 are on an unaudited basis. This document should be read in conjunction with Westpac’s December 2020 Pillar 3 Report, incorporating the requirements of APS330. Results principally cover and compare the 1Q21 and 2H20 quarterly average periods unless otherwise stated.
Westpac Group 1Q21 Update15

Our strategy. Appendix
16 Westpac Group 1Q21 Update
Prio
ritie
sVa
lues
Helpful Ethical Leading Change Performing Simple
Purp
ose
50
Mar
kets
, pr
oduc
ts,
cust
omer
s
Simplify
Sustainable long-term returns• Customer service – market leading
• Growth in key markets
• Re-set cost base
• Enhance returns, optimise capital
• Strong balance sheet
Streamline and focus the business• Exit non-core businesses
and consolidate international
• Reduce products, simplify customer offer
• Lines of Business operating model
• Transform using digital and data to enhance the customer experience
Address outstanding issues• Risk management
• Risk culture
• Customer remediation & pain points
• IT complexity
Helping Australians and New Zealanders Succeed
Banking for consumer, business and institutional customers
Fix Perform

Priorities for FY21.
1 Refers to the monthly growth rate for Australian housing lending outstanding.
Appendix
17
SimplifyFix Perform
• Continue to strengthen risk management‒ Financial Crime remediation ‒ Expand/deliver CORE Program‒ Reduce correspondent bank
relationships• Accelerate customer payments &
complete Advice remediation• Enhance performance culture• Complete multi-year technology
plan
• Portfolio simplification ‒ Continue to exit non-core
businesses‒ Close 5 international offices
• System simplification ‒ Migrate BT Wrap customers
and advisers to Panorama‒ Customer Service Hub roll-out
across brands and brokers• Further migrate customers to
current products• Embed Lines of Business model
• Support customers through COVID-19
• Mortgage growth in line with major banks by 2H211
• Deliver 3 year cost plan• Maintain balance sheet strength
and return focus
Westpac Group 1Q21 Update
1Q21 reported net profit after tax.1
Westpac Group 1Q21 Update18
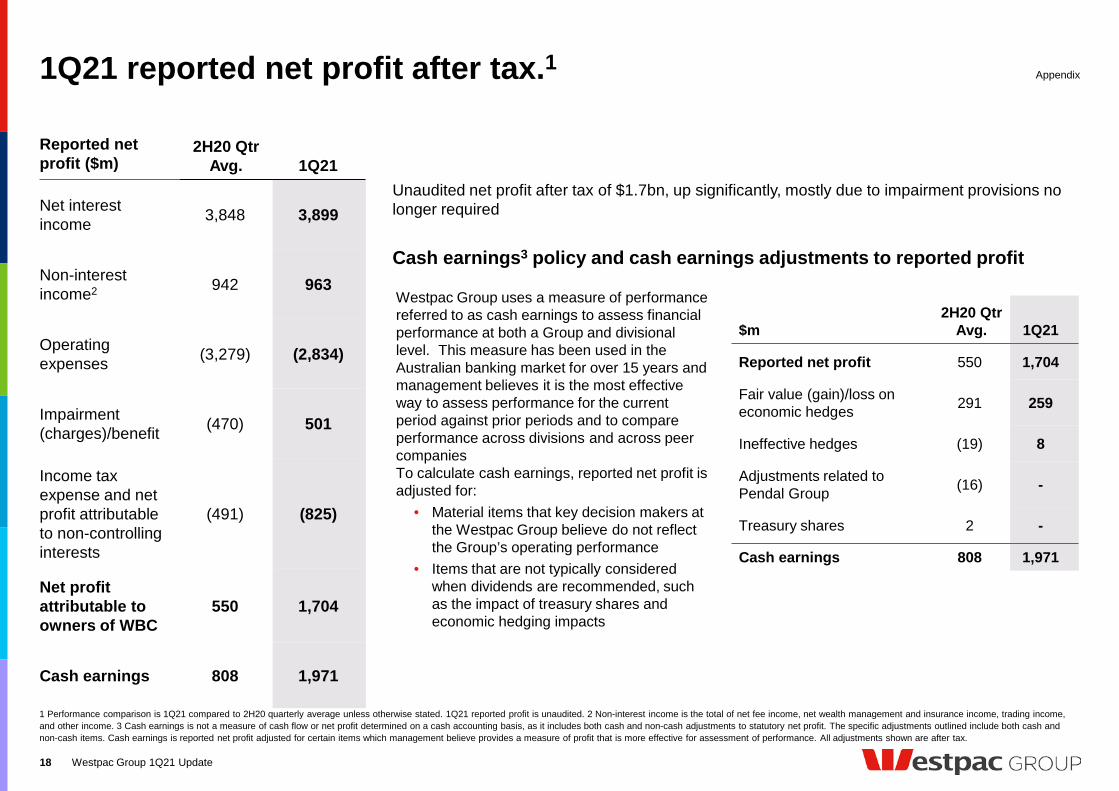
Unaudited net profit after tax of $1.7bn, up significantly, mostly due to impairment provisions no longer required
1 Performance comparison is 1Q21 compared to 2H20 quarterly average unless otherwise stated. 1Q21 reported profit is unaudited. 2 Non-interest income is the total of net fee income, net wealth management and insurance income, trading income, and other income. 3 Cash earnings is not a measure of cash flow or net profit determined on a cash accounting basis, as it includes both cash and non-cash adjustments to statutory net profit. The specific adjustments outlined include both cash and non-cash items. Cash earnings is reported net profit adjusted for certain items which management believe provides a measure of profit that is more effective for assessment of performance. All adjustments shown are after tax.
Cash earnings3 policy and cash earnings adjustments to reported profit
Reported net profit ($m)
2H20 QtrAvg. 1Q21
Net interest income 3,848 3,899
Non-interest income2 942 963
Operating expenses (3,279) (2,834)
Impairment (charges)/benefit (470) 501
Income tax expense and net profit attributable to non-controlling interests
(491) (825)
Net profit attributable to owners of WBC
550 1,704
Cash earnings 808 1,971
$m2H20 Qtr
Avg. 1Q21
Reported net profit 550 1,704
Fair value (gain)/loss on economic hedges 291 259
Ineffective hedges (19) 8
Adjustments related to Pendal Group (16) -
Treasury shares 2 -
Cash earnings 808 1,971
Westpac Group uses a measure of performance referred to as cash earnings to assess financial performance at both a Group and divisional level. This measure has been used in the Australian banking market for over 15 years and management believes it is the most effective way to assess performance for the current period against prior periods and to compare performance across divisions and across peer companiesTo calculate cash earnings, reported net profit is adjusted for:
• Material items that key decision makers at the Westpac Group believe do not reflect the Group’s operating performance
• Items that are not typically considered when dividends are recommended, such as the impact of treasury shares and economic hedging impacts
Appendix

Louise CoughlanHead of Rating Agencies and Analysis
+61 2 8254 0549+61 425 213 [email protected]
Investor Relations Team.Contact Us.
Contact us
Or email: [email protected]
www.westpac.com.au/investorcentreAnnual reportsPresentations and webcasts5 year financial summaryPrior financial results
19 Westpac Group 1Q21 Update
Andrew BowdenHead of Investor Relations
+61 2 8253 4008+61 438 284 [email protected]
Jacqueline BoddyHead of Debt Investor Relations
+61 2 8253 3133+61 448 064 [email protected]
Alec LeithheadManager
+61 2 8254 0159+61 481 906 [email protected]
Rebecca PlackettDirector
+61 2 8253 6556+61 478 336 [email protected]
Disclaimer
The material contained in this presentation is intended to be general background information on Westpac Banking Corporation (Westpac) and its activities.
The information is supplied in summary form and is therefore not necessarily complete. It is not intended that it be relied upon as advice to investors or potential investors, who should consider seeking independent professional advice depending upon their specific investment objectives, financial situation or particular needs. The material contained in this presentation may include information derived from publicly available sources that have not been independently verified. No representation or warranty is made as to the accuracy, completeness or reliability of the information.
All amounts are in Australian dollars unless otherwise indicated.
Unless otherwise noted, financial information in this presentation is presented on a cash earnings basis. Cash earnings is a non-GAAP measure. Refer to Westpac’s 2020 Full Year Financial Results (incorporating the requirements of Appendix 4E) for the twelve months ended 30 September 2020 available at www.westpac.com.au for details of the basis of preparation of cash earnings. Refer to Westpac’s 2020 Full Year Financial Results Presentation and Investor Discussion Pack for an explanation of cash earnings and a reconciliation of reported net profit to cash earnings.
The financial information for the three months ended 31 December 2020 has not been audited or reviewed by any independent registered public accounting firm and has been derived from the unaudited financial statements for the quarter ended 31 December 2020. Any other financial information provided as at a date after 31 December 2020 (including information on deferral packages) has not been audited or reviewed by any independent registered public accounting firm either. The information contained in this presentation is presented for information purposes only, is based on management’s current information and reflects management’s view of other factors, including a wide variety of significant business, economic and competitive risks and uncertainties, which may be heightened during the ongoing COVID-19 pandemic. Certain data herein may involve underlying estimates, assumptions and judgments when applying accounting policies and preparing its financial statements, particularly in connection with the calculation of provisions. Any change in such estimates, assumptions and/or judgments resulting from new information or from changes in circumstances or experience could result in Westpac incurring losses greater than those anticipated or provided for.This presentation contains statements that constitute “forward-looking statements” within the meaning of Section 21E of the US Securities Exchange Act of 1934. Forward-looking statements are statements about matters that are not historical facts. Forward-looking statements appear in a number of places in this presentation and include statements regarding our intent, belief or current expectations with respect to our business and operations, macro and micro economic and market conditions, results of operations and financial condition, including, without limitation, future loan loss provisions, financial support to certain borrowers, indicative drivers, forecasted economic indicators and performance metric outcomes.We use words such as ‘will’, ‘may’, ‘expect’, ‘intend’, ‘seek’, ‘would’, ‘should’, ‘could’, ‘continue’, ‘plan’, ‘estimate’, ‘anticipate’, ‘believe’, ‘probability’, ‘risk’, ‘aim’, or other similar words to identify forward-looking statements. These forward-looking statements reflect our current views with respect to future events and are subject to change, certain risks, uncertainties and assumptions which are, in many instances, beyond our control, and have been made based upon management’s expectations and beliefs concerning future developments and their potential effect upon us. There can be no assurance that future developments will be in accordance with our expectations or that the effect of future developments on us will be those anticipated. Actual results could differ materially from those which we expect, depending on the outcome of various factors. Factors that may impact on the forward-looking statements made include, but are not limited to, those described in the section titled ‘Risk factors' in Westpac’s 2020 Annual Report for the twelve months ended 30 September 2020 available at www.westpac.com.au. When relying on forward-looking statements to make decisions with respect to us, investors and others should carefully consider such factors and other uncertainties and events. We are under no obligation to update any forward-looking statements contained in this presentation, whether as a result of new information, future events or otherwise, after the date of this presentation.
Disclaimer
20 Westpac Group 1Q21 Update