instructions for use - cascades...the containerboard market two us$50/s.t. price increases since...
TRANSCRIPT

CASCADES INC. NBF Québec Conference June 5, 2013

2
Preserving and improving a Canadian success story
INTRODUCTION
Our recent performance and financial situation • Pressures from cost inflation • Slow growth, particularly in Canada • Productivity and profitability improvement necessary • 2011 left us with an over-levered balance sheet • No immediate maturity but we need to address the debt situation
Where we come from • Unique culture – green visionaries, opportunistic turnarounds, importance of
autonomy and empowerment, open book and profit sharing, decentralized structure • Business model challenged with dollar at parity and volatile recycled fibre costs
Our action plan • Started at the end of 2011 • A lot has been done but the plan is not completed yet • Balance sheet reflects investments but benefits not yet in results • Start-up of the Greenpac mill in July 2013
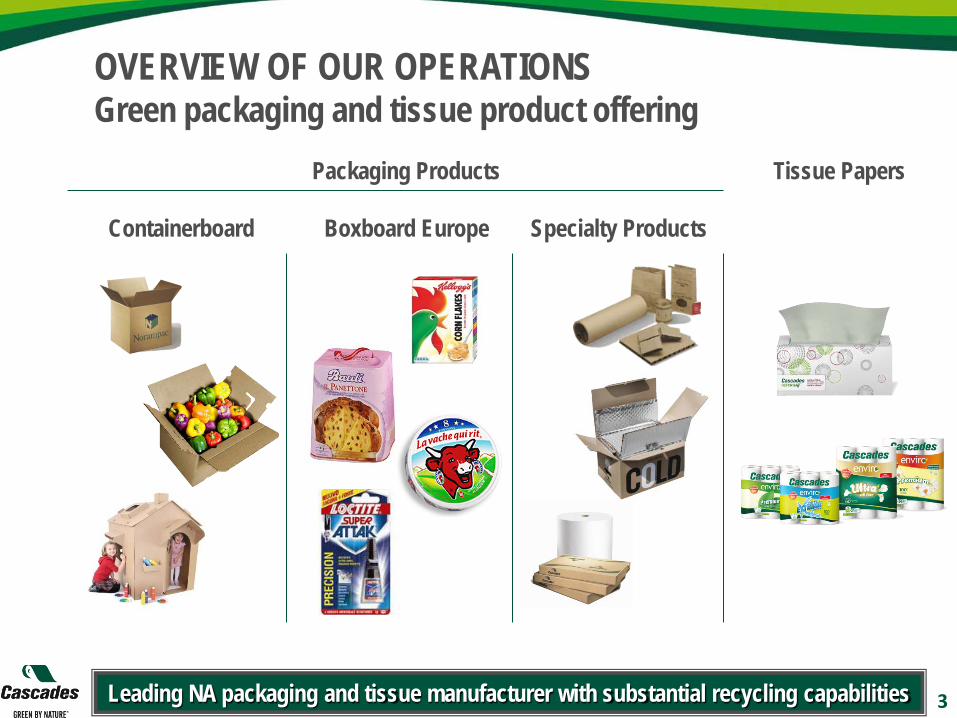
OVERVIEW OF OUR OPERATIONS Green packaging and tissue product offering
3
Packaging Products Tissue Papers Containerboard Boxboard Europe Specialty Products
Leading NA packaging and tissue manufacturer with substantial recycling capabilities

OVERVIEW OF OUR OPERATIONS Closed-loop business model
4
100+ business units
32 units
23 units
58 units
May be sent to recycling centers
77% recycled fibre (2.9M tons)
NA integration rate (2012):
34% (520K tons)
NA integration rate (2012): •Containerboard Group 56% •Tissue Papers Group 69%
Including seven manufacturing/converting tissue papers units and Reno De Medici’s units.
Upstream and downstream integration in North America
CLIENTS
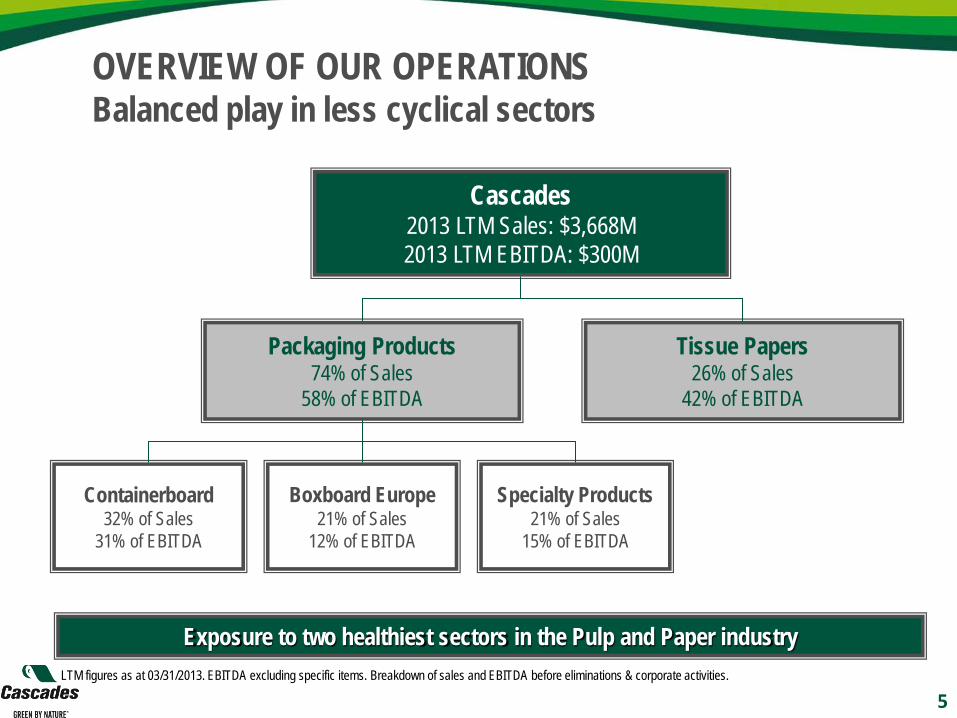
OVERVIEW OF OUR OPERATIONS Balanced play in less cyclical sectors
5
Packaging Products 74% of Sales
58% of EBITDA
Cascades 2013 LTM Sales: $3,668M 2013 LTM EBITDA: $300M
Tissue Papers 26% of Sales
42% of EBITDA
Containerboard 32% of Sales
31% of EBITDA
Boxboard Europe 21% of Sales
12% of EBITDA
Specialty Products 21% of Sales
15% of EBITDA
Exposure to two healthiest sectors in the Pulp and Paper industry LTM figures as at 03/31/2013. EBITDA excluding specific items. Breakdown of sales and EBITDA before eliminations & corporate activities.

3,278
3,929 4,017 3,877
3,182
3,625 3,645 3,668
2,500
3,000
3,500
4,000
4,500
2006 2007 2008 2009 2010 2011 2012 03/31/13LTM
(M CAN$) Sales
OUR FINANCIAL PERFORMANCE AND SITUATION Historical performance
Results impacted by challenging market conditions, lower shipments and higher cost input EBITDA excluding specific items. Note 1 – Elimination of joint venture consolidation Note 2 – Impact of Dopaco divestiture and elimination of joint venture consolidation
IFRS CANADIAN GAAP
6
315350
306
465
310
229
304 300
100
200
300
400
500
2006 2007 2008 2009 2010 2011 2012 03/31/13LTM
(M CAN$) EBITDA
IFRS CANADIAN GAAP
1
1
2
2

12 13
2
11
15 15
811
0.0%
3.0%
6.0%
9.0%
12.0%
0
5
10
15
20
Q22011
Q32011
Q42011
Q12012
Q22012
Q32012
Q42012
Q12013
(% of sales)(M CAN$)Specialty Products
16 18
2833
3935 31 29
0.0%
5.0%
10.0%
15.0%
20.0%
0
10
20
30
40
Q22011
Q32011
Q42011
Q12012
Q22012
Q32012
Q42012
Q12013
(% of sales)(M CAN$)Tissue Papers
20
27
19 21 2326 25 25
0.0%
3.0%
6.0%
9.0%
12.0%
10
15
20
25
30
Q22011
Q32011
Q42011
Q12012
Q22012
Q32012
Q42012
Q12013
(% of sales)(M CAN$)Containerboard
17
10 1013 11
711 11
0.0%
3.0%
6.0%
9.0%
12.0%
0
5
10
15
20
Q22011
Q32011
Q42011
Q12012
Q22012
Q32012
Q42012
Q12013
(% of sales)(M CAN$)Boxboard Europe
OUR FINANCIAL PERFORMANCE AND SITUATION Historical segmented EBITDA
EBITDA excluding specific items. 7
Tissue Papers
Containerboard Boxboard Europe
Specialty Products

808 826 804 809 831
500
625
750
875
1000
Q12012
Q22012
Q32012
Q42012
Q12013
('000 s.t.) Total Shipments
89% 90%
87% 88%
92%
83%
86%
89%
92%
95%
Q12012
Q22012
Q32012
Q42012
Q12013
Capacity Utilization Rate
OUR FINANCIAL PERFORMANCE AND SITUATION Key performance indicators (KPIs)
Capacity utilization rate improving and shipments picking up Refer to Notes included in the Appendix. 8
Containerboard only: 87% (for the quarter) 92% (for March 2013)
Containerboard only: 86% (for the quarter)

4.5x4.8x5.0x3.8x
4.7x5.9x
3.3x4.5x
5.8x5.0x4.8x4.4x
0.0x1.0x2.0x3.0x4.0x5.0x6.0x7.0x
2003
2004
2005
2006
2007
2008
2009
2010
2011
2012
2013
E
2014
E
OUR FINANCIAL PERFORMANCE AND SITUATION Our debt profile
No significant maturity before 2016 and sufficient liquidity 1 EBITDA excluding specific items. 2013E and 2014E ratios are based on forecasts by analysts and debt remaining at 03/31/2013 level.
Objective: reduce debt below long term average Maturities well spread out • Increase in ratios due to challenging FY2011 and
modernization program
• Short-term objective to improve profitability • Assuming debt remains the same, leverage
ratio to improve
• Mid-term objective to reach industry standards (towards 3x EBITDA)
Average 2003-20121 : 4.7x
• Banking Facilities: $422M • Senior Notes: $958M • Other Debt (net): $201M • Total Net Debt: $1,581M
• Available Liquidity (03/2013): $300M
9
Debt Maturity
Pre-20169%
201641%
201733%
202017%

OUR FINANCIAL PERFORMANCE AND SITUATION Investment program
10
Gradual capex program to improve asset base while maintaining financial flexibility
Capital Expenditures Distribution in 2012 - $198M
• Capex requests for 2013 initially approved at approximately $175M
• First allocation of $150M • Including ~$60-70M of maintenance
capex • Amount subject to change depending
on operating results and economic conditions
• Mostly dedicated towards converting operations
Corporate 10%
IT 15%
Boxboard Europe
15%
Tissue Papers
17%
Specialty Products
7%
Container-board 36%
By segment

OBM Average Quarterly List Prices Q1-2012 Q4-2012 Q1-2013 YoY QoQBrown grades - OCC No. 11 (New England) 135 98 108 -20% +10%White grades - SOP No. 37 (New England) 163 172 165 +1% -4%
Virgin Pulp PricesNBSK (Canadian sources delivered to US East) 873 863 898 +3% +4%NBHK (Canada/US sources delivered to US East) 714 744 791 +11% +6%
Mar 1
3
Current
150
100
Ma
y 13
Based on 2012 shipments, EBITDA sensitivity to US$15 or €/s.t. change: ±$47M Sources: RISI, Bloomberg.
OUR BUSINESS DRIVERS Raw material costs
11
Current
930
835
600
700
800
900
1,000
1,100
Jan
11
Apr 1
1
July
11
Oct 1
1
Jan
12
Apr 1
2
July
12
Oct 1
2
Jan
13
(US$/tonne) Virgin Pulp Prices
NBSK NBHK
50
100
150
200
250
300
Jan
11
Apr
11
July
11
Oct
11
Jan
12
Apr
12
July
12
Oct
12
Jan
13
Apr
13
(US$/ ton)
Main Recycled Fiber North Amercian OBM List Prices
White grades (SOP) Brown grades (OCC)

Largest recycled paper collector in Canada
OUR BUSINESS DRIVERS Raw material dynamics
Our North American Recycled Fibre Supply
• Short term: • constant review of our inventory
strategy • prepare for Greenpac project to
minimize market disruption • Long term:
• ensure control over fiber supply • develop substitute grades • potential to increase virgin content
in certain circumstances • continue to close the loop with
customers retailers
Our strategy
Contractual Agreement
40%
Cascades Recovery
and Internal
33% Spot Purchases
27%
12
2012
Currently control over 80% of our fibre supply despite greater concentration on the supply side

Stronger CAN$ and significant variable cost inflation negatively impact results
OUR BUSINESS DRIVERS Cost structure and FX
Source: Bloomberg
Raw materials, energy & supplies = 62% of 2012 COGS A weaker CAN$ would be a game changer
Raw material and
consumables 32%
Wages and benefits
18% Others 13%
Energy 10%
Freight 8%
Maintenance 7%
Supplies and chemicals
12%
13
• US$/CAN$ forecasts by top-5 Canadian banks • Range 2013 0.95 to 0.99 (average 0.97) • Range 2014 0.91 to 1.01 (average 0.98)
0.65
0.70
0.75
0.80
0.85
0.90
0.95
1.00
1.05
1.10
Q2-10
Q3-10
Q4-10
Q1-11
Q2-11
Q3-11
Q4-11
Q1-12
Q2-12
Q3-12
Q4-12
Q1-13
€/CAN$US$/CAN$
US$/CAN$ €/CAN$

Improve our ROCE to reach our cost of capital Reach industry comparable leverage ratios
Improving our profitability and financial situation through our Action Plan
ACTION PLAN PRIORITIES
MEDIUM TERM OBJECTIVES
Modernize core operations (and IT) through
focused investments
Optimize capital allocation
and reduce working capital
Restructure underperforming
units
2 3 1 Innovate
to improve and develop
processes and products
4
OUR STRATEGIC ACTION PLAN Four priorities
14

Modernize core operations (and IT) through focused investments 1
15
Initiatives undertaken since the beginning of our Action Plan
Containerboard – Manufacturing
Containerboard – Converting
• Construction of the Greenpac linerboard mill in Niagara Falls, NY
• Consolidation of our platform in Ontario
• Consolidation of our folding carton platform in Canada
• Installation in 2010 of an ATMOS machine in Candiac
• Launch of an important upgrade of our ERP system
Boxboard – Converting
Tissue Papers – Manufacturing
Corporate

16
• $99M total investment (represents ± $1.05/share) • Debt non-recourse to Cascades
Partners Ownership Cascades ~60% 3 other partners ~40%
• Largest recycled linerboard mill in NA: • 328 inches • 1,500 s.t./day of lightweight recycled
linerboard (26 pounds)
• Most technologically advanced equipment
Financial Structure Operational Facts
OUR NEW GREENPAC LINERBOARD MILL
Modernize core operations (and IT) through focused investments 1

Objective: maintain our leading position in Ontario with a fully utilized state-of-the-art converting platform
OUR CONTAINERBOARD CONVERTING PLATFORM IN ONTARIO
Modernize core operations (and IT) through focused investments 1 17
Before Now # of plants 8 7
Average capacity 725 840 per plant (‘000 MSF)
• Acquisition of Bird • Closure of 3 units • Invest $30M to
modernize and increase capacity at remaining plants
B B

Smurfit Stone 20% Weyerhaeuser 16% IP 11% Georgia Pacific 11% Temple Inland 9% PCA 6% Cascades 3%
Others 24%
Top-5 67%
THE CONTAINERBOARD MARKET
Sources: Company estimates, RISI, Fiber Box Association, Paper Packaging Canada. Cascades’ capacity includes 100% of Greenpac
Cascades is increasing its market share
18
Changing landscape: Leading 3 North American Producers representing 68% of the market % of total capacity
2007 Industry Participants
IP 35% Rock Tenn 20% Koch/GP 11% PCA 7% Cascades 4% Pratt 3% Kapstone 2%
Others 18%
Top-5 77%
2013 Industry Participants

10
11
12
13
14
15
16
350
450
550
650
750
850
Mar
-09
Jul-0
9No
v-09
Mar
-10
Jul-1
0No
v-10
Mar
-11
Jul-1
1No
v-11
Mar
-12
Jul-1
2No
v-12
Mar
-13
Linerboard PriceShipments to Inventories Ratio (3-mth average)
(US$/s.t.) Ratio
THE CONTAINERBOARD MARKET
Two US$50/s.t. price increases since fall
Sources: Company estimates, RISI, Fiber Box Association, Paper Packaging Canada.
Initiatives undertaken will position us well in an industry with positive fundamentals
19
Second US$50/st price increase announced for April 1st
Market tightness supporting 2nd increase
400
500
600
700
800
900
1,000
1,100
Mar-1
0
Jun-
10
Sep-
10
Dec-
10
Mar-1
1
Jun-
11
Sep-
11
Dec-
11
Mar-1
2
Jun-
12
Sep-
12
Dec-
12
Mar-1
3
20-pt clay coated news (CRB)Linerboard 42-lbCorrugating medium 26-lb
(US$/s.t.)

Optimize capital allocation and reduce working capital 2
20
Selected initiatives undertaken since the beginning of our Action Plan
Tissue Papers – Converting Corporate
• Acquisition of remaining interest in Papersource
• One of the most modern converting plants in NA
• Integration level increased to 70% +
• Reinforces positioning in away-from-home sector
• 10 converting lines
• Working capital reduction initiative
14.5%14.4%14.5%
13.2%
14.2%14.7%
14.3%
12.4%
13.3%
10%
12%
14%
16%
Q12011
Q22011
Q32011
Q42011
Q12012
Q22012
Q32012
Q42012
Q12013
Working Capital to Sales

21
Cascades’ Tissue Papers 2012 Sales – End-Users
Branded 57%
Private label 43%
Branded 16%
Private label 84%
Cascades’ Tissue Papers 2012 Sales – Countries
Retail 54%
AfH 46%
Retail 53%
AfH 47%
Canada (28%)
US (72%)
Retail 45%
Parent rolls 16%
AfH 39%
90% private label
36% branded
OUR POSITIONNING IN THE TISSUE PAPERS SEGMENT
Optimize capital allocation and reduce working capital 2

7,896
8,028
8,201
8,053
8,219
8,319
8,472
7,800
8,000
8,200
8,400
8,600
2006 2007 2008 2009 2010 2011 2012
('000 s.t.)U.S. Total Tissue Consumption
US tissue consumption grows steadily, based on demographics
THE TISSUE PAPERS MARKET
22
Market is growing every year which will contribute to absorb additional capacity Sources: RISI
+1.5% CAGR
Upward trend in parent rolls price linked to higher raw materials
Apr-1
3
1,000
1,100
1,200
1,300
1,400
1,500
1,600
Jan-
11
Mar-1
1
May-
11
Jul-1
1
Sep-
11
Nov-
11
Jan-
12
Mar-1
2
May-
12
Jul-1
2
Sep-
12
Nov-
12
Jan-
13
Virgin parent rollsRecycled parent rolls
(US$/s.t.)

8,543
9,165531
356
7,000
7,500
8,000
8,500
9,000
9,500
10,000
End of 2011 NATissue Capacity
New capacity '12-'14
(TAD and TADe)
New capacity '12-'14
(other grades)
Expectedclosures
End of 2014 NATissue Capacity
(estimate)
('000 s.t.)
(265)
THE TISSUE PAPERS MARKET
23
New capacity to have more impact on national brands but potential trickle-down to AfH Sources: RISI
Capacity additions in the tissue sector close to 1.5-2.0% consumption growth
+2.4% CAGR
Top 5 – North American Tissue Producers
Koch/GP 30% P&G 17% Kimberly-Clark 16% Cascades 7% SCA 6% Others 24% Total - 2012 8,476
% of total capacity

1,397
1,535
(298)
(287)
278
25099
8344
700800900
1,0001,1001,2001,3001,4001,5001,6001,700
Net Debt12/31/2010
Dopacosale
Cash flowfrom op.
Var. ofworkingCapital
$CAN Acqu. &consol.
Capex,net of disp.
Greenpacinvestment
Leases &others
Dividends&
buy-backs
Net Debt12/31/2012
(M CAN$)
(20) (11)
DIVESTITURE TO FINANCE OTHER GROWTH INITIATIVES
24 Optimize capital allocation and reduce working capital 2
Increase in debt since 2010 essentially related to consolidation of Reno ($149M)
Divestitures and FCF have funded acquisitions and capex

Restructure underperforming units 3
25
Difficult decisions taken since the beginning of our Action Plan
• 12 closures • Containerboard – Manufacturing Burnaby mill • Containerboard – Converting Le Gardeur, Leominster, 3 mills Greater Toronto Area • Spec. Prod. – Manufacturing East Angus pulp mill, Enviropac plant in Toronto • Boxboard – Converting Lachute plant • Boxboard – Europe Magenta and Marzabotto plants • Tissue Papers Napkin plant in Toronto
• 4 sales • Containerboard – Manufacturing Avot-Vallée mill • Boxboard – Manufacturing Versailles plant • Boxboard – Converting Dopaco subsidiary, Hebron mill

OUR INTEREST IN RENO AND OUR EUROPEAN PLATFORM
26
Villa S. Lucia
215k tons recycled WLC
Wednesbury
Sheeting centre
Blendecques
110k tons recycled WLC
Almazan
35k tons recycled WLC
Magenta
120k tons recycled WLC
Arnsberg
215k tons
recycled WLC
Ovaro
95k tons recycled WLC & other
grades
S. Giustina
220k tons recycled WLC
Llica de val - Barcelona
Sheeting centre
Careo – sales offices
Cascades mills
Djupafors
60k tons virgin FBB
La Rochette
150k tons virgin FBB
Manucor
Flexible packaging
Reno is a turnaround story • Results from 2007 transaction: we received a 31% interest in exchange for our CRB mills • We now own ~50% of public Italian company (fully consolidated in our results) • Allowed for rationalization of production capacity and amalgamation of sales forces • Now 2nd producer of boxboard in Europe
Restructure underperforming units 3
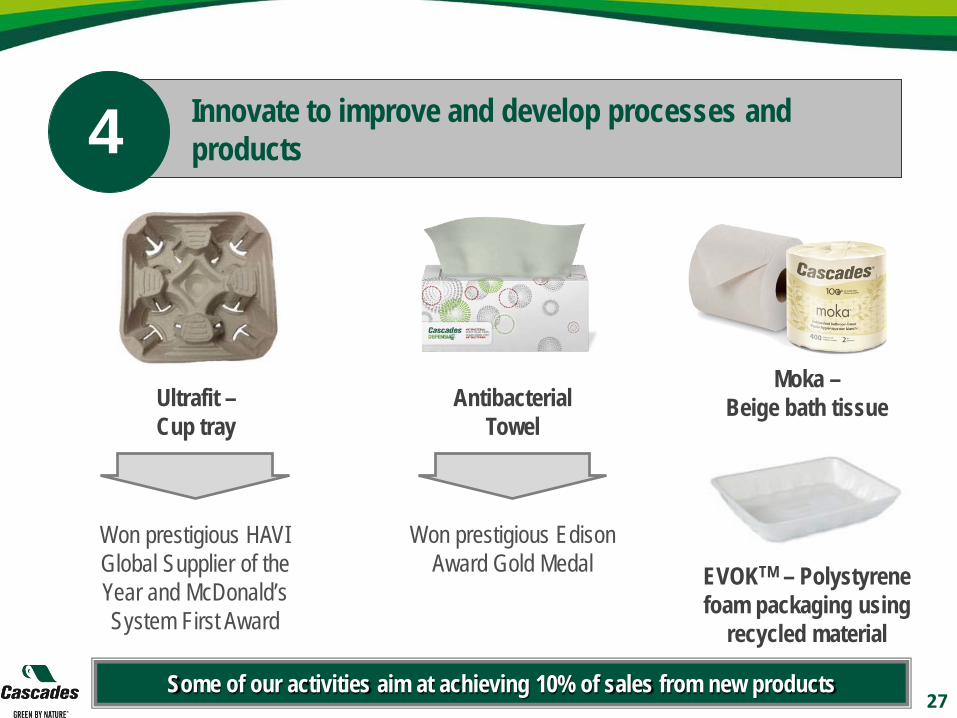
Innovate to improve and develop processes and products 4
27
Moka – Beige bath tissue Antibacterial
Towel Ultrafit – Cup tray
Won prestigious HAVI Global Supplier of the Year and McDonald’s System First Award
Won prestigious Edison Award Gold Medal
Some of our activities aim at achieving 10% of sales from new products
EVOKTM – Polystyrene foam packaging using
recycled material

Stable source of revenues and platform for innovation
OUR SPECIALTY PRODUCTS GROUP
LTM sales of $960M in four main sectors of activities (including joint ventures)
28
Recycling and Recovery (23 units)
• 30% of sales
• Largest recycled paper collector in Canada
Specialty Papers (6 units)
Industrial Packaging (11 units) Consumer Packaging (7 units)
• 30% of sales
• Eco-friendly fine and security papers
• 29% of sales
• Leading produced of papermill packaging
• $10-15M EBITDA under equity method
• 11% of sales
• Largest producer of honeycomb in Canada

Outperform rating by most sell-side analysts
INVESTMENT CONSIDERATIONS Recent share price performance and analyst recommendations
29
EBITDA EPS2013 2013
BMO Outperform 5.00 317 $0.37
Desjardins Buy 6.00 314 $0.16
NBF Outperform 5.25 322 $0.22
Scotia Sector perform 6.00 359 $0.45
TD Buy 6.00 334 $0.30
RBC Outperform 6.00 333 $0.41
Average 5.71 330 $0.32
Brokeragefirm Rating Target
100
500
900
1,300
1,700
2,100
2,500
$3.75
$4.00
$4.25
$4.50
$4.75
$5.00
$5.25
06/01
/12
07/01
/12
08/01
/12
09/01
/12
10/01
/12
11/01
/12
12/01
/12
01/01
/13
02/01
/1303
/01/13
04/01
/13
05/01
/13
Volume Price
LTM share price performance

INVESTMENT CONSIDERATIONS Valuation metrics
Undervalued compared to peer group 30
Data as of May 29, 2013
Comparable Entreprise Price / BV EV / EBITDA EV / EBITDA P / E Dividendcompanies Value (M$) (LTM) (next) (next) yield (%)
Graphic Packaging US$5,110 2.8x 8.2x 7.0x 16.2x 0.0%
Kapstone US$1,746 2.6x 9.8x 6.3x 14.0x 6.8%
Meadwestvaco US$8,052 1.9x 10.7x 7.7x 24.4x 2.8%
PCA US$5,400 4.8x 9.8x 7.7x 16.8x 2.1%
Rock Tenn US$10,265 1.9x 8.6x 6.0x 15.4x 0.9%
Sonoco US$4,534 2.4x 8.0x 7.4x 15.5x 3.4%
Average - Packaging US$5,851 2.7x 9.2x 7.0x 17.1x 2.7%
Clearwater US$1,650 2.2x 7.7x 5.8x 18.6x 0.0%
KP Tissue US$1,165 1.0x 11.0x 8.1x 16.0x 4.2%
Orchids Paper US$200 2.3x 9.0x 6.4x 15.9x 3.8%
Wausau US$765 3.2x 17.6x 7.6x NMF 1.0%
Average - Tissue US$945 2.2x 11.3x 7.0x 16.8x 2.3%
Cascades $2,171 0.5x 7.3x 6.0x 16.4x 3.1%
Sector
PackagingProducts
Tissue Papers

INVESTMENT CONSIDERATIONS Illustrative sum-of-the-parts valuation analysis
31
Comparable Companies Illustrative Cascades’ Selected Illustrative Trading Range LTM EBITDA2 Multiple Value TEV/LTM EBITDA1 (M$ rounded, net corp. activities) (conservative) (M$ rounded)
• Tissue Papers 7.0x – 12.0x 129 7.5x 970 • Containerboard 6.0x – 10.0x 92 6.5x 600 • Boxboard Europe 5.0x – 9.0x 34 6.0x 200 • Specialty Products 4.0x – 8.0x 45 6.0x 270 300 6.8x Total Enterprise Value 2,040 Add: JV contribution ($10M EBITDA @ 6.0x) 60 Subtract: Net Debt (1,581) Total Equity Value – pre-adjustments 519 Add: Boralex’ stake (at market value) 135 Add: Greenpac investment (at book value) 100 Subtract: Minority interest (estimate3) (67) Total Equity Value – post-adjustments 687 Per share 7.32$ Current Market Capitalization 463 Current Market Price (as at May 29, 2013) 5.21$ Discount to Sum-of-the-Part Equity Value (given current market price and using trailing EBITDA) 29%
Refer to Notes page included in the Appendix. For illustration purposes only. Values by segment do not necessarily reflect the Corporation’s view on their respective value.
Shares trading at significant discount, even using current trough EBITDA and conservative multiples

32
INVESTMENT CONSIDERATIONS Our equity investments - Boralex
Source: Bloomberg and Boralex’ website; refer to January 2013 Investor Presentation for footnotes.
Analyst Recommendations Average target 1 top pick 13.00$ 4 buys or outperforms ~12.40$ 1 sector outperform 12.00$ 2 market or sector perform ~10.50$ Comparative Valuation Matrix BLX INE NPI (based on 2013 figures) Price/Book 1.3x 1.6x 4.4x Price/Cash flow 8.9x 10.6x 12.7x EV/EBITDA 10.9x 15.8x 15.1x
• No capital allocated to Boralex; valuation does not fully reflect growth potential
• Current BLX share price: $11.00 - represents ±$1.50/share for CAS

33
Taking the right steps to position Cascades for the future
CONCLUSION Potential Benefits Stemming From Our Recent Initiatives
Tissue Papers: strong and growing position • increasing presence in the US • ramp-up of ATMOS tissue paper machine
Containerboard: great fundamentals and improved platform • modernized converting platform and manufacturing productivity expected to be higher • Greenpac contribution • prices increasing
Modernizing our operating platform to increase profitability • ±$150M capex program per year • divestitures and closures of under-performing units • ERP upgrade
Other sources of growth and incremental value • Culture of innovation • European platform • Boralex project pipeline

APPENDIX

Certain statements in this presentation, including statements regarding future results and performance, are forward-looking statements within the meaning of securities legislation based on current expectations. The accuracy of such statements is subject to a number of risks, uncertainties and assumptions that may cause actual results to differ materially from those projected, including, but not limited to, the effect of general economic conditions, decreases in demand for the Corporation’s products, the prices and availability of raw materials, changes in the relative values of certain currencies, fluctuations in selling prices and adverse changes in general market and industry conditions. This presentation may also include price indices as well as variance and sensitivity analyses that are intended to provide the reader with a better understanding of the trends related to our business activities. These items are based on the best estimates available to the Corporation. The financial information included in this presentation also contains certain data that are not measures of performance under IFRS (“non-IFRS measures”). For example, the Corporation uses earnings before interest, taxes, depreciation and amortization (EBITDA) because it is the measure used by management to assess the operating and financial performance of the Corporation’s operating segments. Such information is reconciled to the most directly comparable financial measures, as set forth in the “Supplemental Information on Non-IFRS Measures” section of our most recent quarterly report or annual report. Specific items are defined as items such as charges for impairment of assets, for facility or machine closures, accelerated depreciation of assets due to restructuring measures, debt restructuring charges, gains or losses on sales of business units, unrealized gains or losses on derivative financial instruments that do not qualify for hedge accounting, foreign exchange gains or losses on long-term debt and other significant items of an unusual or non-recurring nature. All amounts in this presentation are in Canadian dollars unless otherwise indicated.
DISCLAIMER
35

NOTES
1. Comparable companies include: - Graphic Packaging, Greif, IP, Meadwestvaco, Packaging Corp., Rock Tenn for Containerboard. - KP Tissue, Clearwater Paper, Kimberly-Clark and Orchids Paper for Tissue Papers. Wausau Papers trailing multiple not considered. - Reno de Medici’s current market multiple for Boxboard Europe. - Boise, Domtar, KapStone, Sealed Air and Sonoco for Specialty Products. 2. EBITDA adjusted for corporate activities which have been distributed according to sales for illustration purposes. 3. Minority interest adjustments estimated for Reno (assuming 57% ownership) and Cascades Recovery (73% ownership). The capacity utilization rate is defined as: Shipments/Practical capacity. Paper manufacturing only. Working capital includes accounts receivable (excluding the short term portion of other assets) plus inventories less accounts payable.
36
For more information: www.cascades.com/investors Riko Gaudreault, CFA, ASA Director, Investor Relations [email protected] 514-282-2697