instructional procedures - deped tambayan...355 10 cm is less than 100 cm (may introduce the symbols...
TRANSCRIPT

351
MATERIALS 1. Ruler 1. Meter stick 2. String 3. Objects to be measured (bamboo poles, school supplies, personal
belongings, etc.) INSTRUCTIONAL PROCEDURES A. Preparatory Activities:
1. Drill Show pictures of the following objects. Tell them to stand
if they will measure the length of the object using m and shout hurray if they will use cm. a. a road d. a pencil case b. an eggplant e. a tree c. a playground f. a boy’s pants
B. Development Activities
1. Motivation Show a picture like this.
Questions:
a. What is the boy holding? b. Do you have a toy? What is it? c. If this is your toy and I will ask you how long it is, what unit of
length will you use? Why?
2. Presentation a. Concrete
Group activity
1. Divide the class into 4.
2. Give each group a set of objects measurable in
centimeter and meter units (with exact lengths).
3. Let them write the result of the activity in the table
illustrated below.

352
Object Length (m or cm)
1.
2.
3.
4.
5.
Processing:
Which of the objects is the shortest?
Which of the objects is the longest?
Can the shortest object be measured using meter?
Can the longest object be measured using
centimeter?
What is the advantage of using the appropriate unit of
length in measuring the length of the objects?
Paired activity
1. Work in pairs
2. Let each pair cut 2 strings of different lengths (1 m and 20
cm)
3. Ask them to measure the following:
Length of a pencil
Width of a notebook
Length of a desk
Width of a window
Length of a skirt/pants
4. Give them time to report the results. Be sure to check the
correctness of the answers.
b. Pictorial Let the pupils draw a 1 meter line on the board. Then, ask one or two pupils to draw a picture of a pencil (or other objects) showing the length in the 1 meter line. Below is an example of what and how they may draw.
(key) 1 m line
3. Reinforcing Activities
Let the pupils answer Gawain 1. Refer to LM 101. Key to correction: 1. 14 cm 2. 15 cm 3. 10 cm

353
4. Application Let the pupils answer Gawain 2. Refer to LM 101.
The teacher will provide the materials needed.
2. Generalization. EVALUATION:
The teacher will prepare five objects with different lengths. Put these objects together with measuring devices (tape measure or meter stick or centimetre ruler) at five stations. Each station should have enough space for the learners to do the measuring. Allow two pupils at a time in one station to measure the lengths of the objects.
Station 1 –a bamboo or wood pole Station 2 –a wire Station 3 –a book Station 4 – a ribbon Station 5 – an umbrella Note: Never use objects which have been used in the
discussion proper. Home Activity Refer to LM 101. Key to correction 1, 2 and 3- Answers will depend on the size of the paper ito be used in reproducing this material. 4. paaralan _____________________________________________________________
Teaching Guide for Mathematics Grade 2 Length
Lesson 102 TOPIC: Measuring Length OBJECTIVE Compare lengths in meters (m) or centimeters (cm). PREREQUISITE CONCEPTS AND SKILLS
Identifying appropriate unit of length in measuring objects MATERIALS
1. Ruler 2. Meter stick 3. Show Me board
How do you measure the length of an object?

354
INSTRUCTIONAL PROCEDURES A. Preparatory Activities:
Drill Show pictures of the following objects. Tell them to stand
if the unit of measure to be used in measuring the height or length is m and clap three times if cm. a. a glass d. a slipper b. an umbrella e. a basketball court c. a crayon f. a girl’s skirt
B. Development Activities 1. Motivation
Using their Show Me boards, tell the pupils to write down their answers to the following questions. Ask them to show their answers after each question.
Which is longer? a. 1 cm or 1 m b. 1 m or 100 cm c. 10 cm or 1 m
3. Presentation
a. Concrete 1. Prepare five bamboo poles (or other objects) of different
lengths (10 cm, 50 cm and 100 cm). Label each pole with the corresponding length.
2. Show/give these poles to the pupils. Ask the following questions.
Which of the three sticks is the shortest? How many cm is it?
Which of the three sticks is the longest? How many cm is it?
Which between the 50 cm and 100 cm is longer? How many cm is it longer than the other pole?
b. Pictorial Instruct the pupils draw the poles on the board or in the
paper. Ask them label each pole. Then, let them formulate statements of comparison
between two lengths. Like;
The 10 cm pole is shorter than the 50 cm pole
The 100 cm pole is longer than the 50 cm pole.
Two 50 cm poles have the same length with 100 cm pole.
Out of the statements, let them translate each into a mathematical statement like;

355
10 cm is less than 100 cm (may introduce the symbols < and > as 10 cm < 50 cm - optional)
100 cm is greater than 50 cm
Twice 50 cm is equal to 100 cm
c. Abstract 1. Post/write on the board a list of lengths.
15 cm, 20 cm, 75 cm, 100 cm, 1 m, and 2 m (examples only) Let the pupils pick pairs of lengths and let them
compare.
2. Compare the lengths in each number by filling up the blank with the appropriate word or symbol.
35 cm _____ 70 cm
125 cm _____ 215 cm
50 m _____ 60 m
1 ½ m _____ 2 m
4. Reinforcing Activities Let the pupils answer Gawain 1 in LM 102.
5. Application Ask the class to answer Activity 2 in LM 102.
Additional situation Nais ni Mang Pipito na mag jogging. Mas mahaba nang tatakbuhan ay mas mabuti. Ang haba ng public plaza ay 50 m at ang school playground ay 60 m. Saan ang dapat piliin ni Mang Pipito?
6. Generalization.
EVALUATION Paghambingin ang dalawang units. Halimbawa: 25 cm at 13 cm Posibleng mga sagot sagot:
Ang 25 cm ay mas mahaba kaysa 13 cm. Ang 13 cm ay mas maikli kaysa 25 cm. 1. 30 cm at 50 cm 2. 2 m at 5 m 3. 50 m at 1 m
In comparing lengths, the greater value has the longer length.

356
4. 210 cm at 120 cm 5. 100 cm at 10 cm HOME ACTIVITY Refer to LM 102. Key to correction: answers will vary. ______________________________________________________________
Teaching Guide for Mathematics Grade 2 Length
Lesson 103 TOPIC: Measuring Length OBJECTIVE Estimate length using meter (m) or centimeter (cm). PREREQUISITE CONCEPTS AND SKILLS
Identifying appropriate unit of length in measuring objects MATERIALS
1. Real objects or pictures of objects which can be measured using cm or m
2. Meter sticks and rulers INSTRUCTIONAL PROCEDURES A. Preparatory Activities
1. Drill Show a pencil, a spoon and a 3-inch nail. Using these
objects ask the following questions. d. About how many pencils long is the table? e. About how many spoons long is the umbrella (the teacher
will provide umbrella)? f. About how many nails long is the Mathematics book?
2. Pre-Assessment
If the pencil is 13 cm long, the spoon is 18 cm long and
the nail 7 cm long,
a. about how many centimeters is the umbrella?
b. about how many centimeters is the table?
c. about how many centimeters is the Mathematics book?

357
B. Development Activities 1. Motivation
Group the class into four. Give each group a set of materials (ruler, meter stick and at least three objects which can be measured by cm and m) to work on.
Then, instruct to estimate in meter and centimeter (without using the ruler or the meter stick) the length of each object. Explain to the pupils that if the actual measure is one-half or more than one-half of the unit, add 1 to the approximated measure. Example, 2 and ½ cm is 3 cm and 5 and ¾ m is 6 m. Processing
What are the lengths of the objects?
Are the lengths the real lengths of the objects? (let them measure the objects using the measuring device)
How did you estimate lengths of the objects?
2. Presentation a. Concrete
Activity 1
Group the class into 2. Let each group estimate the
measure of the following objects using centimeter or
meter.
Group 1: width of the room, length of the teacher’s table
and length of a pencil
Group 2: length of the room, height of the teacher’s chair
and length of a chalk.
Let each group find the measures of the enumerated
objects using the appropriate measuring device and
units.
Processing:
Compare your estimated lengths/widths of the objects
and the real lengths/widths of the objects (when
measured using the measuring device).
Are your answers exactly the same with the
lengths/widths of the objects when measured using the
measuring device?
358
If the measures are different, how would you describe
the difference between the measures? Is it far or close to
the real measure?
Is the closest measure the estimated measure of the
object? Why?
What specific word can you use in approximating
measurements (about)? Why?
b. Pictorial
In your paper, draw any object you can see around.
Under it, label with the estimated length of the real object.
c. Abstract
Name objects with standard measures and are familiar to
the learners. Let them estimate the length, height or width of
each.
Below are examples of the objects.
1. Length of ballpen or unused pencil
2. Width or length of their math book
3. Height of their classroom
4. Length of the hallway in school
5. Height of the school principal
3. Reinforcing Activities Let the pupils answer Gawain 1 in LM 103.
4. Application Ask the class to answer Gawain 2. Refer to LM 103.
Key to correction: 1. Pareho lang, 3 m = 300 cm 2. Statement, graph or picture will do 3. Cm or m will do 4. Answers will vary
5. Generalization
To approximate measurements, it is important to
consider the actual length of 1 meter and 1 centimeter.

359
EVALUATION Estimate/approximate the length of the following objects. Use
cm or m.
1. The pair of scissors measures 12 cm. About how high is the chair?
2. About how thick is book “b” if the width of book “a” is 18 cm?
a b
3. The eraser measures 5 cm. About how many centimeters is the cellular phone?
Key to correction 1. 50 cm 2. 36 cm 3. 10 cm
HOME ACTIVITY Refer to LM _________________________________________________________

360
Teaching Guide for Mathematics Grade 2 Length
Lesson 104 TOPIC: Measuring Length OBJECTIVE Solve simple word problems involving length. PREREQUISITE CONCEPTS AND SKILLS
1. Identifying appropriate unit of length in measuring objects. 2. Comparing lengths in centimeters and meters.
MATERIALS
1. Activity cards 2. Flash cards
INSTRUCTIONAL PROCEDURES A. Preparatory Activities
1. Drill Using flash cards, ask the pupils which one is greater.
a. 2 m or 5 m b. 200 cm or 150 cm c. 1 and ½ m or 2 m d. 50 cm or 75 cm e. 150 cm or 510 cm
Fill in the blanks with the correct symbol (> or <).
a. 1 m ___ 3 m b. 200 cm ___ m c. 120 cm ___ 210m d. 500 cm ___ 800 cm e. 1 and ½ m ___ 1 and ¾ m
2. Pre-Assessment
Mary Shine has 50 cm red ribbon, 75 cm blue ribbon and 25
cm yellow ribbon. How many centimeters of ribbon are there in all
Mary Shine has?
B. Development Activities 1. Motivation
Show a picture of a girl like this one below.

361
Ask the following questions. a. What does the picture represent? (happy family) b. Where do you think the family is going? c. Is your family like this? Tell the pupils that they will be attending a family day. The
teacher can tell a story what a family day is (the members of the family play, sing or dance together as one team). Then, give emphasis to playing. This will lead the teacher to site situations that involve games on lengths, distances, or heights using centimeter (cm) or meter (m).
2. Presentation
a. Concrete
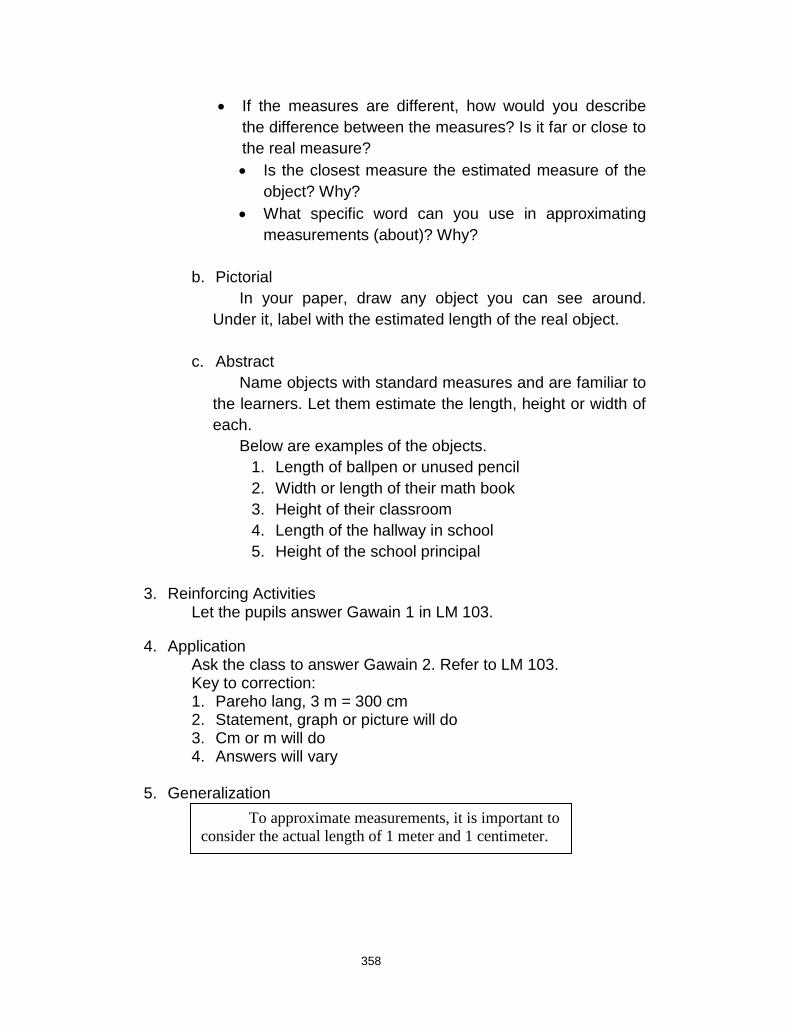
Give this problem.
Guide the learners to solve the problem.
Underline the question
Rewrite the question into an answer statement
(Nanette is _____ taller than Rica)
Restate the problem focusing on important details
that will solve the problem
(What is the difference between 105 and 95?)
Decide what process/equation will be used to find
the answer
(105 – 95 = ___ or 95 + ___ = 105 or
105
Rica stands 95 cm and Nanette stands 105 cm. How many cm is Nanette taller than Rica?
362
95 ?
Give the answer
(Nanette is 10 cm taller than Rica)
b. Pictorial
Let the pupils show the solution to the problem by
drawing Rica and Nanette.
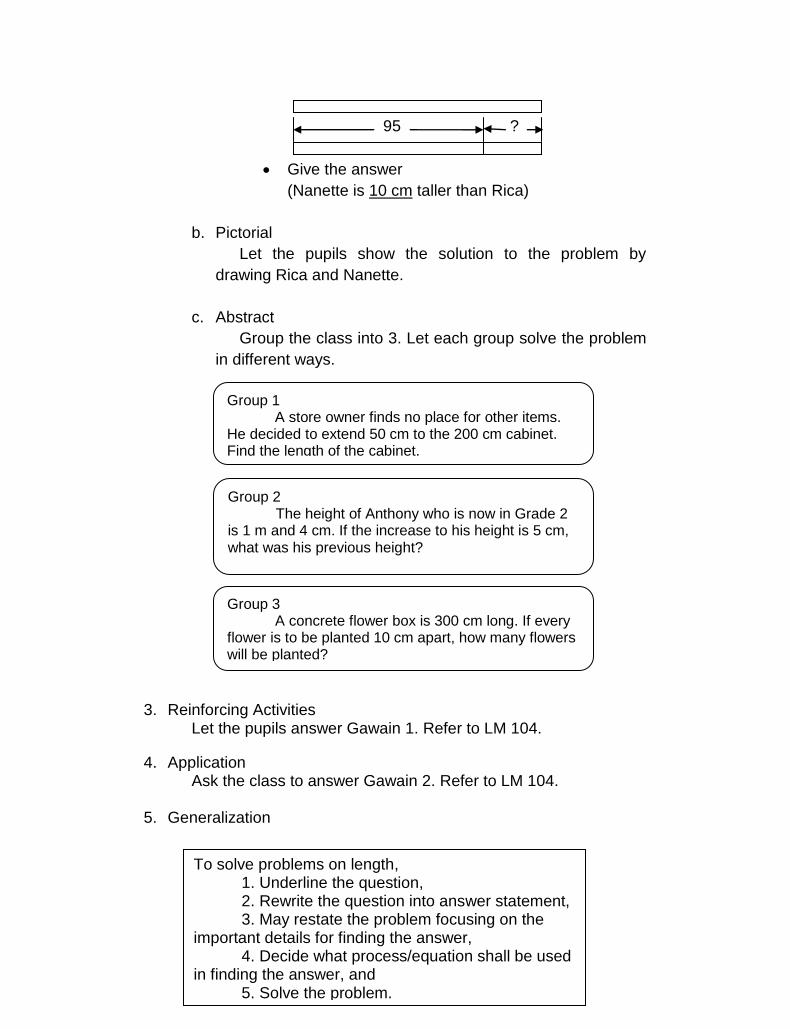
c. Abstract
Group the class into 3. Let each group solve the problem
in different ways.
3. Reinforcing Activities Let the pupils answer Gawain 1. Refer to LM 104.
4. Application Ask the class to answer Gawain 2. Refer to LM 104.
5. Generalization
Group 3 A concrete flower box is 300 cm long. If every
flower is to be planted 10 cm apart, how many flowers will be planted?
Group 1 A store owner finds no place for other items.
He decided to extend 50 cm to the 200 cm cabinet. Find the length of the cabinet.
Group 2 The height of Anthony who is now in Grade 2
is 1 m and 4 cm. If the increase to his height is 5 cm, what was his previous height?
To solve problems on length, 1. Underline the question, 2. Rewrite the question into answer statement, 3. May restate the problem focusing on the
important details for finding the answer, 4. Decide what process/equation shall be used
in finding the answer, and 5. Solve the problem.

363
EVALUATION: Basahin at sagutin ang bawat bilang.
1. Gaano kalayo ang bahay sa plaza kung ang bawat guhit ay katumbas ng 5 m?
Bahay - - tindahan - - - - paaralan - - - plaza
2. Ang vegetable garden ni Carlo ay may habang 2 m sa bawat gilid. Nais niya itong paikutan ng barbed wire ng 3 beses bilang bakod. Ilang metro ng barbed wire ang kakailanganin ni Carlo?
3. Para sa kanyang kaarawan, nilalagyan ni Christy ng silky raffles
ang laylayan ng kaniyang damit. Kung ang bawat 50 cm ng laylayan ay mangangailangan ng 1 m na raffles, ilang meters ng raffles ang magagamit kung ang laylayan ay 1 at ½ m ang haba?
Key to correction: 1. 45 m 2. 24 m 3. 3m
HOME ACTIVITY Refer to LM 104. __________________________________________________________________________
Teaching Guide for Mathematics Grade 2
Mass
Lesson 105 TOPIC: Measuring mass OBJECTIVE
Identify and use appropriate unit of mass (in gram or kilogram and their abbreviations g or kg) in measuring a particular object.
PREREQUISITE CONCEPTS AND SKILLS
Reading units in a scale (length) MATERIALS
1. Weighing scale 2. Objects of different mass ( 1g, 10 g, 100 g, 1 kg) 3. Show Me boards

364
INSTRUCTIONAL PROCEDURES A. Preparatory Activities:
1. Drill Show at least three pairs of objects (each pair with different
mass). Ask which one is heavier/lighter? a. a small sachet of milk or a big pack of milk b. one piece of banana or 12 pieces of bananas c. plastic of cotton and plastic of rice
B. Developmental Activities:
1. Motivation: Show to the class a real weighing scale available in the
community. Below are examples of weighing scales. Pictures of the other weighing scales need to be shown by the teacher (for the pupils’ familiarity).
Say: Class, this is a weighing scale. Then ask:
Have you seen something like this?
Where do you often see this instrument?
What are the things measured using a weighing scale?
When you buy rice, how is it measured? How about fish?
2. Presentation a. Concrete
Using a weighing scale, let the pupils weigh pairs of objects. Below are examples.
A gram of rice and a kilogram of rice
A sachet of milk and a bag of milk (about a kilogram or more)
Few grams and a kilogram (or more) of fruits Give the learners enough time see the difference
between 1 g and 1 kg, 10 g and 1 kg, 100 g and 1 kg. Tell them that these weights are masses of the objects. Ask:
What unit of mass is best to use if the object is light?
What unit of mass is best to use if the object is heavy?
What unit is best to use in getting the mass of a bag of
rice? 6 pieces of mangoes? 1 piece of banana?

365
This time, teach the pupils how to read the weight of an
object. Focus first on 10 g (up to about 300) and 1 kg (up to
about 3). This is to establish only the idea that light masses
are to be measured in grams and heavy ones in kilograms.
b. Pictorial Ask the pupils to draw grocery items that are measured in gram and in kilogram. Group the items as to gram and kilogram.
c. Abstract
What unit is appropriate to the mass in each number? 1. 10 pieces of orange (kalamansi) 2. 5 fishes 3. Papaya fruit 4. 7 pieces of lady finger (okra) 5. Whole chicken meat
3. Reinforcing Activities Refer to Gawain 1 of LM 105
Key to correction: 1. kg 2. g 3. kg 4. K 5. kg 6. Kg
4. Application Let the pupils answer Gawain 2. Refer to LM 105. The teacher will provide the materials/objects. Better to prepare
those with exact mass like 50 g, 100 g, 1 kg or 2 kg.
5. Generalization
EVALUATION
Gumamit ng weighing scale sa pagtukoy ng timbang ng mga sumusunod na bagay. Ibigay ang timbang gamit ang tamang unit of measure (g o kg).
(ang guro ang maghahanda ng mga gamit na kakailanganin sa pagsusulit)
1. Pack of rice 2. Fruit (banana, papaya, mango) 3. Asukal 4. School bag
In measuring mass:
Use gram (g) in light objects
Use kilogram (kg) in heavy objects

366
5. Aklat HOME ACTIVITY Refer to LM 105. If not available in the locality, change the items enumerated in the LM. _____________________________________________________________
Teaching Guide for Mathematics Grade 2
Mass Lesson 106
TOPIC: Measuring Mass OBJECTIVE Compare mass in grams or kilograms PREREQUISITE CONCEPTS AND SKILLS
Finding the mass of an object MATERIALS 1. Weighing scale with gram and kilogram scales
2. Objects of different sizes and masses (like: pack of powdered milk, pack of sugar, fruits and others) 3. Show Me boards
INSTRUCTIONAL PROCEDURES A. Preparatory Activities:
1. Drill a. Show pairs (one is heavy and the other is light) of objects to
the class. b. Call a volunteer. Let him/her feel the weight of the two
objects using his/her hands. c. Ask: Which is heavier? Lighter?
2. Pre-Assessment:
Show objects/pictures of: pack of powdered milk, pack of
sugar, pack of salt, fruits and other objects the teacher had
prepared. Using Show Me boards, let them write which one is
heavier.
a. Packs of powdered milk and sugar.
b. Packs of sugar and salt.
c. A banana and a mango.

367
B. Development Activities
1. Motivation Show to the class real bananas or any set of fruits, vegetables
or root crops available in the community. Ask:
Do you eat fruits? Vegetables or root crops?
Are these foods good to your health? 2. Presentation
a. Concrete
Group activity
Group the class into 2.
Provide each group with a weighing scale and 16
stones, each weighing 250 g, (or any other objects) of
similar sizes which are available in the community.
Ask each group to fill out the table below:
Number of stones Mass (in kg)
4 stones
8 stones
12 stones
16 stones
Processing
What is the mass of 4 stones? 8 stones? 12 stones?
6 stones?
Which one is heavier, 4 stones or 8 stones? 16
stones or 12 stones?
What happens to the mass as the number of stone
increases?
b. Pictorial
Let the pupils draw a representation of the table above.
Pictograph, line graph or bar graph will do.
c. Abstract
Using Show Me boards, let the pupils tell which one is
greater/heavier in each of the following pairs of masses. Can

368
use words (greater or less) and symbols (<, >) in comparing
the masses.
10 g or 15 g
50 kg or 15 kg
26 g or 30 g
25 kg or 24 kg
75 g or 57 g
3. Reinforcement Activities Let the pupils answer Gawain1 in LM 106.
4. Application: Ask the class to answer Gawain 2 in LM 106.
6. Generalization
EVALUATION Which is heavier?
1. 2 kg or 4 kg 2. 40 g or 30 g 3. 5 kg or 7 kg 4. 100 g or 1,000 g 5. 2 kg or 1 kg
HOME ACTIVITY Refer to LM 106. Key to correction: 1. Si Belinda (4 < 5) 2. 9 kg ( 4 + 5 = 9 or 5 + 4 = 9) 3. Baboy (5 > 4) ______________________________________________________________
Teaching Guide for Mathematics Grade 2 Mass
Lesson 107 TOPIC: Measuring Mass OBJECTIVE Estimate mass using gram or kilogram PREREQUISITE CONCEPTS AND SKILLS
Greater mass is heavier and smaller mass is lighter.

369
Measuring mass in g and kg MATERIALS
1. Weighing scale 2. Pictures/real objects 3. Activity sheets INSTRUCTIONAL PROCEDURES A. Preparatory Activities:
1. Drill Show to the class real or pictures of food items. Say: I will be
showing you real/pictures of objects. If it is to be measured by g, say cute and if it is to be measured by kg, say beautiful.
Note to the teachers: Examples of the food items can be vegetables or fruits. Sizes should vary such that g and kg will be mentioned by the class as the unit to measure the mass.
2. Review
Use the objects shown in the drill portion. If pictures were shown, prepare at least three real objects. Let the learners get the mass of each object. Be sure that they get the correct mass and use the appropriate unit.
B. Developmental Activities:
1. Motivation A picture story:
Ask: a. See the content label of these items. b. How is the content of each item measured? c. Can you guess the mass of these items?
2. Presentation
Show the word ESTIMATE written on a card. Then ask: What does this word mean? Can you estimate the weight of a small pack of powder soap? a. Concrete
Group activity:
Group the class into four.
Provide each group with an activity sheet.
Nanay Fina went to the supermarket. She bought a can of powdered milk, a pack of sugar and a sachet of cereal. (Show the real items to the
pupils or the pictures or empty containers of these
items).
370
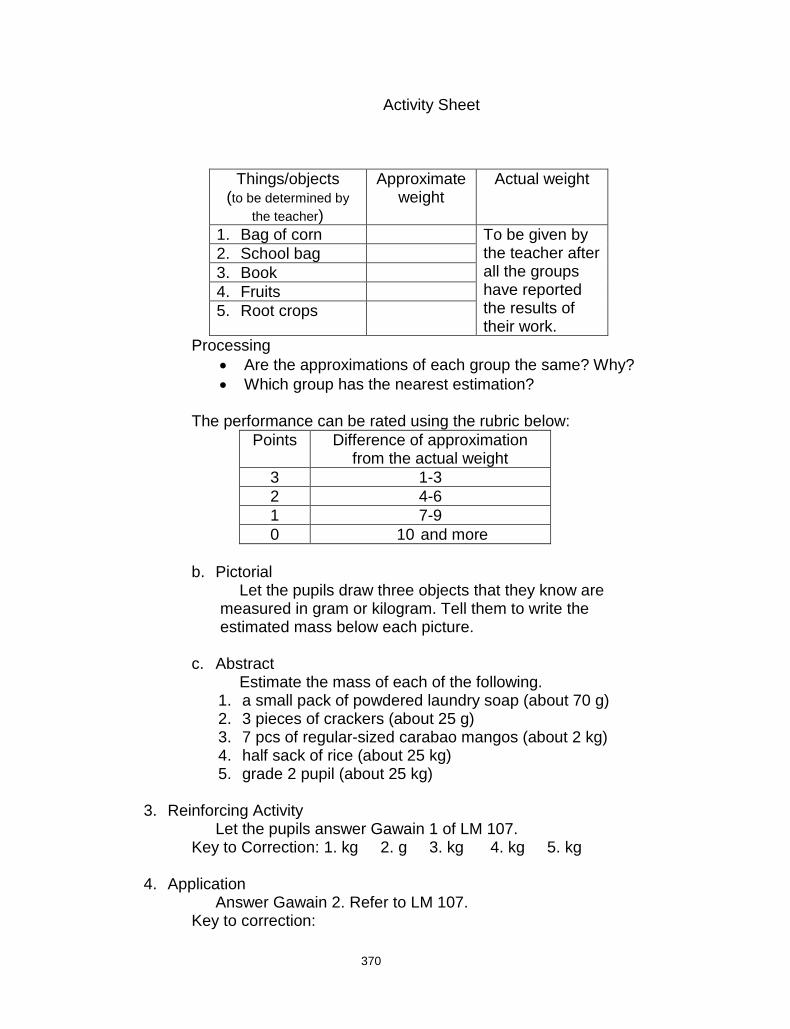
Activity Sheet
Things/objects (to be determined by
the teacher)
Approximate weight
Actual weight
1. Bag of corn To be given by the teacher after all the groups have reported the results of their work.
2. School bag
3. Book
4. Fruits
5. Root crops
Processing
Are the approximations of each group the same? Why?
Which group has the nearest estimation? The performance can be rated using the rubric below:
Points Difference of approximation from the actual weight
3 1-3
2 4-6
1 7-9
0 10 and more
b. Pictorial
Let the pupils draw three objects that they know are measured in gram or kilogram. Tell them to write the estimated mass below each picture.
c. Abstract
Estimate the mass of each of the following. 1. a small pack of powdered laundry soap (about 70 g) 2. 3 pieces of crackers (about 25 g) 3. 7 pcs of regular-sized carabao mangos (about 2 kg) 4. half sack of rice (about 25 kg) 5. grade 2 pupil (about 25 kg)
3. Reinforcing Activity
Let the pupils answer Gawain 1 of LM 107. Key to Correction: 1. kg 2. g 3. kg 4. kg 5. kg
4. Application Answer Gawain 2. Refer to LM 107.
Key to correction:

371
1. Php 160 2. Opo, kasi 50 g lang ang sobra at ito ay napakaliit na sobra 3. 1 at ½ kg, ang 3 ay kalahati ng 6
5. Generalization.
EVALUATION:
Estimate the weight of each of the following. (Show the actual objects. The teacher may provide a different set of materials) 1. A box of bath soap 2. A bag of rice 3. About three pieces of mangoes 4. A canned sardines 5. A pack of powdered juice
HOME ACTIVITY Refer to LM 107. _____________________________________________________________
Teaching Guide for Mathematics Grade 2 Mass
Lesson 108 TOPIC: Measuring mass OBJECTIVE Solve simple problems involving mass PREREQUISITE CONCEPTS AND SKILLS
1. Compare mass in grams or kilograms 2. Measure mass in grams or kilograms
MATERIALS
1. Different products with mass labels 2. Show Me board 3. Activity sheets
INSTRUCTIONAL PROCEDURES A. Preparatory Activities:
1. Drill
Familiarity of the weight of 100 g and 1 kg
will make one good to estimate.

372
Show at least three things (examples: packs of rice, powdered milk and salt) to the class. The packs of milk and salt are in small sizes.
Ask the following: a. How are these things sold? (by g or kg) b. What unit of measure do we use in measuring the mass of light
objects (salt and milk)? How about heavy objects (rice)? c. Which between the pack of rice and the pack of powdered milk
is heavier? How about between the packs of milk and salt? d. About how many kilograms is the pack of rice?
2. Pre-Assessment:
A store owner has 80 kg of rice. Today, she was able to sell
35 kg of it. How many kilograms of rice are left unsold?
B. Developmental Activities:
1. Motivation:
Show a picture like this.
Ask the following:
a. What is the vendor selling?
b. How are fishes sold, in grams or in kilograms?
c. What do you think the boy is doing?
2. Presentation a. Concrete
Present this problem.
Processing:
1. What did Aling Nora sell? 2. Underline the question.
Aling Nora sold 3 kg of bananas, 2 kg of oranges
and 2 and ½ kg of mangoes. How many kilograms of
fruits in all did she sell?

373
3. Rewrite the question into an answer statement. (Aling Nora sold ____ in all)
4. What process/equation will you use to solve the problem? (3 + 2 + 2 + ½ = 8 ½ kg or the vertical way of adding)
5. What is the answer to the problem? (Aling Nora sold 8 ½ kg in all)
b. Pictorial Let the pupils draw a representation of the solution
3 + 2 + 2 + ½ = 8 ½.
d. Abstract Divide the class into four. Give each group a copy of
the problem. Remind them that they will report the solution and answer in front of the class.
3. Reinforcing Activity Let the pupils perform Gawain 1 at 2. Refer to LM 108.
Key to correction: 1. 90 kg 2. 4 kg 3. 18 kg
1. 15 kg 2. 1,000 g 3. 10 kg
4. Application Ask the pupils to answer Gawain 2 in LM 108.
7. Generalization.
EVALUATION:
Solve the following word problems. 1. Miss Ferrera needs 1 kg of sugar, 2 kg of flour and 1 kg of baking
powder for a recipe. How many kilograms of ingredients in all does she needs?
To solve problems involving mass,
1. Underline the question,
2. Rewrite the question into answer statement,
3. May restate the problem focusing on the important
details for finding the answer,
4. Decide what process/equation shall be used in finding the
answer, and
5. Solve the problem.
Lucio bought 250 g of eggplant and 300 g of
ampalaya? What is the total mass of vegetables did Lucio
buy?

374
2. Mark bought 500 g of beef and 500 g of pork. What is the total mass of meat he bought?
3. A baker needs 5,000 g of flour. If what he has is 2,500 kg only, how much more does he need to complete the amount of flour he needs? Key to correction; 1. 4 kg 2. 1,000 g 3. 2,500 g
HOME ACTIVITY Refer to LM 108. Key to correction: 1. 1 ¼ kg 2. ¼ kg 3. Answers will vary ______________________________________________________________
Teaching Guide for Mathematics Grade 2 Area
Lesson 109 TOPIC: Area Concept OBJECTIVE
Illustrate area as a measure of how much surface is covered or occupied by plane figure.
PREREQUISITE CONCEPTS AND SKILLS
Visualize triangles, squares and rectangles. MATERIALS
1. Pictures (Parts of a house covered with square tiles like living room or comfort room).
2. Square tile or a square cardboard 2. Graphing paper. 3. Match sticks or ice cream sticks.
INSTRUCTIONAL PROCEDURES A. Preparatory Activities:
1. Drill Using the match sticks or ice cream sticks, form the following figures. a. It has 3 sides and 3 corners. b. It has 4 equal sides. c. It has 2 pairs of equal sides and 4 corners. Ask: a. What shape has 3 sides and 3 corners? b. What shape has 4 equal sides? c. What shape has 2 pairs of equal sides and 4 corners?

375
2. Pre-Assessment:
Show this figure.
Questions:
a. How many sides does the figure have?
b. What is the shape of the figure?
c. How many triangles can you see in the figure?
B. Development Activities 1. Motivation:
Show a picture of a square tile like this one below.
Ask:
a. Do you know what in this picture are? (tiles) b. Have you seen tiles like these? c. Where do we always see tiles? (offices, house) d. What is the shape of each tile in this picture? (square)
2. Presentation a. Concrete
Show a real square tile. If no real square tile, a square
cardboard can be used.
Ask the shape of the tile/cardboard.
Explain to them that its shape is square. The teacher
may connect this situation to what they have formed in
the drill part. It should be clear to them that a square has
2 pairs of equal sides and has 4 equal corners.
Lay 2 rectangular flat objects (cardboard or cartolina),
one is bigger than the other. Be sure that the surface of
each object will exactly fit a certain number of the square
tiles/cardboards.

376
Call a pupil to lay flat the square unit (cardboard tiles) on
top of the flat objects.
Ask:
Which object takes more square tiles/cardboards
to cover its surface? Why?
How many square tiles are there in the smaller
rectangle? In the other rectangle?
Tell them that the number of squares used to cover the
surface is the area of the object.
b. Pictorial Activity:
Group the pupils into 4. Give each group an activity sheet related to this one below. The small squares are found outside the figures only and not inside.
Let the pupils illustrate the area of the given figure by
drawing the number of squares.
A rectangle with an area of 10 square units.
A square with an area of 16 square units.
A plane figure with an area of 3 square units.
A plane figure with an area of 18 square units.
A rectangle with an area of 50 square units.
c. Abstract Illustrate the area of each figure below.
10 square units
16 square
units 18 square
units
50 square units

377
3. Reinforcing Activities: Let the pupils answer Gawain 1 at 2 in LM 109.
4. Application:
Ask the class to answer Gawain 3 in LM 109.
4. Generalization. EVALUATION
Draw square units to illustrate the area of a given figure. a. b. c. HOME ACTIVITY Refer to the LM 109. ______________________________________________________________
Teaching Guide for Mathematics Grade 2 Area
Lesson 110 TOPIC: Area Concept OBJECTIVE
Show the area of a given figure using square tile units. (i.e. number of square tiles needed).
PREREQUISITE CONCEPTS AND SKILLS
Illustrate the area of a plane figure. MATERIALS
1. Square tiles or square cardboards 2. Graphing paper
3. Straight edge 4. Activity sheets
Area is the measure of the region inside a plane figure. It is measured in square units.

378
INSTRUCTIONAL PROCEDURES A. Preparatory Activities:
1. Drill How many squares are there in each figure? a. b.
2. Pre-Assessment:
Board work activity:
Using cut-out cardboards, let the pupils draw the figures
described below. Ask three pupils at a time.
a. A square with 4 square units.
b. A square with 9 square units.
c. A rectangle with 8 square units.
d. A rectangle with 3 squares wide and 5 squares long.
e. A rectangle with 4 squares wide and 5 squares long.
B. Development Activities 1. Motivation
Show a big grid with different shapes drawn on it.
Questions: a. What are the shapes you can see on the grid? b. Can you easily identify the number of small squares in every
figure without counting? Why?
2. Presentation Concrete/Pictorial
Group the class into 4.
1. Give an activity sheet like the one below to each
group.

379
Tell them that this is the floor plan of a school.
2. Instruct the pupils to do the following
Draw square units to each area.
Write the number of units inside each area.
Count the number of squares each area occupied.
Processing
What are the shapes of the rooms in the floor plan?
What is the area of each room?
Which part of the school has the biggest area? How
many squares does it occupy?
Which areas are the same? How many squares does
each area occupy?
Which place in the school has the smallest area? How
many squares does it occupy?
Which has the bigger area, the canteen or the clinic?
How many squares does it occupy?
3. Reinforcing Activities
Let the pupils answer Gawain 1 in LM 110.
4. Application Ask the class to answer Activity 2 in LM 110.

380
5. Generalization EVALUATION Alamin ang area ng bawat hugis gamit ang sukat ng maliit na square na kulay itim.
1.
2.
3.
4. HOME ACTIVITY Refer to LM 110.
The area of a given figure can be shown by drawing squares in it.

381
____________________________________________________________
Teaching Guide for Mathematics Grade 2 Area
Lesson 111 TOPIC: Area Concept OBJECTIVE Find the area of a square and a rectangle using square tile units. PREREQUISITE CONCEPTS AND SKILLS
1. Show the area of a given figure using square tile units. 2. Multiplying one-digit numbers
MATERIALS
1. Square tiles (Cut-out Cardboards) 2. Cartolina with small squares drawn
INSTRUCTIONAL PROCEDURES A. Preparatory Activities:
1. Drill a. Show flashcards. Give the answers orally.
b. Give the products of;
3 and 3
4 and 4
7 and 10
8 and 10
10 and 9
2. Pre-assessment:
Give the number of square units for each figure. Try to
recite the number sentence for each answer.
a. b. c.
2 x 2 = 5 x 5 = 4 x 10 =

382
B. Development Activities 1. Motivation
Show this cube or a picture of this.
Questions:
a. Are you familiar with this? (it’s a rubik’s cube) b. Do you play this? c. How many sides does it have? d. What shape is each side?
Say: Today, we will find the area of a square and a rectangle using square tile units.
2. Presentation
a. Concrete
1. Give this situation;
One face of the rubik’s cube looks this figure below.
Processing
How many square tiles are there in the figure?
How many small squares are there in each
column? (3)
How many squares are there in each row? (3)
2. Show these examples.
Examples 1
3 units
What do you call the line that enclosed the figure?
(sides)
3 u
nits

383
What will you do with the sides to get the area
which is 9? (multiply)
Area = side x side
= 3 x 3
= 9 square units
Example 2
4 units
Area = 4 x 2
= 8 square units
b. Pictorial Let the pupils draw a rectangle. 1. Labe its length as 6 units and its width 3 units. 2. Show how the area is solved. 3. Give answer.
c. Abstract
The side of a square is 7 units. Find the area if the square.
3. Reinforcing Activities
Let the pupils answer Gawain 1 and 2 in LM 111.
4. Application Let the pupils answer Gawain 3. Refer to LM 111.
5. Generalization
EVALUATION
Find the area of each figure. 1.
The area of a: Square = side X side Rectangle = side X side or length X width
2 u
nits

384
2, 2 units 4 units 3. 4 units 9 units HOME ACTIVITY: Refer to LM 111. ______________________________________________________________ Key to correction: Activity 1
1. 16 square units 2. 9 square units 3. 20 square units
Activity 2
1. Silid tulugan-30 sq units, kusina-18 sq units, silid kainan-28 sq units, palikuran-12 sq units, sala-42 sq units, silid tulugan- 30 sq units, garahe-21 sq units
2. Palikuran, 12 sq units 3. 3 sq units
Activity 3
1. 2 square units 2. Parisukat, 4 square units 3. 8 square units 4. Answers will vary
Evaluation
1. 4 sq units 2. 8 sq units 3. 36 sq units
Home Activity 1. 25 sq units 2. 90 sq units 3. 40 sq units

385
4. 2 sq units 5. 80 sq units ____________________________________________________________
Teaching Guide for Mathematics Grade 2
Area Lesson 112
TOPIC: Area of a Plane Figure OBJECTIV Estimate the area of a given figure using any shape. PREREQUISITE CONCEPTS AND SKILLS
Show the area of a given figure using square tiles. MATERIALS
3. Square cardboards cut-outs 4. Square, rectangle, L-shaped and T-shaped big boards
INSTRUCTIONAL PROCEDURES A. Preparatory Activities
1. Drill Using the cardboard cut-outs let the pupils show the area
of the following figures. (This figures need to be drawn by the teacher on the board. Be sure that the figures will fit with the desired area.)
a. c.
b. d.
2. Pre-Assessment
Group the class into 4.
a. Prepare four learning stations.
b. Each station has one board and a small square cardboard
cut-out as square tile.
Station 1 - square board
Station 2 - rectangular board

386
Station 3 - L-shaped board
Station 4 - T-shaped board
c. Using the square cut-out cardboard let them find the area of
each board.
d. Give each group the time to present the answers in front of
the class.
B. Development Activities 1. Motivation
Show pictures of different tile design like these ones below:
Ask the following questions. d. What are the shapes of the tiles? e. How many squares does the first figure contain? f. How many triangles does the second figure contain? g. How many rectangles does the third figure contain?
2. Presentation
a. Concrete
Activity
Group the class into 3. Using the small objects, let
each group estimate (using cardboard cut-outs) the
measure of the big objects. (The teacher is not limited
to the objects enumerated)
Group 1:
Group 2:

387
Group 3:
Processing:
Give each group time to report on the following questions.
How did you estimate the measure of the big objects
using the size of the small objects?
How many small objects do the big objects have?
Can the small square be used in estimating the
measure of the big rectangle? Why?
b. Pictorial
Activity
Group the class into 2.
Let each group draw the big figures. Then, inside it,
draw the number of small figures. Determine if how
many small figure will the big figure contain. (The
teacher is not limited to the objects enumerated)
Group 1
Group 2

388
Group 3
Processing:
Give each group time to report on the following questions.
For group 1 only: Can the small triangle be used in
estimating the measure of a big rectangle? How?
For group 2 only: Can the small square be used in
estimating the measure of the big triangle? How?
For group 3 only: Can the small rectangle be used in
estimating the measure of the big square? How?
For the 3 groups:
How did you estimate the measure of the big object using the size of the small object?
How many small objects are there in big object?
c. Abstract Look at the figures below. About how triangles will there be in the rectangle?
3. Reinforcing Activities: Let the pupils answer Gawain 1 in LM 112. Key to correction: 1. 8 2. 12 3. 6
4. Application: Ask the class to answer Gawain 2 in LM 112. Key to correction:
1. 50 square units 2. Mga 3 square units

389
3. Mga 15 square units 4. Mga 25 square units ( if the pupils can’t give the exact value,
the estimated area can be 20 or more square units)
5. Generalization. EVALUATION: Given the small figure, estimate the area of the bigger figure. 1. 3 units 5 units 2. 4 units
5. 5 units
2 units
HOME ACTIVITY Refer to LM 112. ___________________________________________________________
Teaching Guide for Mathematics Grade 2 Capacity
Lesson 113 TOPIC: Measuring capacity OBJECTIVE
Identify appropriate unit of measure in finding the capacity
Estimating the measure of a given figure using different shapes can be done by visualizing the given shape and fitting it on the given figure.

390
PREREQUISITE CONCEPTS AND SKILLS
Measure capacity using non-standard units MATERIALS
1. Bottles of soft drinks or medicines, cups, glasses and pitcher 2. Different items with different sizes with ml or l label content
3. Show Me Boards INSTRUCTIONAL PROCEDURES A. Preparatory Activities:
1. Drill Show the different measuring device. Ask:
c. Can you remember how you use these things when you were in Grade 1?
d. How many glasses of water are there in a pitcher?
e. Can you still remember the number of bottles of mineral water in a bottle of family-sized soft drink?
The illustration below can be used to help the pupils remember the non-standard units used in measuring liquids.
2. Pre-Assessment Show the following objects to the class. Let the pupils
stand if the content is in liquid form and clap twice if not. a. A canned sardines b. A bottle of juice c. A bottle of vinegar d. A pack of powdered milk e. A bottle of mineral water

391
B. Developmental Activities:
1. Motivation: Show a picture like the one shown below.
Ask: a. What is the boy doing? (drinking water) b. Discuss the importance of water in our body.
For drinking (drink 8 to 10 glasses of water every day)
For taking a bath
For washing dishes and clothes
2. Presentation a. Concrete
1. Show different kinds of bottles commonly used in the locality like: 1 liter soft drink, 1.5 liter bottle of juice, 2 bottles of mineral water (big and small) and a bottle of vinegar.
2. Look at the capacity of each bottle on its label and show it to the class.
3. Write the words mililiter and liter on the board for the pupils to see. Then discuss the following:
The capacity of a small container is in mililiter while that of the big one is in liter.
The abbreviation of mililiter is ml and that of liter is
l.
4. Show to the class these bottles of water.
1 liter 100 mililiter
Using the 100 ml bottle of water, let them fill the big bottle with water.

392
Allow them to see the difference between 1 liter and 100 mililiter.
Help them realize that 10 ml water is a small amount compared to 1 liter. There is no need to introduce first the equivalence of 1000 ml =1 l. The purpose is learn that small amount of liquid is to be measured in mililiter and big amount in liter.
b. Pictorial Ask the pupils to name liquid ingredients that are used in cooking. Examples are water, vinegar, oil and soy sauce. Let them draw containers and name the ingredient inside of each. Then, write the appropriate unit to be used in measuring the capacity. Examples:
a glass of milk is - in mililiter
a pitcher of water is - in liter
c. Abstract Group activity Divide the class into three’s. Using their Show Me Boards,
let each group write if the capacity inside the container will be measured by liter or milliliter.
1. Water inside a tank 2. Juice inside a small can
3. Milk in a glass
4. Water in a gallon 5. Vinegar in a sachet
Ask the pupils to present their answers in front of the class.
3. Reinforcing Activities Let the pupils answer Gawain 1. Refer to LM 113.
Key to correction 1. Liter 2. Mililiter 3. Mililiter 4. Liter 5. Mililiter
4. Application:
Let the pupils answer Gawain 2 in LM 113. Key to correction: 1. Mililiter

393
5. Generalization.
EVALUATION: Anong unit of capacity ang gagamitin sa mga sumusunod na
aytem? Isulat ang liter o meliliter at ang abbreviation nito. 1. Tubig sa loob ng tangke 2. Gatas sa tasa 3. Tubig sa pitsel 4. Suka sa bote 5. Juice sa baso Key to correction: 1. liter 2. mililiter 3. Liter
4. mililiter 5. mililiter HOME ACTIVITY
Refer to LM 113. _____________________________________________________________
Teaching Guide for Mathematics Grade 2
(Statistics and Probability) Lesson No. 114
TOPIC: Collect and Organize Data OBJECTIVE Collect and organize data using tables and pictures. PREREQUISITE CONCEPTS AND SKILLS 1. Organize data using charts and graphs.
2. Collect and organizes data using tallies and tables.
MATERIALS 1. Non-transparent bag 3. Graphing paper 2. 20 crayons in red, blue, green and yellow (assorted number of each
color)
INSTRUCTIONAL PROCEDURE A. Preparatory Activities 1. Pre-assessment Show to the pupils an empty non-transparent bag. (or use a covered jar) Put all the 20 crayons in the bag. Explain to the pupils that they are going to use the crayons to make a graph that shows how many are there in each color. Ask the pupils to create a graph of the colors of the crayons. (similar to the one below using their graphing paper) At random, ask pupil/s to
The capacity of liquid is measured in liter when in big amount and in mililiter when in small amount.
394
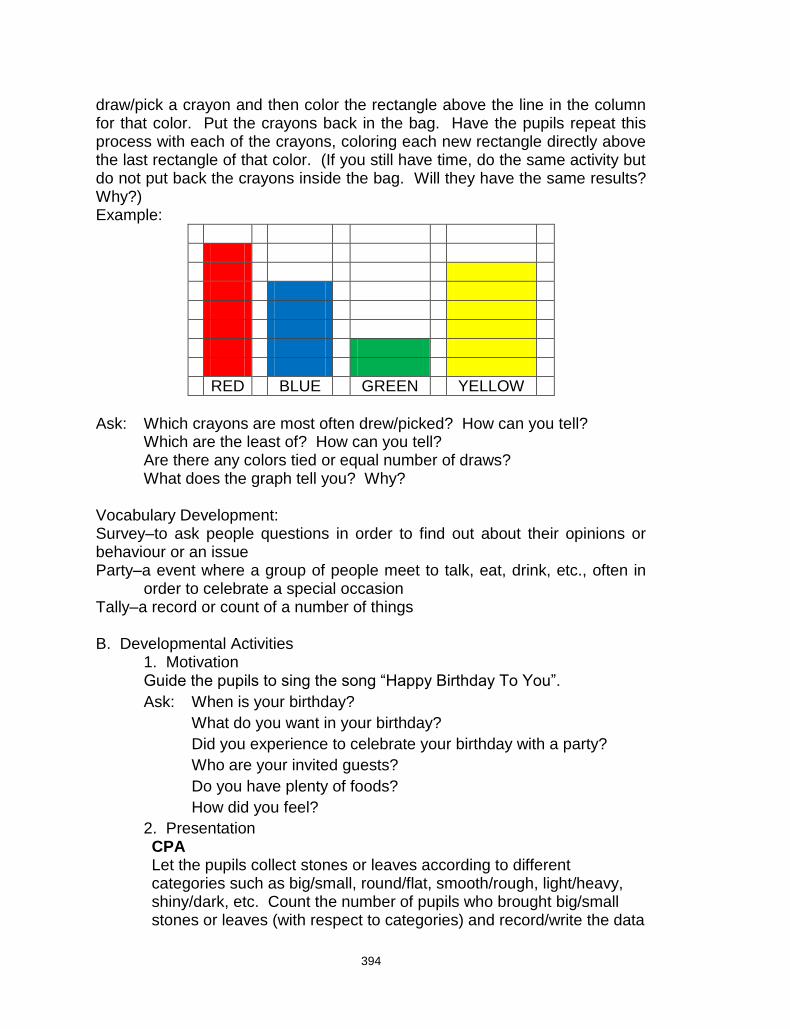
draw/pick a crayon and then color the rectangle above the line in the column for that color. Put the crayons back in the bag. Have the pupils repeat this process with each of the crayons, coloring each new rectangle directly above the last rectangle of that color. (If you still have time, do the same activity but do not put back the crayons inside the bag. Will they have the same results? Why?) Example:
RED BLUE GREEN YELLOW
Ask: Which crayons are most often drew/picked? How can you tell? Which are the least of? How can you tell? Are there any colors tied or equal number of draws? What does the graph tell you? Why? Vocabulary Development: Survey–to ask people questions in order to find out about their opinions or behaviour or an issue Party–a event where a group of people meet to talk, eat, drink, etc., often in
order to celebrate a special occasion Tally–a record or count of a number of things B. Developmental Activities 1. Motivation Guide the pupils to sing the song “Happy Birthday To You”.
Ask: When is your birthday?
What do you want in your birthday?
Did you experience to celebrate your birthday with a party?
Who are your invited guests?
Do you have plenty of foods?
How did you feel?
2. Presentation CPA Let the pupils collect stones or leaves according to different categories such as big/small, round/flat, smooth/rough, light/heavy, shiny/dark, etc. Count the number of pupils who brought big/small stones or leaves (with respect to categories) and record/write the data

395
gathered in the worksheet (refer to sample worksheet: on the board or individually in a sheet of paper.)
Sample worksheet
Category Leaves
Tally No. of Pupils
Small
Big
TOTAL
Category Stones
Tally No. of Pupils
Round
Flat
TOTAL
How many pupils brought (categories) stones/leaves? What is the least common category? What is the most common category? What is the total number of pupils?
Practice: Joe and Rhona are in the same class of 35 students. They had a survey to help them select foods for their class party. The result of the survey is shown in Table 1:
Table 1
Party Food Survey
Choices Tally Votes
Burger IIII - 4
Spaghetti IIII IIII III - 13
Hot Dog IIII IIII - 9
Chicken Salad III - 3
Pancit IIII I - 6
TOTAL
Processing: What are the food choices of the class? Which among the foods got the highest votes? Which among the foods got the lowest votes? What is the total number of votes? Based on the result, what are the two foods preferred by the class to
have in the party? Practice: See LM 114 – Gawain 1 Answers will vary. How many pupils ride a school bus? How many pupils walk to school?

396
How many pupils ride a car from home? How many pupils ride on their bike? What means of transportation do most pupils used?
(Change the means transportation if necessary. Data will vary depending on information gathered.)
Practice After filling the “How students get to school?” tally chart, prepare a graph using the same data. 3. Reinforcing Activities Refer to LM 114–Gawain 2 Read the story
How many SPED pupils chose a (flavour) ice cream cone? Which flavour wasn’t selected? How many flavours were chosen only once? Which flavour was selected the most? Which flavours were selected the same number of times? How many pupils chose Rocky Road? Assist the pupils to fill up the table.
My Favourite Ice Cream
Ice Cream Flavours 4. Application Refer to LM 114 – Gawain 3
Our Pets
Kinds of Pets
Triple Cookies Rocky Double Ube
Chocolate n' Cream Road Dutch Macapuno
0
1
2
3
4
5
Fish Dogs Cats Birds No Pets
Number of Pets IIII II IIII IIII IIII IIII III IIII IIII

397
Use the above information to fill in the graph below.
Our Pets
Kinds of Pets
Make a tally chart that shows the number of pupils who have pets and who do not have pets. 5. Generalization EVALUATION The students of Holy Infant Academy are voting for the booth they want to have at the Academy Day. They wanted to know the booth preferred by the students. The results of the voting survey are as follows: Make a picture graph using the above data. HOME ACTIVITY Refer to LM 114 – Gawain Bahay Key: Answers will vary.
Fish Dogs Cats Birds No Pets0
2
4
6
8
10
Nu
mb
er
of
Pet
s
No. of Students 200 59 70 30 45
Booth Movie Dedication Food Jail Marriage
Data are information that are collected about people or things Tally Chart is a chart that uses tally marks to show data.

398
Teaching Guide for Mathematics Grade 2 (Statistics and Probability)
Lesson No. 115
TOPIC: Read and Make Pictograph OBJECTIVES
1. Read and interpret data in a given pictograph. 2. Form scale representation of objects from the data collected. 3. Make pictographs using scale representation.
PREREQUISITE CONCEPTS AND SKILLS
1. Collect and organize data using tables and pictures 2. Counting 3. Addition 4. Multiplication
MATERIALS 1. Calendar where Philippine holidays are written 2. Sample Pictographs 3.
INSTRUCTIONAL PROCEDURE A. Preparatory Activities 1. Pre-assessment Show a calendar where all regular holidays in every month are listed. Select the first 4 months of the calendar and count the number of holidays. (Number of holidays may vary every year) Make a tally chart and picture graph that will use the information in the selected months. Assist the pupils who hardly or find difficulty to make a tally chart and picture graph similar to the one below: Tally Chart:
(Help the pupils to think of a symbol that would represent each month that has connection to the holidays)
No. of
DaysII II I IIII
Month January February March April
Holiday

399
Picture Graph: Vocabulary Development: Pictograph is a graph that uses pictures or symbols to show or
represent data. Label is a short description given for the purpose of identification. Key or legend is a word or phrase or number written on or next to a
picture, map, etc. that explains what it is about or what the symbols on it mean or equal to.
B. Developmental Activities 1. Motivation What tree is abundant in your place? (Coconut, Mango, etc.)
Have you seen a coconut tree (most common)?
What can we get from a coconut tree?
2. Presentation Today we will make a pictograph. What is a pictograph? A pictograph is a graph that uses pictures or symbols to show or represent data. All pictographs have labels and Key or legend. A label is a short description given for the purpose of identification. A key or legend is a word or phrase or number written on or next to a picture, map, etc. that explains what it is about or what the symbols on it mean or equal to. Conduct a survey to the class who have old or new bags, shoes, hats and umbrellas, etc. (anything that the pupils usually bring to school) Group the pupils according to the classification s/he sets. Write on the board or use large chart paper, or an overhead projector to record the information in a tally chart format. Let the pupils draw the categories if possible. From the
January February March April
Month
Holiday
0
1
2
3
4
5 N u m b e r
of D a y s

400
collected data, let them create their own data representations or even their own pictograph. S/he should see to it (observe/guide) that the pupils include the necessary parts of the graph/table. Practice: Posing Problem: Don Dominic has a big lot. He wanted to have a coconut plantation so he started planting coconut trees on it. Initially, he planted for 5 Months. The graph below shows the total number of coconut tree planted each day:
Month Number of Trees January 80 February 70 March 100 April 90 May 70
What we need to do first? (Answers may vary) What symbol can we use? (Let them decide on the symbol and how many it will represent. A tree would be a logical symbol. Discuss different number representation but explain to them that 10 is the best choice, considering the given trees for the month of March.) On the board, have the pupils list the months. Ask the pupils month by month how many tree symbols they need to draw. (8, 7, 10, 9, 7) What other things they need besides a symbol? (Title, labels, and legend or key.) What title could we use? (Answer may vary. Dominic’s Coconut Plantation) What labels could
we use? (Months) The legend or key should be = 10. Why is it so important? (You cannot read the graph without a key or legend)

401
Dominic’s Coconut Plantation
Month Trees
January
February
March
April
May
Key or Legend: = 10 trees Processing:
What is the title of the Pictograph? Who has a big lot? What are the labels in the pictograph? What is the symbol used in the pictograph? What did he want to plant on it? How many months did he plant? Let the pupils read the months. What is the key or legend of the pictograph?
What is the equivalent of one ? (How many coconut tree a picture represents?) What month did he plant the most number of coconut trees? (If 1 coconut tree (picture) is equivalent to ten coconut trees then how many coconut trees did he plant on January or let the pupils figure out how many coconut trees were planted on January: multiply 8 times 10 or 10+10+10+10+10+10+10+10).
What month did he plant the least number of coconut trees? (If 1 coconut tree (picture) is equivalent to ten coconut trees then how many coconut trees did he plant on February and May? Help the pupils figure it out)
What is the total number of of coconut trees did he plant? Solution:
Title
Labels
Labels

402
Day Tally
Monday
8 x 10 = 80
(10+10+10+10+10+10+10+10)
Tuesday
7 x 10 = 70
(10+10+10+10+10+10+10)
Wednesday
10 x 10 = 100
(10+10+10+10+10+10+10+10+10+10)
Thursday
9 x 10 = 90
(10+10+10+10+10+10+10+10+10)
Friday
7 x 10 = 70
(10+10+10+10+10+10+10)
Then: Find the sum of 80 + 70 + 100 + 90 + 70 = 410 coconut trees (Integration: Discuss the importance of planting trees.) 3. Reinforcing Activities
Refer to LM 115 – Gawain 1
Legend: = 10 Boy Scouts
What is the title of the pictograph? What are the labels of the pictograph? What is the symbol used in the pictograph? (What is the legend of the pictograph?)

403
How many days did they clean?
What is the equivalent of one ? (How many boy scouts a picture represents?) What day did the boy scouts participate the most? What day did the boy scouts participate the least?
What is the purpose of the barangay clean up?
What is the total number of boy scouts who participated in the clean
up?
Write the number equivalent of boy scouts in opposite each day. (Valuing: Discuss the importance of helping the community/one another) Make the scale representation of the pictograph “Boy Scouts Barangay Clean Up.” Key:
Araw Bilang
Linggo 50
Lunes 60
Martes 30
Miyerkoles 40
Huwebes 50
Biyernes 20
Sabado 70
4. Application
Refer to LM 115 Gawain 2.
Legend: = 3 Awards
1. What is the title of the Pictograph? 2. What are the labels of the pictograph? 3. What is the symbol used in the pictograph? 4. How many pupils received paper stars? 5. How many awards a star represent? 6. Who received the most number of awards? 7. Who received the least number of awards? 8. How many awards did each pupils received? 9. What is the total number of awards for the month? 10. Who could be the smartest among the 5 pupils?
404
5. Generalization What is a pictograph? It is a representation of data using pictures. What is a key or legend? It is a short description of a picture or illustration. How can we interpret a pictograph? We can interpret a pictograph by using legend. EVALUATION
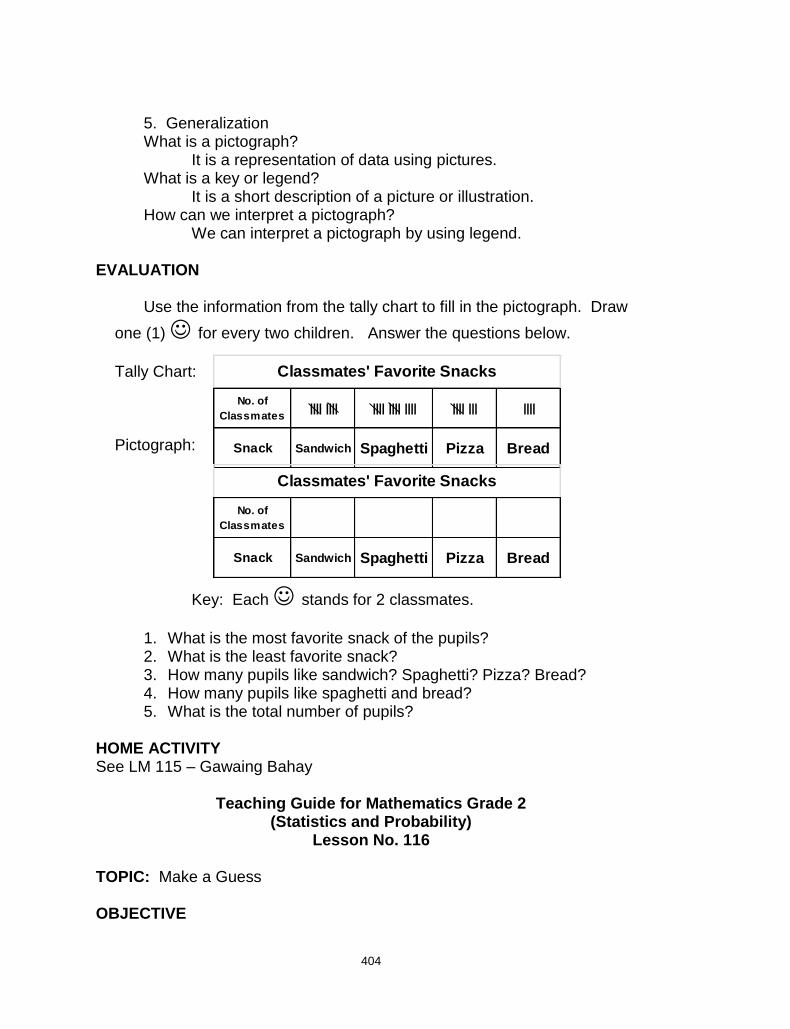
Use the information from the tally chart to fill in the pictograph. Draw
one (1) for every two children. Answer the questions below.
Tally Chart: Pictograph:
Key: Each stands for 2 classmates.
1. What is the most favorite snack of the pupils? 2. What is the least favorite snack? 3. How many pupils like sandwich? Spaghetti? Pizza? Bread? 4. How many pupils like spaghetti and bread? 5. What is the total number of pupils?
HOME ACTIVITY See LM 115 – Gawaing Bahay
Teaching Guide for Mathematics Grade 2 (Statistics and Probability)
Lesson No. 116
TOPIC: Make a Guess OBJECTIVE
No. of
Classmates IIII IIII IIII IIII IIII IIII III IIII
Snack Sandwich Spaghetti Pizza Bread
Classmates' Favorite Snacks
No. of
Classmates
Snack Sandwich Spaghetti Pizza Bread
Classmates' Favorite Snacks

405
Make a guess on whether an event is less likely, more likely, equally likely or unlikely to happen based on facts.
PREREQUISITE CONCEPTS AND SKILLS 1. Predict and record outcome of experiments and chance games.
MATERIALS 1. Paper bags 4. Party/Magicians hat 2. Colored popsicle sticks 5. Colored candies or small toys 3. Improvise spinner 6. Basket of fruits
INSTRUCTIONAL PROCEDURE A. Preparatory Activities 1. Pre-assessment Show an empty paper bag to the pupils. Put inside the bag seven colored popsicle sticks (4 red, 2 green, and 1 yellow) (may vary). Don’t mention the colors. Say: Your goal is to draw a conclusion about the number and color of each popsicle sticks that is inside the bag. Present the worksheet and model the experiment to the class. Discuss the information regarding “What we Know” about the paper bag and record the idea. Example: I know that there are seven popsicle sticks in the bag. (Later after several trials without putting the popsicle sticks back in the bag, discuss the “My prediction is . . .) Their colors are red, green and yellow. What We Know . . . My prediction is that we have . . .
_____ RED, _____ GREEN and _____ YELLOW popsicle sticks.
RESULTS of the EXPERIMENT
RED GREEN YELLOW
Trial # 1
Trial # 2
Trial # 3
Trial # 4
I Guess the next is . . .
Trial # 5
I Guess the next is . . .
Trial # 6
I’m sure the next is . . .
Trial # 7

406
We have are _____ RED, _____ GREEN and _____ YELLOW popsicle sticks. What makes you so sure/certain that the last popsicle stick is _______ in color? Vocabulary Development: Likelihood – are the four events such as: Less Likely, Equally Likely, More Likely and Unlikely that an event will happen/occur. Less Likely – an event is less likely if it does have a smaller chance of
happening. Equally likely – an event is equally likely if it does have an equal/fair chance
of happening. (half/half) More Likely – an event is more likely if it does have greater chance of
happening. Unlikely – an event is unlikely if it does not have a good chance of happening. B. Developmental Activities 1. Motivation
Ask the pupils about everyday experiences of chance and
certainty that they can recall.
Make a list of things that will never happen. (Example: A flying
carabao, you see a live dinosaur today, etc.) Label this list.
“Impossible.”
Now make a list of things that will definitely happen. (Example:
the sun will rise tomorrow, you will eat something today, etc.) Label this
list. “Certain.”
Now make a list of events that may or may not happen.
(Example: Tonight might rain, single 6-sided die rolling an even
number, etc.) Label this list. “Chance.”
Impossible Certain Chance
Analyse the list. Which of the three events has a long list?
Which list was easy to think off? Which list was funny to make?

407
1
2
1 2
1
2
3. Presentation Let the pupils create different kinds of spinning wheel with different symbols, shapes and numbers and with equal and unequal proportions. (S/He may start teaching from the unlikely to happen then followed by less likely to happen, equally likely to happen and finally to more likely to happen.)
Our topic for today is about making a guess, whether it is less likely, equally likely, more likely, or unlikely to happen. (Present the spinners one by one and discuss its meaning). An event is said to be less likely if it does have a smaller chance of happening. Show the improvised spinner. (Ask the pupils before spinning.) Which color do you think the marker will point? Why? (Then spin it several times.) This shows that red or number 1 is less likely to happen. (Ask a common question every time you present a spinner: Does the size of the covered colors (red and blue) affect the likelihood of which the arrow will land?) Next is to discuss the equally likely to happen. An event is said to be equally likely if it does have an equal or fair chance of happening. (Half/half) Can you describe the next spinner wheel? (Let the pupils describe before showing the next spinner.) Ask the pupils. Which color do you think the marker will stop? Why? (Then spin it several times to prove that it is almost equal. Tell them that the more trials you make, the more equally likely the results). Do you think that the spinner is divided equally? Ask again: Does the size of the covered colors (red and blue) affect the likelihood of which the arrow will land? Emphasize to them that red/1 and blue/2 are equally likely to happen. An event is more likely if it does have greater chance of happening. In this case red/1 is more likely to happen than blue/2 or blue/2 is less likely to happen than red/1. If you will compare the first and third spinner, what is something common to them? Are they the same? Why? Ask again: Does the size of the covered colors (red and blue) affect the likelihood of which the arrow will land? Finally, show them the last spinner. An event is unlikely if it does not have a good chance of happening. What can you say about the last spinner? (Blue/2 has a very slim chance or unlikely to happen because red/1 almost occupy the whole wheel. Ask them again: Does the size of the covered colors (red and blue) affect the likelihood of which the arrow will land? Did you understand/enjoy our lesson? Practice Show to the pupils a party hat or magician’s hat. Put inside the hat 1 orange, 3 blue, 6 green and 12 red candies or small toys. (Act like a magician by showing your hands are clear and you will draw one candy/toy at a time to make it a little bit exciting.) Can you guess the color of the candy/toy that I will draw? (Answer may vary but just the same let them explain why they choose that answer.) Present a worksheet similar to the
1
2

408
one below or you may write it on the board. After each draw you will call a pupil to write below the color the word “Less Likely”, “Equally Likely”, “More Likely” and “Unlikely” and let them explain their answer. After the 11th draw ask them if they can guess the next color to be drawn. Finish the activity.
Draw # Color of the Candies/Toys
1 Orange Blue Green Red
2 Blue Green Red Orange
3 Green Red Orange Blue
4 Red Orange Blue Green
5 Orange Blue Green Red
6 Blue Green Red Orange
7 Green Red Orange Blue
8 Red Orange Blue Green
9 Orange Blue Green Red
10 Blue Green Red Orange
. . . . .
. . . . .
. . . . . 22 Blue Green Red Orange
3. Reinforcing Activities Group the class into 2. Answer the questions provided in each group. Talk about the pupils answers/reasons. Refer to LM 116 – Gawain 1 Group 1: (Weather)
Events Likelihood Reason
It will rain tomorrow.
The sun will shine tomorrow.
The following day will be windy.
We will have a super typhoon.
We will need a rain coat.

409
2
The sun will rise after 8:00 A.M.
Key: (Answers will vary) Group 2: (Household Chores)
Events Likelihood Reason
Wash the dishes
Clean the yard
Wash clothes
Sweep the floor
Take care of baby sister/brother
Scrub the floor
Key: (Answers will vary) 4. Application Show an improvised spinner and make sure it is fair. Have the whole class do the lesson together. Each pupil will spin once and record the spin in the worksheet. What color the spinner would land? Can you guess the likelihood of each color? (Blue is more likely, yellow is unlikely, red and green is less likely. It is noticeable that there is no equally likely. It is expected that the frequency of red and green are almost the same. Help the pupils realized that red and green are equally likely to each other.)
Color Tally Frequency Likelihood
Red Less likely
Green Less likely
Blue More likely
Yellow Unlikely
5. Generalization
An event is less likely if it does have a smaller chance of happening. An event is equally likely if it does have an equal/fair chance of happening. An event is more likely if it does have greater chance of happening. An event is unlikely if it does not have a good chance of happening.
EVALUATION
Present a chart with list of events for the month, and record the events according to the likelihood they will occur.
No. Events Likelihood Why
Ex. Supervise Recess More likely Happening Daily

410
1. Reading Books
2. Cleaning the room
3. Religion Period
4. Feeding event
5. Playing time
6. Ground improvement
7. Campus field trip
8. Planting Activity
9. Viewing Time
10. Values formation
HOME ACTIVITY
Refer to LM 116 – Gawaing Bahay: Key: (Answers will vary)