instruction manual for the cahsee early warning model
TRANSCRIPT

Instruction Manual for the CAHSEE Early Warning Model
Version 1.0, June 2012
Julian R. Betts, Andrew C. Zau, Yendrick Zieleniak, and Karen Volz Bachofer
Supported with funding from the Donald Bren Foundation

Contents
Exhibits 5
Table 5
Introduction 6
Overview of Data Requirements 8 1. Preparing Data for Use in the Spreadsheets; Limitations of the Model 8 2. Inputting Data from Grade 6 into the Validation Spreadsheet and Interpreting the Results 9 3. The Grade 6 Forecasting Spreadsheet 15 4. Inputting Data from Grade 8 into the Validation Spreadsheet and Interpreting the Results 16 5. The Grade 8 Forecasting Spreadsheet 17
District Feedback: Questions and Suggestions 18
Appendix 19
http://www.ppic.org/main/home.asp Instruction Manual for the CAHSEE Early Warning Model 5
Exhibits
1. Sample Data Entry worksheet with two observations added 9
2. The first four tables in the Results and Graphs worksheet 10
3. Table 5 from the Results and Graphs worksheet with results for SDUSD 11
4. Tables 6 through 8 from the Results and Graphs worksheet, showing the consequences of using various cutpoints to determine students who should receive academic assistance 12
5. Figure 1 from the Results and Graphs worksheet, showing as an example the results from San Diego on the overall passage of the CAHSEE 13
6. Figure 2 from the Results and Graphs worksheet, showing as an example the results from San Diego on the passage of the Math section of the CAHSEE 14
7. Figure 3 from the Results and Graphs worksheet, showing as an example the results from San Diego on the passage of the ELA section of the CAHSEE 14
8. Figure 4 from the Results and Graphs worksheet, showing for San Diego the distribution of students by predicted probability of passing the CAHSEE 15
9. Predicted probabilities of passing the CAHSEE in grade 10 from the Predict worksheet 16
10. Probit Models of grade 10 CAHSEE passage as a function of student characteristics, grades, and test scores in grade 6 20
11. Probit Models of grade 10 CAHSEE passage as a function of student characteristics, grades, and test scores in grade 8 21
Table
1. Names of Excel spreadsheets provided as part of the CAHSEE Early Warning Model by grade level and purpose 6

http://www.ppic.org/main/home.asp Instruction Manual for the CAHSEE Early Warning Model 6
Introduction
The CAHSEE Early Warning Model is a new tool that California school districts can use to help forecast which students are likely to fail one or both components of the California High School Exit Examination (CAHSEE) when they first take the test in grade 10. Early identification of students at risk of failing the exam is an important goal, since grade 10 failure rates remain high statewide, and much of the content that students must master to pass the exit examination is taught in the upper elementary and middle school grades. In Passing the California High School Exit Exam: Have Recent Policies Improved Student Performance?—a report released by the Public Policy Institute of California simultaneously with this CAHSEE Early Warning Model—Betts, Zau, Zieleniak, and Bachofer show that one can predict success and failure on the exit examination using state tests, but that predictions improve if one incorporates additional information. The CAHSEE Early Warning Model is based on models we have estimated using data from the San Diego Unified School District (SDUSD), using students who took the CAHSEE in 2007 when they were in grade 10.
The model consists of four Excel spreadsheets: two “validation” spreadsheets (for grades 6 and 8) and two “forecasts” spreadsheets (again, for grades 6 and 8). Table 1 describes their purposes and file names. School districts can choose whether they prefer to use student data from grade 6 or grade 8 to create forecasts, in part based on when they desire to begin targeting assistance to students—in grade 7 or grade 9. In SDUSD, we have found that data from either grade 6 or grade 8 forecast outcomes well. There is a tradeoff, though, in that using grade 6 data allows districts to intervene earlier in students’ careers, but using data from grade 8 will generally provide slightly more accurate forecasts of how the students will perform on the CAHSEE when they reach grade 10.
TABLE 1 Names of Excel spreadsheets provided as part of the CAHSEE Early Warning Model by grade level and purpose
Characteristics of students based on data from:
Purpose: Validating the model for students who have already taken the CAHSEE in grade 10
Purpose: Forecasting the probability of passing the CAHSEE in grade 10 for students who have not yet taken the exam
Grade 6 Validation_Grade_6.xlsx Forecasts_Grade_6.xlsx
Grade 8 Validation_Grade_8.xlsx Forecasts_Grade_8.xlsx
The four spreadsheets are quite similar. The validation spreadsheets allow district administrators to enter information on whether students passed the mathematics and ELA components of the CAHSEE in grade 10, and then to compare the predicted probability of passing against actual passage rates. The forecast spreadsheets are identical except that they do not allow input of CAHSEE passage information, because these spreadsheets are intended to evaluate students who have not yet taken the CAHSEE.
Validation. Because some of the required student variables, such as grade point average (GPA), English Learner (EL) status, or participation in special education, may be measured or determined differently from one district to another, we urge districts to test the CAHSEE Early Warning Model using data from older students in their own districts for whom grade 10 CAHSEE results are already known. One can then compare the predictions of the validation spreadsheet against what actually occurred among these students. This validation exercise is crucial, because it provides some direct evidence on how well the model works in the given district.

http://www.ppic.org/main/home.asp Instruction Manual for the CAHSEE Early Warning Model 7
If this validation exercise shows that the model has good predictive power for students in a given district, then that district may want to use it to forecast whether students in the district who have not yet reached grade 10 will pass either or both sections of the CAHSEE when they reach grade 10.
Conversely, if the validation exercise shows that the model does not accurately predict who did pass the exit examination in grade 10 in the given district, it probably means that the district will need to develop its own statistical model of passage rates.
Forecasting. To predict CAHSEE passage, one will need to enter a small number of student variables, measured in one selected grade (either grade 6 or grade 8) into a forecasting spreadsheet. The spreadsheet will provide the estimated probability of each student, in grade 10, passing the mathematics portion of the CAHSEE, the English Language Arts (ELA) portion of the CAHSEE, or the CAHSEE overall (by passing both sections).

http://www.ppic.org/main/home.asp Instruction Manual for the CAHSEE Early Warning Model 8
Overview of Data Requirements
For districts wishing to use data from grade 6 to validate or forecast student success on the CAHSEE, the following data must be gathered: binary, that is (0,1) indicators, for whether the student is female, EL, or in special education, as well as annual GPA, the percentage of days in the school year when the student was absent, the grade 6 scaled scores for the student on the California Standards Test (CST) in mathematics and English Language Arts, and the calendar year in which the CST test was administered. The user should then enter these data into the appropriate Excel spreadsheet, as described above in Table 1. For the validation spreadsheets, data on student passage in grade 10 are also needed.
The requirements for those wishing to use the grade 8 spreadsheets are the same as for grade 6, with some important exceptions. Because by grade 8, students in the same grade are likely to be taking different mathematics CST tests, based on the mathematics course they enrolled in that year, one must also enter a numerical code for the type of CST test taken. We are able to provide estimated probabilities of passing the CAHSEE for grade 8 students who took any of the following math CST tests: General Mathematics, Algebra I, and Geometry.
We have organized the rest of this section as follows:
1. Preparing Data for Use in the Spreadsheets; Limitations of the Model
2. Inputting Data from Grade 6 into the Validation Spreadsheet and Interpreting the Results
3. The Grade 6 Forecasting Spreadsheet
4. Inputting Data from Grade 8 into the Validation Spreadsheet and Interpreting the Results
5. The Grade 8 Forecasting Spreadsheet
1. Preparing Data for Use in the Spreadsheets; Limitations of the Model
Data, from whatever district source, should be in a form that can be exported into an Excel spreadsheet or copied and pasted directly into the provided spreadsheet templates. With one row per student, columns include variables such as ID (any identifying variable the district cares to use), demographics, grades, absences, and test scores. Apart from ID, which is for district use and can contain any sort of alphanumeric student id, all variables should be numerical. By exporting data in the same order as listed in the Data Entry worksheet of the appropriate Excel spreadsheet, one can save a substantial amount of time in copying and pasting data.
Limitations
i) Missing data To produce estimated probabilities that a student passes the CAHSEE or its components, valid data for each of the variables must be entered into the spreadsheet. The spreadsheet is set up to check for blank (missing) values, and it will not produce estimated probabilities of passage for observations that are missing any of the variables used to predict outcomes. If a user sees “N/A” for a student’s predicted probability of passing the exit examination, this means that one or more of the required data fields for that student was blank.

http://www.ppic.org/main/home.asp Instruction Manual for the CAHSEE Early Warning Model 9
ii) Maximum number of observations The current version of the spreadsheet allows for data for up to 10,000 students to be entered. In the rare case that a district has more students in a cohort than this, individual predictions can still be obtained by dividing the data across several versions of the file. Alternatively, upon request we can provide instructions on how to change the formulae in the various calculation spreadsheets to accommodate more than 10,000 observations.
iii) The current model can accommodate CST scores from 2002 through 2011 only The Early Warning Model standardizes CST scores to have mean zero and variance one, using the statewide mean and standard deviation from the calendar year in which the CST was administered. The current version will standardize CST test scores for test administrations from 2002 through 2011. When 2012 CST norms are released, we will update the spreadsheet accordingly.
2. Inputting Data from Grade 6 into the Validation Spreadsheet and Interpreting the Results
Data input proceeds similarly in all four of the spreadsheet templates. District users should open the file, switch to the Data Entry worksheet, and paste the requested data. None of the other worksheets (Results and Graphs, Predict, and Calculations) should be altered in any of the Excel spreadsheets, as these worksheets process the data provided in Data Entry or present results of that analysis.
Below is a screen shot of the Data Entry worksheet from the grade 6 validation spreadsheet. This worksheet is used to input data for students who have already taken the CAHSEE in grade 10.
EXHIBIT 1 Sample Data Entry worksheet with two observations added
This screenshot shows fictitious data that have been entered for two students. (No data appear in rows 11 and below when the worksheet is first opened.)
Note that FEMALE, EL, Special Ed, and the outcomes from the grade 10 administration of the CAHSEE in columns J, K, and L are all coded as 1 if the student fits into the stated category and 0 otherwise. For instance, we see in row 11 that the student with ID = 2 is a male, EL student, not in special education, who did not pass the CAHSEE overall, did not pass the mathematics section of the CAHSEE, but did pass the ELA section.
GPA is measured on a 0–4 scale and represents the overall GPA in grade 6.

http://www.ppic.org/main/home.asp Instruction Manual for the CAHSEE Early Warning Model 10
The percentage of days absent is calculated as 100% x (number of days absent/number of days in school year). Thus, if a student missed 9 out of 180 school days, he was absent 5 percent of the time and this should be entered as 5, not 0.05.
The Mathematics and ELA Scaled scores refer to each student’s scaled scores on the grade 6 CST in the stated subjects. It is important to include in column I the calendar year in which the student was tested. We use this to transform each student’s score into a “Z-score,” which measures the number of standard deviations above or below the state average the student scored in the given year. The year refers to the calendar year in which the test was administered. For instance, in row 11, we see that the student took the grade 6 test in spring 2007.
After the data have been entered in the Data Entry worksheet, summary results will appear in the Results and Graphs worksheet, and predicted probabilities of passage for each student will appear in the Predict worksheet.
The Results and Graphs worksheet provides several tables of results. Exhibit 2 below shows the first four tables of results for the SDUSD data used to estimate the CAHSEE Early Warning Model. We think it is useful to show users the results for SDUSD as they provide a point of comparison for results from their own district.
EXHIBIT 2 The first four tables in the Results and Graphs worksheet

http://www.ppic.org/main/home.asp Instruction Manual for the CAHSEE Early Warning Model 11
Tables 1 and 2 show the number and percentage distribution of students in the sample by predicted probability of passing. Each row corresponds to a different “predicted probability of passing” group. For instance, the first row of each table refers to students in each predicted probability range from “< 0.10,” which means a probability of passing of less than 0.10 (that is, 10%). The last row refers to students in the group “0.9 or higher,” which means a predicted probability of passing of 90 percent or higher.
To make the tables easier to read, we listed probability ranges as 0.10–0.19, 0.20–0.29, and so on. In fact, we assign any student with predicted probability equal to or greater than 0.1 and strictly less than 0.2 to the group “0.10–0.19.”
Tables 3 and 4 in the Results and Graphs worksheet show the number of students in each predicted probability group who actually passed and who actually failed the CAHSEE overall, as well as the number who passed and who failed the mathematics and ELA portions of the exam.1
Table 5, shown for the SDUSD data in Exhibit 3 below, shows the percentage of students in each probability category who actually passed in grade 10, overall and by subject area. The bottom row shows the pass rates for the entire student sample. The Early Warning Model clearly works well for the SDUSD sample, because the percentage of students passing rises steeply with the predicted probability of passing. For instance, in examining the “overall pass” column, we see that among the students with a predicted probability of passing of less than 0.10 (10%), only 8.2 percent in fact passed the CAHSEE in grade 10. Conversely, among the group of students with a predicted probability of passing of 0.9 or higher, fully 96.7 percent passed. The model, however, does not predict perfectly. For example, in the range 0.10–0.19 only 8.2 percent of the students passed the CAHSEE overall.
EXHIBIT 3 Table 5 from the Results and Graphs worksheet with results for SDUSD
1 Note that the first few rows of Table 3 show that more students in the bottom probability categories passed overall than passed either the math or ELA sections. At first this may seem impossible. But it is important to remember that there are different numbers of students in the category with predicted probability “< 0.10” for overall passage than there are in the corresponding “Pass Math” and “Pass ELA” categories. There will generally be more students with predicted probability below any given point such as 0.1 for overall passage than there will be for passage of either the ELA or math sections. Thus the same students are not being compared in the three columns of Table 3 in any given row.

http://www.ppic.org/main/home.asp Instruction Manual for the CAHSEE Early Warning Model 12
One of our key goals in creating the CAHSEE Early Warning Model was to help school districts simulate what would happen if they chose a cutpoint, that is, a probability of passing the CAHSEE below which a student would be provided with some form of intervention or assistance. This raises a number of questions: For a given cutpoint, how many students would need support? What percentage of all of the students who actually failed the CAHSEE when they reached grade 10 would have been included in the group targeted for assistance? Conversely, what percentage of students who passed the CAHSEE in grade 10 would have been included in the group targeted for assistance even though they passed without any additional help?
Exhibit 4 shows Tables 6 through 8 from the Results and Graphs worksheet, with data from SDUSD used to generate the results in the cells of the tables.
EXHIBIT 4 Tables 6 through 8 from the Results and Graphs worksheet, showing the consequences of using various cutpoints to determine students who should receive academic assistance
NOTE: Data show results for the grade 6 SDUSD sample used to generate the Early Warning Model.
Table 6 shows the total number of students who would have been identified for assistance. Table 7 shows the percentage of students who did fail the CAHSEE or one section of the CAHSEE in grade 10 who would have been included in the group below the cutpoint and who would therefore receive assistance through whatever academic intervention the district created. Table 8 shows the percentage of students who in fact passed the CAHSEE or one section of the CAHSEE in grade 10 who would have been included in the intervention program.
These counts are useful because by choosing a cutpoint carefully, one could include the majority of students who actually failed the exit examination, while excluding most of the students who passed without any additional assistance. For instance, suppose that administrators wanted to design an intervention program to prepare students at risk of failing the math section of the CAHSEE. Based on the San Diego data generating the numbers in Exhibit 4, if administrators had assigned to the intervention program students with a predicted probability of passing the mathematics section below 0.5, they would have identified 889 students. They would have included 57.6 percent of the students who indeed failed the math section later in grade 10 and 6.7 percent of students who passed the math section in grade 10.

http://www.ppic.org/main/home.asp Instruction Manual for the CAHSEE Early Warning Model 13
To the extent that a district’s distribution of CAHSEE test scores does not shift radically from year to year, these retrospective analyses should predict quite well what would happen if such a cutpoint were used to target assistance to students who had just completed grade 6. In our companion report, we find that forecasts using data from the class of 2006 in San Diego predicted CAHSEE outcomes very well for the next three cohorts of students (the classes of 2007 through 2009).
Below the tabulated results in the Results and Graphs worksheet appear a number of figures. The top three figures show the percentage of students who passed either the CAHSEE overall, the mathematics section, or the ELA section, plotted against the predicted probability that they would pass. These graphs are crucial, because if the CAHSEE Early Warning Model works well for data in the given district, we should see that a very small percentage of students in the bottom groups—those with a “< 0.10” or “0.10–0.19” probability of passing—actually pass in grade 10. Conversely, a large majority of the students in the top groups, such as “0.9 or higher,” should have passed the tests in grade 10. If so, then the CAHSEE Early Warning Model may provide good forecasts for students in the given district who have not yet reached grade 10.
Exhibits 5 through 7 show what these figures look like for the SDUSD sample used to generate the Early Warning Model. The models perform well. (If the model had no predictive power, then the height of the bars should not systematically increase as one moves from left to right in the figures, from the groups with low predicted probability of passing to the groups with high predicted probability.
EXHIBIT 5 Figure 1 from the Results and Graphs worksheet, showing as an example the results from San Diego on the overall passage of the CAHSEE

http://www.ppic.org/main/home.asp Instruction Manual for the CAHSEE Early Warning Model 14
EXHIBIT 6 Figure 2 from the Results and Graphs worksheet, showing as an example the results from San Diego on the passage of the Math section of the CAHSEE
EXHIBIT 7 Figure 3 from the Results and Graphs worksheet, showing as an example the results from San Diego on the passage of the ELA section of the CAHSEE
All three of these figures show sharply increasing passage rates as one moves from the “low probability” groups at the left of the figures to the “high probability” groups toward the right of the figures.
The final figure in the spreadsheet—Exhibit 8 provides an example, using data from San Diego—shows the percentage distribution of students across the ten “predicted probability of passing” groups for overall

http://www.ppic.org/main/home.asp Instruction Manual for the CAHSEE Early Warning Model 15
passage, passage of the mathematics section, and passage of the ELA section of the CAHSEE. Notably, in this example very few students are in the groups with the lowest predicted probability of passage. This suggests that interventions could be cost-effectively targeted at the students in the gravest danger of failing the CAHSEE.
Of course, these patterns will vary from district to district, based on the average academic preparation of grade 6 students.
EXHIBIT 8 Figure 4 from the Results and Graphs worksheet, showing for San Diego the distribution of students by predicted probability of passing the CAHSEE
In addition to the Results and Graphs worksheet, a second worksheet showing results—named “Predict”—shows the predicted probability of passing the CAHSEE (overall and by section) for each student. This worksheet takes on much greater importance when forecasting results for students yet to reach grade 10. We now discuss the forecasting spreadsheet, which is appropriate for students who have not yet taken the CAHSEE.
3. The Grade 6 Forecasting Spreadsheet
Using the grade 6 forecasting spreadsheet is similar to the using the grade 6 validation spreadsheet described above. There is one important difference from the validation spreadsheet—one does not enter data on whether the students actually passed the CAHSEE in grade 10. This is because the forecasting spreadsheet is intended for students who have yet to take the CAHSEE for the first time.
The Results and Graphs worksheet for the forecasting spreadsheet is much simpler than the one for the grade 6 validation spreadsheet. It provides tables on the number and percentage of students by their predicted probability of passing. These tables correspond to Tables 1 and 2 from the validation spreadsheet shown in Exhibit 2 above. A third table in the Results and Graphs worksheet corresponds to Table 6 in the validation worksheet, shown in Exhibit 4. It shows the number of students who would be included in an

http://www.ppic.org/main/home.asp Instruction Manual for the CAHSEE Early Warning Model 16
intervention if various cutpoints were used to identify students in need of assistance. A fourth table shows the percentage of all students who would be placed in an intervention for various cutpoints. The sole figure shows the percentage distribution of students by their predicted probability group. It is identical to the figure shown in Exhibit 8 above.
The Predict worksheet assumes great importance in the forecasting spreadsheet because it shows for each student the predicted probability of passing each section of the CAHSEE, as well as passing the CAHSEE overall. These results can be used to identify students who are likely to require additional assistance if they are to pass the exit examination on their first attempt in grade 10.
Exhibit 9 shows the predicted probabilities of passing the CAHSEE overall or each section for the two fictitious students we entered in the Data Entry worksheet in Exhibit 1.
EXHIBIT 9 Predicted probabilities of passing the CAHSEE in grade 10 from the Predict worksheet
Student 168890 has predicted probabilities of 0.179, 0.261, and 0.314, respectively, of passing the overall CAHSEE and the math and ELA portions of the exam. Note that all later rows have “N/A” entries for the probabilities. The worksheet sets probabilities to Not Available for any line in the Data Entry worksheet where there is a blank for any of the variables used to predict outcomes.
4. Inputting Data from Grade 8 into the Validation Spreadsheet and Interpreting the Results
Using the grade 8 validation spreadsheet is almost identical to the process described above in Section 2 for the using the grade 6 validation spreadsheet. The only differences reflect the fact that, by the end of grade 8, students will have taken one of a variety of mathematics CST tests pitched to the mathematics course they have taken in grade 8. Although a wide variety of CST mathematics tests can in theory be taken by a grade 8 student, there were only three tests that were undertaken by a large number of the students in our SDUSD sample: General Mathematics, Algebra I, and Geometry. (In our estimation sample, these tests accounted for roughly 32%, 61%, and 3% of the students, respectively.) District officials will likely be able to draw their own conclusions about the academic achievement of the small minority of students who may be taking courses above Geometry in grade 8.
Users of this spreadsheet enter the mathematics CST scaled score just as in the grade 6 validation spreadsheet. But additionally, they must indicate in a new column a code of 8, 9, or 10 to indicate whether the mathematics test taken was General Mathematics, Algebra I, or Geometry, respectively.
Interpretation of the results in the Results and Graphs worksheet is identical to that described in Section 3 for the grade 6 validation spreadsheet.

http://www.ppic.org/main/home.asp Instruction Manual for the CAHSEE Early Warning Model 17
5. The Grade 8 Forecasting Spreadsheet
The Data Entry worksheet in this spreadsheet is identical to that described above in Section 4, except that there are no columns to input information on whether the student passed the CAHSEE overall or by section. This makes sense because this forecasting spreadsheet is designed for students who have yet to take the CAHSEE.
As with the grade 6 forecasting spreadsheet, the Predict worksheet is of crucial importance, because it allows districts to identify specific students who are likely to require considerable assistance if they are to pass the CAHSEE in grade 10.

http://www.ppic.org/main/home.asp Instruction Manual for the CAHSEE Early Warning Model 18
District Feedback: Questions and Suggestions
We are eager to hear from school district administrators about their experiences with the Early Warning Model and their suggestions for improving it if we should we be able to update it in the future. We would be particularly interested in seeing the the numerical results in the Results and Graphs worksheet, to see how well the Early Warning Model works in other districts in California. Of course, never send the actual spreadsheets to anybody by email, because the Data Entry worksheets may contain identifying student information. However, screenshots of the Results and Graphs section do not pose any confidentiality risks if sent by email.
We make no guarantees that the CAHSEE Early Warning Model will predict CAHSEE results well in all districts. In particular, if a given district assigns students to special education or EL status, or calculates grades, in ways quite different from the practices in SDUSD, the model’s accuracy may decline. In such a case, it would make sense for a district to estimate, or have estimated for it, its own tailormade statistical model.
Suggestions and questions can be sent to Julian Betts at [email protected].

http://www.ppic.org/main/home.asp Instruction Manual for the CAHSEE Early Warning Model 19
Appendix
Using data we have gathered from SDUSD, we estimated models that predicted performance in 2007 in grade 10 on the CAHSEE for students who were in grade 10 for the first time in 2006–2007.
We estimated probit models where the dependent variable was the probability of passing the CAHSEE overall, the math section, or the ELA section, all measured in grade 10. In our past work we have reported Ordinary Least Squares (OLS) estimates because the coefficients are easier to interpret, but we have found that probit models and OLS models produce similar results. The probit model has the advantage of restricting the predicted probability of passing the CAHSEE to lie between 0 and 1.
We estimated two sets of models, one using information gathered when the students were in grade 8, and another using information gathered when the students were in grade 6.
If the matrix X is an nXk matrix of explanatory variables, and 𝛽 is the corresponding vector of coefficients, the probability of passing the CAHSEE for student i is set to Φ(𝑋𝑖�̂�) where �̂� refers to the estimated coefficients.
We took care to estimate models that were simple and precisely estimated, to avoid overfitting. As a result, the grade 6 and 8 models looked slightly different. For the grade 6 models, a robust finding was that the interaction between the Z-scores in math and ELA was a positive predictor of passing. We did not find a robust and precisely estimated interaction like this at the grade 8 level, perhaps because in the grade 8 models we had three different mathematics test scores, reflecting whether the student took the General Mathematics, Algebra I, or Geometry CST tests. In addition, in the grade 8 model we add dummy variables for whether the student took the General Mathematics or Geometry tests, with Algebra I being the omitted category.
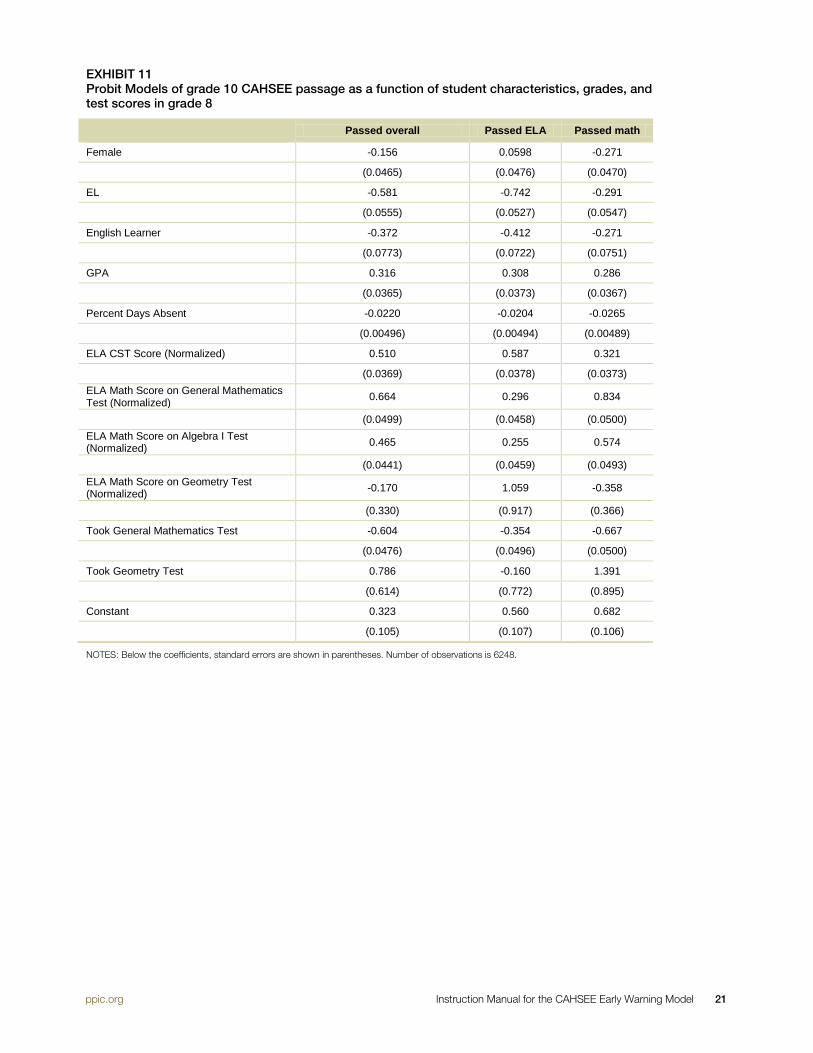
Exhibits 10 and 11 show the estimated models at the grade 6 and grade 8 levels, respectively.

http://www.ppic.org/main/home.asp Instruction Manual for the CAHSEE Early Warning Model 20
EXHIBIT 10 Probit Models of grade 10 CAHSEE passage as a function of student characteristics, grades, and test scores in grade 6
Passed overall Passed ELA Passed math
Female -0.139 0.0605 -0.273
(0.0504) (0.0525) (0.0518)
EL -0.460 -0.569 -0.332
(0.0608) (0.0600) (0.0610)
Special Education -0.334 -0.359 -0.297
(0.0723) (0.0711) (0.0718)
GPA 0.474 0.419 0.519
(0.0397) (0.0411) (0.0407)
Percent Days Absent -0.0115 -0.0105 -0.0131
(0.00600) (0.00608) (0.00595)
Math CST Score (Normalized) 0.505 0.214 0.605
(0.0415) (0.0410) (0.0436)
ELA CST Score (Normalized) 0.347 0.463 0.194
(0.0407) (0.0425) (0.0416)
ELA*Math Scores 0.109 0.0859 0.0960
(0.00946) (0.00946) (0.00959)
Constant -0.431 -0.0485 -0.299
(0.118) (0.121) (0.120)
NOTES: Below the coefficients, standard errors are shown in parentheses. Number of observations is 4664.
http://www.ppic.org/main/home.asp Instruction Manual for the CAHSEE Early Warning Model 21
EXHIBIT 11 Probit Models of grade 10 CAHSEE passage as a function of student characteristics, grades, and test scores in grade 8
Passed overall Passed ELA Passed math
Female -0.156 0.0598 -0.271
(0.0465) (0.0476) (0.0470)
EL -0.581 -0.742 -0.291
(0.0555) (0.0527) (0.0547)
English Learner -0.372 -0.412 -0.271
(0.0773) (0.0722) (0.0751)
GPA 0.316 0.308 0.286
(0.0365) (0.0373) (0.0367)
Percent Days Absent -0.0220 -0.0204 -0.0265
(0.00496) (0.00494) (0.00489)
ELA CST Score (Normalized) 0.510 0.587 0.321
(0.0369) (0.0378) (0.0373) ELA Math Score on General Mathematics Test (Normalized) 0.664 0.296 0.834
(0.0499) (0.0458) (0.0500) ELA Math Score on Algebra I Test (Normalized) 0.465 0.255 0.574
(0.0441) (0.0459) (0.0493) ELA Math Score on Geometry Test (Normalized) -0.170 1.059 -0.358
(0.330) (0.917) (0.366)
Took General Mathematics Test -0.604 -0.354 -0.667
(0.0476) (0.0496) (0.0500)
Took Geometry Test 0.786 -0.160 1.391
(0.614) (0.772) (0.895)
Constant 0.323 0.560 0.682
(0.105) (0.107) (0.106)
NOTES: Below the coefficients, standard errors are shown in parentheses. Number of observations is 6248.

The Public Policy Institute of California is dedicated to informing and improving public policy in California through independent, objective, nonpartisan research on major economic, social, and political issues. The institute’s goal is to raise public awareness and to give elected representatives and other decisionmakers a more informed basis for developing policies and programs.
The institute’s research focuses on the underlying forces shaping California’s future, cutting across a wide range of public policy concerns, including economic development, education, environment and resources, governance, population, public finance, and social and health policy.
PPIC is a private operating foundation. It does not take or support positions on any ballot measures or on any local, state, or federal legislation, nor does it endorse, support, or oppose any political parties or candidates for public office. PPIC was established in 1994 with an endowment from William R. Hewlett.
Mark Baldassare is President and Chief Executive Officer of PPIC. Gary K. Hart is Chair of the Board of Directors.
Short sections of text, not to exceed three paragraphs, may be quoted without written permission provided that full attribution is given to the source.
Research publications reflect the views of the authors and do not necessarily reflect the views of the staff, officers, or Board of Directors of the Public Policy Institute of California.
Copyright © 2012 Public Policy Institute of California All rights reserved. San Francisco, CA
PUBLIC POLICY INSTITUTE OF CALIFORNIA 500 Washington Street, Suite 600 San Francisco, California 94111 phone: 415.291.4400 fax: 415.291.4401 www.ppic.org
PPIC SACRAMENTO CENTER Senator Office Building 1121 L Street, Suite 801 Sacramento, California 95814 phone: 916.440.1120 fax: 916.440.1121