institutional perspectives on real estate investing: the role of risk and uncertainty
DESCRIPTION
Institutional Perspectives on Real Estate Investing: the Role of Risk and Uncertainty. Ravi Dhar William N. Goetzmann Yale School of Management. Problem. Why is the allocation to Real Estate so low? (1) It’s the right number (2) costs and trouble (3) conceptual issues. Approach. - PowerPoint PPT PresentationTRANSCRIPT

Institutional Perspectives on Real Estate Investing:
the Role of Risk and UncertaintyRavi Dhar
William N. Goetzmann
Yale School of Management

Problem
• Why is the allocation to Real Estate so low?
• (1) It’s the right number
• (2) costs and trouble
• (3) conceptual issues

Approach
• Collect current institutional investor views about real estate as an asset class.
• Goal: to understand determinant factors of institutional allocation to real estate.
• We survey a large sample of major institutional investors via a web questionnaire.

Findings
• Long-term estimates of risk and return are the driving factors
• A strong trend towards increasing their real estate allocation.
• Trend more pronounced for managers who felt relatively comfortable in relying on historical statistics about real estate returns.
• Conjectures about the role of uncertainty.

Data Collection
• Focus groups and interviews
• Greenwich Associates questionnaire
• E-mail administered.
• 202 responses, 173completed/1,500 mailed
• Focus on CIOs

Sample Size, Composition and Assets Under Management
Resps Comp. Assets $MM
Endow/Found 65 60 94,184
Corp Pension 83 68 274,556
Public Pension 52 43 1,114,916
Union 2 2 1,310
Total 202 173 1,484,966
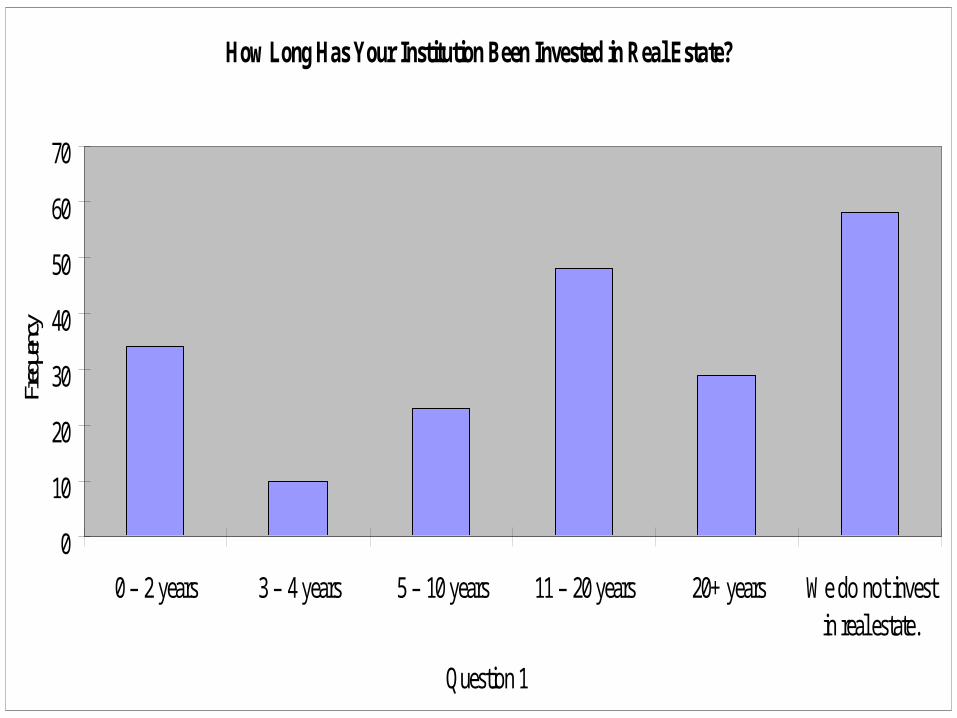
How Long Has Your Institution Been Invested in Real Estate?
0
10
20
30
40
50
60
70
0 – 2 years 3 – 4 years 5 – 10 years 11 – 20 years 20+ years We do not investin real estate.
Question 1
Freq
uenc
y

Cross-Tabulation: Years Invested
0 to 2 3 to 4 5 to 10 11 to 20 20+ No
Endow/Foun 0.328 0.069 0.207 0.172 0.052 0.172
Corp Pension 0.121 0.045 0.106 0.182 0.136 0.409
Public Pension 0.088 0.059 0.059 0.441 0.176 0.176

Table 3: Cross-Tabulation of Plans to Increase Allocation vs. Type of Institution
Note: rows sum to 100%
Increase Decrease Stay the Same Uncertain
Endow/Found 0.552 0.000 0.276 0.172
Corporate Pension 0.288 0.045 0.470 0.197
Public Pension 0.294 0.029 0.500 0.176

Assets (%) in Real Estate
0
10
20
30
40
50
60
None 1-3% 3-5% 5-7% 7-10% 10-12% 12-16% 16-20% 20-30%
Question 3
Freq
uenc
y

Target Allocation (%) to Real Estate
0
10
20
30
40
50
60
70
None 1-3% 3-5% 5-7% 7-10% 10-12% 12-16% 16-20% 20-30%
Question 4
Freq
uenc
y

Increase/Decrease to Real Estate Allocation over next 2-3 Years
0
10
20
30
40
50
60
70
80
Increase Decrease Stay the Same Uncertain Prefer not to answer
Question 5
Freq
uenc
y
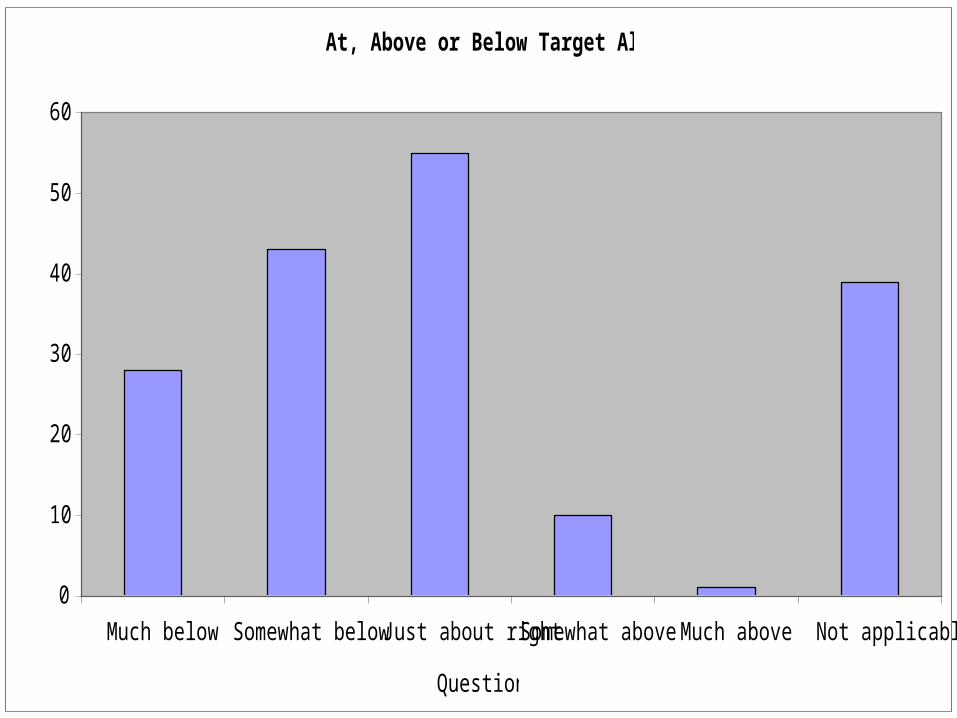
At, Above or Below Target Allocation?
0
10
20
30
40
50
60
Much below Somewhat below Just about right Somewhat above Much above Not applicable
Question 7
Freq
uenc
y
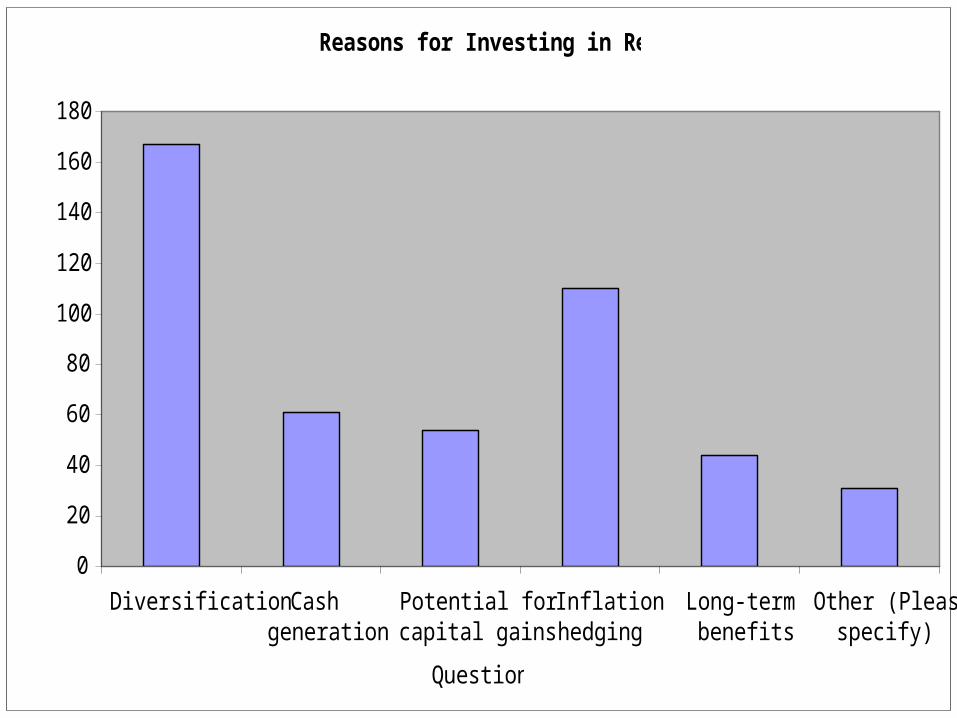
Reasons for Investing in Real Estate
0
20
40
60
80
100
120
140
160
180
Diversification Cashgeneration
Potential forcapital gains
Inflationhedging
Long-termbenefits
Other (Pleasespecify)
Question 8
No.
Res
pons
es

Top Risk Factors in Real Estate
0
20
40
60
80
100
120
140
Asset volatility Liquidity risk Risk of a crash Lack ofreliable
valuation data
Moral hazard/operational
risk
Macro-economic
uncertainty
Legal andregulatory risk
Risk of poorprofessional
advice
Hard todetermine the
bestopportunities
Risk ofmaking a poor
investment
Other (Pleasespecify)
Question 11
No. R
espo
nses

Views on Real Estate Expected Return Equity Fixed Hedge PE EM
ER of RE significantly less 6.4% 1.7% 4.0% 30.1% 24.3%
ER of RE Little less 42.2% 4.6% 16.8% 31.8% 34.1%
ER of RE same 22.5% 5.8% 24.3% 7.5% 6.9%
ER of RE little more 15.0% 55.5% 13.3% 1.7% 4.6%
ER of RE significantly more 1.7% 20.2% 2.3% 0.6% 0.6%
Don't know 12.1% 12.1% 39.3% 28.3% 29.5%

Relative Risk
Equity Fixed Hedge PE EM
ER of RE significantly less 11.6% 2.3% 9.8% 42.8% 41.0%
ER of RE Little less 49.1% 11.0% 30.6% 30.6% 31.2%
ER of RE same 21.4% 14.5% 18.5% 5.8% 5.2%
ER of RE little more 11.0% 54.3% 13.3% 1.2% 1.2%
ER of RE significantly more 0.6% 11.0% 3.5% 2.3% 1.7%
Don't know 6.4% 6.9% 24.3% 17.3% 19.7%

Relative Cost
Equity Fixed Hedge PE EM
ER of RE significantly less 4.6% 6.4% 15.0% 21.4% 4.6%
ER of RE Little less 7.5% 4.6% 20.8% 23.7% 15.6%
ER of RE same 12.7% 5.8% 15.0% 18.5% 22.0%
ER of RE little more 38.7% 23.1% 4.6% 0.0% 19.7%
ER of RE significantly more 17.3% 41.0% 0.0% 1.7% 2.9%
Don't know 19.1% 19.1% 44.5% 34.7% 35.3%

Uncertainty and Decision-Making
• Frank Knight’s 1921 study Risk, Uncertainty and Profit
• Uncertainty: you don’t know the distribution• Risk: you don’t know the Std.• Bewley (1986)
– investors were prone to inertia– the tendency to remain with the status quo choice. – might even explain the gross under—diversification
observed among individual investors.

Institution vs. Individual
• Hirshleifer and Welch (2002) model the organization as distinct from the manager.
• As the institutional memory for why a decision was originally made fades
• Remaining managers have a bias towards the status quo in a steady economic environment.
• In a volatile environment they might exhibit impulsiveness.

Does Uncertainty Affect Choice?
• Factors to look for:– Extrapolation Comfort– Efficiency of Market Price

Extrapolation Comfort
Least com 2 3 4 Most com Don’t know
RE 9.8% 15.0% 30.1% 30.6% 4.0% 10.4%
EQ 10.4% 15.0% 26.0% 29.5% 14.5% 4.6%
FEQ 11.6% 26.6% 27.2% 24.3% 4.0% 6.4%
EM 22.5% 35.3% 19.7% 11.6% 0.0% 11.0%
Debt 8.1% 11.0% 27.7% 31.2% 16.8% 5.2%
HY 13.9% 20.2% 33.5% 21.4% 1.2% 9.8%
Com 27.2% 21.4% 15.6% 7.5% 0.0% 28.3%
HF 34.7% 21.4% 15.0% 4.0% 0.0% 24.9%
VC 26.0% 27.2% 21.4% 4.6% 0.0% 20.8%

A strong relationship between confidence of extrapolation and target allocation!
Allocation
Least com 2 3 4
Most com
Don’t know
0-1 18.4% 18.4% 20.4% 14.3% 0.0% 28.6%
1-5 8.0% 20.0% 40.0% 24.0% 2.0% 6.0%
5-9 5.9% 5.9% 29.4% 52.9% 2.9% 2.9%
>9 5.0% 12.5% 30.0% 40.0% 12.5% 0.0%

A strong relationship between length of time
invested in RE, however it is non-linear.
YearsLeast.c
om 2 3 4Most.co
mDon’t know
0-2 18.2% 9.1% 29.1% 20.0% 0.0% 23.6%
3-4 5.7% 24.5% 34.0% 26.4% 3.8% 5.7%
5-10 3.7% 14.8% 25.9% 44.4% 7.4% 3.7%
11-20 9.7% 9.7% 25.8% 45.2% 6.5% 3.2%
20+ 0.0% 14.3% 42.9% 28.6% 14.3% 0.0%
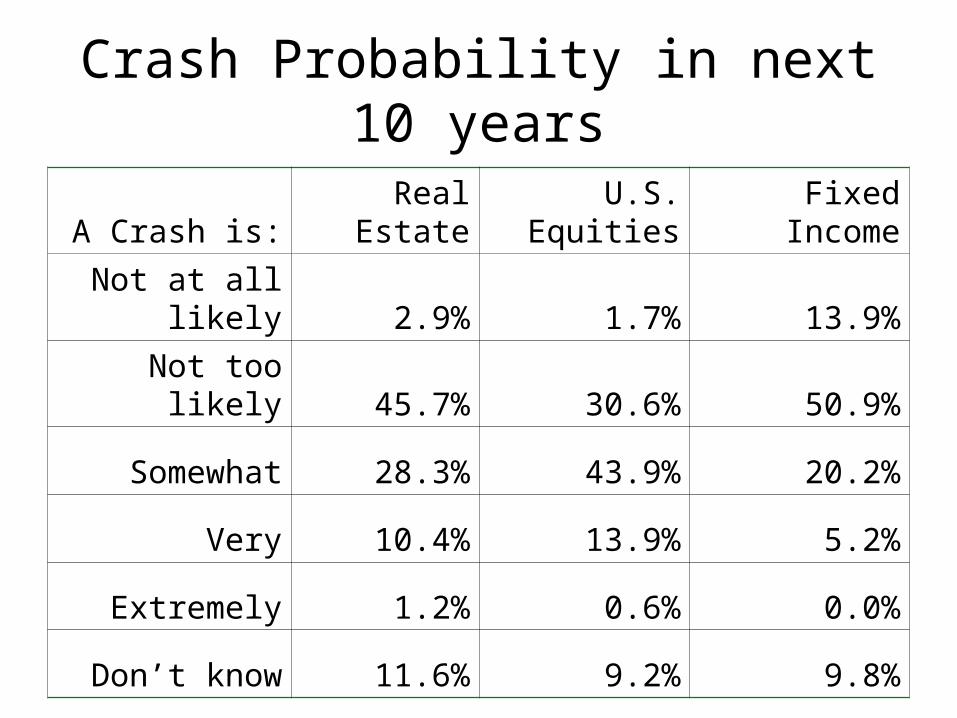
Crash Probability in next 10 years
A Crash is: Real Estate U.S. Equities Fixed Income
Not at all likely 2.9% 1.7% 13.9%
Not too likely 45.7% 30.6% 50.9%
Somewhat 28.3% 43.9% 20.2%
Very 10.4% 13.9% 5.2%
Extremely 1.2% 0.6% 0.0%
Don’t know 11.6% 9.2% 9.8%

Relative Efficiency
Real estate is: EQ FEQ EM Debt HY Com
Substantially less Efficient 22.5% 11.0% 4.6% 28.3% 5.8% 11.6%
Somewhat less 30.6% 34.7% 18.5% 33.5% 31.2% 20.8%
About as 17.9% 16.8% 16.2% 21.4% 30.1% 14.5%
Somewhat more 15.0% 20.2% 29.5% 2.9% 13.9% 15.6%
Substantially more Efficient 4.0% 4.6% 13.9% 2.9% 2.3% 3.5%
Don’t know 9.8% 12.7% 17.3% 11.0% 16.8% 34.1%
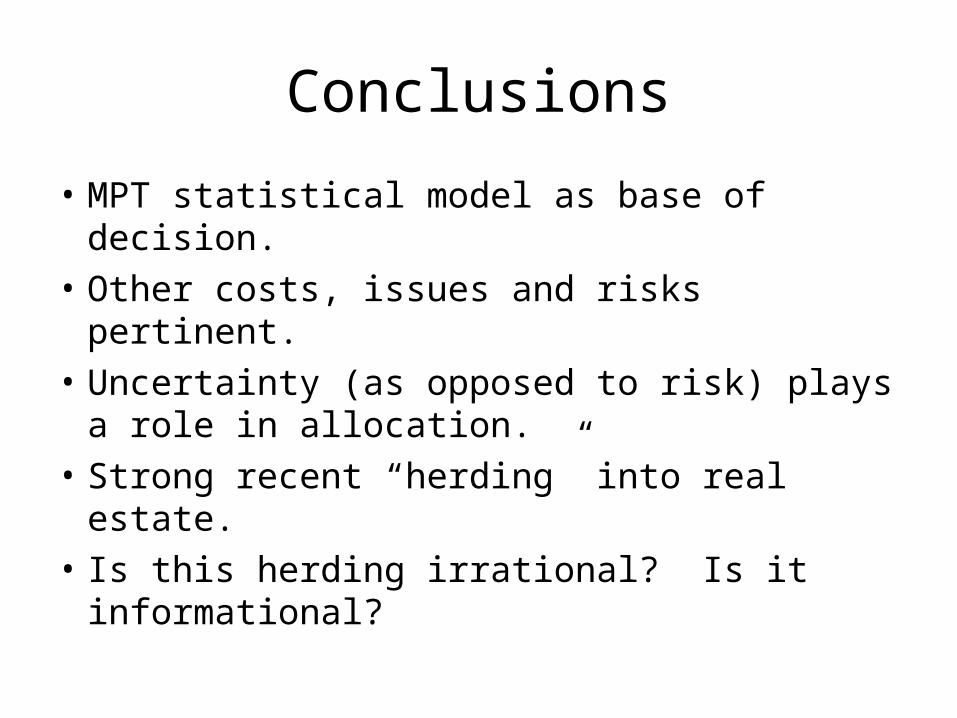
Conclusions
• MPT statistical model as base of decision.
• Other costs, issues and risks pertinent.
• Uncertainty (as opposed to risk) plays a role in allocation.
• Strong recent “herding” into real estate.
• Is this herding irrational? Is it informational?