institutional equities leyland- initiating... · institutional equities 2 ashok leyland...
TRANSCRIPT

Institutional Equities
Reuters: ASOK.NS; Bloomberg: AL IN
Ashok Leyland
Initi
atin
g C
over
age
Likely To Fire On All Cylinders In FY19/FY20 We initiate coverage on Ashok Leyland (ALL) with a Buy rating as we believe the company has multiple levers in its favour which will drive growth over FY19-FY20. The growth momentum witnessed by domestic commercial vehicle (CV) industry in recent months is poised to continue in FY19/FY20, buoyed by policy changes at the macro level and shifting demand preference at the buyer level. Three significant demand drivers are likely to propel strong volume growth for the industry i.e. overloading ban on trucks, pre-purchases on account of migration to BS-VI emission norms and CV scrappage policy implementation. In terms of demand, there has been a strong shift towards higher tonnage vehicles in the past few years and we believe ALL is a key beneficiary, given its growing share in the heavy tonnage segment. ALL’s double-digit EBITDA margin, while comparable to those of its peers, is likely to witness an expansion on the back of improved product mix and operating leverage benefits. ALL is a pure play on revival of the medium and heavy commercial vehicle (MHCV) cycle which is in the early stage of unfolding on the back of multiple growth drivers and we, accordingly, forecast a 14% CAGR over FY17-FY20E. We expect ALL to register FY17-FY20E revenue/EBITDA/PAT CAGR of 20%/22%/15%, and have assigned Buy rating to it with a target price of Rs167 (valuing the stock at 11.5x FY20E EBITDA+Rs7 for the holding in Hinduja Leyland Finance).
Commercial vehicle industry structurally well positioned for growth: We believe the demand drivers are in place for domestic CV industry to clock double-digit growth in the next two years and that ALL will be key beneficiary of the upcycle in CV demand. Recent ban on overloading of trucks in states like Madhya Pradesh, Rajasthan and Uttar Pradesh has resulted in strong volume growth in the past few months, which is likely to continue in the near term. Further, pre-purchases due of the shift to BS-VI emission norms in FY20 and the vehicle scrappage scheme should support volume growth in FY19/FY20.
Overloading ban on trucks drove volume growth for higher tonnage vehicles in recent months: Improved road conditions clubbed with government policies enforcing a ban on truck overloading in key states has driven the recent strong volume growth in MHCVs, which has led to increased demand for higher tonnage vehicles. Higher tonnage vehicles have witnessed an improvement in overall share of the MHCV segment by 560bps since FY15. We note that ALL has a high mix of higher tonnage vehicles in its mix, and has been a key beneficiary, given its growing share in the heavy tonnage segment. In YTDFY18, ALL posted 14% YoY growth in domestic MHCV sales compared to 12% growth each in industry and Tata Motors’ volume. We forecast a volume CAGR of 14% over FY17-FY20E.
Non-core business to gain traction: ALL has been focusing on non-cyclical high-margin segments to reduce its exposure from cyclical truck business to LCVs, defence, spare parts and exports and is targeting to reduce its truck business revenues to ~50% of total revenues over the next five years from ~75% currently. The after-market business, post Goods and Services Tax (GST) implementation, has been clocking monthly sales of more than Rs1bn, contributing 5%-6% to revenues, which are expected to top 10% in the medium term. Apart from this, the company has also been winning orders from defence and exports.
Valuation: ALL, armed with a strong product portfolio, rising realisation and robust financials is a formidable contender to its peers as it aspires to capture a larger pie of industry demand. We have assigned Buy rating to ALL with a target price of Rs167 (valuing the stock at 11.5x FY20E EBITDA+Rs7 for the holding in Hinduja Leyland Finance).
BUY
Sector: Automobiles
CMP: Rs142
Target Price: Rs167
Upside: 18%
Gaurant Dadwal Research Analyst [email protected] +91-22-6273 8145 Vivek Sarin Research Associate [email protected] +91 22 6273 8176
Key Data
Current Shares O/S (mn) 2,927.1
Mkt Cap (Rsbn/US$bn) 432/8.2
52 Wk H / L (Rs) 415.8/7.8
Daily Vol. (3M NSE Avg.) 15,982,830
Share holding (%) 1QFY18 2QFY18 3QFY18
Promoter 51.3 51.3 51.3
Public 48.7 48.7 48.7
Others - - -
One -Year Indexed Stock Performance
80
90
100
110
120
130
140
150
160
170
180
Mar-17 May-17 Jul-17 Sep-17 Nov-17 Jan-18 Mar-18
ASHOK LEYLAND Nifty 50
Price Performance (%)
1 M 6 M 1 Yr
Ashok Leyland 5.7 24.3 63.2
Nifty Index (4.6) 0.4 10.1
Source: Bloomberg
Y/E March (Rsmn) FY16 FY17 FY18 FY19E FY20E
Net sales 189,373 200,187 257,293 293,769 346,347
EBITDA 22,546 22,025 26,771 32,516 40,208
Net profit 3,896 12,231 14,867 18,890 24,029
EPS (Rs) 4.2 5.5 5.2 6.6 8.4
EPS growth (%) 415.1 30.6 (5.5) 27.1 27.2
EBITDA margin (%) 11.9 11.0 10.4 11.1 11.6
P/E (x) 33.5 25.7 27.2 21.4 16.8
P/BV (x) 7.5 6.6 5.8 5.0 4.3
EV/EBITDA (x) 18.2 18.8 15.5 12.7 10.2
RoE (%) 22.8 27.3 22.8 25.2 27.6
RoCE (%) 17.3 21.2 19.3 22.6 25.1
Source: Company, Nirmal Bang Institutional Equities Research
23 March 2018

Institutional Equities
Ashok Leyland 2
Valuation/stock price performance
ALL’s stock has outperformed broader indices over the past few months on the back of strong volume and earnings growth and build-up of positive macro-sentiment. The stock has been a strong performer with 70% returns over the past one year because of improved demand. We believe the CV industry’s tilt towards higher tonnage vehicles will place ALL in a sweet spot as it will reap benefits from the large share it holds in this segment. The stock currently trades at 10.2x FY20E EBITDA, comparable to its peers. We believe the company will continue to report strong 22%/15% EBITDA/earnings CAGR over FY17-FY20E.respectively, led by 14% volume CAGR and 60bps margin expansion. We have assigned Buy rating to ALL with a target price of Rs167, up 18% from the current market price Our target price is based on 11.5x FY20E EBITDA + Rs7 for the holding in Hinduja Leyland Finance.
Exhibit 1: P/E band
12
14
16
18
20
22
24
26
28
30
Mar
-14
Jun-
14
Sep
-14
Dec
-14
Mar
-15
Jun-
15
Sep
-15
Dec
-15
Mar
-16
Jun-
16
Sep
-16
Dec
-16
Mar
-17
Jun-
17
Sep
-17
Dec
-17
Mar
-18
(x)
PE Mean 1sd -1sd
Source: Bloomberg, Nirmal Bang Institutional Equities Research
Exhibit 2: EV/EBITDA
5
7
9
11
13
15
Mar
-14
Jun-
14
Sep
-14
Dec
-14
Mar
-15
Jun-
15
Sep
-15
Dec
-15
Mar
-16
Jun-
16
Sep
-16
Dec
-16
Mar
-17
Jun-
17
Sep
-17
Dec
-17
Mar
-18
(x)
EV/EBITDA Mean 1sd -1sd
Source: Bloomberg, Nirmal Bang Institutional Equities Research
Exhibit 3: Top 5 institutional shareholders of ALL
Name Holding (%)
JP Morgan Chase 5.1
Amas Bank Switzerland 4.9
Life Insurance Corporation of India 3.6
Government Pension Fund 2.4
Norges Bank 2.4
Source: Bloomberg

Institutional Equities
Ashok Leyland 3
Multiple growth drivers likely over FY19/FY20
We believe ALL has multiple levers in its favour which will drive growth over FY17-FY20. The growth momentum experienced by the domestic commercial vehicle industry in recent months is poised to continue over FY19/FY20, buoyed by policy changes at the macro level and shifting demand preference at the buyer level. Three significant demand drivers are likely to propel strong volume growth for industry i.e. truck overloading ban, pre-purchases on account of shift to BS-VI emission norms, and old vehicle scrappage policy implementation. In terms of demand, we have seen a strong shift in higher tonnage vehicles in the past few years and we believe the demand for higher tonnage CVs will continue to remain strong.
Exhibit 4: Ashok Leyland’s growth drivers
AL growth drivers over FY19/FY20
Over-loading ban
Demand shift towards higher
tonnage vehicles
Focus on exports,/spares
& engines/defence
Scrappage policy
implementation
BS-VI norms migration
Source: Nirmal Bang Institutional Equities Research
Exhibit 5: Volume assumptions
FY14 FY15 FY16 FY17 FY18E FY19E FY20E
MHCV 60,304 77,660 1,09,760 1,13,292 1,29,516 1,42,120 1,62,096
LCV 28,205 26,890 30,598 31,774 42,639 48,089 54,867
Total sales 88,509 1,04,550 1,40,358 1,45,066 1,72,155 1,90,208 2,16,963
Exports (from above) 9,399 12,546 13,037 11,802 17,227 19,748 22,670
YoY (%)
MHCV (24.4) 28.8 41.3 3.2 14.3 9.7 14.1
LCV (19.2) (4.7) 13.8 3.8 34.2 12.8 14.1
Total (22.8) 18.1 34.2 3.4 18.7 10.5 14.1
Exports 4.4 33.5 3.9 (9.5) 46.0 14.6 14.8
Source: Company, Nirmal Bang Institutional Equities Research
Exhibit 6: ALL volumes expected to remain strong over FY19/FY20 Exhibit 7: MHCV segment’s industry volume growth
60 78
110 113 130 142
162 28
27
31 32
43 48
55
-
50
100
150
200
250
FY14 FY15 FY16 FY17 FY18E FY19E FY20E
('000 units)
MHCV LCV
(40)
(30)
(20)
(10)
0
10
20
30
40
50
-
50,000
100,000
150,000
200,000
250,000
300,000
350,000
400,000
450,000
FY
07
FY
08
FY
09
FY
10
FY
11
FY
12
FY
13
FY
14
FY
15
FY
16
FY
17
FY
18E
FY
19E
FY
20E
(%)(units)
MHCV-domestic volume YoY growth (RHS)
Source: Company, Nirmal Bang Institutional Equities Research Source: SIAM, Nirmal Bang Institutional Equities Research

Institutional Equities
Ashok Leyland 4
Investment Rationale
Ban on overloading trucks resulted in strong volume momentum in recent months
Improving road conditions clubbed with government policies enforcing a ban on overloading of trucks in key states like Rajasthan, Uttar Pradesh and Madhya Pradesh has driven the recent strong volume growth in MHCVs, which led to an increase in demand for higher tonnage vehicles. Higher tonnage vehicles have witnessed an improvement in overall share of the MHCV segment since the past few years and since FY15, the share of higher tonnage vehicles has increased by 560bps. ALL is a key beneficiary, given its growing share in the heavy tonnage segment, thereby benefitting from the same. In YTDFY18, ALL posted 14% YoY growth in domestic MHCV sales compared to 12% growth each in industry and Tata Motors’s volumes. We forecast a volume CAGR of 14% over FY17-FY20E.
Exhibit 8: MHCV segment’s industry sales volume Exhibit 9: MHCV segment’s industry sales volume growth
0
5,000
10,000
15,000
20,000
25,000
30,000
35,000
40,000
45,000
Ap
r-1
5
Jun
-15
Au
g-1
5
Oct
-15
De
c-1
5
Fe
b-1
6
Ap
r-1
6
Jun
-16
Au
g-1
6
Oct
-16
De
c-1
6
Fe
b-1
7
Ap
r-1
7
Jun
-17
Au
g-1
7
Oct
-17
De
c-1
7
Fe
b-1
8
(units)
22 21
2
(8) (11)(21)
17
(13) (12)
1 5 6
(55)
(33)
(7)
7
28 26
1
63 73
19 23
(80)
(60)
(40)
(20)
0
20
40
60
80
Ap
r-1
6
Ma
y-1
6
Jun
-16
Jul-1
6
Au
g-1
6
Se
p-1
6
Oct
-16
No
v-1
6
De
c-1
6
Jan
-17
Fe
b-1
7
Ma
r-1
7
Ap
r-1
7
Ma
y-1
7
Jun
-17
Jul-1
7
Au
g-1
7
Se
p-1
7
Oct
-17
No
v-1
7
De
c-1
7
Jan
-18
Fe
b-1
8
(%)
Source: SIAM, Nirmal Bang Institutional Equities Research Source: SIAM, Nirmal Bang Institutional Equities Research
Exhibit 10: MHCV segment’s mix shift towards higher tonnage Exhibit 11: ALL’s tonnage mix
0%
25%
50%
75%
100%
FY14 FY15 FY16 FY17 YTDFY18
7.5-12T 12-16T 16-25T (Rigid) 25-40T (Rigid)
26.4-35.2T (Haulage) 35.2-40.2T (Haulage) 40.2-49T (Haulage) >49T (Haulage)
0%
10%
20%
30%
40%
50%
60%
70%
80%
90%
100%
FY14 FY15 FY16 FY17 FY18E FY19E FY20E
7.5-10tn 10-12tn 12-16tn Rigid vehicles Haulage tractors Source: SIAM, Nirmal Bang Institutional Equities Research Source: Company, Nirmal Bang Institutional Equities Research
Expect strong pre-purchases because of migration to BS-VI emission norms
The government will be enforcing BS-VI norms by April 2020 and we believe the impetus to push for cleaner fuel technologies will hasten replacement of older and lesser efficient trucks/buses and serve as tailwinds in driving volume growth for players like ALL.
From 1 April 2020, new fuel emission policy guidelines require all commercial vehicles to be compliant with BS-VI norms which may cause a price revision of ~10%, resulting in pre-purchasing activity in 2HFY19. In mandating compliance with BS-VI norms to mitigate pollution, the government has fast-tracked the schedule of migration by four years and skipped BS-V norm deadline entirely. We see the advancement of this deadline as a key positive for CV demand that will give a spurt to industry volume growth on account of pre-purchases. The demand generated coupled with ALL’s low-cost iEGR technology should enable the company to position its vehicles competitively in the face of higher discounts being offered by other players in higher tonnage segments.

Institutional Equities
Ashok Leyland 5
We note that CV industry is very price sensitive and it has been seen by the pre buying effect each time a revised norm comes into effect. For instance, anti-lock braking system (ABS) was made mandatory from October 2015 onwards, which resulted in some pre-purchases. Cabin ventilation was made mandatory after 31 December 2017 and there were some pre-purchases because of that too. ABS for a truck costs anywhere between Rs60,000-Rs80,000, while cabin ventilation costs Rs15,000- Rs20,000. We expect strong pre-purchasing in 2HFY20 due to emission norm implementation
Exhibit 12: MHCV segment’s sales volume Exhibit 13: Bharat Stage norms timeline
0
5,000
10,000
15,000
20,000
25,000
30,000
35,000
40,000
45,000
Ap
r-1
5
Jun
-15
Au
g-1
5
Oct
-15
De
c-1
5
Fe
b-1
6
Ap
r-1
6
Jun
-16
Au
g-1
6
Oct
-16
De
c-1
6
Fe
b-1
7
Ap
r-1
7
Jun
-17
Au
g-1
7
Oct
-17
De
c-1
7
Fe
b-1
8
(units)
Standard Year Region
India 2000 2000 Nationwide
Bharat Stage II 2001 NCR, Mumbai, Kolkata, Chennai
2003.04 NCR, 13 cities
2005.04 Nationwide
Bharat Stage III 2005.04 NCR, 13 cities
2010.04 Nationwide
Bharat Stage IV 2010.04 NCR, 13 cities
2017.04 Nationwide
Bharat Stage V (to be skipped)
Bharat Stage VI 2020.04 (proposed) Nationwide
Source: Company, Nirmal Bang Institutional Equities Research Source: Government data
CV scrappage policy
As per media reports, the CV scrappage policy has received in-principle approval from the Prime Minister’s Office and the same is now said to be in the final stage with approval pending from the GST Council. According to the revised guidelines, vehicles older than 20 years will fall under its ambit when the scheme is put into effect from 1 April 2020. This will coincide with the implementation of BS-VI vehicle emission norms. Though the fine print of the scrappage policy is not yet out, media reports suggest that the incentives offered for scrappage will be in the form of lower GST rate and additional discount from OEMs. Considering the long time span until April 2020, there could be further changes in draft policy guidelines. We believe there could be close to 150,000 CVs more than 20 years old that could come up for replacement. However, the exact number of vehicles coming up for replacement will depend on the benefits that are offered to customers in the final scrappage scheme.
Focus on LCV
ALL has also been increasingly targeting to capture a larger pie of LCV market and has announced Rs4bn investment towards creating a LCV platform for rolling out seven-eight new vehicles across all tonnage categories over the next 12 months. We expect the company’s total sales (domestic+export) from LCV segment to rise to ~55,000 units in FY20E from 31,774 units in FY17. LCV sales in YTDFY18 stood at ~38,000 units, a growth of 34% over YTDFY17. ALL currently derives just 3% of its LCV volumes via exports while other players like Tata Motors, Mahindra & Mahindra (M&M), and VE Commercial Vehicles derive 12%/8%/13% of LCV sales through exports, implying that ALL could play a more prominent role in overseas markets as it seeks to aggressively capture market share from rivals. We note that the company has laid out an export strategy whereby its exports will be targeted at African and Middle-East markets which are typically more profitable than those in Asia. Further, domestic LCV sales which have been lacklustre over the years are expected to witness an uptick with demand being driven by consumption-led industries, agriculture and allied activities.

Institutional Equities
Ashok Leyland 6
Exhibit 14: LCV volume performance trend
34,917
28,205 26,890 30,598 31,774
42,639
48,089
54,867
-
10,000
20,000
30,000
40,000
50,000
60,000
FY13 FY14 FY15 FY16 FY17 FY18E FY19E FY20E
(units)
Source: Company, Nirmal Bang Institutional Equities Research
Exhibit 15: LCV monthly volume
-
500
1,000
1,500
2,000
2,500
3,000
3,500
4,000
4,500
5,000
Ap
r-1
5M
ay-
15
Jun
-15
Jul-1
5A
ug
-15
Se
p-1
5O
ct-1
5N
ov-
15
De
c-1
5Ja
n-1
6F
eb
-16
Ma
r-1
6A
pr-
16
Ma
y-1
6Ju
n-1
6Ju
l-16
Au
g-1
6S
ep
-16
Oct
-16
No
v-1
6D
ec-
16
Jan
-17
Fe
b-1
7M
ar-
17
Ap
r-1
7M
ay-
17
Jun
-17
Jul-1
7A
ug
-17
Se
p-1
7O
ct-1
7N
ov-
17
De
c-1
7Ja
n-1
8F
eb
-18
(units)
Source: Company, Nirmal Bang Institutional Equities Research
Exhibit 16: LCV market share-domestic
0.2
1.7
6.66.3
6.7
7.4 7.58.1
FY11 FY12 FY13 FY14 FY15 FY16 FY17 YTDFY18
(%)
Source: SIAM, Nirmal Bang Institutional Equities Research
ALL’s LCV business, which comprises operations of its three subsidiaries, has turned PBT positive and is currently posting EBITDA margin in the range of 8%-9%. The management is confident of turning the LCV business to be at least as profitable as its MHCV business over the medium term.

Institutional Equities
Ashok Leyland 7
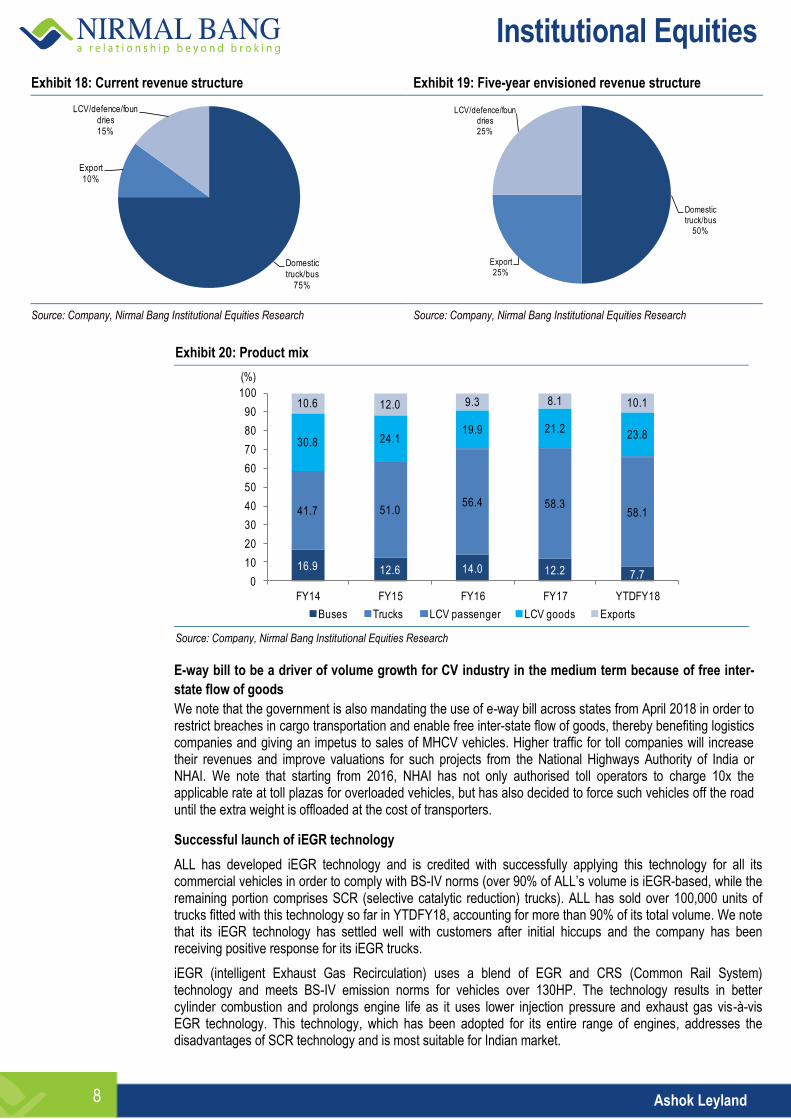
ALL is intentionally trying to reduce its exposure to cyclical domestic truck business revenues to 50% in five years (from ~75% currently), by increasing its share of revenues from LCVs and exports, spare parts and defence supplies. This will not only reduce dependence on domestic trucks, but also drive strong revenue growth. This strategy to reduce reliance on Indian truck business is likely to bear fruit in the medium term. We note that in the aftermath of GST rollout, demand for LCVs has grown owing to consolidation of warehouses which resulted in incremental demand for last-mile connectivity, along with rising demand from e-tailers and rural areas. In YTDFY18, LCV industry posted an impressive 25% YoY growth.
New order wins: High margin/non-core business to gain traction
ALL is looking to buttress its margins by focusing on non-cyclical segments such as defence and spares. We foresee a lot of headroom for the company’s non-cyclical spare part business to grow. ALL markets products under its two brands ‘Leyparts’ and ‘Valueparts’ and through various initiatives such as SPARK (Spare Parts Accelerated Reforms Kick-off), MITR (Mutual Improvement through Relationships), PRISM parts and DigiParts focusing on timely availability of genuine spare parts for its on-road trucks and buses.
Its SPARK programme seeks to boost revenues by streamlining back-end, distribution and front-end operations to ensure adequate market reach for its spare parts at competitive prices. MITR is a loyalty programme that targets mechanics and encourages them to use original spare parts for replacement/repair in a QR code-based redemption whereby customers can redeem cumulative points earned on every purchase they make from retailers, while its PRISM and DigiParts initiatives are designed to assist the dealers for all market-related activities and boost secondary retail sales.
The after-market business, estimated to be clocking monthly sales of more than Rs1bn, contributes 5%-6% to revenues and is expected to top 10% in the medium term.
Exhibit 17: Spare part revenues
12,126 13,917
12,734
16,729
20,912
26,140
32,675
11.4
9.6
6.4 7.9
7.7 8.5
9.1
0
2
4
6
8
10
12
14
-
5,000
10,000
15,000
20,000
25,000
30,000
35,000
FY14 FY15 FY16 FY17 FY18E FY19E FY20E
(%)(Rsmn)
Spare part revenues Spare parts % of total (RHS) Source: Company Nirmal Bang Institutional Equities Research
As regards its defence portfolio, ALL continues to reap the benefits from the government-led ‘Make in India’ campaign. The company has started providing various kinds of vehicles such as mine-protected vehicles or medium bullet-proof vehicles, multi-barrel rocket launchers, thereby positioning itself as a complete mobility solutions provider, which naturally enlarges the opportunity size for the company. In its post-result conference call, ALL stated that it has pre-qualified for 21 tenders under the defence vehicle programme. The management expects defence revenues to be between US$0.5bn – US$1.0bn over the medium term, depending on the timeline of execution.
As regards export business, ALL has lined up new product launches such as Boss, Falcon, Partner, etc, in the coming months and is also setting up assembly plants in Africa and Bangladesh to tap export demand, which will help it increase the share of exports in its basket to its targeted goal of 25% of total revenues from ~10% currently. We see the company’s sharpening focus on high‐margin businesses like spare parts, defence supplies and exports with an eye on de-risking its portfolio as a potent margin trigger.
Institutional Equities
Ashok Leyland 8
Exhibit 18: Current revenue structure Exhibit 19: Five-year envisioned revenue structure
Domestic truck/bus
75%
Export 10%
LCV/defence/foundries 15%
Domestic truck/bus
50%
Export 25%
LCV/defence/foundries 25%
Source: Company, Nirmal Bang Institutional Equities Research Source: Company, Nirmal Bang Institutional Equities Research
Exhibit 20: Product mix
16.9 12.6 14.0 12.2 7.7
41.7 51.056.4 58.3
58.1
30.8 24.119.9 21.2
23.8
10.6 12.0 9.3 8.1 10.1
0
10
20
30
40
50
60
70
80
90
100
FY14 FY15 FY16 FY17 YTDFY18
(%)
Buses Trucks LCV passenger LCV goods Exports
Source: Company, Nirmal Bang Institutional Equities Research E-way bill to be a driver of volume growth for CV industry in the medium term because of free inter-
state flow of goods
We note that the government is also mandating the use of e-way bill across states from April 2018 in order to restrict breaches in cargo transportation and enable free inter-state flow of goods, thereby benefiting logistics companies and giving an impetus to sales of MHCV vehicles. Higher traffic for toll companies will increase their revenues and improve valuations for such projects from the National Highways Authority of India or NHAI. We note that starting from 2016, NHAI has not only authorised toll operators to charge 10x the applicable rate at toll plazas for overloaded vehicles, but has also decided to force such vehicles off the road until the extra weight is offloaded at the cost of transporters.
Successful launch of iEGR technology
ALL has developed iEGR technology and is credited with successfully applying this technology for all its commercial vehicles in order to comply with BS-IV norms (over 90% of ALL’s volume is iEGR-based, while the remaining portion comprises SCR (selective catalytic reduction) trucks). ALL has sold over 100,000 units of trucks fitted with this technology so far in YTDFY18, accounting for more than 90% of its total volume. We note that its iEGR technology has settled well with customers after initial hiccups and the company has been receiving positive response for its iEGR trucks.
iEGR (intelligent Exhaust Gas Recirculation) uses a blend of EGR and CRS (Common Rail System) technology and meets BS-IV emission norms for vehicles over 130HP. The technology results in better cylinder combustion and prolongs engine life as it uses lower injection pressure and exhaust gas vis-à-vis EGR technology. This technology, which has been adopted for its entire range of engines, addresses the disadvantages of SCR technology and is most suitable for Indian market.

Institutional Equities
Ashok Leyland 9
Exhibit: 21 iEGR vs other technologies
Source: Company
Increasing MHCV market share
The CV industry in India is dominated by Tata Motors, ALL and M&M. ALL, a predominantly MHCV player, has seen its market share in the domestic MHCV space rising from 26% in FY14 to 34% in YTDFY18. While Tata Motors maintains leadership in this segment, it has lost share every year over the past three years - from 55% in FY14 to under 50% in YTDFY18. ALL’s cargo segment, which accounts for over 85% of its MHCV sales, has 34% market share in YTDFY18, up from 23% market share in FY14 and mainly led by growth in tractors, rigid vehicles and high tonnage trucks. ALL is now the second-largest MHCV player in India with a market share of 34%, compared to Tata Motor’s 50%. On the LCV front, its market share has risen continuously from below 1% in FY11 to over 8% in YTDFY18.
Exhibit 22: Industry MHCV market share Exhibit 23: ALL’s market share
59.5 59.3
53.4 54.9 54.451.9
49.2 49.8
25.723.3
26.4 25.828.7
32.7 33.8 34.0
9.4 10.713.0 12.2 10.8 10.4 11.4 11.3
0
10
20
30
40
50
60
70
FY11 FY12 FY13 FY14 FY15 FY16 FY17 YTDFY18
(%)
Tata Motors Ashok Leyland VE CVs - Eicher
15
20
25
30
35
40
45
50
55
FY11 FY12 FY13 FY14 FY15 FY16 FY17 YTDFY18
(%)
MHCV Goods Rigid vehicles (over 16tn) Haulage tractor (over 26tn)
Source: SIAM, Nirmal Bang Institutional Equities Research Source: SIAM, Nirmal Bang Institutional Equities Research

Institutional Equities
Ashok Leyland 10
Exhibit 24: Product-wise market share in CV segment (Figures in %) FY11 FY12 FY13 FY14 FY15 FY16 FY17 YTDFY18
MHCV-Passenger 42.8 41.6 40.5 38.6 36.1 44.6 37.5 38.1
MHCV- Goods 22.8 20.2 23.4 22.8 27.3 30.6 33.1 33.6
Rigid vehicles 26.6 22.7 25.5 23.4 28.6 30.2 30.5 26.0
Haulage tractor 31.9 23.8 26.1 30.6 35.9 40.2 45.6 52.2
MHCV-Domestic 25.7 23.3 26.4 25.8 28.7 32.7 33.8 34.0
LCV-Domestic 0.2 1.7 6.6 6.3 6.7 7.4 7.5 8.1
Source: SIAM, Nirmal Bang Institutional Equities Research
Exhibit 25: MHCV player-wise market share (Figures in %) FY11 FY12 FY13 FY14 FY15 FY16 FY17 YTDFY18
Tata Motors 59.5 59.3 53.4 54.9 54.4 51.9 49.2 49.8
Ashok Leyland 25.7 23.3 26.4 25.8 28.7 32.7 33.8 34.0
VE CVs - Eicher 9.4 10.7 13.0 12.2 10.8 10.4 11.4 11.3
Swaraj Mazda 2.4 2.4 2.9 2.7 2.6 2.0 2.4 1.4
Mahindra Navistar 0.4 1.1 1.4 1.6 1.9 2.3 2.7 3.1
Source: SIAM, Nirmal Bang Institutional Equities Research
Exhibit 26: MHCV- Domestic volume comparison
Feb-18 Feb-17 YoY (%) Jan-18 MoM (%) YTDFY18 YTDFY17 YoY (%)
Ashok Leyland 12,874 10,594 21.5 12,127 6.2 1,00,219 88,113 13.7
Tata Motors 18,944 15,031 26.0 16,012 18.3 1,46,757 1,31,253 11.8
VECV-Eicher 4,284 3,458 23.9 4,346 (1.4) 33,401 30,000 11.3
M&M 965 811 19.0 1,168 (17.4) 9,186 6,479 41.8
Others 485 625 (22.4) 517 (6.2) 4,900 7,207 (32.0)
Source: SIAM, Nirmal Bang Institutional Equities Research
ALL has recouped well from previous year’ systemic shocks
CV industry growth had tempered towards the end of FY17, growing at a tepid 4% on account of demonetisation and contracted further in 1QFY18 because of BS-IV/GST transition. Later, however, ALL outperformed industry growth, registering total volume growth of 23%/42% in 2QFY18/3QFY18, respectively, against industry growth of 20%/29%, respectively.
Recent government directives to give a leg-up to volume growth
Given the rise in allocation to infrastructure, road construction and rural development in the recent Union budget, MHCV demand should remain at an elevated level going forward. The government’s estimated budgetary and extra budgetary expenditure on infrastructure for FY19 has been increased to Rs5.97trn against an estimated expenditure of Rs4.94trn in FY18, while the emphasis on strengthening rural economy and doubling farm income by 2022 should support rural demand amid expectations of a normal monsoon over the next couple of years.
Total government expenditure on infrastructure in FY19 is slated to increase by 21%, as per budget estimates, a major portion of which will supply funds to the Bharatmala project. Anticipating an increase in demand, most CV manufacturers are beginning to align their production volume to match demand for higher tonnage CVs. ALL, at the 3QFY18 conference call, stated that it experienced a sudden spike in demand for its 37tn vehicle, but the same could not be met because of supply constraints.
Exhibit 27: Transport gets a spending boost followed by agriculture
Major expenditure heads (Rsbn) FY16A FY17A FY18BE FY18RE FY19E
Agriculture and allied activities 236.9 501.8 569.9 565.9 638.4
% YoY - 111.8 13.6 12.8 12.8
Transport 874.1 1,022.0 1,243.8 1,070.9 1,345.7
% YoY - 16.9 21.7 4.8 25.7
Source: Budget documents, Nirmal Bang Institutional Equities Research

Institutional Equities
Ashok Leyland 11
Improvement in macros remains a structural growth driver for CV industry over FY19/FY20
We believe the demand drivers are in place for domestic CV industry to clock double-digit growth in the next two years and that ALL will be key beneficiary of the upcycle. Growth in coal mining, construction and port container traffic will aid in supporting CV demand in FY19. India’s macro-level data points towards a well entrenched economic recovery in 2HFY18 (India Macro Meter - Economy Update), thereby directly benefiting truck sales which have historically closely followed economic growth.
Exhibit 28: Truck sales correlation with IIP growth
(50)
(40)
(30)
(20)
(10)
0
10
20
30
40
50
0
2
4
6
8
10
12
14
16
18
FY07 FY08 FY09 FY10 FY11 FY12 FY13 FY14 FY15 FY16 FY17
(%)(%)
IIP growth (YoY) MHCV Goods-Domestic (YoY, RHS)
(80)
(60)
(40)
(20)
0
20
40
60
80
(2)
0
2
4
6
8
10
Apr
-16
May
-16
Jun-
16
Jul-1
6
Aug
-16
Sep
-16
Oct
-16
Nov
-16
Dec
-16
Jan-
17
Feb
-17
Mar
-17
Apr
-17
May
-17
Jun-
17
Jul-1
7
Aug
-17
Sep
-17
Oct
-17
Nov
-17
Dec
-17
(%)(%)
IIP growth (YoY) MHCV Goods-Domestic (YoY, RHS) Source: Company, Nirmal Bang Institutional Equities Research Source: Company, Nirmal Bang Institutional Equities Research
The Economic Survey for 2017-18 points to an expected rise in fixed investments and notes that there has been a drop in the number of infrastructure projects that have been delayed and a concomitant fall in cost over-runs. Further, the pace of highway construction has continued its upward trajectory, indicating a broad-based increase in demand across sectors, which is expected to continue. In a recent conference call, ALL’s management indicated that volume growth in July-December 2017 period was driven by rise in demand from construction, road -building, FMCG and mining sectors.
Focus on electric vehicles
ALL remains focused on the electric vehicle (EV) space and expects EVs to constitute a large part of its product portfolio in the coming years. It has announced investment of Rs1bn in EV technology over the next three to five years, which we feel is well placed. We remain confident in the company’s ability to outperform competition, seeing the edge that it has maintained over most local players in terms of successfully developing and deploying indigenously developed technology.
In EV technology, its focus will remain on three areas of battery technology: swappable batteries, long-range vehicle batteries and fast-charging batteries for long-range buses. The company has entered into a strategic partnership with Sun Mobility to provide solutions for short-distance service vehicles, long-range vehicles, and long-range fast vehicles and develop e-buses with swap and charge battery technology. It has also announced an alliance with Phinergy of Israel and will be bidding for tenders to be floated by state transport undertakings (STUs) for electric buses and by private operators for battery-powered buses. We believe that regulatory changes and technological advancements have put ALL in a sweet spot to capitalise on the evolving market dynamics and leverage its pole position advantage in technology innovation.

Institutional Equities
Ashok Leyland 12
Strong 3QFY18 performance
ALL’s December 2017 quarter results were above consensus estimates and reflect the growth momentum in CV sales on the back of good monsoon and a return to normal economic activity post GST-transition. The quarter witnessed heavy discounts by competitors, which impinged ALL’s market share by 20bps, while reduced Pantnagar unit’s tax benefit impacted gross margin by ~50bps. Nonetheless, operating margin expanded 100bps, despite input cost pressure and higher marketing expenditure, because of operating leverage benefits and a better product mix. Contrary to the industry trend, ALL implemented price hike in the range of 1.0%-1.5% in January 2018, which should assist in improving margins going forward. The management, in a conference call, indicated that it has participated in defence tenders which should lead to revenue accretion in FY19/FY20. ALL also reiterated its focus on margins and indicated that it will not be a participant in the high discount category. It is noteworthy that despite not raising prices in the December 2017 quarter, it was able to absorb higher commodity costs and more than offset higher manufacturing and selling expenses, thereby retaining double-digit EBITDA margin.
ALL, during the quarter, benefitted from the green shoots of recovery witnessed in macro-economic activity which, we believe, will sustain its performance in the coming years. The uptick in volume growth is attributable to a combination of truck overloading ban, pre-purchases and incremental demand from sectors like mining, cement, infrastructure and FMCG. Pick-up of road-building activity in northern states clubbed with a ban on truck over-loading has given a push to CV sales and resulted in strong volume growth, while growing acceptance of its iEGR technology trucks bodes well for future sales, given the government tilt towards adoption of cleaner and more fuel-efficient automobiles.
Exhibit 29: ALL’s quarterly financials
Y/E March (Rsmn) 3QFY17 4QFY17 1QFY18 2QFY18 3QFY18 YoY (%) FY16 FY17 YoY (%)
Net revenues 45,163 66,179 42,378 60,469 71,132 57.5 1,89,373 2,00,187 5.7
Raw material costs 31,429 47,603 29,425 43,139 50,818 61.7 1,31,949 1,39,573 5.8
Staff costs 3,981 4,118 4,376 4,916 4,918 23.5 13,851 15,309 10.5
Other expenses 5,211 7,158 5,516 6,296 7,512 44.2 21,027 23,279 10.7
Total expenditure 40,622 58,880 39,317 54,351 63,247 55.7 1,66,827 1,78,161 6.8
EBITDA 4,541 7,299 3,061 6,118 7,884 73.6 22,546 22,025 (2.3)
EBITDAM (%) 10.1 11.0 7.2 10.1 11.1 103 11.9 11.0 (90)
Depreciation 1,313 1,395 1,321 1,411 1,350 2.8 4,879 5,179 6.1
Interest costs 453 423 366 410 335 (26.0) 2,476 1,554 (37.3)
Other income 258 404 384 557 380 47.3 1,176 1,363 15.9
PBT 2,395 6,114 1,730 4,827 6,576 174.6 16,418 16,809 2.4
Tax 778 (2,157) 492 1,484 2,079 167.2 4,369 1,070 (75.5)
Reported net profit 1,617 4,762 1,112 3,343 4,497 178.1 3,896 12,231 213.9
NPM (%) 3.6 7.2 2.6 5.5 6.3 274 2.1 6.1 405
EPS (Rs) 0.6 2.8 0.4 1.1 1.5 178.1 4.2 5.5 30.6
Metrics
MHCV domestic sales 22,344 35,770 16,817 26,964 31,437 40.7 98,809 1,02,313 3.5
LCV domestic sales 7,426 8,689 8,404 9,252 10,508 41.5 28,512 30,951 8.6
Export sales 3,070 3,162 3,277 4,751 4,707 53.3 13,037 11,802 (9.5)
Total volume 32,840 47,621 28,498 40,967 46,652 42.1 1,40,358 1,45,066 3.4
RM as % sales 69.6 71.9 69.4 71.3 71.4 185 69.7 69.7 4bps
EC as % sales 8.8 6.2 10.3 8.1 6.9 (190) 7.3 7.6 33bps
OE as % sales 11.5 10.8 13.0 10.4 10.6 (98) 11.1 11.6 53bps
Depreciation as % sales 2.9 2.1 3.1 2.3 1.9 (101) 2.6 2.6 1bps
Gross margin 30.4 28.1 30.6 28.7 28.6 (185) 30.3 30.3 (4bps)
EBITDA margin 10.1 11.0 7.2 10.1 11.1 103 11.9 11.0 (90bps)
Net margin 3.6 7.2 2.6 5.5 6.3 274 2.1 6.1 405bps
Tax rate (% of EBT) 32.5 (35.3) 28.5 30.7 31.6 (87) 26.6 6.4 (2,025bps)
Source: Company, Nirmal Bang Institutional Equities Research

Institutional Equities
Ashok Leyland 13
Exhibit 30: Quarterly volume run-rate Exhibit 31: Net sales
43,992
31,165 33,440 32,840
47,621
28,498
40,967
46,652
-
10,000
20,000
30,000
40,000
50,000
60,000
4QFY16 1QFY17 2QFY17 3QFY17 4QFY17 1QFY18 2QFY18 3QFY18
(units)
59,732
42,58846,224 45,163
66,179
42,378
60,469
71,132
0
10,000
20,000
30,000
40,000
50,000
60,000
70,000
80,000
4QFY16 1QFY17 2QFY17 3QFY17 4QFY17 1QFY18 2QFY18 3QFY18
(Rsmn)
Source: Company, Nirmal Bang Institutional Equities Research Source: Company, Nirmal Bang Institutional Equities Research
Exhibit 32: EBITDA margin Exhibit 33: Gross margin
13.1
11.3
11.6
10.1
11.0
7.2
10.1
11.1
5
6
7
8
9
10
11
12
13
14
4QFY16 1QFY17 2QFY17 3QFY17 4QFY17 1QFY18 2QFY18 3QFY18
(%)
29.6
31.3
32.2
30.4
28.1
30.6
28.7
28.6
25
26
27
28
29
30
31
32
33
4QFY16 1QFY17 2QFY17 3QFY17 4QFY17 1QFY18 2QFY18 3QFY18
(%)
Source: Company, Nirmal Bang Institutional Equities Research Source: Company, Nirmal Bang Institutional Equities Research
Exhibit 34: Category-wise sales Exhibit 35: Realisation trend
73.2 70.8 66.2 68.075.1
59.065.8 67.4
18.8 22.123.8 22.6
18.2
29.522.6 22.5
8.0 7.1 10.0 9.3 6.6 11.5 11.6 10.1
0
10
20
30
40
50
60
70
80
90
100
4QFY16 1QFY17 2QFY17 3QFY17 4QFY17 1QFY18 2QFY18 3QFY18
(%)
MHCV domestic sales LCV domestic sales Export sales
1,35
7,78
2
1,36
6,54
6
1,38
2,29
8
1,38
9,21
0
1,39
6,15
6
1,48
7,04
7
1,47
6,03
9
1,52
4,72
8
0
2
4
6
8
10
12
1,250,000
1,300,000
1,350,000
1,400,000
1,450,000
1,500,000
1,550,000
4QFY16 1QFY17 2QFY17 3QFY17 4QFY17 1QFY18 2QFY18 3QFY18
(%)(Rs/vehicle)
Realisation YoY growth (RHS)
Source: Company, Nirmal Bang Institutional Equities Research Source: Company, Nirmal Bang Institutional Equities Research
Earnings expected to post double-digit growth
We expect ALL to post strong earnings CAGR of 15% over FY17-FY20E driven by double-digit volume growth in both domestic and overseas markets, with domestic MHCV sales playing a dominant role in its product portfolio. Domestic growth will be driven by demand from government spending on infrastructure, increase in industrial, mining and agriculture activities as well as demand emanating from policy-level changes (emission norms, overloading, voluntary replacement etc) while export demand will be supported by new launches in the LCV segment. We note that the government’s budgetary allocation towards road-building, infrastructure and agriculture/allied activities has risen considerably and the same should result in demand remaining at an elevated level over FY19/FY20. We forecast MHCV sales to grow 10%/14% in FY19E/FY20E, respectively.

Institutional Equities
Ashok Leyland 14
The company’s EBITDA margin has recovered over FY16/FY17 because of economies of scale and a more favourable product mix. Further, interest costs - which have been on the decline - are expected to drop further as it repays debt, thereby expanding PAT margin and return ratios. We forecast rising cost pressure to restrict operating margin growth which is likely to remain stable at more than 11% over FY19E/FY20E, whereas reduced finance costs will drive PAT margin growth of ~120bps over the same period. Further, the company has been generating strong free cash flow over the past few years which is expected to remain strong over FY17-FY20E even after meeting capex requirement.
Exhibit 36: Annual sales trend Exhibit 37: Annual EBITDA trend
12
4,8
12
99
,43
4
13
5,6
22
18
9,3
73
20
0,1
87
25
7,2
93
29
3,7
69
34
6,3
47
(3.3)
(20.3)
36.4 39.6
5.7
28.5 14.2
17.9
(30)
(20)
(10)
0
10
20
30
40
50
-
50,000
100,000
150,000
200,000
250,000
300,000
350,000
400,000
FY13 FY14 FY15 FY16 FY17 FY18E FY19E FY20E
(%)(Rsmn)
Sales YoY growth (RHS)
8,765
1,666
10,267
22,546 22,025
26,771
32,516
40,208
(30.2)
(81.0)
516.4
119.6 (2.3) 21.5 21.5 23.7
(200)
(100)
0
100
200
300
400
500
600
-
5,000
10,000
15,000
20,000
25,000
30,000
35,000
40,000
45,000
FY13 FY14 FY15 FY16 FY17 FY18E FY19E FY20E
(%)(Rsmn)
Sales YoY growth (RHS) Source: Company, Nirmal Bang Institutional Equities Research Source: Company, Nirmal Bang Institutional Equities Research
Exhibit 38: EBITDA and gross margin trend Exhibit 39: Annual PAT trend
26.9
23.5
26.5
30.3 30.3 29.4 29.7 29.9
7.0
1.7
7.6
11.9 11.0 10.4 11.1 11.6
0
5
10
15
20
25
30
35
FY13 FY14 FY15 FY16 FY17 FY18E FY19E FY20E
(%)
Gross margin EBITDA margin
4,33
7
294 3,
348
3,89
6
12,2
31
14,8
67
18,8
90
24,0
29 (74.5)
(430.4)
(149.1)
415.1
30.6
(5.5)
27.1
27.2
(500)
(400)
(300)
(200)
(100)
0
100
200
300
400
500
-
5,000
10,000
15,000
20,000
25,000
30,000
FY13 FY14 FY15 FY16 FY17 FY18E FY19E FY20E
(%)(Rsmn)
PAT YoY growth (RHS) Source: Company, Nirmal Bang Institutional Equities Research Source: Company, Nirmal Bang Institutional Equities Research
Exhibit 40: Return ratios Exhibit 41: Capex trend
4.9
22.8
27.3
22.8 25.2
27.6
6.1
17.3
21.2
19.3
22.6
25.1
0
5
10
15
20
25
30
FY15 FY16 FY17 FY18E FY19E FY20E
(%)
RoE RoCE
1,702
3,783
6,000
8,000
9,000
-
1,000
2,000
3,000
4,000
5,000
6,000
7,000
8,000
9,000
10,000
FY16 FY17 FY18E FY19E FY20E
(Rsmn)
Source: Company, Nirmal Bang Institutional Equities Research Source: Company, Nirmal Bang Institutional Equities Research

Institutional Equities
Ashok Leyland 15
Exhibit 42: Leadership team profile
Personnel Designation Background
Mr. Dheeraj Hinduja
Chairman He is part of the promoter-owned Hinduja family. He is chairman of Ashok Leyland, Hinduja Leyland Finance, Hinduja Tech, Hinduja Foundries and co-chairman of Hinduja National Power.
Mr. Vinod Dasari CEO & MD
Hei is the chief executive officer (CEO) and managing director of Ashok Leyland. Prior to joining Ashok Leyland, he worked at Cummins India as president. At Ashok Leyland, he started his term as chief operating officer in 2005,after which he was appointed as director in 2008 and then in his current position as CEO in 2011. He has also served as president of ARAI (Automotive Research Association of India) and SIAM (Society of Indian Automobile Manufacturers).
Mr. Gopal Mahadevan
CFO
He is the president-finance and chief financial officer of Ashok Leyland. He joined the company in July 2013 and is a member of the board of several companies in the group. He has over 28 years of experience in the finance function across a spectrum of industries. Prior to joining Ashok Leyland, he worked with Thermax as Group CFO.
Dr. Seshu Bhagavathula
CTO
He is the chief technology officer (CTO) of Ashok Leyland since April 2016. As the CTO of the group, he guides Ashok Leyland’s truck, bus and LCV verticals along with other group verticals, sister companies and joint ventures. Prior to joining Ashok Leyland, he worked with Daimler AG where he was also the founding managing director of Mercedes-Benz Research and Development Centre in Bengaluru.
Mr. Anuj Kathuria President -
Global Trucks
He joined Ashok Leyland in 2010, where he serves as president of global trucks division. Among his roles in the company, he has headed the strategic sourcing department where he was responsible for the entire supply chain activities and also headed the operations department which comprised all manufacturing, strategic sourcing and supply chains. Prior to joining Ashok Leyland, he worked with Tata Motors as general manager of the company’s Prima factory.
Mr. N V Balachandar
President -HR, Communication
and CSR
He currently serves as president-HR, communication and CSR. He has held senior positions in organisations such as Aditya Birla group where he was chief people officer, India Today, Seagram India and the Taj Group of Hotels. He also held various portfolios in different industry bodies like SIAM, CII (Confederation of Indian Industry) and EFSI (Employers’ Federation of Southern India), Chennai.
Source: Company
Institutional Equities
Ashok Leyland 16
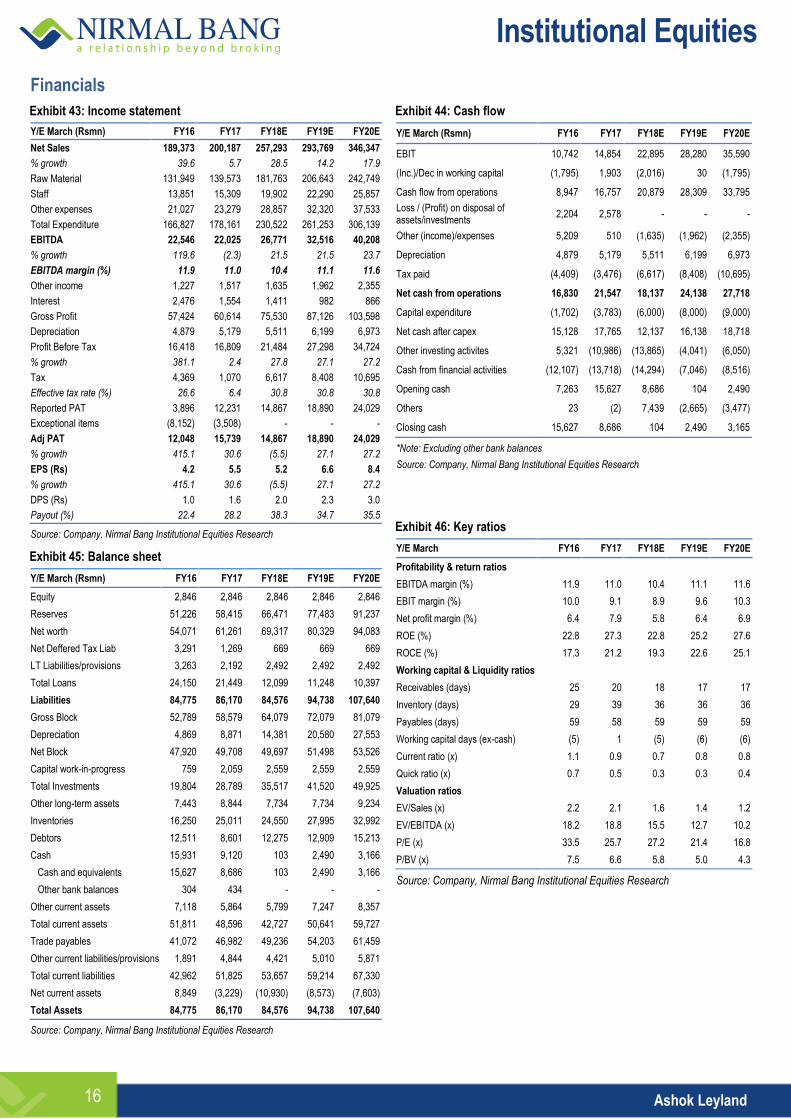
Financials
Exhibit 43: Income statement
Y/E March (Rsmn) FY16 FY17 FY18E FY19E FY20E
Net Sales 189,373 200,187 257,293 293,769 346,347
% growth 39.6 5.7 28.5 14.2 17.9
Raw Material 131,949 139,573 181,763 206,643 242,749
Staff 13,851 15,309 19,902 22,290 25,857
Other expenses 21,027 23,279 28,857 32,320 37,533
Total Expenditure 166,827 178,161 230,522 261,253 306,139
EBITDA 22,546 22,025 26,771 32,516 40,208
% growth 119.6 (2.3) 21.5 21.5 23.7
EBITDA margin (%) 11.9 11.0 10.4 11.1 11.6
Other income 1,227 1,517 1,635 1,962 2,355
Interest 2,476 1,554 1,411 982 866
Gross Profit 57,424 60,614 75,530 87,126 103,598
Depreciation 4,879 5,179 5,511 6,199 6,973
Profit Before Tax 16,418 16,809 21,484 27,298 34,724
% growth 381.1 2.4 27.8 27.1 27.2
Tax 4,369 1,070 6,617 8,408 10,695
Effective tax rate (%) 26.6 6.4 30.8 30.8 30.8
Reported PAT 3,896 12,231 14,867 18,890 24,029
Exceptional items (8,152) (3,508) - - -
Adj PAT 12,048 15,739 14,867 18,890 24,029
% growth 415.1 30.6 (5.5) 27.1 27.2
EPS (Rs) 4.2 5.5 5.2 6.6 8.4
% growth 415.1 30.6 (5.5) 27.1 27.2
DPS (Rs) 1.0 1.6 2.0 2.3 3.0
Payout (%) 22.4 28.2 38.3 34.7 35.5
Source: Company, Nirmal Bang Institutional Equities Research
Exhibit 45: Balance sheet
Y/E March (Rsmn) FY16 FY17 FY18E FY19E FY20E
Equity 2,846 2,846 2,846 2,846 2,846
Reserves 51,226 58,415 66,471 77,483 91,237
Net worth 54,071 61,261 69,317 80,329 94,083
Net Deffered Tax Liab 3,291 1,269 669 669 669
LT Liabilities/provisions 3,263 2,192 2,492 2,492 2,492
Total Loans 24,150 21,449 12,099 11,248 10,397
Liabilities 84,775 86,170 84,576 94,738 107,640
Gross Block 52,789 58,579 64,079 72,079 81,079
Depreciation 4,869 8,871 14,381 20,580 27,553
Net Block 47,920 49,708 49,697 51,498 53,526
Capital work-in-progress 759 2,059 2,559 2,559 2,559
Total Investments 19,804 28,789 35,517 41,520 49,925
Other long-term assets 7,443 8,844 7,734 7,734 9,234
Inventories 16,250 25,011 24,550 27,995 32,992
Debtors 12,511 8,601 12,275 12,909 15,213
Cash 15,931 9,120 103 2,490 3,166
Cash and equivalents 15,627 8,686 103 2,490 3,166
Other bank balances 304 434 - - -
Other current assets 7,118 5,864 5,799 7,247 8,357
Total current assets 51,811 48,596 42,727 50,641 59,727
Trade payables 41,072 46,982 49,236 54,203 61,459
Other current liabilities/provisions 1,891 4,844 4,421 5,010 5,871
Total current liabilities 42,962 51,825 53,657 59,214 67,330
Net current assets 8,849 (3,229) (10,930) (8,573) (7,603)
Total Assets 84,775 86,170 84,576 94,738 107,640
Source: Company, Nirmal Bang Institutional Equities Research
Exhibit 44: Cash flow
Y/E March (Rsmn) FY16 FY17 FY18E FY19E FY20E
EBIT 10,742 14,854 22,895 28,280 35,590
(Inc.)/Dec in working capital (1,795) 1,903 (2,016) 30 (1,795)
Cash flow from operations 8,947 16,757 20,879 28,309 33,795
Loss / (Profit) on disposal of assets/investments
2,204 2,578 - - -
Other (income)/expenses 5,209 510 (1,635) (1,962) (2,355)
Depreciation 4,879 5,179 5,511 6,199 6,973
Tax paid (4,409) (3,476) (6,617) (8,408) (10,695)
Net cash from operations 16,830 21,547 18,137 24,138 27,718
Capital expenditure (1,702) (3,783) (6,000) (8,000) (9,000)
Net cash after capex 15,128 17,765 12,137 16,138 18,718
Other investing activites 5,321 (10,986) (13,865) (4,041) (6,050)
Cash from financial activities (12,107) (13,718) (14,294) (7,046) (8,516)
Opening cash 7,263 15,627 8,686 104 2,490
Others 23 (2) 7,439 (2,665) (3,477)
Closing cash 15,627 8,686 104 2,490 3,165
*Note: Excluding other bank balances
Source: Company, Nirmal Bang Institutional Equities Research
Exhibit 46: Key ratios
Y/E March FY16 FY17 FY18E FY19E FY20E
Profitability & return ratios
EBITDA margin (%) 11.9 11.0 10.4 11.1 11.6
EBIT margin (%) 10.0 9.1 8.9 9.6 10.3
Net profit margin (%) 6.4 7.9 5.8 6.4 6.9
ROE (%) 22.8 27.3 22.8 25.2 27.6
ROCE (%) 17.3 21.2 19.3 22.6 25.1
Working capital & Liquidity ratios
Receivables (days) 25 20 18 17 17
Inventory (days) 29 39 36 36 36
Payables (days) 59 58 59 59 59
Working capital days (ex-cash) (5) 1 (5) (6) (6)
Current ratio (x) 1.1 0.9 0.7 0.8 0.8
Quick ratio (x) 0.7 0.5 0.3 0.3 0.4
Valuation ratios
EV/Sales (x) 2.2 2.1 1.6 1.4 1.2
EV/EBITDA (x) 18.2 18.8 15.5 12.7 10.2
P/E (x) 33.5 25.7 27.2 21.4 16.8
P/BV (x) 7.5 6.6 5.8 5.0 4.3
Source: Company, Nirmal Bang Institutional Equities Research

Institutional Equities
Ashok Leyland 17
DISCLOSURES
This Report is published by Nirmal Bang Equities Private Limited (hereinafter referred to as “NBEPL”) for private circulation. NBEPL is a registered Research Analyst under SEBI (Research Analyst) Regulations, 2014 having Registration no. INH000001436. NBEPL is also a registered Stock Broker with National Stock Exchange of India Limited and BSE Limited in cash and derivatives segments. NBEPL has other business divisions with independent research teams separated by Chinese walls, and therefore may, at times, have different or contrary views on stocks and markets. NBEPL or its associates have not been debarred / suspended by SEBI or any other regulatory authority for accessing / dealing in securities Market. NBEPL, its associates or analyst or his relatives do not hold any financial interest in the subject company. NBEPL or its associates or Analyst do not have any conflict or material conflict of interest at the time of publication of the research report with the subject company. NBEPL or its associates or Analyst or his relatives do not hold beneficial ownership of 1% or more in the subject company at the end of the month immediately preceding the date of publication of this research report. NBEPL or its associates / analyst has not received any compensation / managed or co-managed public offering of securities of the company covered by Analyst during the past twelve months. NBEPL or its associates have not received any compensation or other benefits from the company covered by Analyst or third party in connection with the research report. Analyst has not served as an officer, director or employee of Subject Company and NBEPL / analyst has not been engaged in market making activity of the subject company. Analyst Certification: I/We, Gaurant Dadwal, the research analysts and Vivek Sarin, the research associate are the author of this report, hereby certify that the views expressed in this research report accurately reflects my/our personal views about the subject securities, issuers, products, sectors or industries. It is also certified that no part of the compensation of the analyst(s) was, is, or will be directly or indirectly related to the inclusion of specific recommendations or views in this research. The analyst(s) principally responsible for the preparation of this research report and has taken reasonable care to achieve and maintain independence and objectivity in making any recommendations.

Institutional Equities
Ashok Leyland 18
Disclaimer
Stock Ratings Absolute Returns
BUY > 15%
ACCUMULATE -5% to15%
SELL < -5%
This report is for the personal information of the authorized recipient and does not construe to be any investment, legal or taxation advice to you. NBEPL is not soliciting any action based upon it. Nothing in this research shall be construed as a solicitation to buy or sell any security or product, or to engage in or refrain from engaging in any such transaction. In preparing this research, we did not take into account the investment objectives, financial situation and particular needs of the reader.
This research has been prepared for the general use of the clients of NBEPL and must not be copied, either in whole or in part, or distributed or redistributed to any other person in any form. If you are not the intended recipient you must not use or disclose the information in this research in any way. Though disseminated to all the customers simultaneously, not all customers may receive this report at the same time. NBEPL will not treat recipients as customers by virtue of their receiving this report. This report is not directed or intended for distribution to or use by any person or entity resident in a state, country or any jurisdiction, where such distribution, publication, availability or use would be contrary to law, regulation or which would subject NBEPL & its group companies to registration or licensing requirements within such jurisdictions.
The report is based on the information obtained from sources believed to be reliable, but we do not make any representation or warranty that it is accurate, complete or up-to-date and it should not be relied upon as such. We accept no obligation to correct or update the information or opinions in it. NBEPL or any of its affiliates or employees shall not be in any way responsible for any loss or damage that may arise to any person from any inadvertent error in the information contained in this report. NBEPL or any of its affiliates or employees do not provide, at any time, any express or implied warranty of any kind, regarding any matter pertaining to this report, including without limitation the implied warranties of merchantability, fitness for a particular purpose, and non-infringement. The recipients of this report should rely on their own investigations.
This information is subject to change without any prior notice. NBEPL reserves its absolute discretion and right to make or refrain from making modifications and alterations to this statement from time to time. Nevertheless, NBEPL is committed to providing independent and transparent recommendations to its clients, and would be happy to provide information in response to specific client queries.
Before making an investment decision on the basis of this research, the reader needs to consider, with or without the assistance of an adviser, whether the advice is appropriate in light of their particular investment needs, objectives and financial circumstances. There are risks involved in securities trading. The price of securities can and does fluctuate, and an individual security may even become valueless. International investors are reminded of the additional risks inherent in international investments, such as currency fluctuations and international stock market or economic conditions, which may adversely affect the value of the investment. Opinions expressed are subject to change without any notice. Neither the company nor the director or the employees of NBEPL accept any liability whatsoever for any direct, indirect, consequential or other loss arising from any use of this research and/or further communication in relation to this research. Here it may be noted that neither NBEPL, nor its directors, employees, agents or representatives shall be liable for any damages whether direct or indirect, incidental, special or consequential including lost revenue or lost profit that may arise from or in connection with the use of the information contained in this report.
Copyright of this document vests exclusively with NBEPL.
Our reports are also available on our website www.nirmalbang.com
Access all our reports on Bloomberg, Thomson Reuters and Factset.
Team Details:
Name Email Id Direct Line
Rahul Arora CEO [email protected] -
Girish Pai Head of Research [email protected] +91 22 6273 8017 / 18
Dealing
Ravi Jagtiani Dealing Desk [email protected] +91 22 6273 8230, +91 22 6636 8833
Pradeep Kasat Dealing Desk [email protected] +91 22 6273 8100/8101, +91 22 6636 8831
Michael Pillai Dealing Desk [email protected] +91 22 6273 8102/8103, +91 22 6636 8830
Nirmal Bang Equities Pvt. Ltd.
Correspondence Address
B-2, 301/302, Marathon Innova,
Nr. Peninsula Corporate Park,
Lower Parel (W), Mumbai-400013.
Board No. : 91 22 6273 8000/1; Fax. : 022 6273 8010