institutional distance in comparative perspective: chinese
TRANSCRIPT
1
Institutional distance in comparative perspective: Chinese and U.S. FDI to Africa
Paper presented at the 6th Copenhagen Conference on: 'Emerging Multinationals': Outward
Investment from Emerging Economies, Copenhagen, Denmark, 11-12 October 2018
Sanne van der Lugt, BIGSSS, Jacobs University, Campus ring 1, South Hall room 307, 28759 Bremen,
Germany; Tel. +49 172 893 0856; [email protected]. (Corresponding author)
Adalbert F.X. Wilhelm, Jacobs University, Campus ring 1, Research IV, room 111, 28759 Bremen,
Germany; Tel. +49 421 200 3303; [email protected]
Marco Sanfilippo, University of Bari (Italy) and University of Antwerp (Belgium), Room 121, Stadscampus
- Lange Sint-Annastraat 7, 2000, Antwerpen, Belgium; Tel. +32 32 655 936;
Acknowledgements:
We would like to thank Christoph Lattemann, Svetla Marinova, Guido Möllering, Jean-Francois Hennart,
Jorma Larimo, Andrei Panibratov, Teemu Santonen, Per Servais, Oded Shenkar, Romeo Turcan, Olav Jull
Sørensen, participants to the International Business Conference in Aalborg in 2016, participants to the 5th
International CA/AC conference in Brussels in 2018, and the Field C colloquia at BIGSSS for insightful
discussions and for their suggestions on earlier draft versions of the paper. We are indebted to BIGSSS
colleague Dr. Georgi Dragolov for his great support with data analysis. Sanne Van der Lugt thanks the
German Excellence Initiative and the Bremen International Graduate School for Social Science (BIGSSS)
for funding.

2
Institutional distance in comparative perspective: Chinese and U.S. FDI to Africa
ABSTRACT
This study tests the assumed competitive advantage for Chinese firms in relatively high risk host
countries. We use a conceptual framework presented by Child and Marinova to study the role of
institutional distance for the location choice of Chinese and U.S. firms. We run an analysis on the
determinants of FDI from Chinese and U.S. firms in a group of African destination countries for the
period 2003-2011. We find that contrary to popular believe, Chinese investments are not directed to
countries with a low level of institutional maturity and investments from both China and the U.S. are
directed to countries with a low level of political stability.

3
INTRODUCTION
The rapidly growing share in global investment flows from China since the Chinese government
implemented the Go Global Strategy in 2001 worries traditionally dominant investors from the West and
made scholars wonder whether the on Western studies based FDI theories need to be adapted.
In 2001, Chinese direct investment flows accounted for only 1.8 per cent of global foreign direct
investment (FDI) flows; this increased to 12.6 per cent in 2016 (UNCTAD Stats, 2018). Although China
surpassed major FDI source countries like Germany, Japan and the Netherlands in 2016, it is still
performing below its relatively size in terms of GDP and population size. In comparison, direct investment
flows from the United States (U.S.) accounted for more than twenty per cent of global FDI flows in 2016
(UNCTAD Stats, 2018). It can therefore be expected that China’s share of global FDI flow will keep
increasing over the coming years.
The rise of China as an important source of global investment is reflected in a rising number of academic
studies on the topic (e.g. Amighini, Rabellotti & Sanfilippo, 2011; Berning & Holtbrügge, 2012; Buckley,
Clegg, Cross, Liu, Voss & Zheng, 2007; Child & Rodrigues, 2005; Kolstad & Wiig, 2012; Meunier &
Bargoon, 2014; Morck, Yeung & Zhao, 2008; Ramasamy, Yeung & Laforet, 2012). The main debates
revolve around two issues: the determinants and motives for Chinese direct investment, and the
uniqueness of the characteristics of Chinese investment behavior. In short, Chinese investment is assumed
to be particularly attracted to countries with weak institutions (Kolstad & Wiig, 2012) and not deterred
from political risk (Buckley et al., 2007).
These assumed unique characteristics of Chinese outward investment are often translated into accusations
of exploitation and neocolonialism; especially with regards to Chinese investments in South-East Asia,
Latin America and Africa. These accusations occur in both news and academic reports in which China is
referred to as a hungry dragon (“A hungry dragon,” 2004; Cáceres & Ear, 2013; “China’s material needs,”

4
2004; Furniss, 2006; Lorenz & Thielke, 2007) exploiting countries with poor institutions and natural
resources (Kolstad & Wiig, 2012).
These assumptions are persistent: a week after the New York Times wrote down Chinese economic
activities in Africa as driven by the Chinese state, using Chinese workers, focusing on extracting resources
and flooding Africa with cheap imports (Larmer, 2017), McKinsey presented an interesting study that
refute these accusations (Sun, Jayaram & Kassiri, 2017). McKinsey found that around thirty per cent of
the about ten thousand Chinese firms in Africa are actually operating in the manufacturing sector, that 86
per cent of their employees are local — as are forty per cent of their managers — and that 85 per cent of
the firms are privately owned (Sun, Jayaram & Kassiri, 2017). Still, during his visit to the African
continent as U.S. Secretary of State in March 2018, Mr. Tillerson stated again that Chinese investment is
creating ‘few if any jobs in most countries’ (Koran, 2018, March 10).
The perseverance of the accusations towards Chinese economic activities in Africa is related to the
enormous success of China in what was long regarded to be Europe’s backyard by some and the strategic
position of the African region. In the past two decades, China has grown rapidly from being a relatively
small investor in the continent to becoming Africa’s largest economic partner. In 2009 China surpassed
the U.S. and became the largest trading partner of the African region and in 2016 China became the single
largest investor in terms of capital (Ernst & Young, 2017).1
Africa is a strategic region because of the abundance of “strategic minerals”, access to one of the most
strategic maritime passages, the large number of United Nation member states and the enormous market
potential. Access to these strategic minerals and maritime passage, and votes in the United Nations could
explain the interest of the Chinese government in the African continent. However, western governments
1 Furthermore, China was the first country in the world hosting a large delegation of Heads of States of 41 African
states during the Forum on China-Africa Cooperation Summit in Beijing in 2006 (Shelton & Paruk, 2008). This was
only matched by the U.S. in 2014 when President Obama hosted fifty leaders of African states during the U.S.-Africa
Leaders’ Summit (the Whitehouse, 2014).
5
have similar interests on the African continent. If it is not for their unique interests, why would Chinese
firms target African countries with “poor institutions”?
The main argument of this paper is that the assumed unique characteristics of Chinese outward investment
have not been sufficiently tested so far. Cuervo-Cazurra and Genc (2008) and Morck et al. (2008)
provided a theoretical explanation for the assumed attraction of Chinese firms to countries with weak
institutions. They argue that Chinese firms are more prevalent in least developed countries with difficult
institutional conditions, because their vast experience in navigating complex bureaucracies at home gives
them a competitive advantage over Western firms. Cuervo-Cazurra and Genc define difficult institutional
conditions as ‘the absence of a well-established infrastructure, well-developed market mechanisms, and a
well-developed contracting and intellectual property rights regime’ (2008: 960). Moreover Morck et al.
focus on ‘endemic government interference and related problems’ (2008: 346). However, neither Cuervo-
Cazurra and Genc (2008) and Morck et al. (2008) conducted a comparative analysis to confirm their
theory.
Taking stock of the above discussion, the aim of our study is to compare the role of institutional distance
for the location choice of Chinese and U.S. investors in Africa. Child and Marinova present a conceptual
framework – which they adapted from Rodrigues (2010) – that could be used to further study the role of
regulative institutional distance for the location choice of Chinese firms (2014: 354). In line with Cuervo-
Cazurra and Genc (2008) and Morck et al. (2008), Child and Marinova (2014) state that firms are most
successful in host countries with a similar level of political stability (PS) and institutional maturity (IM) as
in their home country. Cuervo-Cazurra and Genc (2008) and Morck et al. (2008) argue that Chinese firms
are more prevalent in least developed countries with difficult institutional conditions, because their vast
experience in navigating complex bureaucracies at home gives them a competitive advantage over
Western firms. Therefore, we link success with location choice based on the insights from Cuervo-Cazurra
and Genc (2008) and Morck et al. (2008) and use Child & Marinova’s (2014) framework to empirically
test the role of institutional distance for the location choice of Chinese and U.S. investors in Africa. To do

6
this we ran an analysis on the determinants of FDI from Chinese and U.S. firms in a group of African
destination countries for the period 2003-2011.
The results provide interesting new insights on the role of institutional distance, and on the uniqueness of
Chinese FDI. We find that – contrary to popular belief – investments from both China and the U.S. are
significantly directed to countries with a low level of PS and both Chinese and U.S. investments are
directed to countries with a high level of IM (though this latter relation is only significant for investments
from the U.S.). These results seem to reject the hypothesis that Chinese investments in Africa are attracted
to high risk countries because of the relatively small regulative institutional distance that should give
Chinese firms a competitive advantage over their western counterparts in these countries. Results remain
robust to different empirical specifications, and their sensitivity is supported when comparing Chinese
FDI to Africa with those by other developed and emerging economies.
The paper proceeds as follows. First, we review the existing literature on the rise of Chinese outward FDI
and the assumptions regarding the uniqueness of Chinese outward investments. We then discuss the
theoretical framework, grounded in the work by Child and Marinova (2014) and its antecedents. Based on
this review, hypotheses are developed. After this we present the data, the model and the methodology for
the empirical analysis. Next, we present the results of the empirical analysis and discuss their implications.
We conclude by outlining the contributions of the present study to existing knowledge and drawing some
implications for future research.
LITERATURE REVIEW AND THEORETICAL FRAMEWORK
General FDI theory predicts that when the risk in a host country goes up, investment goes down. The
logical explanation is that risks involve costs and firms choose locations for their activities that minimize
the overall costs of their operations (Buckley & Casson 1976). More generally, poor governance is
associated with low levels of attraction for FDI, given that it often poses a threat to the protection of

7
property rights and contract enforcement (Dixit, 2012). However, literature seems to suggest that MNEs
from emerging markets (EMNEs) might be an exception to this rule. The literature on location choices by
EMNEs generally shows that these firms are relatively indifferent to the institutional conditions in host
countries and this has been so far considered to be a competitive advantage related to their domestic
experience in coping with poor governance (Cuervo-Cazurra & Genc, 2008; Dixit, 2012). China
represents a case in point.
Buckley et al. (2007) find in their much-quoted study that when the risk goes down in a host country,
Chinese investment goes down.2 Subsequently Buckley et al. provide a number of reasons for ‘why
Chinese firms may not behave in the conventional manner’ (2007:510). Their potential explanations are
presented in their results and discussion section but they were not empirically verified as such in the same
study.
It is interesting to note that these potential explanations have been quoted in later studies as findings (e.g.
Amighini et al. (2013); Buckley, Yu, Liu, Munjal & Tao (2016)). Referring to his own study that Buckley
published in 2007 with other co-authors, Buckley et al. (2016) write for example: ‘[…] research suggests
that EMNEs have experience of, and high tolerance towards political risk, which makes them different
from western MNEs, and therefore political risk may not negatively affect their location choice decision’
(2016: 432). However, so far there is no empirical proof for a higher tolerance towards political risk by
Chinese investors compared to other investors.
General FDI theory focuses merely on competitive advantages that enable foreign investment (Vernon,
1966; Hymer, 1976; Johanson & Vahne, 1977; Dunning, 1977; Horst, Caves & Baumann (in Dunning,
2000)), and host country factors that attract foreign investors (Dunning, 1977; Dunning, 2013). The
2 The other way around (Chinese investment going up when the risk goes up) would be more convincing; however,
this is the way Buckley et al. describe their finding.

8
Location factors in the famous OLI-framework for example refer to host country factors only (Dunning,
2013).
More recent empirical studies on Chinese direct investment put much more emphasis on the impact of
home country factors (Buckley et al., 2007; Kolstad & Wiig, 2012; Morck et al., 2008; Ramasamy et al.,
2012). For example, Morck et al. argue that Chinese firms’ expertise in managing complex markets at
home makes them more capable than their Western counterparts ‘of dealing with burdensome regulations
and navigating around the opaque political constraints’ in host countries (2008: 346).Buckley et al. argue
that ‘capital market imperfections and institutional factors in China may have induced a perverse attitude
to risk’ (2007: 510). Kolstad and Wiig state that ‘Chinese FDI outflows differ from FDI from other
regions, in their attraction to poorly governed countries rich in natural resources’ (2012: 33). However, at
the end of their paper Kolstad and Wiig admit that their ‘results show that the interacted term is significant
only for fuel exports’ (2012: 32) and that ‘it is possible that oil investment from China and from other
countries is driven by the same set of factors’ (2012: 33). Both Ramasamy et al. (2012) and Amighini et
al. (2013) argue that this apparent aversion towards risk is more likely to characterize the
internationalization pattern of SOEs, rather than private firms.
Child and Marinova (2014) emphasize the importance of looking at both home and host country factors
and aim to link them within a theoretical framework. Child and Marinova (2014) state that investors are
most successful in host countries with similar levels of political stability (PS) and institutional maturity
(IM) as in their home country. This is in line with the institutional distance argument that the costs of
doing business abroad (also referred to as ‘liability of foreignness’ (Zaheer, 1995)) depend on the extent of
similarity/dissimilarity between the home and the host country. The concept of liability of foreignness
suggests that the risks are relative and differ per investor; depending on how familiar the foreign investor
is with the situation in the host country.

9
To illustrate this, Child and Marinova (2014) present a matrix in which countries are grouped according to
their levels of PS and IM (see Figure 1). They categorize China as a category B country with a high level
of PS and a low level of IM.
FIGURE 1 GOES ABOUT HERE
Child and Marinova argue that Chinese investors are less successful in category A countries than in
category B countries and that Chinese firms are relatively more successful in category D countries (with
low levels of PS and IM) than their western counterparts because of a similarly low level of IM. Child and
Marinova (2014) do not make the link between success in a specific business environment and location
choice. However, following the line of argument from Cuervo-Cazurra and Genc (2008) and Morck et al.
(2008) – that Chinese firms are more prevalent in least developed countries with difficult institutional
conditions, because Chinese firms are more successful in such countries than their Western competitors –
this framework could be used to further study the causal relation between Chinese direct investment flows
and the levels of institutional maturity and political stability in the (potential) host countries.
Child and Marinova define political stability as a situation in which the governance system enjoys popular
legitimacy, in which changes in government are orderly, and in which the policies of different
governments exhibit substantial continuity (2014: 353). The two possible measurements Child and
Marinova (2014) propose for political stability are: the worldwide governance indicator ‘political stability
and absence of violence/terrorism’ from the World Bank’s Worldwide Governance Indicators and the
Economist Intelligence Unit’s ‘Political Instability Index’. Institutional maturity is defined by Child and
Marinova as ‘a situation in which a country’s institutions, such as its legal system and regulatory
authorities, function in a transparent manner, adhering to clear rules that are applied in a universalistic
manner to all citizens’(2014: 354). Child and Marinova (2014) suggest the World Bank’s annual country
ranking of ‘Ease of Doing Business’ for measuring the level of IM.
10
However, so far the mentioned relationships are mostly based on anecdotal evidence. The work by Quer et
al. (2012) is an exception. They use data on 35 Chinese firms listed in Fortune 500 and show empirically
that political risk is not detrimental to the location choice of the investment. Their sample is, however,
relatively small and biased towards bigger firms who might have exploited opportunities to buy cheaper
assets in more risky contexts. Chen, Dollar and Tang (2015) also conducted an interesting study on the
motives behind Chinese investments in Africa which seems to present evidence for the statement that
Chinese firms invest more in poor governance environments than Western firms. However, there are three
critical points to this research. Firstly, Chen et al. (2015) used two measures from the same database
(namely “rule of law” and “political stability and absence of violence/terrorism” from the worldwide
governance indicators (WGI) from the World Bank(2017a)). Since rule of law and political stability are
related concepts it is recommendable to use measures derived from different backgrounds in order to
avoid correlation effects. Secondly, for the first part of their study in which they look at the effect of poor
governance on the location choice for Chinese investments they use FDI stock instead of number of
investment projects. FDI stock is expected to be a less accurate measure of location choice for investment
since the results can be biased due to single very large investments especially in the mining sector.
Thirdly, Chen et al. (2015) did not conduct a comparative analysis, but only compared total FDI stock in
Africa with Chinese FDI stock in Africa. Since Western firms have been investing on the African
continent for a long time already for reasons that changed over the years, this comparison does not give an
accurate picture of how the current motives between Western and Chinese firms differ.
Our study aims to provide a more accurate comparison between Chinese and U.S. investments on the
African continent in order to get a better understanding of the role of regulative institutional distance for
the location choice of Chinese investments. This will provide a first empirical assessment of the
framework proposed by Child and Marinova (2014) – although we are aware that we do not measure the
success of the firms, but their location choice based on this success according to Cuervo-Cazurra and
Genc (2008) and Morck et al. (2008) – while bringing fresh comparative evidence on the different drivers
of location choice of foreign investors from countries with different institutional contexts.

11
Based on the institutional distance theory and Child and Marinova’s (2014) framework we hypothesize
that:
Hypothesis 1: Chinese FDI is directed to African countries with a low level of IM.
Hypothesis 2: Chinese FDI is directed to African countries with a high level of PS.
Hypothesis 3: U.S. FDI is directed to African countries with a high level of IM.
Hypothesis 4: U.S. FDI is directed to African countries with a high level of PS.
RESEARCH DESIGN
We test our hypotheses based on the number of U.S. and Chinese FDI projects per African country as
reported by respectively fDi Markets and MOFCOM. Due to limitations in the availability of data, we
look at all registered investment projects by respectively fDi Markets and MOFCOM for the period 2003-
2011. The selected period of time is representative for China’s rising outward investments to Africa that
rapidly increased since 2003 and for the fluctuations in U.S. investments to the African continent (see
Figure 2 for the developments of Chinese and U.S. total investments to the African continent from 2003 to
2012).The sample includes 35 of the 54 African countries due to the fact that ICRG has limited data on the
level of government stability for many African countries.
FIGURE 2 GOES ABOUT HERE
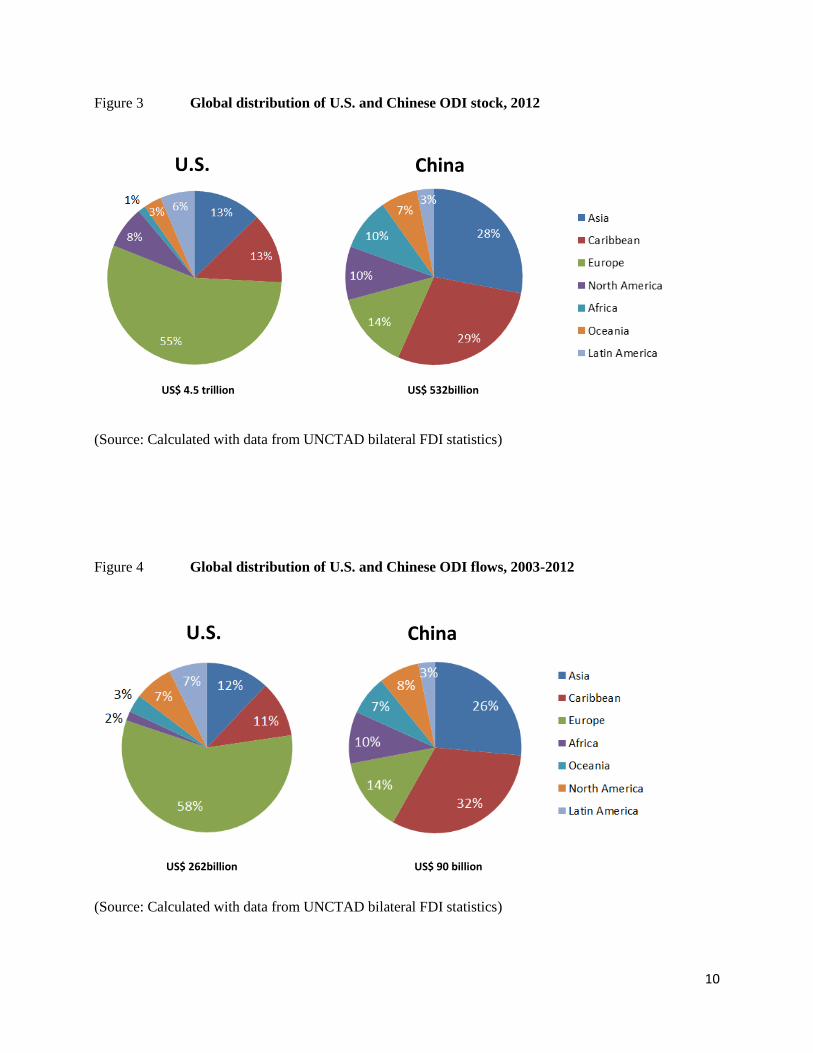
One could argue that Chinese investments to Africa are only a small percentage of its total outward
investments and that knowledge about these specific flows can tell us little about Chinese outward
investments in general. The same could be said about U.S. investments. It is true that Chinese investments
in Africa accounted for only ten per cent of China’s global ODI stock in 2012 (still more than the share of
its investments in Oceania or Latin America) and only one per cent of U.S.’s global ODI stock in 2012

12
(see Figure 3). However, the aim of this study is not to explain the location choice of Chinese firms in
general. Instead the aim is to test the explanatory power of current theories on the motives behind Chinese
outward investments and to further explore the particular advantages and disadvantages for Chinese firms
in high-risk markets outside their own region. After Asia, the advanced markets in Europe and Northern
America, and the tax havens in the Caribbean most Chinese investments were directed to the African
continent: a challenging region for business known for its instability. Traditional FDI theory cannot
explain the still relatively large share of Chinese investments that flow to these high-risk host markets far
away from China so soon in the internationalization process of Chinese firms.
FIGURE 3 GOES ABOUT HERE
FDi Markets– a service from the Financial Times – is a leading source of information on FDI. It collects
data on greenfield FDI at the project level; including information on the home and host countries, the
sector and the timing of each investment. There are three main drawbacks with the fDi Markets data: the
first drawback is that fDi Markets does not cover M&As. However, we do not expect that this will have a
significant effect on the results of our study because the spread of U.S. M&As over the African continent
is similar to the spread of U.S. investment projects in Africa. Kimberly et al. (2015) found 136 cases of
M&As by U.S. firms in Africa in the period 2003-2012. They also found that by far the most M&As in
Africa took place in South Africa (1766), Egypt (360) and Nigeria (189) (Kimberley et al., 2015); which
are also the top-three African countries with the most U.S. investment projects according to fDi Markets.
The second drawback is that information on the real capital expenditure at the project level – though
available – is not precise as it often reflects an estimated project size. Therefore, we decided to use the
number of investments as a more precise proxy of FDI activities. The third drawback is that the fDi
Market data is not complete for Chinese investment projects in Africa. Therefore, we use the MOFCOM
database for the number of China projects.
The MOFCOM database is freely accessible and shows all registered overseas investment projects by
Chinese companies. MOFCOM used to provide the data on the names of the parent company and foreign
13
entities, the province of origin in China, a short description of its activities, and the registration date of the
project. From the descriptions of the business activities we found that the MOFCOM database also does
not include Chinese M&As in Africa for the period 2003-2011 and therefore MOFCOM and fDi Markets
data are comparable. The main drawback of the MOFCOM database is that these registered projects have
been approved, but not necessarily implemented. It is likely that some of the projects have been cancelled
in the process because of difficulties encountered during the implementation phase. In short, the two
databases are comparable and their combined use gives us a good opportunity to compare the location
choice of Chinese and U.S. investors in Africa.
It must be noted that we are aware of the challenges with FDI data.3 One challenge is that some countries
(like for example the U.S.) report FDI stock data at book value instead of market value. Data on FDI flows
from FDI home countries that use different reporting standards are of course incomparable. Another
challenge are tax havens and countries that are not tax havens but that are convenient for channeling FDI
to other countries using holding companies (e.g. Switzerland, the Netherlands and Luxembourg). It is
clear that these investments are channeled through one country to another country; however, we cannot
know the final destination of this money. Without knowing the final host country of these investments a
large part of global investment flows remain unknown which makes the publicly available data on FDI
flows incomplete and therewith incomparable.
However, these challenges with FDI data do not impact the relevance of our findings for three reasons.
Firstly, we use the number of FDI projects instead of FDI stock or flow. In this case it does not matter
whether the money for the investment project came in via a tax haven or not. Secondly, we do not
compare the number of Chinese and U.S. investment projects with each other. Instead, we compare the
number of Chinese FDI projects for different African host countries. In another model we compare the
3 Last year, the editor in chief of Columbia FDI Perspectives from the Columbia Center on Sustainable Investment,
Karl Sauvant, published a paper with the telling title: “Beware of FDI statistics!” In this paper he identifies five
shortcomings in FDI statistics that limit their accuracy, and therefore also their usefulness for analysis (Sauvant,
2017).

14
number of U.S. FDI projects for different African countries and we then compare the results of both
models to analyze the differences in location choice between Chinese and U.S. firms. Thirdly, the aim of
our research is not to find the truth behind the location choice or motives of Chinese ODI to Africa. The
aim is to test the explanatory power of current theories on the motives behind Chinese outward investment
and these theories (or rather assumptions) are based on the same unreliable data our study is based on. The
point that we make is that based on the publicly available data one cannot state that Chinese ODI is
uniquely directed to politically instable or institutionally immature host countries; as is currently stated in
the literature.
Variables and Measures
Table 1 summarizes the variables, measures, and data sources.
Number of FDI projects. Our dependent variable is the total number of Chinese (and U.S.)
investment projects to Africa per host country over the period 2003-2011 as registered by MOFCOM
(China) and fDi Markets (U.S.). Prior studies have used FDI flow (e.g. Buckley et al., 2007) or stock (e.g.
Chen et al., 2015) to measure Chinese investments abroad. However, FDI flow and stock are not very
accurate measures of location choice for investment since the results can be biased due to single large
investments. When using FDI flow or stock the results are expected to be biased to countries with natural
resources since the mining and oil industries require much higher investments than most other industries.
The number of FDI projects is therefore a more accurate measurement for how attractive a specific host
country is for foreign investors.
TABLE 1 GOES ABOUT HERE
Institutional maturity. Prior studies have either used composite measures or two or more separate
measures from the same database to measure the level of governance/ institutions in host countries. For
example, Buckley et al. (2016) use both Government Stability and Rule of Law from the ICRG database

15
to measure the quality of host countries’ institutions. Chen et al. (2015) look at “governance” using two
measures from the Worldwide Governance Indicators: Rule of law and Political stability and absence of
violence/terrorism.
Child and Marinova’s (2014) framework suggests to separate political stability and institutional maturity.
Child and Marinova mention the Ease of Doing Business ranking from the World Bank as a measure for
institutional maturity; however this ranking includes many more aspects of a good business environment
than their description of institutional maturity, namely: ‘a situation in which a country’s institutions, such
as its legal system and regulatory authorities, function in a transparent manner, adhering to clear rules that
are applied in a universalistic manner to all citizens’ (2014: 353). Therefore, we use “rule of law” from the
Worldwide Governance Indicators (WGI) from the World Bank to measure the level of institutional
maturity.
Political stability. In prior studies, political stability is often measured from its negative opposite:
political instability or political risk. The much quoted study from Buckley et al. (2007) for example uses
“political risk” from the International Country Risk Guide (ICRG). The political risk rating from ICRG is
composed of the following risk components: government stability; socioeconomic conditions; investment
profile; internal conflict; external conflict; corruption; military in politics; religious tensions; law and
order; ethnic tensions; democratic accountability; and bureaucracy quality (ICRG methodology at website
PRS Group). Since this composite political risk measure includes also measures for institutional maturity,
we decided to focus on the component “government stability” only to measure political stability.
Government stability includes the following three subcomponents: government unity, legislative strength,
and popular support. The measure government stability (POL) therefore fits Child and Marinova’s (2014)
description of political stability, namely: a country which governance system enjoys popular legitimacy, in
which changes in government are orderly, and in which the policies of different governments exhibit
substantial continuity (2014: 353).

16
Control Variables
We control for the standard variables that have been included as controls in prior research and that apply
to our sample, including: market size, natural resource endowments, inflation, existing trade relations, and
how welcoming the host country is towards FDI in general.
Market (GDP). The data are obtained from the World Development Indicators (WDI) using GDP
at market prices (current US$).
Natural resources (NREXP). Amighini et al. (2011) refer to Buckley et al. (2007), Cheung and
Qian (2008), and Kolstad and Wiig (2012) and state that the results of these studies show that Chinese
investments are motivated by the need to satisfy their growing demand for primary resources, especially
for investments going to developing countries. However, Buckley et al. (2007) and Cheung and Qian
(2008) actually find that natural resources are insignificant, and Kolstad and Wiig (2012) find only an
interaction effect for natural resources and weak institutions in the host country. Despite these results, the
popular assumption is still that Chinese firms are attracted to countries with natural resources, especially
in developing regions. We use Buckley et al.’s (2007) measure for natural resource endowment, namely:
the ratio of ore and metal exports to merchandise exports of the host country and add the categories
precious stones and mineral fuels and oilsi.
Inflation (INFL). The conventional idea is that macroeconomic instability (proxied by high
inflation) is a deterrent for foreign investors. We use the World Economic Outlook to measure the
inflation rate, measured as the percentage change in consumer price index.
Trade (EXP and IMP). Research has shown that trade and FDI have a strong relationship
(Blomström & Kokko, 1997; Wells, 1983). FDI could be in support of trade or trade could be a substitute
for exports for example (see springboard theory by Luo & Tung, 2007). For the export to and import from
African countries of China and the U.S. we use data in current dollars from the ITC Trade map.

17
Welcoming to FDI (IFDI). Traditional FDI theory assumes that the more open a country is to
international investment, the more attractive it is likely to be as a destination for FDI (Chakrabarti, 2001).
We measure the openness of the host economy to international investment by calculating the ratio of
inward FDI stock to host GDP. We do this by excluding respectively Chinese and U.S. FDI to the total
FDI received by each host country.
The Model
Given the structure of the data and the expected relationships we apply a panel regression model using
fixed covariate effects and a random intercept to account for the heterogeneity in receiving countries.
Based on theoretical considerations and visual exploration of the data, we apply logarithmic
transformations to some of our variables to stabilize linearity of the relationships and homoscedasticity of
variances. Using the MIXED linear model command in SPSS we fit to the data via generalized least
squares a mixed effects model with fixed main effects and a random intercept:
lnFDIproj = α + β1lnGDP + β2NREXP + β3INFL + β4lnEXP + β5lnIMP + β6lnIFDI + β7POL + β8INST +
εit
We expect some correlation between POL and INST since countries with a high level of PS are more
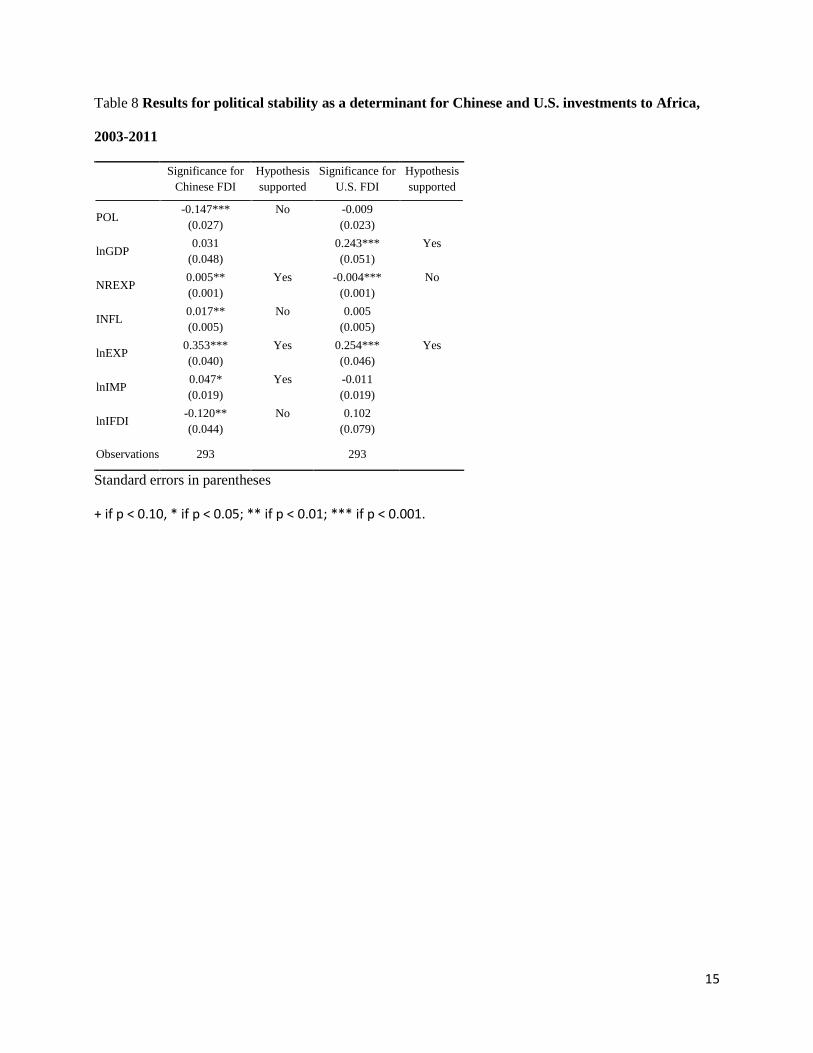
likely to have a high level of IM and vice versa. Therefore we also run two separate models for PS and IM
and compare the results with the results of our combined model.iiThis means that when the two variables
are combined the correlation is already controlled for and the results show the remaining positive relation
between Chinese FDI projects and institutional maturity.
The advantage of combining the two variables in one model is that we compare the same group of
countries for both IM and PS. Separately the IM model includes 51 of the in total 54 African countries and
the PS model only 35, due to a lack of data on these countries. The combined model can therefore include
a maximum of 35 countries.iiiIn order to control for the impact of analyzing fewer countries on the results
for IM, we also run a separate model for IM including only the 35 countries that are included in the PS

18
model.ivThe directions and levels of significance stay the same for China and U.S. investments in Africa.
This is not too surprising since the top-receiving FDI destination countries for both China and the U.S. are
included in this list of 35 Africa countries. Therefore we conclude that the down-sizing of our dataset due
to combining PS and IM does not have a significant impact on our results.
The data on FDI projects (FDIproj), GDP, export (EXP), import (IMP), and inward FDI (IFDI) are
transformed into natural logarithms as we expect nonlinearities in the relationship on the basis of theory
and previous empirical work. In order to be able to take logarithms, all values for IFDI are shifted by the
smallest negative number plus one, so that only positive scores occur. We add one to all values for
FDIproj so that zero projects become one project in order to be able to take the logarithms.
RESULTS AND DISCUSSION
Table 2 shows the results for the effect of IM and PS on the location choice for Chinese and U.S.
investments to Africa for the period 2003-2011.
TABLE 2 GOES ABOUT HERE
As predicted by Child and Marinova (2014) US investment is significantly directed to countries with a
relatively high level of IM. This is in line with general FDI theory – which predicts that FDI goes up when
the level of institutional maturity goes up. A more interesting finding however is that Chinese investments
are not directed to countries with a low level of IM. These results support Hypothesis 3, and do not
support Hypothesis 1.
Another important finding is that both Chinese and U.S. investment projects are significantly directed to
African countries with a relatively low level of PS. These results are contrary to both Hypothesis 2 and 4.
As discussed in the literature review, Buckley et al. (2007) found that Chinese FDI is not deterred from

19
political risk; however they claim this finding to be unique for Chinese FDI. Our findings show that both
Chinese and U.S. investments in Africa do not seem to be deterred by political instability.
The attraction of Chinese FDI towards countries with a low level of political stability could be partly
explained by being attracted to countries rich in natural resources in combination with the resource curse
theory. The following countries are in the top ten FDI host countries on the African continent for China:
Nigeria, South Africa, Zambia, Egypt, the DRC, Sudan and Angola (in order of their importance Chinese
investors). Zambia, Nigeria, the DRC and South Africa (from very low to higher levels of PS) are all in
the top 20 of African countries with the lowest levels of PS; and Egypt, Sudan and Angola follow soon
thereafter. In the case of the U.S. this finding is mostly explained by the large number of U.S. investment
projects in South Africa and Nigeria.
The strong positive relation with GDP for U.S. investments to Africa is conventional and confirms the
importance of market-seeking motives explained in general FDI theory.
Natural resource endowments are positive and significant for Chinese investments in Africa; supporting
the view that natural resource-seeking is a key motivation of Chinese FDI in the region. For U.S.
investments the relation with NREXP is negative and significant. In other words, the data shows that U.S.
firms invest more in relatively resource-poor countries in Africa. A possible explanation for this finding is
that by far the most U.S. investment in Africa is directed to South Africa. South Africa is a resource-rich
country; however, the South African economy is more diversified than most other African countries and
the revenue from natural resources is therefore lower compared to the other resource-rich countries in
Africa.
It is interesting to note that inflation is significantly and positively related to Chinese investments to
Africa. This means that there are significantly more Chinese investment projects in countries with
relatively high levels of inflation. This finding is in contrast with general FDI theory that predicts that
investors target countries with relatively low levels of inflation which are deemed to be economically

20
more stable. Buckley et al. (2007) find the same for their sample of Chinese FDI over the period 1984-
2001andprovide two possible explanations: first, moderate demand inflation accompanies economic
growth and this growth could attract Chinese firms. Second, Buckley et al. argue that ‘this may support
the view that the investment decisions of Chinese firms are unusually tolerant of less stable countries with
respect to local economic conditions’ (2007: 511). However, since inflation is also positively related to
U.S. investments to Africa – albeit not significantly – the first explanation seems to be more plausible.
Welcoming FDI is negatively and significantly related to Chinese investments. This shows that there are
more Chinese investment projects in countries that are receiving relatively little FDI in general. An
explanation could be that as late-comers, Chinese firms have little choice except to invest in less saturated
markets.
Additional Results and Robustness checks
We checked the effect on our results using the Ease of Doing Business (EoDB) data instead of Rule of
Law from the WGI as a proxy for IM. When we use EoDB U.S. investment projects are still, and Chinese
investment projects become, highly significantly directed to host countries with a high level of IM (see
table 3).v This is in line with general FDI theory, but not with the assumptions regarding the unique
characteristics of the location choice of Chinese investors.
TABLE 3 GOES ABOUT HERE
We also checked the effect on our results if we would use the WGI data on political stability and absence
of violence instead of the ICRG as a proxy for PS. The directions stay the same for U.S. investments.
However, the directions for Chinese investments do change significantly(see Table 4).vi
TABLE 4 GOES ABOUT HERE
The difference in the results for the relationship between Chinese investments and the level of PS in the
host country seems to be mainly caused by the fact that South Africa and Zambia – both in the top three

21
Chinese FDI project destinations in Africa – are much more negatively evaluated by the ICRG than the
WGI over the period 2003-2011.
Furthermore, we also checked how our results would be affected by using another proxy for the dependent
variable, namely using FDI flow instead of number of FDI projects. Table 5 shows that our results are not
affected by this change.
TABLE 5 GOES ABOUT HERE
As a last robustness check we decided to compare these results with the results for U.S. and Chinese
investments globally. Since we do not have access to the number of Chinese and U.S. investment projects
globally we decided to use the less favorable FDI flows instead as a measure for Chinese and U.S.
investments abroad. We left out the variables export, import and welcoming to FDI due to time
constraints. In all other aspects the model is the same as for Chinese and U.S. investments in Africa. Table
6 shows the results.
TABLE 6 GOES ABOUT HERE
Going against general FDI theory (that states that firms tend to avoid risks when investing abroad) both
Chinese and U.S. global investments are significantly directed to countries with low levels of PS. These
results are quite surprising, knowing that almost sixty per cent of U.S. investment flows over the period
2003-2011 were directed to Europe (see Figure 4). Furthermore, when looking at global investments both
Chinese and U.S. investments are significantly directed to countries with high levels of IM.
FIGURE 4 GOES ABOUT HERE
Lastly, we compared the results for Chinese and U.S. investments to Africa with the results of investments
from other advanced and emerging markets, namely: the U.K., France, Canada, Russia and India. The
results, reported in Table 12 in the Appendix, show that investments in Africa from all countries under
study are directed to host countries with relatively low levels of political stability and high levels of

22
institutional maturity; albeit with different levels of significance. These stable results point to a general
trend in the international location choice of firms that transcends political, economic and cultural
differences between the FDI source countries.
CONCLUSION
Child and Marinova ‘tried to revive the tradition of developing a different way of looking at things
through an argument that opens up some new space for academic debate’ (2014b: 409). However, they
were also constraining themselves by discussing differences in opportunities for firms mostly on a
national level. Furthermore, they perceived Chinese firms to be different than firms from other home
countries based on assumptions about specific benefits and challenges Chinese firms face in host countries
with different levels of PS and IM. For example, Child and Marinova state that ‘[o]ne reason why China
can be regarded as a different case concerns the suspicion that the motives for its overseas investment are
informed by a political agenda’ (2014: 348, our italics).
Child and Marinova argue that we should not focus on the host or home country alone; neither should we
focus on ‘the simple ‘distance’ between them’ (2014b: 405). They state that it is rather ‘the qualitative
interface between the two that is key to understanding what happens when companies engage in outward
foreign direct investment’ (2014b). We agree with and applaud the idea of studying the ‘qualitative
interface’. However, first we need to make clear that Chinese firms do not target institutionally immature
or politically instable countries more than Western firms do, because this singling out of Chinese firms is
not contributing to a better understanding of Chinese investment behavior or the internationalization
process of firms in general.
Therefore we decided to focus on the first part of Child and Marinova’s argument and to use the
framework they presented on PS and IM in order to test the role of institutional distance for the location
choice of Chinese and U.S. investments in Africa. We focused on the African region because of the heavy

23
criticism towards Chinese investments in especially this region that accuses “China” (as if it is one
monolithic actor) of exploiting countries with “poor institutions” without convincing empirical evidence.
To conclude, our findings do neither confirm our hypotheses that Chinese firms are most prevalent in
countries with a similarly high level of PS and low level of IM as China (or category B countries) nor that
U.S. firms are most prevalent in countries with a high level of PS and a high level of IM(or category A
countries). Instead, our findings show that both Chinese and U.S. investments to Africa are directed to
countries in all four categories due to resource-seeking and market-seeking motives. In other words,
Chinese firms do not differ substantially from U.S. firms in their location choice on the African continent.

24
ENDNOTES
i The data are obtained from ITC Trade map using the following codes: 26 (ores, slag & ash), 27 (mineral
fuels, mineral oils & products of their distillation), 71 (pearls, precious or semi-precious stones, precious
metals), 72 (iron & steel), 74 (copper), 75 (nickel), 76 (aluminium), 78 (lead), 79 (zinc), 80 (tin), 81 (other
base metals e.g. cobalt & titanium).
ii See appendix 1 for the results of the two separate models. For U.S. investments the direction of the
results is the same for the separate & combined models. For Chinese investments the main difference is
that the relation with IM changes from not significantly negative to significantly positive when combined
with PS.
iii See appendix 2 for a list of the African countries included in our dataset.
iv See appendix 3 for the results of the IM model when only looking at the 35 African countries from the
PS model.
v See appendix 4 for the change in results of the other variables.
vi See appendix 5 for the change in results of the other variables.

2
REFERENCES
A hungry dragon: Does the world have enough resources for China to keep growing at its present pace?
2004, September 30. The Economist. http://www.economist.com/node/3219503.
Amighini, A., Rabellotti, R. &Sanfilippo, M. 2011.China's Outward FDI: An Industry-level Analysis of
Host Country Determinants, CESifo Working Paper Series 3688, CESifo Group Munich.
Amighini, A., Rabellotti, R. &Sanfilippo, M. 2013. Do Chinese state-owned and private enterprises differ
in their internationalization strategies? China Economic Review, 27: 312-325.
Berning, S.C. &Holtbrügge, D. 2012.Chinese outward foreign direct investment—a challenge for
traditional internationalization theories? Journal für Betriebswirtschaft.
Blonigen, B. 2001.In search of substitution between foreign production and exports.Journal of
International Economics, 53(1): 81-104.
Brautigam, D. 2009.The dragon’s gift: The real story of China in Africa. Oxford: Oxford University Press.
Buckley, P.J., & Casson, M.C. 1976. The Future of the Multinational Enterprise. London: Homes and
Meier.
Buckley, P.J., Clegg, L.J., Cross, A.R., Liu, X., Voss, H., & Zheng, P. 2007. The determinants of Chinese
outward foreign direct investment. Journal of International Business Studies, 38: 499–518.

3
Buckley, P.J., Yu, P., Liu, Q., Munjal, S. & Tao, P. 2016. The Institutional Influence on the Location
Strategies of Multinational Enterprises from Emerging Economies: Evidence from China’s Cross-
border Mergers and Acquisitions. Management and Organization Review, 12(3): 425-448.
Burgess, S. 2010. Sustainability of strategic minerals in southern Africa and potential conflicts and
partnerships. Institute for National Security Studies, U.S. Air Force Academy.
http://www.dtic.mil/get-tr-doc/pdf?AD=ADA535875. Accessed at 23 January 2018
Cáceres, S.B., & Ear, S. 2013. The Hungry Dragon: How China's resources quest is reshaping the world.
New York: Routledge.
Chacrabarti, A. 2001. The determinants of foreign direct investment: sensitivity analyses of cross-country
regressions. KYKLOS, 54(1): 89-114.
Chen, W., Dollar, D. & Tang, H. 2016. Why Is China Investing in Africa? Evidence from the Firm Level.
The World Bank Economic Review. Online available at: https://doi.org/10.1093/wber/lhw049.
Cheung, Y., & Qian, X. 2009. The Empirics of China ’ s Outward Direct Investment. CESifo Working
Paper Series No. 2621.
Child, J. & Marinova, S. 2014. The Role of Contextual Combinations in the Globalization of Chinese
Firms. Management and Organization Review, 10(3): 347–371.
Child, J. & Marinova, S. 2014b. Response: Reflections on the Commentaries. Management and
Organization Review, 10(3): 405–409.

4
Child, J. & Rodrigues, S.B. 2005. The Internationalization of Chinese Firms: A Case for Theoretical
Extension? Management and Organization Review, 1(3): 381-410.
China’s material needs: The hungry dragon. 2004, February 19. The Economist.
http://www.economist.com/node/2446908.
Chinese state media slam Hillary Clinton's speech in Africa. 2012, Augustus 3.The
Guardian.https://www.theguardian.com/world/2012/aug/03/hillary-clinton-china-africa-
investment.
Clinton warns against "new colonialism" in Africa. 2011, June 11. Reuters.
https://www.reuters.com/article/us-clinton-africa/clinton-warns-against-new-colonialism-in-
africa-idUSTRE75A0RI20110611.
Cuervo-Cazurra, A. & Genc, M. 2008. Transforming disadvantages into advantages: developing-country
MNEs in the least developed countries. Journal of International Business Studies, 39: 957-979.
Dixit, A. 2012.Governance, development, and foreign direct investment. Max Weber lecture series,
January.
Dunning, J.H.1977. Trade, Location of Economic Activity and the MNE: A Search for an Eclectic
Approach. In B. Ohlin, P.-O. Hesselborn & P.M. Wijkman (eds.), The International Allocation of
Economic Activity: 395-418. London: Palgrave Macmillan.

5
Dunning, J.H. 2000. The eclectic paradigm of international production: A personal perspective. In C.
Pitelis & R. Sugden (eds.), The nature of the transnational firm (2nd ed.):119-139. London:
Routledge.
Dunning, J.H. 2013. International production and the multinational enterprise (12thed.). London:
Routledge.
Ernst & Young, 2017, May. Attractiveness Program Africa: Connectivity redefined.
Furniss, C. 2006. Dossier: China in Africa: The hungry dragon and the dark continent. Geographical,
78(12): 53-61.
Hagerman, R.A. 1984, April 6. U.S. reliance on Africa for strategic minerals. The Marine Corps
Command and Staff College. Quantico, Virginia.
http://www.globalsecurity.org/military/library/report/1984/HRA.htm. Accessed at 23 January
2018.
Hymer, S.H. 1976. The International Operations of National Firms: A Study of Foreign Direct
Investment. Cambridge, Mass: MIT Press 1976
IMF 2017.World Economic Outlook. http://www.imf.org/external/ns/cs.aspx?id=28. Accessed 16 October
2017.
ITC Trade map. 2017. Trademap. http://www.trademap.org/Index.aspx. Accessed 20September 2017.
6
Johanson, J., & Vahne, J-A.1977. The Internationalization Process of the Firm: A Model of Knowledge
Development and Increasing Foreign Market Commitments. Journal of International Business
Studies, 8: 23-32.
Kolstad, I. & Wiig,A. 2012. What determines Chinese outward FDI? Journal of World Business, 47: 26-
34.
Larmer, B. 2017, May 2. Is China the World’s New Colonial Power? The New York Times, Retrieved
from newspaper homepage https://www.nytimes.com/2017/05/02/magazine/is-china-the-worlds-
new-colonial-power.html, Accessed at 23 January 2018.
Lorenz, A. & Thielke, T. 2007, may 30. The Age of the Dragon: China's Conquest of Africa. Spiegel
Online: http://www.spiegel.de/international/world/the-age-of-the-dragon-china-s-conquest-of-
africa-a-484603.html. Accessed at 24 January 2018.
Luo, Y., & Tung, R. L. 2007.International expansion of emerging market enterprises: A springboard
perspective. Journal of International Business Studies, 38(4): 481–498.
Meunier, B & Bargoon, D. 2014. Chinese investment and European labor: should and do workers fear
Chinese FDI? Asia Europe Journal, 12(1-2): 179-197.
MOFCOM 2016.境外投资企业(机构)备案结果公开名录 (Registration of overseas investment
projects by Chinese companies).
http://femhzs.mofcom.gov.cn/fecpmvc/pages/fem/CorpJWList.html. Accessed 18 January 2016.

7
Morck, R., Yeung, B. & Zhao, M. 2008. Perspectives on China's Outward Foreign Direct Investment,
Journal of International Business Studies, 39(3): 337-350.
Quer, D., Claver, E., & Rienda, L. 2012. Political risk, cultural distance, and outward foreign direct
investment: Empirical evidence from large Chinese firms. Asia Pacific Journal of Management,
29(4): 1089-1104.
Ramasamy, B., Yeung, M., & Laforet, S. 2012. China’s outward foreign direct investment: Location
choice and firm ownership. Journal of World Business, 47(1): 17–25.
Rodrigues, S. B. 2010. Towards a new agenda for the study of business internationalisation: Integrating
markets, institutions and politics. Inaugural address, Erasmus University, Rotterdam, June 17.
Shelton, G. &Paruk, F. 2008.The Forum on China–Africa cooperation: A strategic opportunity. Institute
for Security Studies. Monograph 156.
https://www.files.ethz.ch/isn/103618/MONO156FULL.PDF. Accessed at 24 January 2018.
Sun, I.Y., Jayaram, K. & Kassiri, O. 2017. Dance of the lions and dragons: How are Africa and China
engaging, and how will the partnership evolve? Report by McKinsey & Company.
https://www.mckinsey.com/global-themes/middle-east-and-africa/the-closest-look-yet-at-chinese-
economic-engagement-in-africa. Accessed at 23January 2018.
UNCTAD 2017.Foreign direct investment: Inward and outward flows and stock, annual, 1970-2016.
http://unctadstat.unctad.org/wds/TableViewer/tableView.aspx?ReportId=96740. Accessed at 18
September 2017.
8
Vernon, R. 1966. International Investment and International Trade in the Product Cycle. Quarterly
Journal of Economics, 80: 190-207.
Whitehouse. 2014. U.S. – Africa Leaders’ Summit. https://obamawhitehouse.archives.gov/node/286081.
Accessed at 23 January 2018.
World Bank 2017a.Worldwide Governance Indicators. http://info.worldbank.org/governance/wgi/#home.
Accessed 2 October 2017.
World Bank 2017b.World Development Indicators.https://data.worldbank.org/data-catalog/world-
development-indicators. Accessed 18 September 2017.
Zaheer, S. 1995. Overcoming the Liability of Foreignness. The Academy of Management Journal, 38(2):
341-363.

9
FIGURES
Figure 1. Countries categorized according to their political stability and institutional maturity
(Source: Child & Marinova 2014)
Figure 2 The increase of Chinese and U.S. ODI flows to Africa in $US billions, 2003-2012
(Source: Calculated with data from UNCTAD bilateral FDI statistics)
-
1
2
3
4
5
6
7
8
9
10
2003 2004 2005 2006 2007 2008 2009 2010 2011 2012
Tota
l OD
I (U
S$ b
illio
ns)
U.S.
China
10
Figure 3 Global distribution of U.S. and Chinese ODI stock, 2012
(Source: Calculated with data from UNCTAD bilateral FDI statistics)
Figure 4 Global distribution of U.S. and Chinese ODI flows, 2003-2012
(Source: Calculated with data from UNCTAD bilateral FDI statistics)
U.S. China
US$ 4.5 trillion US$ 532billion
U.S. China
US$ 90 billion US$ 262billion

11
TABLES
Table 1 Variables, measures and sources of data
Variable Description Measure Data source
lnFDIproj
(dependent
variable)
Number of FDI
projects
Annual number of
Chinese/U.S. FDI
projects to Africa (per
host country)
Computed using data
from fDi Markets,
Financial Times and
MOFCOM (2016)
POL Political stability Annual estimate of
governance stability in
host country
Data from international
country risk group,
published by the PRS
Group
INST Institutional maturity Annual estimate of
governance of rule of
law in host country
Data from worldwide
governance indicators
database, World Bank
(2017a)
lnGDP Absolute market size Host country GDP at
market prices (current
US$)
Data from World
Development Indicators
database, World Bank
(2017b)
NREXP Natural resource
endowment
The ratio of ore, metal,
minerals and precious
stones exports to
merchandise exports of
host country
Computed using data
from ITC Trade map
(2017)
INFL Host country
inflation rate
Host country annual
inflation rate
Data from World
Economic Outlook, IMF
(2017)
lnEXP Chinese (and U.S.)
exports to the host
country
Total export per year Computed using data
from ITC Trade map
(2017)
lnIMP Chinese (and U.S.)
imports from the host
country
Total import per year Computed using data
from ITC Trade map
(2017)
lnIFDI Openness to FDI Ration of inward FDI
stock to host GDP
Computed using data
from UNCTAD (2017)
and the World
Development Indicators
database, World Bank
(2017)

12
Table 2 Results for institutional maturity and political stability as determinants for Chinese and U.S.
investments to Africa for the period 2003-2011
Significance for
Chinese FDI
Hypothesis
supported
Significance
for U.S. FDI
Hypothesis
supported
INST 0.115
(0.076)
0.252***
(0.063)
Yes
POL -0.164***
(0.029)
No -0.045+
(0.024)
No
lnGDP 0.003
(0.051)
0.220***
(0.050)
Yes
NREXP 0.005***
(0.001)
Yes -0.003**
(0.001)
No
INFL 0.017**
(0.005)
No 0.007
(0.005)
lnEXP 0.364***
(0.040)
Yes 0.253***
(0.045)
Yes
lnIMP 0.054**
(0.020)
Yes -0.005
(0.019)
lnIFDI -0.133**
(0.044)
No 0.120
(0.079)
Observations 293 293
Standard errors in parentheses
+if p < 0.10, * if p < 0.05; ** if p < 0.01; *** if p < 0.001.
Table 3 Comparing the results when using a different proxy for institutional maturity
Significance for
Chinese FDI
Significance for
U.S. FDI
Significance for
Chinese FDI
Significance
for U.S. FDI
POLICRG -0.164***
(0.029)
-0.045+
(0.024) POLICRG
-0.155***
(0.029)
-0.015
(0.025)
INSTWGI 0.115
(0.076)
0.252***
(0.063) INSTEoDB
0.014**
(0.004)
0.012**
(0.004)
Observations 293 293 248 248
Standard errors in parentheses
+if p < 0.10, * if p < 0.05; ** if p < 0.01; *** if p < 0.001.

13
Table 4 Comparing the results when using a different proxy for political stability
Significance for
Chinese FDI
Significance for
U.S. FDI
Significance for
Chinese FDI
Significance
for U.S. FDI
POLICRG -0.164***
(0.029)
-0.045+
(0.024) POLWGI
0.122+
(0.063)
-0.004
(0.049)
INSTWGI 0.115
(0.076)
0.252***
(0.063) INSTWGI
-0.197*
(0.098)
0.150*
(0.074)
Observations 293 293 420 420
Standard errors in parentheses
+ if p < 0.10, * if p < 0.05; ** if p < 0.01; *** if p < 0.001.
Table 5 Comparing the results when using investment flows instead of number of projects
Results FDI flow
China
Results FDI
projects
China
Results FDI
flow U.S.
Results FDI
projects U.S.
POL -0.334***
(0.053)
-0.164***
(0.029)
-0.169*
(0.075)
-0.045+
(0.024)
INST 0.071
(0.137)
0.115
(0.076)
0.056
(0.196)
0.252***
(0.063)
Observations 293 293 292 293
Standard errors in parentheses
+ if p < 0.10, * if p < 0.05; ** if p < 0.01; *** if p < 0.001.
Table 6 IM and PS as determinants for Chinese and U.S. FDI flow globally, 2003-2011
Significance for
Chinese FDI
Hypothesis
supported
Significance for
U.S. FDI
Hypothesis
supported
INST 0.114+
(0.062)
No 0.826***
(0.110)
Yes
POL -0.080*
(0.033)
No -0.145*
(0.059)
No
lnGDP 0.175***
(0.016)
Yes 0.294***
(0.028)
Yes
NREXP 0.017***
(0.002)
Yes -0.001
(0.003)
INFL 0.024**
(0.009)
No -0.018
(0.014)
Standard errors in parentheses
+ if p < 0.10, * if p < 0.05; ** if p < 0.01; *** if p < 0.001.

14
APPENDIX 1
Results of two separate models for PS and IM:
Table 7 Results for institutional maturity as a determinant for Chinese and U.S. investments to
Africa, 2003-2011
Significance for
Chinese FDI
Hypothesis
supported
Significance for
U.S. FDI
Hypothesis
supported
INST -0.045
(0.060)
0.146**
(0.046)
Yes
lnGDP 0.172***
(0.044)
Yes 0.202***
(0.039)
Yes
NREXP 0.003**
(0.001)
Yes -0.003***
(0.001)
No
INFL 0.017***
(0.004)
No 0.009*
(0.003)
No
lnEXP 0.214***
(0.028)
Yes 0.136***
(0.030)
Yes
lnIMP -0.024
(0.015)
0.020
(0.014)
lnIFDI 0.011
(0.033)
0.052
(0.059)
Observations 420 420
Standard errors in parentheses
+ if p < 0.10, * if p < 0.05; ** if p < 0.01; *** if p < 0.001.
15
Table 8 Results for political stability as a determinant for Chinese and U.S. investments to Africa,
2003-2011
Significance for
Chinese FDI
Hypothesis
supported
Significance for
U.S. FDI
Hypothesis
supported
POL -0.147***
(0.027)
No -0.009
(0.023)
lnGDP 0.031
(0.048)
0.243***
(0.051)
Yes
NREXP 0.005**
(0.001)
Yes -0.004***
(0.001)
No
INFL 0.017**
(0.005)
No 0.005
(0.005)
lnEXP 0.353***
(0.040)
Yes 0.254***
(0.046)
Yes
lnIMP 0.047*
(0.019)
Yes -0.011
(0.019)
lnIFDI -0.120**
(0.044)
No 0.102
(0.079)
Observations 293 293
Standard errors in parentheses
+ if p < 0.10, * if p < 0.05; ** if p < 0.01; *** if p < 0.001.

16
APPENDIX 2
List of African countries included in our dataset:
Algeria Madagascar
Angola Malawi
Botswana Mali
Burkina Faso Morocco
Cameroon Mozambique
Congo Namibia
Congo DR Niger
Côte d’Ivoire Nigeria
Egypt Senegal
Ethiopia South Africa
Gabon Sudan
Gambia Tanzania
Ghana Togo
Guinea Tunisia
Guinea-Bissau Uganda
Kenya Zambia
Liberia Zimbabwe
Libya

17
APPENDIX 3
Table 9 Results for institutional maturity when looking at only 35 African countries
Significance for
Chinese FDI
Hypothesis
supported
Significance for
U.S. FDI
Hypothesis
supported
INST -0.054
(0.076)
0.208***
(0.059)
Yes
lnGDP 0.041
(0.054)
0.215***
(0.050)
Yes
NREXP 0.004*
(0.001)
Yes -0.004**
(0.001)
No
INFL 0.020***
(0.006)
No 0.007+
(0.005)
No
lnEXP 0.353***
(0.043)
Yes 0.248***
(0.045)
Yes
lnIMP 0.035+
(0.021)
-0.001
(0.019)
lnIFDI -0.155**
(0.048)
No 0.100
(0.077)
Observations 293 293
Standard errors in parentheses
+ if p < 0.10, * if p < 0.05; ** if p < 0.01; *** if p < 0.001.

18
APPENDIX 4
Table 10 Results when using a different proxy for institutional maturity
Significance for
Chinese FDI
Hypothesis
supported
Significance for
U.S. FDI
Hypothesis
supported
INSTEoDB 0.014**
(0.004)
No 0.012**
(0.004)
Yes
POL -0.155***
(0.029)
No -0.015
(0.025)
lnGDP -0.025
(0.055)
0.198**
(0.057)
Yes
NREXP 0.006***
(0.001)
Yes -0.002*
(0.001)
No
INFL 0.021***
(0.005)
No 0.008+
(0.005)
No
lnEXP 0.362***
(0.043)
Yes 0.328***
(0.050)
Yes
lnIMP 0.064**
(0.022)
Yes -0.037+
(0.022)
No
lnIFDI -0.140*
(0.058)
No 0.076
(0.106)
Observations 248 248
Standard errors in parentheses
+ if p < 0.10, * if p < 0.05; ** if p < 0.01; *** if p < 0.001.

19
APPENDIX5
Table 11 Results when using a different proxy for political stability
Significance for
Chinese FDI
Hypothesis
supported
Significance for
U.S. FDI
Hypothesis
supported
INST -0.197*
(0.098)
Yes 0.150*
(0.074)
Yes
POLWGI 0.122+
(0.063)
Yes -0.004
(0.049)
lnGDP 0.205***
(0.047)
Yes 0.201***
(0.041)
Yes
NREXP 0.003*
(0.001)
Yes -0.003**
(0.001)
No
INFL 0.019***
(0.004)
No 0.009*
(0.004)
No
lnEXP 0.216***
(0.028)
Yes 0.136***
(0.031)
Yes
lnIMP -0.032*
(0.015)
No 0.020
(0.014)
lnIFDI 0.011
(0.032)
0.052
(0.059)
Observations 420 420
Standard errors in parentheses
+ if p < 0.10, * if p < 0.05; ** if p < 0.01; *** if p < 0.001.

20
APPENDIX 6
Table 12 Comparing Chinese, U.S., U.K., French, Canadian, Russian and Indian investments to
Africa, 2003-2011
China U.S. U.K. France Canada Russia India
INST 0.115
(0.076)
0.252***
(0.063)
0.242**
(0.070)
0.251***
(0.071)
0.238***
(0.053)
0.051
(0.039)
0.215***
(0.050)
POL -0.164***
(0.029)
-0.045+
(0.024)
-0.057*
(0.026)
-0.025
(0.028)
-0.065**
(0.020)
-0.014
(0.015)
-0.077***
(0.020)
lnGDP 0.003
(0.051)
0.220***
(0.050)
0.296***
(0.053)
0.180***
(0.043)
0.104*
(0.043)
0.109***
(0.023)
0.131***
(0.030)
NREXP 0.005***
(0.001)
-0.003**
(0.001)
-0.000
(0.001)
-0.004**
(0.001)
0.002+
(0.001)
0.000
(0.001)
-0.001
(0.001)
INFL 0.017**
(0.005)
0.007
(0.005)
0.003
(0.005)
-0.002
(0.005)
0.002
(0.004)
0.005+
(0.003)
0.003
(0.004)
lnEXP 0.364***
(0.040)
0.253***
(0.045)
0.072+
(0.039)
0.263***
(0.040)
-0.010
(0.032)
-0.002
(0.007)
0.048+
(0.025)
lnIMP 0.054**
(0.020)
-0.005
(0.019)
-0.023
(0.021)
-0.028
(0.030)
0.001
(0.012)
-0.015*
(0.006)
0.039**
(0.014)
lnIFDI -0.133**
(0.044)
0.120
(0.079)
0.087*
(0.040)
0.179***
(0.049)
0.004
(0.031)
0.051*
(0.021)
0.051*
(0.025)
Observations 293 293 293 293 293 293 293
Standard errors in parentheses
+ if p < 0.10, * if p < 0.05; ** if p < 0.01; *** if p < 0.001.