institutional credit, farm productivity and farm …...institutional credit, farm productivity and...
TRANSCRIPT
Project Sponsored by: Bharat Krishak Samaj, New Delhi
Council for Social Development, New Delhi
July 2013
Institutional Credit, Farm Productivity and Farm Distress
Institutional Credit, Farm Productivity and Farm Distress
PROJECT TEAM
Dr.T.Haque,
Director
Ms. Ankita Goyal,
Senior Research Associate & Principal Researcher
PROJECT SPONSORED
BY
Bharat Krishak Samaj
New Delhi
Council for Social Development (CSD)
Sangha Rachna, 53 - Lodi Estate,
New Delhi 110003
July 2013
ACKNOWLEDGEMENT
We acknowledge the funding support from Bharat Krishak Samaj, New Delhi, to the
Council for Social Development (CSD) for taking up this work under the titled
‘Institutional Credit, Farm Productivity and Farm Distress’. The team members
gratefully acknowledge the support and encouragement received from Prof. Muchkund
Dubey (President, CSD).
We would like to thank, Mr. Santosh Pandhari Suradkar, Mr Milind Ramachandra Ghate,
Mr. Amol P. Suradkar, Mr Anil Hiwali, Ms Harpreet Kaur, Mr. Davinder Singh, Mr. Poli
Singh and Mr. Randeep Singh for carrying out field investigation in Yavatmal, Buldhana,
Sangrur and Ludhiana. Mr Gitesh Sinha, Research officer CSD, for creating the database
and Mr. Santosh Atre and Ms. Gurvinder Kaur for assisting in data entry work. We
would also like to thank Ms Purtika Kalra, Research Associate CSD, for helping in data
cleaning and tabulation.
We gratefully acknowledge the help and assistance received from the farmers
interviewed. They had shown keen interest in this work, spared their precious time to
attend to our questionnaires and engaged in discussions. We remain indebted to them.
A warm gratitude is extended to the library staff of Reserve Bank of India, NABARD,
and the Council for Social Development, New Delhi for being helpful in facilitating the
data and documents required. We benefited immensely from the detailed discussions
and cooperation received from Shri Balwinder Singh Sidhu, Director (Agriculture),
Punjab, Dr. Sudhir Kumar Goyal ji, Addl Chief Secretary, Department of Agriculture and
Marketing, Maharashtra and district agriculture officers.
TABLE OF CONTENTS
SL. NO. TITLE PAGE NO.
1 ACKNOWLEDGEMENTS i
2 TABLE OF CONTENTS ii-iii
I INTRODUCTION 1-2
II ALL-INDIA TRENDS IN CREDIT DISBURSED TO
AGRICULTURE AND ALLIED ACTIVITIES
3-24
III PRIMARY SURVEY ANALYSIS 25-29
IV CONCLUSION AND WAY FORWARD 30
4 APPENDICES iv-xiii
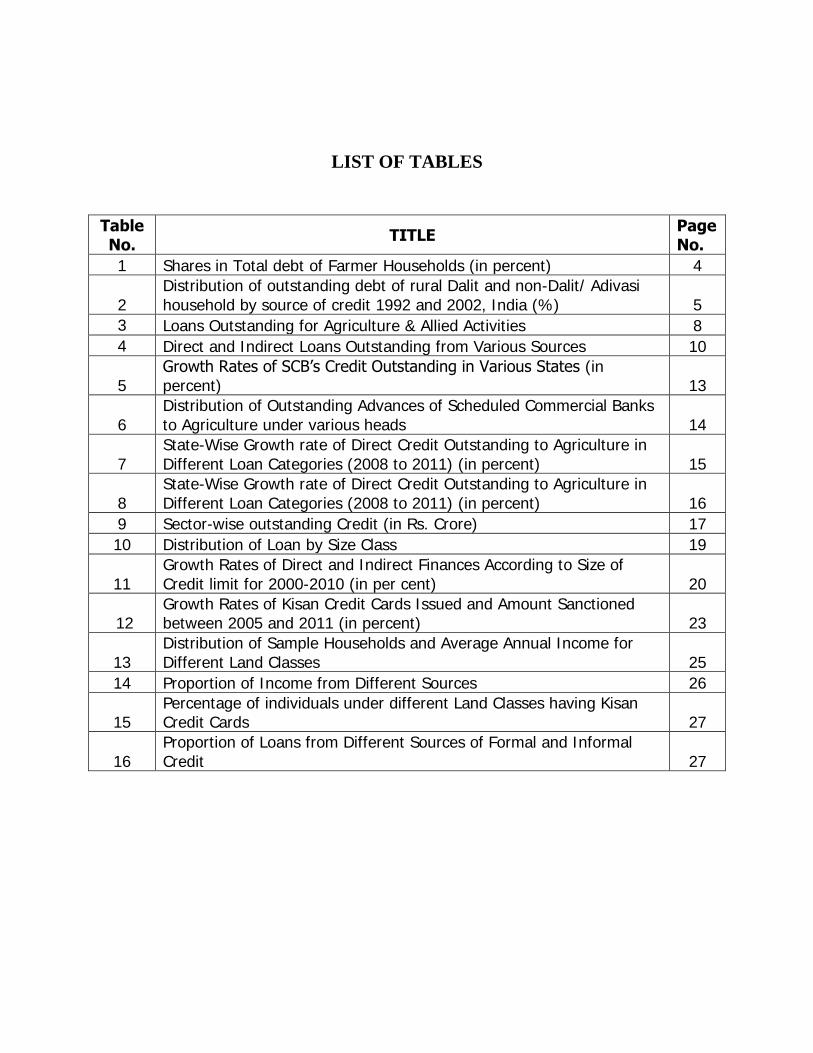
LIST OF TABLES
Table No.
TITLE Page No.
1 Shares in Total debt of Farmer Households (in percent) 4
2 Distribution of outstanding debt of rural Dalit and non-Dalit/ Adivasi household by source of credit 1992 and 2002, India (%) 5
3 Loans Outstanding for Agriculture & Allied Activities 8
4 Direct and Indirect Loans Outstanding from Various Sources 10
5 Growth Rates of SCB’s Credit Outstanding in Various States (in percent) 13
6 Distribution of Outstanding Advances of Scheduled Commercial Banks to Agriculture under various heads 14
7 State-Wise Growth rate of Direct Credit Outstanding to Agriculture in Different Loan Categories (2008 to 2011) (in percent) 15
8 State-Wise Growth rate of Direct Credit Outstanding to Agriculture in Different Loan Categories (2008 to 2011) (in percent) 16
9 Sector-wise outstanding Credit (in Rs. Crore) 17
10 Distribution of Loan by Size Class 19
11 Growth Rates of Direct and Indirect Finances According to Size of Credit limit for 2000-2010 (in per cent) 20
12 Growth Rates of Kisan Credit Cards Issued and Amount Sanctioned between 2005 and 2011 (in percent) 23
13 Distribution of Sample Households and Average Annual Income for Different Land Classes 25
14 Proportion of Income from Different Sources 26
15 Percentage of individuals under different Land Classes having Kisan Credit Cards 27
16 Proportion of Loans from Different Sources of Formal and Informal Credit 27
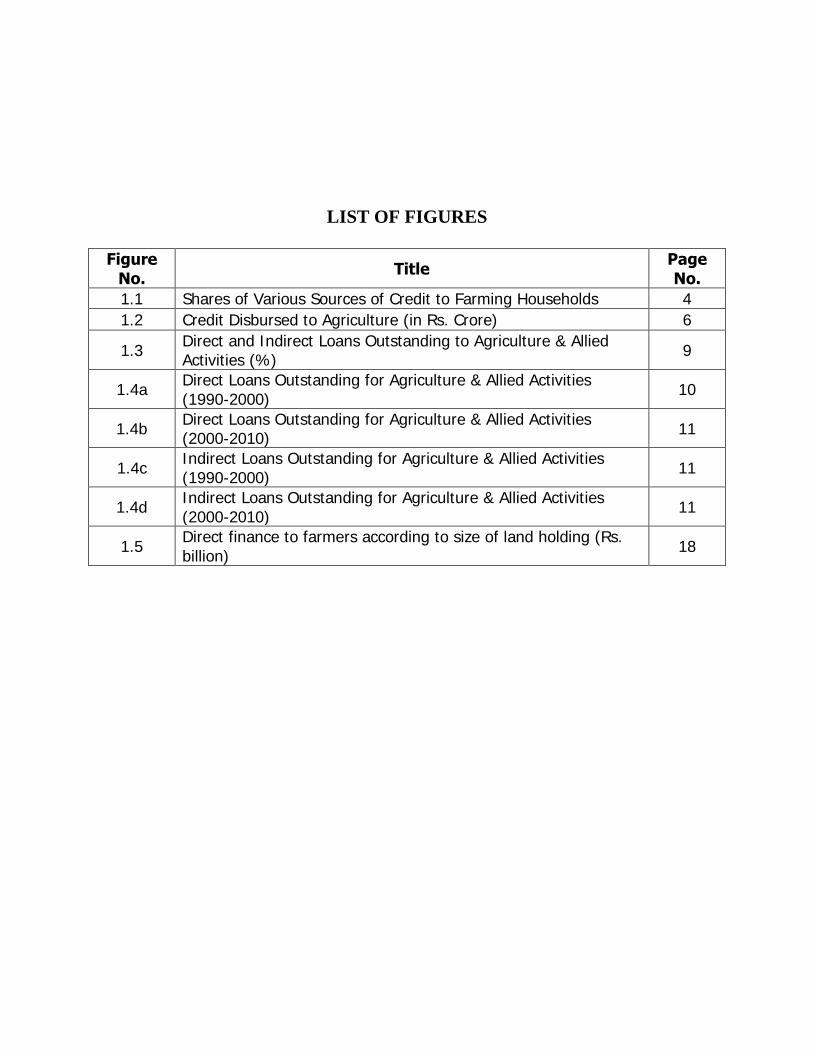
LIST OF FIGURES
Figure
No. Title
Page No.
1.1 Shares of Various Sources of Credit to Farming Households 4
1.2 Credit Disbursed to Agriculture (in Rs. Crore) 6
1.3 Direct and Indirect Loans Outstanding to Agriculture & Allied Activities (%)
9
1.4a Direct Loans Outstanding for Agriculture & Allied Activities (1990-2000)
10
1.4b Direct Loans Outstanding for Agriculture & Allied Activities (2000-2010)
11
1.4c Indirect Loans Outstanding for Agriculture & Allied Activities (1990-2000)
11
1.4d Indirect Loans Outstanding for Agriculture & Allied Activities (2000-2010)
11
1.5 Direct finance to farmers according to size of land holding (Rs. billion)
18
I. INTRODUCTION
Agriculture is the most important sector in India in terms of the population dependent
on it. With more than two-thirds of the population engaged in agriculture related
activities, it is imperative to study the constraints faced by them. There are various
physical, institutional, infrastructural and technological factors affecting agriculture in
India, viz., climate, soil, topography, market, transport facilities, labour, irrigation
facilities, adequate availability of quality seeds and other inputs, electrification, capital
and Government policies etc. Among these factors, ‘capital’ implies the credit required
for the purchase of inputs and machinery. In a poor agricultural country like India
where savings are negligible among the small farmers, agricultural credit appears to be
a critical factor affecting agricultural investment and productivity.
Objectives:
This study was taken up with the following objectives:
1. To analyse the trends in credit disbursed to agriculture and allied activities in
India
2. To examine farm size category wise credit availability from various sources
(institutional and non-institutional) in selected states.
3. To find out the credit related problems of farmers in areas where there is high
incidence of suicides by farmers.
Methodology:
The study is based on both secondary and primary data. For the purpose of farm level
data, a household survey was conducted in the States of Maharashtra and Punjab.
Ludhiana and Sangrur in Punjab and Buldhana and Yavatmal in Maharashtra were
selected for the purpose of primary survey. These districts have shown relatively high

incidence of suicides by the farmers and thus were specifically selected to help
understand the credit related problems of farmers.
One block/cluster of villages was selected from each of the four districts in consultation
with local district level officers. 100 farm households of different size groups from each
of the selected block/cluster were chosen forming a sample of around 400 farm
households for the study. Further, farming households in each block was divided into
three categories based on their net cultivated area (NCA) into small (less than 2
hectares), medium (between 2 and 4 hectares) and large (above 4 hectares). A detailed
questionnaire schedule was prepared for the collection of primary data. Information
was also gathered from banks and agricultural credit institutions where majority of the
farmers in a selected block took credit from. Results of analysis of both secondary and
primary data were used to arrive at conclusions.
II. ALL-INDIA TRENDS IN CREDIT DISBURSED TO
AGRICULTURE AND ALLIED ACTIVITIES
Globally, directed credit programmes involving loans on preferential terms and
conditions to priority sectors were considered a major tool of development policy in
both developed and developing countries in the 1960s, 1970s and mid-1980s. In India,
the Credit Policy for the year 1967-68, recognized, for the first time, the need of
increased involvement of commercial banks in financing of the priority sectors, viz.,
agriculture, exports and small-scale industries. In July 1969, 14 major commercial
banks were nationalized with the objective that lack of credit support should not be an
obstacle to any viable productive endeavor, irrespective of the fact whether the
borrower was big or small. In effect it further pressed for the concept of priority sector
lending. A formal description of the priority sector was done in 1972 on the basis of the
report submitted by the Informal Study Group on Statistics relating to advances to the
Priority Sectors constituted by Reserve Bank in May 1971. Since then, several changes
with new areas and sectors have been brought within the purview of the priority sector.
Institutional and Non-Institutional Sources of Credit
The agricultural credit system of India consists of informal and formal sources or
institutional sources of credit supply. The informal sources include commission agents,
traders, private moneylenders, friends, relatives, etc. Three major channels for
disbursement of formal credit include commercial banks, cooperatives and micro-
finance institutions (MFI) covering the whole length and breadth of the country.
Table 1: Shares in Total Debt of Farmer Households (in percent)
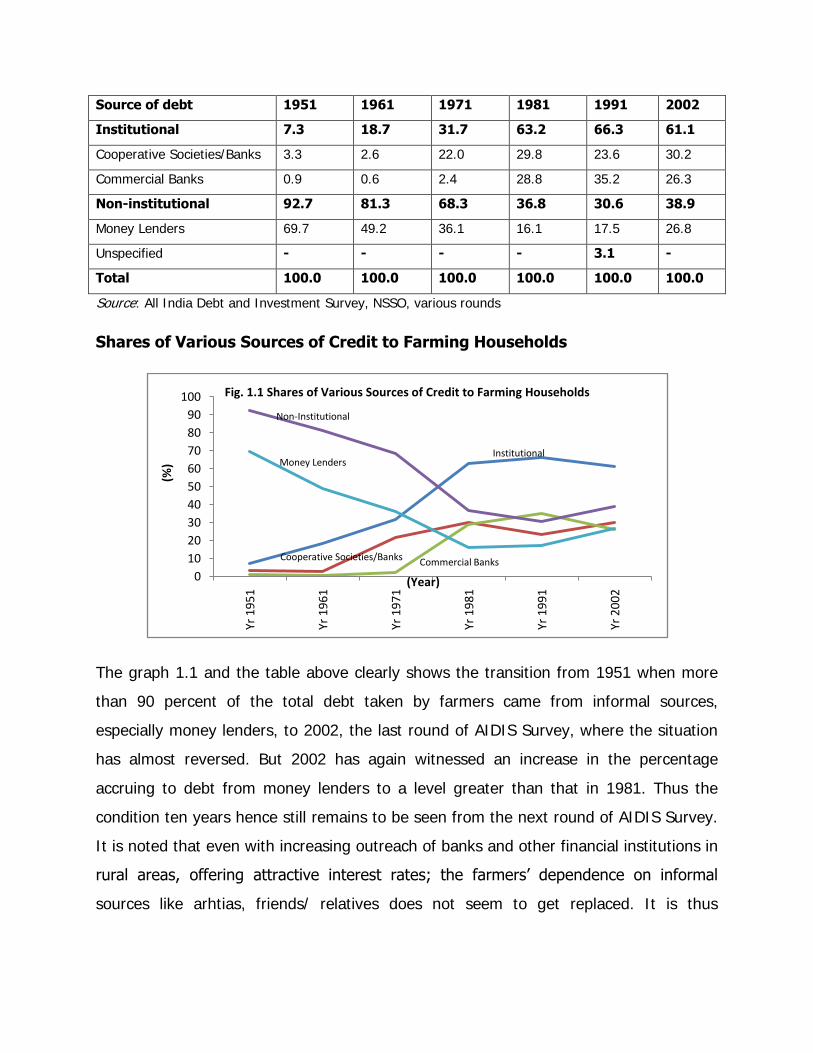
Source of debt 1951 1961 1971 1981 1991 2002
Institutional 7.3 18.7 31.7 63.2 66.3 61.1
Cooperative Societies/Banks 3.3 2.6 22.0 29.8 23.6 30.2
Commercial Banks 0.9 0.6 2.4 28.8 35.2 26.3
Non-institutional 92.7 81.3 68.3 36.8 30.6 38.9
Money Lenders 69.7 49.2 36.1 16.1 17.5 26.8
Unspecified - - - - 3.1 -
Total 100.0 100.0 100.0 100.0 100.0 100.0
Source: All India Debt and Investment Survey, NSSO, various rounds
Shares of Various Sources of Credit to Farming Households
The graph 1.1 and the table above clearly shows the transition from 1951 when more
than 90 percent of the total debt taken by farmers came from informal sources,
especially money lenders, to 2002, the last round of AIDIS Survey, where the situation
has almost reversed. But 2002 has again witnessed an increase in the percentage
accruing to debt from money lenders to a level greater than that in 1981. Thus the
condition ten years hence still remains to be seen from the next round of AIDIS Survey.
It is noted that even with increasing outreach of banks and other financial institutions in
rural areas, offering attractive interest rates; the farmers’ dependence on informal
sources like arhtias, friends/ relatives does not seem to get replaced. It is thus
0
10
20
30
40
50
60
70
80
90
100
Yr 1
95
1
Yr 1
96
1
Yr 1
97
1
Yr 1
98
1
Yr 1
99
1
Yr 2
00
2
(%)
(Year)
Fig. 1.1 Shares of Various Sources of Credit to Farming Households
Non-Institutional
Cooperative Societies/Banks
Institutional
Commercial Banks
Money Lenders
imperative to look at the trends in institutional credit disbursed to agriculture sector in
the recent years.
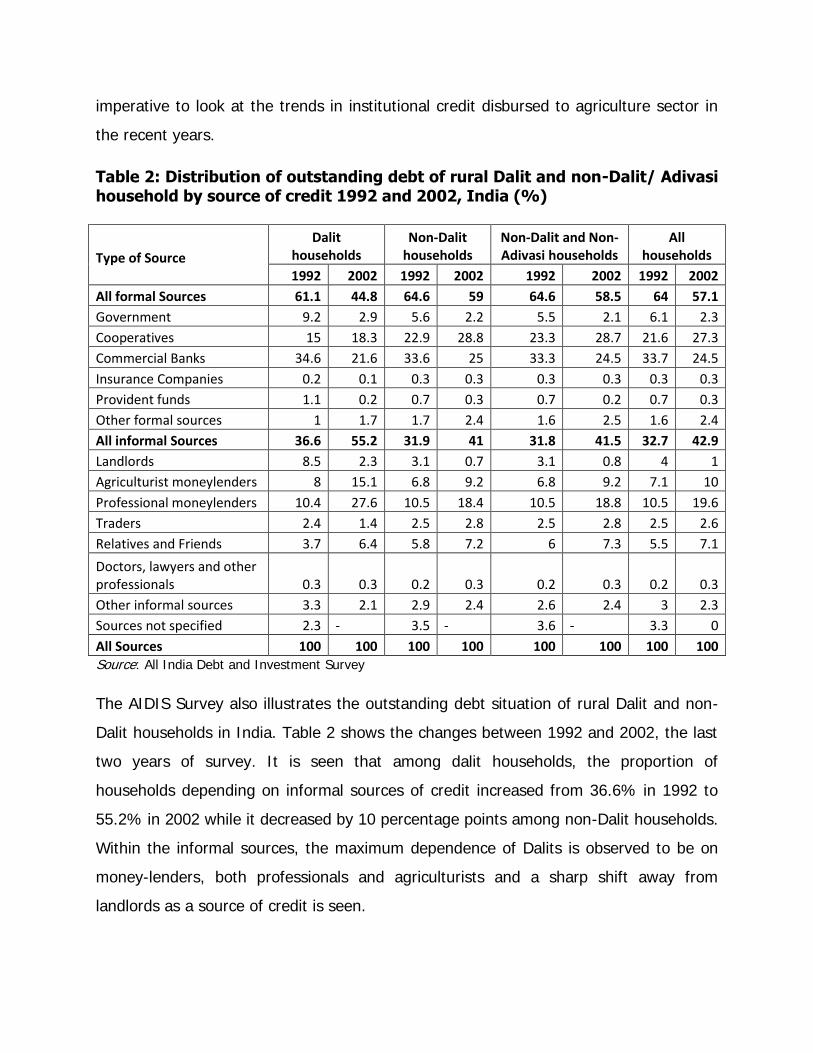
Table 2: Distribution of outstanding debt of rural Dalit and non-Dalit/ Adivasi household by source of credit 1992 and 2002, India (%)
Type of Source
Dalit households
Non-Dalit households
Non-Dalit and Non-Adivasi households
All households
1992 2002 1992 2002 1992 2002 1992 2002
All formal Sources 61.1 44.8 64.6 59 64.6 58.5 64 57.1
Government 9.2 2.9 5.6 2.2 5.5 2.1 6.1 2.3
Cooperatives 15 18.3 22.9 28.8 23.3 28.7 21.6 27.3
Commercial Banks 34.6 21.6 33.6 25 33.3 24.5 33.7 24.5
Insurance Companies 0.2 0.1 0.3 0.3 0.3 0.3 0.3 0.3
Provident funds 1.1 0.2 0.7 0.3 0.7 0.2 0.7 0.3
Other formal sources 1 1.7 1.7 2.4 1.6 2.5 1.6 2.4
All informal Sources 36.6 55.2 31.9 41 31.8 41.5 32.7 42.9
Landlords 8.5 2.3 3.1 0.7 3.1 0.8 4 1
Agriculturist moneylenders 8 15.1 6.8 9.2 6.8 9.2 7.1 10
Professional moneylenders 10.4 27.6 10.5 18.4 10.5 18.8 10.5 19.6
Traders 2.4 1.4 2.5 2.8 2.5 2.8 2.5 2.6
Relatives and Friends 3.7 6.4 5.8 7.2 6 7.3 5.5 7.1
Doctors, lawyers and other professionals 0.3 0.3 0.2 0.3 0.2 0.3 0.2 0.3
Other informal sources 3.3 2.1 2.9 2.4 2.6 2.4 3 2.3
Sources not specified 2.3 - 3.5 - 3.6 - 3.3 0
All Sources 100 100 100 100 100 100 100 100 Source: All India Debt and Investment Survey
The AIDIS Survey also illustrates the outstanding debt situation of rural Dalit and non-
Dalit households in India. Table 2 shows the changes between 1992 and 2002, the last
two years of survey. It is seen that among dalit households, the proportion of
households depending on informal sources of credit increased from 36.6% in 1992 to
55.2% in 2002 while it decreased by 10 percentage points among non-Dalit households.
Within the informal sources, the maximum dependence of Dalits is observed to be on
money-lenders, both professionals and agriculturists and a sharp shift away from
landlords as a source of credit is seen.
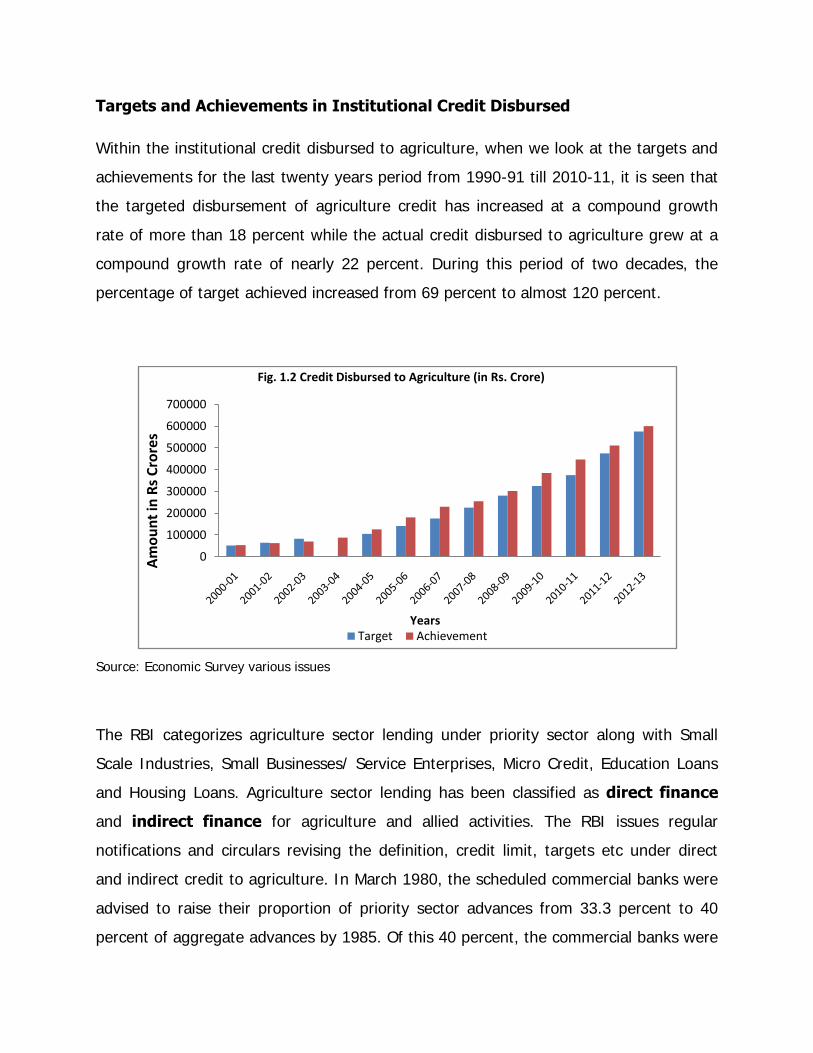
Targets and Achievements in Institutional Credit Disbursed
Within the institutional credit disbursed to agriculture, when we look at the targets and
achievements for the last twenty years period from 1990-91 till 2010-11, it is seen that
the targeted disbursement of agriculture credit has increased at a compound growth
rate of more than 18 percent while the actual credit disbursed to agriculture grew at a
compound growth rate of nearly 22 percent. During this period of two decades, the
percentage of target achieved increased from 69 percent to almost 120 percent.
Source: Economic Survey various issues
The RBI categorizes agriculture sector lending under priority sector along with Small
Scale Industries, Small Businesses/ Service Enterprises, Micro Credit, Education Loans
and Housing Loans. Agriculture sector lending has been classified as direct finance
and indirect finance for agriculture and allied activities. The RBI issues regular
notifications and circulars revising the definition, credit limit, targets etc under direct
and indirect credit to agriculture. In March 1980, the scheduled commercial banks were
advised to raise their proportion of priority sector advances from 33.3 percent to 40
percent of aggregate advances by 1985. Of this 40 percent, the commercial banks were
0
100000
200000
300000
400000
500000
600000
700000
Am
ou
nt
in R
s C
rore
s
Years
Fig. 1.2 Credit Disbursed to Agriculture (in Rs. Crore)
Target Achievement
mandated to earmark 18 per cent of total annual lending to agricultural sector as part
of priority sector lending. Earlier only direct finance to farmers was considered in the 18
percent target, but was expanded to include indirect finance in 1993.
Trends in Direct and Indirect Agricultural Credit
RBI defines agriculture credit as direct finance and indirect finance. Direct finance to
agriculture comprises loans to individuals, corporates and institutions. This includes crop
loans for raising crops, advances against hypothecation of agricultural produce for a
period less than a year, loans to small and marginal farmers for purchase of land for
agricultural purposes, loans to distressed farmers indebted to non-institutional lenders,
loans granted for pre-harvest and post-harvest activities, etc. Finance up to an
aggregate amount of Rs. one crore per borrower can be granted as direct loan by
Scheduled Commercial Banks.
Indirect finances for agriculture and allied activities comprises of loans to food and
agro-based processing units with investments in plant and machinery, credit for
purchase and distribution of fertilisers, pesticides, seeds and other inputs such a s cattle
feed, finance for setting up of Agri-clinics and Agri-business centres, finance to dealers
in agricultural machinery, loans for construction and running of storage facilities, loans
to Arhtias (commission agents) for extending credit to farmers, loans sanctioned to
NGOs which are SHG promoting institutions, for on-lending to members of SHGs, loans
granted to RRBs for on-lending to agriculture and allied activities sector, etc.
The credit limits for each of the categories under direct and indirect finances has been
revised from time to time, as also newer additions have been made to widen the scope
of direct as well as indirect institutional credit.
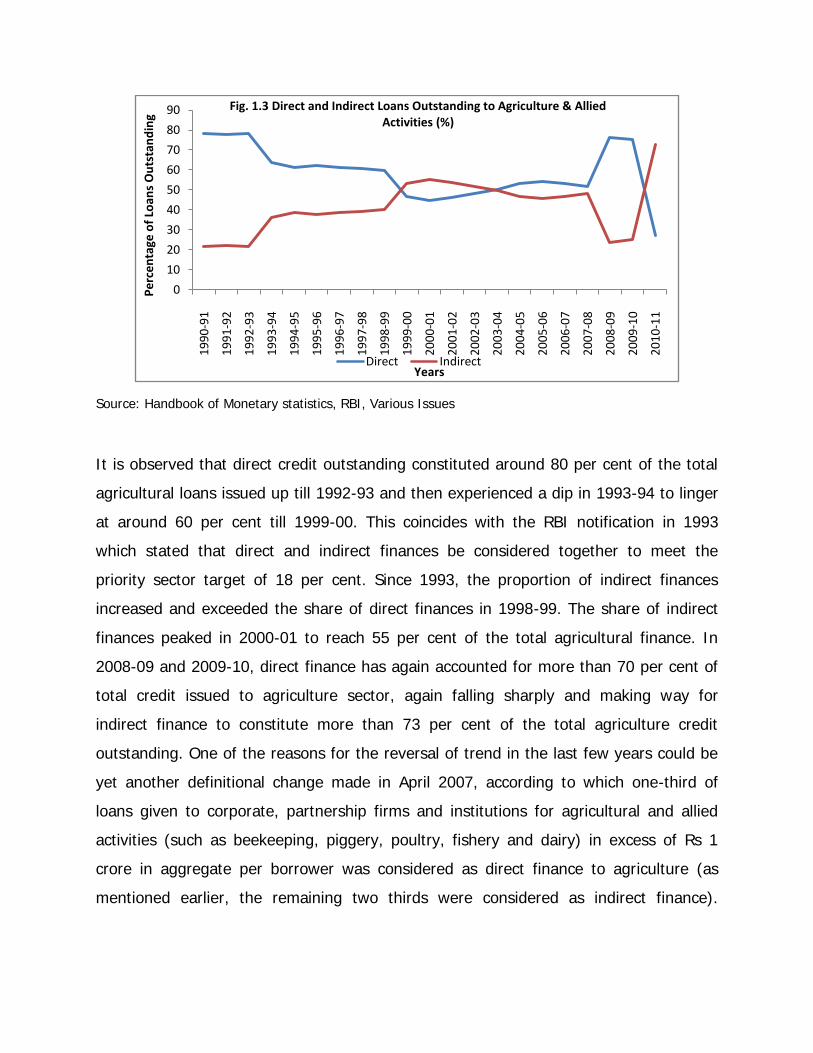
Figure 1.3 illustrates the changes in the proportion of total direct loans issued and total
indirect loans issued by various financial institutions in the past two decades. Total
direct credit includes direct credit from Co-operatives, State Governments, Scheduled
Commercial Banks and Regional rural Banks. Total indirect credit includes indirect
finances from Co-operatives, Scheduled Commercial Banks, Regional Rural Banks and
Rural Electrification Corporation.
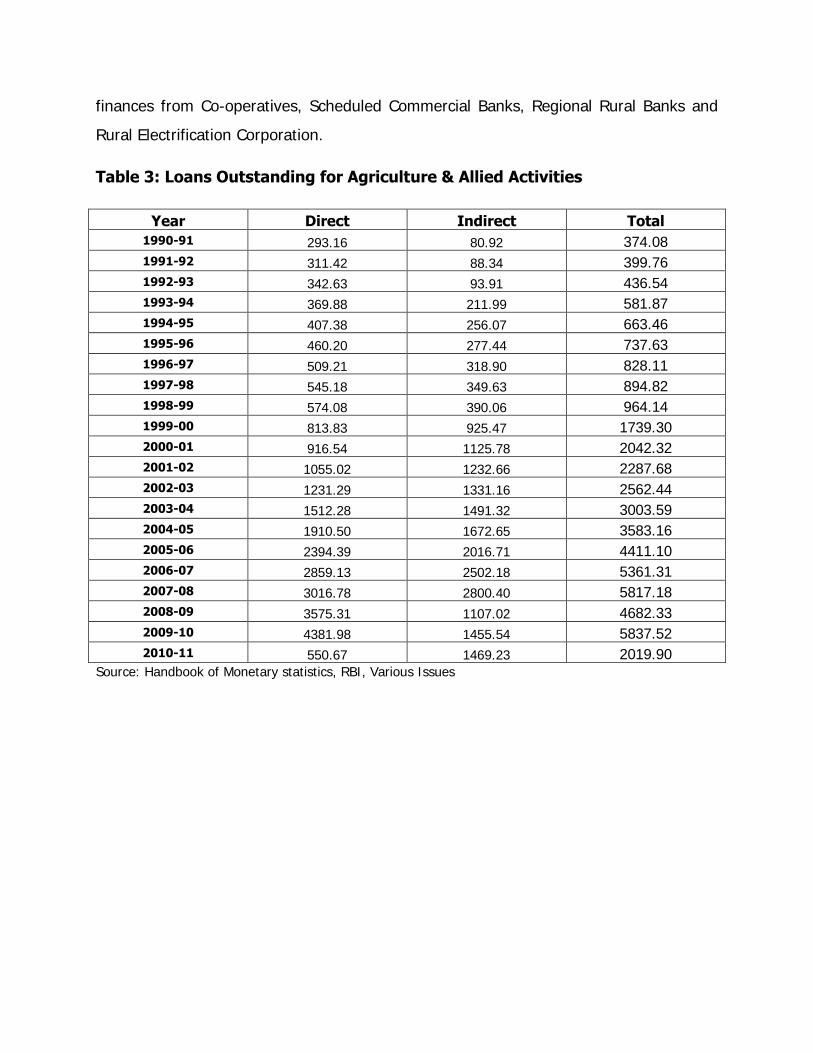
Table 3: Loans Outstanding for Agriculture & Allied Activities
Year Direct Indirect Total 1990-91 293.16 80.92 374.08 1991-92 311.42 88.34 399.76 1992-93 342.63 93.91 436.54 1993-94 369.88 211.99 581.87 1994-95 407.38 256.07 663.46 1995-96 460.20 277.44 737.63 1996-97 509.21 318.90 828.11 1997-98 545.18 349.63 894.82 1998-99 574.08 390.06 964.14 1999-00 813.83 925.47 1739.30 2000-01 916.54 1125.78 2042.32 2001-02 1055.02 1232.66 2287.68 2002-03 1231.29 1331.16 2562.44 2003-04 1512.28 1491.32 3003.59 2004-05 1910.50 1672.65 3583.16 2005-06 2394.39 2016.71 4411.10 2006-07 2859.13 2502.18 5361.31 2007-08 3016.78 2800.40 5817.18 2008-09 3575.31 1107.02 4682.33 2009-10 4381.98 1455.54 5837.52 2010-11 550.67 1469.23 2019.90
Source: Handbook of Monetary statistics, RBI, Various Issues
Source: Handbook of Monetary statistics, RBI, Various Issues
It is observed that direct credit outstanding constituted around 80 per cent of the total
agricultural loans issued up till 1992-93 and then experienced a dip in 1993-94 to linger
at around 60 per cent till 1999-00. This coincides with the RBI notification in 1993
which stated that direct and indirect finances be considered together to meet the
priority sector target of 18 per cent. Since 1993, the proportion of indirect finances
increased and exceeded the share of direct finances in 1998-99. The share of indirect
finances peaked in 2000-01 to reach 55 per cent of the total agricultural finance. In
2008-09 and 2009-10, direct finance has again accounted for more than 70 per cent of
total credit issued to agriculture sector, again falling sharply and making way for
indirect finance to constitute more than 73 per cent of the total agriculture credit
outstanding. One of the reasons for the reversal of trend in the last few years could be
yet another definitional change made in April 2007, according to which one-third of
loans given to corporate, partnership firms and institutions for agricultural and allied
activities (such as beekeeping, piggery, poultry, fishery and dairy) in excess of Rs 1
crore in aggregate per borrower was considered as direct finance to agriculture (as
mentioned earlier, the remaining two thirds were considered as indirect finance).
0
10
20
30
40
50
60
70
80
90
19
90
-91
19
91
-92
19
92
-93
19
93
-94
19
94
-95
19
95
-96
19
96
-97
19
97
-98
19
98
-99
19
99
-00
20
00
-01
20
01
-02
20
02
-03
20
03
-04
20
04
-05
20
05
-06
20
06
-07
20
07
-08
20
08
-09
20
09
-10
20
10
-11
Pe
rce
nta
ge o
f Lo
ans
Ou
tsta
nd
ing
Years
Fig. 1.3 Direct and Indirect Loans Outstanding to Agriculture & Allied Activities (%)
Direct Indirect

Similar definitional changes, from time to time, have made direct and indirect credit
incomparable over time. (R Ramakumar, Pallavi Chavan, 2007)
Table 4: Direct and Indirect Loans Outstanding from Various Sources
Direct (short term + long term) Indirect Credit Year Co-operatives SCBs RRBs Co-operatives SCBs RRBs REC 1990-91 35.92 58.10 5.98 29.10 14.70 0.29 55.91 1991-92 39.10 54.53 6.37 28.15 16.22 0.44 55.18 1992-93 40.19 53.38 6.44 27.58 16.52 0.42 55.10 1993-94 41.41 51.67 6.92 63.27 9.90 0.16 26.67 1994-95 41.26 51.35 7.39 64.50 11.19 0.13 24.18 1995-96 41.56 50.91 7.53 62.74 13.24 0.12 23.89 1996-97 40.37 51.70 7.93 61.79 15.64 0.15 22.42 1997-98 39.23 52.18 8.59 59.54 18.12 0.04 22.31 1998-99 38.67 51.94 9.39 56.46 20.81 0.06 22.67 1999-00 51.55 41.09 7.36 72.79 14.01 0.03 13.17 2000-01 50.34 41.76 7.91 70.68 16.72 0.00 12.60 2001-02 49.39 42.75 7.85 72.28 14.80 0.00 12.93 2002-03 47.97 43.70 8.33 69.80 17.80 0.00 12.40 2003-04 47.22 45.03 7.75 68.60 19.12 0.00 12.27 2004-05 41.26 50.00 8.75 65.84 21.57 0.00 12.59 2005-06 34.38 56.63 8.98 59.47 28.35 0.00 12.18 2006-07 31.28 59.12 9.60 54.51 33.00 0.00 12.49 2007-08 21.77 67.22 11.01 52.84 33.37 0.00 13.79 2008-09 17.91 71.64 10.45 0.00 100.00 0.00 45.76 2009-10 17.45 71.98 10.56 0.00 100.00 0.00 45.33 Source: Handbook of Monetary statistics, RBI, Various Issues
0.00
20.00
40.00
60.00
80.00
%
Years
Fig. 1.4a: Direct Loans Outstanding for Agriculture & Allied Activities
Co-operatives SCBs RRBs
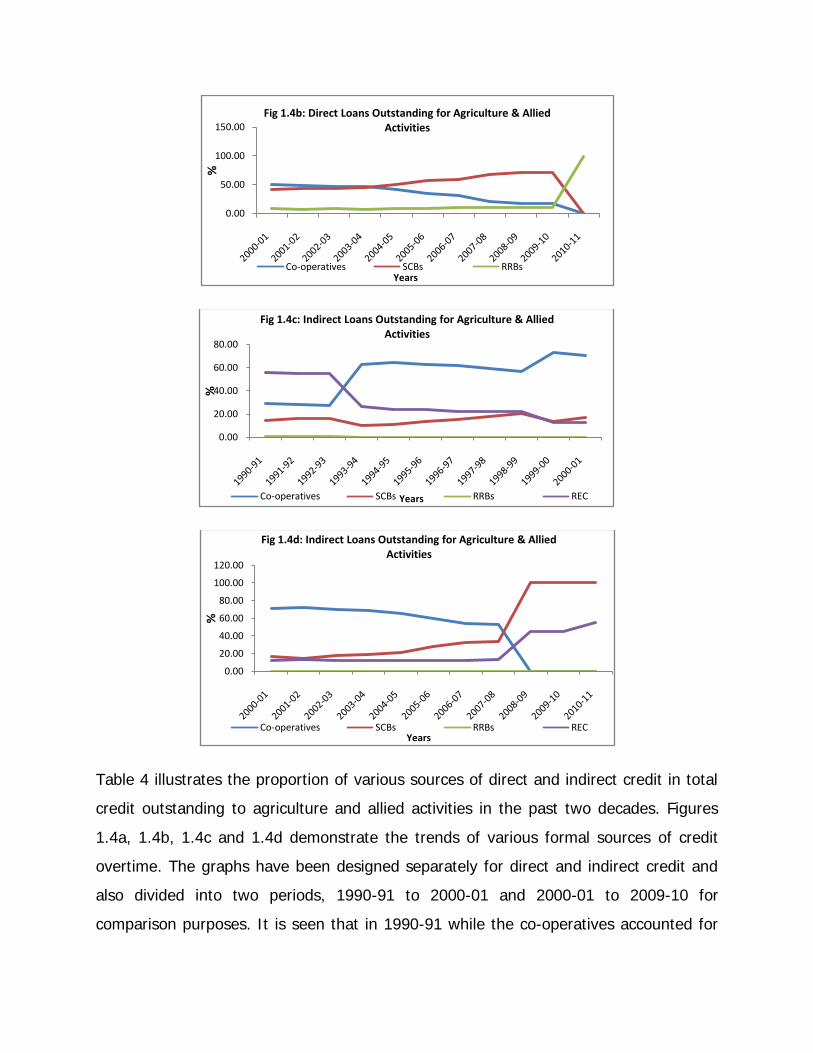
Table 4 illustrates the proportion of various sources of direct and indirect credit in total
credit outstanding to agriculture and allied activities in the past two decades. Figures
1.4a, 1.4b, 1.4c and 1.4d demonstrate the trends of various formal sources of credit
overtime. The graphs have been designed separately for direct and indirect credit and
also divided into two periods, 1990-91 to 2000-01 and 2000-01 to 2009-10 for
comparison purposes. It is seen that in 1990-91 while the co-operatives accounted for
0.00
50.00
100.00
150.00
%
Years
Fig 1.4b: Direct Loans Outstanding for Agriculture & Allied Activities
Co-operatives SCBs RRBs
0.00
20.00
40.00
60.00
80.00
%
Years
Fig 1.4c: Indirect Loans Outstanding for Agriculture & Allied Activities
Co-operatives SCBs RRBs REC
0.00
20.00
40.00
60.00
80.00
100.00
120.00
%
Years
Fig 1.4d: Indirect Loans Outstanding for Agriculture & Allied Activities
Co-operatives SCBs RRBs REC
nearly 30 percent of the direct as well as indirect credit to agriculture, the situation
changed by the beginning of the new millennium when co-operatives share changed to
50 percent and 71 percent respectively and most recently in 2009-10, it has drastically
fallen to 17 percent of direct credit and 0 percent in case of indirect credit.
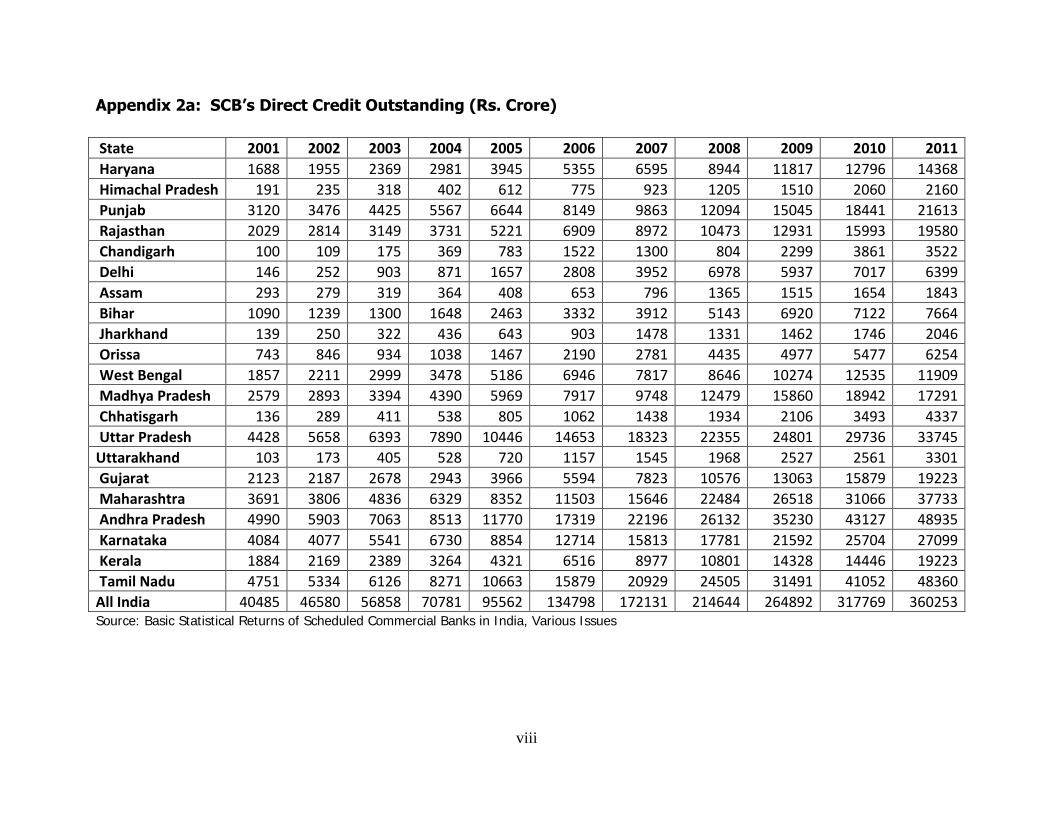
When we look at the changes in the credit outstanding of Scheduled Commercial Banks
over the years, it is seen to have decreased from 58 percent of direct credit in 1990-91
to 42 percent in 2000-01 but has again increased to an unprecedented 72 percent of
the direct credit in 2008-09 and 2009-10. In case of share of indirect credit from SCB’s,
it is noted that it remained around 15-17 percent between 1999-91 and 2002-03 and
jumped to almost 70 percent in 2008-09.
Regional Rural Banks are seen to contribute only towards direct credit to agriculture.
The share has been in the range of 6 percent to 11 percent and no substantial shift is
seen in the later years. Rural Electrification Corporation is a contributor only towards
indirect credit to agriculture. Its share has dipped from more than 55 percent in 1990-
91 to around 13 percent for most of 2000s but has seen to increase to more than 30
percent in 2008-09 and 2009-10.
Thus it can be said that a very different trend is seen in 2000s as compared to the
1990s, and is truly reflective of the changes in policies as well as definition of direct and
indirect credit.
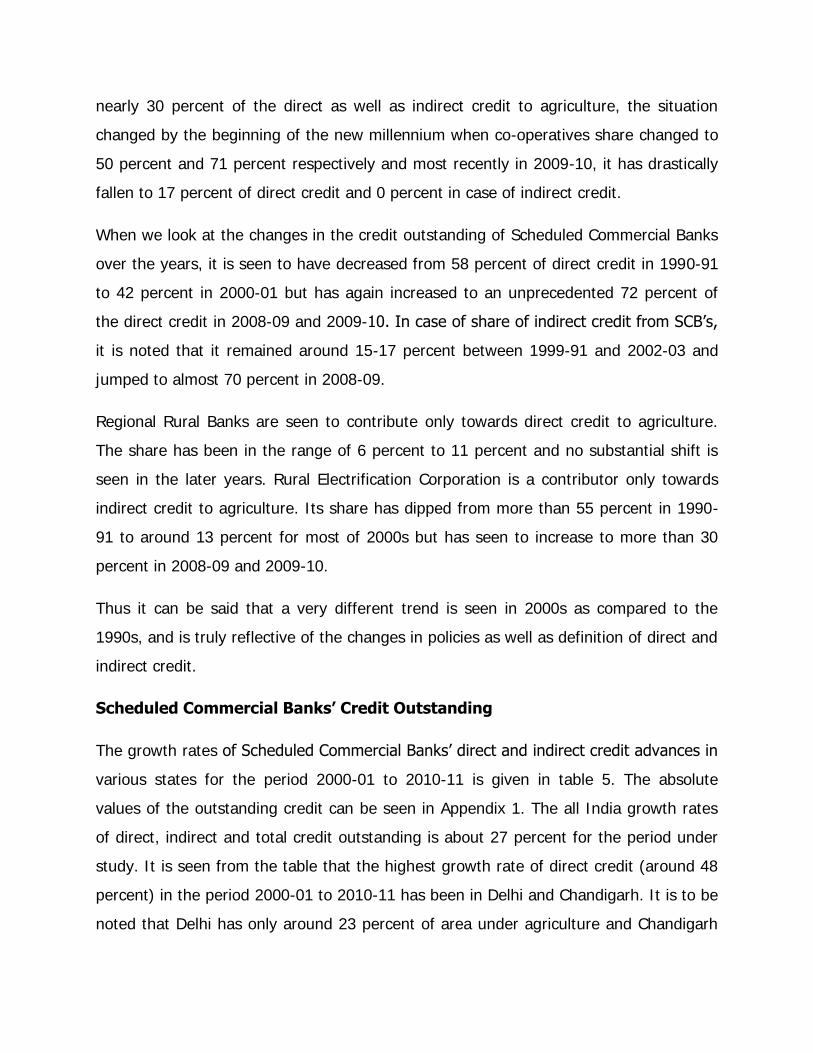
Scheduled Commercial Banks’ Credit Outstanding
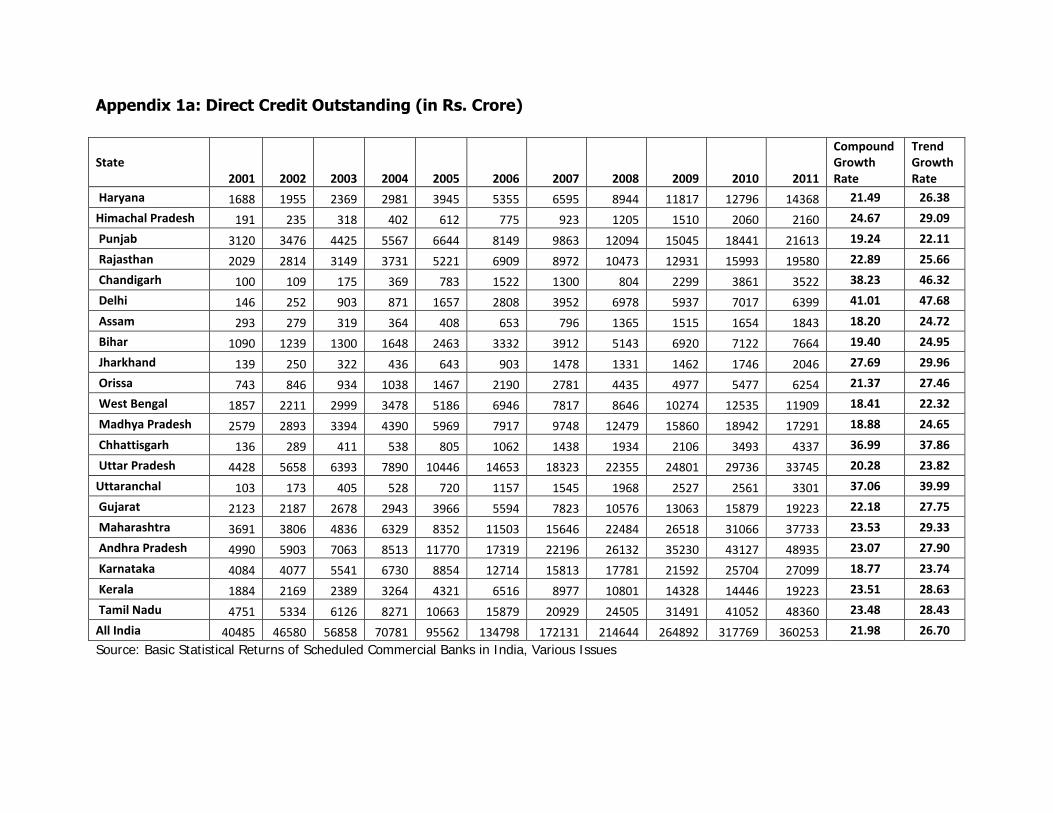
The growth rates of Scheduled Commercial Banks’ direct and indirect credit advances in
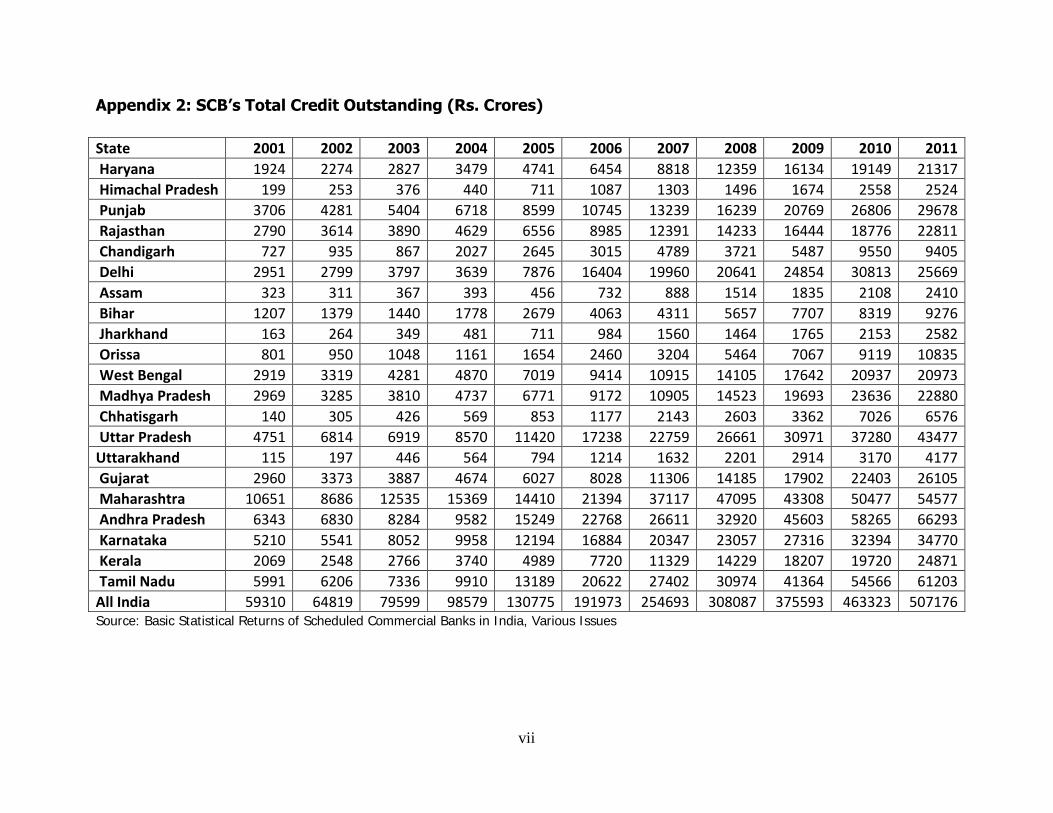
various states for the period 2000-01 to 2010-11 is given in table 5. The absolute
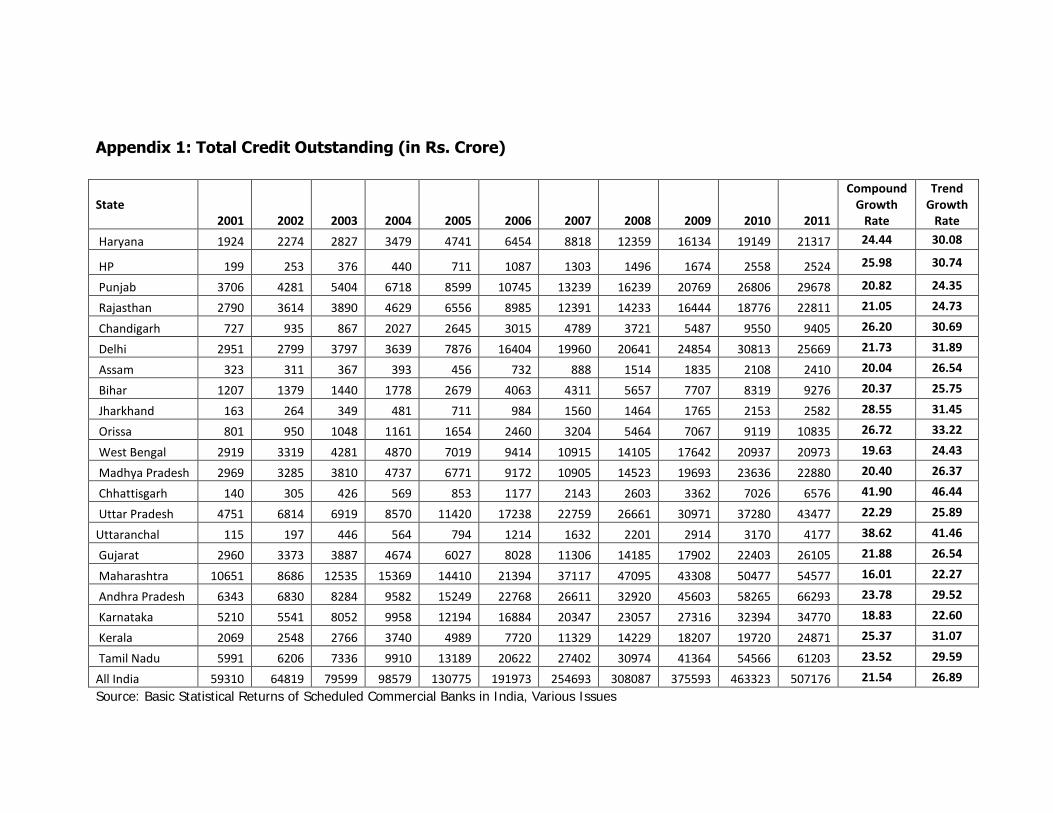
values of the outstanding credit can be seen in Appendix 1. The all India growth rates
of direct, indirect and total credit outstanding is about 27 percent for the period under
study. It is seen from the table that the highest growth rate of direct credit (around 48
percent) in the period 2000-01 to 2010-11 has been in Delhi and Chandigarh. It is to be
noted that Delhi has only around 23 percent of area under agriculture and Chandigarh
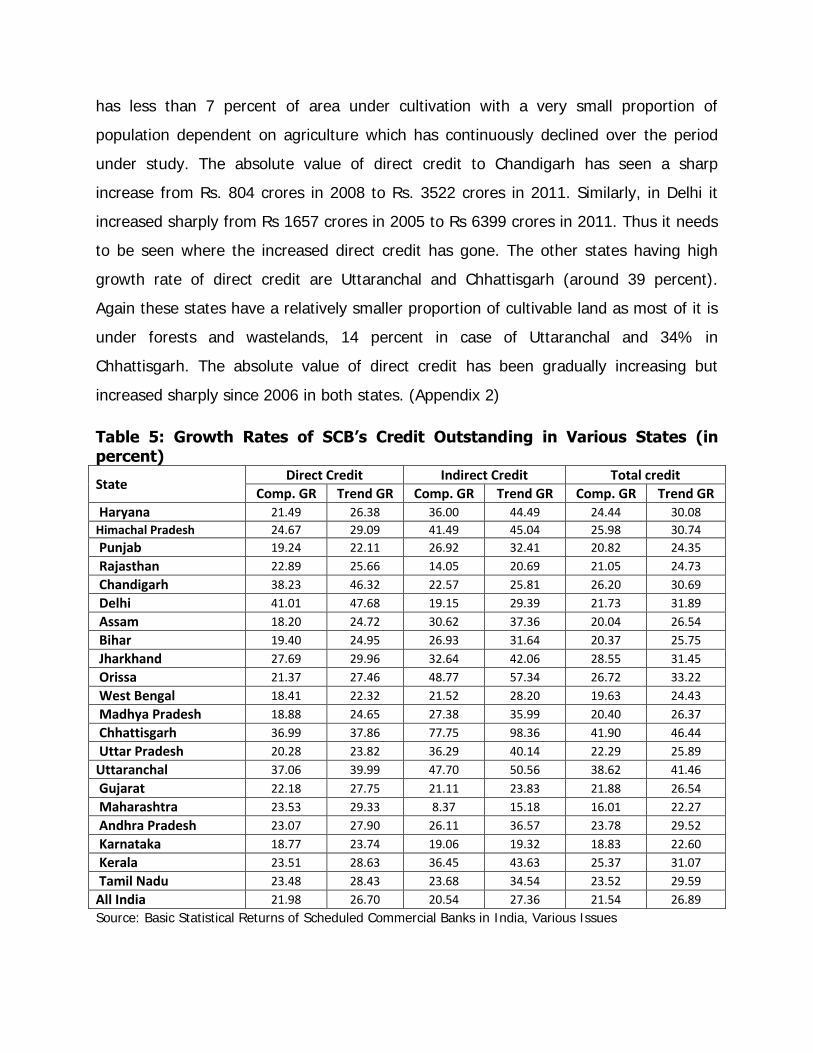
has less than 7 percent of area under cultivation with a very small proportion of
population dependent on agriculture which has continuously declined over the period
under study. The absolute value of direct credit to Chandigarh has seen a sharp
increase from Rs. 804 crores in 2008 to Rs. 3522 crores in 2011. Similarly, in Delhi it
increased sharply from Rs 1657 crores in 2005 to Rs 6399 crores in 2011. Thus it needs
to be seen where the increased direct credit has gone. The other states having high
growth rate of direct credit are Uttaranchal and Chhattisgarh (around 39 percent).
Again these states have a relatively smaller proportion of cultivable land as most of it is
under forests and wastelands, 14 percent in case of Uttaranchal and 34% in
Chhattisgarh. The absolute value of direct credit has been gradually increasing but
increased sharply since 2006 in both states. (Appendix 2)
Table 5: Growth Rates of SCB’s Credit Outstanding in Various States (in percent)
State Direct Credit Indirect Credit Total credit
Comp. GR Trend GR Comp. GR Trend GR Comp. GR Trend GR
Haryana 21.49 26.38 36.00 44.49 24.44 30.08
Himachal Pradesh 24.67 29.09 41.49 45.04 25.98 30.74
Punjab 19.24 22.11 26.92 32.41 20.82 24.35
Rajasthan 22.89 25.66 14.05 20.69 21.05 24.73
Chandigarh 38.23 46.32 22.57 25.81 26.20 30.69
Delhi 41.01 47.68 19.15 29.39 21.73 31.89
Assam 18.20 24.72 30.62 37.36 20.04 26.54
Bihar 19.40 24.95 26.93 31.64 20.37 25.75
Jharkhand 27.69 29.96 32.64 42.06 28.55 31.45
Orissa 21.37 27.46 48.77 57.34 26.72 33.22
West Bengal 18.41 22.32 21.52 28.20 19.63 24.43
Madhya Pradesh 18.88 24.65 27.38 35.99 20.40 26.37
Chhattisgarh 36.99 37.86 77.75 98.36 41.90 46.44
Uttar Pradesh 20.28 23.82 36.29 40.14 22.29 25.89
Uttaranchal 37.06 39.99 47.70 50.56 38.62 41.46
Gujarat 22.18 27.75 21.11 23.83 21.88 26.54
Maharashtra 23.53 29.33 8.37 15.18 16.01 22.27
Andhra Pradesh 23.07 27.90 26.11 36.57 23.78 29.52
Karnataka 18.77 23.74 19.06 19.32 18.83 22.60
Kerala 23.51 28.63 36.45 43.63 25.37 31.07
Tamil Nadu 23.48 28.43 23.68 34.54 23.52 29.59
All India 21.98 26.70 20.54 27.36 21.54 26.89
Source: Basic Statistical Returns of Scheduled Commercial Banks in India, Various Issues
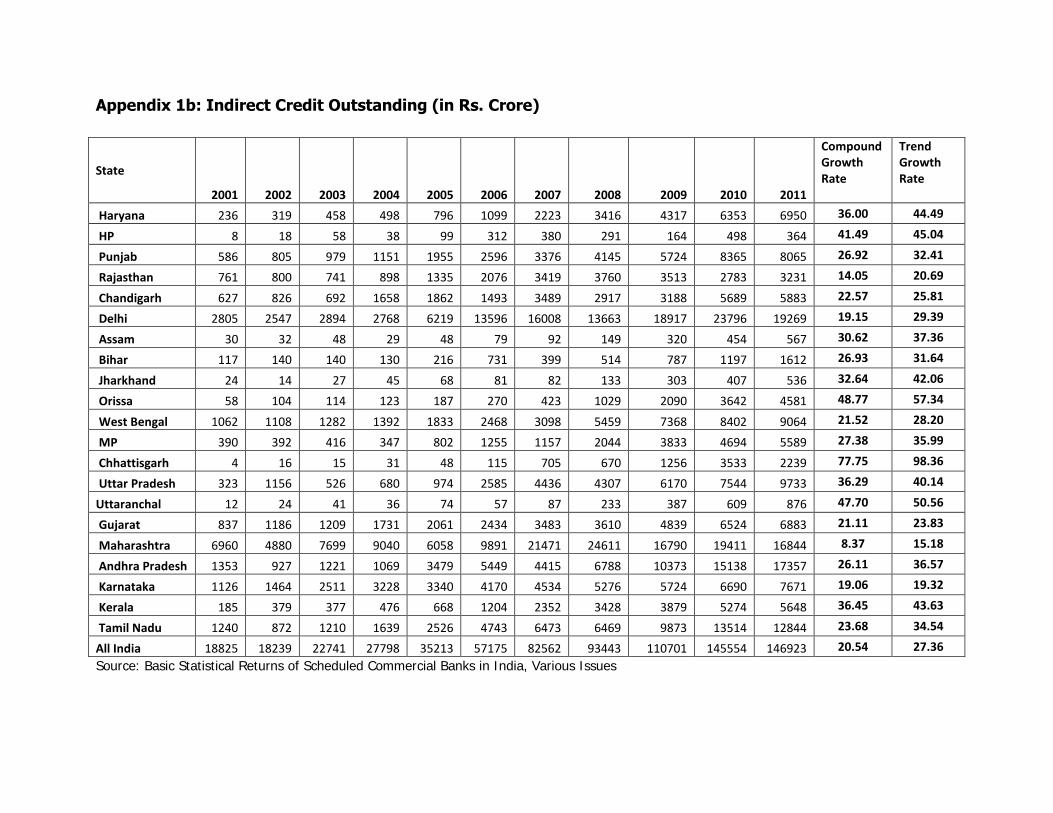
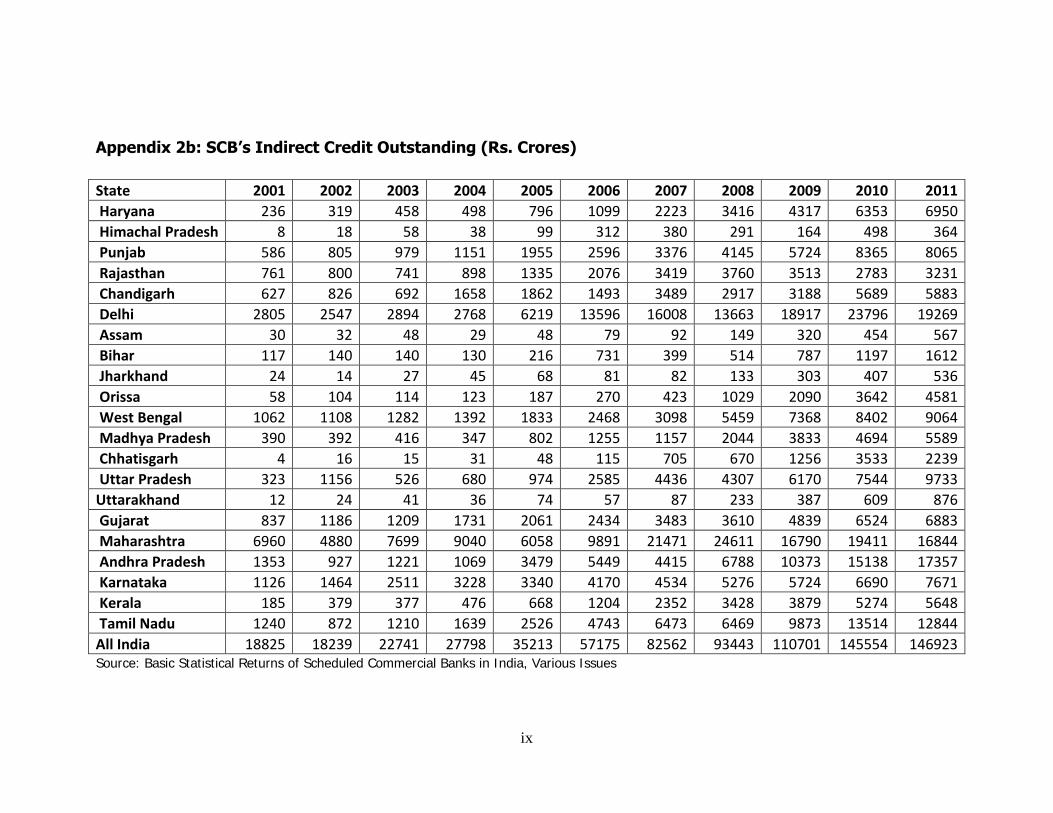
The increase in indirect credit over this period has been close to 100 percent in
Chhattisgarh but not as high in Uttaranchal and Jharkhand, which were created in the
same year. The growth rate of indirect credit in Kerala, Uttar Pradesh, Himachal
Pradesh and Haryana has been more than 40 percent in these years. It is noticed that
there is a sharp jump in indirect credit outstanding for most states since 2006, almost
doubling in some cases.
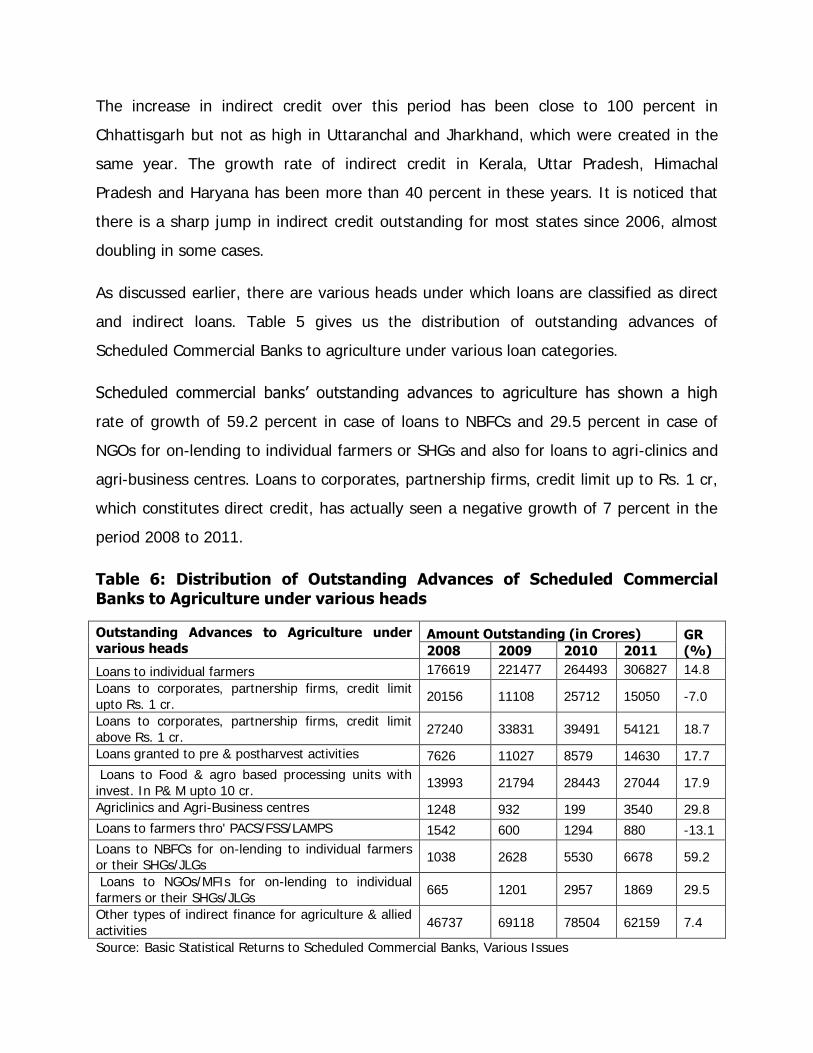
As discussed earlier, there are various heads under which loans are classified as direct
and indirect loans. Table 5 gives us the distribution of outstanding advances of
Scheduled Commercial Banks to agriculture under various loan categories.
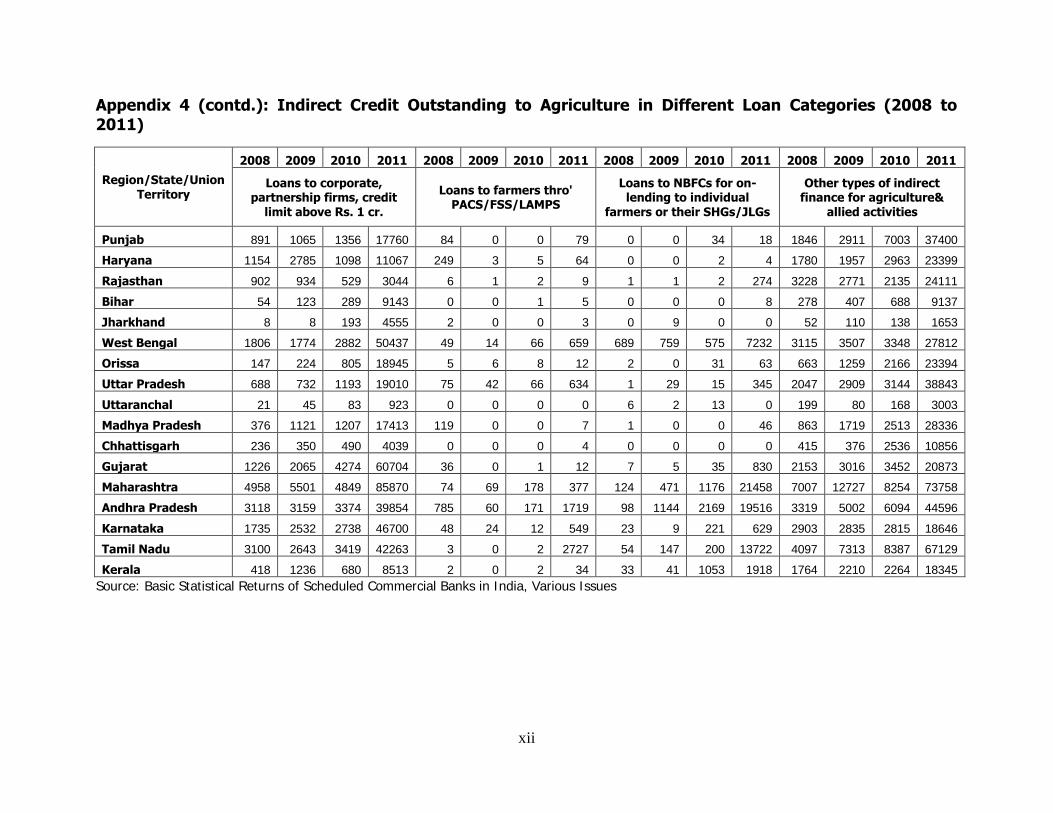
Scheduled commercial banks’ outstanding advances to agriculture has shown a high
rate of growth of 59.2 percent in case of loans to NBFCs and 29.5 percent in case of
NGOs for on-lending to individual farmers or SHGs and also for loans to agri-clinics and
agri-business centres. Loans to corporates, partnership firms, credit limit up to Rs. 1 cr,
which constitutes direct credit, has actually seen a negative growth of 7 percent in the
period 2008 to 2011.
Table 6: Distribution of Outstanding Advances of Scheduled Commercial
Banks to Agriculture under various heads
Outstanding Advances to Agriculture under various heads
Amount Outstanding (in Crores) GR
(%) 2008 2009 2010 2011
Loans to individual farmers 176619 221477 264493 306827 14.8
Loans to corporates, partnership firms, credit limit upto Rs. 1 cr.
20156 11108 25712 15050 -7.0
Loans to corporates, partnership firms, credit limit
above Rs. 1 cr. 27240 33831 39491 54121 18.7
Loans granted to pre & postharvest activities 7626 11027 8579 14630 17.7
Loans to Food & agro based processing units with
invest. In P& M upto 10 cr. 13993 21794 28443 27044 17.9
Agriclinics and Agri-Business centres 1248 932 199 3540 29.8
Loans to farmers thro' PACS/FSS/LAMPS 1542 600 1294 880 -13.1
Loans to NBFCs for on-lending to individual farmers or their SHGs/JLGs
1038 2628 5530 6678 59.2
Loans to NGOs/MFIs for on-lending to individual
farmers or their SHGs/JLGs 665 1201 2957 1869 29.5
Other types of indirect finance for agriculture & allied
activities 46737 69118 78504 62159 7.4
Source: Basic Statistical Returns to Scheduled Commercial Banks, Various Issues
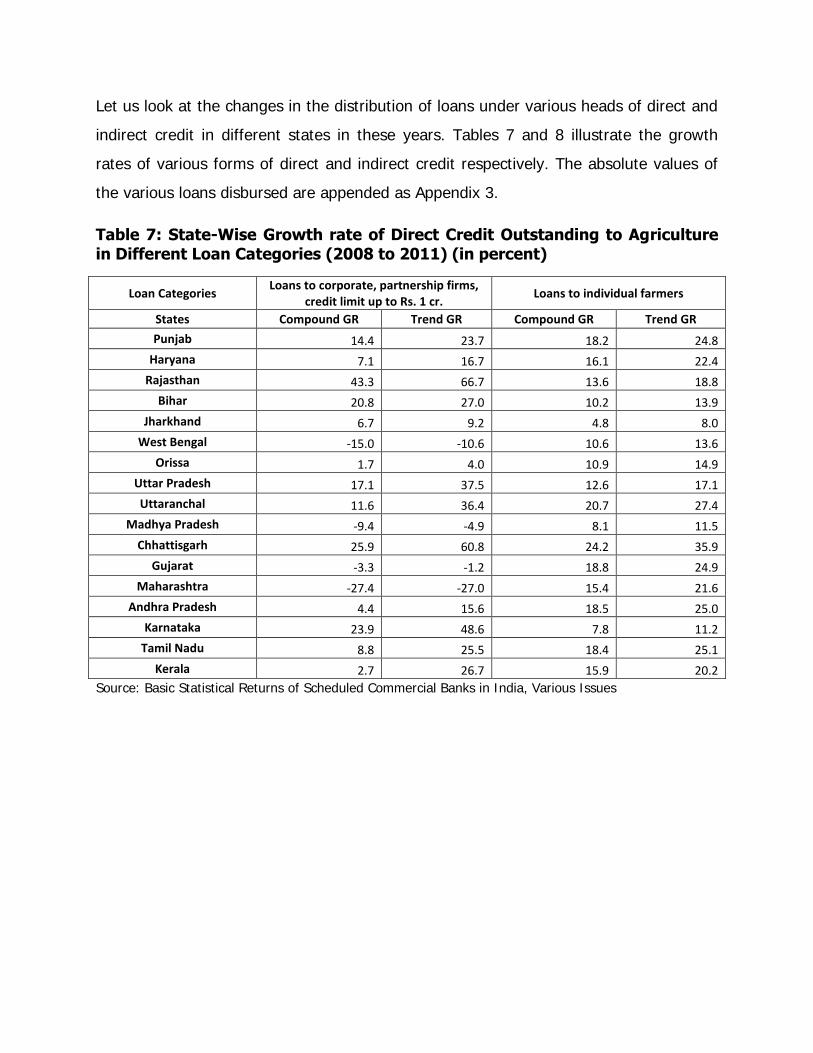
Let us look at the changes in the distribution of loans under various heads of direct and
indirect credit in different states in these years. Tables 7 and 8 illustrate the growth
rates of various forms of direct and indirect credit respectively. The absolute values of
the various loans disbursed are appended as Appendix 3.
Table 7: State-Wise Growth rate of Direct Credit Outstanding to Agriculture in Different Loan Categories (2008 to 2011) (in percent)
Loan Categories Loans to corporate, partnership firms,
credit limit up to Rs. 1 cr. Loans to individual farmers
States Compound GR Trend GR Compound GR Trend GR
Punjab 14.4 23.7 18.2 24.8
Haryana 7.1 16.7 16.1 22.4
Rajasthan 43.3 66.7 13.6 18.8
Bihar 20.8 27.0 10.2 13.9
Jharkhand 6.7 9.2 4.8 8.0
West Bengal -15.0 -10.6 10.6 13.6
Orissa 1.7 4.0 10.9 14.9
Uttar Pradesh 17.1 37.5 12.6 17.1
Uttaranchal 11.6 36.4 20.7 27.4
Madhya Pradesh -9.4 -4.9 8.1 11.5
Chhattisgarh 25.9 60.8 24.2 35.9
Gujarat -3.3 -1.2 18.8 24.9
Maharashtra -27.4 -27.0 15.4 21.6
Andhra Pradesh 4.4 15.6 18.5 25.0
Karnataka 23.9 48.6 7.8 11.2
Tamil Nadu 8.8 25.5 18.4 25.1
Kerala 2.7 26.7 15.9 20.2
Source: Basic Statistical Returns of Scheduled Commercial Banks in India, Various Issues
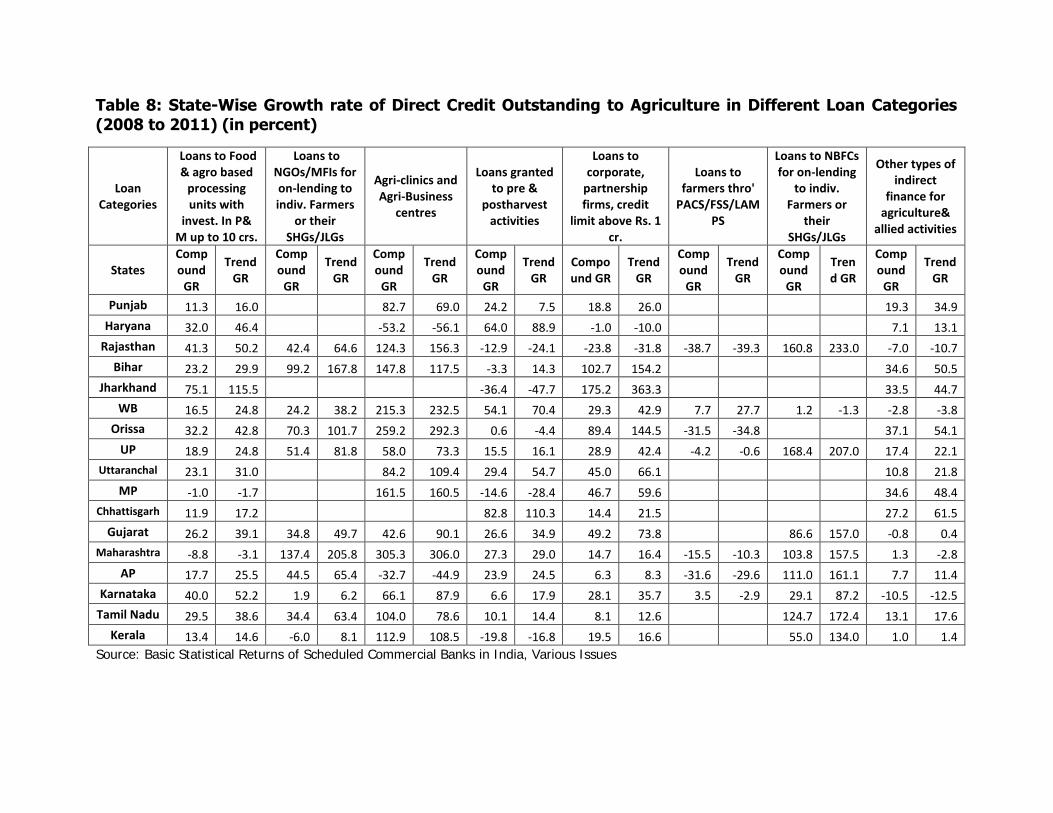
Table 8: State-Wise Growth rate of Direct Credit Outstanding to Agriculture in Different Loan Categories
(2008 to 2011) (in percent)
Loan Categories
Loans to Food & agro based
processing units with
invest. In P& M up to 10 crs.
Loans to NGOs/MFIs for on-lending to indiv. Farmers
or their SHGs/JLGs
Agri-clinics and Agri-Business
centres
Loans granted to pre &
postharvest activities
Loans to corporate,
partnership firms, credit
limit above Rs. 1 cr.
Loans to farmers thro'
PACS/FSS/LAMPS
Loans to NBFCs for on-lending
to indiv. Farmers or
their SHGs/JLGs
Other types of indirect
finance for agriculture&
allied activities
States Compound
GR
Trend GR
Compound
GR
Trend GR
Compound
GR
Trend GR
Compound
GR
Trend GR
Compound GR
Trend GR
Compound
GR
Trend GR
Compound
GR
Trend GR
Compound
GR
Trend GR
Punjab 11.3 16.0 82.7 69.0 24.2 7.5 18.8 26.0
19.3 34.9
Haryana 32.0 46.4 -53.2 -56.1 64.0 88.9 -1.0 -10.0
7.1 13.1
Rajasthan 41.3 50.2 42.4 64.6 124.3 156.3 -12.9 -24.1 -23.8 -31.8 -38.7 -39.3 160.8 233.0 -7.0 -10.7
Bihar 23.2 29.9 99.2 167.8 147.8 117.5 -3.3 14.3 102.7 154.2 34.6 50.5
Jharkhand 75.1 115.5 -36.4 -47.7 175.2 363.3
33.5 44.7
WB 16.5 24.8 24.2 38.2 215.3 232.5 54.1 70.4 29.3 42.9 7.7 27.7 1.2 -1.3 -2.8 -3.8
Orissa 32.2 42.8 70.3 101.7 259.2 292.3 0.6 -4.4 89.4 144.5 -31.5 -34.8
37.1 54.1
UP 18.9 24.8 51.4 81.8 58.0 73.3 15.5 16.1 28.9 42.4 -4.2 -0.6 168.4 207.0 17.4 22.1
Uttaranchal 23.1 31.0 84.2 109.4 29.4 54.7 45.0 66.1 10.8 21.8
MP -1.0 -1.7
161.5 160.5 -14.6 -28.4 46.7 59.6
34.6 48.4
Chhattisgarh 11.9 17.2 82.8 110.3 14.4 21.5 27.2 61.5
Gujarat 26.2 39.1 34.8 49.7 42.6 90.1 26.6 34.9 49.2 73.8
86.6 157.0 -0.8 0.4
Maharashtra -8.8 -3.1 137.4 205.8 305.3 306.0 27.3 29.0 14.7 16.4 -15.5 -10.3 103.8 157.5 1.3 -2.8
AP 17.7 25.5 44.5 65.4 -32.7 -44.9 23.9 24.5 6.3 8.3 -31.6 -29.6 111.0 161.1 7.7 11.4
Karnataka 40.0 52.2 1.9 6.2 66.1 87.9 6.6 17.9 28.1 35.7 3.5 -2.9 29.1 87.2 -10.5 -12.5
Tamil Nadu 29.5 38.6 34.4 63.4 104.0 78.6 10.1 14.4 8.1 12.6
124.7 172.4 13.1 17.6
Kerala 13.4 14.6 -6.0 8.1 112.9 108.5 -19.8 -16.8 19.5 16.6
55.0 134.0 1.0 1.4
Source: Basic Statistical Returns of Scheduled Commercial Banks in India, Various Issues
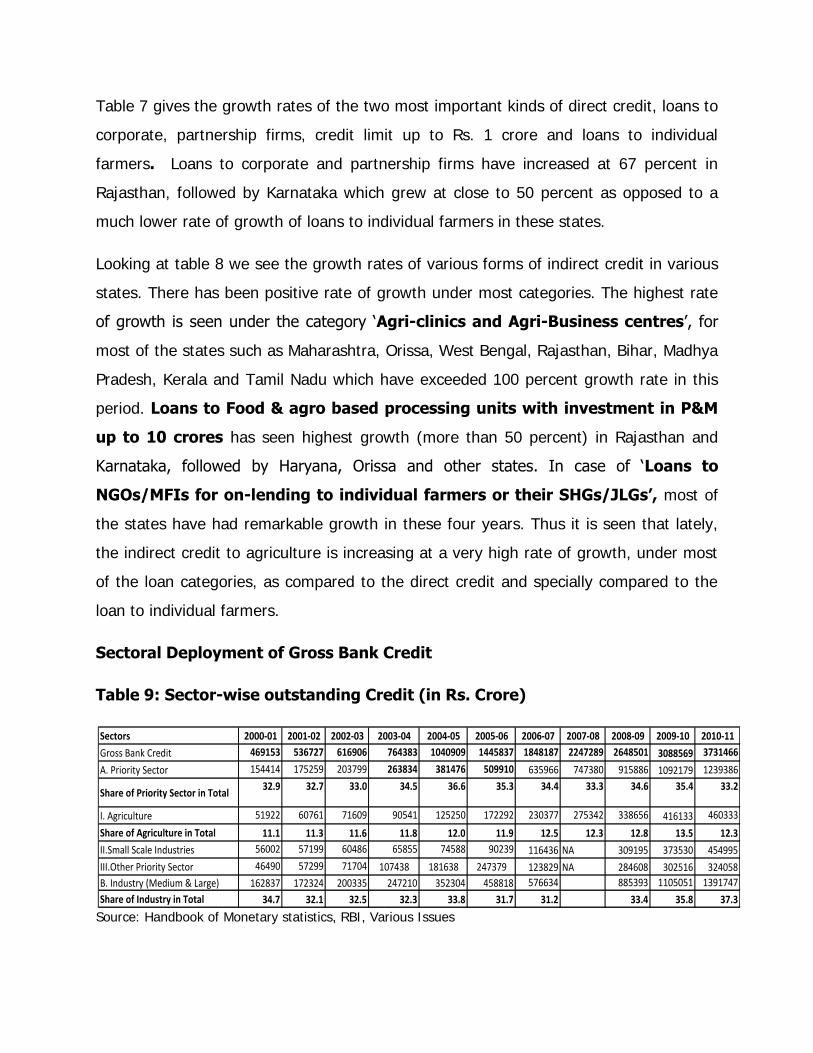
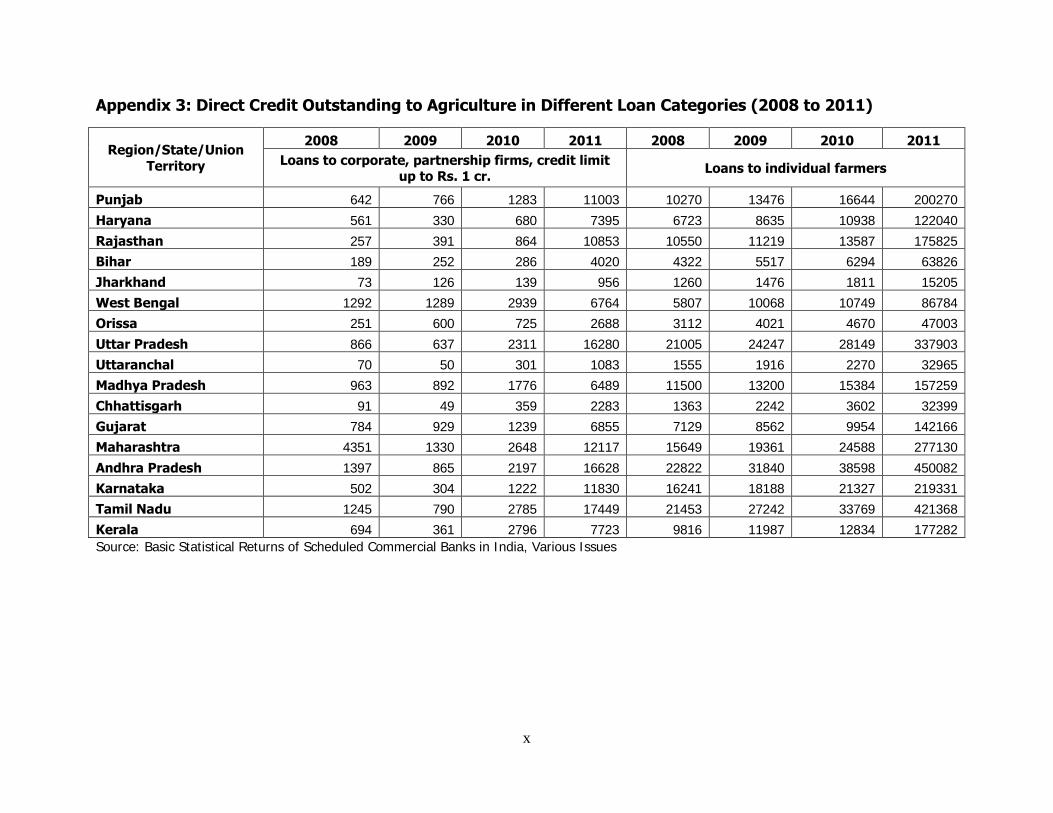
Table 7 gives the growth rates of the two most important kinds of direct credit, loans to
corporate, partnership firms, credit limit up to Rs. 1 crore and loans to individual
farmers. Loans to corporate and partnership firms have increased at 67 percent in
Rajasthan, followed by Karnataka which grew at close to 50 percent as opposed to a
much lower rate of growth of loans to individual farmers in these states.
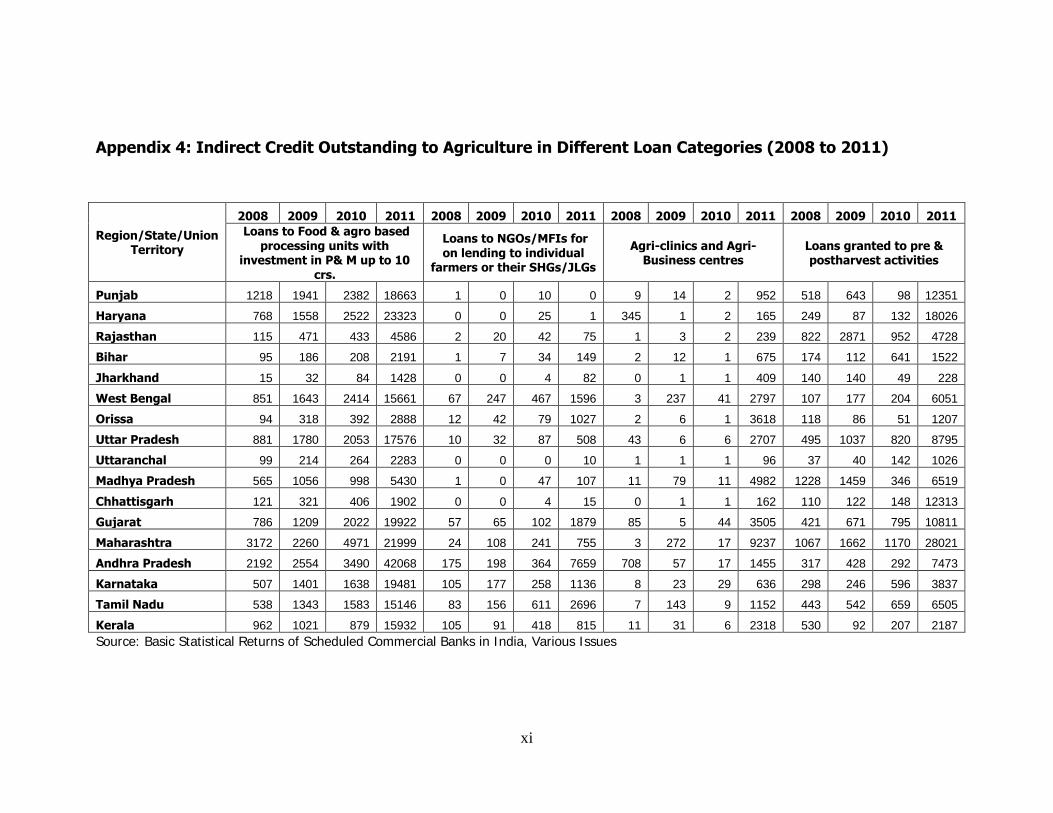
Looking at table 8 we see the growth rates of various forms of indirect credit in various
states. There has been positive rate of growth under most categories. The highest rate
of growth is seen under the category ‘Agri-clinics and Agri-Business centres’, for
most of the states such as Maharashtra, Orissa, West Bengal, Rajasthan, Bihar, Madhya
Pradesh, Kerala and Tamil Nadu which have exceeded 100 percent growth rate in this
period. Loans to Food & agro based processing units with investment in P&M
up to 10 crores has seen highest growth (more than 50 percent) in Rajasthan and
Karnataka, followed by Haryana, Orissa and other states. In case of ‘Loans to
NGOs/MFIs for on-lending to individual farmers or their SHGs/JLGs’, most of
the states have had remarkable growth in these four years. Thus it is seen that lately,
the indirect credit to agriculture is increasing at a very high rate of growth, under most
of the loan categories, as compared to the direct credit and specially compared to the
loan to individual farmers.
Sectoral Deployment of Gross Bank Credit
Table 9: Sector-wise outstanding Credit (in Rs. Crore)
Source: Handbook of Monetary statistics, RBI, Various Issues
Sectors 2000-01 2001-02 2002-03 2003-04 2004-05 2005-06 2006-07 2007-08 2008-09 2009-10 2010-11
Gross Bank Credit 469153 536727 616906 764383 1040909 1445837 1848187 2247289 2648501 3088569 3731466
A. Priority Sector 154414 175259 203799 263834 381476 509910 635966 747380 915886 1092179 1239386
Share of Priority Sector in Total32.9 32.7 33.0 34.5 36.6 35.3 34.4 33.3 34.6 35.4 33.2
I. Agriculture 51922 60761 71609 90541 125250 172292 230377 275342 338656 416133 460333
Share of Agriculture in Total 11.1 11.3 11.6 11.8 12.0 11.9 12.5 12.3 12.8 13.5 12.3
II.Small Scale Industries 56002 57199 60486 65855 74588 90239 116436 NA 309195 373530 454995
III.Other Priority Sector 46490 57299 71704 107438 181638 247379 123829 NA 284608 302516 324058
B. Industry (Medium & Large) 162837 172324 200335 247210 352304 458818 576634 885393 1105051 1391747
Share of Industry in Total 34.7 32.1 32.5 32.3 33.8 31.7 31.2 33.4 35.8 37.3
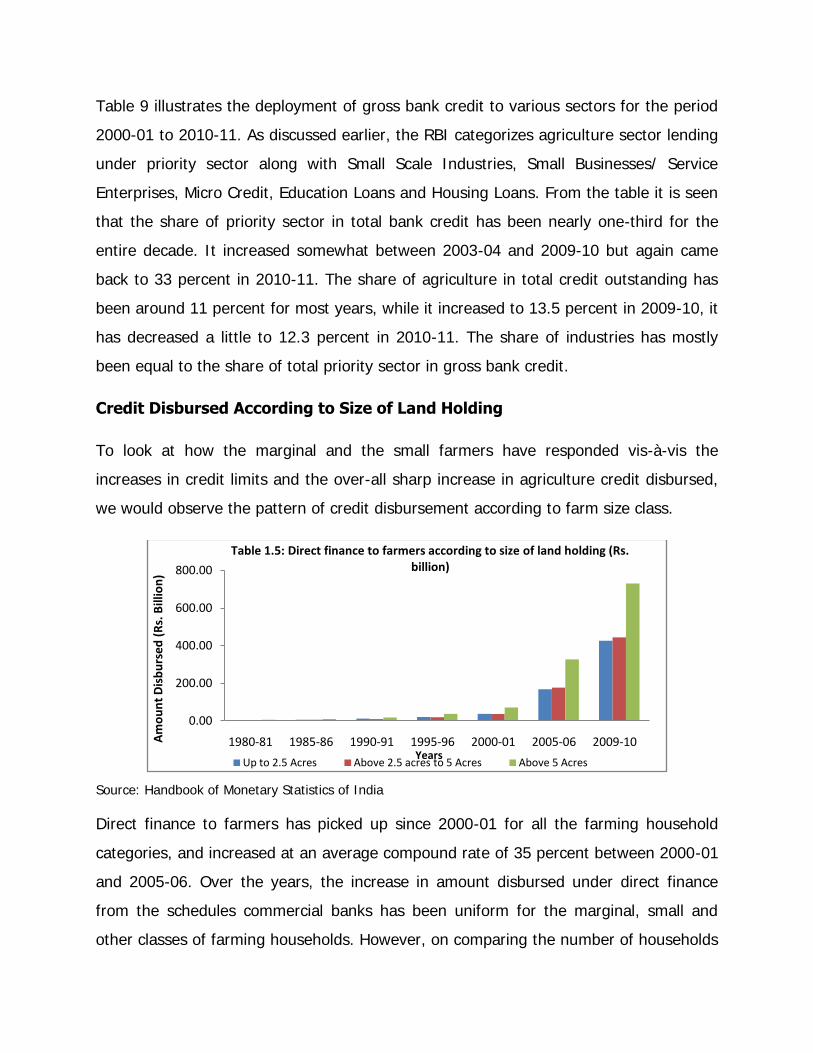
Table 9 illustrates the deployment of gross bank credit to various sectors for the period
2000-01 to 2010-11. As discussed earlier, the RBI categorizes agriculture sector lending
under priority sector along with Small Scale Industries, Small Businesses/ Service
Enterprises, Micro Credit, Education Loans and Housing Loans. From the table it is seen
that the share of priority sector in total bank credit has been nearly one-third for the
entire decade. It increased somewhat between 2003-04 and 2009-10 but again came
back to 33 percent in 2010-11. The share of agriculture in total credit outstanding has
been around 11 percent for most years, while it increased to 13.5 percent in 2009-10, it
has decreased a little to 12.3 percent in 2010-11. The share of industries has mostly
been equal to the share of total priority sector in gross bank credit.
Credit Disbursed According to Size of Land Holding
To look at how the marginal and the small farmers have responded vis-à-vis the
increases in credit limits and the over-all sharp increase in agriculture credit disbursed,
we would observe the pattern of credit disbursement according to farm size class.
Source: Handbook of Monetary Statistics of India
Direct finance to farmers has picked up since 2000-01 for all the farming household
categories, and increased at an average compound rate of 35 percent between 2000-01
and 2005-06. Over the years, the increase in amount disbursed under direct finance
from the schedules commercial banks has been uniform for the marginal, small and
other classes of farming households. However, on comparing the number of households
0.00
200.00
400.00
600.00
800.00
1980-81 1985-86 1990-91 1995-96 2000-01 2005-06 2009-10 Am
ou
nt
Dis
bu
rse
d (
Rs.
Bill
ion
)
Years
Table 1.5: Direct finance to farmers according to size of land holding (Rs. billion)
Up to 2.5 Acres Above 2.5 acres to 5 Acres Above 5 Acres
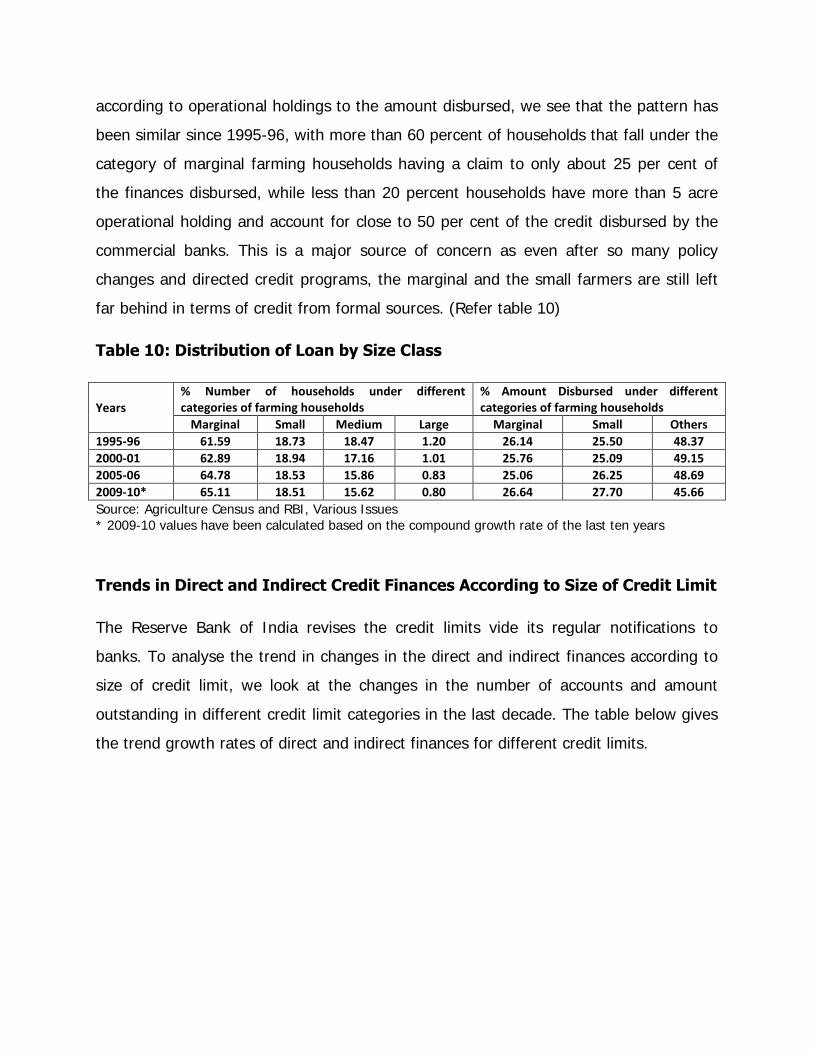
according to operational holdings to the amount disbursed, we see that the pattern has
been similar since 1995-96, with more than 60 percent of households that fall under the
category of marginal farming households having a claim to only about 25 per cent of
the finances disbursed, while less than 20 percent households have more than 5 acre
operational holding and account for close to 50 per cent of the credit disbursed by the
commercial banks. This is a major source of concern as even after so many policy
changes and directed credit programs, the marginal and the small farmers are still left
far behind in terms of credit from formal sources. (Refer table 10)
Table 10: Distribution of Loan by Size Class
Years
% Number of households under different categories of farming households
% Amount Disbursed under different categories of farming households
Marginal Small Medium Large Marginal Small Others
1995-96 61.59 18.73 18.47 1.20 26.14 25.50 48.37
2000-01 62.89 18.94 17.16 1.01 25.76 25.09 49.15
2005-06 64.78 18.53 15.86 0.83 25.06 26.25 48.69
2009-10* 65.11 18.51 15.62 0.80 26.64 27.70 45.66
Source: Agriculture Census and RBI, Various Issues
* 2009-10 values have been calculated based on the compound growth rate of the last ten years
Trends in Direct and Indirect Credit Finances According to Size of Credit Limit
The Reserve Bank of India revises the credit limits vide its regular notifications to
banks. To analyse the trend in changes in the direct and indirect finances according to
size of credit limit, we look at the changes in the number of accounts and amount
outstanding in different credit limit categories in the last decade. The table below gives
the trend growth rates of direct and indirect finances for different credit limits.
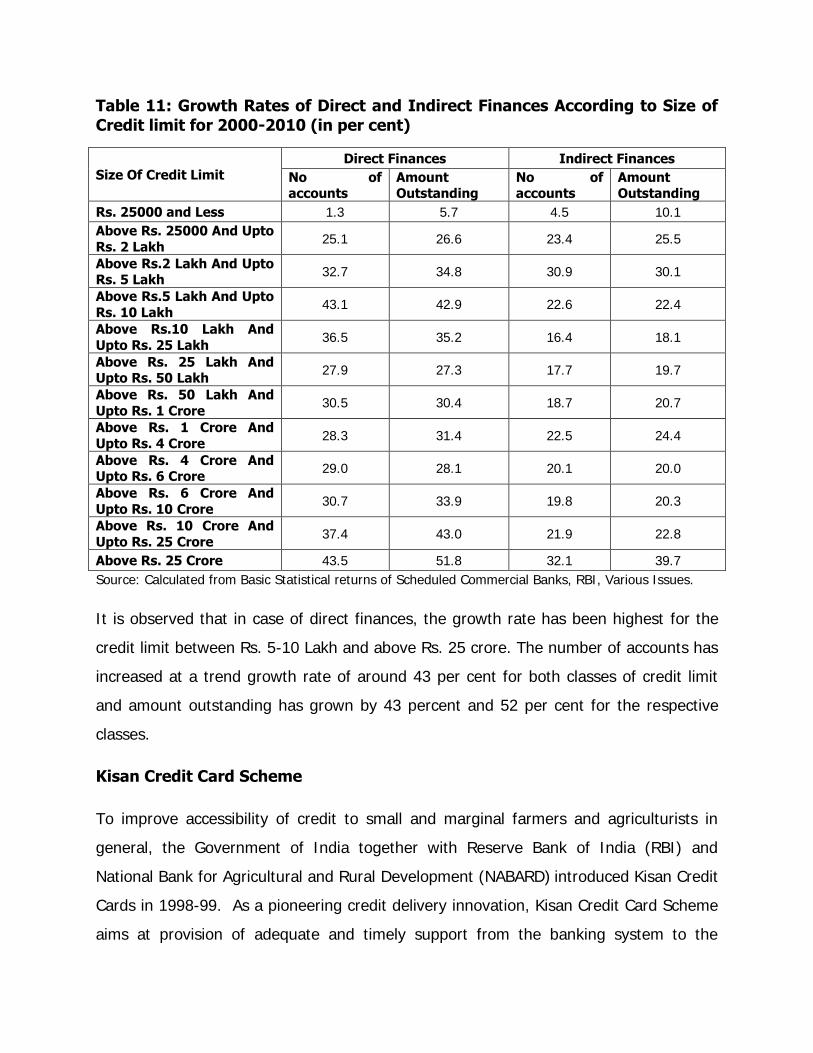
Table 11: Growth Rates of Direct and Indirect Finances According to Size of
Credit limit for 2000-2010 (in per cent)
Size Of Credit Limit
Direct Finances Indirect Finances
No of accounts
Amount Outstanding
No of accounts
Amount Outstanding
Rs. 25000 and Less 1.3 5.7 4.5 10.1
Above Rs. 25000 And Upto
Rs. 2 Lakh 25.1 26.6 23.4 25.5
Above Rs.2 Lakh And Upto Rs. 5 Lakh
32.7 34.8 30.9 30.1
Above Rs.5 Lakh And Upto
Rs. 10 Lakh 43.1 42.9 22.6 22.4
Above Rs.10 Lakh And
Upto Rs. 25 Lakh 36.5 35.2 16.4 18.1
Above Rs. 25 Lakh And Upto Rs. 50 Lakh
27.9 27.3 17.7 19.7
Above Rs. 50 Lakh And
Upto Rs. 1 Crore 30.5 30.4 18.7 20.7
Above Rs. 1 Crore And
Upto Rs. 4 Crore 28.3 31.4 22.5 24.4
Above Rs. 4 Crore And Upto Rs. 6 Crore
29.0 28.1 20.1 20.0
Above Rs. 6 Crore And
Upto Rs. 10 Crore 30.7 33.9 19.8 20.3
Above Rs. 10 Crore And
Upto Rs. 25 Crore 37.4 43.0 21.9 22.8
Above Rs. 25 Crore 43.5 51.8 32.1 39.7
Source: Calculated from Basic Statistical returns of Scheduled Commercial Banks, RBI, Various Issues.
It is observed that in case of direct finances, the growth rate has been highest for the
credit limit between Rs. 5-10 Lakh and above Rs. 25 crore. The number of accounts has
increased at a trend growth rate of around 43 per cent for both classes of credit limit
and amount outstanding has grown by 43 percent and 52 per cent for the respective
classes.
Kisan Credit Card Scheme
To improve accessibility of credit to small and marginal farmers and agriculturists in
general, the Government of India together with Reserve Bank of India (RBI) and
National Bank for Agricultural and Rural Development (NABARD) introduced Kisan Credit
Cards in 1998-99. As a pioneering credit delivery innovation, Kisan Credit Card Scheme
aims at provision of adequate and timely support from the banking system to the
farmers for their cultivation needs including purchase of inputs in a flexible and cost
effective manner. It is issued to farmers, on the basis of their land holdings, for uniform
adoption by banks, so that the farmers may use them to readily purchase agricultural
inputs such as seeds, fertilisers, pesticides, etc. and also draw cash for their production
needs.
Salient features of the Kisan Credit Card (KCC) Scheme
Eligible farmers to be provided with a Kisan Credit Card and a pass book or card-
cum-pass book.
Revolving cash credit facility involving any number of drawals and repayments
within the limit.
Limit to be fixed on the basis of operational land holding, cropping pattern and
scale of finance.
Entire production credit needs for full year plus ancillary activities related to crop
production to be considered while fixing limit.
Sub-limits to cover short term, medium term as well as term credit are fixed at
the discretion of banks.
Card valid for 3 to 5 years subject to annual review. As incentive for good
performance, credit limits could be enhanced to take care of increase in costs,
change in cropping pattern, etc.
Each drawal to be repaid within a maximum period of 12 months.
Conversion/re-schedulement of loans also permissible in case of damage to crops
due to natural calamities.
Security, margin, rate of interest, etc. as per RBI norms.
Operations may be through issuing branch (and also PACS in the case of
Cooperative Banks) through other designated branches at the discretion of bank.
Withdrawals through slips/cheques accompanied by card and passbook.
Crop loans disbursed under KCC Scheme for notified crops are covered under
Rashtriya Krishi Bima Yojna (National Crop Insurance Scheme), a crop insurance
scheme introduced at the behest of Government of India to protect the interest
of the farmer against loss of crop yield caused by natural calamities, pest attacks
etc.
In order to spread the KCC base and to popularize the KCC amongst the farming
community, KCC scheme was redesigned to make it Smart Card-cum-Debit Card and a
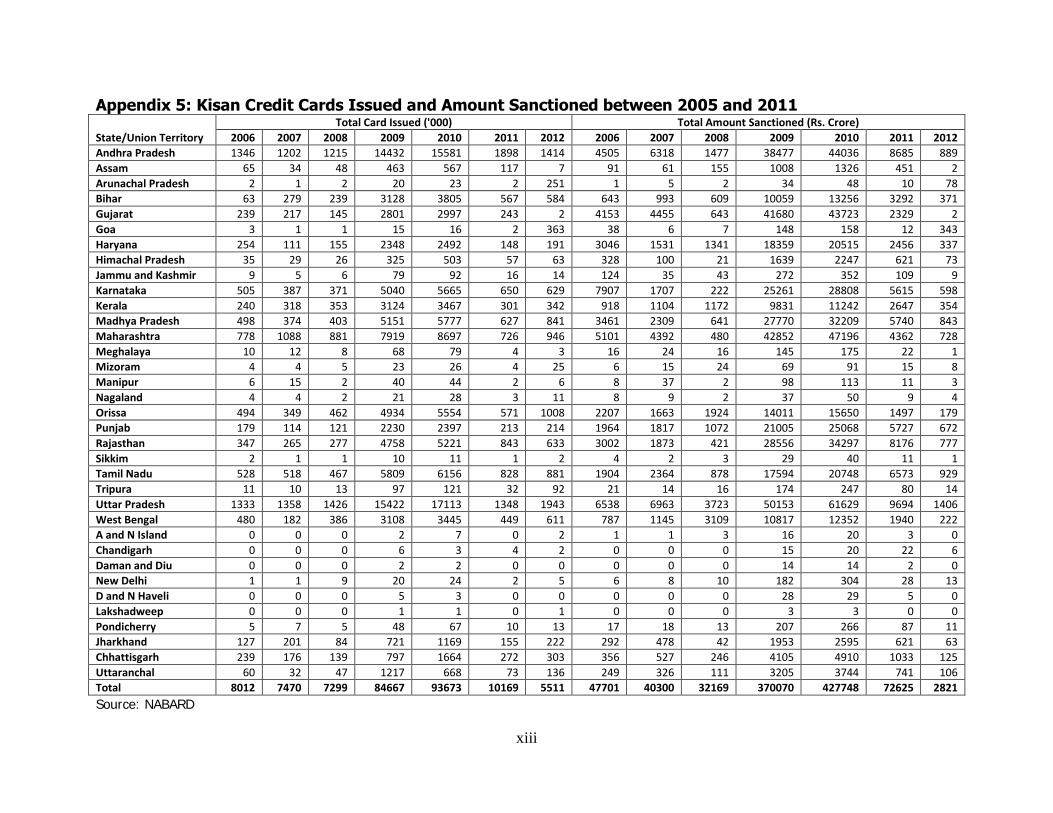
revised KCC scheme has been introduced in April 2012. According to NABARD, since
1998, around 11.56 crore Kisan Credit Cards have been issued up to 31 March 2012 by
Cooperative Banks, Regional Rural Banks and Commercial Banks put together. It is thus
important to look at the changes over the years and in different states and also the
distribution across various bank groups.
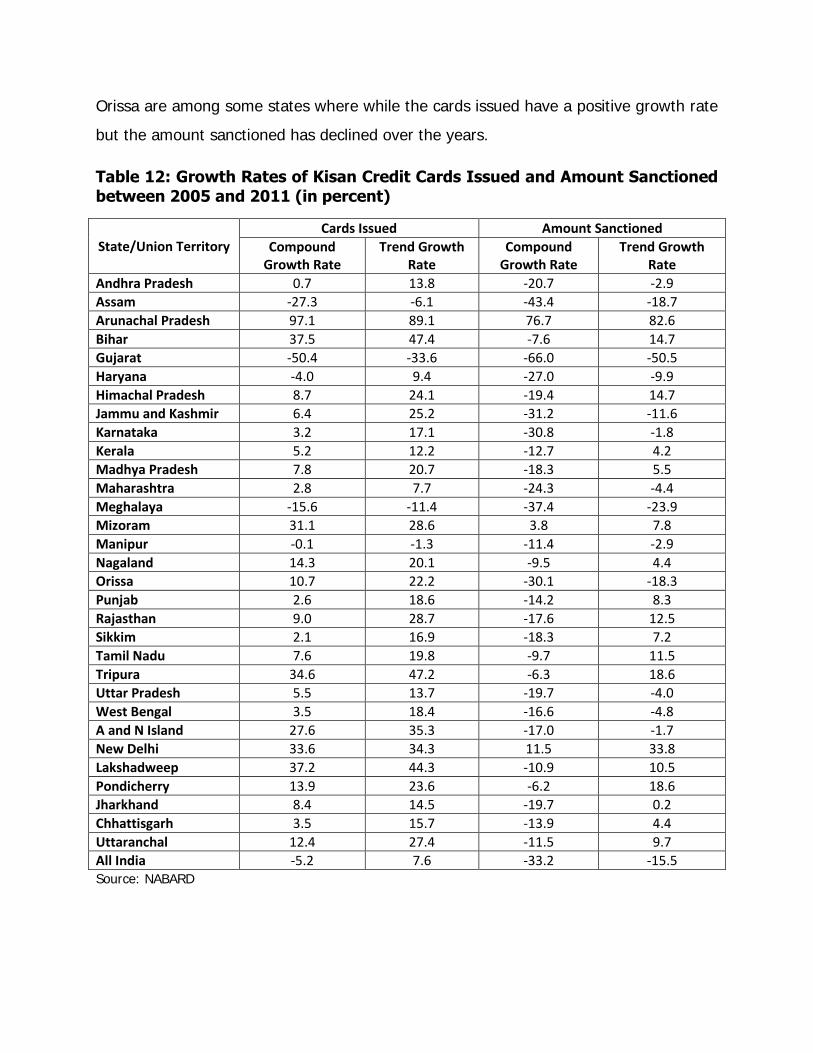
Table 12 gives the growth rates of the KCC issued and amounts sanctioned in different
states and union territories for the period 2005 to 2011. (Appendix 4 for absolute
figures). The All India figures show that the credit cards issued have increased at a
trend growth rate of only 7.6 percent in these seven years while the amount sanctioned
has decreased at a trend growth rate of 15 percent during this period. When we look at
the distribution across states, it is seen that among the states having high proportion of
area under agriculture, Bihar has the highest growth rate of cards issued followed by
Rajasthan and Madhya Pradesh. Gujarat has a negative trend growth rate of 33 percent
while New Delhi, which has a very small proportion of people dependent on agriculture,
saw a positive growth rate of 34 percent. It is to be probed as to who are the increased
KCC holders.
While the amount sanctioned has not increased at the same rate as the cards issued for
most of the states, it is interesting to look at New Delhi where amount sanctioned also
increased at a high rate of around 40 percent. Andhra Pradesh, Haryana, Karnataka and
Orissa are among some states where while the cards issued have a positive growth rate
but the amount sanctioned has declined over the years.
Table 12: Growth Rates of Kisan Credit Cards Issued and Amount Sanctioned
between 2005 and 2011 (in percent)
State/Union Territory Cards Issued Amount Sanctioned
Compound Growth Rate
Trend Growth Rate
Compound Growth Rate
Trend Growth Rate
Andhra Pradesh 0.7 13.8 -20.7 -2.9 Assam -27.3 -6.1 -43.4 -18.7 Arunachal Pradesh 97.1 89.1 76.7 82.6 Bihar 37.5 47.4 -7.6 14.7 Gujarat -50.4 -33.6 -66.0 -50.5 Haryana -4.0 9.4 -27.0 -9.9 Himachal Pradesh 8.7 24.1 -19.4 14.7 Jammu and Kashmir 6.4 25.2 -31.2 -11.6 Karnataka 3.2 17.1 -30.8 -1.8 Kerala 5.2 12.2 -12.7 4.2 Madhya Pradesh 7.8 20.7 -18.3 5.5 Maharashtra 2.8 7.7 -24.3 -4.4 Meghalaya -15.6 -11.4 -37.4 -23.9 Mizoram 31.1 28.6 3.8 7.8 Manipur -0.1 -1.3 -11.4 -2.9 Nagaland 14.3 20.1 -9.5 4.4 Orissa 10.7 22.2 -30.1 -18.3 Punjab 2.6 18.6 -14.2 8.3 Rajasthan 9.0 28.7 -17.6 12.5 Sikkim 2.1 16.9 -18.3 7.2 Tamil Nadu 7.6 19.8 -9.7 11.5 Tripura 34.6 47.2 -6.3 18.6 Uttar Pradesh 5.5 13.7 -19.7 -4.0 West Bengal 3.5 18.4 -16.6 -4.8 A and N Island 27.6 35.3 -17.0 -1.7 New Delhi 33.6 34.3 11.5 33.8 Lakshadweep 37.2 44.3 -10.9 10.5 Pondicherry 13.9 23.6 -6.2 18.6 Jharkhand 8.4 14.5 -19.7 0.2 Chhattisgarh 3.5 15.7 -13.9 4.4 Uttaranchal 12.4 27.4 -11.5 9.7 All India -5.2 7.6 -33.2 -15.5 Source: NABARD
It is evident from the discussion above that the total credit flow to agriculture has
increased leaps and bounds in the last decade. The first thought that comes to mind on
seeing increased agricultural credit is that small and marginal farmers must be better
off with the growing availability of credit to agriculture sector. But on looking at the
break-up of total agriculture credit between direct agriculture credit and indirect
agriculture credit we see that the beneficiaries have not actually been the small and
marginal farmers but the larger agriculturists doing agri-business etc. Moreover the
dependence on money lenders has not shown any decrease despite the greater
availability and accessibility of agriculture credit.
We would now look at some field data from Maharashtra and Punjab to see the
accessibility and availability of credit from the farmer’s perspective.

III. PRIMARY SURVEY ANALYSIS
For the purpose of the study, a detailed primary survey was done in two districts each
in the states Punjab and Maharashtra. Ludhiana and Sangrur in Punjab and Yavatmal
and Buldhana in Maharashtra were purposively chosen due to high incidence of credit
related farm distress and farmer suicides. 100 farming households were surveyed from
a cluster of five villages in each of the four tehsils/ blocks, viz., Pakhowal in Ludhiana,
Lehragaga in Sangrur, Pusad in Yavatmal and Buldhana in Buldhana. The distribution of
sample households was as follows:
Table 13: Distribution of Sample Households and Average Annual Income for
Different Land Classes
State District Land Class No. of Households Avg Annual Income (Rs.)
Maharashtra
Buldhana
Large 1 920000
Medium 30 230433
Small 69 109623
Buldhana Total 100 153970
Yavatmal
Large 1 250000
Medium 41 96585
Small 59 55025
Yavatmal Total 100 73827
Maharashtra Average 200 113898
Punjab
Ludhiana
Landless 9 305089
Large 3 1961667
Medium 37 548352
Small 51 350703
Ludhiana Total 100 468057
Sangrur
Large 6 1219333
Medium 41 548197
Small 53 202236
Sangrur Total 100 405106
Punjab Average 200 436581
Source: Primary Survey
The number of households in each land class was chosen as a proportion of the actual
distribution of households in each of the villages. The average annual income includes
income of the household from crop cultivation, livestock rearing, fisheries, hiring out
labour/ agricultural machinery and implements, renting out land as well as lending
money. It was observed that many small farmers substituted their income from crop
cultivation by hiring out land and also by working as wage labourers. On an average 80
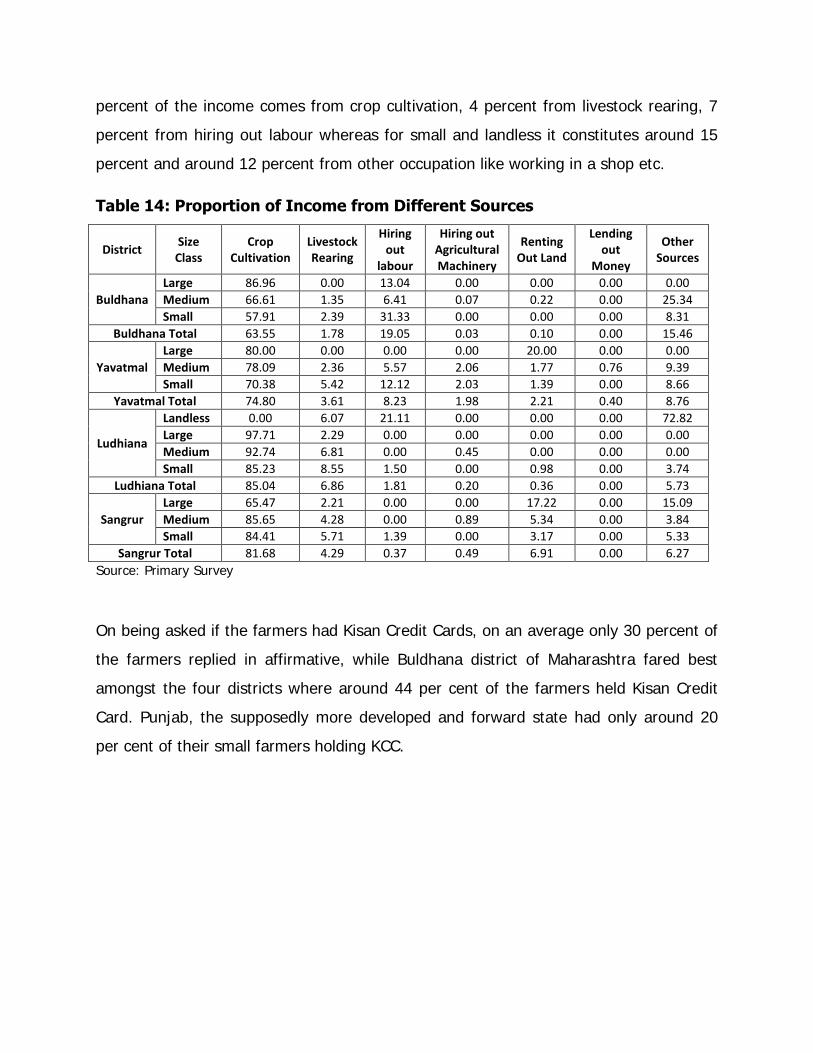
percent of the income comes from crop cultivation, 4 percent from livestock rearing, 7
percent from hiring out labour whereas for small and landless it constitutes around 15
percent and around 12 percent from other occupation like working in a shop etc.
Table 14: Proportion of Income from Different Sources
District Size
Class Crop
Cultivation Livestock Rearing
Hiring out
labour
Hiring out Agricultural Machinery
Renting Out Land
Lending out
Money
Other Sources
Buldhana
Large 86.96 0.00 13.04 0.00 0.00 0.00 0.00
Medium 66.61 1.35 6.41 0.07 0.22 0.00 25.34
Small 57.91 2.39 31.33 0.00 0.00 0.00 8.31
Buldhana Total 63.55 1.78 19.05 0.03 0.10 0.00 15.46
Yavatmal
Large 80.00 0.00 0.00 0.00 20.00 0.00 0.00
Medium 78.09 2.36 5.57 2.06 1.77 0.76 9.39
Small 70.38 5.42 12.12 2.03 1.39 0.00 8.66
Yavatmal Total 74.80 3.61 8.23 1.98 2.21 0.40 8.76
Ludhiana
Landless 0.00 6.07 21.11 0.00 0.00 0.00 72.82
Large 97.71 2.29 0.00 0.00 0.00 0.00 0.00
Medium 92.74 6.81 0.00 0.45 0.00 0.00 0.00
Small 85.23 8.55 1.50 0.00 0.98 0.00 3.74
Ludhiana Total 85.04 6.86 1.81 0.20 0.36 0.00 5.73
Sangrur
Large 65.47 2.21 0.00 0.00 17.22 0.00 15.09
Medium 85.65 4.28 0.00 0.89 5.34 0.00 3.84
Small 84.41 5.71 1.39 0.00 3.17 0.00 5.33
Sangrur Total 81.68 4.29 0.37 0.49 6.91 0.00 6.27
Source: Primary Survey
On being asked if the farmers had Kisan Credit Cards, on an average only 30 percent of
the farmers replied in affirmative, while Buldhana district of Maharashtra fared best
amongst the four districts where around 44 per cent of the farmers held Kisan Credit
Card. Punjab, the supposedly more developed and forward state had only around 20
per cent of their small farmers holding KCC.
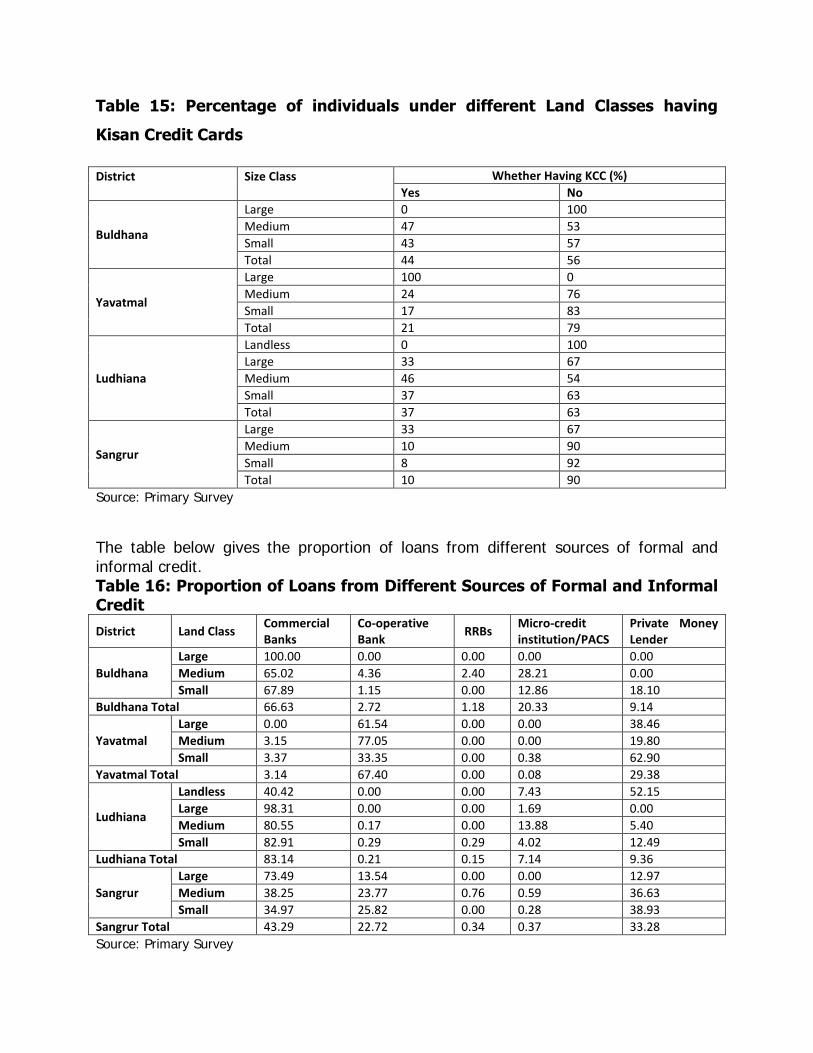
Table 15: Percentage of individuals under different Land Classes having
Kisan Credit Cards
District
Size Class
Whether Having KCC (%)
Yes No
Buldhana
Large 0 100
Medium 47 53
Small 43 57
Total 44 56
Yavatmal
Large 100 0
Medium 24 76
Small 17 83
Total 21 79
Ludhiana
Landless 0 100
Large 33 67
Medium 46 54
Small 37 63
Total 37 63
Sangrur
Large 33 67
Medium 10 90
Small 8 92
Total 10 90
Source: Primary Survey
The table below gives the proportion of loans from different sources of formal and informal credit. Table 16: Proportion of Loans from Different Sources of Formal and Informal Credit
District Land Class Commercial Banks
Co-operative Bank
RRBs Micro-credit institution/PACS
Private Money Lender
Buldhana
Large 100.00 0.00 0.00 0.00 0.00
Medium 65.02 4.36 2.40 28.21 0.00
Small 67.89 1.15 0.00 12.86 18.10
Buldhana Total 66.63 2.72 1.18 20.33 9.14
Yavatmal
Large 0.00 61.54 0.00 0.00 38.46
Medium 3.15 77.05 0.00 0.00 19.80
Small 3.37 33.35 0.00 0.38 62.90
Yavatmal Total 3.14 67.40 0.00 0.08 29.38
Ludhiana
Landless 40.42 0.00 0.00 7.43 52.15
Large 98.31 0.00 0.00 1.69 0.00
Medium 80.55 0.17 0.00 13.88 5.40
Small 82.91 0.29 0.29 4.02 12.49
Ludhiana Total 83.14 0.21 0.15 7.14 9.36
Sangrur
Large 73.49 13.54 0.00 0.00 12.97
Medium 38.25 23.77 0.76 0.59 36.63
Small 34.97 25.82 0.00 0.28 38.93
Sangrur Total 43.29 22.72 0.34 0.37 33.28
Source: Primary Survey
In the course of the primary field analysis it was observed that loans from institutional
sources like commercial banks, co-operatives etc have not been able to replace the
existence of money lenders. Though it was seen that an average of 86 percent of the
farmers surveyed in Maharashtra and 90 percent surveyed in Punjab had applied for
loan from a financial institution and 99 percent of the applications were successful, But
it was noted that it has only become an additional source of credit along with the
traditional sources like Arhtias, friends and relatives, money lenders. Money lenders
serve as easy and comfortable source of credit to farmers especially marginal and small
farmers, due to its easy access and very often non-requirement of collateral. Around 40
per cent of the total loan taken by landless and small farmers came from non-
institutional sources, that is, from money-lenders. This observation corroborates with
the last AIDIS survey of year 2002 that dependence on money lenders is again
increasing and slowly reaching the 1951 level.
It was seen that a single farmer had taken loan from eight to ten sources including
banks, money lenders and family and friends, at the same time; as a single loan does
not help cover expenses of a single year activities. Since these money lenders are
generally from the same village and known to farmers, it is much easier to get loan
from them even if it means a much higher rate of interest (5 per cent per month in
many cases).
There are schemes by the financial institutions that provide attractive rates of interest
on loans for agricultural activities. For instance, in Yavatmal districts it was seen that for
a financial year that is from April to March, zero rate of interest was charged on crop
loans and only in case of failure to repay the loan in a year, rate of interest would be
charged.
Farmers’ lack of knowledge was observed especially in Maharashtra, where the farmer
did not know the rate of interest charged and the date of repayment of loan taken from
bank. Not much provision is there to cover the farmer in case of natural calamity or
crop failure due to some reason. To repay loan from one source, farmers seek loans
from other sources and the spiral keeps building up.
It is also observed that credit taken from financial institutions in the name of agriculture
and related activities, was not always spent on crop cultivation. Rather more than 50
percent of the farmers accepted to having used it for other reasons such as health or
for social functions like marriage. It implies that having no alternate employment
option, the farmers are dependent on the risky and not so conducive choice of source
of income that is agriculture.
In the course of the survey of farmers as well as banks serving in the blocks under
study, we did not come across a single loanee for setting up agri-business or agri-
clinics, or distributor of inputs such as fertilizers, seed etc. This implies what a farmer in
an under developed area needs is a simple crop loan which is a direct short term loan
as defined by RBI. Thus the pictures showing total agriculture credit booming in the last
decade does not seem to find corroboration with the ground reality of the actual needy
farmers.
IV. CONCLUSIONS AND WAY FORWARD
The increase in credit disbursed to agriculture, by almost Rs. 5,50,000 crore, in
thirteen years and mainly since 2005-06 looks very encouraging and pro farm
sector. Despite this significant increase in the institutional credit and flow to
agriculture in the past few years, small and marginal farmers do not generally
have access to institutional credit especially from Commercial Banks.
Due to the increase in cost of production, small and marginal farmers are finding
it difficult to continue in agriculture especially when the institutional credit facility
is highly inadequate and inefficient.
Even though according to the government a large number of Kisan Credit Cards
have been issued, in reality as evident from various field researches, majority of
the farmers did not receive the cards so far.
Due to changes in the definition of agriculture in recent years it is the large
farmers and some agri-business companies that are cornering the major benefit
of institutional credit.
The situation on the field is still very grim which fails to validate the overall
picture of perennially increasing disbursement of agriculture credit from
institutional sources. The farmer is still in the same situation as he was 60 years
back, or may be much worse owing to the rising retail prices and falling returns
to farmers. The only possible solution to take out the farmer from the ever
increasing debt trap is by offering him remunerative prices for his produce and
keeping him secure from the fluctuations in the prices in the open market.
Secondly, farmer must be insured against the natural calamities that leave his
crop destroyed, in turn leaving no source of income to run his household.
Thirdly, there is an urgent need for alternate employment opportunities for the
farmers to complement his earnings from the field. These new options will be
important for checking or reducing the incidence of suicides by farmers.
Appendix 1: Total Credit Outstanding (in Rs. Crore)
State 2001 2002 2003 2004 2005 2006 2007 2008 2009 2010 2011
Compound Growth
Rate
Trend Growth
Rate
Haryana 1924 2274 2827 3479 4741 6454 8818 12359 16134 19149 21317 24.44 30.08
HP 199 253 376 440 711 1087 1303 1496 1674 2558 2524 25.98 30.74
Punjab 3706 4281 5404 6718 8599 10745 13239 16239 20769 26806 29678 20.82 24.35
Rajasthan 2790 3614 3890 4629 6556 8985 12391 14233 16444 18776 22811 21.05 24.73
Chandigarh 727 935 867 2027 2645 3015 4789 3721 5487 9550 9405 26.20 30.69
Delhi 2951 2799 3797 3639 7876 16404 19960 20641 24854 30813 25669 21.73 31.89
Assam 323 311 367 393 456 732 888 1514 1835 2108 2410 20.04 26.54
Bihar 1207 1379 1440 1778 2679 4063 4311 5657 7707 8319 9276 20.37 25.75
Jharkhand 163 264 349 481 711 984 1560 1464 1765 2153 2582 28.55 31.45
Orissa 801 950 1048 1161 1654 2460 3204 5464 7067 9119 10835 26.72 33.22
West Bengal 2919 3319 4281 4870 7019 9414 10915 14105 17642 20937 20973 19.63 24.43
Madhya Pradesh 2969 3285 3810 4737 6771 9172 10905 14523 19693 23636 22880 20.40 26.37
Chhattisgarh 140 305 426 569 853 1177 2143 2603 3362 7026 6576 41.90 46.44
Uttar Pradesh 4751 6814 6919 8570 11420 17238 22759 26661 30971 37280 43477 22.29 25.89
Uttaranchal 115 197 446 564 794 1214 1632 2201 2914 3170 4177 38.62 41.46
Gujarat 2960 3373 3887 4674 6027 8028 11306 14185 17902 22403 26105 21.88 26.54
Maharashtra 10651 8686 12535 15369 14410 21394 37117 47095 43308 50477 54577 16.01 22.27
Andhra Pradesh 6343 6830 8284 9582 15249 22768 26611 32920 45603 58265 66293 23.78 29.52
Karnataka 5210 5541 8052 9958 12194 16884 20347 23057 27316 32394 34770 18.83 22.60
Kerala 2069 2548 2766 3740 4989 7720 11329 14229 18207 19720 24871 25.37 31.07
Tamil Nadu 5991 6206 7336 9910 13189 20622 27402 30974 41364 54566 61203 23.52 29.59
All India 59310 64819 79599 98579 130775 191973 254693 308087 375593 463323 507176 21.54 26.89
Source: Basic Statistical Returns of Scheduled Commercial Banks in India, Various Issues
Appendix 1a: Direct Credit Outstanding (in Rs. Crore)
State 2001 2002 2003 2004 2005 2006 2007 2008 2009 2010 2011
Compound Growth Rate
Trend Growth Rate
Haryana 1688 1955 2369 2981 3945 5355 6595 8944 11817 12796 14368 21.49 26.38
Himachal Pradesh 191 235 318 402 612 775 923 1205 1510 2060 2160 24.67 29.09
Punjab 3120 3476 4425 5567 6644 8149 9863 12094 15045 18441 21613 19.24 22.11
Rajasthan 2029 2814 3149 3731 5221 6909 8972 10473 12931 15993 19580 22.89 25.66
Chandigarh 100 109 175 369 783 1522 1300 804 2299 3861 3522 38.23 46.32
Delhi 146 252 903 871 1657 2808 3952 6978 5937 7017 6399 41.01 47.68
Assam 293 279 319 364 408 653 796 1365 1515 1654 1843 18.20 24.72
Bihar 1090 1239 1300 1648 2463 3332 3912 5143 6920 7122 7664 19.40 24.95
Jharkhand 139 250 322 436 643 903 1478 1331 1462 1746 2046 27.69 29.96
Orissa 743 846 934 1038 1467 2190 2781 4435 4977 5477 6254 21.37 27.46
West Bengal 1857 2211 2999 3478 5186 6946 7817 8646 10274 12535 11909 18.41 22.32
Madhya Pradesh 2579 2893 3394 4390 5969 7917 9748 12479 15860 18942 17291 18.88 24.65
Chhattisgarh 136 289 411 538 805 1062 1438 1934 2106 3493 4337 36.99 37.86
Uttar Pradesh 4428 5658 6393 7890 10446 14653 18323 22355 24801 29736 33745 20.28 23.82
Uttaranchal 103 173 405 528 720 1157 1545 1968 2527 2561 3301 37.06 39.99
Gujarat 2123 2187 2678 2943 3966 5594 7823 10576 13063 15879 19223 22.18 27.75
Maharashtra 3691 3806 4836 6329 8352 11503 15646 22484 26518 31066 37733 23.53 29.33
Andhra Pradesh 4990 5903 7063 8513 11770 17319 22196 26132 35230 43127 48935 23.07 27.90
Karnataka 4084 4077 5541 6730 8854 12714 15813 17781 21592 25704 27099 18.77 23.74
Kerala 1884 2169 2389 3264 4321 6516 8977 10801 14328 14446 19223 23.51 28.63
Tamil Nadu 4751 5334 6126 8271 10663 15879 20929 24505 31491 41052 48360 23.48 28.43
All India 40485 46580 56858 70781 95562 134798 172131 214644 264892 317769 360253 21.98 26.70
Source: Basic Statistical Returns of Scheduled Commercial Banks in India, Various Issues
Appendix 1b: Indirect Credit Outstanding (in Rs. Crore)
State
2001 2002 2003 2004 2005 2006 2007 2008 2009 2010 2011
Compound Growth Rate
Trend Growth Rate
Haryana 236 319 458 498 796 1099 2223 3416 4317 6353 6950 36.00 44.49
HP 8 18 58 38 99 312 380 291 164 498 364 41.49 45.04
Punjab 586 805 979 1151 1955 2596 3376 4145 5724 8365 8065 26.92 32.41
Rajasthan 761 800 741 898 1335 2076 3419 3760 3513 2783 3231 14.05 20.69
Chandigarh 627 826 692 1658 1862 1493 3489 2917 3188 5689 5883 22.57 25.81
Delhi 2805 2547 2894 2768 6219 13596 16008 13663 18917 23796 19269 19.15 29.39
Assam 30 32 48 29 48 79 92 149 320 454 567 30.62 37.36
Bihar 117 140 140 130 216 731 399 514 787 1197 1612 26.93 31.64
Jharkhand 24 14 27 45 68 81 82 133 303 407 536 32.64 42.06
Orissa 58 104 114 123 187 270 423 1029 2090 3642 4581 48.77 57.34
West Bengal 1062 1108 1282 1392 1833 2468 3098 5459 7368 8402 9064 21.52 28.20
MP 390 392 416 347 802 1255 1157 2044 3833 4694 5589 27.38 35.99
Chhattisgarh 4 16 15 31 48 115 705 670 1256 3533 2239 77.75 98.36
Uttar Pradesh 323 1156 526 680 974 2585 4436 4307 6170 7544 9733 36.29 40.14
Uttaranchal 12 24 41 36 74 57 87 233 387 609 876 47.70 50.56
Gujarat 837 1186 1209 1731 2061 2434 3483 3610 4839 6524 6883 21.11 23.83
Maharashtra 6960 4880 7699 9040 6058 9891 21471 24611 16790 19411 16844 8.37 15.18
Andhra Pradesh 1353 927 1221 1069 3479 5449 4415 6788 10373 15138 17357 26.11 36.57
Karnataka 1126 1464 2511 3228 3340 4170 4534 5276 5724 6690 7671 19.06 19.32
Kerala 185 379 377 476 668 1204 2352 3428 3879 5274 5648 36.45 43.63
Tamil Nadu 1240 872 1210 1639 2526 4743 6473 6469 9873 13514 12844 23.68 34.54
All India 18825 18239 22741 27798 35213 57175 82562 93443 110701 145554 146923 20.54 27.36
Source: Basic Statistical Returns of Scheduled Commercial Banks in India, Various Issues
vii
Appendix 2: SCB’s Total Credit Outstanding (Rs. Crores)
State 2001 2002 2003 2004 2005 2006 2007 2008 2009 2010 2011
Haryana 1924 2274 2827 3479 4741 6454 8818 12359 16134 19149 21317
Himachal Pradesh 199 253 376 440 711 1087 1303 1496 1674 2558 2524
Punjab 3706 4281 5404 6718 8599 10745 13239 16239 20769 26806 29678
Rajasthan 2790 3614 3890 4629 6556 8985 12391 14233 16444 18776 22811
Chandigarh 727 935 867 2027 2645 3015 4789 3721 5487 9550 9405
Delhi 2951 2799 3797 3639 7876 16404 19960 20641 24854 30813 25669
Assam 323 311 367 393 456 732 888 1514 1835 2108 2410
Bihar 1207 1379 1440 1778 2679 4063 4311 5657 7707 8319 9276
Jharkhand 163 264 349 481 711 984 1560 1464 1765 2153 2582
Orissa 801 950 1048 1161 1654 2460 3204 5464 7067 9119 10835
West Bengal 2919 3319 4281 4870 7019 9414 10915 14105 17642 20937 20973
Madhya Pradesh 2969 3285 3810 4737 6771 9172 10905 14523 19693 23636 22880
Chhatisgarh 140 305 426 569 853 1177 2143 2603 3362 7026 6576
Uttar Pradesh 4751 6814 6919 8570 11420 17238 22759 26661 30971 37280 43477
Uttarakhand 115 197 446 564 794 1214 1632 2201 2914 3170 4177
Gujarat 2960 3373 3887 4674 6027 8028 11306 14185 17902 22403 26105
Maharashtra 10651 8686 12535 15369 14410 21394 37117 47095 43308 50477 54577
Andhra Pradesh 6343 6830 8284 9582 15249 22768 26611 32920 45603 58265 66293
Karnataka 5210 5541 8052 9958 12194 16884 20347 23057 27316 32394 34770
Kerala 2069 2548 2766 3740 4989 7720 11329 14229 18207 19720 24871
Tamil Nadu 5991 6206 7336 9910 13189 20622 27402 30974 41364 54566 61203
All India 59310 64819 79599 98579 130775 191973 254693 308087 375593 463323 507176 Source: Basic Statistical Returns of Scheduled Commercial Banks in India, Various Issues
viii
Appendix 2a: SCB’s Direct Credit Outstanding (Rs. Crore)
State 2001 2002 2003 2004 2005 2006 2007 2008 2009 2010 2011
Haryana 1688 1955 2369 2981 3945 5355 6595 8944 11817 12796 14368
Himachal Pradesh 191 235 318 402 612 775 923 1205 1510 2060 2160
Punjab 3120 3476 4425 5567 6644 8149 9863 12094 15045 18441 21613
Rajasthan 2029 2814 3149 3731 5221 6909 8972 10473 12931 15993 19580
Chandigarh 100 109 175 369 783 1522 1300 804 2299 3861 3522
Delhi 146 252 903 871 1657 2808 3952 6978 5937 7017 6399
Assam 293 279 319 364 408 653 796 1365 1515 1654 1843
Bihar 1090 1239 1300 1648 2463 3332 3912 5143 6920 7122 7664
Jharkhand 139 250 322 436 643 903 1478 1331 1462 1746 2046
Orissa 743 846 934 1038 1467 2190 2781 4435 4977 5477 6254
West Bengal 1857 2211 2999 3478 5186 6946 7817 8646 10274 12535 11909
Madhya Pradesh 2579 2893 3394 4390 5969 7917 9748 12479 15860 18942 17291
Chhatisgarh 136 289 411 538 805 1062 1438 1934 2106 3493 4337
Uttar Pradesh 4428 5658 6393 7890 10446 14653 18323 22355 24801 29736 33745
Uttarakhand 103 173 405 528 720 1157 1545 1968 2527 2561 3301
Gujarat 2123 2187 2678 2943 3966 5594 7823 10576 13063 15879 19223
Maharashtra 3691 3806 4836 6329 8352 11503 15646 22484 26518 31066 37733
Andhra Pradesh 4990 5903 7063 8513 11770 17319 22196 26132 35230 43127 48935
Karnataka 4084 4077 5541 6730 8854 12714 15813 17781 21592 25704 27099
Kerala 1884 2169 2389 3264 4321 6516 8977 10801 14328 14446 19223
Tamil Nadu 4751 5334 6126 8271 10663 15879 20929 24505 31491 41052 48360
All India 40485 46580 56858 70781 95562 134798 172131 214644 264892 317769 360253 Source: Basic Statistical Returns of Scheduled Commercial Banks in India, Various Issues
ix
Appendix 2b: SCB’s Indirect Credit Outstanding (Rs. Crores)
State 2001 2002 2003 2004 2005 2006 2007 2008 2009 2010 2011
Haryana 236 319 458 498 796 1099 2223 3416 4317 6353 6950
Himachal Pradesh 8 18 58 38 99 312 380 291 164 498 364
Punjab 586 805 979 1151 1955 2596 3376 4145 5724 8365 8065
Rajasthan 761 800 741 898 1335 2076 3419 3760 3513 2783 3231
Chandigarh 627 826 692 1658 1862 1493 3489 2917 3188 5689 5883
Delhi 2805 2547 2894 2768 6219 13596 16008 13663 18917 23796 19269
Assam 30 32 48 29 48 79 92 149 320 454 567
Bihar 117 140 140 130 216 731 399 514 787 1197 1612
Jharkhand 24 14 27 45 68 81 82 133 303 407 536
Orissa 58 104 114 123 187 270 423 1029 2090 3642 4581
West Bengal 1062 1108 1282 1392 1833 2468 3098 5459 7368 8402 9064
Madhya Pradesh 390 392 416 347 802 1255 1157 2044 3833 4694 5589
Chhatisgarh 4 16 15 31 48 115 705 670 1256 3533 2239
Uttar Pradesh 323 1156 526 680 974 2585 4436 4307 6170 7544 9733
Uttarakhand 12 24 41 36 74 57 87 233 387 609 876
Gujarat 837 1186 1209 1731 2061 2434 3483 3610 4839 6524 6883
Maharashtra 6960 4880 7699 9040 6058 9891 21471 24611 16790 19411 16844
Andhra Pradesh 1353 927 1221 1069 3479 5449 4415 6788 10373 15138 17357
Karnataka 1126 1464 2511 3228 3340 4170 4534 5276 5724 6690 7671
Kerala 185 379 377 476 668 1204 2352 3428 3879 5274 5648
Tamil Nadu 1240 872 1210 1639 2526 4743 6473 6469 9873 13514 12844
All India 18825 18239 22741 27798 35213 57175 82562 93443 110701 145554 146923 Source: Basic Statistical Returns of Scheduled Commercial Banks in India, Various Issues
x
Appendix 3: Direct Credit Outstanding to Agriculture in Different Loan Categories (2008 to 2011)
Region/State/Union
Territory
2008 2009 2010 2011 2008 2009 2010 2011
Loans to corporate, partnership firms, credit limit up to Rs. 1 cr.
Loans to individual farmers
Punjab 642 766 1283 11003 10270 13476 16644 200270
Haryana 561 330 680 7395 6723 8635 10938 122040
Rajasthan 257 391 864 10853 10550 11219 13587 175825
Bihar 189 252 286 4020 4322 5517 6294 63826
Jharkhand 73 126 139 956 1260 1476 1811 15205
West Bengal 1292 1289 2939 6764 5807 10068 10749 86784
Orissa 251 600 725 2688 3112 4021 4670 47003
Uttar Pradesh 866 637 2311 16280 21005 24247 28149 337903
Uttaranchal 70 50 301 1083 1555 1916 2270 32965
Madhya Pradesh 963 892 1776 6489 11500 13200 15384 157259
Chhattisgarh 91 49 359 2283 1363 2242 3602 32399
Gujarat 784 929 1239 6855 7129 8562 9954 142166
Maharashtra 4351 1330 2648 12117 15649 19361 24588 277130
Andhra Pradesh 1397 865 2197 16628 22822 31840 38598 450082
Karnataka 502 304 1222 11830 16241 18188 21327 219331
Tamil Nadu 1245 790 2785 17449 21453 27242 33769 421368
Kerala 694 361 2796 7723 9816 11987 12834 177282
Source: Basic Statistical Returns of Scheduled Commercial Banks in India, Various Issues
xi
Appendix 4: Indirect Credit Outstanding to Agriculture in Different Loan Categories (2008 to 2011)
Region/State/Union Territory
2008 2009 2010 2011 2008 2009 2010 2011 2008 2009 2010 2011 2008 2009 2010 2011
Loans to Food & agro based processing units with
investment in P& M up to 10 crs.
Loans to NGOs/MFIs for on lending to individual
farmers or their SHGs/JLGs
Agri-clinics and Agri-Business centres
Loans granted to pre & postharvest activities
Punjab 1218 1941 2382 18663 1 0 10 0 9 14 2 952 518 643 98 12351
Haryana 768 1558 2522 23323 0 0 25 1 345 1 2 165 249 87 132 18026
Rajasthan 115 471 433 4586 2 20 42 75 1 3 2 239 822 2871 952 4728
Bihar 95 186 208 2191 1 7 34 149 2 12 1 675 174 112 641 1522
Jharkhand 15 32 84 1428 0 0 4 82 0 1 1 409 140 140 49 228
West Bengal 851 1643 2414 15661 67 247 467 1596 3 237 41 2797 107 177 204 6051
Orissa 94 318 392 2888 12 42 79 1027 2 6 1 3618 118 86 51 1207
Uttar Pradesh 881 1780 2053 17576 10 32 87 508 43 6 6 2707 495 1037 820 8795
Uttaranchal 99 214 264 2283 0 0 0 10 1 1 1 96 37 40 142 1026
Madhya Pradesh 565 1056 998 5430 1 0 47 107 11 79 11 4982 1228 1459 346 6519
Chhattisgarh 121 321 406 1902 0 0 4 15 0 1 1 162 110 122 148 12313
Gujarat 786 1209 2022 19922 57 65 102 1879 85 5 44 3505 421 671 795 10811
Maharashtra 3172 2260 4971 21999 24 108 241 755 3 272 17 9237 1067 1662 1170 28021
Andhra Pradesh 2192 2554 3490 42068 175 198 364 7659 708 57 17 1455 317 428 292 7473
Karnataka 507 1401 1638 19481 105 177 258 1136 8 23 29 636 298 246 596 3837
Tamil Nadu 538 1343 1583 15146 83 156 611 2696 7 143 9 1152 443 542 659 6505
Kerala 962 1021 879 15932 105 91 418 815 11 31 6 2318 530 92 207 2187
Source: Basic Statistical Returns of Scheduled Commercial Banks in India, Various Issues
xii
Appendix 4 (contd.): Indirect Credit Outstanding to Agriculture in Different Loan Categories (2008 to
2011)
Region/State/Union Territory
2008 2009 2010 2011 2008 2009 2010 2011 2008 2009 2010 2011 2008 2009 2010 2011
Loans to corporate, partnership firms, credit
limit above Rs. 1 cr.
Loans to farmers thro' PACS/FSS/LAMPS
Loans to NBFCs for on-lending to individual
farmers or their SHGs/JLGs
Other types of indirect finance for agriculture&
allied activities
Punjab 891 1065 1356 17760 84 0 0 79 0 0 34 18 1846 2911 7003 37400
Haryana 1154 2785 1098 11067 249 3 5 64 0 0 2 4 1780 1957 2963 23399
Rajasthan 902 934 529 3044 6 1 2 9 1 1 2 274 3228 2771 2135 24111
Bihar 54 123 289 9143 0 0 1 5 0 0 0 8 278 407 688 9137
Jharkhand 8 8 193 4555 2 0 0 3 0 9 0 0 52 110 138 1653
West Bengal 1806 1774 2882 50437 49 14 66 659 689 759 575 7232 3115 3507 3348 27812
Orissa 147 224 805 18945 5 6 8 12 2 0 31 63 663 1259 2166 23394
Uttar Pradesh 688 732 1193 19010 75 42 66 634 1 29 15 345 2047 2909 3144 38843
Uttaranchal 21 45 83 923 0 0 0 0 6 2 13 0 199 80 168 3003
Madhya Pradesh 376 1121 1207 17413 119 0 0 7 1 0 0 46 863 1719 2513 28336
Chhattisgarh 236 350 490 4039 0 0 0 4 0 0 0 0 415 376 2536 10856
Gujarat 1226 2065 4274 60704 36 0 1 12 7 5 35 830 2153 3016 3452 20873
Maharashtra 4958 5501 4849 85870 74 69 178 377 124 471 1176 21458 7007 12727 8254 73758
Andhra Pradesh 3118 3159 3374 39854 785 60 171 1719 98 1144 2169 19516 3319 5002 6094 44596
Karnataka 1735 2532 2738 46700 48 24 12 549 23 9 221 629 2903 2835 2815 18646
Tamil Nadu 3100 2643 3419 42263 3 0 2 2727 54 147 200 13722 4097 7313 8387 67129
Kerala 418 1236 680 8513 2 0 2 34 33 41 1053 1918 1764 2210 2264 18345
Source: Basic Statistical Returns of Scheduled Commercial Banks in India, Various Issues
xiii
Appendix 5: Kisan Credit Cards Issued and Amount Sanctioned between 2005 and 2011 State/Union Territory
Total Card Issued ('000) Total Amount Sanctioned (Rs. Crore)
2006 2007 2008 2009 2010 2011 2012 2006 2007 2008 2009 2010 2011 2012
Andhra Pradesh 1346 1202 1215 14432 15581 1898 1414 4505 6318 1477 38477 44036 8685 889
Assam 65 34 48 463 567 117 7 91 61 155 1008 1326 451 2
Arunachal Pradesh 2 1 2 20 23 2 251 1 5 2 34 48 10 78
Bihar 63 279 239 3128 3805 567 584 643 993 609 10059 13256 3292 371
Gujarat 239 217 145 2801 2997 243 2 4153 4455 643 41680 43723 2329 2
Goa 3 1 1 15 16 2 363 38 6 7 148 158 12 343
Haryana 254 111 155 2348 2492 148 191 3046 1531 1341 18359 20515 2456 337
Himachal Pradesh 35 29 26 325 503 57 63 328 100 21 1639 2247 621 73
Jammu and Kashmir 9 5 6 79 92 16 14 124 35 43 272 352 109 9
Karnataka 505 387 371 5040 5665 650 629 7907 1707 222 25261 28808 5615 598
Kerala 240 318 353 3124 3467 301 342 918 1104 1172 9831 11242 2647 354
Madhya Pradesh 498 374 403 5151 5777 627 841 3461 2309 641 27770 32209 5740 843
Maharashtra 778 1088 881 7919 8697 726 946 5101 4392 480 42852 47196 4362 728
Meghalaya 10 12 8 68 79 4 3 16 24 16 145 175 22 1
Mizoram 4 4 5 23 26 4 25 6 15 24 69 91 15 8
Manipur 6 15 2 40 44 2 6 8 37 2 98 113 11 3
Nagaland 4 4 2 21 28 3 11 8 9 2 37 50 9 4
Orissa 494 349 462 4934 5554 571 1008 2207 1663 1924 14011 15650 1497 179
Punjab 179 114 121 2230 2397 213 214 1964 1817 1072 21005 25068 5727 672
Rajasthan 347 265 277 4758 5221 843 633 3002 1873 421 28556 34297 8176 777
Sikkim 2 1 1 10 11 1 2 4 2 3 29 40 11 1
Tamil Nadu 528 518 467 5809 6156 828 881 1904 2364 878 17594 20748 6573 929
Tripura 11 10 13 97 121 32 92 21 14 16 174 247 80 14
Uttar Pradesh 1333 1358 1426 15422 17113 1348 1943 6538 6963 3723 50153 61629 9694 1406
West Bengal 480 182 386 3108 3445 449 611 787 1145 3109 10817 12352 1940 222
A and N Island 0 0 0 2 7 0 2 1 1 3 16 20 3 0
Chandigarh 0 0 0 6 3 4 2 0 0 0 15 20 22 6
Daman and Diu 0 0 0 2 2 0 0 0 0 0 14 14 2 0
New Delhi 1 1 9 20 24 2 5 6 8 10 182 304 28 13
D and N Haveli 0 0 0 5 3 0 0 0 0 0 28 29 5 0
Lakshadweep 0 0 0 1 1 0 1 0 0 0 3 3 0 0
Pondicherry 5 7 5 48 67 10 13 17 18 13 207 266 87 11
Jharkhand 127 201 84 721 1169 155 222 292 478 42 1953 2595 621 63
Chhattisgarh 239 176 139 797 1664 272 303 356 527 246 4105 4910 1033 125
Uttaranchal 60 32 47 1217 668 73 136 249 326 111 3205 3744 741 106
Total 8012 7470 7299 84667 93673 10169 5511 47701 40300 32169 370070 427748 72625 2821
Source: NABARD

xiv