institutional characteristics (uf ... - university of florida
TRANSCRIPT

Institutional Characteristics (UF Main Campus) 2
Institutional Characteristics (UF Online) 18
Fall Enrollment (UF Main Campus) 32
Fall Enrollment (UF Online) 84
12 Month Enrollment 114
Completions (UF Main Campus) 121
Completions (UF Online) 166
Admissions (UF Main Campus) 172
Admissions (UF Online) 179
Graduation Rates 186
Graduation Rates 200 200
Student Financial Aid and Net Price 205
Finance 223
Human Resources (UF Main Campus) 243
Human Resources (UF Online) 291

Institutional Characteristics 2014-15Institution: University of Florida (134130)User ID: 88G4434
OverviewInstitutional Characteristics Overview
Welcome to the Institutional Characteristics (IC) component. This component collects important information about yourinstitution's mission, student services, and student charges.
Much of the data reported on IC appear on College Navigator, which is updated once after IC data has been finallyreviewed. Thus, errors may stay on College Navigator for a full year.
Additionally, the cost of attendance data are used to calculate the net price of attendance in the Student Financial Aidcomponent. This has important implications for what students see about your institution, and also for the CollegeAffordability and Transparency Center's lists. Revisions or changes to costs can ONLY be made in the StudentFinancial Aid component and not in the prior year revision system.
Remember, it is the responsibility of the keyholder to submit accurate data about the institution. Please contact theIPEDS Help Desk for clarifications to make sure that you are reporting correctly.
Changes to This Year's IC Component:• All of the Part B Admissions questions have been moved to the new Admissions (ADM)
component. A screening question on IC-Header will determine if your institution is required tocomplete ADM in the Winter Collection.
• Estimated enrollment numbers were part of the admissions questions in IC, but was not movedto the new ADM component. Starting this year, IPEDS will no longer collect estimatedenrollment numbers.
• A new question on the services and programs for military servicemembers and veterans hasbeen added and placed in Part B of IC, which used to have the admissions questions.
Common ErrorsQuality control reviews of past IC data indicate frequently made errors. Please review the common errors below toensure accurate reporting. Additional common errors or tips can be found in the New Keyholder Handbook underResources.
• Question 2 should only be marked 'YES' if your institution is EXCLUSIVELY distance education. Do not mark'YES' if your courses/programs are also available in person.
• Do not try to outsmart fatal errors; this is falsifying data. Contact the Help Desk to override, or fix, the data.• Make sure you understand ALL definitions before responding to questions. For example, make sure that you
are reporting for an 'ACADEMIC YEAR' or 'PROGRAM' as defined by IPEDS.
  To download the survey materials for this component: Survey Materials To access your prior year data submission for this component: Reported Data

Institution: University of Florida (134130)User ID: 88G4434
Part A - Mission Statement and Distance Education1. Provide the institution's mission statement or a web address (URL) where the mission statement can befound. Typed statements are limited to 2,000 characters or less. The mission statement will be available to thepublic on College Navigator. Mission Statement URL:
Please begin URL with "http://" or "https://"
Mission Statement
2. Are all the programs at your institution offered exclusively via distance education? Yes
No
https://catalog.ufl.edu/

Imagedescription.Thesecontext noteswill beposted onthe CollegeNavigator.End of imagedescription.
Institution: University of Florida (134130)User ID: 88G4434
Part B - Services and Programs for Servicemembers and Veterans1. Which of the following are available to veterans, military servicemembers, or their families? Yellow Ribbon Program (officially known as Post-9/11 GI Bill, Yellow Ribbon Program)
Credit for military training
Dedicated point of contact for support services for veterans, military servicemembers, and their families
Recognized student veteran organization
Member of Servicemembers Opportunity Colleges
None of the above
You may use the space below to provide context for the data you've reported above. These context noteswill be posted on the College Navigator website, and should be written to be understood by students andparents. Office of Veterans Services www.veterans.ufl.edu Collegiate VeteransSuccess Center www.dso.ufl.edu/veteran

Institution: University of Florida (134130)User ID: 88G4434
Part C - Student Services - Special Learning Opportunities1. Does your institution accept any of the following? [Check all that apply] Dual credit (college credit earned while in high school)
Credit for life experiences
Advanced placement (AP) credits
None of the above
2. What types of special learning opportunities are offered by your institution? [Check all that apply] ROTC
Army Navy Air Force
Study abroad
Weekend/evening college
Teacher certification (for the elementary, middle school/junior high, or secondary level)
Do not include certifications to teach at the postsecondary level. Students can complete their preparation in certain areas of specialization
Students must complete their preparation at another institution for certain areas of specialization
This institution is approved by the state for the initial certification or licensure of teachers
None of the above
3. If your institution grants a bachelor's degree or higher but does not offer a full 4-year program of study at theundergraduate level, how many years of completed college-level work are required for entrance? Number of years Select One

Imagedescription.Thesecontext noteswill beposted onthe CollegeNavigator.End of imagedescription.
Institution: University of Florida (134130)User ID: 88G4434
Part C - Student Services - Distance Opportunities4. Which of the following selected student services are offered by your institution? [Check all that apply] Remedial services
Academic/career counseling services
Employment services for current students
Placement services for program completers
On-campus day care for children of students
None of the above
5. Does your institution have its own library or are you financially supporting a shared library with anotherpostsecondary education institution? Have our own library
Do not have our own library but contribute financial support to a shared library
Neither of the above
6. Indicate whether or not any of the following alternative tuition plans are offered by your institution. No
Yes
Tuition guarantee
Prepaid tuition plan
Tuition payment plan
Other (specify in box below)
7. Please indicate at what level(s) your institution offers distance education opportunities (courses and/orprograms). Undergraduate
Graduate
The institution does not offer distance education opportunities
You may use the space below to provide context for the alternative tuition plans you've reported above.These context notes will be posted on the College Navigator website, and should be written to be understoodby students and parents.

Imagedescription.Thesecontext noteswill beposted onthe CollegeNavigator.End of imagedescription.
Institution: University of Florida (134130)User ID: 88G4434
Part C - Disability ServicePlease indicate the percentage of all undergraduate students enrolled during fall 2013 who were formallyregistered as students with disabilities with the institution's office of disability services (or the equivalentoffice). 3 percent or less
More than 3 percent: %
You may use the space below to provide context for the data you've reported above. These context noteswill be posted on the College Navigator website, and should be written to be understood by students andparents.

Institution: University of Florida (134130)User ID: 88G4434
Part D - Student Charges Questions1. Are all full-time, first-time degree/certificate-seeking students required to live on campus or in institutionally-controlled housing?If you answer Yes to this question, you will not be asked to report off-campus room and board in the price of attendance(D11).
This is only a screening question, and your response does not show up on College Navigator.
If you make any exceptions to this rule, and have even one first-time, full-time student living off-campus, please answerNo so that this does not cause conflicts with the Student Financial Aid survey. Making changes to the SFA component isvery difficult and may lead to inaccurate reporting for your institution. No
Yes, and we do not make ANY(even one) exceptions to this rule
2. Does your institution charge different tuition for in-district, in-state, or out-of-state students?If you answer Yes to this question, you will be expected to report tuition amounts for in-district, in-state, and out-of-statestudents.
Please only select Yes if you really charge different tuition rates, or you will be reporting the same numbers 3 times. No
Yes
3. Does your institution offer institutionally-controlled housing (either on or off campus)?If you answer Yes to this question, you will be expected to specify a housing capacity, and to report a room charge or acombined room and board charge (D10). No
Yes
Specify housing capacity foracademic year 2014-15
10,8584. Do you offer board or meal plans to your students?If you answer Yes to this question, you will be expected to report a board charge or combined room and board charge(D10). No
Yes - Enter the number of mealsper week in the maximum mealplan available
Yes - Number of meals per week
can vary (e.g., students' chargemeals against a meal card)

Institution: University of Florida (134130)User ID: 88G4434
Part D - Undergraduate Student ChargesIf the institution charges an application fee, indicate the amount. Amount Prior year Undergraduate application fee 30 30 5. Charges to full-time undergraduate students for the full academic year 2014-15Please be sure to report an average tuition that includes all students at all levels (freshman, sophomore, etc.). In-district Prior year In-state Prior year Out-of-state Prior yearAll full-time undergraduatesAverage tuition 4,477 4,477 4,477 4,477 25,694 25,694Required fees 1,836 1,786 1,836 1,786 2,897 2,8476. Per credit hour charge for part-time undergraduate studentsPlease be sure to report an average per credit tuition that includes all students at all levels (freshman, sophomore, etc.). In-district Prior year In-state Prior year Out-of-state Prior yearPer credit hour charge 149 149 149 149 856 856

Institution: University of Florida (134130)User ID: 88G4434
Part D - Graduate Student ChargesIf the institution charges an application fee, indicate the amount. Amount Prior yearGraduate application fee 30 30
Please do not include tuition for Doctor’s Degree – Professional Practice programs.
Data for those programs are collected separately.7. Charges to full-time graduate students for the full academic year 2014-15 In-district Prior year In-state Prior year Out-of-state Prior yearAverage tuition 10,770 10,770 10,770 10,770 27,335 27,335Required fees 1,912 1,872 1,912 1,872 2,741 2,701 8. Per credit hour charge for part-time graduate students In-district Prior year In-state Prior year Out-of-state Prior yearPer credit hour charge 449 449 449 449 1,139 1,139

Institution: University of Florida (134130)User ID: 88G4434
Part D - Student Charges - Graduate, Doctor's Professional Practice Tuition9. List the typical tuition and required fees for a full-time doctor's-professional practice student in any of theselected programs for the full academic year 2014-15. DO NOT include room and board chargesDoctor's degree-professional practice In-state Out-of-state1. Chiropractic (D.C. or D.C.M.): Tuition amount Required fees 2. Dentistry (D.D.S. or D.M.D.): Tuition amount 37,564 62,783 Required fees 4,063 5,3243. Medicine (M.D.): Tuition amount 32,744 60,592 Required fees 3,822 5,2154. Optometry (O.D.): Tuition amount Required fees 5. Osteopathic Medicine (D.O.): Tuition amount Required fees 6. Pharmacy (Pharm.D.): Tuition amount 19,845 41,886 Required fees 2,975 4,0777. Podiatry (Pod.D., D.P., or D.P.M.): Tuition amount Required fees 8. Veterinary Medicine (D.V.M.): Tuition amount 25,248 45,225 Required fees 3,448 4,4469. Law (J.D.): Tuition amount 19,574 35,388 Required fees 2,657 3,447

Institution: University of Florida (134130)User ID: 88G4434
Part D - Student Charges - Room and Board10. What are the typical room and board charges for a student for the full academic year 2014-15?If your institution offers room or board at no charge to students, enter zero.If you report room and board separately, leave the combined charge blank. If you report a combined charge, leave theroom and board charges blank.Room and board charges Amount Prior yearRoom charge (Double occupancy) 5,340 5,230Board charge (Maximum plan) 4,290 4,290Combined room and board charge(Answer only if you CANNOT separate room and board charges.)
NA

Imagedescription.Thesecontext noteswill beposted onthe CollegeNavigator.End of imagedescription.
Institution: University of Florida (134130)User ID: 88G4434
Part D - Student Charges - Price of Attendance11. Cost of attendance for full-time, first-time undergraduate students:Please enter the amounts requested below. These data will be made available to the public on College Navigator. Ifyour institution participates in any Title IV programs (Pell, Stafford, etc.), you must complete all information. Estimates ofexpenses for books and supplies, room and board, and other expenses are those from the Cost of Attendance reportused by the financial aid office in determining financial need. Please talk to your financial aid office to get thesenumbers, to ensure that you are reporting correctly.
If the 2014-15 tuition and/or fees as reported on this page for full-time, first-time students are covered by a tuitionguarantee program, check the applicable box(es) under 'Tuition Guarantee'. Additionally, please indicate the maximum% increase that is guaranteed. These numbers are expected to be fairly small. Please contact the Help Desk if you areconfused about these values and how to report them.Charges for fullacademic year
2011-12 2012-13 2013-14 2014-15
Published tuition and required fees: Tuition Guarantee(check only if applicable toentering students in 2014-15)
Guaranteedincrease %
In-district Tuition 4,060 4,425 4,477 4,477
Required fees 1,597 1,718 1,786 1,836
Tuition + feestotal
5,657 6,143 6,263 6,313
In-state Tuition 4,060 4,425 4,477 4,477
Required fees 1,597 1,718 1,786 1,836
Tuition + feestotal
5,657 6,143 6,263 6,313
Out-of-state Tuition 25,276 25,641 25,694 25,694
Required fees 2,658 2,779 2,847 2,897
Tuition + feestotal
27,934 28,420 28,541 28,591
Books andsupplies
1,070 1,080 1,080 1,290
On-campus: Room and board 8,800 9,370 9,520 9,630 Other expenses 4,260 3,960 2,240 3,320 Room and boardand otherexpenses
13,060 13,330 11,760 12,950
Off-campus (not with family): Room and board 8,800 9,370 9,520 9,630 Other expenses 4,260 3,960 2,240 3,320 Room and boardand otherexpenses
13,060 13,330 11,760 12,950
Off-campus (with family): Other expenses 4,260 3,960 2,240 3,320
You may use the space below to provide context for the data you've reported above. These context noteswill be posted on the College Navigator website, and should be written to be understood by students andparents.

Institution: University of Florida (134130)User ID: 88G4434
Part E - Athletic Association1. Is this institution a member of a national athletic association?
No
Yes - Check all that apply
National Collegiate Athletic Association (NCAA)
National Association of Intercollegiate Athletics (NAIA)
National Junior College Athletic Association (NJCAA)
United States Collegiate Athletic Association (USCAA)
National Christian College Athletic Association(NCCAA)
Other
2. If this institution is a member of the NCAA or NAIA, specify the conference FOR EACH SPORT using the pulldown menu. Sport NCAA or NAIA member ConferenceFootball No Yes-Specify Southeastern Conference
Basketball No Yes-Specify Southeastern Conference
Baseball No Yes-Specify Southeastern Conference
Cross country and/or track No Yes-Specify Southeastern Conference

Institution: University of Florida (134130)User ID: 88G4434
Prepared by This survey component was prepared by: Keyholder SFA Contact HR Contact
Finance Contact Academic Library Contact Other
Name: Marie Zeglen Email: [email protected] How long did it take to prepare thissurvey component?
4hours minutes
The name of the preparer is being collected so that we can follow up with the appropriate person in the event that thereare questions concerning the data. The Keyholder will be copied on all email correspondence to other preparers.The time it took to prepare this component is being collected so that we can continue to improve our estimate of thereporting burden associated with IPEDS. Please include in your estimate the time it took for you to review instructions,query and search data sources, complete and review the component, and submit the data through the Data CollectionSystem.Thank you for your assistance.

Institution: University of Florida (134130) User ID: 88G4434Summary
Institutional Characteristics Component SummaryAcademic Year Reporters
IPEDS collects important information regarding your institution. All data reported in IPEDSsurvey components become available in the IPEDS Data Center and appear as aggregated datain various Department of Education reports. Additionally, some of the reported data appearsspecifically for your institution through the College Navigator website and is included in yourinstitution’s Data Feedback Report (DFR). The purpose of this summary is to provide you anopportunity to view some of the data that, when accepted through the IPEDS quality controlprocess, will appear on the College Navigator website and/or your DFR. College Navigator isupdated approximately three months after the data collection period closes and Data FeedbackReports will be available through the Data Center and sent to your institution’s CEO inNovember 2015.
Please review your data for accuracy. If you have questions about the data displayed belowafter reviewing the data reported on the survey screens, please contact the IPEDS Help Desk at:1-877-225-2568 or [email protected].
GENERAL INFORMATIONMission Statement https://catalog.ufl.edu/ugrad/current/uf-mission/pages/home.aspx
Are all the programs at your institutionoffered completely via distanceeducation?
No
Special Learning Opportunities ROTC (ArmyNavyAir Force)Study abroadWeekend/evening collegeTeacher certification (below the postsecondary level)
Student Services Remedial servicesAcademic/career counseling servicesEmployment services for current studentsPlacement services for program completersOn-campus day care for children of students
Credit Accepted Dual credit (college credit earned while in high school)Advanced placement (AP) credits
Undergraduate students enrolled whoare formally registered with office ofdisability services
3 percent or less
PRICING INFORMATION
Estimated expenses for academic year for full-time, first-time students 2011-12 2012-13 2013-14 2014-15
In-district tuition and fees $5,657 $6,143 $6,263 $6,313
In-state tuition and fees $5,657 $6,143 $6,263 $6,313
Out-of-state tuition and fees $27,934 $28,420 $28,541 $28,591
Books and supplies $1,070 $1,080 $1,080 $1,290
On-campus room and board $8,800 $9,370 $9,520 $9,630
On-campus other expenses $4,260 $3,960 $2,240 $3,320
Off-campus room and board $8,800 $9,370 $9,520 $9,630
Off-campus other expenses $4,260 $3,960 $2,240 $3,320
Off-campus with family other expenses $4,260 $3,960 $2,240 $3,320
Average undergraduate student tuition and fees for academic year 2014-15
Tuition Fees
In-district $4,477 $1,836
In-state $4,477 $1,836
Out-of-state $25,694 $2,897
Average graduate student tuition and fees for academic year 2014-15 Tuition Fees
In-district $10,770 $1,912
In-state $10,770 $1,912
Out-of-state $27,335 $2,741
Alternative tuition plans Prepaid tuition plan

Institution: University of Florida (134130) User ID: 88G4434Edit Report
Institutional Characteristics
University of Florida (134130)
Source Description Severity Resolved OptionsScreen: Price of Attendance
ScreenEntry
This value is expected to be within 20% of the prior yearamount. Please correct your data or explain. (Error #11110)
Explanation Yes
Reason: Transportation was mistakenly excluded from Other Expenses in 2013-14. The correct Other Expenses amount for 2013-14 IC will be submitted to the Prior Year Revision System.

Institutional Characteristics 2014-15Institution: University of Florida-Online (484473)User ID: 88G4434
OverviewInstitutional Characteristics Overview
Welcome to the Institutional Characteristics (IC) component. This component collects important information about yourinstitution's mission, student services, and student charges.
Much of the data reported on IC appear on College Navigator, which is updated once after IC data has been finallyreviewed. Thus, errors may stay on College Navigator for a full year.
Additionally, the cost of attendance data are used to calculate the net price of attendance in the Student Financial Aidcomponent. This has important implications for what students see about your institution, and also for the CollegeAffordability and Transparency Center's lists. Revisions or changes to costs can ONLY be made in the StudentFinancial Aid component and not in the prior year revision system.
Remember, it is the responsibility of the keyholder to submit accurate data about the institution. Please contact theIPEDS Help Desk for clarifications to make sure that you are reporting correctly.
Changes to This Year's IC Component:• All of the Part B Admissions questions have been moved to the new Admissions (ADM)
component. A screening question on IC-Header will determine if your institution is required tocomplete ADM in the Winter Collection.
• Estimated enrollment numbers were part of the admissions questions in IC, but was not movedto the new ADM component. Starting this year, IPEDS will no longer collect estimatedenrollment numbers.
• A new question on the services and programs for military servicemembers and veterans hasbeen added and placed in Part B of IC, which used to have the admissions questions.
Common ErrorsQuality control reviews of past IC data indicate frequently made errors. Please review the common errors below toensure accurate reporting. Additional common errors or tips can be found in the New Keyholder Handbook underResources.
• Question 2 should only be marked 'YES' if your institution is EXCLUSIVELY distance education. Do not mark'YES' if your courses/programs are also available in person.
• Do not try to outsmart fatal errors; this is falsifying data. Contact the Help Desk to override, or fix, the data.• Make sure you understand ALL definitions before responding to questions. For example, make sure that you
are reporting for an 'ACADEMIC YEAR' or 'PROGRAM' as defined by IPEDS.
  To download the survey materials for this component: Survey Materials To access your prior year data submission for this component: Reported Data

Institution: University of Florida-Online (484473)User ID: 88G4434
Part A - Mission Statement and Distance Education1. Provide the institution's mission statement or a web address (URL) where the mission statement can befound. Typed statements are limited to 2,000 characters or less. The mission statement will be available to thepublic on College Navigator. Mission Statement URL:
Please begin URL with "http://" or "https://"
Mission Statement
2. Are all the programs at your institution offered exclusively via distance education? Yes
No
http://ufonline.ufl.edu/

Imagedescription.Thesecontext noteswill beposted onthe CollegeNavigator.End of imagedescription.
Institution: University of Florida-Online (484473)User ID: 88G4434
Part B - Services and Programs for Servicemembers and Veterans1. Which of the following are available to veterans, military servicemembers, or their families? Yellow Ribbon Program (officially known as Post-9/11 GI Bill, Yellow Ribbon Program)
Credit for military training
Dedicated point of contact for support services for veterans, military servicemembers, and their families
Recognized student veteran organization
Member of Servicemembers Opportunity Colleges
None of the above
You may use the space below to provide context for the data you've reported above. These context noteswill be posted on the College Navigator website, and should be written to be understood by students andparents. Office of Veterans Services www.veterans.ufl.edu Collegiate VeteransSuccess Center www.dso.ufl.edu/veteran

Institution: University of Florida-Online (484473)User ID: 88G4434
Part C - Student Services - Special Learning Opportunities1. Does your institution accept any of the following? [Check all that apply] Dual credit (college credit earned while in high school)
Credit for life experiences
Advanced placement (AP) credits
None of the above
2. What types of special learning opportunities are offered by your institution? [Check all that apply] ROTC
Army Navy Air Force
Study abroad
Weekend/evening college
Teacher certification (for the elementary, middle school/junior high, or secondary level)
Do not include certifications to teach at the postsecondary level. Students can complete their preparation in certain areas of specialization
Students must complete their preparation at another institution for certain areas of specialization
This institution is approved by the state for the initial certification or licensure of teachers
None of the above
3. If your institution grants a bachelor's degree or higher but does not offer a full 4-year program of study at theundergraduate level, how many years of completed college-level work are required for entrance? Number of years Select One

Imagedescription.Thesecontext noteswill beposted onthe CollegeNavigator.End of imagedescription.
Institution: University of Florida-Online (484473)User ID: 88G4434
Part C - Student Services - Distance Opportunities4. Which of the following selected student services are offered by your institution? [Check all that apply] Remedial services
Academic/career counseling services
Employment services for current students
Placement services for program completers
On-campus day care for children of students
None of the above
5. Does your institution have its own library or are you financially supporting a shared library with anotherpostsecondary education institution? Have our own library
Do not have our own library but contribute financial support to a shared library
Neither of the above
6. Indicate whether or not any of the following alternative tuition plans are offered by your institution. No
Yes
Tuition guarantee
Prepaid tuition plan
Tuition payment plan
Other (specify in box below)
7. Please indicate at what level(s) your institution offers distance education opportunities (courses and/orprograms). Undergraduate
Graduate
The institution does not offer distance education opportunities
You may use the space below to provide context for the alternative tuition plans you've reported above.These context notes will be posted on the College Navigator website, and should be written to be understoodby students and parents.

Imagedescription.Thesecontext noteswill beposted onthe CollegeNavigator.End of imagedescription.
Institution: University of Florida-Online (484473)User ID: 88G4434
Part C - Disability ServicePlease indicate the percentage of all undergraduate students enrolled during fall 2013 who were formallyregistered as students with disabilities with the institution's office of disability services (or the equivalentoffice). 3 percent or less
More than 3 percent: %
You may use the space below to provide context for the data you've reported above. These context noteswill be posted on the College Navigator website, and should be written to be understood by students andparents.

Institution: University of Florida-Online (484473)User ID: 88G4434
Part D - Student Charges Questions1. Are all full-time, first-time degree/certificate-seeking students required to live on campus or in institutionally-controlled housing?If you answer Yes to this question, you will not be asked to report off-campus room and board in the price of attendance(D11).
This is only a screening question, and your response does not show up on College Navigator.
If you make any exceptions to this rule, and have even one first-time, full-time student living off-campus, please answerNo so that this does not cause conflicts with the Student Financial Aid survey. Making changes to the SFA component isvery difficult and may lead to inaccurate reporting for your institution. No
Yes, and we do not make ANY(even one) exceptions to this rule
2. Does your institution charge different tuition for in-district, in-state, or out-of-state students?If you answer Yes to this question, you will be expected to report tuition amounts for in-district, in-state, and out-of-statestudents.
Please only select Yes if you really charge different tuition rates, or you will be reporting the same numbers 3 times. No
Yes
3. Does your institution offer institutionally-controlled housing (either on or off campus)?If you answer Yes to this question, you will be expected to specify a housing capacity, and to report a room charge or acombined room and board charge (D10). No
Yes
Specify housing capacity foracademic year 2014-15
4. Do you offer board or meal plans to your students?If you answer Yes to this question, you will be expected to report a board charge or combined room and board charge(D10). No
Yes - Enter the number of mealsper week in the maximum mealplan available
Yes - Number of meals per week
can vary (e.g., students' chargemeals against a meal card)
Institution: University of Florida-Online (484473)User ID: 88G4434
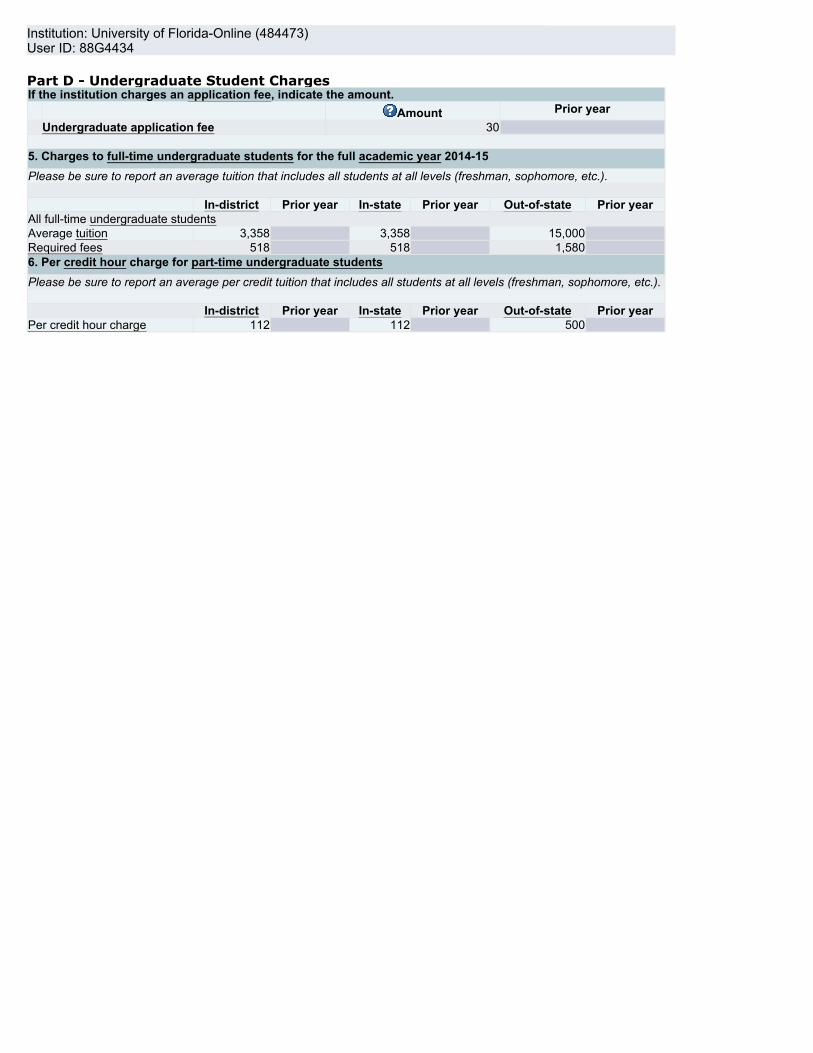
Part D - Undergraduate Student ChargesIf the institution charges an application fee, indicate the amount. Amount Prior year Undergraduate application fee 30 5. Charges to full-time undergraduate students for the full academic year 2014-15Please be sure to report an average tuition that includes all students at all levels (freshman, sophomore, etc.). In-district Prior year In-state Prior year Out-of-state Prior yearAll full-time undergraduate studentsAverage tuition 3,358 3,358 15,000 Required fees 518 518 1,580 6. Per credit hour charge for part-time undergraduate studentsPlease be sure to report an average per credit tuition that includes all students at all levels (freshman, sophomore, etc.). In-district Prior year In-state Prior year Out-of-state Prior yearPer credit hour charge 112 112 500

Imagedescription.Thesecontext noteswill beposted onthe CollegeNavigator.End of imagedescription.
Institution: University of Florida-Online (484473)User ID: 88G4434
Part D - Student Charges - Price of Attendance11. Cost of attendance for full-time, first-time undergraduate students:Please enter the amounts requested below. These data will be made available to the public on College Navigator. Ifyour institution participates in any Title IV programs (Pell, Stafford, etc.), you must complete all information. Estimates ofexpenses for books and supplies, room and board, and other expenses are those from the Cost of Attendance reportused by the financial aid office in determining financial need. Please talk to your financial aid office to get thesenumbers, to ensure that you are reporting correctly. Charges for fullacademic year
2011-12 2012-13 2013-14 2014-15
Published tuition and required fees: Tuition Guarantee(check only if applicable toentering students in 2014-15)
Guaranteedincrease %
In-district Tuition 3,358
Required fees 518
Tuition + feestotal
0 0 0 3,876
In-state Tuition 3,358
Required fees 518
Tuition + feestotal
0 0 0 3,876
Out-of-state Tuition 15,000
Required fees 1,580
Tuition + feestotal
0 0 0 16,580
Books andsupplies
1,290
Off-campus (not with family): Room and board 9,630 Other expenses 2,350 Room and boardand otherexpenses
0 0 0 11,980
Off-campus (with family): Other expenses 2,350
You may use the space below to provide context for the data you've reported above. These context noteswill be posted on the College Navigator website, and should be written to be understood by students andparents.

Institution: University of Florida-Online (484473)User ID: 88G4434
Part E - Athletic Association1. Is this institution a member of a national athletic association?
No
Yes - Check all that apply
National Collegiate Athletic Association (NCAA)
National Association of Intercollegiate Athletics (NAIA)
National Junior College Athletic Association (NJCAA)
United States Collegiate Athletic Association (USCAA)
National Christian College Athletic Association(NCCAA)
Other
2. If this institution is a member of the NCAA or NAIA, specify the conference FOR EACH SPORT using the pulldown menu. Sport NCAA or NAIA member ConferenceFootball No Yes-Specify Southeastern Conference
Basketball No Yes-Specify Southeastern Conference
Baseball No Yes-Specify Southeastern Conference
Cross country and/or track No Yes-Specify Southeastern Conference

Institution: University of Florida-Online (484473)User ID: 88G4434
Prepared by This survey component was prepared by: Keyholder SFA Contact HR Contact
Finance Contact Academic Library Contact Other
Name: Marie Zeglen Email: [email protected] How long did it take to prepare thissurvey component?
2hours minutes
The name of the preparer is being collected so that we can follow up with the appropriate person in the event that thereare questions concerning the data. The Keyholder will be copied on all email correspondence to other preparers.The time it took to prepare this component is being collected so that we can continue to improve our estimate of thereporting burden associated with IPEDS. Please include in your estimate the time it took for you to review instructions,query and search data sources, complete and review the component, and submit the data through the Data CollectionSystem.Thank you for your assistance.

Institution: University of Florida-Online (484473) User ID: 88G4434Summary
Institutional Characteristics Component SummaryAcademic Year Reporters
IPEDS collects important information regarding your institution. All data reported in IPEDSsurvey components become available in the IPEDS Data Center and appear as aggregated datain various Department of Education reports. Additionally, some of the reported data appearsspecifically for your institution through the College Navigator website and is included in yourinstitution’s Data Feedback Report (DFR). The purpose of this summary is to provide you anopportunity to view some of the data that, when accepted through the IPEDS quality controlprocess, will appear on the College Navigator website and/or your DFR. College Navigator isupdated approximately three months after the data collection period closes and Data FeedbackReports will be available through the Data Center and sent to your institution’s CEO inNovember 2015.
Please review your data for accuracy. If you have questions about the data displayed belowafter reviewing the data reported on the survey screens, please contact the IPEDS Help Desk at:1-877-225-2568 or [email protected].
GENERAL INFORMATIONMission Statement http://ufonline.ufl.edu/mission/
Are all the programs at your institutionoffered completely via distanceeducation?
Yes
Special Learning Opportunities Study abroad
Student Services Academic/career counseling servicesPlacement services for program completers
Credit Accepted Dual credit (college credit earned while in high school)Advanced placement (AP) credits
Undergraduate students enrolled whoare formally registered with office ofdisability services
3 percent or less
PRICING INFORMATION
Estimated expenses for academic year for full-time, first-time students 2011-12 2012-13 2013-14 2014-15
In-district tuition and fees $0 $0 $0 $3,876
In-state tuition and fees $0 $0 $0 $3,876
Out-of-state tuition and fees $0 $0 $0 $16,580
Books and supplies N/A N/A N/A $1,290
Off-campus room and board N/A N/A N/A $9,630
Off-campus other expenses N/A N/A N/A $2,350
Off-campus with family other expenses N/A N/A N/A $2,350
Average undergraduate student tuition and fees for academic year 2014-15
Tuition Fees
In-district $3,358 $518
In-state $3,358 $518
Out-of-state $15,000 $1,580
Alternative tuition plans Prepaid tuition plan

Institution: University of Florida-Online (484473) User ID: 88G4434Edit Report
Institutional Characteristics
University of Florida-Online (484473)
Source Description Severity Resolved OptionsScreen: Price of Attendance
ScreenEntry
This field should not be blank. Please correct yourdata or explain. (Error #11107)
Explanation Yes
Reason: University of Florida-Online is a new IPEDS institution beginning in 2014-15. There are no historical data available.ScreenEntry
This field should not be blank. Please correct yourdata or explain. (Error #11107)
Explanation Yes
Reason: University of Florida-Online is a new IPEDS institution beginning in 2014-15. There are no historical data available.ScreenEntry
This field should not be blank. Please correct yourdata or explain. (Error #11107)
Explanation Yes
Reason: University of Florida-Online is a new IPEDS institution beginning in 2014-15. There are no historical data available.ScreenEntry
This field should not be blank. Please correct yourdata or explain. (Error #11107)
Explanation Yes
Reason: University of Florida-Online is a new IPEDS institution beginning in 2014-15. There are no historical data available.ScreenEntry
This field should not be blank. Please correct yourdata or explain. (Error #11107)
Explanation Yes
Reason: University of Florida-Online is a new IPEDS institution beginning in 2014-15. There are no historical data available.ScreenEntry
This field should not be blank. Please correct yourdata or explain. (Error #11107)
Explanation Yes
Reason: University of Florida-Online is a new IPEDS institution beginning in 2014-15. There are no historical data available.ScreenEntry
This field should not be blank. Please correct yourdata or explain. (Error #11107)
Explanation Yes
Reason: University of Florida-Online is a new IPEDS institution beginning in 2014-15. There are no historical data available.ScreenEntry
This field should not be blank. Please correct yourdata or explain. (Error #11107)
Explanation Yes
Reason: University of Florida-Online is a new IPEDS institution beginning in 2014-15. There are no historical data available.ScreenEntry
This field should not be blank. Please correct yourdata or explain. (Error #11107)
Explanation Yes
Reason: University of Florida-Online is a new IPEDS institution beginning in 2014-15. There are no historical data available.ScreenEntry
This field should not be blank. Please correct yourdata or explain. (Error #11107)
Explanation Yes
Reason: University of Florida-Online is a new IPEDS institution beginning in 2014-15. There are no historical data available.ScreenEntry
This field should not be blank. Please correct yourdata or explain. (Error #11107)
Explanation Yes
Reason: University of Florida-Online is a new IPEDS institution beginning in 2014-15. There are no historical data available.ScreenEntry
This field should not be blank. Please correct yourdata or explain. (Error #11107)
Explanation Yes
Reason: University of Florida-Online is a new IPEDS institution beginning in 2014-15. There are no historical data available.ScreenEntry
This field should not be blank. Please correct yourdata or explain. (Error #11107)
Explanation Yes
Reason: University of Florida-Online is a new IPEDS institution beginning in 2014-15. There are no historical data available.ScreenEntry
This field should not be blank. Please correct yourdata or explain. (Error #11107)
Explanation Yes
Reason: University of Florida-Online is a new IPEDS institution beginning in 2014-15. There are no historical data available.ScreenEntry
This field should not be blank. Please correct yourdata or explain. (Error #11107)
Explanation Yes
Reason: University of Florida-Online is a new IPEDS institution beginning in 2014-15. There are no historical data available.ScreenEntry
This field should not be blank. Please correct yourdata or explain. (Error #11107)
Explanation Yes
Reason: University of Florida-Online is a new IPEDS institution beginning in 2014-15. There are no historical data available.ScreenEntry
This field should not be blank. Please correct yourdata or explain. (Error #11107)
Explanation Yes
Reason: University of Florida-Online is a new IPEDS institution beginning in 2014-15. There are no historical data available.ScreenEntry
This field should not be blank. Please correct yourdata or explain. (Error #11107)
Explanation Yes
Reason: University of Florida-Online is a new IPEDS institution beginning in 2014-15. There are no historical data available.ScreenEntry
This field should not be blank. Please correct yourdata or explain. (Error #11107)
Explanation Yes
Reason: University of Florida-Online is a new IPEDS institution beginning in 2014-15. There are no historical data available.

ScreenEntry
This field should not be blank. Please correct yourdata or explain. (Error #11107)
Explanation Yes
Reason: University of Florida-Online is a new IPEDS institution beginning in 2014-15. There are no historical data available.ScreenEntry
The amount entered for tuition and fees is expectedto be greater than 500. Please correct your data orexplain. (Error #11250)
Explanation Yes
Reason: University of Florida-Online is a new IPEDS institution beginning in 2014-15. There are no historical data available.ScreenEntry
The amount entered for tuition and fees is expectedto be greater than 500. Please correct your data orexplain. (Error #11250)
Explanation Yes
Reason: University of Florida-Online is a new IPEDS institution beginning in 2014-15. There are no historical data available.ScreenEntry
This value is expected to be within 20% of the prioryear amount. Please correct your data or explain.(Error #11110)
Explanation Yes
Reason: University of Florida-Online is a new IPEDS institution beginning in 2014-15. There are no historical data available.ScreenEntry
The amount entered for tuition and fees is expectedto be greater than 500. Please correct your data orexplain. (Error #11250)
Explanation Yes
Reason: University of Florida-Online is a new IPEDS institution beginning in 2014-15. There are no historical data available.ScreenEntry
The amount entered for tuition and fees is expectedto be greater than 500. Please correct your data orexplain. (Error #11250)
Explanation Yes
Reason: University of Florida-Online is a new IPEDS institution beginning in 2014-15. There are no historical data available.ScreenEntry
This value is expected to be within 20% of the prioryear amount. Please correct your data or explain.(Error #11110)
Explanation Yes
Reason: University of Florida-Online is a new IPEDS institution beginning in 2014-15. There are no historical data available.

Fall Enrollment 2014-15Institution: University of Florida (134130)User ID: 88G4433
OverviewFall Enrollment Overview
The Fall Enrollment component collects student enrollment counts by level of student, enrollment status, gender andrace/ethnicity. In addition, first-time student retention rates and the student-to-faculty ratio are collected. Every otheryear data on residence of first-time undergraduates is required and in opposite years, enrollment by student age isrequired to be reported.
Institutions operating on a traditional academic year calendar (semester, trimester, quarter, or 4-1-4) report Fallenrollment as of the institution's official fall reporting date or October 15. Institutions operating on a calendar thatdiffers by program or that enrolls students on a continuous basis (referred to as program reporters) report Fallenrollment as students enrolled any time during the period August 1 and October 31.
Data Reporting Reminders:
•Part B, Enrollment of students by age, is optional this year.•Part C, Residence of first-time degree/certificate-seeking undergraduates, is required this year.
Resources:To download the survey materials for this component: Survey Materials
To access your prior year data submission for this component: Reported Data
If you have questions about completing this survey, please contact the IPEDS Help Desk at 1-877-225-2568.

Institution: University of Florida (134130)User ID: 88G4433
Part SelectionCompletion of Part B (Enrollment of Students by Age) is optional this year.
Do you wish to complete Part B this year?If you select 'Yes', you will be expected to complete the Part B screens.If you select 'No', you will skip Part B. Yes, I will complete Part B
No, I will not complete Part B

Institution: University of Florida (134130)User ID: 88G4433
Fall Enrollment - CIPCODE SelectionIndicate which of the following fields of study are offered by your institution. Students are to be reported bytheir major field of study for the categories listed below. Fields for which enrollment was reported for Fall 2012have already been checked; please make sure all listed fields that are offered by your institution are checked. Undergraduate and graduate fields 13.0000 -- Education
14.0000 -- Engineering
26.0000 -- Biological and Biomedical Sciences
27.0000 -- Mathematics
40.0000 -- Physical Sciences
52.0000 -- Business, Management, Marketing, and Related Support Services
Graduate-only fields 22.0101 -- Law (LL.B., J.D.)
51.0401 -- Dentistry (D.D.S., D.M.D.)
51.1201 -- Medicine (M.D.)
None of the above
You may use the space below to provide context for the data you've reported above.

Institution: University of Florida (134130)User ID: 88G4433
Part A - Fall Enrollment for Full-Time Undergraduate StudentsEnrollment as of the institution's official fall reporting date or as of October 15, 2014
Full-time Undergraduate Students
Race/Ethnicity Reporting Reminder:•Report Hispanic/Latino individuals of any race as Hispanic/Latino•Report race for non-Hispanic/Latino individuals only
MenEnrolled for credit Degree/certificate-seeking
First-timeTransfer-in Continuing/Returning
Total degree/certificate-seeking
Non-degree/non-certificate-seeking
Total,Full-time
undergraduatestudents
Nonresident alien 23 30 136 189 76 265Hispanic/Latino 492 167 1,821 2,480 19 2,499American Indian orAlaska Native
3 11 22 36 0 36
Asian 260 38 806 1,104 3 1,107Black or AfricanAmerican
123 40 538 701 9 710
Native Hawaiian orOther PacificIslander
5 4 43 52 0 52
White 1,615 416 5,743 7,774 23 7,797Two or more races 83 10 258 351 0 351Race and ethnicityunknown
75 37 267 379 2 381
Total men 2,679 753 9,634 13,066 132 13,198Total men prior year 2,646 831 9,826 13,303 124 13,427
WomenEnrolled for credit Degree/certificate-seeking
First-timeTransfer-in Continuing/Returning
Total degree/certificate-seeking
Non-degree/non-certificate-seeking
Total,Full-time
undergraduatestudents
Nonresident alien 40 21 113 174 89 263Hispanic/Latino 812 196 2,386 3,394 12 3,406American Indian orAlaska Native
3 5 24 32 0 32
Asian 340 30 852 1,222 6 1,228Black or AfricanAmerican
237 51 989 1,277 16 1,293
Native Hawaiian orOther PacificIslander
3 3 118 124 2 126
White 2,144 395 6,795 9,334 66 9,400Two or more races 122 15 382 519 4 523Race and ethnicityunknown
95 29 311 435 3 438
Total women 3,796 745 11,970 16,511 198 16,709Total women prioryear
3,702 752 12,297 16,751 136 16,887
Grand total(men+women)
6,475 1,498 21,604 29,577 330 29,907
Grand total(men+women) prioryear
6,348 1,583 22,123 30,054 260 30,314

Institution: University of Florida (134130)User ID: 88G4433
Part A - Fall Enrollment by race/ethnicity and genderEnrollment as of the institution's official fall reporting date or as of October 15, 2014
CIPCODE: 13.0000 -- EducationFull-time undergraduate students
•Report Hispanic/Latino individuals of any race as Hispanic/Latino•Report race for non-Hispanic/Latino individuals only
MenStudents enrolled for credit Degree/certificate-seeking
First-time Transfer-in Continuing/Returning
TotalNon-degree/
non-certificate-seekingTotal,
full-timeundergraduate
studentsNonresident alien 0 0 0 0 0 0Hispanic/Latino 0 2 5 7 0 7American Indian or Alaska Native 0 0 1 1 0 1Asian 0 0 3 3 0 3Black or African American 0 1 3 4 0 4Native Hawaiian or Other Pacific Islander 0 0 1 1 0 1White 9 11 48 68 0 68Two or more races 0 0 1 1 0 1Race and ethnicity unknown 0 1 0 1 0 1Total men 9 15 62 86 0 86
WomenStudents enrolled for credit Degree/certificate-seeking
First-time Transfer-in Continuing/Returning
TotalNon-degree/
non-certificate-seekingTotal,
full-timeundergraduate
studentsNonresident alien 1 0 1 2 0 2Hispanic/Latino 6 6 57 69 0 69American Indian or Alaska Native 0 0 1 1 0 1Asian 1 1 6 8 0 8Black or African American 2 1 16 19 0 19Native Hawaiian or Other Pacific Islander 0 0 1 1 0 1White 30 40 286 356 1 357Two or more races 2 0 11 13 0 13Race and ethnicity unknown 2 0 5 7 0 7Total women 44 48 384 476 1 477
Grand total (men+women) 53 63 446 562 1 563Grand total (men+women) 2012-13 53 46 475 574 1 575

Institution: University of Florida (134130)User ID: 88G4433
Part A - Fall Enrollment by race/ethnicity and genderEnrollment as of the institution's official fall reporting date or as of October 15, 2014
CIPCODE: 14.0000 -- EngineeringFull-time undergraduate students
•Report Hispanic/Latino individuals of any race as Hispanic/Latino•Report race for non-Hispanic/Latino individuals only
MenStudents enrolled for credit Degree/certificate-seeking
First-time Transfer-in Continuing/Returning
TotalNon-degree/
non-certificate-seekingTotal,
full-timeundergraduate
studentsNonresident alien 8 7 46 61 1 62Hispanic/Latino 130 31 561 722 0 722American Indian or Alaska Native 2 2 1 5 0 5Asian 66 8 226 300 0 300Black or African American 22 6 94 122 0 122Native Hawaiian or Other Pacific Islander 2 1 7 10 0 10White 458 68 1,658 2,184 0 2,184Two or more races 24 0 77 101 0 101Race and ethnicity unknown 24 7 67 98 1 99Total men 736 130 2,737 3,603 2 3,605
WomenStudents enrolled for credit Degree/certificate-seeking
First-time Transfer-in Continuing/Returning
TotalNon-degree/
non-certificate-seekingTotal,
full-timeundergraduate
studentsNonresident alien 6 3 10 19 0 19Hispanic/Latino 62 5 204 271 0 271American Indian or Alaska Native 0 0 0 0 0 0Asian 32 2 73 107 0 107Black or African American 4 3 31 38 0 38Native Hawaiian or Other Pacific Islander 1 0 2 3 0 3White 166 9 525 700 1 701Two or more races 19 0 29 48 0 48Race and ethnicity unknown 11 0 33 44 0 44Total women 301 22 907 1,230 1 1,231
Grand total (men+women) 1,037 152 3,644 4,833 3 4,836Grand total (men+women) 2012-13 1,011 175 3,755 4,941 7 4,948

Institution: University of Florida (134130)User ID: 88G4433
Part A - Fall Enrollment by race/ethnicity and genderEnrollment as of the institution's official fall reporting date or as of October 15, 2014
CIPCODE: 26.0000 -- Biological and Biomedical SciencesFull-time undergraduate students
•Report Hispanic/Latino individuals of any race as Hispanic/Latino•Report race for non-Hispanic/Latino individuals only
MenStudents enrolled for credit Degree/certificate-seeking
First-time Transfer-in Continuing/Returning
TotalNon-degree/
non-certificate-seekingTotal,
full-timeundergraduate
studentsNonresident alien 0 4 2 6 0 6Hispanic/Latino 48 13 165 226 0 226American Indian or Alaska Native 0 2 2 4 0 4Asian 43 6 154 203 1 204Black or African American 9 3 45 57 0 57Native Hawaiian or Other Pacific Islander 1 0 9 10 0 10White 132 26 498 656 0 656Two or more races 9 2 21 32 0 32Race and ethnicity unknown 5 2 30 37 0 37Total men 247 58 926 1,231 1 1,232
WomenStudents enrolled for credit Degree/certificate-seeking
First-time Transfer-in Continuing/Returning
TotalNon-degree/
non-certificate-seekingTotal,
full-timeundergraduate
studentsNonresident alien 2 1 6 9 0 9Hispanic/Latino 114 21 276 411 1 412American Indian or Alaska Native 0 1 5 6 0 6Asian 78 8 176 262 0 262Black or African American 29 8 74 111 2 113Native Hawaiian or Other Pacific Islander 0 2 19 21 0 21White 279 43 716 1,038 1 1,039Two or more races 13 2 39 54 1 55Race and ethnicity unknown 12 1 37 50 0 50Total women 527 87 1,348 1,962 5 1,967
Grand total (men+women) 774 145 2,274 3,193 6 3,199Grand total (men+women) 2012-13 835 146 2,272 3,253 1 3,254

Institution: University of Florida (134130)User ID: 88G4433
Part A - Fall Enrollment by race/ethnicity and genderEnrollment as of the institution's official fall reporting date or as of October 15, 2014
CIPCODE: 27.0000 -- Mathematics and StatisticsFull-time undergraduate students
•Report Hispanic/Latino individuals of any race as Hispanic/Latino•Report race for non-Hispanic/Latino individuals only
MenStudents enrolled for credit Degree/certificate-seeking
First-time Transfer-in Continuing/Returning
TotalNon-degree/
non-certificate-seekingTotal,
full-timeundergraduate
studentsNonresident alien 2 1 2 5 5Hispanic/Latino 4 1 22 27 27American Indian or Alaska Native 0 0 1 1 1Asian 6 1 17 24 24Black or African American 0 1 1 2 2Native Hawaiian or Other Pacific Islander 0 0 0 0 0White 13 5 79 97 97Two or more races 1 0 5 6 6Race/ethnicity unknown 2 2 5 9 9Total men 28 11 132 171 0 171
WomenStudents enrolled for credit Degree/certificate-seeking
First-time Transfer-in Continuing/Returning
TotalNon-degree/
non-certificate-seekingTotal,
full-timeundergraduate
studentsNonresident alien 0 1 3 4 4Hispanic/Latino 5 0 15 20 20American Indian or Alaska Native 0 0 0 0 0Asian 1 0 13 14 14Black or African American 1 0 2 3 3Native Hawaiian or Other Pacific Islander 0 0 0 0 0White 23 2 57 82 82Two or more races 2 0 2 4 4Race/ethnicity unknown 3 0 1 4 4Total women 35 3 93 131 0 131
Grand total (men+women) 63 14 225 302 0 302Grand total (men+women) 2012-13 55 14 221 290 290

Institution: University of Florida (134130)User ID: 88G4433
Part A - Fall Enrollment by race/ethnicity and genderEnrollment as of the institution's official fall reporting date or as of October 15, 2014
CIPCODE: 40.0000 -- Physical SciencesFull-time undergraduate students
•Report Hispanic/Latino individuals of any race as Hispanic/Latino•Report race for non-Hispanic/Latino individuals only
MenStudents enrolled for credit Degree/certificate-seeking
First-time Transfer-in Continuing/Returning
TotalNon-degree/
non-certificate-seekingTotal,
full-timeundergraduate
studentsNonresident alien 0 2 2 4 0 4Hispanic/Latino 30 11 57 98 0 98American Indian or Alaska Native 0 2 2 4 0 4Asian 14 4 48 66 0 66Black or African American 1 2 14 17 0 17Native Hawaiian or Other Pacific Islander 0 1 1 2 0 2White 62 13 195 270 1 271Two or more races 6 1 6 13 0 13Race/ethnicity unknown 6 0 13 19 0 19Total men 119 36 338 493 1 494
WomenStudents enrolled for credit Degree/certificate-seeking
First-time Transfer-in Continuing/Returning
TotalNon-degree/
non-certificate-seekingTotal,
full-timeundergraduate
studentsNonresident alien 2 1 3 6 0 6Hispanic/Latino 30 5 39 74 0 74American Indian or Alaska Native 0 0 1 1 0 1Asian 24 1 33 58 0 58Black or African American 11 2 9 22 0 22Native Hawaiian or Other Pacific Islander 0 0 4 4 0 4White 72 9 108 189 0 189Two or more races 2 1 10 13 0 13Race/ethnicity unknown 3 0 8 11 0 11Total women 144 19 215 378 0 378
Grand total (men+women) 263 55 553 871 1 872Grand total (men+women) 2012-13 253 51 510 814 814

Institution: University of Florida (134130)User ID: 88G4433
Part A - Fall Enrollment by race/ethnicity and genderEnrollment as of the institution's official fall reporting date or as of October 15, 2014
CIPCODE: 52.0000 -- Business, Management, Marketing and Related Support ServicesFull-time undergraduate students
•Report Hispanic/Latino individuals of any race as Hispanic/Latino•Report race for non-Hispanic/Latino individuals only
MenStudents enrolled for credit Degree/certificate-seeking
First-time Transfer-in Continuing/Returning
TotalNon-degree/
non-certificate-seekingTotal,
full-timeundergraduate
studentsNonresident alien 5 5 27 37 0 37Hispanic/Latino 69 9 231 309 1 310American Indian or Alaska Native 0 1 4 5 0 5Asian 36 3 87 126 0 126Black or African American 9 2 40 51 0 51Native Hawaiian or Other Pacific Islander 0 0 1 1 0 1White 324 25 886 1,235 1 1,236Two or more races 16 0 17 33 0 33Race/ethnicity unknown 19 4 43 66 0 66Total men 478 49 1,336 1,863 2 1,865
WomenStudents enrolled for credit Degree/certificate-seeking
First-time Transfer-in Continuing/Returning
TotalNon-degree/
non-certificate-seekingTotal,
full-timeundergraduate
studentsNonresident alien 8 1 21 30 0 30Hispanic/Latino 82 6 235 323 0 323American Indian or Alaska Native 0 0 0 0 0 0Asian 31 4 79 114 0 114Black or African American 17 0 37 54 0 54Native Hawaiian or Other Pacific Islander 0 0 5 5 0 5White 271 6 702 979 1 980Two or more races 10 0 34 44 1 45Race/ethnicity unknown 6 6 41 53 0 53Total women 425 23 1,154 1,602 2 1,604
Grand total (men+women) 903 72 2,490 3,465 4 3,469Grand total (men+women) 2012-13 743 202 2,168 3,113 3,113

Institution: University of Florida (134130)User ID: 88G4433
Part A - Fall Enrollment for Part-time Undergraduate StudentsEnrollment as of the institution's official fall reporting date or as of October 15, 2014
Part-time Undergraduate Students
Race/Ethnicity Reporting Reminder:•Report Hispanic/Latino individuals of any race as Hispanic/Latino•Report race for non-Hispanic/Latino individuals only
MenEnrolled for credit Degree/certificate-seeking
First-time Transfer-inContinuing/Returning
Total degree/certificate-seeking
Non-degree/non-certificate-seeking
Total,part-time
undergraduatestudents
Nonresident alien 0 1 15 16 8 24Hispanic/Latino 5 15 251 271 49 320American Indian orAlaska Native
0 0 7 7 0 7
Asian 1 2 78 81 21 102Black or AfricanAmerican
0 6 64 70 16 86
Native Hawaiian orOther PacificIslander
0 0 8 8 2 10
White 8 56 705 769 153 922Two or more races 1 0 24 25 8 33Race and ethnicityunknown
0 3 37 40 8 48
Total men 15 83 1,189 1,287 265 1,552Total men prior year 10 109 1,160 1,279 273 1,552
WomenEnrolled for credit Degree/certificate-seeking
First-time Transfer-inContinuing/Returning
Total degree/certificate-seeking
Non-degree/non-certificate-seeking
Total,part-time
undergraduatestudents
Nonresident alien 0 1 7 8 5 13Hispanic/Latino 1 23 217 241 71 312American Indian orAlaska Native
0 0 6 6 2 8
Asian 0 2 61 63 27 90Black or AfricanAmerican
2 6 68 76 28 104
Native Hawaiian orOther PacificIslander
0 0 8 8 0 8
White 11 32 516 559 199 758Two or more races 0 0 22 22 13 35Race and ethnicityunknown
0 3 29 32 10 42
Total women 14 67 934 1,015 355 1,370Total women prioryear
12 114 887 1,013 289 1,302
Grand total(men+women)
29 150 2,123 2,302 620 2,922
Grand total(men+women) prioryear
22 223 2,047 2,292 562 2,854

Institution: University of Florida (134130)User ID: 88G4433
Part A - Fall Enrollment by race/ethnicity and genderEnrollment as of the institution's official fall reporting date or as of October 15, 2014
CIPCODE: 13.0000 -- EducationPart-time undergraduate students
•Report Hispanic/Latino individuals of any race as Hispanic/Latino•Report race for non-Hispanic/Latino individuals only
MenStudents enrolled for credit Degree/certificate-seeking
First-time Transfer-in Continuing/Returning
TotalNon-degree/
non-certificate-seekingTotal,
part-timeundergraduate
studentsNonresident alien 0 0 0 0Hispanic/Latino 0 2 2 2American Indian or Alaska Native 0 1 1 1Asian 0 0 0 0Black or African American 0 0 0 0Native Hawaiian or Other Pacific Islander 0 0 0 0White 1 4 5 5Two or more races 0 0 0 0Race/ethnicity unknown 0 0 0 0Total men 0 1 7 8 0 8
WomenStudents enrolled for credit Degree/certificate-seeking
First-time Transfer-in Continuing/Returning
TotalNon-degree/
non-certificate-seekingTotal,
part-timeundergraduate
studentsNonresident alien 0 0 0 0Hispanic/Latino 0 4 4 4American Indian or Alaska Native 0 0 0 0Asian 0 0 0 0Black or African American 0 0 0 0Native Hawaiian or Other Pacific Islander 0 0 0 0White 0 8 8 8Two or more races 0 0 0 0Race/ethnicity unknown 0 0 0 0Total women 0 0 12 12 0 12
Grand total (men+women) 0 1 19 20 0 20Grand total (men+women) 2012-13 2 13 15 1 16

Institution: University of Florida (134130)User ID: 88G4433
Part A - Fall Enrollment by race/ethnicity and genderEnrollment as of the institution's official fall reporting date or as of October 15, 2014
CIPCODE: 14.0000 -- EngineeringPart-time undergraduate students
•Report Hispanic/Latino individuals of any race as Hispanic/Latino•Report race for non-Hispanic/Latino individuals only
MenStudents enrolled for credit Degree/certificate-seeking
First-time Transfer-in Continuing/Returning
TotalNon-degree/
non-certificate-seekingTotal,
part-timeundergraduate
studentsNonresident alien 0 0 8 8 0 8Hispanic/Latino 0 1 77 78 0 78American Indian or Alaska Native 0 0 1 1 0 1Asian 0 2 26 28 1 29Black or African American 0 0 16 16 0 16Native Hawaiian or Other Pacific Islander 0 0 0 0 0 0White 2 8 224 234 6 240Two or more races 1 0 5 6 0 6Race and ethnicity unknown 0 2 11 13 0 13Total men 3 13 368 384 7 391
WomenStudents enrolled for credit Degree/certificate-seeking
First-time Transfer-in Continuing/Returning
TotalNon-degree/
non-certificate-seekingTotal,
part-timeundergraduate
studentsNonresident alien 0 0 0 0 0 0Hispanic/Latino 0 1 26 27 1 28American Indian or Alaska Native 0 0 0 0 0 0Asian 0 0 11 11 0 11Black or African American 0 0 6 6 0 6Native Hawaiian or Other Pacific Islander 0 0 0 0 0 0White 1 3 54 58 2 60Two or more races 0 0 2 2 0 2Race and ethnicity unknown 0 0 3 3 0 3Total women 1 4 102 107 3 110
Grand total (men+women) 4 17 470 491 10 501Grand total (men+women) 2012-13 4 9 311 324 15 339

Institution: University of Florida (134130)User ID: 88G4433
Part A - Fall Enrollment by race/ethnicity and genderEnrollment as of the institution's official fall reporting date or as of October 15, 2014
CIPCODE: 26.0000 -- Biological and Biomedical SciencesPart-time undergraduate students
•Report Hispanic/Latino individuals of any race as Hispanic/Latino•Report race for non-Hispanic/Latino individuals only
MenStudents enrolled for credit Degree/certificate-seeking
First-time Transfer-in Continuing/Returning
TotalNon-degree/
non-certificate-seekingTotal,
part-timeundergraduate
studentsNonresident alien 0 0 1 1 1 2Hispanic/Latino 0 1 18 19 5 24American Indian or Alaska Native 0 0 0 0 0 0Asian 1 0 8 9 2 11Black or African American 0 0 5 5 1 6Native Hawaiian or Other Pacific Islander 0 0 2 2 0 2White 1 5 41 47 9 56Two or more races 0 0 2 2 0 2Race and ethnicity unknown 0 1 3 4 1 5Total men 2 7 80 89 19 108
WomenStudents enrolled for credit Degree/certificate-seeking
First-time Transfer-in Continuing/Returning
TotalNon-degree/
non-certificate-seekingTotal,
part-timeundergraduate
studentsNonresident alien 0 0 0 0 0 0Hispanic/Latino 0 3 24 27 4 31American Indian or Alaska Native 0 0 1 1 0 1Asian 0 1 10 11 1 12Black or African American 0 2 2 4 0 4Native Hawaiian or Other Pacific Islander 0 0 2 2 0 2White 0 2 33 35 0 35Two or more races 0 0 1 1 0 1Race and ethnicity unknown 0 0 5 5 0 5Total women 0 8 78 86 5 91
Grand total (men+women) 2 15 158 175 24 199Grand total (men+women) 2012-13 16 104 120 27 147

Institution: University of Florida (134130)User ID: 88G4433
Part A - Fall Enrollment by race/ethnicity and genderEnrollment as of the institution's official fall reporting date or as of October 15, 2014
CIPCODE: 27.0000 -- Mathematics and StatisticsPart-time undergraduate students
•Report Hispanic/Latino individuals of any race as Hispanic/Latino•Report race for non-Hispanic/Latino individuals only
MenStudents enrolled for credit Degree/certificate-seeking
First-time Transfer-in Continuing/Returning
TotalNon-degree/
non-certificate-seekingTotal,
part-timeundergraduate
studentsNonresident alien 0 0 0 0 0Hispanic/Latino 0 1 1 0 1American Indian or Alaska Native 0 1 1 0 1Asian 0 0 0 0 0Black or African American 0 1 1 0 1Native Hawaiian or Other Pacific Islander 0 0 0 0 0White 1 15 16 1 17Two or more races 0 0 0 0 0Race/ethnicity unknown 0 3 3 0 3Total men 1 0 21 22 1 23
WomenStudents enrolled for credit Degree/certificate-seeking
First-time Transfer-in Continuing/Returning
TotalNon-degree/
non-certificate-seekingTotal,
part-timeundergraduate
studentsNonresident alien 0 0 0 0 0Hispanic/Latino 0 0 0 0 0American Indian or Alaska Native 0 0 0 0 0Asian 0 1 1 0 1Black or African American 0 0 0 0 0Native Hawaiian or Other Pacific Islander 0 0 0 0 0White 0 8 8 1 9Two or more races 0 0 0 0 0Race/ethnicity unknown 0 0 0 0 0Total women 0 0 9 9 1 10
Grand total (men+women) 1 0 30 31 2 33Grand total (men+women) 2012-13 1 19 20 6 26

Institution: University of Florida (134130)User ID: 88G4433
Part A - Fall Enrollment by race/ethnicity and genderEnrollment as of the institution's official fall reporting date or as of October 15, 2014
CIPCODE: 40.0000 -- Physical SciencesPart-time undergraduate students
•Report Hispanic/Latino individuals of any race as Hispanic/Latino•Report race for non-Hispanic/Latino individuals only
MenStudents enrolled for credit Degree/certificate-seeking
First-time Transfer-in Continuing/Returning
TotalNon-degree/
non-certificate-seekingTotal,
part-timeundergraduate
studentsNonresident alien 0 0 0 0 0 0Hispanic/Latino 0 0 4 4 0 4American Indian or Alaska Native 0 0 0 0 0 0Asian 0 0 3 3 1 4Black or African American 0 0 0 0 0 0Native Hawaiian or Other Pacific Islander 0 0 0 0 0 0White 1 3 20 24 2 26Two or more races 0 0 2 2 0 2Race and ethnicity unknown 0 0 1 1 0 1Total men 1 3 30 34 3 37
WomenStudents enrolled for credit Degree/certificate-seeking
First-time Transfer-in Continuing/Returning
TotalNon-degree/
non-certificate-seekingTotal,
part-timeundergraduate
studentsNonresident alien 0 0 0 0 0 0Hispanic/Latino 0 0 2 2 0 2American Indian or Alaska Native 0 0 1 1 0 1Asian 0 0 1 1 0 1Black or African American 0 0 1 1 0 1Native Hawaiian or Other Pacific Islander 0 0 0 0 0 0White 1 0 8 9 1 10Two or more races 0 0 0 0 0 0Race and ethnicity unknown 0 0 1 1 0 1Total women 1 0 14 15 1 16
Grand total (men+women) 2 3 44 49 4 53Grand total (men+women) 2012-13 4 40 44 6 50

Institution: University of Florida (134130)User ID: 88G4433
Part A - Fall Enrollment by race/ethnicity and genderEnrollment as of the institution's official fall reporting date or as of October 15, 2014
CIPCODE: 52.0000 -- Business, Management, Marketing and Related Support ServicesPart-time undergraduate students
•Report Hispanic/Latino individuals of any race as Hispanic/Latino•Report race for non-Hispanic/Latino individuals only
MenStudents enrolled for credit Degree/certificate-seeking
First-time Transfer-in Continuing/Returning
TotalNon-degree/
non-certificate-seekingTotal,
part-timeundergraduate
studentsNonresident alien 0 0 2 2 0 2Hispanic/Latino 1 1 29 31 5 36American Indian or Alaska Native 0 0 0 0 0 0Asian 0 0 7 7 1 8Black or African American 0 0 3 3 1 4Native Hawaiian or Other Pacific Islander 0 0 1 1 0 1White 0 0 83 83 5 88Two or more races 0 0 2 2 0 2Race and ethnicity unknown 0 0 5 5 1 6Total men 1 1 132 134 13 147
WomenStudents enrolled for credit Degree/certificate-seeking
First-time Transfer-in Continuing/Returning
TotalNon-degree/
non-certificate-seekingTotal,
part-timeundergraduate
studentsNonresident alien 0 0 3 3 0 3Hispanic/Latino 0 0 21 21 5 26American Indian or Alaska Native 0 0 0 0 0 0Asian 0 1 14 15 1 16Black or African American 0 0 4 4 1 5Native Hawaiian or Other Pacific Islander 0 0 1 1 0 1White 1 0 48 49 5 54Two or more races 0 0 1 1 0 1Race and ethnicity unknown 0 0 3 3 1 4Total women 1 1 95 97 13 110
Grand total (men+women) 2 2 227 231 26 257Grand total (men+women) 2012-13 1 76 402 479 43 522

Institution: University of Florida (134130)User ID: 88G4433
Part A - Fall Enrollment for Graduate StudentsEnrollment as of the institution's official fall reporting date or as of October 15, 2014
Graduate StudentsRace/Ethnicity Reporting Reminder:•Report Hispanic/Latino individuals of any race as Hispanic/Latino•Report race for non-Hispanic/Latino individuals only
Graduate Student Reporting Reminder:•Report all postbaccalaureate degree and certificate students as graduate students, including any doctor's-professionalpractice students (formerly first-professional)
MenEnrolled for credit Total full-time Total part-time Total graduate studentsNonresident alien 1,985 222 2,207Hispanic/Latino 514 181 695American Indian or Alaska Native 20 7 27Asian 307 108 415Black or African American 229 110 339Native Hawaiian or Other Pacific Islander 8 5 13White 2,582 1,176 3,758Two or more races 51 16 67Race and ethnicity unknown 253 115 368Total men 5,949 1,940 7,889Total men prior year 6,047 2,002 8,049
WomenEnrolled for credit Total full-time Total part-time Total graduate studentsNonresident alien 1,312 211 1,523Hispanic/Latino 650 245 895American Indian or Alaska Native 13 14 27Asian 413 146 559Black or African American 366 253 619Native Hawaiian or Other Pacific Islander 29 2 31White 2,988 1,694 4,682Two or more races 72 27 99Race and ethnicity unknown 215 91 306Total women 6,058 2,683 8,741Total women prior year 6,129 2,532 8,661
Grand total (men+women) 12,007 4,623 16,630Grand total (men+women) prior year 12,176 4,534 16,710

Institution: University of Florida (134130)User ID: 88G4433
Part A - Fall Enrollment by race/ethnicity and genderEnrollment as of the institution's official fall reporting date or as of October 15, 2014
CIPCODE: 13.0000 -- EducationGraduate students
•Report Hispanic/Latino individuals of any race as Hispanic/Latino•Report race for non-Hispanic/Latino individuals only•Report all postbaccalaureate degree and certificate students as graduate students, including any doctor's-professionalpractice students (formerly first-professional)
MenStudents enrolled for credit Total full-time Total part-time Total graduate studentsNonresident alien 28 3 31Hispanic/Latino 4 19 23American Indian or Alaska Native 0 1 1Asian 0 6 6Black or African American 14 20 34Native Hawaiian or Other Pacific Islander 0 0 0White 54 151 205Two or more races 0 1 1Race and ethnicity unknown 5 10 15Total men 105 211 316
WomenStudents enrolled for credit Total full-time Total part-time Total graduate studentsNonresident alien 65 14 79Hispanic/Latino 34 64 98American Indian or Alaska Native 0 6 6Asian 7 13 20Black or African American 33 63 96Native Hawaiian or Other Pacific Islander 2 1 3White 226 375 601Two or more races 5 3 8Race and ethnicity unknown 6 22 28Total women 378 561 939
Grand total (men+women) 483 772 1,255Grand total (men+women) 2012-13 486 812 1,298

Institution: University of Florida (134130)User ID: 88G4433
Part A - Fall Enrollment by race/ethnicity and genderEnrollment as of the institution's official fall reporting date or as of October 15, 2014
CIPCODE: 14.0000 -- EngineeringGraduate students
•Report Hispanic/Latino individuals of any race as Hispanic/Latino•Report race for non-Hispanic/Latino individuals only•Report all postbaccalaureate degree and certificate students as graduate students, including any doctor's-professionalpractice students (formerly first-professional)
MenStudents enrolled for credit Total full-time Total part-time Total graduate studentsNonresident alien 862 85 947Hispanic/Latino 66 47 113American Indian or Alaska Native 0 1 1Asian 45 24 69Black or African American 22 12 34Native Hawaiian or Other Pacific Islander 1 0 1White 295 231 526Two or more races 6 1 7Race and ethnicity unknown 30 23 53Total men 1,327 424 1,751
WomenStudents enrolled for credit Total full-time Total part-time Total graduate studentsNonresident alien 287 28 315Hispanic/Latino 20 9 29American Indian or Alaska Native 0 1 1Asian 24 10 34Black or African American 14 9 23Native Hawaiian or Other Pacific Islander 0 0 0White 73 59 132Two or more races 7 1 8Race and ethnicity unknown 6 3 9Total women 431 120 551
Grand total (men+women) 1,758 544 2,302Grand total (men+women) 2012-13 2,318 670 2,988

Institution: University of Florida (134130)User ID: 88G4433
Part A - Fall Enrollment by race/ethnicity and genderEnrollment as of the institution's official fall reporting date or as of October 15, 2014
CIPCODE: 26.0000 -- Biological and Biomedical SciencesGraduate students
•Report Hispanic/Latino individuals of any race as Hispanic/Latino•Report race for non-Hispanic/Latino individuals only•Report all postbaccalaureate degree and certificate students as graduate students, including any doctor's-professionalpractice students (formerly first-professional)
MenStudents enrolled for credit Total full-time Total part-time Total graduate studentsNonresident alien 134 10 144Hispanic/Latino 12 3 15American Indian or Alaska Native 2 0 2Asian 9 3 12Black or African American 9 2 11Native Hawaiian or Other Pacific Islander 0 0 0White 177 38 215Two or more races 3 1 4Race and ethnicity unknown 18 2 20Total men 364 59 423
WomenStudents enrolled for credit Total full-time Total part-time Total graduate studentsNonresident alien 171 8 179Hispanic/Latino 30 11 41American Indian or Alaska Native 0 0 0Asian 19 2 21Black or African American 23 0 23Native Hawaiian or Other Pacific Islander 0 0 0White 173 38 211Two or more races 4 0 4Race and ethnicity unknown 18 2 20Total women 438 61 499
Grand total (men+women) 802 120 922Grand total (men+women) 2012-13 779 108 887

Institution: University of Florida (134130)User ID: 88G4433
Part A - Fall Enrollment by race/ethnicity and genderEnrollment as of the institution's official fall reporting date or as of October 15, 2014
CIPCODE: 27.0000 -- Mathematics and StatisticsGraduate students
•Report Hispanic/Latino individuals of any race as Hispanic/Latino•Report race for non-Hispanic/Latino individuals only•Report all postbaccalaureate degree and certificate students as graduate students, including any doctor's-professionalpractice students (formerly first-professional)
MenStudents enrolled for credit Total full-time Total part-time Total graduate studentsNonresident alien 45 2 47Hispanic/Latino 6 0 6American Indian or Alaska Native 0 0 0Asian 2 0 2Black or African American 0 0 0Native Hawaiian or Other Pacific Islander 0 0 0White 29 3 32Two or more races 5 0 5Race/ethnicity unknown 3 1 4Total men 90 6 96
WomenStudents enrolled for credit Total full-time Total part-time Total graduate studentsNonresident alien 18 1 19Hispanic/Latino 2 0 2American Indian or Alaska Native 0 0 0Asian 1 2 3Black or African American 1 0 1Native Hawaiian or Other Pacific Islander 0 0 0White 11 0 11Two or more races 0 0 0Race/ethnicity unknown 1 0 1Total women 34 3 37
Grand total (men+women) 124 9 133Grand total (men+women) 2012-13 146 4 150

Institution: University of Florida (134130)User ID: 88G4433
Part A - Fall Enrollment by race/ethnicity and genderEnrollment as of the institution's official fall reporting date or as of October 15, 2014
CIPCODE: 40.0000 -- Physical SciencesGraduate students
•Report Hispanic/Latino individuals of any race as Hispanic/Latino•Report race for non-Hispanic/Latino individuals only•Report all postbaccalaureate degree and certificate students as graduate students, including any doctor's-professionalpractice students (formerly first-professional)
MenStudents enrolled for credit Total full-time Total part-time Total graduate studentsNonresident alien 152 3 155Hispanic/Latino 7 1 8American Indian or Alaska Native 0 0 0Asian 10 0 10Black or African American 5 1 6Native Hawaiian or Other Pacific Islander 0 0 0White 114 1 115Two or more races 2 0 2Race and ethnicity unknown 13 2 15Total men 303 8 311
WomenStudents enrolled for credit Total full-time Total part-time Total graduate studentsNonresident alien 76 1 77Hispanic/Latino 5 0 5American Indian or Alaska Native 0 0 0Asian 4 0 4Black or African American 3 0 3Native Hawaiian or Other Pacific Islander 0 0 0White 44 2 46Two or more races 2 0 2Race and ethnicity unknown 6 0 6Total women 140 3 143
Grand total (men+women) 443 11 454Grand total (men+women) 2012-13 449 10 459

Institution: University of Florida (134130)User ID: 88G4433
Part A - Fall Enrollment by race/ethnicity and genderEnrollment as of the institution's official fall reporting date or as of October 15, 2014
CIPCODE: 52.0000 -- Business, Management, Marketing and Related Support ServicesGraduate students
•Report Hispanic/Latino individuals of any race as Hispanic/Latino•Report race for non-Hispanic/Latino individuals only•Report all postbaccalaureate degree and certificate students as graduate students, including any doctor's-professionalpractice students (formerly first-professional)
MenStudents enrolled for credit Total full-time Total part-time Total graduate studentsNonresident alien 63 6 69Hispanic/Latino 73 36 109American Indian or Alaska Native 3 0 3Asian 22 31 53Black or African American 16 20 36Native Hawaiian or Other Pacific Islander 1 2 3White 335 251 586Two or more races 1 3 4Race and ethnicity unknown 31 29 60Total men 545 378 923
WomenStudents enrolled for credit Total full-time Total part-time Total graduate studentsNonresident alien 68 20 88Hispanic/Latino 36 15 51American Indian or Alaska Native 1 1 2Asian 18 15 33Black or African American 12 16 28Native Hawaiian or Other Pacific Islander 3 0 3White 153 130 283Two or more races 4 2 6Race and ethnicity unknown 17 6 23Total women 312 205 517
Grand total (men+women) 857 583 1,440Grand total (men+women) 2012-13 1,122 579 1,701

Institution: University of Florida (134130)User ID: 88G4433
Part A - Fall Enrollment by race/ethnicity and genderEnrollment as of the institution's official fall reporting date or as of October 15, 2014
CIPCODE: 22.0101 -- Law (LL.B., J.D.)•Report Hispanic/Latino individuals of any race as Hispanic/Latino•Report race for non-Hispanic/Latino individuals only
MenStudents enrolled for credit Total full-time Total part-time TotalNonresident alien 1 0 1Hispanic/Latino 77 0 77American Indian or Alaska Native 6 0 6Asian 14 0 14Black or African American 39 0 39Native Hawaiian or Other Pacific Islander 1 0 1White 364 1 365Two or more races 6 0 6Race and ethnicity unknown 33 0 33Total men 541 1 542
WomenStudents enrolled for credit Total full-time Total part-time TotalNonresident alien 6 0 6Hispanic/Latino 66 0 66American Indian or Alaska Native 2 0 2Asian 12 0 12Black or African American 42 0 42Native Hawaiian or Other Pacific Islander 0 0 0White 244 2 246Two or more races 8 0 8Race and ethnicity unknown 21 0 21Total women 401 2 403
Grand total (men+women) 942 3 945Grand total (men+women) 2012-13 954 5

Institution: University of Florida (134130)User ID: 88G4433
Part A - Fall Enrollment by race/ethnicity and genderEnrollment as of the institution's official fall reporting date or as of October 15, 2014
CIPCODE: 51.0401 -- Dentistry (D.D.S., D.M.D.)•Report Hispanic/Latino individuals of any race as Hispanic/Latino•Report race for non-Hispanic/Latino individuals only
MenStudents enrolled for credit Total full-time Total part-time TotalNonresident alien 0 0Hispanic/Latino 24 24American Indian or Alaska Native 0 0Asian 26 26Black or African American 10 10Native Hawaiian or Other Pacific Islander 0 0White 80 80Two or more races 3 3Race and ethnicity unknown 9 9Total men 152 0 152
WomenStudents enrolled for credit Total full-time Total part-time TotalNonresident alien 0 0Hispanic/Latino 48 48American Indian or Alaska Native 1 1Asian 36 36Black or African American 12 12Native Hawaiian or Other Pacific Islander 3 3White 86 86Two or more races 3 3Race and ethnicity unknown 8 8Total women 197 0 197
Grand total (men+women) 349 0 349Grand total (men+women) 2012-13 327

Institution: University of Florida (134130)User ID: 88G4433
Part A - Fall Enrollment by race/ethnicity and genderEnrollment as of the institution's official fall reporting date or as of October 15, 2014
CIPCODE: 51.1201 -- Medicine (M.D.)•Report Hispanic/Latino individuals of any race as Hispanic/Latino•Report race for non-Hispanic/Latino individuals only
MenStudents enrolled for credit Total full-time Total part-time TotalNonresident alien 0 0Hispanic/Latino 28 28American Indian or Alaska Native 2 2Asian 39 39Black or African American 27 27Native Hawaiian or Other Pacific Islander 2 2White 174 174Two or more races 2 2Race and ethnicity unknown 20 20Total men 294 0 294
WomenStudents enrolled for credit Total full-time Total part-time TotalNonresident alien 0 0Hispanic/Latino 39 39American Indian or Alaska Native 0 0Asian 26 26Black or African American 28 28Native Hawaiian or Other Pacific Islander 0 0White 133 133Two or more races 5 5Race and ethnicity unknown 18 18Total women 249 0 249
Grand total (men+women) 543 0 543Grand total (men+women) 2012-13 542

Institution: University of Florida (134130)User ID: 88G4433
Part A - Fall Enrollment by Distance Education StatusEnrollment as of the institution's official fall reporting date or as of October 15, 2014
Undergraduate Students Degree/Certificate
SeekingNon-Degree/Certificate
Seeking
GraduateStudents
Enrolled exclusively in distance education courses 884 373 3,374Enrolled in some but not all distance educationcourses
18,384 199 2,987
Not enrolled in any distance education courses 12,611 378 10,269Total (all distance education statuses) 31,879 950 16,630Total (from prior part A screens)
NOTE: The total of all distance education statuses(above) must equal this total carried forward from the priorpart A screens
31,879 950 16,630
You may use the space below to provide context for the data you've reported above.

Institution: University of Florida (134130)User ID: 88G4433
Part A - Fall Enrollment by Distance Education Status Undergraduate StudentsOf those students exclusively enrolled in distanceeducation courses, report the number that are:
Degree/CertificateSeeking
Non-Degree/CertificateSeeking
GraduateStudents
Located in FL 855 301 1,757Located in the U.S. but not in FL 27 62 1,434Located in the U.S. but state/jurisdiction unknown 0 1 11Located outside the U.S. 2 9 172Location unknown/unreported 0 0 0Total students exclusively enrolled in distance education(from section above)
884 373 3,374

Institution: University of Florida (134130)User ID: 88G4433
Part A - Fall Enrollment SummaryFall Enrollment Summary
MenStudents enrolled for credit Total full-time
studentsTotal part-time
studentsGrand total,all students
Nonresident alien 2,250 246 2,496Hispanic/Latino 3,013 501 3,514American Indian or Alaska Native 56 14 70Asian 1,414 210 1,624Black or African American 939 196 1,135Native Hawaiian or Other Pacific Islander 60 15 75White 10,379 2,098 12,477Two or more races 402 49 451Race and ethnicity unknown 634 163 797Total men 19,147 3,492 22,639
WomenStudents enrolled for credit Total full-time
studentsTotal part-time
studentsGrand total,all students
Nonresident alien 1,575 224 1,799Hispanic/Latino 4,056 557 4,613American Indian or Alaska Native 45 22 67Asian 1,641 236 1,877Black or African American 1,659 357 2,016Native Hawaiian or Other Pacific Islander 155 10 165White 12,388 2,452 14,840Two or more races 595 62 657Race and ethnicity unknown 653 133 786Total women 22,767 4,053 26,820
Grand Total (men+women) 41,914 7,545 49,459

Institution: University of Florida (134130)User ID: 88G4433
Part A - Fall Enrollment - Summary by race/ethnicityFall enrollment totals
CIPCODE: 13.0000 -- EducationMenStudents enrolled for credit Total full-time
studentsTotal part-time
studentsGrand total,all students
Nonresident alien 28 3 31Hispanic/Latino 11 21 32American Indian or Alaska Native 1 2 3Asian 3 6 9Black or African American 18 20 38Native Hawaiian or Other Pacific Islander 1 0 1White 122 156 278Two or more races 1 1 2Race and ethnicity unknown 6 10 16Total men 191 219 410
WomenStudents enrolled for credit Total full-time
studentsTotal part-time
studentsGrand total,all students
Nonresident alien 67 14 81Hispanic/Latino 103 68 171American Indian or Alaska Native 1 6 7Asian 15 13 28Black or African American 52 63 115Native Hawaiian or Other Pacific Islander 3 1 4White 583 383 966Two or more races 18 3 21Race and ethnicity unknown 13 22 35Total women 855 573 1,428
Grand Total (men+women) 1,046 792 1,838

Institution: University of Florida (134130)User ID: 88G4433
Part A - Fall Enrollment - Summary by race/ethnicityFall enrollment totals
CIPCODE: 14.0000 -- EngineeringMenStudents enrolled for credit Total full-time
studentsTotal part-time
studentsGrand total,all students
Nonresident alien 924 93 1,017Hispanic/Latino 788 125 913American Indian or Alaska Native 5 2 7Asian 345 53 398Black or African American 144 28 172Native Hawaiian or Other Pacific Islander 11 0 11White 2,479 471 2,950Two or more races 107 7 114Race and ethnicity unknown 129 36 165Total men 4,932 815 5,747
WomenStudents enrolled for credit Total full-time
studentsTotal part-time
studentsGrand total,all students
Nonresident alien 306 28 334Hispanic/Latino 291 37 328American Indian or Alaska Native 0 1 1Asian 131 21 152Black or African American 52 15 67Native Hawaiian or Other Pacific Islander 3 0 3White 774 119 893Two or more races 55 3 58Race and ethnicity unknown 50 6 56Total women 1,662 230 1,892
Grand Total (men+women) 6,594 1,045 7,639

Institution: University of Florida (134130)User ID: 88G4433
Part A - Fall Enrollment - Summary by race/ethnicityFall enrollment totals
CIPCODE: 26.0000 -- Biological and Biomedical SciencesMenStudents enrolled for credit Total full-time
studentsTotal part-time
studentsGrand total,all students
Nonresident alien 140 12 152Hispanic/Latino 238 27 265American Indian or Alaska Native 6 0 6Asian 213 14 227Black or African American 66 8 74Native Hawaiian or Other Pacific Islander 10 2 12White 833 94 927Two or more races 35 3 38Race and ethnicity unknown 55 7 62Total men 1,596 167 1,763
WomenStudents enrolled for credit Total full-time
studentsTotal part-time
studentsGrand total,all students
Nonresident alien 180 8 188Hispanic/Latino 442 42 484American Indian or Alaska Native 6 1 7Asian 281 14 295Black or African American 136 4 140Native Hawaiian or Other Pacific Islander 21 2 23White 1,212 73 1,285Two or more races 59 1 60Race and ethnicity unknown 68 7 75Total women 2,405 152 2,557
Grand Total (men+women) 4,001 319 4,320

Institution: University of Florida (134130)User ID: 88G4433
Part A - Fall Enrollment - Summary by race/ethnicityFall enrollment totals
CIPCODE: 27.0000 -- Mathematics and StatisticsMenStudents enrolled for credit Total full-time
studentsTotal part-time
studentsGrand total,all students
Nonresident alien 50 2 52Hispanic/Latino 33 1 34American Indian or Alaska Native 1 1 2Asian 26 0 26Black or African American 2 1 3Native Hawaiian or Other Pacific Islander 0 0 0White 126 20 146Two or more races 11 0 11Race and ethnicity unknown 12 4 16Total men 261 29 290
WomenStudents enrolled for credit Total full-time
studentsTotal part-time
studentsGrand total,all students
Nonresident alien 22 1 23Hispanic/Latino 22 0 22American Indian or Alaska Native 0 0 0Asian 15 3 18Black or African American 4 0 4Native Hawaiian or Other Pacific Islander 0 0 0White 93 9 102Two or more races 4 0 4Race and ethnicity unknown 5 0 5Total women 165 13 178
Grand Total (men+women) 426 42 468

Institution: University of Florida (134130)User ID: 88G4433
Part A - Fall Enrollment - Summary by race/ethnicityFall enrollment totals
CIPCODE: 40.0000 -- Physical SciencesMenStudents enrolled for credit Total full-time
studentsTotal part-time
studentsGrand total,all students
Nonresident alien 156 3 159Hispanic/Latino 105 5 110American Indian or Alaska Native 4 0 4Asian 76 4 80Black or African American 22 1 23Native Hawaiian or Other Pacific Islander 2 0 2White 385 27 412Two or more races 15 2 17Race and ethnicity unknown 32 3 35Total men 797 45 842
WomenStudents enrolled for credit Total full-time
studentsTotal part-time
studentsGrand total,all students
Nonresident alien 82 1 83Hispanic/Latino 79 2 81American Indian or Alaska Native 1 1 2Asian 62 1 63Black or African American 25 1 26Native Hawaiian or Other Pacific Islander 4 0 4White 233 12 245Two or more races 15 0 15Race and ethnicity unknown 17 1 18Total women 518 19 537
Grand Total (men+women) 1,315 64 1,379

Institution: University of Florida (134130)User ID: 88G4433
Part A - Fall Enrollment - Summary by race/ethnicityFall enrollment totals
CIPCODE: 52.0000 -- Business, Management, Marketing and Related Support ServicesMenStudents enrolled for credit Total full-time
studentsTotal part-time
studentsGrand total,all students
Nonresident alien 100 8 108Hispanic/Latino 383 72 455American Indian or Alaska Native 8 0 8Asian 148 39 187Black or African American 67 24 91Native Hawaiian or Other Pacific Islander 2 3 5White 1,571 339 1,910Two or more races 34 5 39Race and ethnicity unknown 97 35 132Total men 2,410 525 2,935
WomenStudents enrolled for credit Total full-time
studentsTotal part-time
studentsGrand total,all students
Nonresident alien 98 23 121Hispanic/Latino 359 41 400American Indian or Alaska Native 1 1 2Asian 132 31 163Black or African American 66 21 87Native Hawaiian or Other Pacific Islander 8 1 9White 1,133 184 1,317Two or more races 49 3 52Race and ethnicity unknown 70 10 80Total women 1,916 315 2,231
Grand Total (men+women) 4,326 840 5,166

Institution: University of Florida (134130)User ID: 88G4433
Part B - Fall Enrollment by Age and Gender for Full-time Undergraduate StudentsNOTE: These data are optional this year.
Enrollment as of the institution's official fall reporting date or as of October 15, 2014Age Full-time Undergraduate Students
Men WomenUnder 18 19 50
18-19 4,332 6,31120-21 5,689 7,75522-24 2,603 2,28925-29 385 20230-34 112 6035-39 29 2040-49 20 1450-64 8 8
65 and over 1 0Age unknown/unreported 0 0
Total full-time undergraduate students (from part A) 13,198 16,709

Institution: University of Florida (134130)User ID: 88G4433
Part B - Fall Enrollment by Age and Gender for Part-time Undergraduate StudentsNOTE: These data are optional this year.
Enrollment as of the institution's official fall reporting date or as of October 15, 2014Age Part-time Undergraduate Students
Men WomenUnder 18 44 72
18-19 173 17920-21 298 37222-24 635 48025-29 211 13230-34 88 5835-39 46 3540-49 48 2550-64 8 16
65 and over 1 1Age unknown/unreported 0 0
Total part-time undergraduate students (from part A) 1,552 1,370

Institution: University of Florida (134130)User ID: 88G4433
Part B - Fall Enrollment by Age and Gender for Full-time Graduate StudentsNOTE: These data are optional this year.
Enrollment as of the institution's official fall reporting date or as of October 15, 2014Age Full-time Graduate Students
Men WomenUnder 18 0 0
18-19 1 120-21 115 18822-24 2,176 2,60425-29 2,271 2,12730-34 844 65335-39 323 23740-49 165 18750-64 54 57
65 and over 0 4Age unknown/unreported 0 0
Total full-time graduate students (from part A) 5,949 6,058

Institution: University of Florida (134130)User ID: 88G4433
Part B - Fall Enrollment by Age and Gender for Part-time Graduate StudentsNOTE: These data are optional this year.
Enrollment as of the institution's official fall reporting date or as of October 15, 2014Age Part-time Graduate Students
Men WomenUnder 18 0 0
18-19 0 120-21 0 722-24 191 29925-29 600 81530-34 457 50035-39 277 32840-49 265 47250-64 137 259
65 and over 13 2Age unknown/unreported 0 0
Total part-time graduate students (from part A) 1,940 2,683

Institution: University of Florida (134130)User ID: 88G4433
Part C - Screening QuestionDid any of your first-time degree/certificate-seeking undergraduate students (reported in Part A) enroll within 12months of graduating high school or receiving their GED? Yes, we have first-time students who enrolled within 12 months of their high school graduation.
No, we do not have any first-time students who enrolled within 12 months of their high schoolgraduation.
You may use the space below to provide context for the data you've reported above.

Institution: University of Florida (134130)User ID: 88G4433
Part C - Residence of First-time UndergraduatesEnrollment as of the institution's official fall reporting date or as of October 15, 2014 Enter at least one zero, where applicable, to verify that the screen has not been skipped.
State of residence when studentwas first admitted
FIPS Code Total first-timedegree/certificate-seeking
undergraduates(1)
Of students in column 1, thosewho enrolled within 12 months
of high school graduationor receiving their GED
(2)Alabama 01 4 4Alaska 02 0 0Arizona 04 2 2Arkansas 05 1 1California 06 21 21Colorado 08 5 5Connecticut 09 7 7Delaware 10 3 3District of Columbia 11 2 2Florida 12 5,683 5,587Georgia 13 48 48Hawaii 15 0 0Idaho 16 0 0Illinois 17 28 27Indiana 18 4 4Iowa 19 1 1Kansas 20 2 2Kentucky 21 3 3Louisiana 22 4 4Maine 23 0 0

Institution: University of Florida (134130)User ID: 88G4433
Part C - Residence of First-time UndergraduatesEnrollment as of the institution's official fall reporting date or as of October 15, 2014 Enter at least one zero, where applicable, to verify that the screen has not been skipped.
State of residence when studentwas first admitted
FIPS Code Total first-timedegree/certificate-seeking
undergraduates(1)
Of students in column 1, thosewho enrolled within 12 months
of high school graduationor receiving their GED
(2)Maryland 24 42 39Massachusetts 25 16 15Michigan 26 10 10Minnesota 27 3 3Mississippi 28 2 2Missouri 29 5 5Montana 30 0 0Nebraska 31 2 2Nevada 32 0 0New Hampshire 33 3 3New Jersey 34 44 43New Mexico 35 1 1New York 36 103 103North Carolina 37 17 16North Dakota 38 0 0Ohio 39 4 4Oklahoma 40 0 0Oregon 41 1 1Pennsylvania 42 33 33Rhode Island 44 2 2

Institution: University of Florida (134130)User ID: 88G4433
Part C - Residence of First-time UndergraduatesEnrollment as of the institution's official fall reporting date or as of October 15, 2014 Enter at least one zero, where applicable, to verify that the screen has not been skipped.
State of residence when studentwas first admitted
FIPSCode
Total first-timedegree/certificate-seeking
undergraduates(1)
Of students in column 1, thosewho enrolled within 12 months of
high school graduationor receiving their GED
(2)South Carolina 45 12 12South Dakota 46 0 0Tennessee 47 11 11Texas 48 26 25Utah 49 3 3Vermont 50 0 0Virginia 51 39 38Washington 53 4 4West Virginia 54 2 2Wisconsin 55 1 1Wyoming 56 State Unknown 57 11 11American Samoa 60 Federated States of Micronesia 64 Guam 66 Marshall Islands 68 Northern Marianas 69 Palau 70 Puerto Rico 72 17 17Virgin Islands 78 1 1Foreign Countries 90 271 260Residence unknown/unreported 98 0 Total first-time degree/certificate-seekingundergraduates (from Part A)
6,504 6,388
You may use the space below to provide context for the data you've reported above.

Institution: University of Florida (134130)User ID: 88G4433
Part D - Total Undergraduate Entering ClassTotal Undergraduate Entering Class, Fall 2014
D1Total full-time, first-time degree/certificate-seeking undergraduates from Part A (GR cohort) 6,475D2Total first-time degree/certificate-seeking undergraduates (full-time + part-time) from Part A 6,504D3Total transfer-in degree/certificate-seeking undergraduates (full-time + part-time) from Part A 1,648D4Total non-degree/certificate-seeking undergraduates (full-time + part-time) from Part A 950D5Of the total non-degree/certificate-seeking undergraduates displayed on line D4, the number that are new to
the institution in Fall 2014 690
D6Total entering students at the undergraduate levelNote: This is calculated as first-time students (line D2) + students transferring to the institution (line D3) + non-degree/certificate-seeking undergraduates entering in Fall 2014 (line D5).
8,842
D7Percentage of undergraduate entering class represented by your GR cohort (line D1/line D6) 73

Imagedescription.Thesecontext noteswill beposted onthe CollegeNavigator.End of imagedescription.
Institution: University of Florida (134130)User ID: 88G4433
Part E - First-time Bachelor's Cohort Retention Rates (Full-time)Retention Rates
Full-time, First-time Bachelor's Cohort from Fall 2013
Academic reporters determine the cohort and retention as of the institution's official fall reporting date or as ofOctober 15. Program reporters determine the cohort with enrollment any time between August 1 and October31, 2013 and retention based on August 1, 2014.
The retention rate is calculated by the system after clicking "Save" on the screen. Exclusions are subtractedfrom the original cohort and the resulting adjusted cohort is used for calculating the retention rate. Retention Data Reporting Reminders:
• Include only full-time, first-time bachelor's students in this cohort.• Determine the full-time cohort using Fall 2013 status (e.g. if a student was full-time in Fall 2013,
report them in the full-time cohort regardless of their Fall 2014 status).• If there are no students to report in the cohort, enter zero. Do not leave the field blank.• Report in the exclusions box (line E2) the number of students from the cohort who left the
institution for any of the following reasons: died or were totally and permanently disabled; toserve in the armed forces (including those called to active duty); to serve with a foreign aidservice of the Federal Government (e.g. Peace Corps); or to serve on official church missions.
Prior yeardata (Fall
2012 cohort)
FULL-TIME, FIRST-TIME BACHELOR'S COHORT RETENTION:E1 Full-time, first-time Fall 2013 bachelor's cohort 6,348 6,273 E2 Exclusions from the Fall 2013 cohort 0 0 E3 Adjusted Fall 2013 cohort (line E1- line E2) 6,348 6,273 E4 Students from Fall 2013 cohort still enrolled as of Fall 2014 6,101 6,051 E5 Full-time, first-time Fall 2013 bachelor's cohort retention rate (line E4 / line E3) 96% 96 %
You may use the space below to provide context for the data you've reported above.These context notes will be posted on the College Navigator website, and should be written to be understoodby students and parents.

Imagedescription.Thesecontext noteswill beposted onthe CollegeNavigator.End of imagedescription.
Institution: University of Florida (134130)User ID: 88G4433
Part E - First-time Bachelor's Cohort Retention Rates (Part-time)Retention Rates
Part-time, First-time Bachelor's Cohort from Fall 2013
Academic reporters determine the cohort and retention as of the institution's official fall reporting date or as ofOctober 15. Program reporters determine the cohort with enrollment any time between August 1 and October31, 2013 and retention based on August 1, 2014.
The retention rate is calculated by the system after clicking "Save" on the screen. Exclusions are subtractedfrom the original cohort and the resulting adjusted cohort is used for calculating the retention rate. Retention Data Reporting Reminders:
• Include only part-time, first-time bachelor's-seeking students in this cohort.• Determine part-time using Fall 2013 attendance status (e.g. if a student was part-time in Fall
2013, report them in the part-time cohort regardless of their Fall 2014 status).• If there are no students to report in the cohort, enter zero. Do not leave the field blank.• Report in the exclusions box (line E7) the number of students from the cohort who left the
institution for any of the following reasons: died or were totally and permanently disabled; toserve in the armed forces (including those called to active duty); to serve with a foreign aidservice of the Federal Government (e.g. Peace Corps); or to serve on official church missions.
Prior yeardata (Fall
2012 cohort)PART-TIME, FIRST-TIME BACHELOR'S COHORT RETENTION:E6 Part-time, first-time Fall 2013 bachelor's cohort 22 17 E7 Exclusions from the Fall 2013 cohort 0 0 E8 Adjusted Fall 2013 cohort (line E6 - line E7) 22 17 E9 Students from Fall 2013 cohort still enrolled as of Fall 2014 15 14 E10 Part-time, first-time Fall 2013 bachelor's cohort retention rate (line E9 / line E8) 68% 82 %
You may use the space below to provide context for the data you've reported above.These context notes will be posted on the College Navigator website, and should be written to be understoodby students and parents.

Imagedescription.Thesecontext noteswill beposted onthe CollegeNavigator.End of imagedescription.
Institution: University of Florida (134130)User ID: 88G4433
Part F - Student-to-Faculty RatioPlease provide your institution's student-to-faculty ratio (i.e., student-to-instructional staff) for undergraduateprograms for Fall 2014. The student-to-faculty ratio and any accompanying context that is provided will bedisplayed on College Navigator.
Note: Logic in this item is similar to item I-2 from the Common Data Set data collection.
Click here to use a worksheet to help you determine the student-to-faculty ratio
Student-to-faculty ratio 21 to 1 Student-to-faculty ratio prior year 21 to 1
You may use the space below to provide context for the data you've reported above.These context notes will be posted on the College Navigator website, and should be written to be understoodby students and parents.

Institution: University of Florida (134130)User ID: 88G4433
Prepared by This survey component was prepared by: Keyholder SFA Contact HR Contact
Finance Contact Academic Library Contact Other
Name: Marie Zeglen Email: [email protected] How long did it take to prepare thissurvey component?
25hours minutes
The name of the preparer is being collected so that we can follow up with the appropriate person in the event that thereare questions concerning the data. The Keyholder will be copied on all email correspondence to other preparers.The time it took to prepare this component is being collected so that we can continue to improve our estimate of thereporting burden associated with IPEDS. Please include in your estimate the time it took for you to review instructions,query and search data sources, complete and review the component, and submit the data through the Data CollectionSystem.Thank you for your assistance.

Institution: University of Florida (134130) User ID: 88G4433Summary
Fall Enrollment Survey SummaryFour-Year Institutions with Graduate Students
IPEDS collects important information regarding your institution. All data reported in IPEDSsurvey components become available in the IPEDS Data Center and appear as aggregated datain various Department of Education reports. Additionally, some of the reported data appearsspecifically for your institution through the College Navigator website and is included in yourinstitution’s Data Feedback Report (DFR). The purpose of this summary is to provide you anopportunity to view some of the data that, when accepted through the IPEDS quality controlprocess, will appear on the College Navigator website and/or your DFR. College Navigator isupdated approximately three months after the data collection period closes and Data FeedbackReports will be available through the Data Center and sent to your institution’s CEO inNovember 2015.
Please review your data for accuracy. If you have questions about the data displayed belowafter reviewing the data reported on the survey screens, please contact the IPEDS Help Desk at:1-877-225-2568 or [email protected].
Student EnrollmentTotal enrollment 49,459
Undergraduate enrollment 32,829
Undergraduate transfer-in enrollment 1,648
Graduate enrollment 16,630
Student-to-faculty ratio 21 to 1
Student Characteristics (All Students)Percent of all students who are female 54%
Percent of all students by race/ethnicity:
American Indian or Alaska Native 0%
Asian 7%
Black or African American 6%
Hispanic/Latino 16%
Native Hawaiian or Pacific Islander 0%
White 55%
Two or More Races 2%
Race and ethnicity unknown 3%
Nonresident alien 9%
Undergraduate Student CharacteristicsPercent of undergraduates who are female 55%
Percent of undergraduates who are full-time 91%
Percent of undergraduates by race/ethnicity:
American Indian or Alaska Native 0%
Asian 8%
Black or African American 7%
Hispanic/Latino 20%
Native Hawaiian or Pacific Islander 1%
White 58%
Two or More Races 3%
Race and ethnicity unknown 3%
Nonresident alien 2%
Percent of undergraduate students by age:
24 and under 95%

25 and over 5%
Age unknown 0%
Undergraduate Retention and Graduation Rate CohortFirst-time, full-time bachelor’s seeking student retentionrate 96%
First-time, part-time bachelor’s seeking student retentionrate 68%
Graduation rate cohort as percent of total enteringstudents 73%
Graduate Student CharacteristicsPercent of graduate students who are female 53%
Percent of graduate students who are full-time 72%

Institution: University of Florida (134130) User ID: 88G4433Edit Report
Fall Enrollment
University of Florida (134130)
There are no errors for the selected survey and institution.

Fall Enrollment 2014-15Institution: University of Florida-Online (484473)User ID: 88G4433
OverviewFall Enrollment Overview
The Fall Enrollment component collects student enrollment counts by level of student, enrollment status, gender andrace/ethnicity. In addition, first-time student retention rates and the student-to-faculty ratio are collected. Every otheryear data on residence of first-time undergraduates is required and in opposite years, enrollment by student age isrequired to be reported.
Institutions operating on a traditional academic year calendar (semester, trimester, quarter, or 4-1-4) report Fallenrollment as of the institution's official fall reporting date or October 15. Institutions operating on a calendar thatdiffers by program or that enrolls students on a continuous basis (referred to as program reporters) report Fallenrollment as students enrolled any time during the period August 1 and October 31.
Data Reporting Reminders:
•Part B, Enrollment of students by age, is optional this year.•Part C, Residence of first-time degree/certificate-seeking undergraduates, is required this year.
Resources:To download the survey materials for this component: Survey Materials
To access your prior year data submission for this component: Reported Data
If you have questions about completing this survey, please contact the IPEDS Help Desk at 1-877-225-2568.

Institution: University of Florida-Online (484473)User ID: 88G4433
Part SelectionCompletion of Part B (Enrollment of Students by Age) is optional this year.
Do you wish to complete Part B this year?If you select 'Yes', you will be expected to complete the Part B screens.If you select 'No', you will skip Part B. Yes, I will complete Part B
No, I will not complete Part B

Institution: University of Florida-Online (484473)User ID: 88G4433
Fall Enrollment - CIPCODE SelectionIndicate which of the following fields of study are offered by your institution. Students are to be reported bytheir major field of study for the categories listed below. Fields for which enrollment was reported for Fall 2012have already been checked; please make sure all listed fields offered by your institution are checked. Undergraduate and graduate fields 13.0000 -- Education
14.0000 -- Engineering
26.0000 -- Biological and Biomedical Sciences
27.0000 -- Mathematics
40.0000 -- Physical Sciences
52.0000 -- Business, Management, Marketing, and Related Support Services
None of the above
You may use the space below to provide context for the data you've reported above.

Institution: University of Florida-Online (484473)User ID: 88G4433
Part A - Fall Enrollment for Full-Time Undergraduate StudentsEnrollment as of the institution's official fall reporting date or as of October 15, 2014
Full-time Undergraduate Students
Race/Ethnicity Reporting Reminder:•Report Hispanic/Latino individuals of any race as Hispanic/Latino•Report race for non-Hispanic/Latino individuals only
MenEnrolled for credit Degree/certificate-seeking
First-timeTransfer-in Continuing/Returning
Total degree/certificate-seeking
Non-degree/non-certificate-seeking
Total,Full-time
undergraduatestudents
Nonresident alien 0 0 0 0 0 0Hispanic/Latino 0 12 17 29 0 29American Indian orAlaska Native
0 2 1 3 0 3
Asian 0 3 2 5 0 5Black or AfricanAmerican
0 3 5 8 0 8
Native Hawaiian orOther PacificIslander
0 0 0 0 0 0
White 1 41 80 122 1 123Two or more races 0 0 1 1 0 1Race and ethnicityunknown
0 3 3 6 0 6
Total men 1 64 109 174 1 175Total men prior year
WomenEnrolled for credit Degree/certificate-seeking
First-timeTransfer-in Continuing/Returning
Total degree/certificate-seeking
Non-degree/non-certificate-seeking
Total,Full-time
undergraduatestudents
Nonresident alien 0 0 0 0 0 0Hispanic/Latino 1 13 13 27 0 27American Indian orAlaska Native
0 2 1 3 0 3
Asian 1 2 3 6 0 6Black or AfricanAmerican
0 11 11 22 0 22
Native Hawaiian orOther PacificIslander
0 1 1 2 0 2
White 5 38 52 95 1 96Two or more races 0 0 1 1 0 1Race and ethnicityunknown
0 2 6 8 1 9
Total women 7 69 88 164 2 166Total women prioryear
Grand total(men+women)
8 133 197 338 3 341
Grand total(men+women) prioryear

Institution: University of Florida-Online (484473)User ID: 88G4433
Part A - Fall Enrollment by race/ethnicity and genderEnrollment as of the institution's official fall reporting date or as of October 15, 2014
CIPCODE: 26.0000 -- Biological and Biomedical SciencesFull-time undergraduate students
•Report Hispanic/Latino individuals of any race as Hispanic/Latino•Report race for non-Hispanic/Latino individuals only
MenStudents enrolled for credit Degree/certificate-seeking
First-time Transfer-in Continuing/Returning
TotalNon-degree/
non-certificate-seekingTotal,
full-timeundergraduate
studentsNonresident alien 0 0 0Hispanic/Latino 0 0 0American Indian or Alaska Native 0 0 0Asian 0 0 0Black or African American 0 0 0Native Hawaiian or Other Pacific Islander 0 0 0White 0 0 0Two or more races 0 0 0Race and ethnicity unknown 0 0 0Total men 0 0 0 0 0 0
WomenStudents enrolled for credit Degree/certificate-seeking
First-time Transfer-in Continuing/Returning
TotalNon-degree/
non-certificate-seekingTotal,
full-timeundergraduate
studentsNonresident alien 0 0 0Hispanic/Latino 0 0 0American Indian or Alaska Native 0 0 0Asian 0 0 0Black or African American 0 0 0Native Hawaiian or Other Pacific Islander 0 0 0White 1 1 1Two or more races 0 0 0Race and ethnicity unknown 0 0 0Total women 1 0 0 1 0 1
Grand total (men+women) 1 0 0 1 0 1Grand total (men+women) 2012-13

Institution: University of Florida-Online (484473)User ID: 88G4433
Part A - Fall Enrollment by race/ethnicity and genderEnrollment as of the institution's official fall reporting date or as of October 15, 2014
CIPCODE: 40.0000 -- Physical SciencesFull-time undergraduate students
•Report Hispanic/Latino individuals of any race as Hispanic/Latino•Report race for non-Hispanic/Latino individuals only
MenStudents enrolled for credit Degree/certificate-seeking
First-time Transfer-in Continuing/Returning
TotalNon-degree/
non-certificate-seekingTotal,
full-timeundergraduate
studentsNonresident alien 0 0 0Hispanic/Latino 0 0 0American Indian or Alaska Native 0 0 0Asian 0 0 0Black or African American 0 0 0Native Hawaiian or Other Pacific Islander 0 0 0White 0 0 0Two or more races 0 0 0Race/ethnicity unknown 0 0 0Total men 0 0 0 0 0 0
WomenStudents enrolled for credit Degree/certificate-seeking
First-time Transfer-in Continuing/Returning
TotalNon-degree/
non-certificate-seekingTotal,
full-timeundergraduate
studentsNonresident alien 0 0 0Hispanic/Latino 0 0 0American Indian or Alaska Native 0 0 0Asian 0 0 0Black or African American 0 0 0Native Hawaiian or Other Pacific Islander 0 0 0White 1 1 1Two or more races 0 0 0Race/ethnicity unknown 0 0 0Total women 0 1 0 1 0 1
Grand total (men+women) 0 1 0 1 0 1Grand total (men+women) 2012-13

Institution: University of Florida-Online (484473)User ID: 88G4433
Part A - Fall Enrollment by race/ethnicity and genderEnrollment as of the institution's official fall reporting date or as of October 15, 2014
CIPCODE: 52.0000 -- Business, Management, Marketing and Related Support ServicesFull-time undergraduate students
•Report Hispanic/Latino individuals of any race as Hispanic/Latino•Report race for non-Hispanic/Latino individuals only
MenStudents enrolled for credit Degree/certificate-seeking
First-time Transfer-in Continuing/Returning
TotalNon-degree/
non-certificate-seekingTotal,
full-timeundergraduate
studentsNonresident alien 0 0 0 0 0Hispanic/Latino 0 2 10 12 12American Indian or Alaska Native 0 1 0 1 1Asian 0 1 2 3 3Black or African American 0 1 2 3 3Native Hawaiian or Other Pacific Islander 0 0 0 0 0White 0 22 59 81 81Two or more races 0 0 0 0 0Race/ethnicity unknown 0 1 1 2 2Total men 0 28 74 102 0 102
WomenStudents enrolled for credit Degree/certificate-seeking
First-time Transfer-in Continuing/Returning
TotalNon-degree/
non-certificate-seekingTotal,
full-timeundergraduate
studentsNonresident alien 0 0 0 0 0Hispanic/Latino 1 3 5 9 9American Indian or Alaska Native 0 0 0 0 0Asian 0 1 2 3 3Black or African American 0 0 6 6 6Native Hawaiian or Other Pacific Islander 0 0 0 0 0White 1 14 17 32 32Two or more races 0 0 0 0 0Race/ethnicity unknown 0 1 3 4 4Total women 2 19 33 54 0 54
Grand total (men+women) 2 47 107 156 0 156Grand total (men+women) 2012-13

Institution: University of Florida-Online (484473)User ID: 88G4433
Part A - Fall Enrollment for Part-time Undergraduate StudentsEnrollment as of the institution's official fall reporting date or as of October 15, 2014
Part-time Undergraduate Students
Race/Ethnicity Reporting Reminder:•Report Hispanic/Latino individuals of any race as Hispanic/Latino•Report race for non-Hispanic/Latino individuals only
MenEnrolled for credit Degree/certificate-seeking
First-time Transfer-inContinuing/Returning
Total degree/certificate-seeking
Non-degree/non-certificate-seeking
Total,part-time
undergraduatestudents
Nonresident alien 0 2 1 3 0 3Hispanic/Latino 0 7 28 35 0 35American Indian orAlaska Native
0 0 2 2 0 2
Asian 0 3 9 12 0 12Black or AfricanAmerican
0 4 13 17 0 17
Native Hawaiian orOther PacificIslander
0 0 1 1 0 1
White 1 54 115 170 5 175Two or more races 0 0 0 0 0 0Race and ethnicityunknown
1 6 7 14 0 14
Total men 2 76 176 254 5 259Total men prior year
WomenEnrolled for credit Degree/certificate-seeking
First-time Transfer-inContinuing/Returning
Total degree/certificate-seeking
Non-degree/non-certificate-seeking
Total,part-time
undergraduatestudents
Nonresident alien 1 0 0 1 0 1Hispanic/Latino 3 16 22 41 0 41American Indian orAlaska Native
0 2 0 2 0 2
Asian 0 1 5 6 0 6Black or AfricanAmerican
0 6 15 21 0 21
Native Hawaiian orOther PacificIslander
0 1 2 3 0 3
White 6 61 135 202 2 204Two or more races 0 0 0 0 0 0Race and ethnicityunknown
0 4 7 11 2 13
Total women 10 91 186 287 4 291Total women prioryear
Grand total(men+women)
12 167 362 541 9 550
Grand total(men+women) prioryear

Institution: University of Florida-Online (484473)User ID: 88G4433
Part A - Fall Enrollment by race/ethnicity and genderEnrollment as of the institution's official fall reporting date or as of October 15, 2014
CIPCODE: 26.0000 -- Biological and Biomedical SciencesPart-time undergraduate students
•Report Hispanic/Latino individuals of any race as Hispanic/Latino•Report race for non-Hispanic/Latino individuals only
MenStudents enrolled for credit Degree/certificate-seeking
First-time Transfer-in Continuing/Returning
TotalNon-degree/
non-certificate-seekingTotal,
part-timeundergraduate
studentsNonresident alien 0 0 0 0 0 0Hispanic/Latino 0 0 0 0 0 0American Indian or Alaska Native 0 0 0 0 0 0Asian 0 0 0 0 0 0Black or African American 0 0 0 0 0 0Native Hawaiian or Other Pacific Islander 0 0 0 0 0 0White 0 0 0 0 0 0Two or more races 0 0 0 0 0 0Race and ethnicity unknown 0 0 0 0 0 0Total men 0 0 0 0 0 0
WomenStudents enrolled for credit Degree/certificate-seeking
First-time Transfer-in Continuing/Returning
TotalNon-degree/
non-certificate-seekingTotal,
part-timeundergraduate
studentsNonresident alien 0 0 0 0 0 0Hispanic/Latino 0 0 0 0 0 0American Indian or Alaska Native 0 0 0 0 0 0Asian 0 0 0 0 0 0Black or African American 0 0 0 0 0 0Native Hawaiian or Other Pacific Islander 0 0 0 0 0 0White 0 0 0 0 0 0Two or more races 0 0 0 0 0 0Race and ethnicity unknown 0 0 0 0 0 0Total women 0 0 0 0 0 0
Grand total (men+women) 0 0 0 0 0 0Grand total (men+women) 2012-13

Institution: University of Florida-Online (484473)User ID: 88G4433
Part A - Fall Enrollment by race/ethnicity and genderEnrollment as of the institution's official fall reporting date or as of October 15, 2014
CIPCODE: 40.0000 -- Physical SciencesPart-time undergraduate students
•Report Hispanic/Latino individuals of any race as Hispanic/Latino•Report race for non-Hispanic/Latino individuals only
MenStudents enrolled for credit Degree/certificate-seeking
First-time Transfer-in Continuing/Returning
TotalNon-degree/
non-certificate-seekingTotal,
part-timeundergraduate
studentsNonresident alien 0 0 0 0Hispanic/Latino 1 1 0 1American Indian or Alaska Native 0 0 0 0Asian 0 0 0 0Black or African American 0 0 0 0Native Hawaiian or Other Pacific Islander 0 0 0 0White 0 0 4 4Two or more races 0 0 0 0Race and ethnicity unknown 0 0 0 0Total men 0 1 0 1 4 5
WomenStudents enrolled for credit Degree/certificate-seeking
First-time Transfer-in Continuing/Returning
TotalNon-degree/
non-certificate-seekingTotal,
part-timeundergraduate
studentsNonresident alien 0 0 0 0Hispanic/Latino 0 0 0 0American Indian or Alaska Native 0 0 0 0Asian 0 0 0 0Black or African American 0 0 0 0Native Hawaiian or Other Pacific Islander 0 0 0 0White 1 1 0 1Two or more races 0 0 0 0Race and ethnicity unknown 0 0 0 0Total women 0 1 0 1 0 1
Grand total (men+women) 0 2 0 2 4 6Grand total (men+women) 2012-13

Institution: University of Florida-Online (484473)User ID: 88G4433
Part A - Fall Enrollment by race/ethnicity and genderEnrollment as of the institution's official fall reporting date or as of October 15, 2014
CIPCODE: 52.0000 -- Business, Management, Marketing and Related Support ServicesPart-time undergraduate students
•Report Hispanic/Latino individuals of any race as Hispanic/Latino•Report race for non-Hispanic/Latino individuals only
MenStudents enrolled for credit Degree/certificate-seeking
First-time Transfer-in Continuing/Returning
TotalNon-degree/
non-certificate-seekingTotal,
part-timeundergraduate
studentsNonresident alien 0 1 1 2 0 2Hispanic/Latino 0 4 22 26 0 26American Indian or Alaska Native 0 0 1 1 0 1Asian 0 1 6 7 0 7Black or African American 0 2 9 11 0 11Native Hawaiian or Other Pacific Islander 0 0 1 1 0 1White 0 38 93 131 1 132Two or more races 0 0 0 0 0 0Race and ethnicity unknown 0 4 5 9 0 9Total men 0 50 138 188 1 189
WomenStudents enrolled for credit Degree/certificate-seeking
First-time Transfer-in Continuing/Returning
TotalNon-degree/
non-certificate-seekingTotal,
part-timeundergraduate
studentsNonresident alien 1 0 0 1 0 1Hispanic/Latino 0 9 16 25 0 25American Indian or Alaska Native 0 1 0 1 0 1Asian 0 0 5 5 0 5Black or African American 0 1 8 9 0 9Native Hawaiian or Other Pacific Islander 0 0 2 2 0 2White 3 31 113 147 0 147Two or more races 0 0 0 0 0 0Race and ethnicity unknown 0 1 5 6 0 6Total women 4 43 149 196 0 196
Grand total (men+women) 4 93 287 384 1 385Grand total (men+women) 2012-13

Institution: University of Florida-Online (484473)User ID: 88G4433
Part A - Fall Enrollment by Distance Education StatusEnrollment as of the institution's official fall reporting date or as of October 15, 2014
Undergraduate Students Degree/Certificate
SeekingNon-Degree/Certificate
SeekingEnrolled exclusively in distance education courses 879 12
Enrolled in some but not all distance education courses 0 0Not enrolled in any distance education courses 0 0Total (all distance education statuses) 879 12Total (from prior part A screens)
NOTE: The total of all distance education statuses (above) mustequal this total carried forward from the prior part A screens
879 12
You may use the space below to provide context for the data you've reported above.

Institution: University of Florida-Online (484473)User ID: 88G4433
Part A - Fall Enrollment by Distance Education Status Undergraduate StudentsOf those students exclusively enrolled in distance educationcourses, report the number that are:
Degree/CertificateSeeking
Non-Degree/CertificateSeeking
Located in FL 798 10Located in the U.S. but not in FL 19 Located in the U.S. but state/jurisdiction unknown 1 Located outside the U.S. 1 Location unknown/unreported 60 2Total students exclusively enrolled in distance education (fromsection above)
879 12

Institution: University of Florida-Online (484473)User ID: 88G4433
Part A - Fall Enrollment SummaryFall Enrollment Summary
MenStudents enrolled for credit Total full-time
studentsTotal part-time
studentsGrand total,all students
Nonresident alien 0 3 3Hispanic/Latino 29 35 64American Indian or Alaska Native 3 2 5Asian 5 12 17Black or African American 8 17 25Native Hawaiian or Other Pacific Islander 0 1 1White 123 175 298Two or more races 1 0 1Race and ethnicity unknown 6 14 20Total men 175 259 434
WomenStudents enrolled for credit Total full-time
studentsTotal part-time
studentsGrand total,all students
Nonresident alien 0 1 1Hispanic/Latino 27 41 68American Indian or Alaska Native 3 2 5Asian 6 6 12Black or African American 22 21 43Native Hawaiian or Other Pacific Islander 2 3 5White 96 204 300Two or more races 1 0 1Race and ethnicity unknown 9 13 22Total women 166 291 457
Grand Total (men+women) 341 550 891

Institution: University of Florida-Online (484473)User ID: 88G4433
Part A - Fall Enrollment - Summary by race/ethnicityFall enrollment totals
CIPCODE: 26.0000 -- Biological and Biomedical SciencesMenStudents enrolled for credit Total full-time
studentsTotal part-time
studentsGrand total,all students
Nonresident alien 0 0 0Hispanic/Latino 0 0 0American Indian or Alaska Native 0 0 0Asian 0 0 0Black or African American 0 0 0Native Hawaiian or Other Pacific Islander 0 0 0White 0 0 0Two or more races 0 0 0Race and ethnicity unknown 0 0 0Total men 0 0 0
WomenStudents enrolled for credit Total full-time
studentsTotal part-time
studentsGrand total,all students
Nonresident alien 0 0 0Hispanic/Latino 0 0 0American Indian or Alaska Native 0 0 0Asian 0 0 0Black or African American 0 0 0Native Hawaiian or Other Pacific Islander 0 0 0White 1 0 1Two or more races 0 0 0Race and ethnicity unknown 0 0 0Total women 1 0 1
Grand Total (men+women) 1 0 1

Institution: University of Florida-Online (484473)User ID: 88G4433
Part A - Fall Enrollment - Summary by race/ethnicityFall enrollment totals
CIPCODE: 40.0000 -- Physical SciencesMenStudents enrolled for credit Total full-time
studentsTotal part-time
studentsGrand total,all students
Nonresident alien 0 0 0Hispanic/Latino 0 1 1American Indian or Alaska Native 0 0 0Asian 0 0 0Black or African American 0 0 0Native Hawaiian or Other Pacific Islander 0 0 0White 0 4 4Two or more races 0 0 0Race and ethnicity unknown 0 0 0Total men 0 5 5
WomenStudents enrolled for credit Total full-time
studentsTotal part-time
studentsGrand total,all students
Nonresident alien 0 0 0Hispanic/Latino 0 0 0American Indian or Alaska Native 0 0 0Asian 0 0 0Black or African American 0 0 0Native Hawaiian or Other Pacific Islander 0 0 0White 1 1 2Two or more races 0 0 0Race and ethnicity unknown 0 0 0Total women 1 1 2
Grand Total (men+women) 1 6 7

Institution: University of Florida-Online (484473)User ID: 88G4433
Part A - Fall Enrollment - Summary by race/ethnicityFall enrollment totals
CIPCODE: 52.0000 -- Business, Management, Marketing and Related Support ServicesMenStudents enrolled for credit Total full-time
studentsTotal part-time
studentsGrand total,all students
Nonresident alien 0 2 2Hispanic/Latino 12 26 38American Indian or Alaska Native 1 1 2Asian 3 7 10Black or African American 3 11 14Native Hawaiian or Other Pacific Islander 0 1 1White 81 132 213Two or more races 0 0 0Race and ethnicity unknown 2 9 11Total men 102 189 291
WomenStudents enrolled for credit Total full-time
studentsTotal part-time
studentsGrand total,all students
Nonresident alien 0 1 1Hispanic/Latino 9 25 34American Indian or Alaska Native 0 1 1Asian 3 5 8Black or African American 6 9 15Native Hawaiian or Other Pacific Islander 0 2 2White 32 147 179Two or more races 0 0 0Race and ethnicity unknown 4 6 10Total women 54 196 250
Grand Total (men+women) 156 385 541

Institution: University of Florida-Online (484473)User ID: 88G4433
Part B - Fall Enrollment by Age and Gender for Full-time Undergraduate StudentsNOTE: These data are optional this year.
Enrollment as of the institution's official fall reporting date or as of October 15, 2014Age Full-time Undergraduate Students
Men WomenUnder 18
18-19 2 1020-21 32 2522-24 58 5325-29 45 3930-34 19 1735-39 8 1340-49 5 750-64 6 2
65 and over Age unknown/unreported 0 0
Total full-time undergraduate students (from part A) 175 166

Institution: University of Florida-Online (484473)User ID: 88G4433
Part B - Fall Enrollment by Age and Gender for Part-time Undergraduate StudentsNOTE: These data are optional this year.
Enrollment as of the institution's official fall reporting date or as of October 15, 2014Age Part-time Undergraduate Students
Men WomenUnder 18
18-19 3 420-21 16 2022-24 41 5025-29 63 5730-34 52 6835-39 37 2540-49 36 5550-64 10 12
65 and over 1 0Age unknown/unreported 0 0
Total part-time undergraduate students (from part A) 259 291

Institution: University of Florida-Online (484473)User ID: 88G4433
Part C - Screening QuestionDid any of your first-time degree/certificate-seeking undergraduate students (reported in Part A) enroll within 12months of graduating high school or receiving their GED? Yes, we have first-time students who enrolled within 12 months of their high school graduation.
No, we do not have any first-time students who enrolled within 12 months of their high schoolgraduation.
You may use the space below to provide context for the data you've reported above.

Institution: University of Florida-Online (484473)User ID: 88G4433
Part C - Residence of First-time UndergraduatesEnrollment as of the institution's official fall reporting date or as of October 15, 2014 Enter at least one zero, where applicable, to verify that the screen has not been skipped.
State of residence when studentwas first admitted
FIPS Code Total first-timedegree/certificate-seeking
undergraduates(1)
Of students in column 1, thosewho enrolled within 12 months
of high school graduationor receiving their GED
(2)Alabama 01 Alaska 02 Arizona 04 1 0Arkansas 05 California 06 1 1Colorado 08 Connecticut 09 0 0Delaware 10 District of Columbia 11 Florida 12 16 8Georgia 13 0 0Hawaii 15 0 0Idaho 16 Illinois 17 0 0Indiana 18 Iowa 19 Kansas 20 Kentucky 21 Louisiana 22 Maine 23

Institution: University of Florida-Online (484473)User ID: 88G4433
Part C - Residence of First-time UndergraduatesEnrollment as of the institution's official fall reporting date or as of October 15, 2014 Enter at least one zero, where applicable, to verify that the screen has not been skipped.
State of residence when studentwas first admitted
FIPS Code Total first-timedegree/certificate-seeking
undergraduates(1)
Of students in column 1, thosewho enrolled within 12 months
of high school graduationor receiving their GED
(2)Maryland 24 Massachusetts 25 Michigan 26 Minnesota 27 Mississippi 28 Missouri 29 0 0Montana 30 0 0Nebraska 31 Nevada 32 New Hampshire 33 New Jersey 34 New Mexico 35 New York 36 North Carolina 37 0 0North Dakota 38 Ohio 39 Oklahoma 40 Oregon 41 0 0Pennsylvania 42 Rhode Island 44

Institution: University of Florida-Online (484473)User ID: 88G4433
Part C - Residence of First-time UndergraduatesEnrollment as of the institution's official fall reporting date or as of October 15, 2014 Enter at least one zero, where applicable, to verify that the screen has not been skipped.
State of residence when studentwas first admitted
FIPSCode
Total first-timedegree/certificate-seeking
undergraduates(1)
Of students in column 1, thosewho enrolled within 12 months of
high school graduationor receiving their GED
(2)South Carolina 45 South Dakota 46 Tennessee 47 1 0Texas 48 Utah 49 Vermont 50 Virginia 51 Washington 53 West Virginia 54 Wisconsin 55 Wyoming 56 State Unknown 57 0 0American Samoa 60 Federated States of Micronesia 64 Guam 66 Marshall Islands 68 Northern Marianas 69 Palau 70 Puerto Rico 72 Virgin Islands 78 Foreign Countries 90 1 0Residence unknown/unreported 98 0 Total first-time degree/certificate-seekingundergraduates (from Part A)
20 9
You may use the space below to provide context for the data you've reported above.

Institution: University of Florida-Online (484473)User ID: 88G4433
Part D - Total Undergraduate Entering ClassTotal Undergraduate Entering Class, Fall 2014
D1Total full-time, first-time degree/certificate-seeking undergraduates from Part A (GR cohort) 8D2Total first-time degree/certificate-seeking undergraduates (full-time + part-time) from Part A 20D3Total transfer-in degree/certificate-seeking undergraduates (full-time + part-time) from Part A 300D4Total non-degree/certificate-seeking undergraduates (full-time + part-time) from Part A 12D5Of the total non-degree/certificate-seeking undergraduates displayed on line D4, the number that are new to
the institution in Fall 2014 8
D6Total entering students at the undergraduate levelNote: This is calculated as first-time students (line D2) + students transferring to the institution (line D3) + non-degree/certificate-seeking undergraduates entering in Fall 2014 (line D5).
328
D7Percentage of undergraduate entering class represented by your GR cohort (line D1/line D6) 2

Imagedescription.Thesecontext noteswill beposted onthe CollegeNavigator.End of imagedescription.
Institution: University of Florida-Online (484473)User ID: 88G4433
Part E - First-time Bachelor's Cohort Retention Rates (Full-time)Retention Rates
Full-time, First-time Bachelor's Cohort from Fall 2013
Academic reporters determine the cohort and retention as of the institution's official fall reporting date or as ofOctober 15. Program reporters determine the cohort with enrollment any time between August 1 and October31, 2013 and retention based on August 1, 2014.
The retention rate is calculated by the system after clicking "Save" on the screen. Exclusions are subtractedfrom the original cohort and the resulting adjusted cohort is used for calculating the retention rate. Retention Data Reporting Reminders:
• Include only full-time, first-time bachelor's students in this cohort.• Determine the full-time cohort using Fall 2013 status (e.g. if a student was full-time in Fall 2013,
report them in the full-time cohort regardless of their Fall 2014 status).• If there are no students to report in the cohort, enter zero. Do not leave the field blank.• Report in the exclusions box (line E2) the number of students from the cohort who left the
institution for any of the following reasons: died or were totally and permanently disabled; toserve in the armed forces (including those called to active duty); to serve with a foreign aidservice of the Federal Government (e.g. Peace Corps); or to serve on official church missions.
Prior yeardata (Fall
2012 cohort)
FULL-TIME, FIRST-TIME BACHELOR'S COHORT RETENTION:E1 Full-time, first-time Fall 2013 bachelor's cohort E2 Exclusions from the Fall 2013 cohort E3 Adjusted Fall 2013 cohort (line E1- line E2) 0 E4 Students from Fall 2013 cohort still enrolled as of Fall 2014 E5 Full-time, first-time Fall 2013 bachelor's cohort retention rate (line E4 / line E3) % %
You may use the space below to provide context for the data you've reported above.These context notes will be posted on the College Navigator website, and should be written to be understoodby students and parents. This institution began enrolling students in Fall 2014, so there are no datafor cohorts in Fall 2013

Imagedescription.Thesecontext noteswill beposted onthe CollegeNavigator.End of imagedescription.
Institution: University of Florida-Online (484473)User ID: 88G4433
Part E - First-time Bachelor's Cohort Retention Rates (Part-time)Retention Rates
Part-time, First-time Bachelor's Cohort from Fall 2013
Academic reporters determine the cohort and retention as of the institution's official fall reporting date or as ofOctober 15. Program reporters determine the cohort with enrollment any time between August 1 and October31, 2013 and retention based on August 1, 2014.
The retention rate is calculated by the system after clicking "Save" on the screen. Exclusions are subtractedfrom the original cohort and the resulting adjusted cohort is used for calculating the retention rate. Retention Data Reporting Reminders:
• Include only part-time, first-time bachelor's-seeking students in this cohort.• Determine part-time using Fall 2013 attendance status (e.g. if a student was part-time in Fall
2013, report them in the part-time cohort regardless of their Fall 2014 status).• If there are no students to report in the cohort, enter zero. Do not leave the field blank.• Report in the exclusions box (line E7) the number of students from the cohort who left the
institution for any of the following reasons: died or were totally and permanently disabled; toserve in the armed forces (including those called to active duty); to serve with a foreign aidservice of the Federal Government (e.g. Peace Corps); or to serve on official church missions.
Prior yeardata (Fall
2012 cohort)PART-TIME, FIRST-TIME BACHELOR'S COHORT RETENTION:E6 Part-time, first-time Fall 2013 bachelor's cohort E7 Exclusions from the Fall 2013 cohort E8 Adjusted Fall 2013 cohort (line E6 - line E7) 0 E9 Students from Fall 2013 cohort still enrolled as of Fall 2014 E10 Part-time, first-time Fall 2013 bachelor's cohort retention rate (line E9 / line E8) % %
You may use the space below to provide context for the data you've reported above.These context notes will be posted on the College Navigator website, and should be written to be understoodby students and parents. This institution began enrolling students in Fall 2014, so there are no datafor cohorts in Fall 2013

Imagedescription.Thesecontext noteswill beposted onthe CollegeNavigator.End of imagedescription.
Institution: University of Florida-Online (484473)User ID: 88G4433
Part F - Student-to-Faculty RatioPlease provide your institution's student-to-faculty ratio (i.e., student-to-instructional staff) for undergraduateprograms for Fall 2014. The student-to-faculty ratio and any accompanying context that is provided will bedisplayed on College Navigator.
Note: Logic in this item is similar to item I-2 from the Common Data Set data collection.
Click here to use a worksheet to help you determine the student-to-faculty ratio
Student-to-faculty ratio 27 to 1 Student-to-faculty ratio prior year to 1
You may use the space below to provide context for the data you've reported above.These context notes will be posted on the College Navigator website, and should be written to be understoodby students and parents.

Institution: University of Florida-Online (484473)User ID: 88G4433
Prepared by This survey component was prepared by: Keyholder SFA Contact HR Contact
Finance Contact Academic Library Contact Other
Name: Marie Zeglen Email: [email protected] How long did it take to prepare thissurvey component?
20hours minutes
The name of the preparer is being collected so that we can follow up with the appropriate person in the event that thereare questions concerning the data. The Keyholder will be copied on all email correspondence to other preparers.The time it took to prepare this component is being collected so that we can continue to improve our estimate of thereporting burden associated with IPEDS. Please include in your estimate the time it took for you to review instructions,query and search data sources, complete and review the component, and submit the data through the Data CollectionSystem.Thank you for your assistance.

Institution: University of Florida-Online (484473) User ID: 88G4433Summary
Fall Enrollment Survey SummaryFour-Year Institutions without Graduate Students
IPEDS collects important information regarding your institution. All data reported in IPEDSsurvey components become available in the IPEDS Data Center and appear as aggregated datain various Department of Education reports. Additionally, some of the reported data appearsspecifically for your institution through the College Navigator website and is included in yourinstitution’s Data Feedback Report (DFR). The purpose of this summary is to provide you anopportunity to view some of the data that, when accepted through the IPEDS quality controlprocess, will appear on the College Navigator website and/or your DFR. College Navigator isupdated approximately three months after the data collection period closes and Data FeedbackReports will be available through the Data Center and sent to your institution’s CEO inNovember 2015.
Please review your data for accuracy. If you have questions about the data displayed belowafter reviewing the data reported on the survey screens, please contact the IPEDS Help Desk at:1-877-225-2568 or [email protected].
Undergraduate Student EnrollmentTotal enrollment 891
Transfer-in enrollment 300
Student-to-faculty ratio 27 to 1
Undergraduate Student CharacteristicsPercent of undergraduates who are female 51%
Percent of undergraduates who are full-time 38%
Percent of undergraduates by race/ethnicity:
American Indian or Alaska Native 1%
Asian 3%
Black or African American 8%
Hispanic/Latino 15%
Native Hawaiian or Pacific Islander 1%
White 67%
Two or More Races 0%
Race and ethnicity unknown 5%
Nonresident alien 0%
Percent of undergraduate students by age:
24 and under 35%
25 and over 65%
Age unknown 0%
Undergraduate Retention and Graduation Rate CohortFirst-time, full-time bachelor’s seeking student retentionrate
First-time, part-time bachelor’s seeking student retentionrate
Graduation rate cohort as percent of total enteringstudents 2%

Institution: University of Florida-Online (484473) User ID: 88G4433Edit Report
Fall Enrollment
University of Florida-Online (484473)
Source Description Severity Resolved OptionsScreen: Part A - Fall Enrollment by race/ethnicity and genderPerform Edits You have reported Transfer-in students (Col 2) for full-time
undergraduate women (CIP 40.0000), but noContinuing/Returning students in Col 3. Please confirmthat these data are correct or contact the IPEDS HelpDesk for assistance at 1-877-225-2568. (Error #6239)
Confirmation Yes
Perform Edits You have reported Transfer-in students (Col 2) for part-time undergraduate men (CIP 40.0000), but noContinuing/Returning students in Col 3. Please confirmthat these data are correct or contact the IPEDS HelpDesk for assistance at 1-877-225-2568. (Error #6240)
Confirmation Yes
Perform Edits You have reported Transfer-in students (Col 2) for part-time undergraduate women (CIP 40.0000), but noContinuing/Returning students in Col 3. Please confirmthat these data are correct or contact the IPEDS HelpDesk for assistance at 1-877-225-2568. (Error #6241)
Confirmation Yes

12-month Enrollment 2014-15Institution: University of Florida (134130)User ID: 88G4434
Overview screen12-month Enrollment Overview
The 12-Month Enrollment component collects unduplicated student enrollment counts and instructional activity data foran entire 12-month period. Using the instructional activity data reported, a full-time equivalent (FTE) studentenrollment at the undergraduate and graduate level is estimated. Institutions with Doctor's-professional practicestudents will also report the FTE enrollment of those students. NCES uses the FTE enrollment to produce indicatorssuch as expenses by function per FTE as reported in the IPEDS Data Feedback Report.
Data Reporting Reminders:
• All institutions must now use the July 1 - June 30 reporting period. There is no longer the option of using the
September 1 - August 31 reporting period.
  Resources:To download the survey materials for this component: Survey Materials
To access your prior year data submission for this component: Reported Data
If you have questions about completing this survey, please contact the IPEDS Help Desk at 1-877-225-2568.

Institution: University of Florida (134130)User ID: 88G4434
Undergraduate Instructional Activity TypeUndergraduate instructional activity data in Part B may be reported in units of contact hours or credit hours.Which instructional activity units will you use to report undergraduate instructional activity?
Please note that any graduate level instructional activity must be reported in credit hours. Contact hours
Credit hours
Both contact and credit hours (some undergraduate programs measured in contact hours and some measuredin credit hours)
You may use the space below to provide context for the data you've reported above.

Institution: University of Florida (134130)User ID: 88G4434
Part A - Unduplicated Count12-month Unduplicated Count by Race/Ethnicity and Gender
July 1, 2013 - June 30, 2014Race/Ethnicity Reporting Reminder:•Report Hispanic/Latino individuals of any race as Hispanic/Latino•Report race for non-Hispanic/Latino individuals only•Even though Teacher Preparation certificate programs may require a bachelor's degree for admission, they areconsidered subbaccalaureate undergraduate programs, and students in these programs are undergraduate students.
Graduate Student Reporting Reminder:•Report all postbaccalaureate degree and certificate students as graduate students, including any doctor's-professionalpractice students (formerly first-professional)
Men
Students enrolled for credit Undergraduate students Graduatestudents
Nonresident alien 348 2,675Hispanic/Latino 3,050 803American Indian or Alaska Native 50 31Asian 1,322 521Black or African American 1,009 392Native Hawaiian or Other Pacific Islander 76 13White 9,911 4,624Two or more races 409 85Race and ethnicity unknown 522 418Total men 16,697 9,562Total men prior year 16,291 9,916 WomenStudents enrolled for credit Undergraduate students Graduate
studentsNonresident alien 310 1,879Hispanic/Latino 3,927 1,043American Indian or Alaska Native 52 40Asian 1,389 674Black or African American 1,782 707Native Hawaiian or Other Pacific Islander 164 20White 11,227 5,850Two or more races 601 116Race and ethnicity unknown 582 381Total women 20,034 10,710Total women prior year 19,604 10,831 Grand total (2013-14) 36,731 20,272Prior year data: Unduplicated headcount (2012-13) 35,895 20,747
Total enrollment Fall 2013NOTE: Grand total (2013-14) calculated above is expected to be greater thanTotal enrollment Fall 2013.
33,168 16,710
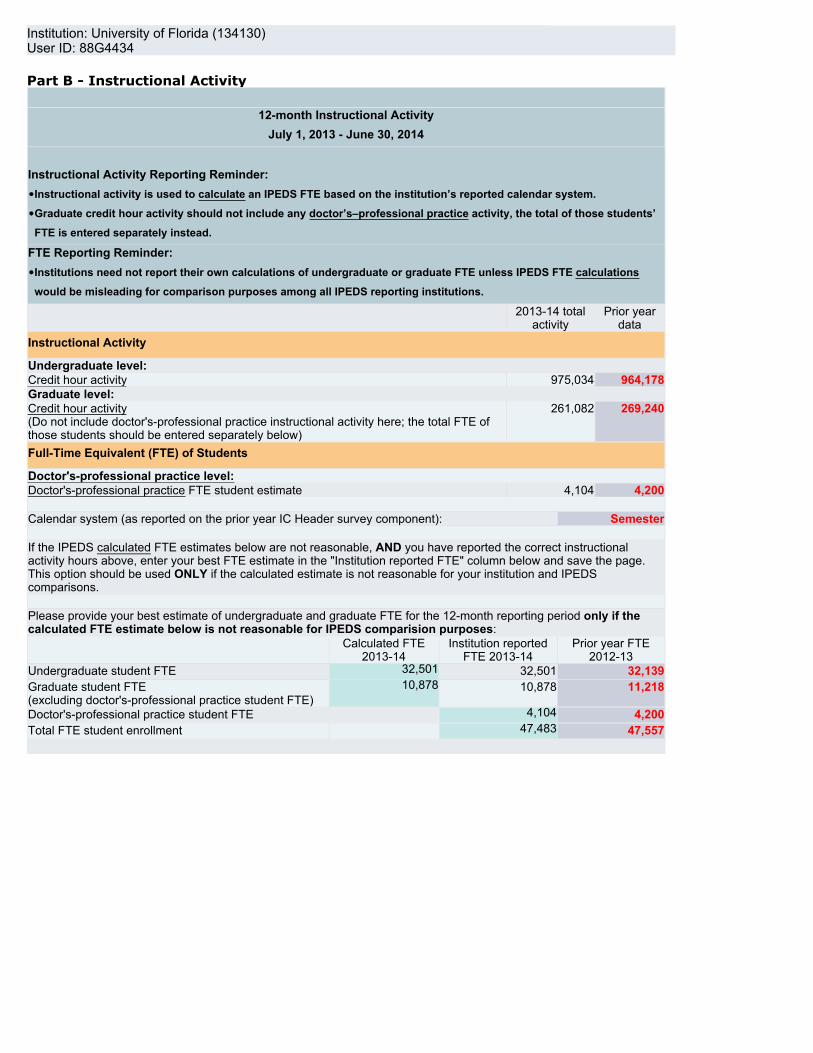
Institution: University of Florida (134130)User ID: 88G4434
Part B - Instructional Activity
12-month Instructional ActivityJuly 1, 2013 - June 30, 2014
Instructional Activity Reporting Reminder:•Instructional activity is used to calculate an IPEDS FTE based on the institution’s reported calendar system.•Graduate credit hour activity should not include any doctor’s–professional practice activity, the total of those students’FTE is entered separately instead.
FTE Reporting Reminder:•Institutions need not report their own calculations of undergraduate or graduate FTE unless IPEDS FTE calculationswould be misleading for comparison purposes among all IPEDS reporting institutions.
2013-14 totalactivity
Prior yeardata
Instructional Activity
Undergraduate level:Credit hour activity 975,034 964,178Graduate level:Credit hour activity(Do not include doctor's-professional practice instructional activity here; the total FTE ofthose students should be entered separately below)
261,082 269,240
Full-Time Equivalent (FTE) of Students
Doctor's-professional practice level:Doctor's-professional practice FTE student estimate 4,104 4,200 Calendar system (as reported on the prior year IC Header survey component): Semester If the IPEDS calculated FTE estimates below are not reasonable, AND you have reported the correct instructionalactivity hours above, enter your best FTE estimate in the "Institution reported FTE" column below and save the page.This option should be used ONLY if the calculated estimate is not reasonable for your institution and IPEDScomparisons. Please provide your best estimate of undergraduate and graduate FTE for the 12-month reporting period only if thecalculated FTE estimate below is not reasonable for IPEDS comparision purposes: Calculated FTE
2013-14Institution reported
FTE 2013-14Prior year FTE
2012-13Undergraduate student FTE 32,501 32,501 32,139Graduate student FTE(excluding doctor's-professional practice student FTE)
10,878 10,878 11,218
Doctor's-professional practice student FTE 4,104 4,200Total FTE student enrollment 47,483 47,557

Institution: University of Florida (134130)User ID: 88G4434
Prepared by This survey component was prepared by: Keyholder SFA Contact HR Contact
Finance Contact Academic Library Contact Other
Name: Marie Zeglen Email: [email protected] How long did it take to prepare thissurvey component?
6hours minutes
The name of the preparer is being collected so that we can follow up with the appropriate person in the event that thereare questions concerning the data. The Keyholder will be copied on all email correspondence to other preparers.The time it took to prepare this component is being collected so that we can continue to improve our estimate of thereporting burden associated with IPEDS. Please include in your estimate the time it took for you to review instructions,query and search data sources, complete and review the component, and submit the data through the Data CollectionSystem.Thank you for your assistance.

Institution: University of Florida (134130) User ID: 88G4434Summary screen
12-Month Enrollment Component Summary
IPEDS collects important information regarding your institution. All data reported in IPEDSsurvey components become available in the IPEDS Data Center and appear as aggregated datain various Department of Education reports. Additionally, some of the reported data appearsspecifically for your institution through the College Navigator website and is included in yourinstitution’s Data Feedback Report (DFR). The purpose of this summary is to provide you anopportunity to view some of the data that, when accepted through the IPEDS quality controlprocess, will appear on the College Navigator website and/or your DFR. College Navigator isupdated approximately three months after the data collection period closes and Data FeedbackReports will be available through the Data Center and sent to your institution’s CEO inNovember 2015.
Please review your data for accuracy. If you have questions about the data displayed belowafter reviewing the data reported on the survey screens, please contact the IPEDS Help Desk at:1-877-225-2568 or [email protected].
12-Month Unduplicated Headcount and Full-Time Equivalent StudentsTotal 12-month unduplicated headcount 57,003
Undergraduate student unduplicated headcount 36,731Graduate student unduplicated headcount 20,272
Total 12-month full-time equivalent (FTE) student enrollment 47,483
Undergraduate student FTE 32,501Graduate student FTE 10,878Doctor's-professional practice FTE 4,104

Institution: University of Florida (134130) User ID: 88G4434Edit Report
12-month Enrollment
University of Florida (134130)
There are no errors for the selected survey and institution.

Completions 2014-15
Institution: University of Florida (134130) User ID: 88G4434Completions Overview
Welcome to the IPEDS Completions survey component. The Completions component is one of several IPEDS components that is conducted during the Fall datacollection period. It collects the number of degrees and certificates awarded by field of study, level of award, race/ethnicity, and gender. The reporting period for theCompletions component is during the 12-month time period beginning July 1 of the previous calendar year and ending June 30 of the current calendar year; therefore,for this year’s Completions component, the reporting period is between July 1, 2013 and June 30, 2014. The Completions component is also collecting the number ofstudents (e.g., completers) who earned awards between July 1, 2013 and June 30, 2014.
Completions Common Errors Some common completions component errors include the following:
• Including award levels on your current year Completions that were not reported on your previous year's (PY) Institutional Characteristics (IC). [Award levels inthe PY IC component cannot be changed; therefore, contact the IPEDS Help Desk at 1-877-225-2568 if you need assistance.]
• Forgetting to select CIP codes for new programs of study that are offered by the institution, but do not have completions for the reporting period.• Forgetting to enter in zero in at least one of the cells for CIP codes that do not have completions.
Recent Changes • The following question on distance education has been added to the bottom of each individual "CIP Data" screen:
"Is this program offered as a distance education program?"• The following two screens, which collect data specifically on students were added to this component, beginning in the 2012-13 survey year:
◦ "All Completers" - Collects the number of students who earned an award between July 1, 2013 and June 30, 2014 by gender and race/ethnicity.(The intent of this screen is to collect an unduplicated count of total numbers of completers.)
◦ "Completers by Level" - Collects the number of students who earned an award between July 1, 2013 and June 30, 2014 by award level and 1) bygender; 2) by race/ethnicity; and 3) by age.
• The definition for Post-baccalaureate Certificate has changed slightly for the 2014-15 collection. The new definition is as follows: An award that requirescompletion of an organized program of study beyond the bachelor's. It is designed for persons who have completed a baccalaureate degree, butdoes not meet the requirements of a master's degree.
NOTE: Even though Teacher Preparation certificate programs may require a bachelor's degree for admission, they are considered sub-bacalaureate undergraduate programs, and students in these programs are undergraduate students.
General Information CIP Codes: The CIP 2010 Website includes a list of new CIP codes, a list of deleted CIP codes, a list of moved CIP Codes, and an online crosswalk of the 2000 CIP and 2010CIP.
The Resources Page of the CIP 2010 website contains many valuable resources including:• CIP 2010 Manual and copies of previous editions of the CIP Manual• Crosswalk between the 2000 CIP codes and the 2010 CIP codes in Excel format
Keep in mind that some information provided by institutions on the Completions component appear in the College Navigator, which is a major tool used by consumerssearching for information about postsecondary education. It is therefore vitally important that you include accurate information about your institution.
Survey materials can be downloaded using the following link: Survey Materials.
The prior year revision system can be accessed using the following link: Prior Year Revision System

Completions CIP Data
CIPCODE AwardLevel Major Gender
NonResident
AlienHispanic/ Latino
AmericanIndian orAlaskaNative
AsianBlack orAfrican
American
NativeHawaiianor OtherPacific
Islander
WhiteTwoor
moreRaces
Race/ethnicityunknown
Totaldistance
educationprogram
01.0103Agricultural Economics
5 - Bachelor'sdegree 1
Men 4 8 1 4 3 1 54 0 2 77 Women 1 8 0 1 3 0 22 0 2 37
Total 5 16 1 5 6 1 76 0 4 114 No01.0103Agricultural Economics
7 - Master'sdegree 1
Men 3 0 0 0 1 0 12 0 1 17 Women 9 1 0 0 0 0 3 0 0 13
Total 12 1 0 0 1 0 15 0 1 30 No01.0103Agricultural Economics
17 - Doctor'sdegree -research /scholarship
1Men 2 0 0 0 0 0 0 0 0 2
Women 0 0 0 0 1 0 0 0 0 1 Total 2 0 0 0 1 0 0 0 0 3 No
01.0401Agricultural and FoodProducts Processing
5 - Bachelor'sdegree 1
Men 0 0 0 0 0 0 0 0 0 0 Women 0 0 0 0 0 0 0 0 0 0
Total 0 0 0 0 0 0 0 0 0 0 No01.0603Ornamental Horticulture
5 - Bachelor'sdegree 1
Men 0 0 0 0 0 1 6 0 0 7 Women 0 0 0 0 0 0 2 0 1 3
Total 0 0 0 0 0 1 8 0 1 10 No01.0901Animal Sciences, General
5 - Bachelor'sdegree 1
Men 0 4 0 0 2 0 14 0 0 20 Women 0 17 0 3 2 0 77 1 4 104
Total 0 21 0 3 4 0 91 1 4 124 No01.0901Animal Sciences, General
7 - Master'sdegree 1
Men 0 1 0 0 0 0 2 0 0 3 Women 4 1 0 0 0 0 6 0 0 11
Total 4 2 0 0 0 0 8 0 0 14 No01.0901Animal Sciences, General
17 - Doctor'sdegree -research /scholarship
1Men 1 1 0 0 0 0 0 0 1 3
Women 1 0 0 0 0 0 1 0 0 2 Total 2 1 0 0 0 0 1 0 1 5 No
01.0901Animal Sciences, General
5 - Bachelor'sdegree 2
Men 0 0 0 0 0 0 0 0 0 0 Women 0 0 0 0 0 0 0 0 0 0
Total 0 0 0 0 0 0 0 0 0 0 No01.1001Food Science
5 - Bachelor'sdegree 1
Men 0 8 0 11 9 6 29 0 2 65 Women 1 25 0 21 11 22 67 4 2 153
Total 1 33 0 32 20 28 96 4 4 218 No01.1001Food Science
7 - Master'sdegree 1
Men 2 0 0 1 0 0 4 0 0 7 Women 2 2 0 0 0 0 8 1 0 13
Total 4 2 0 1 0 0 12 1 0 20 No01.1001Food Science
17 - Doctor'sdegree -research /scholarship
1Men 4 0 0 0 0 0 0 0 0 4
Women 1 1 0 0 0 0 1 0 0 3 Total 5 1 0 0 0 0 1 0 0 7 No
01.1001Food Science
5 - Bachelor'sdegree 2
Men 0 0 0 0 0 0 1 0 0 1 Women 0 0 0 0 0 0 1 1 0 2
Total 0 0 0 0 0 0 2 1 0 3 No01.1101Plant Sciences, General
5 - Bachelor'sdegree 1
Men 0 1 0 0 0 0 10 0 0 11 Women 0 0 0 0 0 0 8 0 0 8
Total 0 1 0 0 0 0 18 0 0 19 No

CIPCODE AwardLevel Major Gender
NonResident
AlienHispanic/ Latino
AmericanIndian orAlaskaNative
AsianBlack orAfrican
American
NativeHawaiianor OtherPacific
Islander
WhiteTwoor
moreRaces
Race/ethnicityunknown
Totaldistance
educationprogram
01.1102Agronomy and Crop Science
7 - Master'sdegree
1 Men 6 0 0 0 0 0 3 0 0 9 Women 0 0 0 0 0 0 2 0 0 2
Total 6 0 0 0 0 0 5 0 0 11 Yes01.1102Agronomy and Crop Science
17 - Doctor'sdegree -research /scholarship
1Men 3 0 0 0 0 0 1 0 0 4
Women 1 0 0 0 0 0 1 0 0 2 Total 4 0 0 0 0 0 2 0 0 6 No
01.1103Horticultural Science
5 - Bachelor'sdegree 1
Men 1 1 0 0 0 0 6 0 1 9 Women 0 0 0 0 0 0 3 0 0 3
Total 1 1 0 0 0 0 9 0 1 12 No01.1103Horticultural Science
7 - Master'sdegree 1
Men 2 1 0 0 0 0 5 0 0 8 Women 6 0 0 2 0 0 5 0 0 13
Total 8 1 0 2 0 0 10 0 0 21 No01.1103Horticultural Science
17 - Doctor'sdegree -research /scholarship
1Men 2 0 0 0 0 0 4 0 0 6
Women 2 0 0 0 0 0 2 0 0 4 Total 4 0 0 0 0 0 6 0 0 10 No
01.1199Plant Sciences, Other
18 - Doctor'sdegree -professionalpractice
1Men 0 1 0 0 0 0 1 0 0 2
Women 1 0 0 0 0 0 2 0 0 3 Total 1 1 0 0 0 0 3 0 0 5 No
01.1201Soil Science and Agronomy,General
5 - Bachelor'sdegree 1
Men 1 1 0 0 0 0 2 0 0 4 Women 0 2 1 0 1 0 2 0 0 6
Total 1 3 1 0 1 0 4 0 0 10 No01.1201Soil Science and Agronomy,General
7 - Master'sdegree 1
Men 2 0 0 0 0 0 4 0 0 6 Women 1 1 0 1 0 0 2 0 0 5
Total 3 1 0 1 0 0 6 0 0 11 Yes01.1201Soil Science and Agronomy,General
17 - Doctor'sdegree -research /scholarship
1Men 3 0 0 0 0 0 0 0 0 3
Women 2 0 0 0 0 0 0 0 1 3 Total 5 0 0 0 0 0 0 0 1 6 No
03.0104Environmental Science
5 - Bachelor'sdegree 1
Men 0 1 0 1 0 0 8 1 1 12 Women 0 3 0 0 1 1 15 1 1 22
Total 0 4 0 1 1 1 23 2 2 34 No03.0301Fishing and FisheriesSciences and Management
7 - Master'sdegree 1
Men 0 0 0 0 0 0 4 0 0 4 Women 0 0 0 0 0 0 2 0 0 2
Total 0 0 0 0 0 0 6 0 0 6 Yes03.0301Fishing and FisheriesSciences and Management
17 - Doctor'sdegree -research /scholarship
1Men 0 1 0 0 0 0 3 0 0 4
Women 0 0 0 1 0 0 1 0 0 2 Total 0 1 0 1 0 0 4 0 0 6 No
03.0501Forestry, General
5 - Bachelor'sdegree 1
Men 0 0 0 0 0 0 19 0 1 20 Women 0 2 1 0 0 0 12 1 0 16
Total 0 2 1 0 0 0 31 1 1 36 No03.0501Forestry, General
7 - Master'sdegree 1
Men 3 0 0 0 0 0 8 0 0 11 Women 1 0 0 1 0 0 6 0 0 8
Total 4 0 0 1 0 0 14 0 0 19 Yes03.0501 Men 2 0 0 0 0 0 1 0 0 3

CIPCODE AwardLevel Major Gender
NonResident
AlienHispanic/ Latino
AmericanIndian orAlaskaNative
AsianBlack orAfrican
American
NativeHawaiianor OtherPacific
Islander
WhiteTwoor
moreRaces
Race/ethnicityunknown
Totaldistance
educationprogram
Forestry, General 17 - Doctor'sdegree -research /scholarship
1 Women 0 0 0 0 0 0 0 0 0 0 Total 2 0 0 0 0 0 1 0 0 3 No
03.0601Wildlife, Fish and WildlandsScience and Management
5 - Bachelor'sdegree 1
Men 0 1 0 1 0 0 16 0 0 18 Women 0 4 0 1 1 0 35 1 2 44
Total 0 5 0 2 1 0 51 1 2 62 No03.0601Wildlife, Fish and WildlandsScience and Management
7 - Master'sdegree 1
Men 1 0 0 0 0 0 2 0 2 5 Women 0 0 0 0 2 0 2 0 0 4
Total 1 0 0 0 2 0 4 0 2 9 No03.0601Wildlife, Fish and WildlandsScience and Management
17 - Doctor'sdegree -research /scholarship
1Men 0 0 0 0 0 0 0 0 0 0
Women 1 0 0 0 0 0 0 0 0 1 Total 1 0 0 0 0 0 0 0 0 1 No
03.0601Wildlife, Fish and WildlandsScience and Management
5 - Bachelor'sdegree 2
Men 0 0 0 0 0 0 1 0 0 1 Women 0 0 0 0 0 0 1 0 0 1
Total 0 0 0 0 0 0 2 0 0 2 No04.0201Architecture
5 - Bachelor'sdegree 1
Men 0 15 0 4 3 0 24 3 2 51 Women 1 10 1 4 2 0 25 1 0 44
Total 1 25 1 8 5 0 49 4 2 95 Yes04.0201Architecture
7 - Master'sdegree 1
Men 5 4 0 1 0 0 21 0 1 32 Women 9 8 0 0 0 0 11 0 2 30
Total 14 12 0 1 0 0 32 0 3 62 No04.0201Architecture
17 - Doctor'sdegree -research /scholarship
1Men 8 1 0 0 0 0 1 0 0 10
Women 6 1 0 0 0 0 1 0 0 8 Total 14 2 0 0 0 0 2 0 0 18 No
04.0301City/Urban, Community andRegional Planning
7 - Master'sdegree 1
Men 1 0 0 0 0 0 4 0 0 5 Women 1 0 0 0 0 0 2 1 0 4
Total 2 0 0 0 0 0 6 1 0 9 Yes04.0601Landscape Architecture
5 - Bachelor'sdegree 1
Men 0 2 0 0 0 0 2 0 2 6 Women 0 1 0 0 1 0 4 0 0 6
Total 0 3 0 0 1 0 6 0 2 12 No04.0601Landscape Architecture
7 - Master'sdegree 1
Men 0 0 0 0 0 0 1 0 0 1 Women 0 0 0 0 0 0 4 0 0 4
Total 0 0 0 0 0 0 5 0 0 5 No05.0103Asian Studies/Civilization
5 - Bachelor'sdegree 1
Men 0 0 0 0 0 0 0 0 0 0 Women 0 0 0 0 0 0 0 0 0 0
Total 0 0 0 0 0 0 0 0 0 0 No05.0107Latin American Studies
7 - Master'sdegree 1
Men 0 1 0 0 0 0 1 0 0 2 Women 0 0 0 0 1 0 1 0 0 2
Total 0 1 0 0 1 0 2 0 0 4 No05.0201African-American/BlackStudies
5 - Bachelor'sdegree 1
Men 0 0 0 0 0 0 0 0 0 0 Women 0 0 0 0 3 0 0 0 0 3
Total 0 0 0 0 3 0 0 0 0 3 No05.0207Women's Studies
5 - Bachelor'sdegree 1
Men 0 1 0 0 0 0 0 0 0 1 Women 0 1 0 0 4 0 8 1 0 14

CIPCODE AwardLevel Major Gender
NonResident
AlienHispanic/ Latino
AmericanIndian orAlaskaNative
AsianBlack orAfrican
American
NativeHawaiianor OtherPacific
Islander
WhiteTwoor
moreRaces
Race/ethnicityunknown
Totaldistance
educationprogram
Total 0 2 0 0 4 0 8 1 0 15 No05.0207Women's Studies
7 - Master'sdegree 1
Men 0 0 0 0 1 0 0 0 0 1 Women 0 2 0 0 0 0 2 0 0 4
Total 0 2 0 0 1 0 2 0 0 5 No05.0207Women's Studies
5 - Bachelor'sdegree 2
Men 0 0 0 0 0 0 0 0 0 0 Women 0 1 0 0 0 0 0 0 0 1
Total 0 1 0 0 0 0 0 0 0 1 No09.0102Mass Communication/MediaStudies
7 - Master'sdegree 1
Men 5 1 0 0 0 0 13 0 0 19 Women 32 10 0 2 6 0 30 1 0 81
Total 37 11 0 2 6 0 43 1 0 100 Yes09.0102Mass Communication/MediaStudies
17 - Doctor'sdegree -research /scholarship
1Men 2 0 0 0 0 0 2 0 0 4
Women 3 0 0 1 1 0 2 0 1 8 Total 5 0 0 1 1 0 4 0 1 12 No
09.0401Journalism
5 - Bachelor'sdegree 1
Men 1 4 0 3 1 0 23 0 0 32 Women 1 15 0 4 6 0 62 3 4 95
Total 2 19 0 7 7 0 85 3 4 127 No09.0701Radio and Television
5 - Bachelor'sdegree 1
Men 1 13 0 3 8 0 45 5 4 79 Women 0 34 1 4 24 1 71 3 2 140
Total 1 47 1 7 32 1 116 8 6 219 Yes09.0902Public Relations/ImageManagement
5 - Bachelor'sdegree 1
Men 0 4 0 0 1 0 14 0 1 20 Women 0 41 0 4 14 1 89 4 6 159
Total 0 45 0 4 15 1 103 4 7 179 No09.0903Advertising
5 - Bachelor'sdegree 1
Men 0 11 0 5 2 0 26 2 0 46 Women 4 26 0 1 5 0 60 3 7 106
Total 4 37 0 6 7 0 86 5 7 152 No09.0903Advertising
7 - Master'sdegree 1
Men 2 1 0 0 0 0 0 0 0 3 Women 2 0 0 0 0 0 2 0 0 4
Total 4 1 0 0 0 0 2 0 0 7 No11.0101Computer and InformationSciences, General
5 - Bachelor'sdegree 1
Men 0 5 1 10 3 0 34 3 2 58 Women 0 1 0 2 0 0 5 3 0 11
Total 0 6 1 12 3 0 39 6 2 69 No11.0101Computer and InformationSciences, General
7 - Master'sdegree 1
Men 3 1 0 0 0 0 1 0 0 5 Women 0 0 0 0 0 0 0 0 0 0
Total 3 1 0 0 0 0 1 0 0 5 No11.0101Computer and InformationSciences, General
5 - Bachelor'sdegree 2
Men 0 0 0 0 0 0 0 1 0 1 Women 0 0 0 0 0 0 0 0 0 0
Total 0 0 0 0 0 0 0 1 0 1 No13.0301Curriculum and Instruction
7 - Master'sdegree 1
Men 0 1 0 0 2 0 9 0 0 12 Women 8 24 1 0 6 0 76 0 1 116
Total 8 25 1 0 8 0 85 0 1 128 Yes13.0301Curriculum and Instruction
8 - Post-Master'scertificates
1Men 0 0 0 0 0 0 1 0 0 1
Women 0 7 0 0 1 0 17 1 1 27 Total 0 7 0 0 1 0 18 1 1 28 Yes
13.0301Curriculum and Instruction 1
Men 0 0 0 1 0 0 2 0 1 4 Women 1 1 0 1 1 0 7 0 0 11

CIPCODE AwardLevel Major Gender
NonResident
AlienHispanic/ Latino
AmericanIndian orAlaskaNative
AsianBlack orAfrican
American
NativeHawaiianor OtherPacific
Islander
WhiteTwoor
moreRaces
Race/ethnicityunknown
Totaldistance
educationprogram
17 - Doctor'sdegree -research /scholarship
Total 1 1 0 2 1 0 9 0 1 15 No
13.0301Curriculum and Instruction
18 - Doctor'sdegree -professionalpractice
1Men 0 0 0 0 0 0 1 0 0 1
Women 0 1 0 0 0 0 12 0 0 13 Total 0 1 0 0 0 0 13 0 0 14 Yes
13.0301Curriculum and Instruction
19 - Doctor'sdegree - Other 1
Men 0 0 0 0 0 0 0 0 0 0 Women 0 0 0 0 0 0 0 0 0 0
Total 0 0 0 0 0 0 0 0 0 0 No13.0401Educational Leadership andAdministration, General
7 - Master'sdegree 1
Men 0 0 0 0 0 0 3 0 1 4 Women 0 0 0 0 1 0 2 0 0 3
Total 0 0 0 0 1 0 5 0 1 7 Yes13.0401Educational Leadership andAdministration, General
8 - Post-Master'scertificates
1Men 0 0 0 0 0 0 0 0 0 0
Women 0 0 0 0 0 0 1 0 0 1 Total 0 0 0 0 0 0 1 0 0 1 No
13.0401Educational Leadership andAdministration, General
17 - Doctor'sdegree -research /scholarship
1Men 0 0 0 0 0 0 5 0 0 5
Women 0 1 0 0 1 0 6 0 0 8 Total 0 1 0 0 1 0 11 0 0 13 Yes
13.0406Higher Education/HigherEducation Administration
17 - Doctor'sdegree -research /scholarship
1Men 1 1 0 0 0 0 5 0 0 7
Women 1 2 0 0 2 0 7 0 0 12 Total 2 3 0 0 2 0 12 0 0 19 Yes
13.0603Educational Statistics andResearch Methods
7 - Master'sdegree 1
Men 2 0 0 0 0 0 0 0 0 2 Women 0 0 0 0 1 0 0 0 0 1
Total 2 0 0 0 1 0 0 0 0 3 No13.0603Educational Statistics andResearch Methods
17 - Doctor'sdegree -research /scholarship
1Men 0 0 0 0 0 0 0 0 0 0
Women 1 0 0 0 0 0 0 0 0 1 Total 1 0 0 0 0 0 0 0 0 1 No
13.1001Special Education andTeaching, General
5 - Bachelor'sdegree 1
Men 0 0 0 0 0 0 0 0 0 0 Women 0 3 0 0 6 0 13 1 0 23
Total 0 3 0 0 6 0 13 1 0 23 No13.1001Special Education andTeaching, General
7 - Master'sdegree 1
Men 0 0 0 0 0 0 1 0 0 1 Women 0 2 0 1 2 0 23 0 1 29
Total 0 2 0 1 2 0 24 0 1 30 Yes13.1001Special Education andTeaching, General
8 - Post-Master'scertificates
1Men 0 0 0 0 0 0 0 0 0 0
Women 0 0 0 0 0 0 1 0 0 1 Total 0 0 0 0 0 0 1 0 0 1 No
13.1001Special Education andTeaching, General
17 - Doctor'sdegree -research /scholarship
1Men 0 0 0 0 0 0 1 0 0 1
Women 1 1 0 0 1 0 9 0 0 12 Total 1 1 0 0 1 0 10 0 0 13 No
13.1101 7 - Master'sdegree 1
Men 0 1 0 0 1 0 2 0 0 4 Women 0 1 0 0 0 0 4 0 0 5
Total 0 2 0 0 1 0 6 0 0 9 No

CIPCODE AwardLevel Major Gender
NonResident
AlienHispanic/ Latino
AmericanIndian orAlaskaNative
AsianBlack orAfrican
American
NativeHawaiianor OtherPacific
Islander
WhiteTwoor
moreRaces
Race/ethnicityunknown
Totaldistance
educationprogram
Counselor Education/SchoolCounseling and GuidanceServices13.1101Counselor Education/SchoolCounseling and GuidanceServices
8 - Post-Master'scertificates 1
Men 0 1 0 0 1 0 2 0 0 4 Women 0 1 0 0 0 0 4 0 0 5
Total 0 2 0 0 1 0 6 0 0 9 No
13.1101Counselor Education/SchoolCounseling and GuidanceServices
17 - Doctor'sdegree -research /scholarship
1Men 0 0 0 0 0 0 1 0 0 1
Women 0 0 0 0 0 0 0 0 0 0 Total 0 0 0 0 0 0 1 0 0 1 No
13.1102College Student Counselingand Personnel Services
7 - Master'sdegree 1
Men 0 0 0 0 1 0 1 0 0 2 Women 0 2 0 1 2 0 8 0 0 13
Total 0 2 0 1 3 0 9 0 0 15 No13.1202Elementary Education andTeaching
5 - Bachelor'sdegree 1
Men 0 1 0 0 0 0 4 0 0 5 Women 0 9 0 1 6 0 89 2 1 108
Total 0 10 0 1 6 0 93 2 1 113 No13.1202Elementary Education andTeaching
7 - Master'sdegree 1
Men 0 2 0 0 0 0 3 0 0 5 Women 0 8 0 2 3 0 100 0 2 115
Total 0 10 0 2 3 0 103 0 2 120 No13.1210Early Childhood Educationand Teaching
7 - Master'sdegree 1
Men 0 0 0 0 0 0 0 0 0 0 Women 0 6 0 1 2 0 12 0 0 21
Total 0 6 0 1 2 0 12 0 0 21 No13.1301Agricultural TeacherEducation
5 - Bachelor'sdegree 1
Men 0 1 0 0 2 0 16 0 0 19 Women 0 5 0 1 0 0 28 0 1 35
Total 0 6 0 1 2 0 44 0 1 54 No13.1301Agricultural TeacherEducation
7 - Master'sdegree 1
Men 0 0 0 0 1 0 5 0 0 6 Women 0 0 0 0 0 0 11 1 0 12
Total 0 0 0 0 1 0 16 1 0 18 Yes13.1301Agricultural TeacherEducation
17 - Doctor'sdegree -research /scholarship
1Men 0 0 0 0 0 0 1 0 0 1
Women 0 1 0 0 0 0 4 0 0 5 Total 0 1 0 0 0 0 5 0 0 6 No
13.1302Art Teacher Education
5 - Bachelor'sdegree 1
Men 0 0 0 0 0 0 0 0 0 0 Women 0 0 0 0 0 0 2 0 0 2
Total 0 0 0 0 0 0 2 0 0 2 No13.1302Art Teacher Education
7 - Master'sdegree 1
Men 0 0 0 0 0 0 3 0 0 3 Women 0 4 1 0 2 1 24 0 2 34
Total 0 4 1 0 2 1 27 0 2 37 Yes13.1305English/Language ArtsTeacher Education
7 - Master'sdegree 1
Men 0 0 0 0 0 0 2 0 0 2 Women 0 0 0 0 2 0 9 0 1 12
Total 0 0 0 0 2 0 11 0 1 14 No13.1311Mathematics TeacherEducation
7 - Master'sdegree 1
Men 0 0 0 0 0 0 1 0 1 2 Women 0 0 0 0 0 0 3 0 0 3
Total 0 0 0 0 0 0 4 0 1 5 No13.1312Music Teacher Education
5 - Bachelor'sdegree 1
Men 0 1 0 0 0 0 4 0 0 5 Women 0 1 0 0 0 0 7 0 0 8

CIPCODE AwardLevel Major Gender
NonResident
AlienHispanic/ Latino
AmericanIndian orAlaskaNative
AsianBlack orAfrican
American
NativeHawaiianor OtherPacific
Islander
WhiteTwoor
moreRaces
Race/ethnicityunknown
Totaldistance
educationprogram
Total 0 2 0 0 0 0 11 0 0 13 No13.1312Music Teacher Education
7 - Master'sdegree 1
Men 1 0 0 0 0 0 1 0 0 2 Women 0 0 0 0 0 0 0 0 0 0
Total 1 0 0 0 0 0 1 0 0 2 Yes13.1312Music Teacher Education
17 - Doctor'sdegree -research /scholarship
1Men 0 0 0 0 0 0 2 0 0 2
Women 0 0 0 0 0 0 2 0 0 2 Total 0 0 0 0 0 0 4 0 0 4 No
13.1315Reading Teacher Education
7 - Master'sdegree 1
Men 0 0 0 0 0 0 1 0 0 1 Women 0 2 0 0 0 0 2 0 0 4
Total 0 2 0 0 0 0 3 0 0 5 No13.1316Science TeacherEducation/General ScienceTeacher Education
7 - Master'sdegree 1
Men 0 0 0 0 0 0 2 0 0 2 Women 0 1 0 0 1 0 19 0 1 22
Total 0 1 0 0 1 0 21 0 1 24 No
13.1318Social Studies TeacherEducation
7 - Master'sdegree 1
Men 0 0 0 0 0 0 4 0 0 4 Women 0 0 0 0 0 0 9 0 0 9
Total 0 0 0 0 0 0 13 0 0 13 No14.0201Aerospace, Aeronautical andAstronautical/SpaceEngineering
5 - Bachelor'sdegree 1
Men 1 10 0 3 3 1 46 3 0 67 Women 0 1 0 0 0 0 5 0 0 6
Total 1 11 0 3 3 1 51 3 0 73 No
14.0201Aerospace, Aeronautical andAstronautical/SpaceEngineering
7 - Master'sdegree 1
Men 6 4 0 1 1 0 8 0 0 20 Women 1 0 0 1 0 0 1 0 0 3
Total 7 4 0 2 1 0 9 0 0 23 Yes
14.0201Aerospace, Aeronautical andAstronautical/SpaceEngineering
17 - Doctor'sdegree -research /scholarship
1Men 2 1 0 0 0 0 4 0 0 7
Women 1 1 0 1 0 0 1 0 0 4 Total 3 2 0 1 0 0 5 0 0 11 No
14.0301Agricultural Engineering
5 - Bachelor'sdegree 1
Men 0 1 0 0 0 0 11 1 0 13 Women 0 2 0 3 2 0 7 0 0 14
Total 0 3 0 3 2 0 18 1 0 27 No14.0301Agricultural Engineering
7 - Master'sdegree 1
Men 6 0 0 2 0 0 0 0 0 8 Women 6 0 0 0 0 0 1 0 0 7
Total 12 0 0 2 0 0 1 0 0 15 No14.0301Agricultural Engineering
17 - Doctor'sdegree -research /scholarship
1Men 7 0 0 0 0 0 3 0 1 11
Women 3 0 0 0 0 0 1 0 0 4 Total 10 0 0 0 0 0 4 0 1 15 No
14.0501Bioengineering andBiomedical Engineering
5 - Bachelor'sdegree 1
Men 0 0 0 4 0 0 5 0 2 11 Women 0 1 0 0 1 0 3 1 0 6
Total 0 1 0 4 1 0 8 1 2 17 No14.0501Bioengineering andBiomedical Engineering
7 - Master'sdegree 1
Men 6 1 0 1 1 0 11 1 1 22 Women 11 0 0 0 0 0 10 0 0 21
Total 17 1 0 1 1 0 21 1 1 43 No14.0501
1Men 4 0 0 2 0 0 7 0 0 13
Women 1 0 0 2 0 0 5 0 0 8

CIPCODE AwardLevel Major Gender
NonResident
AlienHispanic/ Latino
AmericanIndian orAlaskaNative
AsianBlack orAfrican
American
NativeHawaiianor OtherPacific
Islander
WhiteTwoor
moreRaces
Race/ethnicityunknown
Totaldistance
educationprogram
Bioengineering andBiomedical Engineering
17 - Doctor'sdegree -research /scholarship
Total 5 0 0 4 0 0 12 0 0 21 No
14.0701Chemical Engineering
5 - Bachelor'sdegree 1
Men 1 14 0 8 2 0 42 2 2 71 Women 0 5 0 2 2 0 18 1 0 28
Total 1 19 0 10 4 0 60 3 2 99 No14.0701Chemical Engineering
7 - Master'sdegree 1
Men 46 0 0 4 1 0 2 0 0 53 Women 31 1 0 0 0 0 0 0 0 32
Total 77 1 0 4 1 0 2 0 0 85 No14.0701Chemical Engineering
17 - Doctor'sdegree -research /scholarship
1Men 5 0 0 0 0 0 3 0 1 9
Women 1 0 0 0 0 0 0 0 0 1 Total 6 0 0 0 0 0 3 0 1 10 No
14.0801Civil Engineering, General
5 - Bachelor'sdegree 1
Men 2 20 0 5 2 0 46 1 5 81 Women 0 8 0 4 6 0 18 0 0 36
Total 2 28 0 9 8 0 64 1 5 117 No14.0801Civil Engineering, General
7 - Master'sdegree 1
Men 45 8 0 2 2 0 47 2 1 107 Women 10 1 0 1 1 0 6 0 2 21
Total 55 9 0 3 3 0 53 2 3 128 Yes14.0801Civil Engineering, General
17 - Doctor'sdegree -research /scholarship
1Men 5 0 0 0 0 0 6 0 0 11
Women 2 1 0 0 1 0 0 0 0 4 Total 7 1 0 0 1 0 6 0 0 15 No
14.0901Computer Engineering,General
5 - Bachelor'sdegree 1
Men 0 14 0 8 5 0 29 0 3 59 Women 0 3 0 1 2 0 1 0 1 8
Total 0 17 0 9 7 0 30 0 4 67 No14.0901Computer Engineering,General
7 - Master'sdegree 1
Men 152 4 0 2 2 0 7 0 2 169 Women 43 0 0 1 0 0 0 0 0 44
Total 195 4 0 3 2 0 7 0 2 213 Yes14.0901Computer Engineering,General
17 - Doctor'sdegree -research /scholarship
1Men 11 0 0 1 1 0 3 0 0 16
Women 2 0 0 0 0 0 0 0 0 2 Total 13 0 0 1 1 0 3 0 0 18 No
14.0901Computer Engineering,General
5 - Bachelor'sdegree 2
Men 0 0 0 0 0 0 0 0 0 0 Women 0 0 0 0 0 0 0 0 0 0
Total 0 0 0 0 0 0 0 0 0 0 No14.1001Electrical and ElectronicsEngineerin
5 - Bachelor'sdegree 1
Men 2 25 0 10 4 1 41 3 2 88 Women 0 4 0 2 4 0 12 0 0 22
Total 2 29 0 12 8 1 53 3 2 110 No14.1001Electrical and ElectronicsEngineerin
7 - Master'sdegree 1
Men 118 5 0 5 3 0 32 3 5 171 Women 44 0 0 1 0 0 3 0 0 48
Total 162 5 0 6 3 0 35 3 5 219 Yes14.1001Electrical and ElectronicsEngineerin
17 - Doctor'sdegree -research /scholarship
1Men 21 3 0 1 1 0 8 0 0 34
Women 6 0 0 2 0 0 0 0 0 8 Total 27 3 0 3 1 0 8 0 0 42 No
14.1401 1 Men 0 5 0 3 0 1 9 0 1 19

CIPCODE AwardLevel Major Gender
NonResident
AlienHispanic/ Latino
AmericanIndian orAlaskaNative
AsianBlack orAfrican
American
NativeHawaiianor OtherPacific
Islander
WhiteTwoor
moreRaces
Race/ethnicityunknown
Totaldistance
educationprogram
Environmental/EnvironmentalHealth Engineering
5 - Bachelor'sdegree
Women 1 4 0 1 0 0 14 2 0 22 Total 1 9 0 4 0 1 23 2 1 41 No
14.1401Environmental/EnvironmentalHealth Engineering
7 - Master'sdegree 1
Men 1 3 0 0 0 0 20 0 1 25 Women 0 1 0 0 0 0 12 1 4 18
Total 1 4 0 0 0 0 32 1 5 43 Yes14.1401Environmental/EnvironmentalHealth Engineering
17 - Doctor'sdegree -research /scholarship
1Men 3 2 0 0 0 0 4 0 0 9
Women 4 2 0 0 1 0 4 0 0 11 Total 7 4 0 0 1 0 8 0 0 20 No
14.1801Materials Engineering
5 - Bachelor'sdegree 1
Men 0 4 0 3 0 0 16 1 2 26 Women 0 4 0 0 1 0 10 2 1 18
Total 0 8 0 3 1 0 26 3 3 44 No14.1801Materials Engineering
7 - Master'sdegree 1
Men 46 3 0 4 0 0 14 1 0 68 Women 13 1 0 0 1 0 5 0 0 20
Total 59 4 0 4 1 0 19 1 0 88 Yes14.1801Materials Engineering
17 - Doctor'sdegree -research /scholarship
1Men 8 3 0 1 0 0 8 1 0 21
Women 0 0 0 1 1 0 1 0 0 3 Total 8 3 0 2 1 0 9 1 0 24 No
14.1901Mechanical Engineering
5 - Bachelor'sdegree 1
Men 3 46 0 13 10 1 145 5 8 231 Women 0 8 0 4 0 0 24 4 0 40
Total 3 54 0 17 10 1 169 9 8 271 No14.1901Mechanical Engineering
7 - Master'sdegree 1
Men 101 4 1 5 1 0 28 0 4 144 Women 13 1 0 0 0 0 5 0 0 19
Total 114 5 1 5 1 0 33 0 4 163 Yes14.1901Mechanical Engineering
17 - Doctor'sdegree -research /scholarship
1Men 13 1 0 0 0 0 10 0 0 24
Women 1 0 0 0 0 0 1 0 0 2 Total 14 1 0 0 0 0 11 0 0 26 No
14.2301Nuclear Engineering
5 - Bachelor'sdegree 1
Men 1 2 0 2 0 0 13 0 1 19 Women 0 1 0 0 2 0 2 0 0 5
Total 1 3 0 2 2 0 15 0 1 24 No14.2301Nuclear Engineering
7 - Master'sdegree 1
Men 1 0 0 0 0 0 3 1 0 5 Women 0 0 0 0 0 0 1 0 0 1
Total 1 0 0 0 0 0 4 1 0 6 No14.2301Nuclear Engineering
17 - Doctor'sdegree -research /scholarship
1Men 1 0 0 0 0 0 0 0 0 1
Women 0 0 0 0 0 0 0 0 0 0 Total 1 0 0 0 0 0 0 0 0 1 No
14.2401Ocean Engineering
7 - Master'sdegree 1
Men 11 0 0 0 0 0 2 0 0 13 Women 3 0 0 0 0 0 1 0 0 4
Total 14 0 0 0 0 0 3 0 0 17 No14.2401Ocean Engineering
17 - Doctor'sdegree -research /scholarship
1Men 1 0 0 0 0 0 1 0 0 2
Women 0 0 0 0 0 0 0 0 0 0 Total 1 0 0 0 0 0 1 0 0 2 No
14.2701Systems Engineering
5 - Bachelor'sdegree 1 Men 3 18 0 5 4 0 44 3 0 77

CIPCODE AwardLevel Major Gender
NonResident
AlienHispanic/ Latino
AmericanIndian orAlaskaNative
AsianBlack orAfrican
American
NativeHawaiianor OtherPacific
Islander
WhiteTwoor
moreRaces
Race/ethnicityunknown
Totaldistance
educationprogram
Women 0 19 0 1 2 0 19 1 1 43 Total 3 37 0 6 6 0 63 4 1 120 No
14.2701Systems Engineering
7 - Master'sdegree 1
Men 30 15 0 3 4 1 47 2 1 103 Women 12 2 0 4 2 0 12 0 1 33
Total 42 17 0 7 6 1 59 2 2 136 Yes14.2701Systems Engineering
8 - Post-Master'scertificates
1Men 1 0 0 0 0 0 0 0 0 1
Women 0 0 0 0 0 0 0 0 0 0 Total 1 0 0 0 0 0 0 0 0 1 No
14.2701Systems Engineering
17 - Doctor'sdegree -research /scholarship
1Men 7 0 0 1 0 0 1 0 0 9
Women 5 0 0 0 0 0 0 0 0 5 Total 12 0 0 1 0 0 1 0 0 14 No
14.4501Biological/BiosystemsEngineering
5 - Bachelor'sdegree 1
Men 0 0 0 1 1 0 17 0 1 20 Women 0 0 0 0 1 0 5 0 0 6
Total 0 0 0 1 2 0 22 0 1 26 No15.1001Construction EngineeringTechnology/Technician
5 - Bachelor'sdegree 1
Men 0 4 0 1 2 0 34 0 2 43 Women 2 3 0 0 0 0 3 0 1 9
Total 2 7 0 1 2 0 37 0 3 52 No15.1001Construction EngineeringTechnology/Technician
7 - Master'sdegree 1
Men 7 4 0 1 0 0 10 0 2 24 Women 6 0 0 2 1 0 4 0 0 13
Total 13 4 0 3 1 0 14 0 2 37 No15.1102SurveyingTechnology/Surveying
5 - Bachelor'sdegree 1
Men 0 1 0 0 0 0 11 0 0 12 Women 0 0 0 0 0 0 0 0 0 0
Total 0 1 0 0 0 0 11 0 0 12 No15.9999Engineering Technologiesand Engineering-RelatedFields, Other
7 - Master'sdegree 1
Men 0 0 0 0 0 0 1 0 0 1 Women 0 0 0 0 0 0 1 0 0 1
Total 0 0 0 0 0 0 2 0 0 2 No
16.0102Linguistics
5 - Bachelor'sdegree 1
Men 0 6 1 2 0 0 12 0 0 21 Women 0 4 1 4 4 1 32 4 1 51
Total 0 10 2 6 4 1 44 4 1 72 No16.0102Linguistics
7 - Master'sdegree 1
Men 0 0 0 0 0 0 2 0 0 2 Women 4 0 0 0 0 0 2 0 0 6
Total 4 0 0 0 0 0 4 0 0 8 No16.0102Linguistics
17 - Doctor'sdegree -research /scholarship
1Men 4 0 0 0 0 0 1 0 0 5
Women 3 0 0 0 0 0 0 0 0 3 Total 7 0 0 0 0 0 1 0 0 8 No
16.0102Linguistics
5 - Bachelor'sdegree 2
Men 0 1 0 0 0 0 3 0 0 4 Women 0 2 0 0 0 0 3 0 0 5
Total 0 3 0 0 0 0 6 0 0 9 No16.0399East Asian Languages,Literatures, and Linguistics,Other
5 - Bachelor'sdegree 1
Men 0 0 0 1 0 0 2 0 0 3 Women 0 3 0 9 2 1 5 3 1 24
Total 0 3 0 10 2 1 7 3 1 27 No
16.0399 5 - Bachelor'sdegree 2
Men 0 2 0 0 0 0 2 0 0 4 Women 0 0 0 0 0 0 5 0 0 5

CIPCODE AwardLevel Major Gender
NonResident
AlienHispanic/ Latino
AmericanIndian orAlaskaNative
AsianBlack orAfrican
American
NativeHawaiianor OtherPacific
Islander
WhiteTwoor
moreRaces
Race/ethnicityunknown
Totaldistance
educationprogram
East Asian Languages,Literatures, and Linguistics,Other
Total 0 2 0 0 0 0 7 0 0 9 No
16.0402Russian Language andLiterature
5 - Bachelor'sdegree 1
Men 0 1 0 0 0 0 2 0 0 3 Women 0 0 0 0 0 0 8 1 0 9
Total 0 1 0 0 0 0 10 1 0 12 No16.0402Russian Language andLiterature
5 - Bachelor'sdegree 2
Men 0 0 0 0 0 0 1 0 0 1 Women 0 0 0 0 0 0 1 0 0 1
Total 0 0 0 0 0 0 2 0 0 2 No16.0501German Language andLiterature
5 - Bachelor'sdegree 1
Men 0 0 0 0 0 0 1 0 0 1 Women 0 1 0 0 0 0 2 0 0 3
Total 0 1 0 0 0 0 3 0 0 4 No16.0501German Language andLiterature
7 - Master'sdegree 1
Men 0 0 0 0 0 0 2 0 0 2 Women 0 0 0 0 0 0 1 0 0 1
Total 0 0 0 0 0 0 3 0 0 3 No16.0501German Language andLiterature
17 - Doctor'sdegree -research /scholarship
1Men 0 0 0 0 0 0 0 0 0 0
Women 0 0 0 0 0 0 0 0 0 0 Total 0 0 0 0 0 0 0 0 0 0 No
16.0501German Language andLiterature
5 - Bachelor'sdegree 2
Men 0 0 0 0 0 0 0 0 0 0 Women 0 0 0 0 0 0 1 0 0 1
Total 0 0 0 0 0 0 1 0 0 1 No16.0901French Language andLiterature
5 - Bachelor'sdegree 1
Men 0 2 0 0 0 0 0 0 1 3 Women 0 5 0 0 1 0 6 0 0 12
Total 0 7 0 0 1 0 6 0 1 15 No16.0901French Language andLiterature
7 - Master'sdegree 1
Men 0 0 0 0 0 0 1 0 0 1 Women 0 0 0 0 0 0 1 0 0 1
Total 0 0 0 0 0 0 2 0 0 2 No16.0901French Language andLiterature
5 - Bachelor'sdegree 2
Men 0 0 0 0 0 0 0 0 0 0 Women 0 0 0 0 0 0 0 0 0 0
Total 0 0 0 0 0 0 0 0 0 0 No16.0904Portuguese Language andLiterature
5 - Bachelor'sdegree 1
Men 0 1 0 0 0 0 2 0 0 3 Women 0 1 0 0 0 0 1 1 0 3
Total 0 2 0 0 0 0 3 1 0 6 No16.0904Portuguese Language andLiterature
5 - Bachelor'sdegree 2
Men 0 0 0 0 0 0 0 0 0 0 Women 0 0 0 0 1 0 0 0 0 1
Total 0 0 0 0 1 0 0 0 0 1 No16.0905Spanish Language andLiterature
5 - Bachelor'sdegree 1
Men 0 1 0 1 0 0 6 1 0 9 Women 0 11 0 2 4 0 22 0 0 39
Total 0 12 0 3 4 0 28 1 0 48 No16.0905Spanish Language andLiterature
7 - Master'sdegree 1
Men 0 0 0 0 0 0 1 0 0 1 Women 1 0 0 0 0 0 1 0 0 2
Total 1 0 0 0 0 0 2 0 0 3 No16.0905Spanish Language andLiterature
5 - Bachelor'sdegree 2
Men 0 1 0 0 0 0 2 0 0 3 Women 0 1 0 0 0 0 3 0 0 4
Total 0 2 0 0 0 0 5 0 0 7 No

CIPCODE AwardLevel Major Gender
NonResident
AlienHispanic/ Latino
AmericanIndian orAlaskaNative
AsianBlack orAfrican
American
NativeHawaiianor OtherPacific
Islander
WhiteTwoor
moreRaces
Race/ethnicityunknown
Totaldistance
educationprogram
16.0999Romance Languages,Literatures, and Linguistics,Other
17 - Doctor'sdegree -research /scholarship
1 Men 0 0 0 0 0 0 0 0 0 0 Women 2 2 0 0 0 0 3 0 0 7
Total 2 2 0 0 0 0 3 0 0 7 No
16.1200Classics and ClassicalLanguages, Literatures, andLinguistics, General
5 - Bachelor'sdegree 1
Men 0 3 0 0 0 0 12 1 0 16 Women 0 2 0 0 1 0 15 0 0 18
Total 0 5 0 0 1 0 27 1 0 34 No
16.1200Classics and ClassicalLanguages, Literatures, andLinguistics, General
7 - Master'sdegree 1
Men 0 0 0 0 0 0 1 0 0 1 Women 0 0 0 0 0 0 0 0 0 0
Total 0 0 0 0 0 0 1 0 0 1 No
16.1200Classics and ClassicalLanguages, Literatures, andLinguistics, General
17 - Doctor'sdegree -research /scholarship
1Men 0 0 0 0 0 0 4 0 0 4
Women 0 0 0 0 0 0 0 0 0 0 Total 0 0 0 0 0 0 4 0 0 4 Yes
16.1200Classics and ClassicalLanguages, Literatures, andLinguistics, General
5 - Bachelor'sdegree 2
Men 0 1 0 0 0 0 1 0 0 2 Women 0 0 0 0 0 0 3 0 0 3
Total 0 1 0 0 0 0 4 0 0 5 Yes
16.1203Latin Language andLiterature
7 - Master'sdegree 1
Men 0 0 0 0 0 0 0 0 0 0 Women 0 0 0 0 0 0 1 0 0 1
Total 0 0 0 0 0 0 1 0 0 1 Yes19.0707Family and CommunityServices
5 - Bachelor'sdegree 1
Men 0 5 2 1 12 1 16 3 2 42 Women 0 21 0 2 37 1 86 2 2 151
Total 0 26 2 3 49 2 102 5 4 193 No19.0707Family and CommunityServices
7 - Master'sdegree 1
Men 1 0 0 0 1 0 1 0 0 3 Women 0 1 1 1 1 0 3 1 0 8
Total 1 1 1 1 2 0 4 1 0 11 Yes22.0101Law
18 - Doctor'sdegree -professionalpractice
1Men 0 24 2 4 7 0 123 5 12 177
Women 0 15 3 6 5 0 88 2 8 127 Total 0 39 5 10 12 0 211 7 20 304 No
22.0206Comparative Law
7 - Master'sdegree 1
Men 0 0 0 1 0 0 0 0 0 1 Women 4 0 0 0 1 0 1 0 0 6
Total 4 0 0 1 1 0 1 0 0 7 No22.0207Energy, Environment, andNatural Resources Law
7 - Master'sdegree 1
Men 0 0 0 0 0 0 1 0 0 1 Women 0 0 0 0 0 0 3 0 0 3
Total 0 0 0 0 0 0 4 0 0 4 No22.0210International Business,Trade, and Tax Law
7 - Master'sdegree 1
Men 12 0 0 0 0 0 1 0 0 13 Women 3 0 0 1 0 0 0 0 0 4
Total 15 0 0 1 0 0 1 0 0 17 No22.0211Tax Law/Taxation
7 - Master'sdegree 1
Men 0 2 0 5 1 0 32 0 9 49 Women 0 3 0 3 2 0 15 0 3 26
Total 0 5 0 8 3 0 47 0 12 75 No22.0211Tax Law/Taxation 1
Men 0 0 0 0 0 0 1 0 0 1 Women 1 0 0 0 0 0 0 0 0 1
Total 1 0 0 0 0 0 1 0 0 2 No

CIPCODE AwardLevel Major Gender
NonResident
AlienHispanic/ Latino
AmericanIndian orAlaskaNative
AsianBlack orAfrican
American
NativeHawaiianor OtherPacific
Islander
WhiteTwoor
moreRaces
Race/ethnicityunknown
Totaldistance
educationprogram
17 - Doctor'sdegree -research /scholarship
23.0101English Language andLiterature, General
5 - Bachelor'sdegree 1
Men 0 6 1 2 0 0 47 1 4 61 Women 0 32 1 11 10 2 93 8 4 161
Total 0 38 2 13 10 2 140 9 8 222 No23.0101English Language andLiterature, General
7 - Master'sdegree 1
Men 0 1 0 0 0 0 0 0 1 2 Women 1 0 0 0 1 0 3 0 0 5
Total 1 1 0 0 1 0 3 0 1 7 No23.0101English Language andLiterature, General
17 - Doctor'sdegree -research /scholarship
1Men 0 0 0 0 0 0 4 0 1 5
Women 2 0 0 0 0 0 3 0 1 6 Total 2 0 0 0 0 0 7 0 2 11 No
23.0101English Language andLiterature, General
5 - Bachelor'sdegree 2
Men 0 1 0 0 0 0 2 0 0 3 Women 0 4 0 0 4 0 4 0 1 13
Total 0 5 0 0 4 0 6 0 1 16 No23.1302Creative Writing
7 - Master'sdegree 1
Men 0 0 0 0 0 0 4 0 0 4 Women 0 0 0 0 0 0 3 0 0 3
Total 0 0 0 0 0 0 7 0 0 7 No24.0101Liberal Arts andSciences/Liberal Studies
3 - Associate'sdegree 1
Men 1 27 0 12 21 1 76 6 3 147 Women 1 62 0 17 66 3 130 14 6 299
Total 2 89 0 29 87 4 206 20 9 446 No26.0101Biology/Biological Sciences,General
5 - Bachelor'sdegree 1
Men 2 46 0 33 11 11 117 5 3 228 Women 0 57 1 31 15 8 128 9 6 255
Total 2 103 1 64 26 19 245 14 9 483 Yes26.0101Biology/Biological Sciences,General
5 - Bachelor'sdegree 2
Men 0 0 0 0 0 0 1 0 0 1 Women 0 2 0 2 0 0 4 0 0 8
Total 0 2 0 2 0 0 5 0 0 9 No26.0210Biochemistry and MolecularBiology
7 - Master'sdegree 1
Men 0 0 0 0 0 0 0 0 0 0 Women 0 0 0 0 0 0 0 0 0 0
Total 0 0 0 0 0 0 0 0 0 0 No26.0301Botany/Plant Biology
5 - Bachelor'sdegree 1
Men 0 1 0 0 0 0 4 0 0 5 Women 0 1 0 0 0 0 4 1 0 6
Total 0 2 0 0 0 0 8 1 0 11 No26.0301Botany/Plant Biology
7 - Master'sdegree 1
Men 1 0 0 0 0 0 1 0 0 2 Women 0 0 0 0 0 0 2 0 0 2
Total 1 0 0 0 0 0 3 0 0 4 No26.0301Botany/Plant Biology
17 - Doctor'sdegree -research /scholarship
1Men 2 0 0 0 0 0 1 0 0 3
Women 0 0 0 0 0 0 2 0 0 2 Total 2 0 0 0 0 0 3 0 0 5 No
26.0301Botany/Plant Biology
5 - Bachelor'sdegree 2
Men 0 0 0 0 0 0 0 0 0 0 Women 0 0 0 0 0 0 1 0 0 1
Total 0 0 0 0 0 0 1 0 0 1 No26.0305 7 - Master's
degree 1Men 1 0 0 0 0 0 0 0 0 1
Women 1 0 0 0 0 0 0 0 0 1

CIPCODE AwardLevel Major Gender
NonResident
AlienHispanic/ Latino
AmericanIndian orAlaskaNative
AsianBlack orAfrican
American
NativeHawaiianor OtherPacific
Islander
WhiteTwoor
moreRaces
Race/ethnicityunknown
Totaldistance
educationprogram
PlantPathology/Phytopathology
Total 2 0 0 0 0 0 0 0 0 2 No
26.0305PlantPathology/Phytopathology
17 - Doctor'sdegree -research /scholarship
1Men 4 0 0 0 0 0 1 0 0 5
Women 2 0 0 0 0 0 1 0 0 3 Total 6 0 0 0 0 0 2 0 0 8 No
26.0308Plant Molecular Biology
7 - Master'sdegree 1
Men 0 0 0 0 0 0 0 0 0 0 Women 0 0 0 0 0 0 0 0 0 0
Total 0 0 0 0 0 0 0 0 0 0 No26.0308Plant Molecular Biology
17 - Doctor'sdegree -research /scholarship
1Men 3 0 0 0 0 0 1 0 0 4
Women 1 0 0 0 0 0 1 0 0 2 Total 4 0 0 0 0 0 2 0 0 6 No
26.0406Cell/Cellular and MolecularBiology
7 - Master'sdegree 1
Men 0 0 0 0 0 0 0 0 0 0 Women 0 0 0 0 0 0 1 0 0 1
Total 0 0 0 0 0 0 1 0 0 1 No26.0406Cell/Cellular and MolecularBiology
17 - Doctor'sdegree -research /scholarship
1Men 0 0 0 0 0 0 1 0 0 1
Women 0 1 0 0 0 0 0 0 0 1 Total 0 1 0 0 0 0 1 0 0 2 No
26.0503Medical Microbiology andBacteriology
5 - Bachelor'sdegree 1
Men 0 10 0 8 3 1 41 3 4 70 Women 0 18 0 18 8 5 26 3 3 81
Total 0 28 0 26 11 6 67 6 7 151 Yes26.0503Medical Microbiology andBacteriology
7 - Master'sdegree 1
Men 0 0 0 0 0 0 3 0 0 3 Women 0 0 0 0 1 0 0 0 0 1
Total 0 0 0 0 1 0 3 0 0 4 No26.0503Medical Microbiology andBacteriology
17 - Doctor'sdegree -research /scholarship
1Men 0 1 0 1 0 0 1 0 0 3
Women 1 0 0 0 1 0 1 0 0 3 Total 1 1 0 1 1 0 2 0 0 6 No
26.0503Medical Microbiology andBacteriology
5 - Bachelor'sdegree 2
Men 0 0 0 0 0 0 0 0 0 0 Women 0 0 0 1 0 0 1 0 0 2
Total 0 0 0 1 0 0 1 0 0 2 No26.0701Zoology/Animal Biology
5 - Bachelor'sdegree 1
Men 0 0 0 0 0 0 6 0 0 6 Women 0 8 0 1 1 2 18 0 1 31
Total 0 8 0 1 1 2 24 0 1 37 No26.0701Zoology/Animal Biology
7 - Master'sdegree 1
Men 0 0 0 0 0 0 3 0 0 3 Women 0 0 1 0 0 0 0 0 0 1
Total 0 0 1 0 0 0 3 0 0 4 No26.0701Zoology/Animal Biology
17 - Doctor'sdegree -research /scholarship
1Men 0 2 0 0 0 0 2 0 1 5
Women 2 0 0 0 0 0 3 0 0 5 Total 2 2 0 0 0 0 5 0 1 10 No
26.0701Zoology/Animal Biology
5 - Bachelor'sdegree 2
Men 0 0 0 0 0 0 0 0 0 0 Women 0 0 0 0 0 0 2 0 0 2
Total 0 0 0 0 0 0 2 0 0 2 No26.0702Entomology
5 - Bachelor'sdegree 1
Men 0 0 0 0 0 0 4 0 0 4 Women 0 4 0 0 0 0 1 0 1 6

CIPCODE AwardLevel Major Gender
NonResident
AlienHispanic/ Latino
AmericanIndian orAlaskaNative
AsianBlack orAfrican
American
NativeHawaiianor OtherPacific
Islander
WhiteTwoor
moreRaces
Race/ethnicityunknown
Totaldistance
educationprogram
Total 0 4 0 0 0 0 5 0 1 10 No26.0702Entomology
7 - Master'sdegree 1
Men 2 1 0 2 0 0 9 0 0 14 Women 5 1 0 0 0 1 10 0 0 17
Total 7 2 0 2 0 1 19 0 0 31 Yes26.0702Entomology
17 - Doctor'sdegree -research /scholarship
1Men 1 0 0 1 0 0 4 0 0 6
Women 2 0 0 0 0 0 2 0 0 4 Total 3 0 0 1 0 0 6 0 0 10 No
26.0801Genetics, General
17 - Doctor'sdegree -research /scholarship
1Men 3 0 0 0 0 0 2 0 0 5
Women 3 1 0 0 0 0 0 0 0 4 Total 6 1 0 0 0 0 2 0 0 9 No
26.0908Exercise Physiology
5 - Bachelor'sdegree 1
Men 0 7 2 4 10 0 38 1 4 66 Women 0 14 1 6 4 1 82 3 2 113
Total 0 21 3 10 14 1 120 4 6 179 No26.0908Exercise Physiology
7 - Master'sdegree 1
Men 1 1 0 0 0 0 4 0 0 6 Women 3 1 0 0 0 0 11 0 0 15
Total 4 2 0 0 0 0 15 0 0 21 No26.0908Exercise Physiology
17 - Doctor'sdegree -research /scholarship
1Men 2 2 0 1 0 0 3 0 0 8
Women 4 0 0 0 0 0 4 0 0 8 Total 6 2 0 1 0 0 7 0 0 16 No
26.1102Biostatistics
7 - Master'sdegree 1
Men 1 0 0 0 0 0 1 0 0 2 Women 3 0 0 1 0 0 0 0 0 4
Total 4 0 0 1 0 0 1 0 0 6 No26.1102Biostatistics
17 - Doctor'sdegree -research /scholarship
1Men 0 0 0 0 0 0 0 0 0 0
Women 0 0 0 0 0 0 0 0 0 0 Total 0 0 0 0 0 0 0 0 0 0 No
26.1301Ecology
7 - Master'sdegree 1
Men 0 0 0 0 0 0 1 0 0 1 Women 0 1 0 0 0 0 5 0 0 6
Total 0 1 0 0 0 0 6 0 0 7 No26.1301Ecology
17 - Doctor'sdegree -research /scholarship
1Men 2 0 0 0 0 0 5 0 0 7
Women 1 1 1 0 0 0 4 0 1 8 Total 3 1 1 0 0 0 9 0 1 15 No
26.1309Epidemiology
17 - Doctor'sdegree -research /scholarship
1Men 0 0 0 0 0 0 1 0 1 2
Women 0 0 0 0 0 0 0 0 0 0 Total 0 0 0 0 0 0 1 0 1 2 No
26.9999Biological and BiomedicalSciences, Other
7 - Master'sdegree 1
Men 0 0 0 0 1 0 5 0 0 6 Women 0 1 0 1 2 0 4 0 0 8
Total 0 1 0 1 3 0 9 0 0 14 Yes26.9999Biological and BiomedicalSciences, Other
17 - Doctor'sdegree -research /scholarship
1Men 8 0 0 1 1 0 8 0 0 18
Women 2 2 0 0 0 0 12 1 0 17 Total 10 2 0 1 1 0 20 1 0 35 No
27.0101 1 Men 0 7 0 5 1 0 33 5 4 55

CIPCODE AwardLevel Major Gender
NonResident
AlienHispanic/ Latino
AmericanIndian orAlaskaNative
AsianBlack orAfrican
American
NativeHawaiianor OtherPacific
Islander
WhiteTwoor
moreRaces
Race/ethnicityunknown
Totaldistance
educationprogram
Mathematics, General 5 - Bachelor'sdegree
Women 0 5 0 2 0 1 13 1 0 22 Total 0 12 0 7 1 1 46 6 4 77 No
27.0101Mathematics, General
7 - Master'sdegree 1
Men 3 0 0 0 0 0 8 0 0 11 Women 2 0 0 2 1 0 3 0 0 8
Total 5 0 0 2 1 0 11 0 0 19 No27.0101Mathematics, General
17 - Doctor'sdegree -research /scholarship
1Men 2 0 0 1 0 0 6 0 1 10
Women 6 1 0 1 0 0 2 0 0 10 Total 8 1 0 2 0 0 8 0 1 20 No
27.0101Mathematics, General
5 - Bachelor'sdegree 2
Men 0 0 0 1 0 0 5 0 0 6 Women 0 0 0 0 0 0 1 0 0 1
Total 0 0 0 1 0 0 6 0 0 7 No27.0501Statistics, General
5 - Bachelor'sdegree 1
Men 0 5 0 3 0 0 16 0 2 26 Women 0 1 0 2 1 0 7 0 1 12
Total 0 6 0 5 1 0 23 0 3 38 No27.0501Statistics, General
7 - Master'sdegree 1
Men 5 0 0 1 0 0 0 0 2 8 Women 7 0 0 0 0 0 2 0 0 9
Total 12 0 0 1 0 0 2 0 2 17 No27.0501Statistics, General
17 - Doctor'sdegree -research /scholarship
1Men 4 0 0 0 0 0 1 0 0 5
Women 1 0 0 0 0 0 0 0 0 1 Total 5 0 0 0 0 0 1 0 0 6 No
27.0501Statistics, General
5 - Bachelor'sdegree 2
Men 0 0 0 1 0 0 0 0 0 1 Women 0 0 0 0 1 0 1 0 0 2
Total 0 0 0 1 1 0 1 0 0 3 No30.1201Historic Preservation andConservation
7 - Master'sdegree 1
Men 0 0 0 0 0 0 1 0 1 2 Women 0 0 0 0 0 0 3 0 0 3
Total 0 0 0 0 0 0 4 0 1 5 No30.1401Museology/Museum Studies
7 - Master'sdegree 1
Men 0 0 0 0 0 0 0 0 0 0 Women 0 0 0 0 0 0 2 0 0 2
Total 0 0 0 0 0 0 2 0 0 2 No30.1901Nutrition Sciences
17 - Doctor'sdegree -research /scholarship
1Men 0 0 0 0 0 0 1 0 0 1
Women 1 0 0 0 0 0 1 0 0 2 Total 1 0 0 0 0 0 2 0 0 3 No
30.2001International/Global Studies
5 - Bachelor'sdegree 1
Men 1 2 0 0 0 0 5 0 0 8 Women 1 7 0 0 1 0 13 4 1 27
Total 2 9 0 0 1 0 18 4 1 35 No30.2001International/Global Studies
5 - Bachelor'sdegree 2
Men 0 0 0 0 0 0 0 0 0 0 Women 0 1 0 1 0 0 4 0 0 6
Total 0 1 0 1 0 0 4 0 0 6 No30.3301Sustainability Studies
5 - Bachelor'sdegree 1
Men 0 1 1 1 1 1 11 0 0 16 Women 0 4 0 0 0 0 18 0 1 23
Total 0 5 1 1 1 1 29 0 1 39 No30.3301Sustainability Studies
5 - Bachelor'sdegree 2
Men 0 0 0 0 0 0 0 0 0 0 Women 0 0 0 0 0 0 1 0 0 1
Total 0 0 0 0 0 0 1 0 0 1 No

CIPCODE AwardLevel Major Gender
NonResident
AlienHispanic/ Latino
AmericanIndian orAlaskaNative
AsianBlack orAfrican
American
NativeHawaiianor OtherPacific
Islander
WhiteTwoor
moreRaces
Race/ethnicityunknown
Totaldistance
educationprogram
30.9999Multi-/InterdisciplinaryStudies, Other
5 - Bachelor'sdegree
1 Men 0 1 0 5 0 0 18 0 0 24 Women 0 2 0 0 2 1 23 3 2 33
Total 0 3 0 5 2 1 41 3 2 57 Yes30.9999Multi-/InterdisciplinaryStudies, Other
7 - Master'sdegree 1
Men 0 2 0 0 0 0 1 0 2 5 Women 1 0 0 0 0 0 2 0 2 5
Total 1 2 0 0 0 0 3 0 4 10 No30.9999Multi-/InterdisciplinaryStudies, Other
5 - Bachelor'sdegree 2
Men 0 1 0 0 0 0 0 0 0 1 Women 0 0 0 0 0 0 0 0 0 0
Total 0 1 0 0 0 0 0 0 0 1 No31.0301Parks, Recreation andLeisure FacilitiesManagement, General
5 - Bachelor'sdegree 1
Men 1 2 0 0 5 0 8 0 0 16 Women 1 12 1 5 9 1 55 2 6 92
Total 2 14 1 5 14 1 63 2 6 108 No
31.0301Parks, Recreation andLeisure FacilitiesManagement, General
7 - Master'sdegree 1
Men 0 0 0 0 0 0 1 0 0 1 Women 4 0 0 0 0 0 3 0 0 7
Total 4 0 0 0 0 0 4 0 0 8 No
31.0504Sport and FitnessAdministration/Management
5 - Bachelor'sdegree 1
Men 1 8 1 2 10 0 64 0 1 87 Women 1 5 0 1 3 0 27 2 1 40
Total 2 13 1 3 13 0 91 2 2 127 Yes31.0504Sport and FitnessAdministration/Management
7 - Master'sdegree 1
Men 0 3 0 0 2 0 11 0 0 16 Women 1 0 0 0 0 0 8 0 0 9
Total 1 3 0 0 2 0 19 0 0 25 Yes38.0101Philosophy
5 - Bachelor'sdegree 1
Men 0 4 0 3 3 0 16 0 0 26 Women 0 4 0 1 1 0 4 1 0 11
Total 0 8 0 4 4 0 20 1 0 37 No38.0101Philosophy
7 - Master'sdegree 1
Men 1 0 0 0 0 0 1 0 1 3 Women 0 0 0 0 0 0 1 0 0 1
Total 1 0 0 0 0 0 2 0 1 4 No38.0101Philosophy
17 - Doctor'sdegree -research /scholarship
1Men 0 0 0 0 0 0 0 0 0 0
Women 0 0 0 0 0 0 0 0 0 0 Total 0 0 0 0 0 0 0 0 0 0 No
38.0101Philosophy
5 - Bachelor'sdegree 2
Men 0 0 0 0 0 0 1 0 0 1 Women 0 0 0 0 0 0 0 0 0 0
Total 0 0 0 0 0 0 1 0 0 1 No38.0201Religion/Religious Studies
5 - Bachelor'sdegree 1
Men 0 0 0 0 2 0 2 1 2 7 Women 0 1 0 1 1 0 7 0 0 10
Total 0 1 0 1 3 0 9 1 2 17 No38.0201Religion/Religious Studies
7 - Master'sdegree 1
Men 0 0 0 0 0 0 1 0 0 1 Women 0 2 0 0 0 0 0 0 0 2
Total 0 2 0 0 0 0 1 0 0 3 No38.0201Religion/Religious Studies
17 - Doctor'sdegree -research /scholarship
1Men 0 0 0 0 0 0 0 0 0 0
Women 0 0 0 0 0 0 1 0 1 2 Total 0 0 0 0 0 0 1 0 1 2 No
38.0201 2 Men 0 0 0 0 0 0 0 0 0 0

CIPCODE AwardLevel Major Gender
NonResident
AlienHispanic/ Latino
AmericanIndian orAlaskaNative
AsianBlack orAfrican
American
NativeHawaiianor OtherPacific
Islander
WhiteTwoor
moreRaces
Race/ethnicityunknown
Totaldistance
educationprogram
Religion/Religious Studies 5 - Bachelor'sdegree
Women 0 1 0 0 0 0 1 0 0 2 Total 0 1 0 0 0 0 1 0 0 2 No
38.0206Jewish/Judaic Studies
5 - Bachelor'sdegree 1
Men 0 0 0 0 0 0 0 0 0 0 Women 0 0 0 0 0 0 1 0 0 1
Total 0 0 0 0 0 0 1 0 0 1 No38.0206Jewish/Judaic Studies
5 - Bachelor'sdegree 2
Men 0 0 0 0 0 0 0 0 0 0 Women 0 0 0 0 0 0 0 0 0 0
Total 0 0 0 0 0 0 0 0 0 0 No40.0201Astronomy
5 - Bachelor'sdegree 1
Men 0 1 0 1 0 0 0 0 0 2 Women 0 0 0 0 0 0 0 0 0 0
Total 0 1 0 1 0 0 0 0 0 2 No40.0201Astronomy
7 - Master'sdegree 1
Men 4 1 0 0 0 0 0 0 0 5 Women 3 0 0 0 0 0 2 0 1 6
Total 7 1 0 0 0 0 2 0 1 11 No40.0201Astronomy
17 - Doctor'sdegree -research /scholarship
1Men 2 1 0 0 0 0 1 0 0 4
Women 0 0 0 0 0 0 0 0 0 0 Total 2 1 0 0 0 0 1 0 0 4 No
40.0201Astronomy
5 - Bachelor'sdegree 2
Men 0 0 0 0 0 0 0 0 0 0 Women 0 0 0 0 0 0 0 0 0 0
Total 0 0 0 0 0 0 0 0 0 0 No40.0501Chemistry, General
5 - Bachelor'sdegree 1
Men 0 14 0 10 2 0 37 0 3 66 Women 0 8 0 12 3 1 24 1 2 51
Total 0 22 0 22 5 1 61 1 5 117 No40.0501Chemistry, General
7 - Master'sdegree 1
Men 9 0 0 0 0 0 7 0 0 16 Women 2 0 0 1 0 0 2 0 0 5
Total 11 0 0 1 0 0 9 0 0 21 No40.0501Chemistry, General
17 - Doctor'sdegree -research /scholarship
1Men 16 0 0 0 2 0 10 0 0 28
Women 11 0 0 0 1 0 7 0 0 19 Total 27 0 0 0 3 0 17 0 0 47 No
40.0501Chemistry, General
5 - Bachelor'sdegree 2
Men 0 0 0 0 0 0 3 0 0 3 Women 0 0 0 0 0 0 0 0 0 0
Total 0 0 0 0 0 0 3 0 0 3 No40.0601Geology/Earth Science,General
5 - Bachelor'sdegree 1
Men 0 1 0 0 0 0 12 1 0 14 Women 0 1 0 0 0 0 12 1 0 14
Total 0 2 0 0 0 0 24 2 0 28 Yes40.0601Geology/Earth Science,General
7 - Master'sdegree 1
Men 1 0 0 0 0 0 1 0 0 2 Women 2 0 0 0 0 0 0 0 0 2
Total 3 0 0 0 0 0 1 0 0 4 No40.0601Geology/Earth Science,General
17 - Doctor'sdegree -research /scholarship
1Men 0 0 0 0 0 0 1 0 0 1
Women 0 0 0 0 0 0 2 0 0 2 Total 0 0 0 0 0 0 3 0 0 3 No
40.0601Geology/Earth Science,General
5 - Bachelor'sdegree 2
Men 0 0 0 0 0 0 0 0 0 0 Women 0 0 0 0 0 0 1 0 0 1
Total 0 0 0 0 0 0 1 0 0 1 Yes

CIPCODE AwardLevel Major Gender
NonResident
AlienHispanic/ Latino
AmericanIndian orAlaskaNative
AsianBlack orAfrican
American
NativeHawaiianor OtherPacific
Islander
WhiteTwoor
moreRaces
Race/ethnicityunknown
Totaldistance
educationprogram
40.0801Physics, General
5 - Bachelor'sdegree
1 Men 0 6 0 2 0 0 16 1 3 28 Women 0 1 0 0 0 0 2 0 0 3
Total 0 7 0 2 0 0 18 1 3 31 No40.0801Physics, General
7 - Master'sdegree 1
Men 1 0 0 0 0 0 4 0 0 5 Women 3 0 0 1 0 0 0 0 1 5
Total 4 0 0 1 0 0 4 0 1 10 No40.0801Physics, General
17 - Doctor'sdegree -research /scholarship
1Men 12 1 0 0 0 0 4 0 0 17
Women 2 0 0 0 0 1 4 0 0 7 Total 14 1 0 0 0 1 8 0 0 24 No
40.0801Physics, General
5 - Bachelor'sdegree 2
Men 0 1 0 1 0 0 2 0 0 4 Women 0 0 0 0 0 0 0 0 0 0
Total 0 1 0 1 0 0 2 0 0 4 No42.0101Psychology, General
5 - Bachelor'sdegree 1
Men 0 23 0 11 2 1 47 2 4 90 Women 3 82 2 22 38 4 189 7 7 354
Total 3 105 2 33 40 5 236 9 11 444 Yes42.0101Psychology, General
7 - Master'sdegree 1
Men 0 4 0 0 0 0 4 0 0 8 Women 2 1 0 0 0 0 13 0 2 18
Total 2 5 0 0 0 0 17 0 2 26 No42.0101Psychology, General
17 - Doctor'sdegree -research /scholarship
1Men 0 0 0 0 0 0 7 0 0 7
Women 0 2 0 1 0 0 11 0 1 15 Total 0 2 0 1 0 0 18 0 1 22 No
42.0101Psychology, General
5 - Bachelor'sdegree 2
Men 0 1 0 0 0 0 1 0 0 2 Women 0 1 0 0 0 0 3 0 0 4
Total 0 2 0 0 0 0 4 0 0 6 Yes42.2803Counseling Psychology
17 - Doctor'sdegree -research /scholarship
1Men 1 1 0 0 0 0 0 0 0 2
Women 2 0 0 1 0 0 4 0 0 7 Total 3 1 0 1 0 0 4 0 0 9 No
42.2805School Psychology
7 - Master'sdegree 1
Men 0 0 0 0 0 0 0 0 0 0 Women 0 0 0 1 3 0 4 0 0 8
Total 0 0 0 1 3 0 4 0 0 8 No42.2805School Psychology
8 - Post-Master'scertificates
1Men 0 1 0 0 1 0 1 0 0 3
Women 0 0 0 1 1 0 5 0 0 7 Total 0 1 0 1 2 0 6 0 0 10 No
42.2805School Psychology
17 - Doctor'sdegree -research /scholarship
1Men 0 0 0 0 1 0 0 0 0 1
Women 0 0 0 1 1 0 1 0 1 4 Total 0 0 0 1 2 0 1 0 1 5 No
42.2806Educational Psychology
7 - Master'sdegree 1
Men 0 0 0 0 0 0 0 0 0 0 Women 0 0 0 0 0 0 0 0 0 0
Total 0 0 0 0 0 0 0 0 0 0 No42.2806Educational Psychology
8 - Post-Master'scertificates
1Men 0 0 0 0 0 0 0 0 0 0
Women 0 0 0 0 0 0 0 0 0 0 Total 0 0 0 0 0 0 0 0 0 0 No
42.2806 Men 0 0 0 0 0 0 0 0 0 0

CIPCODE AwardLevel Major Gender
NonResident
AlienHispanic/ Latino
AmericanIndian orAlaskaNative
AsianBlack orAfrican
American
NativeHawaiianor OtherPacific
Islander
WhiteTwoor
moreRaces
Race/ethnicityunknown
Totaldistance
educationprogram
Educational Psychology 17 - Doctor'sdegree -research /scholarship
1 Women 0 0 1 0 0 0 0 0 0 1 Total 0 0 1 0 0 0 0 0 0 1 No
43.0203Fire Science/Fire-fighting
5 - Bachelor'sdegree 1
Men 0 2 0 1 1 0 6 0 2 12 Women 0 0 0 0 0 0 0 0 0 0
Total 0 2 0 1 1 0 6 0 2 12 Yes45.0201Anthropology
5 - Bachelor'sdegree 1
Men 0 13 0 7 12 2 37 1 5 77 Women 0 26 0 7 16 1 71 7 7 135
Total 0 39 0 14 28 3 108 8 12 212 No45.0201Anthropology
7 - Master'sdegree 1
Men 2 0 0 0 0 0 2 0 1 5 Women 2 0 0 1 0 0 4 0 2 9
Total 4 0 0 1 0 0 6 0 3 14 No45.0201Anthropology
17 - Doctor'sdegree -research /scholarship
1Men 1 0 0 0 1 0 4 0 0 6
Women 0 2 0 0 0 0 5 0 0 7 Total 1 2 0 0 1 0 9 0 0 13 No
45.0201Anthropology
5 - Bachelor'sdegree 2
Men 0 1 0 0 0 0 2 0 0 3 Women 0 1 0 0 1 0 6 1 0 9
Total 0 2 0 0 1 0 8 1 0 12 No45.0401Criminology
5 - Bachelor'sdegree 1
Men 0 11 0 6 7 1 48 2 4 79 Women 0 27 1 5 23 1 58 2 4 121
Total 0 38 1 11 30 2 106 4 8 200 Yes45.0401Criminology
7 - Master'sdegree 1
Men 0 0 0 0 0 0 1 0 0 1 Women 0 1 0 0 1 0 3 0 0 5
Total 0 1 0 0 1 0 4 0 0 6 No45.0401Criminology
17 - Doctor'sdegree -research /scholarship
1Men 0 0 0 0 0 0 1 0 0 1
Women 0 1 0 0 0 0 4 0 0 5 Total 0 1 0 0 0 0 5 0 0 6 No
45.0401Criminology
5 - Bachelor'sdegree 2
Men 0 2 0 0 3 0 1 0 0 6 Women 0 4 0 0 1 0 5 1 1 12
Total 0 6 0 0 4 0 6 1 1 18 Yes45.0601Economics, General
5 - Bachelor'sdegree 1
Men 5 23 0 9 3 0 81 3 2 126 Women 2 9 0 10 3 0 32 2 2 60
Total 7 32 0 19 6 0 113 5 4 186 No45.0601Economics, General
7 - Master'sdegree 1
Men 3 1 0 0 1 0 3 0 0 8 Women 1 0 0 1 1 0 0 0 0 3
Total 4 1 0 1 2 0 3 0 0 11 No45.0601Economics, General
17 - Doctor'sdegree -research /scholarship
1Men 0 0 0 0 0 0 5 0 0 5
Women 1 0 0 1 0 0 1 0 0 3 Total 1 0 0 1 0 0 6 0 0 8 No
45.0601Economics, General
5 - Bachelor'sdegree 2
Men 0 4 0 0 0 0 7 0 1 12 Women 0 0 0 1 2 0 6 0 0 9
Total 0 4 0 1 2 0 13 0 1 21 No45.0701 1 Men 1 3 0 1 2 0 20 0 0 27

CIPCODE AwardLevel Major Gender
NonResident
AlienHispanic/ Latino
AmericanIndian orAlaskaNative
AsianBlack orAfrican
American
NativeHawaiianor OtherPacific
Islander
WhiteTwoor
moreRaces
Race/ethnicityunknown
Totaldistance
educationprogram
Geography 5 - Bachelor'sdegree
Women 0 4 0 0 0 0 7 0 2 13 Total 1 7 0 1 2 0 27 0 2 40 No
45.0701Geography
7 - Master'sdegree 1
Men 0 0 0 0 1 0 0 0 0 1 Women 0 0 0 0 0 0 1 0 0 1
Total 0 0 0 0 1 0 1 0 0 2 No45.0701Geography
17 - Doctor'sdegree -research /scholarship
1Men 3 1 0 0 0 0 0 0 0 4
Women 4 1 0 0 0 0 0 0 0 5 Total 7 2 0 0 0 0 0 0 0 9 No
45.0701Geography
5 - Bachelor'sdegree 2
Men 0 0 0 0 0 0 1 0 0 1 Women 0 0 0 0 0 0 1 0 0 1
Total 0 0 0 0 0 0 2 0 0 2 No45.0901International Relations andAffairs
7 - Master'sdegree 1
Men 2 0 0 0 1 0 1 0 0 4 Women 2 0 0 0 0 0 1 0 0 3
Total 4 0 0 0 1 0 2 0 0 7 No45.1001Political Science andGovernment, General
5 - Bachelor'sdegree 1
Men 1 28 1 1 6 0 97 2 5 141 Women 1 32 0 7 14 0 89 6 8 157
Total 2 60 1 8 20 0 186 8 13 298 No45.1001Political Science andGovernment, General
7 - Master'sdegree 1
Men 1 2 0 1 1 0 5 0 0 10 Women 2 1 0 1 1 0 5 0 1 11
Total 3 3 0 2 2 0 10 0 1 21 No45.1001Political Science andGovernment, General
17 - Doctor'sdegree -research /scholarship
1Men 2 0 0 0 0 0 3 0 0 5
Women 2 0 0 0 0 0 1 0 0 3 Total 4 0 0 0 0 0 4 0 0 8 No
45.1001Political Science andGovernment, General
5 - Bachelor'sdegree 2
Men 1 7 0 0 0 0 10 3 0 21 Women 1 4 0 3 1 1 13 2 0 25
Total 2 11 0 3 1 1 23 5 0 46 No45.1101Sociology
5 - Bachelor'sdegree 1
Men 2 8 0 5 10 1 18 1 5 50 Women 0 25 1 8 42 2 41 4 5 128
Total 2 33 1 13 52 3 59 5 10 178 No45.1101Sociology
7 - Master'sdegree 1
Men 0 0 0 0 0 0 2 0 0 2 Women 1 0 0 0 0 0 1 0 0 2
Total 1 0 0 0 0 0 3 0 0 4 No45.1101Sociology
17 - Doctor'sdegree -research /scholarship
1Men 1 0 0 0 0 0 4 0 0 5
Women 0 0 0 0 0 0 6 0 0 6 Total 1 0 0 0 0 0 10 0 0 11 No
45.1101Sociology
5 - Bachelor'sdegree 2
Men 0 2 0 0 0 0 1 0 0 3 Women 0 2 0 1 3 0 1 0 1 8
Total 0 4 0 1 3 0 2 0 1 11 No50.0102Digital Arts
5 - Bachelor'sdegree 1
Men 0 1 0 0 1 0 5 0 1 8 Women 0 4 0 1 0 0 2 1 0 8
Total 0 5 0 1 1 0 7 1 1 16 Yes50.0102Digital Arts
7 - Master'sdegree 1
Men 1 0 0 0 0 0 2 0 0 3 Women 2 0 0 0 1 0 0 0 0 3
Total 3 0 0 0 1 0 2 0 0 6 No

CIPCODE AwardLevel Major Gender
NonResident
AlienHispanic/ Latino
AmericanIndian orAlaskaNative
AsianBlack orAfrican
American
NativeHawaiianor OtherPacific
Islander
WhiteTwoor
moreRaces
Race/ethnicityunknown
Totaldistance
educationprogram
50.0301Dance, General
5 - Bachelor'sdegree
1 Men 0 0 0 0 1 0 3 0 0 4 Women 3 5 1 0 1 0 16 0 0 26
Total 3 5 1 0 2 0 19 0 0 30 No50.0408Interior Design
5 - Bachelor'sdegree 1
Men 0 1 0 0 0 0 0 0 0 1 Women 0 3 0 0 0 0 9 1 1 14
Total 0 4 0 0 0 0 9 1 1 15 No50.0408Interior Design
7 - Master'sdegree 1
Men 0 0 0 0 0 0 0 0 0 0 Women 1 0 0 2 0 0 1 0 0 4
Total 1 0 0 2 0 0 1 0 0 4 No50.0409Graphic Design
5 - Bachelor'sdegree 1
Men 0 4 0 1 0 0 2 0 0 7 Women 0 7 0 1 1 0 8 0 0 17
Total 0 11 0 2 1 0 10 0 0 24 No50.0501Drama andDramatics/Theatre Arts,General
5 - Bachelor'sdegree 1
Men 0 2 0 1 2 1 12 0 0 18 Women 0 12 0 1 3 0 13 2 0 31
Total 0 14 0 2 5 1 25 2 0 49 No
50.0501Drama andDramatics/Theatre Arts,General
7 - Master'sdegree 1
Men 0 2 0 1 0 0 3 0 0 6 Women 0 0 0 1 1 0 4 0 0 6
Total 0 2 0 2 1 0 7 0 0 12 No
50.0702Fine/Studio Arts, General
5 - Bachelor'sdegree 1
Men 0 7 0 0 0 1 11 0 2 21 Women 0 10 0 1 3 0 23 0 1 38
Total 0 17 0 1 3 1 34 0 3 59 No50.0702Fine/Studio Arts, General
7 - Master'sdegree 1
Men 1 1 0 0 0 0 2 1 0 5 Women 1 1 0 0 0 0 6 0 0 8
Total 2 2 0 0 0 0 8 1 0 13 No50.0703Art History, Criticism andConservation
5 - Bachelor'sdegree 1
Men 0 0 0 0 0 0 2 0 0 2 Women 1 8 0 2 0 0 13 0 2 26
Total 1 8 0 2 0 0 15 0 2 28 No50.0703Art History, Criticism andConservation
7 - Master'sdegree 1
Men 0 0 0 0 0 0 0 0 0 0 Women 0 1 0 0 1 0 2 0 1 5
Total 0 1 0 0 1 0 2 0 1 5 No50.0703Art History, Criticism andConservation
17 - Doctor'sdegree -research /scholarship
1Men 0 0 0 0 0 0 0 0 0 0
Women 1 0 0 0 0 0 2 0 0 3 Total 1 0 0 0 0 0 2 0 0 3 No
50.0901Music, General
5 - Bachelor'sdegree 1
Men 1 5 0 1 0 0 9 0 0 16 Women 0 5 0 2 0 0 7 0 1 15
Total 1 10 0 3 0 0 16 0 1 31 No50.0901Music, General
7 - Master'sdegree 1
Men 1 0 0 0 2 0 9 0 0 12 Women 1 2 0 0 1 0 2 0 0 6
Total 2 2 0 0 3 0 11 0 0 18 No50.0901Music, General
17 - Doctor'sdegree -research /scholarship
1Men 0 0 0 0 0 0 4 0 2 6
Women 0 0 0 0 0 0 2 0 0 2 Total 0 0 0 0 0 0 6 0 2 8 No
51.0000 1 Men 0 7 0 2 4 2 20 0 1 36

CIPCODE AwardLevel Major Gender
NonResident
AlienHispanic/ Latino
AmericanIndian orAlaskaNative
AsianBlack orAfrican
American
NativeHawaiianor OtherPacific
Islander
WhiteTwoor
moreRaces
Race/ethnicityunknown
Totaldistance
educationprogram
Health Services/AlliedHealth/Health Sciences,General
5 - Bachelor'sdegree
Women 0 23 4 15 22 3 93 1 5 166 Total 0 30 4 17 26 5 113 1 6 202 No
51.0202Audiology/Audiologist
18 - Doctor'sdegree -professionalpractice
1Men 4 0 0 0 0 0 3 0 1 8
Women 12 2 0 2 0 0 27 0 1 44 Total 16 2 0 2 0 0 30 0 2 52 Yes
51.0204Audiology/Audiologist andSpeech-LanguagePathology/Pathologist
5 - Bachelor'sdegree 1
Men 0 0 0 0 1 0 0 0 0 1 Women 0 9 0 2 1 0 37 1 0 50
Total 0 9 0 2 2 0 37 1 0 51 Yes
51.0204Audiology/Audiologist andSpeech-LanguagePathology/Pathologist
7 - Master'sdegree 1
Men 0 0 0 0 0 0 2 0 1 3 Women 0 1 0 1 2 0 24 0 2 30
Total 0 1 0 1 2 0 26 0 3 33 No
51.0204Audiology/Audiologist andSpeech-LanguagePathology/Pathologist
17 - Doctor'sdegree -research /scholarship
1Men 1 0 0 0 0 0 0 0 0 1
Women 1 0 0 0 0 0 2 0 0 3 Total 2 0 0 0 0 0 2 0 0 4 No
51.0401Dentistry
18 - Doctor'sdegree -professionalpractice
1Men 0 7 1 4 2 0 20 0 2 36
Women 0 6 0 8 1 0 29 1 2 47 Total 0 13 1 12 3 0 49 1 4 83 No
51.0501Dental Clinical Sciences,General
7 - Master'sdegree 1
Men 0 1 0 1 0 0 7 0 0 9 Women 0 0 0 2 0 0 3 0 0 5
Total 0 1 0 3 0 0 10 0 0 14 No51.0701Health/Health CareAdministration/Management
7 - Master'sdegree 1
Men 0 2 0 1 0 0 9 0 1 13 Women 0 1 0 3 0 0 4 0 0 8
Total 0 3 0 4 0 0 13 0 1 21 No51.0701Health/Health CareAdministration/Management
17 - Doctor'sdegree -research /scholarship
1Men 1 0 0 0 0 0 0 0 1 2
Women 0 0 0 0 0 0 0 0 0 0 Total 1 0 0 0 0 0 0 0 1 2 No
51.0912Physician Assistant
7 - Master'sdegree 1
Men 0 1 1 0 0 0 6 0 3 11 Women 0 4 0 3 2 0 35 0 3 47
Total 0 5 1 3 2 0 41 0 6 58 No51.0913Athletic Training/Trainer
5 - Bachelor'sdegree 1
Men 0 0 0 0 0 0 3 0 0 3 Women 0 1 0 0 0 0 7 0 0 8
Total 0 1 0 0 0 0 10 0 0 11 No51.1201Medicine
18 - Doctor'sdegree -professionalpractice
1Men 0 10 0 12 2 0 38 3 5 70
Women 0 4 0 13 9 0 31 1 1 59 Total 0 14 0 25 11 0 69 4 6 129 No
51.1505Marriage and FamilyTherapy/Counseling
7 - Master'sdegree 1
Men 0 0 0 0 0 0 1 0 0 1 Women 0 0 0 0 2 0 6 0 0 8
Total 0 0 0 0 2 0 7 0 0 9 No51.1505Marriage and FamilyTherapy/Counseling
8 - Post-Master'scertificates
1Men 0 0 0 0 0 0 1 0 0 1
Women 0 0 0 0 2 0 6 0 0 8

CIPCODE AwardLevel Major Gender
NonResident
AlienHispanic/ Latino
AmericanIndian orAlaskaNative
AsianBlack orAfrican
American
NativeHawaiianor OtherPacific
Islander
WhiteTwoor
moreRaces
Race/ethnicityunknown
Totaldistance
educationprogram
Total 0 0 0 0 2 0 7 0 0 9 No51.1505Marriage and FamilyTherapy/Counseling
17 - Doctor'sdegree -research /scholarship
1Men 0 0 0 0 0 0 1 0 0 1
Women 0 0 0 0 0 0 2 0 1 3 Total 0 0 0 0 0 0 3 0 1 4 No
51.1508Mental HealthCounseling/Counselor
7 - Master'sdegree 1
Men 0 1 0 0 0 0 1 0 0 2 Women 0 0 0 0 1 0 10 1 1 13
Total 0 1 0 0 1 0 11 1 1 15 No51.1508Mental HealthCounseling/Counselor
8 - Post-Master'scertificates
1Men 0 1 0 0 0 0 1 0 0 2
Women 0 0 0 0 1 0 10 1 1 13 Total 0 1 0 0 1 0 11 1 1 15 No
51.1508Mental HealthCounseling/Counselor
17 - Doctor'sdegree -research /scholarship
1Men 0 0 0 0 0 0 0 0 0 0
Women 0 0 0 0 1 0 0 0 0 1 Total 0 0 0 0 1 0 0 0 0 1 No
51.2001Pharmacy
18 - Doctor'sdegree -professionalpractice
1Men 9 14 0 35 19 0 74 1 4 156
Women 14 19 3 63 27 0 135 1 12 274 Total 23 33 3 98 46 0 209 2 16 430 Yes
51.2099Pharmacy, PharmaceuticalSciences, andAdministration, Other
7 - Master'sdegree 1
Men 4 0 0 4 11 0 31 1 5 56 Women 8 10 1 8 14 0 103 0 4 148
Total 12 10 1 12 25 0 134 1 9 204 Yes
51.2099Pharmacy, PharmaceuticalSciences, andAdministration, Other
17 - Doctor'sdegree -research /scholarship
1Men 2 0 0 0 0 1 1 0 1 5
Women 2 0 0 1 0 0 2 0 0 5 Total 4 0 0 1 0 1 3 0 1 10 No
51.2201Public Health, General
7 - Master'sdegree 1
Men 2 3 1 5 1 0 10 1 1 24 Women 5 8 0 5 10 0 23 0 2 53
Total 7 11 1 10 11 0 33 1 3 77 Yes51.2201Public Health, General
17 - Doctor'sdegree -research /scholarship
1Men 0 0 0 0 0 0 0 0 0 0
Women 0 0 0 0 2 0 1 0 0 3 Total 0 0 0 0 2 0 1 0 0 3 No
51.2202Environmental Health
7 - Master'sdegree 1
Men 0 0 0 0 0 0 0 0 0 0 Women 0 0 0 0 1 0 2 0 0 3
Total 0 0 0 0 1 0 2 0 0 3 No51.2208Community Health andPreventive Medicine
5 - Bachelor'sdegree 1
Men 0 1 0 0 4 1 7 0 0 13 Women 1 6 0 5 23 4 47 5 1 92
Total 1 7 0 5 27 5 54 5 1 105 Yes51.2208Community Health andPreventive Medicine
7 - Master'sdegree 1
Men 0 1 0 0 2 0 3 0 0 6 Women 0 0 0 2 1 0 10 1 0 14
Total 0 1 0 2 3 0 13 1 0 20 No51.2306OccupationalTherapy/Therapist
7 - Master'sdegree 1
Men 0 0 0 0 0 0 2 0 0 2 Women 1 8 0 1 1 0 31 0 3 45
Total 1 8 0 1 1 0 33 0 3 47 No51.2308Physical Therapy/Therapist 1
Men 0 0 0 0 0 0 11 0 0 11 Women 1 2 0 1 1 0 37 0 2 44

CIPCODE AwardLevel Major Gender
NonResident
AlienHispanic/ Latino
AmericanIndian orAlaskaNative
AsianBlack orAfrican
American
NativeHawaiianor OtherPacific
Islander
WhiteTwoor
moreRaces
Race/ethnicityunknown
Totaldistance
educationprogram
18 - Doctor'sdegree -professionalpractice
Total 1 2 0 1 1 0 48 0 2 55 No
51.2314Rehabilitation Science
17 - Doctor'sdegree -research /scholarship
1Men 0 1 0 0 0 0 1 0 0 2
Women 2 0 0 1 0 0 4 0 0 7 Total 2 1 0 1 0 0 5 0 0 9 No
51.2401Veterinary Medicine
18 - Doctor'sdegree -professionalpractice
1Men 0 1 0 1 0 0 18 1 1 22
Women 0 8 0 1 2 0 60 0 5 76 Total 0 9 0 2 2 0 78 1 6 98 No
51.2501VeterinarySciences/Veterinary ClinicalSciences, General
7 - Master'sdegree 1
Men 1 0 0 0 0 0 2 0 1 4 Women 1 1 0 0 1 0 6 0 1 10
Total 2 1 0 0 1 0 8 0 2 14 Yes
51.2501VeterinarySciences/Veterinary ClinicalSciences, General
17 - Doctor'sdegree -research /scholarship
1Men 0 0 0 0 0 0 0 0 0 0
Women 1 1 0 0 0 0 1 0 0 3 Total 1 1 0 0 0 0 1 0 0 3 No
51.3801RegisteredNursing/Registered Nurse
5 - Bachelor'sdegree 1
Men 0 4 0 3 0 0 9 1 1 18 Women 0 25 1 5 12 0 115 3 4 165
Total 0 29 1 8 12 0 124 4 5 183 No51.3801RegisteredNursing/Registered Nurse
7 - Master'sdegree 1
Men 0 0 0 0 0 0 7 1 2 10 Women 0 5 0 1 2 0 50 1 1 60
Total 0 5 0 1 2 0 57 2 3 70 No51.3808Nursing Science
17 - Doctor'sdegree -research /scholarship
1Men 0 0 0 0 0 0 1 0 0 1
Women 0 0 0 0 0 0 7 0 0 7 Total 0 0 0 0 0 0 8 0 0 8 No
51.3818Nursing Practice
18 - Doctor'sdegree -professionalpractice
1Men 0 0 0 0 0 0 0 0 0 0
Women 0 5 1 0 1 0 20 0 1 28 Total 0 5 1 0 1 0 20 0 1 28 Yes
52.0201Business Administration andManagement, General
5 - Bachelor'sdegree 1
Men 2 25 1 10 9 0 119 0 7 173 Women 3 22 1 10 10 1 94 1 6 148
Total 5 47 2 20 19 1 213 1 13 321 Yes52.0201Business Administration andManagement, General
7 - Master'sdegree 1
Men 94 55 0 37 14 1 279 4 28 512 Women 109 43 1 14 20 1 149 8 16 361
Total 203 98 1 51 34 2 428 12 44 873 Yes52.0201Business Administration andManagement, General
17 - Doctor'sdegree -research /scholarship
1Men 2 0 0 0 0 0 0 0 0 2
Women 0 0 0 0 0 0 0 0 0 0 Total 2 0 0 0 0 0 0 0 0 2 No
52.0201Business Administration andManagement, General
5 - Bachelor'sdegree 2
Men 0 1 0 0 0 0 1 0 0 2 Women 0 0 0 0 0 0 0 0 0 0
Total 0 1 0 0 0 0 1 0 0 2 Yes52.0201 7 - Master's
degree 2Men 0 0 0 0 0 0 0 0 0 0
Women 0 0 0 0 0 0 0 0 0 0

CIPCODE AwardLevel Major Gender
NonResident
AlienHispanic/ Latino
AmericanIndian orAlaskaNative
AsianBlack orAfrican
American
NativeHawaiianor OtherPacific
Islander
WhiteTwoor
moreRaces
Race/ethnicityunknown
Totaldistance
educationprogram
Business Administration andManagement, General
Total 0 0 0 0 0 0 0 0 0 0 Yes
52.0301Accounting
5 - Bachelor'sdegree 1
Men 1 15 0 10 2 0 71 0 2 101 Women 3 14 0 8 2 0 41 2 1 71
Total 4 29 0 18 4 0 112 2 3 172 No52.0301Accounting
7 - Master'sdegree 1
Men 1 8 0 5 1 0 48 0 3 66 Women 9 5 0 5 0 0 27 1 2 49
Total 10 13 0 10 1 0 75 1 5 115 No52.0801Finance, General
5 - Bachelor'sdegree 1
Men 5 32 0 13 5 0 117 1 3 176 Women 5 16 0 5 5 1 63 0 5 100
Total 10 48 0 18 10 1 180 1 8 276 No52.0801Finance, General
7 - Master'sdegree 1
Men 3 2 0 1 0 0 13 1 0 20 Women 0 0 0 2 0 0 5 0 0 7
Total 3 2 0 3 0 0 18 1 0 27 No52.0801Finance, General
5 - Bachelor'sdegree 2
Men 0 3 0 3 0 0 4 0 0 10 Women 0 2 0 2 0 0 3 0 0 7
Total 0 5 0 5 0 0 7 0 0 17 No52.1301Management Science
5 - Bachelor'sdegree 1
Men 0 8 0 4 2 0 25 2 0 41 Women 0 7 0 3 0 0 8 0 0 18
Total 0 15 0 7 2 0 33 2 0 59 No52.1301Management Science
5 - Bachelor'sdegree 2
Men 1 1 0 2 0 0 3 0 0 7 Women 0 0 0 0 1 0 1 0 0 2
Total 1 1 0 2 1 0 4 0 0 9 No52.1401Marketing/MarketingManagement, General
5 - Bachelor'sdegree 1
Men 0 11 0 2 6 0 33 0 1 53 Women 1 24 0 6 2 0 58 0 0 91
Total 1 35 0 8 8 0 91 0 1 144 No52.1401Marketing/MarketingManagement, General
7 - Master'sdegree 1
Men 0 0 0 0 0 0 0 0 0 0 Women 0 0 0 0 0 0 1 0 0 1
Total 0 0 0 0 0 0 1 0 0 1 No52.1401Marketing/MarketingManagement, General
5 - Bachelor'sdegree 2
Men 0 0 0 0 1 0 2 0 0 3 Women 0 0 0 0 0 0 0 0 0 0
Total 0 0 0 0 1 0 2 0 0 3 No52.1501Real Estate
7 - Master'sdegree 1
Men 1 0 0 1 0 0 18 0 1 21 Women 0 0 0 0 0 0 2 0 0 2
Total 1 0 0 1 0 0 20 0 1 23 No54.0101History, General
5 - Bachelor'sdegree 1
Men 0 13 1 1 2 0 51 4 2 74 Women 0 10 1 4 6 0 40 0 1 62
Total 0 23 2 5 8 0 91 4 3 136 No54.0101History, General
7 - Master'sdegree 1
Men 0 1 0 0 0 0 2 0 0 3 Women 1 0 0 0 0 0 2 0 0 3
Total 1 1 0 0 0 0 4 0 0 6 No54.0101History, General
17 - Doctor'sdegree -research /scholarship
1Men 1 0 0 1 0 0 5 0 0 7
Women 0 1 0 0 0 0 6 0 0 7 Total 1 1 0 1 0 0 11 0 0 14 No
54.0101 2 Men 0 1 0 0 0 0 7 0 1 9

CIPCODE AwardLevel Major Gender
NonResident
AlienHispanic/ Latino
AmericanIndian orAlaskaNative
AsianBlack orAfrican
American
NativeHawaiianor OtherPacific
Islander
WhiteTwoor
moreRaces
Race/ethnicityunknown
Totaldistance
educationprogram
History, General 5 - Bachelor'sdegree
Women 0 0 0 0 0 0 6 1 1 8 Total 0 1 0 0 0 0 13 1 2 17 No

Completions: total by first major
99.0000 SummaryGrand Totals
AwardLevel
Nonresi-dent alien
HispanicLatino
AmericanIndian orAlaskaNative
Asian Black orAfricanAmerican
NativeHawaiianor OtherPacificIslander
White Two ormoreRaces
Race/ethnicityunknown
Total PY Total
Associate's degree 3
Men 1 27 0 12 21 1 76 6 3 147 292
Women 1 62 0 17 66 3 130 14 6 299 548
Total 2 89 0 29 87 4 206 20 9 446 840
Bachelor's degree 5
Men 44 635 13 281 209 36 2266 75 127 3686 3534
Women 37 920 21 303 448 67 2763 135 135 4829 4710
Total 81 1555 34 584 657 103 5029 210 262 8515 8244
Master's degree 7
Men 774 161 3 98 62 2 939 19 86 2144 2069
Women 467 185 6 86 112 3 1087 18 65 2029 1860
Total 1241 346 9 184 174 5 2026 37 151 4173 3929
Post-Master'scertificates
8
Men 1 3 0 0 2 0 6 0 0 12 12
Women 0 8 0 1 5 0 44 2 2 62 76
Total 1 11 0 1 7 0 50 2 2 74 88
Doctor's degree -research /scholarship
17
Men 196 24 0 13 7 1 188 1 12 442 414
Women 110 28 2 16 16 1 172 1 8 354 328
Total 306 52 2 29 23 2 360 2 20 796 742
Doctor's degree -professionalpractice
18
Men 13 57 3 56 30 0 289 10 25 483 526
Women 28 62 7 94 46 0 441 5 32 715 696
Total 41 119 10 150 76 0 730 15 57 1198 1222

99.0000 SummaryGrand Totals
AwardLevel
Nonresi-dent alien
HispanicLatino
AmericanIndian orAlaskaNative
Asian Black orAfricanAmerican
NativeHawaiianor OtherPacificIslander
White Two ormoreRaces
Race/ethnicityunknown
Total PY Total
Doctor's degree -Other
19
Men 0 0 0 0 0 0 0 0 0 0 0
Women 0 0 0 0 0 0 0 0 0 0 0
Total 0 0 0 0 0 0 0 0 0 0 0
Grand Total Men 1029 907 19 460 331 40 3764 111 253 6914 6847
Grand Total Women 643 1265 36 517 693 74 4637 175 248 8288 8218
Grand Total 1672 2172 55 977 1024 114 8401 286 501 15202 15065
PY Grand Total Men 936 892 20 486 309 29 3824 94 257 6847
PY Grand TotalWomen
531 1193 24 563 719 50 4761 153 224 8218
PY Grand Total 1467 2085 44 1049 1028 79 8585 247 481 15065
Completions: total by second major
99.0000 SummaryGrand Totals
AwardLevel
Nonresi-dent alien
HispanicLatino
AmericanIndian orAlaskaNative
Asian Black orAfricanAmerican
NativeHawaiianor OtherPacificIslander
White Two ormoreRaces
Race/ethnicityunknown
Total PY Total
Bachelor's degree 5
Men 2 31 0 8 4 0 65 4 2 116 103
Women 1 26 0 11 15 1 84 6 4 148 152
Total 3 57 0 19 19 1 149 10 6 264 255
Master's degree 7
Men 0 0 0 0 0 0 0 0 0 0 0
Women 0 0 0 0 0 0 0 0 0 0 0
Total 0 0 0 0 0 0 0 0 0 0 0
Grand Total Men 2 31 0 8 4 0 65 4 2 116 103
Grand Total Women 1 26 0 11 15 1 84 6 4 148 152
Grand Total 3 57 0 19 19 1 149 10 6 264 255

PY Grand Total Men 1 9 0 9 4 1 74 1 4 103
PY Grand TotalWomen
0 27 1 12 13 2 86 5 6 152
PY Grand Total 1 36 1 21 17 3 160 6 10 255

Institution: University of Florida (134130) User ID: 88G4434All Completers
Institutions must report the following information. (Some data will be pre-populated from the completions by CIP codedata.)
All Completers
Number of students by gender and race and ethnicity earning an award between July 1, 2013 and June 30, 2014.Count each student only once, regardless of how many awards he/she earned. The intent of this screen is to collect anunduplicated count of total numbers of completers.•Report Hispanic/Latino individuals of any race as Hispanic/Latino•Report race for non-Hispanic/Latino individuals only
Men Women
Number of Students TotalAwards
Number of Students TotalAwards
TotalStudents
Nonresident alien 1,029 643 1,650
Hispanic/Latino 907 1,265 2,032
American Indian orAlaska Native
19 36 55
Asian 460 517 929
Black or AfricanAmerican
331 693 950
Native Hawaiian orOther PacificIslander
40 74 107
White 3,764 4,637 7,968
Two or more races 111 175 252
Race and ethnicityunknown
253 248 477
TOTAL 6,564 6,914 7,856 8,288 14,420
PY TOTAL 6,406 7,500 13,906
1,016 634
849 1,183
19 36
433 496
311 639
38 69
3,559 4,409
96 156
243 234

Institution: University of Florida (134130) User ID: 88G4434Completers by Level
Institutions must report the following information. This screen will be shown for each of the following award categoriesfor which completions have been reported:
• Less than 1-year certificates• At least 1 but less than 4-year certificates• Associate's degrees• Bachelor's degrees• Master's degrees• Doctor's degrees• Postbaccalaureate and post-master's certificates
Associate's degrees
Number of students by gender, by race and ethnicity, and by age earning this award between July 1, 2013 and June30, 2014. Each student should be counted once per award level. For example, if a student earned a master's degreeand a doctor's degree, he/she should be counted once in master's and once in doctor's. A student earning two master'sdegrees should be counted only once.•Report Hispanic/Latino individuals of any race as Hispanic/Latino•Report race for non-Hispanic/Latino individuals only
Number of Students Total Awards
By Gender
Men 147
Women 299
TOTAL 446 446
PY TOTAL 840
By Race/Ethnicity
Nonresident alien 2
Hispanic/Latino 89
American Indian or Alaska Native 0
Asian 29
Black or African American 87
147
299
2
89
0
29
87

Native Hawaiian or Other Pacific Islander 4
White 206
Two or more races 20
Race and ethnicity unknown 9
TOTAL 446 446
By Age
Under 18
18-24
25-39
40 and Above
Age Unknown
TOTAL 446 446
4
206
20
9
0
420
23
3
0

Institution: University of Florida (134130) User ID: 88G4434Completers by Level
Institutions must report the following information. This screen will be shown for each of the following award categoriesfor which completions have been reported:
• Less than 1-year certificates• At least 1 but less than 4-year certificates• Associate's degrees• Bachelor's degrees• Master's degrees• Doctor's degrees• Postbaccalaureate and post-master's certificates
Bachelor's degrees
Number of students by gender, by race and ethnicity, and by age earning this award between July 1, 2013 and June30, 2014. Each student should be counted once per award level. For example, if a student earned a master's degreeand a doctor's degree, he/she should be counted once in master's and once in doctor's. A student earning two master'sdegrees should be counted only once.•Report Hispanic/Latino individuals of any race as Hispanic/Latino•Report race for non-Hispanic/Latino individuals only
Number of Students Total Awards
By Gender
Men 3,686
Women 4,829
TOTAL 8,192 8,515
PY TOTAL 7,921
By Race/Ethnicity
Nonresident alien 81
Hispanic/Latino 1,555
American Indian or Alaska Native 34
Asian 584
Black or African American 657
Native Hawaiian or Other Pacific Islander 103
3,537
4,655
79
1,497
34
562
645

White 5,029
Two or more races 210
Race and ethnicity unknown 262
TOTAL 8,192 8,515
By Age
Under 18
18-24
25-39
40 and Above
Age Unknown
TOTAL 8,192 8,515
100
4,835
192
248
0
7,251
853
88
0

Institution: University of Florida (134130) User ID: 88G4434Completers by Level
Institutions must report the following information. This screen will be shown for each of the following award categoriesfor which completions have been reported:
• Less than 1-year certificates• At least 1 but less than 4-year certificates• Associate's degrees• Bachelor's degrees• Master's degrees• Doctor's degrees• Postbaccalaureate and post-master's certificates
Master's degrees
Number of students by gender, by race and ethnicity, and by age earning this award between July 1, 2013 and June30, 2014. Each student should be counted once per award level. For example, if a student earned a master's degreeand a doctor's degree, he/she should be counted once in master's and once in doctor's. A student earning two master'sdegrees should be counted only once.•Report Hispanic/Latino individuals of any race as Hispanic/Latino•Report race for non-Hispanic/Latino individuals only
Number of Students Total Awards
By Gender
Men 2,144
Women 2,029
TOTAL 4,142 4,173
PY TOTAL 3,905
By Race/Ethnicity
Nonresident alien 1,241
Hispanic/Latino 346
American Indian or Alaska Native 9
Asian 184
Black or African American 174
Native Hawaiian or Other Pacific Islander 5
2,123
2,019
1,235
342
9
183
173

White 2,026
Two or more races 37
Race and ethnicity unknown 151
TOTAL 4,142 4,173
By Age
Under 18
18-24
25-39
40 and Above
Age Unknown
TOTAL 4,142 4,173
5
2,009
36
150
0
1,280
2,572
290
0

Institution: University of Florida (134130) User ID: 88G4434Completers by Level
Institutions must report the following information. This screen will be shown for each of the following award categoriesfor which completions have been reported:
• Less than 1-year certificates• At least 1 but less than 4-year certificates• Associate's degrees• Bachelor's degrees• Master's degrees• Doctor's degrees• Postbaccalaureate and post-master's certificates
Doctor's degrees
Number of students by gender, by race and ethnicity, and by age earning this award between July 1, 2013 and June30, 2014. Each student should be counted once per award level. For example, if a student earned a master's degreeand a doctor's degree, he/she should be counted once in master's and once in doctor's. A student earning two master'sdegrees should be counted only once.•Report Hispanic/Latino individuals of any race as Hispanic/Latino•Report race for non-Hispanic/Latino individuals only
Number of Students Total Awards
By Gender
Men 925
Women 1,069
TOTAL 1,994 1,994
PY TOTAL 1,964
By Race/Ethnicity
Nonresident alien 347
Hispanic/Latino 171
American Indian or Alaska Native 12
Asian 179
Black or African American 99
Native Hawaiian or Other Pacific Islander 2
925
1,069
347
171
12
179
99

White 1,090
Two or more races 17
Race and ethnicity unknown 77
TOTAL 1,994 1,994
By Age
Under 18
18-24
25-39
40 and Above
Age Unknown
TOTAL 1,994 1,994
2
1,090
17
77
0
51
1,683
260
0

Institution: University of Florida (134130) User ID: 88G4434Completers by Level
Institutions must report the following information. This screen will be shown for each of the following award categoriesfor which completions have been reported:
• Less than 1-year certificates• At least 1 but less than 4-year certificates• Associate's degrees• Bachelor's degrees• Master's degrees• Doctor's degrees• Postbaccalaureate and post-master's certificates
Postbaccalaureate and post-master's certificates
Number of students by gender, by race and ethnicity, and by age earning this award between July 1, 2013 and June30, 2014. Each student should be counted once per award level. For example, if a student earned a master's degreeand a doctor's degree, he/she should be counted once in master's and once in doctor's. A student earning two master'sdegrees should be counted only once.•Report Hispanic/Latino individuals of any race as Hispanic/Latino•Report race for non-Hispanic/Latino individuals only
Number of Students Total Awards
By Gender
Men 12
Women 62
TOTAL 74 74
PY TOTAL 88
By Race/Ethnicity
Nonresident alien 1
Hispanic/Latino 11
American Indian or Alaska Native 0
Asian 1
Black or African American 7
Native Hawaiian or Other Pacific Islander 0
12
62
1
11
0
1
7

White 50
Two or more races 2
Race and ethnicity unknown 2
TOTAL 74 74
By Age
Under 18
18-24
25-39
40 and Above
Age Unknown
TOTAL 74 74
0
50
2
2
0
9
53
12
0

Institution: University of Florida (134130) User ID: 88G4434Prepared by
This survey component was prepared by:
Keyholder SFA Contact HR Contact
FinanceContact
Academic LibraryContact
Other
Name:
Email:
How long did it take toprepare this surveycomponent?
hours minutes
The name of the preparer is being collected so that we can follow up with the appropriate person in the event that thereare questions concerning the data. The Keyholder will be copied on all email correspondence to other preparers.
The time it took to prepare this component is being collected so that we can continue to improve our estimate of thereporting burden associated with IPEDS. Please include in your estimate the time it took for you to review instructions,query and search data sources, complete and review the component, and submit the data through the Data CollectionSystem.
Thank you for your assistance.

Institution: University of Florida (134130) User ID: 88G4434Summary
IPEDS collects important information regarding your institution. All data reported inIPEDS survey components become available in the IPEDS Data Center and appear asaggregated data in various Department of Education reports. Additionally, some of thereported data appears specifically for your institution through the College Navigatorwebsite and is included in your institution’s Data Feedback Report (DFR). The purposeof this summary is to provide you an opportunity to view some of the data that, whenaccepted through the IPEDS quality control process, will appear on the CollegeNavigator website and/or your DFR. College Navigator is updated approximately threemonths after the data collection period closes and Data Feedback Reports will beavailable through the Data Center and sent to your institution’s CEO in November2015.
Please review your data for accuracy. If you have questions about the data displayedbelow after reviewing the data reported on the survey screens, please contact theIPEDS Help Desk at: 1-877-225-2568 or [email protected].
Summary of Completions DataAward Level Number of Completions
1st major 2nd major
Associate's degree 446 0Bachelors degree or equivalent 8,515 264Master's degree 4,173 0Post-master's certificate 74 0Doctor's degree - research/scholarship 796 0Doctor's degree - professional practice 1,198 0Doctor's degree - other 0 0Total number of degrees and certificates 15,202
Summary of Completers Data Number of Students
Men Women Total
All Completers 6,564 7,856 14,420

Institution: University of Florida (134130) User ID: 88G4434Edit Report
Completions
University of Florida (134130)
Source Description Severity Resolved OptionsGlobal EditsPerformEdits
Your institution reported offering award level(s) (2:6) in theprior year IC Header survey, but you did not report offeringany programs at this level here. Please correct your data orexplain the discrepancy. (Error #10528)
Explanation Yes
Reason: The official offering of certificates is a new process. The placement of these awards in the Board of Governors systemhas not yet been determined.
PerformEdits
Your institution did not report offering award level(s) (19) inthe prior year IC Header survey, but you indicated that one ormore programs are offered at this level here. Please correctyour data or explain the discrepancy. (Error #10529)
Explanation Yes
Reason: Board of Governors load process was incorrect. Reporting has been corrected to assign these degrees into theirappropriate Doctoral - Research or Doctoral - Professional categories.
PerformEdits
Current year completions (85) are outside the expected rangewhen compared to completions reported in the prior year (39)for: Women, 2-digit field (9), award level (7). Please correctyour data or explain. (Error #10506)
Explanation Yes
Reason: This increase is due to new online master's programs for Mass Communication (09.0102) that started a few years ago,and students are now starting to graduate.
PerformEdits
Current year completions (58) are outside the expected rangewhen compared to completions reported in the prior year (7)for: Men, 2-digit field (11), award level (5). Please correct yourdata or explain. (Error #10503)
Explanation Yes
Reason: This is due to a recent CIP change for Computer Science in Engineering from 14.0901 to 11.0101."PerformEdits
Current year completions (81) are outside the expected rangewhen compared to completions reported in the prior year (50)for: Men, 2-digit field (27), award level (5). Please correct yourdata or explain. (Error #10504)
Explanation Yes
Reason: The data have been verified.PerformEdits
Current year completions (83) are outside the expected rangewhen compared to completions reported in the prior year (48)for: Women, 2-digit field (30), award level (5). Please correctyour data or explain. (Error #10506)
Explanation Yes
Reason: This increase is due to two new programs in Fall 2011 under CIPs 30.2001 and 30.3301, and the enrolled students arebeginning to graduate.
Screen: Completers- Associate's degreesScreenEntry
The total number of completers (Men + Women) reported forthis award level (446) is outside the expected range whencompared to the prior year value. Please correct your data orexplain the reason for the variance. (Error #10584)
Explanation Yes
Reason: The data have been verified.

Completions 2014-15
Institution: University of Florida-Online (484473) User ID: 88G4434Completions Overview
Welcome to the IPEDS Completions survey component. The Completions component is one of several IPEDS components that is conducted during the Fall datacollection period. It collects the number of degrees and certificates awarded by field of study, level of award, race/ethnicity, and gender. The reporting period for theCompletions component is during the 12-month time period beginning July 1 of the previous calendar year and ending June 30 of the current calendar year; therefore,for this year’s Completions component, the reporting period is between July 1, 2013 and June 30, 2014. The Completions component is also collecting the number ofstudents (e.g., completers) who earned awards between July 1, 2013 and June 30, 2014.
Completions Common Errors Some common completions component errors include the following:
• Including award levels on your current year Completions that were not reported on your previous year's (PY) Institutional Characteristics (IC). [Award levels inthe PY IC component cannot be changed; therefore, contact the IPEDS Help Desk at 1-877-225-2568 if you need assistance.]
• Forgetting to select CIP codes for new programs of study that are offered by the institution, but do not have completions for the reporting period.• Forgetting to enter in zero in at least one of the cells for CIP codes that do not have completions.
Recent Changes • The following question on distance education has been added to the bottom of each individual "CIP Data" screen:
"Is this program offered as a distance education program?"• The following two screens, which collect data specifically on students were added to this component, beginning in the 2012-13 survey year:
◦ "All Completers" - Collects the number of students who earned an award between July 1, 2013 and June 30, 2014 by gender and race/ethnicity.(The intent of this screen is to collect an unduplicated count of total numbers of completers.)
◦ "Completers by Level" - Collects the number of students who earned an award between July 1, 2013 and June 30, 2014 by award level and 1) bygender; 2) by race/ethnicity; and 3) by age.
• The definition for Post-baccalaureate Certificate has changed slightly for the 2014-15 collection. The new definition is as follows: An award that requirescompletion of an organized program of study beyond the bachelor's. It is designed for persons who have completed a baccalaureate degree, butdoes not meet the requirements of a master's degree.
NOTE: Even though Teacher Preparation certificate programs may require a bachelor's degree for admission, they are considered sub-bacalaureate undergraduate programs, and students in these programs are undergraduate students.
General Information CIP Codes: The CIP 2010 Website includes a list of new CIP codes, a list of deleted CIP codes, a list of moved CIP Codes, and an online crosswalk of the 2000 CIP and 2010CIP.
The Resources Page of the CIP 2010 website contains many valuable resources including:• CIP 2010 Manual and copies of previous editions of the CIP Manual• Crosswalk between the 2000 CIP codes and the 2010 CIP codes in Excel format
Keep in mind that some information provided by institutions on the Completions component appear in the College Navigator, which is a major tool used by consumerssearching for information about postsecondary education. It is therefore vitally important that you include accurate information about your institution.
Survey materials can be downloaded using the following link: Survey Materials.
The prior year revision system can be accessed using the following link: Prior Year Revision System

Completions CIP Data
CIPCODE AwardLevel Major Gender
NonResident
AlienHispanic/ Latino
AmericanIndian orAlaskaNative
AsianBlack orAfrican
American
NativeHawaiianor OtherPacific
Islander
WhiteTwo ormoreRaces
Race/ethnicityunknown
Totaldistance
educationprogram
09.0701Radio and Television
5 -Bachelor'sdegree
1Men 0 0 0 0 0 0 0 0 0 0
Women 0 0 0 0 0 0 0 0 0 0 Total 0 0 0 0 0 0 0 0 0 0 Yes
11.0101Computer and InformationSciences, General
5 -Bachelor'sdegree
1Men 0 0 0 0 0 0 0 0 0 0
Women 0 0 0 0 0 0 0 0 0 0 Total 0 0 0 0 0 0 0 0 0 0 Yes
24.0101Liberal Arts andSciences/Liberal Studies
3 -Associate'sdegree
1Men 0 0 0 0 0 0 0 0 0 0
Women 0 0 0 0 0 0 0 0 0 0 Total 0 0 0 0 0 0 0 0 0 0 Yes
26.0101Biology/Biological Sciences,General
5 -Bachelor'sdegree
1Men 0 0 0 0 0 0 0 0 0 0
Women 0 0 0 0 0 0 0 0 0 0 Total 0 0 0 0 0 0 0 0 0 0 Yes
30.9999Multi-/InterdisciplinaryStudies, Other
5 -Bachelor'sdegree
1Men 0 0 0 0 0 0 0 0 0 0
Women 0 0 0 0 0 0 0 0 0 0 Total 0 0 0 0 0 0 0 0 0 0 Yes
31.0504Sport and FitnessAdministration/Management
5 -Bachelor'sdegree
1Men 0 0 0 0 0 0 0 0 0 0
Women 0 0 0 0 0 0 0 0 0 0 Total 0 0 0 0 0 0 0 0 0 0 Yes
40.0601Geology/Earth Science,General
5 -Bachelor'sdegree
1Men 0 0 0 0 0 0 0 0 0 0
Women 0 0 0 0 0 0 0 0 0 0 Total 0 0 0 0 0 0 0 0 0 0 Yes
42.0101Psychology, General
5 -Bachelor'sdegree
1Men 0 0 0 0 0 0 0 0 0 0
Women 0 0 0 0 0 0 0 0 0 0 Total 0 0 0 0 0 0 0 0 0 0 Yes
45.0401Criminology
5 -Bachelor'sdegree
1Men 0 0 0 0 0 0 0 0 0 0
Women 0 0 0 0 0 0 0 0 0 0 Total 0 0 0 0 0 0 0 0 0 0 Yes
45.1101Sociology
5 -Bachelor'sdegree
1Men 0 0 0 0 0 0 0 0 0 0
Women 0 0 0 0 0 0 0 0 0 0 Total 0 0 0 0 0 0 0 0 0 0 Yes
51.2208Community Health andPreventive Medicine
5 -Bachelor'sdegree
1Men 0 0 0 0 0 0 0 0 0 0
Women 0 0 0 0 0 0 0 0 0 0 Total 0 0 0 0 0 0 0 0 0 0 Yes
52.0201Business Administrationand Management, General
5 -Bachelor'sdegree
1Men 0 0 0 0 0 0 0 0 0 0
Women 0 0 0 0 0 0 0 0 0 0 Total 0 0 0 0 0 0 0 0 0 0 Yes

Completions: total by first major
99.0000 SummaryGrand Totals
AwardLevel
Nonresi-dent alien
HispanicLatino
AmericanIndian orAlaskaNative
Asian Black orAfricanAmerican
NativeHawaiianor OtherPacificIslander
White Two ormoreRaces
Race/ethnicityunknown
Total PY Total
Associate's degree 3
Men 0 0 0 0 0 0 0 0 0 0 0
Women 0 0 0 0 0 0 0 0 0 0 0
Total 0 0 0 0 0 0 0 0 0 0 0
Bachelor's degree 5
Men 0 0 0 0 0 0 0 0 0 0 0
Women 0 0 0 0 0 0 0 0 0 0 0
Total 0 0 0 0 0 0 0 0 0 0 0
Grand Total Men 0 0 0 0 0 0 0 0 0 0 0
Grand Total Women 0 0 0 0 0 0 0 0 0 0 0
Grand Total 0 0 0 0 0 0 0 0 0 0 0
PY Grand Total Men 0 0 0 0 0 0 0 0 0 0
PY Grand TotalWomen
0 0 0 0 0 0 0 0 0 0
PY Grand Total 0 0 0 0 0 0 0 0 0 0

Institution: University of Florida-Online (484473) User ID: 88G4434Prepared by
This survey component was prepared by:
Keyholder SFA Contact HR Contact
FinanceContact
Academic LibraryContact
Other
Name:
Email:
How long did it take toprepare this surveycomponent?
hours minutes
The name of the preparer is being collected so that we can follow up with the appropriate person in the event that thereare questions concerning the data. The Keyholder will be copied on all email correspondence to other preparers.
The time it took to prepare this component is being collected so that we can continue to improve our estimate of thereporting burden associated with IPEDS. Please include in your estimate the time it took for you to review instructions,query and search data sources, complete and review the component, and submit the data through the Data CollectionSystem.
Thank you for your assistance.

Institution: University of Florida-Online (484473) User ID: 88G4434Summary
IPEDS collects important information regarding your institution. All data reported inIPEDS survey components become available in the IPEDS Data Center and appear asaggregated data in various Department of Education reports. Additionally, some of thereported data appears specifically for your institution through the College Navigatorwebsite and is included in your institution’s Data Feedback Report (DFR). The purposeof this summary is to provide you an opportunity to view some of the data that, whenaccepted through the IPEDS quality control process, will appear on the CollegeNavigator website and/or your DFR. College Navigator is updated approximately threemonths after the data collection period closes and Data Feedback Reports will beavailable through the Data Center and sent to your institution’s CEO in November2015.
Please review your data for accuracy. If you have questions about the data displayedbelow after reviewing the data reported on the survey screens, please contact theIPEDS Help Desk at: 1-877-225-2568 or [email protected].
Summary of Completions DataAward Level Number of Completions
1st major 2nd major
Associate's degree 0 0Bachelors degree or equivalent 0 0Total number of degrees and certificates 0

Institution: University of Florida-Online (484473) User ID: 88G4434Edit Report
Completions
University of Florida-Online (484473)
There are no errors for the selected survey and institution.

Admissions 2014-15Institution: University of Florida (134130)User ID: 88G4434
OverviewAdmissions Overview
Welcome to the IPEDS Admissions (ADM) survey component. The primary purpose of ADM is to collect basicinformation about the undergraduate selection process for entering first-time, degree/certificate-seeking students. Thisincludes information about admissions considerations, admissions yields, and SAT and ACT test scores (if test scoresare required for admission). ADM will be collected only from institutions that do not have an open admissions policy forentering first-time students.
Recent changes The items in ADM were moved from the Institutional Characteristics component. There will be no change to the dataitems collected, only to the collection period in which the data are submitted.
In previous collections, institutions selected from two reporting period options. Admissions data from the prior yearcould be provided if current year data were not available at the time of reporting. Beginning with the current Winter2014-15 collection, all institutions must use the most recent Fall reporting period.
Data Reporting Reminders •ADM covers data for the most recent Fall period.•ADM is only applicable to first-time entering students; do not include other students in the number ofapplicants, number of admits, and number (of admitted) that enrolled. Only include levels (full-time,part-time) that you indicated were offered in the IC Header. If you made an error in the IC Header,please call the IPEDS Help Desk.
Resources:To download the survey materials for this component: Survey Materials
To access your prior year data submission for this component: Reported Data
If you have questions about completing this survey, please contact the IPEDS Help Desk at 1-877-225-2568.

Imagedescription.Thesecontext noteswill beposted onthe CollegeNavigator.End of imagedescription.
Institution: University of Florida (134130)User ID: 88G4434
Admissions Considerations, 11. Please select the option that best describes how your institution uses any of the following data in itsundergraduate selection process. Admission Considerations Required Recommended Neither Required
nor RecommendedDon'tKnow
Secondary school GPA Secondary school rank Secondary school record Completion of college-preparatory program Recommendations Formal demonstration of competencies (e.g., portfolios,certificates of mastery, assessment instruments) Admission test scoresSAT / ACT Other Test (ABT, Wonderlic, WISC-III, etc.)Note: If this is the only requirement other than a diploma orequivalent, and few students are not admitted due to this test,your institution is open enrollment. Please contact the HelpDesk to correct your response to this question.
TOEFL (Test of English as a Foreign Language)
You may use the space below to provide context for the data you've reported above. These context noteswill be posted on the College Navigator website, and should be written to be understood by students andparents.

Institution: University of Florida (134130)User ID: 88G4434
Selection Process - A/A/E2. Provide the number of first-time, degree/certificate-seeking undergraduate students who applied, who wereadmitted, and who enrolled (either full- or part-time) at your institution for Fall 2014. Include early decision,early action, and students who began studies during the summer prior to Fall 2014.Remember that this question is only applicable to first-time students, do not include other students in these totals.
Only include levels that you indicated were offered in the IC Header. If you made an error in the IC Header, pleaseremember to fix the error the next year. Men Women TotalNumber of applicants 12,414 16,193 28,662Number of admissions 5,335 7,725 13,072Number (of admitted) that enrolled full-time 2,679 3,802 6,483Number (of admitted) that enrolled part-time 15 14 29Total enrolled full-time and part-time 2,694 3,816 6,512Percent of admissions enrolled full-time and part-time 50 49 50

Imagedescription.Thesecontext noteswill beposted onthe CollegeNavigator.End of imagedescription.
Institution: University of Florida (134130)User ID: 88G4434
Selection Process - Test Scores3. Provide writing test scores only if used for admission. Provide data for Fall 2014. Include new studentsadmitted the summer prior to Fall 2014.DO NOT convert test scores (e.g., do not convert an SAT score to an ACT scale, etc.). If you have numbers for bothSAT and ACT scores, provide the percentiles for both tests. Number of enrolled students that submitted SAT scores 3,927Percent of enrolled students that submitted SAT scores 60Number of enrolled students that submitted ACT scores 2,597Percent of enrolled students that submitted ACT scores 40 25th Percentile 75th PercentileSAT Critical Reading 580 670SAT Math 590 690SAT Writing 580 670ACT Composite 26 31ACT English 25 32ACT Math 25 30ACT Writing 8 9
You may use the space below to provide context for the data you've reported above. These context noteswill be posted on the College Navigator website, and should be written to be understood by students andparents.

Institution: University of Florida (134130)User ID: 88G4434
Prepared by This survey component was prepared by: Keyholder SFA Contact HR Contact
Finance Contact Academic Library Contact Other
Name: Marie Zeglen Email: [email protected] How long did it take to prepare thissurvey component?
2hours 0minutes
The name of the preparer is being collected so that we can follow up with the appropriate person in the event that thereare questions concerning the data. The Keyholder will be copied on all email correspondence to other preparers.The time it took to prepare this component is being collected so that we can continue to improve our estimate of thereporting burden associated with IPEDS. Please include in your estimate the time it took for you to review instructions,query and search data sources, complete and review the component, and submit the data through the Data CollectionSystem.Thank you for your assistance.

Institution: University of Florida (134130) User ID: 88G4434Summary
Admissions Component Summary
IPEDS collects important information regarding your institution. All data reported in IPEDSsurvey components become available in the IPEDS Data Center and appear as aggregated datain various Department of Education reports. Additionally, some of the reported data appearsspecifically for your institution through the College Navigator website and is included in yourinstitution’s Data Feedback Report (DFR). The purpose of this summary is to provide you anopportunity to view some of the data that, when accepted through the IPEDS quality controlprocess, will appear on the College Navigator website and/or your DFR. College Navigator isupdated approximately three months after the data collection period closes and Data FeedbackReports will be available through the Data Center and sent to your institution’s CEO inNovember 2015.
Please review your data for accuracy. If you have questions about the data displayed belowafter reviewing the data reported on the survey screens, please contact the IPEDS Help Desk at:1-877-225-2568 or [email protected].
ADMISSIONS INFORMATIONUndergraduate Admissions Total Male Female
Number of applicants 28,662 12,414 16,193
Percent admitted 46% 43% 48%
Percent admitted who enrolled 50% 50% 49%
Admissions Considerations Required Recommended
Secondary school GPASecondary school recordCompletion of college-preparatory programAdmission test scores (SAT/ACT)
N/A
Test Scores # Submitting Scores % Submitting Scores
SAT 3,927 60%
ACT 2,597 40%
25th Percentile 75th Percentile
SAT Critical Reading 580 670
SAT Math 590 690
SAT Writing 580 670
ACT Composite 26 31
ACT English 25 32
ACT Math 25 30
ACT Writing 8 9

Institution: University of Florida (134130) User ID: 88G4434Edit Report
Admissions
University of Florida (134130)
Source Description Severity Resolved OptionsScreen: Selection Process - Test Scores
ScreenEntry
The 75th percentile for a majority of institutions isless than 32. Please correct your data or explain.(Error #14315)
Explanation Yes
Reason: The data we have available shows that 32 is the 75th percentile for ACT English for our newly enrolled students.

Admissions 2014-15Institution: University of Florida-Online (484473)User ID: 88G4434
OverviewAdmissions Overview
Welcome to the IPEDS Admissions (ADM) survey component. The primary purpose of ADM is to collect basicinformation about the undergraduate selection process for entering first-time, degree/certificate-seeking students. Thisincludes information about admissions considerations, admissions yields, and SAT and ACT test scores (if test scoresare required for admission). ADM will be collected only from institutions that do not have an open admissions policy forentering first-time students.
Recent changes The items in ADM were moved from the Institutional Characteristics component. There will be no change to the dataitems collected, only to the collection period in which the data are submitted.
In previous collections, institutions selected from two reporting period options. Admissions data from the prior yearcould be provided if current year data were not available at the time of reporting. Beginning with the current Winter2014-15 collection, all institutions must use the most recent Fall reporting period.
Data Reporting Reminders •ADM covers data for the most recent Fall period.•ADM is only applicable to first-time entering students; do not include other students in the number ofapplicants, number of admits, and number (of admitted) that enrolled. Only include levels (full-time,part-time) that you indicated were offered in the IC Header. If you made an error in the IC Header,please call the IPEDS Help Desk.
Resources:To download the survey materials for this component: Survey Materials
To access your prior year data submission for this component: Reported Data
If you have questions about completing this survey, please contact the IPEDS Help Desk at 1-877-225-2568.

Imagedescription.Thesecontext noteswill beposted onthe CollegeNavigator.End of imagedescription.
Institution: University of Florida-Online (484473)User ID: 88G4434
Admissions Considerations, 11. Please select the option that best describes how your institution uses any of the following data in itsundergraduate selection process. Admission Considerations Required Recommended Neither Required
nor RecommendedDon'tKnow
Secondary school GPA Secondary school rank Secondary school record Completion of college-preparatory program Recommendations Formal demonstration of competencies (e.g., portfolios,certificates of mastery, assessment instruments) Admission test scoresSAT / ACT Other Test (ABT, Wonderlic, WISC-III, etc.)Note: If this is the only requirement other than a diploma orequivalent, and few students are not admitted due to this test,your institution is open enrollment. Please contact the HelpDesk to correct your response to this question.
TOEFL (Test of English as a Foreign Language)
You may use the space below to provide context for the data you've reported above. These context noteswill be posted on the College Navigator website, and should be written to be understood by students andparents.

Institution: University of Florida-Online (484473)User ID: 88G4434
Selection Process - A/A/E2. Provide the number of first-time, degree/certificate-seeking undergraduate students who applied, who wereadmitted, and who enrolled (either full- or part-time) at your institution for Fall 2014. Include early decision,early action, and students who began studies during the summer prior to Fall 2014.Remember that this question is only applicable to first-time students, do not include other students in these totals.
Only include levels that you indicated were offered in the IC Header. If you made an error in the IC Header, pleaseremember to fix the error the next year. Men Women TotalNumber of applicants 44 58 105Number of admissions 5 19 24Number (of admitted) that enrolled full-time 1 7 8Number (of admitted) that enrolled part-time 1 8 9Total enrolled full-time and part-time 2 15 17Percent of admissions enrolled full-time and part-time 40 79 71

Imagedescription.Thesecontext noteswill beposted onthe CollegeNavigator.End of imagedescription.
Institution: University of Florida-Online (484473)User ID: 88G4434
Selection Process - Test Scores3. Provide writing test scores only if used for admission. Provide data for Fall 2014. Include new studentsadmitted the summer prior to Fall 2014.DO NOT convert test scores (e.g., do not convert an SAT score to an ACT scale, etc.). If you have numbers for bothSAT and ACT scores, provide the percentiles for both tests. Number of enrolled students that submitted SAT scores 6Percent of enrolled students that submitted SAT scores 35Number of enrolled students that submitted ACT scores 8Percent of enrolled students that submitted ACT scores 47 25th Percentile 75th PercentileSAT Critical Reading 540 620SAT Math 550 620SAT Writing 540 670ACT Composite 24 26ACT English 22 26ACT Math 23 27ACT Writing 7 8
You may use the space below to provide context for the data you've reported above. These context noteswill be posted on the College Navigator website, and should be written to be understood by students andparents.

Institution: University of Florida-Online (484473)User ID: 88G4434
Prepared by This survey component was prepared by: Keyholder SFA Contact HR Contact
Finance Contact Academic Library Contact Other
Name: Marie Zeglen Email: [email protected] How long did it take to prepare thissurvey component?
2hours 0minutes
The name of the preparer is being collected so that we can follow up with the appropriate person in the event that thereare questions concerning the data. The Keyholder will be copied on all email correspondence to other preparers.The time it took to prepare this component is being collected so that we can continue to improve our estimate of thereporting burden associated with IPEDS. Please include in your estimate the time it took for you to review instructions,query and search data sources, complete and review the component, and submit the data through the Data CollectionSystem.Thank you for your assistance.

Institution: University of Florida-Online (484473) User ID: 88G4434Summary
Admissions Component Summary
IPEDS collects important information regarding your institution. All data reported in IPEDSsurvey components become available in the IPEDS Data Center and appear as aggregated datain various Department of Education reports. Additionally, some of the reported data appearsspecifically for your institution through the College Navigator website and is included in yourinstitution’s Data Feedback Report (DFR). The purpose of this summary is to provide you anopportunity to view some of the data that, when accepted through the IPEDS quality controlprocess, will appear on the College Navigator website and/or your DFR. College Navigator isupdated approximately three months after the data collection period closes and Data FeedbackReports will be available through the Data Center and sent to your institution’s CEO inNovember 2015.
Please review your data for accuracy. If you have questions about the data displayed belowafter reviewing the data reported on the survey screens, please contact the IPEDS Help Desk at:1-877-225-2568 or [email protected].
ADMISSIONS INFORMATIONUndergraduate Admissions Total Male Female
Number of applicants 105 44 58
Percent admitted 23% 11% 33%
Percent admitted who enrolled 71% 40% 79%
Admissions Considerations Required Recommended
Secondary school GPASecondary school recordCompletion of college-preparatory programAdmission test scores (SAT/ACT)
N/A
Test Scores # Submitting Scores % Submitting Scores
SAT 6 35%
ACT 8 47%
25th Percentile 75th Percentile
SAT Critical Reading 540 620
SAT Math 550 620
SAT Writing 540 670
ACT Composite 24 26
ACT English 22 26
ACT Math 23 27
ACT Writing 7 8

Institution: University of Florida-Online (484473) User ID: 88G4434Edit Report
Admissions
University of Florida-Online (484473)
Source Description Severity Resolved OptionsScreen: Selection Process - Test Scores
ScreenEntry
The number of enrolled students that submitted test scores(SAT + ACT) reported on the Selection Process - TestScores screen should be greater than or equal to the totalnumber that enrolled full-time and part-time reported on theSelection Process - A/A/E screen. Please correct your dataor explain. (Error #14232)
Explanation Yes
Reason: Per our admissions policy for the University of Florida-Online, three enrolled students where granted test scoreexemptions, so no score was used in the selection process.

Graduation Rates 2014-15Institution: University of Florida (134130)User ID: 88G4434
OverviewGraduation Rates Overview
Welcome to the IPEDS Graduation Rates (GR) survey component. The GR component collects data on the cohort offull-time, first-time degree/certificate-seeking undergraduate students and tracks their completion status at 150% of thenormal time to complete all requirements of their program of study. This information is collected to assist institutions incomplying with the requirements of the Student Right-to-Know Act.
Data Reporting Reminders Once a student is in the cohort, they remain in the cohort, even if their status changes to part-time or they drop out ortransfer out of the institution. However, adjustments can be made to the cohort for allowable exclusions, which includethe death of a student, permanent disability, military deployment, or service on an official church mission or with aforeign aid service of the Federal government.
Resources:The survey materials package for this component can be downloaded using the following link: Survey Materials
To access your prior year data submission for this component: Reported Data
If you have questions about completing this survey, please contact the IPEDS Help Desk at 1-877-225-2568.

Institution: University of Florida (134130)User ID: 88G4434
Section I - Graduation Rates - Establishing cohortsBased on your institution's response to the predominant calendar system question (B3) on the InstitutionalCharacteristics Header survey component from the IPEDS Fall 2014 data collection, your institution must reportgraduation rates data using a:
Fall Cohort A fall cohort is used by institutions with standard academic terms (semester, trimester, quarter, 4-1-4). A full-year cohort is used by institutions offering primarily occupational/vocational programs and operating on acontinuous basis.
Establishing cohortsNOTE: Reporting using the new race/ethnicity categories is now mandatory. On this screen you will need to revise yourpreloaded 2008 cohort of full-time, first-time degree/certificate-seeking undergraduate students to the new race/ethnicitycategories (if applicable). For information and assistance with this, please visit the IPEDS Race/Ethnicity InformationCenter.MenScreen 1 of 2 Cohort year 2008 Initial cohort Revised cohort
(Column 01)NEW categories:Notes for NEW categories:•Report Hispanic/Latino individuals of any race as Hispanic/Latino•Report race for non-Hispanic/Latino individuals onlyHispanic/Latino 365American Indian or Alaska Native 18Asian 266Black or African American 185Native Hawaiian or Other Pacific Islander 6White 1,639Two or more races 19OLD categories:Black, non-Hispanic 203 American Indian/Alaska Native 22 Asian/Pacific Islander 276 Hispanic 358 White, non-Hispanic 1,643 Categories used in BOTH New and Old:Nonresident alien 14 14Race and ethnicity unknown 81 93Total men 2,597 2,605 WomenScreen 1 of 2 Cohort year 2008 Initial cohort Revised cohort
(Column 01)NEW categories:Notes for NEW categories:•Report Hispanic/Latino individuals of any race as Hispanic/Latino•Report race for non-Hispanic/Latino individuals onlyHispanic/Latino 637American Indian or Alaska Native 29Asian 321Black or African American 427Native Hawaiian or Other Pacific Islander 21White 2,205Two or more races 37OLD categories:Black, non-Hispanic 462 American Indian/Alaska Native 33 Asian/Pacific Islander 361 Hispanic 624 White, non-Hispanic 2,180 Categories used in BOTH New and Old:Nonresident alien 17 18Race and ethnicity unknown 92 94Total women 3,769 3,789

Total men + women 6,366 6,394

Institution: University of Florida (134130)User ID: 88G4434
Section I - Graduation Rates - Establishing cohorts•Incoming students seeking a bachelor's degree should be reported in Column 02. Column 03 will then be generated foryou. Column 03 is meant to include any full-time, first-time entering students who were seeking a degree or certificateother than a bachelor's degree, such as an associate's degree or undergraduate certificate.•If you have no changes to the preloaded data on this screen, click the "Save and Next" button to generate additionalscreens for reporting completers and transfers/exclusions.
Establishing cohorts•Report Hispanic/Latino individuals of any race as Hispanic/Latino•Report race for non-Hispanic/Latino individuals only
MenScreen 2 of 2 Cohort year 2008 Cohort Bachelor's or equivalent
degree-seekingsubcohort
Other degree/certificate-seekingsubcohort
(Cohort minus Bachelor’s or equivalent degree-seeking subcohort)
(Column 01) (Column 02) (Column 03)Nonresident alien 14 14 0Hispanic/Latino 365 365 0American Indian or AlaskaNative
18 18 0
Asian 266 266 0Black or African American 185 185 0Native Hawaiian or OtherPacific Islander
6 6 0
White 1,639 1,639 0Two or more races 19 19 0Race and ethnicity unknown 93 93 0Total men 2,605 2,605 0 WomenScreen 2 of 2 Cohort year 2008 Cohort Bachelor's or equivalent
degree-seekingsubcohort
Other degree/certificate-seekingsubcohort
(Cohort minus Bachelor’s or equivalent degree-seeking subcohort)
(Column 01) (Column 02) (Column 03)Nonresident alien 18 18 0Hispanic/Latino 637 637 0American Indian or AlaskaNative
29 29 0
Asian 321 321 0Black or African American 427 427 0Native Hawaiian or OtherPacific Islander
21 21 0
White 2,205 2,205 0Two or more races 37 37 0Race and ethnicity unknown 94 94 0Total women 3,789 3,789 0 Total men + women 6,394 6,394 0

Institution: University of Florida (134130)User ID: 88G4434
Section II - Graduation Rates - Bachelor's or equivalent degree-seeking subcohort -Completers within 150%•In the columns below, report the status of the bachelor's degree-seeking subcohort of students listed in Column 10.•Of the students in Column 10, those who attained a degree or certificate OTHER THAN A BACHELOR'S DEGREEwithin 150% of the normal time to complete the program as of August 31, 2014 should be reported in either Column 11or 12, depending on the length of the program completed.•Of the students in Column 10, those who attained a bachelor's degree or equivalent within 150% of normal time shouldbe reported in Column 18.
Subcohort of full-time, first-time students seeking a bachelor's or equivalent degree•Report Hispanic/Latino individuals of any race as Hispanic/Latino•Report race for non-Hispanic/Latino individuals only
MenScreen 1 of 3 Cohort year 2008 Bachelor's or
equivalent degree-seeking subcohort
Subcohort students who completed their program within 150%of normal time to completion
Completers ofprograms of less
than 2 academic yrs(or equivalent)
Completers ofprograms of at least 2
but less than 4academic yrs (or
equivalent)
Completers ofbachelor's or
equivalentdegrees
Totalcompleterswithin 150%
(Column 10) (Column 11) (Column 12) (Column 18) (Column 29)Nonresident alien 14 11 11Hispanic/Latino 365 307 307American Indian orAlaska Native
18 11 11
Asian 266 227 227Black or AfricanAmerican
185 131 131
Native Hawaiian orOther PacificIslander
6 6 6
White 1,639 1,401 1,401Two or more races 19 18 18Race and ethnicityunknown
93 77 77
Total men 2,605 0 0 2,189 2,189 WomenScreen 1 of 3 Cohort year 2008 Bachelor's or
equivalent degree-seeking subcohort
Subcohort students who completed their program within 150%of normal time to completion
Completers ofprograms of less
than 2 academic yrs(or equivalent)
Completers ofprograms of at least 2
but less than 4academic yrs (or
equivalent)
Completers ofbachelor's or
equivalentdegrees
Totalcompleterswithin 150%
(Column 10) (Column 11) (Column 12) (Column 18) (Column 29)Nonresident alien 18 13 13Hispanic/Latino 637 576 576American Indian orAlaska Native
29 24 24
Asian 321 287 287Black or AfricanAmerican
427 353 353
Native Hawaiian orOther PacificIslander
21 20 20
White 2,205 2,001 2,001Two or more races 37 34 34Race and ethnicityunknown
94 88 88
Total women 3,789 0 0 3,396 3,396

Total men +women
6,394 0 0 5,585 5,585

Institution: University of Florida (134130)User ID: 88G4434
Section II - Graduation Rates - Bachelor's completers by length of time to degreeThose students in the bachelor's or equivalent degree-seeking subcohort who attained a bachelor's degree or equivalentwithin 150% of normal time to completion, as reported on the previous screen, are listed in Column 18. In Column 19,report the number of these students who earned a bachelor's degree in 4 years. In Column 20, report the number ofthese students who earned a bachelor's degree in 5 years. Column 21 will be calculated for you.
Subcohort of full-time, first-time students seeking a bachelor's or equivalent degree•Report Hispanic/Latino individuals of any race as Hispanic/Latino•Report race for non-Hispanic/Latino individuals only
MenScreen 2 of 3 Cohort year 2008 Bachelor's or equivalent
degree-seeking subcohortCompletedbachelor's
degreeor equivalentwithin 150%
Subcohort students who attained a bachelor'sdegree or equivalent
Completed theprogram in
4 yrs or less
Completed theprogram in
5 yrs
Completed theprogram in
6 yrs (Column 10) (Column 18) (Column 19) (Column 20) (Column 21)Nonresident alien 14 11 7 4 0Hispanic/Latino 365 307 194 95 18American Indian orAlaska Native
18 11 6 4 1
Asian 266 227 153 64 10Black or AfricanAmerican
185 131 81 40 10
Native Hawaiian orOther Pacific Islander
6 6 3 3 0
White 1,639 1,401 926 392 83Two or more races 19 18 15 3 0Race and ethnicityunknown
93 77 57 19 1
Total men 2,605 2,189 1,442 624 123 WomenScreen 2 of 3 Cohort year 2008 Bachelor's or equivalent
degree-seeking subcohortCompletedbachelor's
degreeor equivalentwithin 150%
Subcohort students who attained a bachelor'sdegree or equivalent
Completed theprogram in
4 yrs or less
Completed theprogram in
5 yrs
Completed theprogram in
6 yrs (Column 10) (Column 18) (Column 19) (Column 20) (Column 21)Nonresident alien 18 13 12 1 0Hispanic/Latino 637 576 479 79 18American Indian orAlaska Native
29 24 20 2 2
Asian 321 287 241 39 7Black or AfricanAmerican
427 353 307 36 10
Native Hawaiian orOther Pacific Islander
21 20 19 1 0
White 2,205 2,001 1,668 288 45Two or more races 37 34 26 5 3Race and ethnicityunknown
94 88 75 11 2
Total women 3,789 3,396 2,847 462 87 Total men + women 6,394 5,585 4,289 1,086 210

Institution: University of Florida (134130)User ID: 88G4434
Section II - Graduation Rates - Bachelor's or equivalent degree-seeking subcohort -Transfers/exclusions•In the columns below, report the status of those students in the BACHELOR'S OR EQUIVALENT DEGREE-SEEKINGSUBCOHORT listed in Column 10 who did not complete a program within 150% of normal time to completion.•Report transfers-out who did not complete a program in Column 30. If the mission of your institution includes providingsubstantial preparation for students to enroll in another eligible institution WITHOUT having completed a program, youmust report transfer-out data in Column 30. A school is required to report only on those students that the school knowshave transferred to another eligible institution. A school must document that the student actually transferred. If it is notpart of your mission, you may report transfer-out data if you wish.•Report eligible exclusions from the subcohort in Column 45. The ONLY allowable categories for this column are:Students who died or became permanently disabledStudents who left school to serve in the armed forces (or have been called up to active duty)Students who left school to serve with a foreign aid service of the Federal GovernmentStudents who left school to serve on an official church mission•Column 52 [No longer enrolled] will be calculated for you. This includes students who have dropped out as well asthose who completed in greater than 150% of normal time.•If you do not have any values to report in either Column 30, 45, or 51, you must enter at least one zero in a field on thisscreen to continue.
Subcohort of full-time, first-time students seeking a bachelor's or equivalent degree•Report Hispanic/Latino individuals of any race as Hispanic/Latino•Report race for non-Hispanic/Latino individuals only
MenScreen 3 of 3 Cohort year 2008 Bachelor's or
equivalentdegree-seeking
subcohort
Totalcompleterswithin 150%
Total transfer-outstudents
Totalexclusions
Stillenrolled
No longerenrolled
(Column 10) (Column 29) (Column 30) (Column 45) (Column51)
(Column 52)
Nonresident alien 14 11 0 0 0 3Hispanic/Latino 365 307 17 2 9 30American Indian or AlaskaNative
18 11 3 0 0 4
Asian 266 227 11 1 7 20Black or African American 185 131 9 0 4 41Native Hawaiian or OtherPacific Islander
6 6 0 0 0 0
White 1,639 1,401 60 7 31 140Two or more races 19 18 0 0 1 0Race and ethnicityunknown
93 77 2 0 1 13
Total men 2,605 2,189 102 10 53 251
WomenScreen 3 of 3 Cohort year 2008 Bachelor's or
equivalentdegree-seeking
subcohort
Totalcompleterswithin 150%
Total transfer-outstudents
Totalexclusions
Stillenrolled
No longerenrolled
(Column 10) (Column 29) (Column 30) (Column 45) (Column51)
(Column 52)
Nonresident alien 18 13 0 0 0 5Hispanic/Latino 637 576 22 0 5 34American Indian or AlaskaNative
29 24 3 0 0 2
Asian 321 287 11 0 4 19Black or African American 427 353 19 2 3 50Native Hawaiian or OtherPacific Islander
21 20 0 0 0 1
White 2,205 2,001 66 0 15 123Two or more races 37 34 2 0 0 1Race and ethnicityunknown
94 88 0 0 3 3
Total women 3,789 3,396 123 2 30 238
Total men + women 6,394 5,585 225 12 83 489


Imagedescription.Thesecontext noteswill beposted onthe CollegeNavigator.End of imagedescription.
Institution: University of Florida (134130)User ID: 88G4434
Graduation and transfer-out ratesCalculation of graduation and transfer-out rates
Screen 1 of 2 Cohort year 2008 Graduation rate Transfer-out rateOverall Rates (will be displayed on College Navigator) 88 4Men 84 4Women 90 3 Graduation rates displayed below in bold italics will be displayed on College NavigatorGraduation rates for students pursuing bachelor’s or equivalent degrees 4 year graduation rate 5 year graduation rate 6 year graduation rateMen 56 80 84Women 75 87 90 Total (men and women) 67 84 88Nonresident alien 59 75 75Hispanic/Latino 67 85 88American Indian or Alaska Native 55 68 74Asian 67 85 88Black or African American 64 76 79Native Hawaiian or Other Pacific Islander 81 96 96White 68 85 89Two or more races 73 88 93Race and ethnicity unknown 71 87 88
Do you wish to provide additional context notes?
Yes No
Note that certain information from these worksheets will be displayed on College Navigator, as noted. Youmay use the space below to provide context for these data. These context notes will be posted on the CollegeNavigator website, and should be written to be understood by students and parents.

Institution: University of Florida (134130)User ID: 88G4434
4-year average rates4-year average rates
Screen 2 of 2Men 2005 2006 2007 2008 4-year TotalAdjusted cohort 3,137 2,891 2,648 2,595 11,271Total completers within 150% 2,547 2,354 2,245 2,189 9,335Total transfer-out students 127 113 81 102 423
Women 2005 2006 2007 2008 4-year TotalAdjusted cohort 4,080 3,783 3,792 3,787 15,442Total completers within 150% 3,493 3,327 3,328 3,396 13,544Total transfer-out students 159 126 124 123 532
Total (men and women) 2005 2006 2007 2008 4-year TotalAdjusted cohort 7,217 6,674 6,440 6,382 26,713Total completers within 150% 6,040 5,681 5,573 5,585 22,879Total transfer-out students 286 239 205 225 955 4-year average Student Right-to-Know completion or graduation rate calculation 86   (Total Completers within 150% / Adjusted Cohort) 4-year average Student Right-to-Know transfer-out rate calculation 4   (Total Transfer-out Students / Adjusted Cohort)

Institution: University of Florida (134130)User ID: 88G4434
Prepared by This survey component was prepared by: Keyholder SFA Contact HR Contact
Finance Contact Academic Library Contact Other
Name: Marie Zeglen Email: [email protected] How long did it take to prepare thissurvey component?
8hours minutes
The name of the preparer is being collected so that we can follow up with the appropriate person in the event that thereare questions concerning the data. The Keyholder will be copied on all email correspondence to other preparers.The time it took to prepare this component is being collected so that we can continue to improve our estimate of thereporting burden associated with IPEDS. Please include in your estimate the time it took for you to review instructions,query and search data sources, complete and review the component, and submit the data through the Data CollectionSystem.Thank you for your assistance.

Institution: University of Florida (134130) User ID: 88G4434Summary
2014 IPEDS Graduation Rate Component Data Summary
IPEDS collects important information regarding your institution. All data reported in IPEDSsurvey components become available in the IPEDS Data Center and appear as aggregated datain various Department of Education reports. Additionally, some of the reported data appearsspecifically for your institution through the College Navigator website and is included in yourinstitution’s Data Feedback Report (DFR). The purpose of this summary is to provide you anopportunity to view some of the data that, when accepted through the IPEDS quality controlprocess, will appear on the College Navigator website and/or your DFR. College Navigator isupdated approximately three months after the data collection period closes and Data FeedbackReports will be available through the Data Center and sent to your institution’s CEO inNovember 2015.
Please review your data for accuracy. If you have questions about the data displayed belowafter reviewing the data reported on the survey screens, please contact the IPEDS Help Desk at:1-877-225-2568 or [email protected].
Overall Graduation RateGraduation Rate 88%
Total number of students in the Adjusted Cohort 6,382
Total number of completers within 150% of normaltime 5,585
Overall Transfer-out RateTransfer-out Rate 4%
Total number of students in the Adjusted Cohort 6,382
Total number of transfers-out within 150% ofnormal time 225
Graduation Rate for students pursuing Bachelor’s DegreesGraduation Rate for Bachelor’s Cohort 88%
Total number of students in the Adjusted Cohort 6,382
Total number of bachelor’s degree completerswithin 150% of normal time 5,585

Institution: University of Florida (134130) User ID: 88G4434Edit Report
Graduation Rates
University of Florida (134130)
Source Description Severity Resolved OptionsScreen: Cohort, part 2
PerformEdits
Your institution indicated that it offered otherundergraduate degrees or certificates besides abachelor’s or equivalent degree in the IC Header survey,but you did not report an Other degree/certificate-seeking subcohort in Section I of this survey. Pleasecorrect your data or explain. (Error #4210)
Explanation Yes
Reason: UF awards AA degrees but students do not enter seeking the AA. It is awarded on the way to the baccalaureate.Related
Screens:Cohort, part 2

Graduation Rates 200 2014-15Institution: University of Florida (134130)User ID: 88G4434
OverviewGraduation Rates 200 Overview
Welcome to the IPEDS Graduation Rates 200 (GR200) survey component. The GR200 component is a furtherextension of the traditional Graduation Rates (GR) component which carries forward 100% and 150% graduationrates data previously reported in the GR component and requests information on any additional completers andexclusions from the cohort between 151% and 200% of normal time for students to complete all requirements of theirprogram of study. This information is collected to assist institutions with complying with the requirements of the HigherEducation Act, as amended.
Data Reporting Reminders The reporting of data for the 200% completion period is not cumulative. Respondents are ONLY asked to report datafor the time period between 151% and 200% of normal time to completion.
Resources:The survey materials package for this component can be downloaded using the following link: Survey Materials
To access your prior year data submission for this component: Reported Data
If you have questions about completing this survey, please contact the IPEDS Help Desk at 1-877-225-2568.

Imagedescription.Thesecontext noteswill beposted onthe CollegeNavigator.End of imagedescription.
Institution: University of Florida (134130)User ID: 88G4434
Completers within 200%For 4-year institutions, report on the 2006 cohort of full-time, first-time bachelor's or equivalent degree-seekingstudents.Information for this cohort was originally reported by your institution in the 2012-13 IPEDS Graduation Ratessurvey component. The data on lines 1-5 are preloaded based on the information provided.
Graduation rates1 Revised cohort 6,686 2 Exclusions within 150% 12 3 Adjusted cohort 150% 6,674 4 Number of students in the cohort who completed a bachelor’s degree within 100% of
normal time to completion 4,294 64
5 Number of students in the cohort who completed a bachelor’s degree within 150% ofnormal time to completion
5,681 85
6 Additional exclusions (between 151% and 200% of normal time) 1 7 Adjusted cohort 200% (line 3 - line 6) 6,673 8 Number of students in the cohort who completed a bachelor’s degree between 151% and
200% of normal time to completion 107
9 Still enrolled as of 200% of normal time to completion 18 10 Total completers within 200% of normal time (line 5 + line 8) 5,788 87
You may use the space below to provide context for the data you've reported above. These context noteswill be posted on the College Navigator website, and should be written to be understood by students andparents.

Institution: University of Florida (134130)User ID: 88G4434
Prepared by This survey component was prepared by: Keyholder SFA Contact HR Contact
Finance Contact Academic Library Contact Other
Name: Email: How long did it take to prepare thissurvey component?
hours minutes
The name of the preparer is being collected so that we can follow up with the appropriate person in the event that thereare questions concerning the data. The Keyholder will be copied on all email correspondence to other preparers.The time it took to prepare this component is being collected so that we can continue to improve our estimate of thereporting burden associated with IPEDS. Please include in your estimate the time it took for you to review instructions,query and search data sources, complete and review the component, and submit the data through the Data CollectionSystem.Thank you for your assistance.

Institution: University of Florida (134130) User ID: 88G4434Summary
2014 IPEDS Graduation Rate 200% Component Data Summary
IPEDS collects important information regarding your institution. All data reported in IPEDSsurvey components become available in the IPEDS Data Center and appear as aggregated datain various Department of Education reports. Additionally, some of the reported data appearsspecifically for your institution through the College Navigator website and is included in yourinstitution’s Data Feedback Report (DFR). The purpose of this summary is to provide you anopportunity to view some of the data that, when accepted through the IPEDS quality controlprocess, will appear on the College Navigator website and/or your DFR. College Navigator isupdated approximately three months after the data collection period closes and Data FeedbackReports will be available through the Data Center and sent to your institution’s CEO inNovember 2015.
Please review your data for accuracy. If you have questions about the data displayed belowafter reviewing the data reported on the survey screens, please contact the IPEDS Help Desk at:1-877-225-2568 or [email protected].
Bachelor's degree graduation rateswithin 4 years, 6 years, and 8 years – Cohort year 2006
4-year graduation rate 64%
6-year graduation rate 85%
8-year graduation rate 87%

Institution: University of Florida (134130) User ID: 88G4434Edit Report
Graduation Rates 200
University of Florida (134130)
There are no errors for the selected survey and institution.

Student Financial Aid 2014-15Institution: University of Florida (134130)User ID: 88G4434
OverviewIPEDS Student Financial Aid Component Overview
Public Academic Reporters Welcome to the Student Financial Aid (SFA) component. The purpose of the SFA component is to collect informationabout financial aid provided to various groups of undergraduate students and military/veteran educational benefits forall students at your institution.
Changes to This Year’s SFA Component• New questions on military/veteran/eligible dependent students receiving benefits have been
added. Total number and amount will be asked for both undergraduate and graduate students.Please work with your institutional representative who certifies such benefits. They may not beassociated with the student financial aid office.
Data Reporting Reminders
Undergraduate Student GroupsYou will be asked to report information for different groups of students.
• Group 1: All undergraduate students• Group 2: Of Group 1, full-time, first-time degree/certificate-seeking students• Group 3: Of Group 2, students who paid the in-state/in-district tuition rate and were awarded
any grant/scholarship aid from the federal government, state/local government, or theinstitution
• Group 4: Of Group 2, students who paid the in-state/in-district tuition rate and were awardedany Title IV federal student aid
COA RevisionsRevisions to Cost of Attendance used to calculate the net price of attendance can be made in this component.
Consult the instructions and screens to make sure you are reporting the correct aid amounts for the correct groups ofstudents.
College Affordability and Transparency ListsNet price amounts calculated in SFA will be used to populate the Department’s College Affordability and Transparencylists.
Interactive Edits and Error MessagesSFA contains interactive edits that will check for blank fields, invalid values, or values that fall outside expectedranges. Some error messages will require you to confirm or explain the values that you entered. Some errormessages are fatal and will require you to contact the IPEDS Help Desk at 1-877-225-2568 for resolution.
Context BoxesYou will find optional text boxes throughout SFA. Context boxes allow you to provide more information about the datayou enter. Some of these context boxes may be made available to the public on College Navigator, so make sure thatthe information you enter can be understood easily by students, parents, and the general public.
Resources
To download the survey materials for this component: Survey Materials
To access your prior year data submission for this component: Reported Data

Institution: University of Florida (134130)User ID: 88G4434
Section 1: Part APart A - Establish Your GroupsPart A establishes the number of students in various groups. Note that the numbers on this screen will be carriedforward to other parts of the Student Financial Aid component.
In the fields below, report the number of students in each of the following groups. Fall
2013YOUR PRIORYEAR DATA
Fall 201201Group 1
All undergraduate students 33,168 32,776
02Group 2Of those in Group 1, those who are full-time, first-time degree/certificate-seeking
6,348 6,273
02a Of those in Group 2, those who were awarded any Federal Work Study, loans tostudents, or grant or scholarship aid from the federal government, state/localgovernment, the institution, or other sources known to the institution
6,115 6,022
02b Of those in Group 2, those who were awarded any loans to students or grant orscholarship aid from the federal government, state/local government, or the institution
6,081 6,001
03Group 3Of those in Group 2, those who paid the in-state or in-district tuition rate and were awardedgrant or scholarship aid from the federal government, state/local government, or theinstitution
5,795 5,762
04Group 4Of those in Group 2, those who paid the in-state or in-district tuition rate and were awardedany Title IV federal student aid
2,538 2,709

Imagedescription.Thesecontext notesmay beposted onthe CollegeNavigatorwebsite. Endof imagedescription.
Institution: University of Florida (134130)User ID: 88G4434
Section 1: Part BPart B - Enter Information About Group 1Part B includes information about Group 1. Group 1 students are all undergraduate students enrolled in Fall 2013.For this part, report:
For These Students The Following Type(s) of Aid Awarded in This Period• All undergraduate students
enrolled in Fall 2013• Grant or scholarship aid
from the federalgovernment
• Grant or scholarship aidfrom state/localgovernment
• Grant or scholarship aidfrom the institution
• Grant or scholarship aidfrom other sources knownto the institution
• Loans to students fromthe federal government
• Any time during academicyear 2013-14
In the fields below, report the number of Group 1 students and the total amount of aid awarded to thesestudents for each type of aid. Information from Part A: Fall 2013Group 1All undergraduate students(This number is carried forward from Part A, Line 01.)
33,168
Aid Type 2013-14
Number ofGroup 1
students whowere awarded
aid
Percentage ofGroup 1 students
who were awardedaid
Total amount of aidawarded to Group
1 students
Average amountof aid awarded
to Group 1students
01 Grant or scholarship aid from thefederal government, state/localgovernment, the institution, and othersources known to the institution
29,544 89 178,745,056 6,050
02 Pell grants 10,453 32 44,929,431 4,29803 Federal student loans 10,561 32 69,222,199 6,555
You may use the space below to provide context for data you've reported above. These context notes maybe posted on the College Navigator website and should be written to be understood by students and parents.

Institution: University of Florida (134130)User ID: 88G4434
Section 1: Part C, Page 1Part C, Page 1 - Enter Information about Group 2Part C includes information about Group 2. Group 2 students are all full-time, first-time degree/certificate-seekingundergraduate students enrolled in Fall 2013. In the fields below, report the number of Group 2 students paying in-district, in-state, and out-of-state tuitionrates. If your institution does not offer different rates, report all students as paying in-state tuition rates. Information from Part A: Fall 2013Group 2Full-time, first-time degree/certificate-seekingundergraduates(This number is carried forward from Part A, Line 02)
6,348
Group 2 students: YOUR PRIOR YEARDATA
Fall 2013 Fall 2012Number of Group
2 studentsPercentage of
Group 2 studentsPercentage of
Group 2 students01 01a paying in-district tuition rates 0 0 0 01b paying in-state tuition rates 5,971 94 95 01c paying out-of-state tuition rates 377 6 5 01d Unknown (calculated value)
This value is calculated using the followingformula: [A02-(C01a+C01b+C01c)]
0 0 0

Institution: University of Florida (134130)User ID: 88G4434
Section 1: Part C, Page 2Part C, Page 2 - Enter Information about Group 2Part C includes financial aid information about Group 2. Group 2 students are all full-time, first-time degree/certificate-seeking undergraduate students enrolled in Fall 2013.For this part, report:
For These Students The Following Type(s) of Aid Awarded in This Period• Full-time, first-time degree/certificate-
seeking undergraduate studentsenrolled in Fall 2013
• Grant or scholarshipaid from the federalgovernment
• Grant or scholarshipaid from state/localgovernment
• Grant or scholarshipaid from theinstitution
• Loans to studentsfrom the federalgovernment and fromother sources,including private orother loans
• Do not include grantor scholarship aidfrom private or othersources
• Do not include PLUSloans or loans madeto anyone other thanthe student
• Any time duringacademic year2013-14
• For programreporters, this isthe aid yearperiod from July1, 2013 throughJune 30, 2014.
In the fields below, report the number of Group 2 students and the total amount of aid awarded to thesestudents for each type of aid. Enter unduplicated student counts within a category (e.g., Pell grants). However,a student can appear in more than one aid category. Information from Part A: Fall 2013Group 2Full-time, first-time degree/certificate-seeking undergraduates(This number is carried forward from Part A, Line 02)
6,348
Group 2aOf those in Group 2, those who were awarded any Federal Work Study,loans to students, or grant or scholarship aid from the federalgovernment, state/local government, the institution, or other sourcesknown to the institution(This number is carried forward from Part A, Line 02a)
6,115
Group 2bOf those in Group 2, those who were awarded any loans to students orgrant or scholarship aid from the federal government, state/localgovernment, or the institution(This number is carried forward from Part A, Line 02b)
6,081
Group 3Of those in Group 2, those who were awarded grant or scholarship aidfrom the federal government, state/local government, or the institution
5,795
Aid Type YOUR PRIORYEAR DATA
Fall 2013 Fall 2012Number of
Group 2studentswho were
awarded aid
Percentage ofGroup 2
students whowere awarded
aid
Total amountof aid awarded
to Group 2students
Averageamount of
aid awardedto Group 2students
Averageamount of
aid awardedto Group 2students
01Grants or scholarships from thefederal government, state/localgovernment, or the institution
6,026 95 33,726,015 5,597 5,610
02 Federal grants 1,772 28 8,580,040 4,842 4,722 02a Pell grants 1,749 28 7,844,706 4,485 4,453 02b Other federal grants 581 9 735,334 1,266 919

Imagedescription.Thesecontext notesmay beposted onthe CollegeNavigator.End of imagedescription.
03 State/local government grants orscholarships(grants/scholarships/waivers)
5,764 91 16,763,160 2,908 2,841
04 Institutional grants or scholarships(scholarships/fellowships)
1,870 29 8,382,815 4,483 4,194
05Loans to students 1,697 27 9,933,409 5,854 5,684 05a Federal loans 1,697 27 8,907,809 5,249 5,278 05b Other loans (including
private loans) 92 1 1,025,600 11,148 10,262
You may use the space below to provide context for the data you've reported above. These context notesmay be posted on the College Navigator website and should be written to be understood by students andparents. For example, institutions may report here other sources of private aid not included in the categoriesabove.

Institution: University of Florida (134130)User ID: 88G4434
Section 1: Comparison ChartComparison Chart
Based on the information reported on the previous screens for Group 1 (all undergraduates) and Group 2 (full-time, first-time degree/certificate-seeking undergraduates), this comparison chart seeks to help institutions check their reporteddata. Assuming that the information on Groups 1 and 2 are correct, then the calculated fields for ‘All OtherUndergraduates’ should be the balance (Group 1 minus Group 2). If the balance does not check with your institution’scalculations, please correct your reported numbers for Groups 1 and 2 before moving forward with the completion of theSFA survey component.
Note: Data for the 'All Other Undergraduates' will appear in the IPEDS Data Center for data users, but not in CollegeNavigator. Number of
students Pell grants Federal Student Loans
01 Group 1 (all undergraduates) 33,168 02 Number of students who were awarded
aid 10,453 10,561
03 Percentage who were awarded aid 32 3204 Total amount of aid awarded 44,929,431 69,222,19905 Average amount of aid awarded 4,298 6,55506 Group 2 (Full-time first-time
undergraduates) 6,348
07 Number of students who were awardedaid
1,749 1,697
08 Percentage who were awarded aid 28 2709 Total amount of aid awarded 7,844,706 8,907,80910 Average amount of aid awarded 4,485 5,24911 All other undergraduates
(Line 01 - Line 06) 26,820
12 Number of students who were awardedaid(Line 02 - Line 07)
8,704 8,864
13 Percentage who were awarded aid(Line 12 / Line 11)
32 33
14 Total amount of aid awarded(Line 04 - Line 09)
37,084,725 60,314,390
15 Average amount of aid awarded(Line 14 / Line 12)
4,261 6,804

Institution: University of Florida (134130)User ID: 88G4434
Section 1: Cost of AttendanceCost of attendance for full-time, first-time undergraduate students:Please enter the amounts requested below. These data will be made available to the public on College Navigator. Ifyour institution participates in any Title IV programs (Pell, Stafford, etc.), you must complete all information. Estimates ofexpenses for books and supplies, room and board, and other expenses are those from the Cost of Attendance reportused by the financial aid office in determining financial need. Please talk to your financial aid office to get thesenumbers, to ensure that you are reporting correctly.These numbers are carried forward from Institutional Characteristics and should only be changed if an error was madein the reporting.Charges for full academic year 2011-12 2012-13 2013-14Published tuition and required fees: In-district Tuition 4,060 4,425 4,477 Required fees 1,597 1,718 1,786 Tuition + fees total 5,657 6,143 6,263 In-state Tuition 4,060 4,425 4,477 Required fees 1,597 1,718 1,786 Tuition + fees total 5,657 6,143 6,263 Out-of-state Tuition 25,276 25,641 25,694 Required fees 2,658 2,779 2,847 Tuition + fees total 27,934 28,420 28,541 Books and supplies 1,070 1,080 1,080On-campus: Room and board 8,800 9,370 9,520 Other expenses 4,260 3,960 3,350 Room and board and other expenses 13,060 13,330 12,870Off-campus (not with family): Room and board 8,800 9,370 9,520 Other expenses 4,260 3,960 3,350 Room and board and other expenses 13,060 13,330 12,870Off-campus (with family): Other expenses 4,260 3,960 3,350
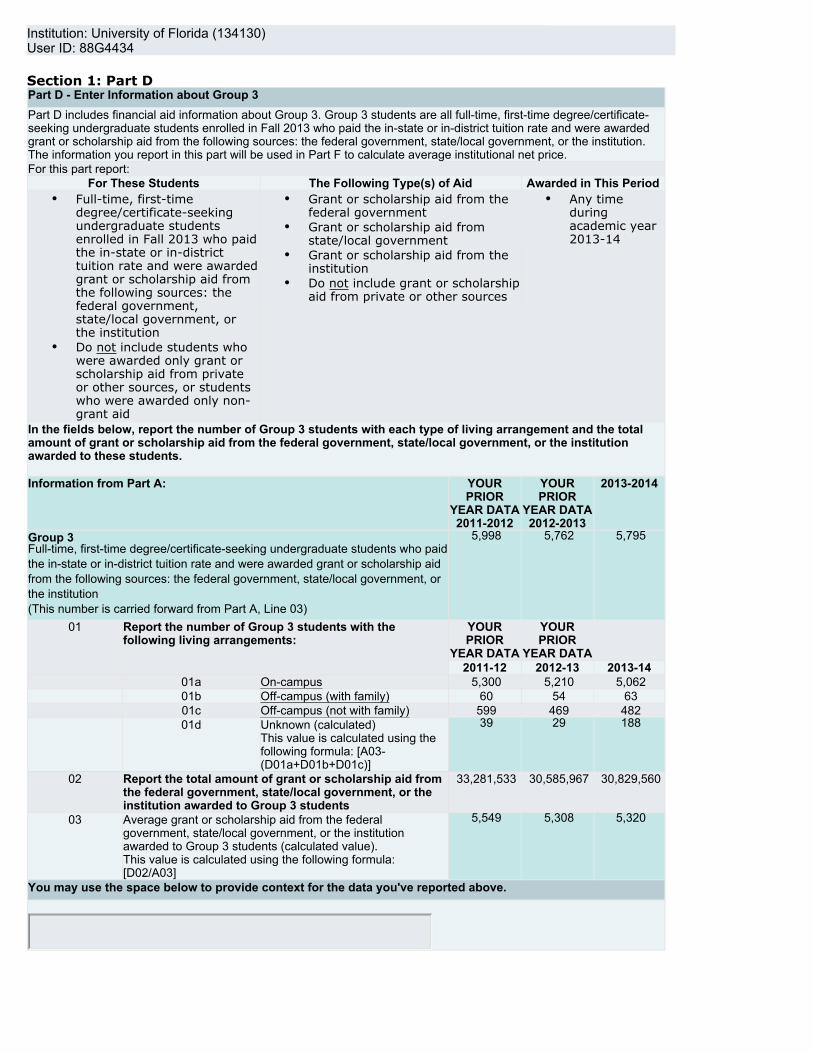
Institution: University of Florida (134130)User ID: 88G4434
Section 1: Part DPart D - Enter Information about Group 3Part D includes financial aid information about Group 3. Group 3 students are all full-time, first-time degree/certificate-seeking undergraduate students enrolled in Fall 2013 who paid the in-state or in-district tuition rate and were awardedgrant or scholarship aid from the following sources: the federal government, state/local government, or the institution.The information you report in this part will be used in Part F to calculate average institutional net price.For this part report:
For These Students The Following Type(s) of Aid Awarded in This Period• Full-time, first-time
degree/certificate-seekingundergraduate studentsenrolled in Fall 2013 who paidthe in-state or in-districttuition rate and were awardedgrant or scholarship aid fromthe following sources: thefederal government,state/local government, orthe institution
• Do not include students whowere awarded only grant orscholarship aid from privateor other sources, or studentswho were awarded only non-grant aid
• Grant or scholarship aid from thefederal government
• Grant or scholarship aid fromstate/local government
• Grant or scholarship aid from theinstitution
• Do not include grant or scholarshipaid from private or other sources
• Any timeduringacademic year2013-14
In the fields below, report the number of Group 3 students with each type of living arrangement and the totalamount of grant or scholarship aid from the federal government, state/local government, or the institutionawarded to these students. Information from Part A: YOUR
PRIORYEAR DATA2011-2012
YOURPRIOR
YEAR DATA2012-2013
2013-2014
Group 3Full-time, first-time degree/certificate-seeking undergraduate students who paidthe in-state or in-district tuition rate and were awarded grant or scholarship aidfrom the following sources: the federal government, state/local government, orthe institution(This number is carried forward from Part A, Line 03)
5,998 5,762 5,795
01 Report the number of Group 3 students with thefollowing living arrangements:
YOURPRIOR
YEAR DATA
YOURPRIOR
YEAR DATA
2011-12 2012-13 2013-14 01a On-campus 5,300 5,210 5,062 01b Off-campus (with family) 60 54 63 01c Off-campus (not with family) 599 469 482 01d Unknown (calculated)
This value is calculated using thefollowing formula: [A03-(D01a+D01b+D01c)]
39 29 188
02 Report the total amount of grant or scholarship aid fromthe federal government, state/local government, or theinstitution awarded to Group 3 students
33,281,533 30,585,967 30,829,560
03 Average grant or scholarship aid from the federalgovernment, state/local government, or the institutionawarded to Group 3 students (calculated value).This value is calculated using the following formula:[D02/A03]
5,549 5,308 5,320
You may use the space below to provide context for the data you've reported above.

Institution: University of Florida (134130)User ID: 88G4434
Section 1: Part EPart E – Enter Information about Group 4Part E includes financial aid information about Group 4. Group 4 students are all full-time, first-time degree/certificate-seeking undergraduate students enrolled in Fall 2013 who paid the in-state or in-district tuition rate and were awardedany Title IV federal student aid, including federal grants or federal student loans. The information you report in this partwill be used in Part G to calculate average institutional net price by income level.For this part, report:
For These Students The Following Type(s) of Aid Awarded in This Period• Full-time, first-time
degree/certificate-seekingundergraduate studentsenrolled in Fall 2013 whopaid the in-state or in-district tuition rate andwere awarded any TitleIV federal student aid
• Grant or scholarship aid from:◦ federal government◦ state/local government◦ institution
• Do not include:◦ grant or scholarship aid
from private or othersources
◦ loan amounts◦ Federal Work Study
amounts
• Any time duringacademic year 2013-14
In the fields below, report the number of Group 4 students with each type of living arrangement and the totalamount of grant or scholarship aid from the federal government, state/local government, or the institutionawarded to these students by income level. Information from Part A: 2011-12 2012-13 2013-14Group 4Full-time, first-time degree/certificate-seeking undergraduatestudents who paid the in-state or in-district tuition rate and wereawarded any Title IV federal student aid(This number is carried forward from Part A, Line 04)
2,946 2,709 2,538
01 Report the number of Group 4 students withthe following living arrangements:
YOUR PRIORYEAR DATA
YOUR PRIORYEAR DATA
2011-12 2012-13 2013-14 01a On-campus 2,625 2,450 2,258 01b Off-campus (with family) 34 28 34 01c Off-campus (not with family) 287 231 246 01d Unknown (calculated)
This value is calculated usingthe formula: [A04-(E01a+E01b+E01c)]
0 0 0
Number ofstudentswho wereawardedany Title
IV aid(Group 4)
Of those inColumn 1, thenumber who
were awardedany grant or
scholarship aidfrom thefollowing
sources: thefederal
government,state/local
government, orthe institution
Of those inColumn 1, the
total amount ofgrant or
scholarship aidawarded fromthe followingsources: the
federalgovernment,
state/localgovernment, orthe institution
Average amountof grant or
scholarship aidawarded to
Group 4students fromthe followingsources: the
federalgovernment,
state/localgovernment, orthe institution
2011-12 Col. 1 Col. 2 Col. 3 Col. 4
02 Income level 02a $0-30,000 453 453 5,478,416 12,094 02b $30,001-48,000 366 366 4,246,511 11,602 02c $48,001-75,000 531 531 6,014,285 11,326 02d $75,001-110,000 496 496 3,686,095 7,432 02e $110,001 and
more 1,100 1,092 4,186,576 3,806
02f Total all incomelevels
2,946 2,938 23,611,883 8,015
2012-13 Col. 1 Col. 2 Col. 3 Col. 4
03 Income level

03a $0-30,000 380 380 4,690,964 12,345 03b $30,001-48,000 326 326 3,908,606 11,990 03c $48,001-75,000 464 464 5,200,814 11,209 03d $75,001-110,000 460 460 3,705,922 8,056 03e $110,001 and
more 1,079 1,054 3,823,723 3,544
03f Total all incomelevels
2,709 2,684 21,330,029 7,874
2013-14 Col. 1 Col. 2 Col. 3 Col. 4
04 Income level 04a $0-30,000 381 381 4,906,642 12,878
04b $30,001-48,000 278 278 3,474,429 12,498 04c $48,001-75,000 409 409 4,791,453 11,715 04d $75,001-110,000 476 476 4,143,050 8,704 04e $110,001 and
more 994 971 3,768,071 3,791
04f Total all incomelevels
2,538 2,515 21,083,645 8,307
You may use the space below to provide context for the data you've reported above.

Imagedescription.Thesecontext notesmay beposted onthe CollegeNavigator.End of imagedescription.
Institution: University of Florida (134130)User ID: 88G4434
Section 1: Part FPart F – Net Price Calculation for Group 3The following net price calculation is based on information that your institution reported in the InstitutionalCharacteristics component and the Student Financial Aid component. For more information about the data yourinstitution reported in the Institutional Characteristics component, please contact your institution’s IPEDS Keyholder.
YOUR PRIORYEAR DATA
YOUR PRIORYEAR DATA
2011-12 2012-13
2013-14
Components of cost of attendance 01 Published tuition and required fees (lower of in-district or in
-state) 5,657 6,143 6,263
02 Books and supplies 1,070 1,080 1,08003 Room and board and other expenses by living
arrangement
03a On-campus 13,060 13,330 12,870 03b Off-campus (with
family) 4,260 3,960 3,350
03c Off-campus (not withfamily)
13,060 13,330 12,870
04 Number of Group 3 students by living arrangement 04a On-campus 5,300 5,210 5,062 04b Off-campus (with
family) 60 54 63
04c Off-campus (not withfamily)
599 469 482
04d Unknown 39 29 18805 Weighted average for room and board and other
expenses by living arrangement (excluding unknownvalues)See instructions for the formula for this calculation
12,971 13,242 12,763
06 Total cost of attendanceThis value is calculated using the following formula:[F01+F02+F05]
19,698 20,465 20,106
07 Average amount of grant or scholarship aid awardedto Group 3 students from the following sources: thefederal government, state/local government, and theinstitution
5,549 5,308 5,320
08 Average institutional net price for Group 3 studentsThis value is calculated using the following formula: [F06-F07]
14,149 15,157 14,786
As required by the Higher Education Opportunity Act of 2008, these amounts will be posted on the U.S. Department ofEducation’s College Navigator website and used in the U.S. Department of Education’s College Affordability andTransparency Lists.
Do you wish to provide additional context notes?
Yes No
You may use the space below to provide context for these data. These context notes may be posted on theCollege Navigator website and should be written to be understood by students and parents.

Imagedescription.Thesecontext notesmay beposted onthe CollegeNavigator.End of imagedescription.
Institution: University of Florida (134130)User ID: 88G4434
Section 1: Part GPart G – Net Price Calculation for Group 4The following net price calculation is based on information that your institution reported in the InstitutionalCharacteristics component and the Student Financial Aid component. For more information about the data yourinstitution reported in the Institutional Characteristics component, please contact your institution’s IPEDS Keyholder.
YOUR PRIORYEAR DATA
YOUR PRIORYEAR DATA
2011-12 2012-13
2013-14
Components of cost of attendance 01 Published tuition and required fees (lower of in-district or in-
state) 5,657 6,143 6,263
02 Books and supplies 1,070 1,080 1,08003 Room and board and other expenses by living
arrangement
03a On-campus 13,060 13,330 12,870 03b Off-campus (with family) 4,260 3,960 3,350 03c Off-campus (not with family) 13,060 13,330 12,87004 Number of Group 4 students by living arrangement
04a On-campus 2,625 2,450 2,258 04b Off-campus (with family) 34 28 34 04c Off-campus (not with family) 287 231 246 04d Unknown 0 0 005 Weighted average for room and board and other
expenses by living arrangement (excluding unknownvalues)See instructions for the formula for this calculation
12,958 13,233 12,742
06 Total cost of attendance by income levelThis value is calculated using the following formula:[G01+G02+G05]
19,685 20,456 20,085
07 Average amount of grant or scholarship aid awarded toGroup 4 students from the following sources: the federalgovernment, state/local government, and the institution
8,015 7,874 8,307
07a $0-30,000 12,094 12,345 12,878 07b $30,001-48,000 11,602 11,990 12,498 07c $48,001-75,000 11,326 11,209 11,715 07d $75,001-110,000 7,432 8,056 8,704 07e $110,001 and more 3,806 3,544 3,79108 Average institutional net price for Group 4 students
This value is calculated using the following formula: [G06-G07]
08a $0-30,000 7,591 8,111 7,207 08b $30,001-48,000 8,083 8,466 7,587 08c $48,001-75,000 8,359 9,247 8,370 08d $75,001-110,000 12,253 12,400 11,381 08e $110,001 and more 15,879 16,912 16,294As required by the Higher Education Opportunity Act of 2008, these amounts will be posted on the U.S. Department ofEducation’s College Navigator website.
Do you wish to provide additional context notes?
Yes No
You may use the space below to provide context for these data. These context notes may be posted on theCollege Navigator website and should be written to be understood by students and parents.

Institution: University of Florida (134130)User ID: 88G4434
Section 2: Military Servicemembers and Veteran's BenefitsSection 2: Military Servicemembers and Veteran's BenefitsIMPORTANT NOTE: Report for July 1, 2013-June 30, 2014
• Report the total number of student recipients and the total dollar amounts for each program.• Student recipients can also include eligible spouse or dependents.• Consult with your campus certifying official, who may not be in the student financial aid office.• For Post-9/11 GI Bill Benefits, do not include the matching institutional aid provided through the
Yellow Ribbon Program if your school participated.• Information reported to IPEDS is only what is known to the institution. Do not report benefits
that were not awarded/certified through the institution.• Enter zero (0) if your institution did not have beneficiaries for that student level or program.
Please do not leave a cell blank.Type of benefit/assistance Number of students
receiving benefits/assistanceTotal dollar amount of
benefits/assistance awardedthrough the institution
Post-9/11 GI Bill BenefitsUndergraduate students 318 1,465,638Graduate students 181 2,081,044Total 499 3,546,682 Department of Defense Tuition Assistance ProgramUndergraduate students 22 48,828Graduate students 70 262,066Total 92 310,894

Institution: University of Florida (134130)User ID: 88G4434
Prepared by This survey component was prepared by: Keyholder SFA Contact HR Contact
Finance Contact Academic Library Contact Other
Name: Marie Zeglen Email: [email protected] How long did it take to prepare thissurvey component?
13hours 1minutes
The name of the preparer is being collected so that we can follow up with the appropriate person in the event that thereare questions concerning the data. The Keyholder will be copied on all email correspondence to other preparers.The time it took to prepare this component is being collected so that we can continue to improve our estimate of thereporting burden associated with IPEDS. Please include in your estimate the time it took for you to review instructions,query and search data sources, complete and review the component, and submit the data through the Data CollectionSystem.Thank you for your assistance.

Institution: University of Florida (134130) User ID: 88G4434Summary
IPEDS Student Financial Aid (SFA) Survey Summary
IPEDS collects important information regarding your institution. All data reported in IPEDSsurvey components become available in the IPEDS Data Center and appear as aggregated datain various Department of Education reports. Additionally, some of the reported data appearsspecifically for your institution through the College Navigator website and is included in yourinstitution’s Data Feedback Report (DFR). The purpose of this summary is to provide you anopportunity to view some of the data that, when accepted through the IPEDS quality controlprocess, will appear on the College Navigator website and/or your DFR. College Navigator isupdated approximately three months after the data collection period closes and Data FeedbackReports will be available through the Data Center and sent to your institution’s CEO inNovember 2015.
Please review your data for accuracy. If you have questions about the data displayed belowafter reviewing the data reported on the survey screens, please contact the IPEDS Help Desk at:1-877-225-2568 or [email protected].
Total grant aid received by all undergraduate students $178,745,056
Number of undergraduate students who received a Pell Grant 10,453
Percentage of FTFT students receiving any financial aid 96%
Percentage of FTFTstudents receiving grantaid by type
Average amount ofgrant aid received bytype
Total 95% $5,597
Federal Government 28% $4,842
Pell 28% $4,485
Other Federal 9% $1,266
State/Local Government 91% $2,908
Institutional 29% $4,483
Percentage of FTFTstudents receiving loansby type
Average amount ofloans received by type
Total 27% $5,854
Federal 27% $5,249
Non-federal 1% $11,148
Average net price for FTFT students who receive grant aid $14,786
Average net price for FTFT students who receive Title IV federal studentaid
$0 – 30,000 $7,207
$30,001 – 48,000 $7,587
$48,001 – 75,000 $8,370
$75,001 – 110,000 $11,381
$110,001 and more $16,294
Military Servicemembers and Veteran's Benefits Number of
students receivingbenefits/assistance
Total dollaramount of
benefits/assistanceawarded through
the institution
Post-9/11 GI Bill Benefits
Undergraduate students 318 $1,465,638
Graduate students 181 $2,081,044
Total 499 $3,546,682
Department of Defense Tuition Assistance Program
Undergraduate students 22 $48,828
Graduate students 70 $262,066

Total 92 $310,894

Institution: University of Florida (134130) User ID: 88G4434Edit Report
Student Financial Aid
University of Florida (134130)
Source Description Severity Resolved OptionsScreen: Part C, Page 2 - Enter Information about Group 2
ScreenEntry
The average amount of this type of aid awarded to Group 2students is outside the expected range of between 736 and1,102 when compared with the prior year value. Please checkthe number of students and the total amount of aid awarded tothese students, and correct or explain the discrepant values.(Error #7147)
Explanation Yes
Reason: We have reviewed the files for the awards made and the reported values for 2013-14 are accurate. There are a numberof factors that contributed to the increase. The primary factor was the supplemental awarding of federal grant funds toeligible Group 2 students.

Finance 2014-15
Institution: University of Florida (134130)User ID: 88G4433
OverviewFinance Overview Purpose The purpose of the IPEDS Finance component is to collect basic financial information from itemsassociated with the institution's General Purpose Financial Statements.
There are changes made to the 2014-15 Finance data collection from the 2013-14 collection. Thefinance form for private for-profit schools have been revised to make it more comparable with thefinance public and private not-for-profit forms.
Resources:To download the survey materials for this component: Survey Materials
To access your prior year data submission for this component: Reported Data
If you have questions about completing this survey, please contact the IPEDS Help Desk at 1-877-225-2568.

Institution: University of Florida (134130)User ID: 88G4433
Finance - Public institutionsReporting StandardPlease indicate which reporting standards are used to prepare your financial statements: GASB (Governmental Accounting Standards Board), using standards of GASB 34 & 35 FASB (Financial Accounting Standards Board)Please consult your business officer for the correct response before saving this screen. Yourresponse to this question will determine the forms you will receive for reporting finance data.

Institution: University of Florida (134130)User ID: 88G4433
Finance - Public institutionsGeneral InformationGASB-Reporting Institutions (aligned form)To the extent possible, the finance data requested in this report should be provided from yourinstitution's audited General Purpose Financial Statements (GPFS). Please refer to the instructionsspecific to each screen of the survey for details and references.1. Fiscal Year CalendarThis report covers financial activities for the 12-month fiscal year: (The fiscal year reportedshould be the most recent fiscal year ending before October 1, 2014.)Beginning: month/year (MMYYYY) Month: 7 Year: 2013
And ending: month/year (MMYYYY) Month: 6 Year: 2014
2. Audit OpinionDid your institution receive an unqualified opinion on its General Purpose Financial Statementsfrom your auditor for the fiscal year noted above? (If your institution is audited only in combinationwith another entity, answer this question based on the audit of that entity.) Unqualified Qualified
(Explain inbox below)
Don't know(Explain inbox below)
3. Reporting ModelGASB Statement No. 34 offers three alternative reporting models for special-purpose governmentslike colleges and universities. Which model is used by your institution? Business Type Activities Governmental Activities Governmental Activities with Business-Type Activities 4. Intercollegiate AthleticsIf your institution participates in intercollegiate athletics, are the expenses accounted for asauxiliary enterprises or treated as student services? Auxiliary enterprises Student services Does not participate in intercollegiate athletics Other (specify in box below) 5. Endowment AssetsDoes this institution or any of its foundations or other affiliated organizations own endowmentassets ? Yes - (report endowment assets) No You may use the space below to provide context for the data you've reported above. 4. Separate Corporation: University Athletic Association

Institution: University of Florida (134130)User ID: 88G4433
Part A - Statement of Financial PositionFiscal Year: July 1, 2013 - June 30, 2014If your institution is a parent institution then the amounts reported in Parts A and D should includeALL of your child institutions Line no. Current year amount Prior year amount Current Assets 01 Total current assets 1,338,525,000 1,213,434,000 Noncurrent Assets 31 Depreciable capital assets, net of depreciation 1,568,905,000 1,633,266,00004 Other noncurrent assets
CV=[A05-A31] 335,422,000 194,561,000
05 Total noncurrent assets 1,904,327,000 1,827,827,000 06 Total assets
CV=(A01+A05) 3,242,852,000 3,041,261,000
Current Liabilities 07 Long-term debt, current portion 10,286,000 8,282,00008 Other current liabilities
CV=(A09-A07) 204,630,000 235,806,000
09 Total current liabilities 214,916,000 244,088,000 Noncurrent Liabilities 10 Long-term debt 189,073,000 120,813,00011 Other noncurrent liabilities
CV=(A12-A10) 350,071,000 307,399,000
12 Total noncurrent liabilities 539,144,000 428,212,000 13 Total liabilities
CV=(A09+A12) 754,060,000 672,300,000
Net Assets 14 Invested in capital assets, net of related debt 1,565,313,000 1,554,445,00015 Restricted-expendable 774,910,000 695,213,00016 Restricted-nonexpendable 0 017 Unrestricted
CV=[A18-(A14+A15+A16)] 148,569,000 119,303,000
18 Total net assetsCV=(A06-A13)
2,488,792,000 2,368,961,000
You may use the space below to provide context for the data you've reported above.

Institution: University of Florida (134130)User ID: 88G4433
Part A - Statement of Financial Position (Page 2)Fiscal Year: July 1, 2013 - June 30, 2014 Line No. Description Ending balance Prior year
Ending balance Capital Assets 21 Land and land improvements 11,279,000 10,841,00022 Infrastructure 112,919,000 108,261,00023 Buildings 2,292,087,000 2,284,054,00032 Equipment, including art and library collections 877,030,000 853,610,00027 Construction in progress 130,441,000 38,220,000 Total for Plant, Property and Equipment
CV = (A21+ .. A27) 3,423,756,000 3,294,986,000
28 Accumulated depreciation 1,745,720,000 1,643,006,00033 Intangible assets, net of accumulated amortization 0 034 Other capital assets 36,729,000 34,358,000 You may use the space below to provide context for the data you've reported above.

Institution: University of Florida (134130)User ID: 88G4433
Part E - Scholarships and FellowshipsFiscal Year: July 1, 2013 - June 30, 2014DO NOT REPORT FEDERAL DIRECT STUDENT LOANS (FDSL) ANYWHERE IN THISSECTION LineNo.
Scholarships and Fellowships Current yearamount
Prior yearamount
01 Pell grants (federal) 47,492,000 46,701,00002 Other federal grants (Do NOT include FDSL amounts) 2,982,000 3,274,00003 Grants by state government 69,000,000 67,177,00004 Grants by local government 0 005 Institutional grants from restricted resources 63,664,000 63,575,00006 Institutional grants from unrestricted resources
CV=[E07-(E01+...+E05)] 23,314,000 24,479,000
07 Total gross scholarships and fellowships 206,452,000 205,206,000 Discounts and Allowances 08 Discounts and allowances applied to tuition and fees 149,793,000 148,064,00009 Discounts and allowances applied to sales and services of
auxiliary enterprises 0 0
10 Total discounts and allowancesCV=(E08+E09)
149,793,000 148,064,000
11 Net scholarships and fellowships expenses after
deductingdiscounts and allowancesCV= (E07-E10) This amount will be carried forwardto C10 of the expense section.
56,659,000 57,142,000
You may use the space below to provide context for the data you've reported above.

Institution: University of Florida (134130)User ID: 88G4433
Part B - Revenues and Other AdditionsFiscal Year: July 1, 2013 - June 30, 2014 LineNo.
Source of Funds Current yearamount
Prior yearamount
Operating Revenues 01 Tuition and fees, after deducting discounts &
allowances 358,655,000 352,444,000
Grants and contracts - operating 02 Federal operating grants and contracts 366,315,000 391,536,00003 State operating grants and contracts 41,200,000 40,280,00004 Local government/private operating grants and
contracts 708,187,000 648,115,000
04a Local government operating grants andcontracts
3,438,000 4,503,000
04b Private operating grants and contracts 704,749,000 643,612,00005 Sales and services of auxiliary enterprises,
after deducting discounts and allowances 129,942,000 131,350,000
06 Sales and services of hospitals,after deducting patient contractual allowances
0 0
26 Sales and services of educational activities 52,012,000 51,555,00007 Independent operations 0 008 Other sources - operating
CV=[B09-(B01+ ....+B07)] 3,559,000 3,500,000
09 Total operating revenues 1,659,870,000 1,618,780,000

Institution: University of Florida (134130)User ID: 88G4433
Part B - Revenues and Other AdditionsFiscal Year: July 1, 2013 - June 30, 2014 LineNo.
Source of funds Current yearamount
Prior yearamount
Nonoperating Revenues 10 Federal appropriations 011 State appropriations 605,890,000 485,479,00012 Local appropriations, education district taxes, and
similar support 0 0
Grants-nonoperating 13 Federal nonoperating grants Do NOT include Federal
Direct Student Loans 49,152,000 48,227,000
14 State nonoperating grants 67,842,000 65,867,00015 Local government nonoperating grants 0 016 Gifts, including contributions from affiliated
organizations 82,041,000 84,091,000
17 Investment income 66,400,000 23,588,00018 Other nonoperating revenues
CV=[B19-(B10+...+B17)] 422,000 0
19 Total nonoperating revenues 871,747,000 707,252,00027 Total operating and nonoperating revenues
CV=[B19+B09] 2,531,617,000 2,326,032,000
28 12-month Student FTE from E12 47,483 47,55729 Total operating and nonoperating revenues per student
FTE CV=[B27/B28] 53,316 48,910

Institution: University of Florida (134130)User ID: 88G4433
Part B - Revenues and Other AdditionsFiscal Year: July 1, 2013 - June 30, 2014 Line No. Source of funds Current year amount Prior year amount Other Revenues and Additions 20 Capital appropriations 43,667,000 9,464,00021 Capital grants and gifts 17,707,000 13,922,00022 Additions to permanent endowments 0 023 Other revenues and additions
CV=[B24-(B20+...+B22)] 0 0
24 Total other revenues and additions 61,374,000 23,386,000 25 Total all revenues and other additions
CV=[B09+B19+B24] 2,592,991,000 2,349,418,000
You may use the space below to provide context for the data you've reported above.

Institution: University of Florida (134130)User ID: 88G4433
Part C - Expenses and Other DeductionsFiscal Year: July 1, 2013 - June 30, 2014Report Total Operating AND Nonoperating Expenses in this section 1 2 3 4 5 6 7 8LineNo.
Description Total amount Salaries andwages
Employeefringebenefits
Operation andmaintenanceof plant
DepreciationInterest All other PY TotalAmount
Expenses and Deductions 01 Instruction 757,936,000 505,406,000 101,692,000 29,881,000 38,762,000 2,534,000 79,661,000 721,302,00002 Research 645,337,000 321,360,000 69,373,000 25,441,000 33,003,000 2,158,000 194,002,000 623,243,00003 Public service 476,883,000 317,397,000 63,798,000 18,800,000 24,388,000 1,594,000 50,906,000 475,459,00005 Academic support 184,581,000 100,431,000 29,200,000 7,277,000 9,440,000 617,000 37,616,000 170,950,00006 Student services 39,567,000 29,147,000 5,760,000 1,560,000 2,024,000 132,000 944,000 39,560,00007 Institutional support 179,069,000 62,499,000 21,031,000 7,060,000 9,158,000 599,000 78,722,000 144,697,00008 Operation and maintenance
of plant (see instructions)0 23,357,000 9,548,000 -94,905,000 0 0 62,000,000 0
10 Scholarships and fellowshipsexpenses, excluding discounts andallowances (from E11)
56,659,000 56,659,000 57,142,000
11 Auxiliary enterprises 123,946,000 47,983,000 16,932,000 4,886,000 6,339,000 414,000 47,392,000 120,370,00012 Hospital services 0 013 Independent operations 0 014 Other expenses
and deductionsCV=[C19-(C01+...+C13)]
9,182,000 0 0 0 0 0 9,182,000 14,026,000
19 Total expenses and deductions 2,473,160,000 1,407,580,000 317,334,000 0 123,114,000 8,048,000 617,084,000 2,366,749,000 Prior year amount 2,366,749,000 1,343,227,000 276,641,000 121,356,000 6,134,000 619,391,000 20 12-month Student FTE from E12 47,483 47,55721 Total expenses and deductions per
student FTE CV=[C19/C20] 52,085 49,767
You may use the space below to provide context for the data you've reported above.

Institution: University of Florida (134130)User ID: 88G4433
Part D - Summary of Changes In Net PositionFiscal Year: July 1, 2013 - June 30, 2014 LineNo.
Description Current yearamount
Prior yearamount
01 Total revenues and other additions (from B25) 2,592,991,000 2,349,418,000 02 Total expenses and deductions (from C19) 2,473,160,000 2,366,749,000 03 Change in net position during year
CV=(D01-D02) 119,831,000 -17,331,000
04 Net position beginning of year 2,368,961,000 2,386,292,00005 Adjustments to beginning net position and other gains
or lossesCV=[D06-(D03+D04)]
0 0
06 Net position end of year (from A18) 2,488,792,000 2,368,961,000 You may use the space below to provide context for the data you've reported above.

Institution: University of Florida (134130)User ID: 88G4433
Part H - Details of Endowment AssetsFiscal Year: July 1, 2013 - June 30, 2014LineNo.
Value of Endowment Assets MarketValue
Prior YearAmounts
Include not only endowment assets held by the institution,but any assets held by private foundations affiliated with theinstitution.
01 Value of endowment assets at the beginning of the fiscal year 1,360,073,000 1,127,419,00002 Value of endowment assets at the end of the fiscal year 1,519,964,000 1,360,073,000 You may use the space below to provide context for the data you've reported above.

Institution: University of Florida (134130)User ID: 88G4433
Part J - Revenue Data for Bureau of CensusFiscal Year: July 1, 2013 - June 30, 2014Source and type Amount
Total for allfundsandoperations(includesendowmentfunds,but excludescomponentunits)
Education andgeneral/independentoperations
Auxiliaryenterprises
HospitalsAgricultureextension/experimentservices
(1) (2) (3) (4) (5)01Tuition and fees 508,448,000 508,448,000 02Sales and
services 181,954,000 45,547,000 129,942,000 0 6,465,000
03Federalgrants/contracts(excludes PellGrants)
366,315,000 296,904,000 0 0 69,411,000
Revenue from the state government:04State
appropriations,current &capital
649,556,000 504,653,000 0 0 144,903,000
05State grants andcontracts
41,200,000 28,197,000 0 0 13,003,000
Revenue from local governments:06Local
appropriation,current &capital
0 0 0 0 0
07Localgovernmentgrants/contracts
3,437,000 1,067,000 0 0 2,370,000
08Receipts fromproperty andnon-propertytaxes
0
09Gifts and privategrants, includingcapital grants
804,497,000
10Interest earnings 37,474,000 11Dividend
earnings 0
12Realized capitalgains
0
You may use the space below to provide context for the data you've reported above.

Institution: University of Florida (134130)User ID: 88G4433
Part K - Expenditure Data for Bureau of CensusFiscal Year: July 1, 2013 - June 30, 2014Category Amount
Total for all fundsand operations(includesendowment funds,but excludescomponent units)
Educationand general/independentoperations
Auxiliaryenterprises
HospitalsAgricultureextension/experimentservices
(1) (2) (3) (4) (5)01Salaries and wages 1,407,580,000 1,196,020,000 47,983,000 163,577,000
02Employee benefits, total 317,334,000 261,862,000 16,932,000 38,540,000
03Payment to state retirementfunds (maybe included inline 02 above)
63,595,000 52,736,000 3,065,000 0 7,794,000
04Current expenditures otherthan salaries
674,357,000 531,825,000 59,031,000 0 83,501,000
Capital outlay: 05Construction 108,923,000 80,932,000 18,717,000 0 9,274,000
06Equipment purchases 31,929,000 24,868,000 2,500,000 0 4,561,000
07Land purchases 0 0 0 0 008Interest on debt
outstanding, all funds andactivities
8,048,000
09Scholarships/fellowships 206,452,000 206,452,000 You may use the space below to provide context for the data you've reported above.

Institution: University of Florida (134130)User ID: 88G4433
Part L - Debt and Assets, page 1Fiscal Year: July 1, 2013 - June 30, 2014DebtCategory Amount01 Long-term debt outstanding at beginning of fiscal year 119,401,000
02 Long-term debt issued during fiscal year 71,005,000
03 Long-term debt retired during fiscal year 8,827,000
04 Long-term debt outstanding at end of fiscal year 181,579,000
05 Short-term debt outstanding at beginning of fiscal year 06 Short-term debt outstanding at end of fiscal year You may use the space below to provide context for the data you've reported above.

Institution: University of Florida (134130)User ID: 88G4433
Part L - Debt and Assets, page 2Fiscal Year: July 1, 2013 - June 30, 2014AssetsCategory Amount07Total cash and security assets held at end of fiscal year in sinking or debt service
funds 10,385,000
08Total cash and security assets held at end of fiscal year in bond funds 64,894,000
09Total cash and security assets held at end of fiscal year in all other funds 1,292,927,000
You may use the space below to provide context for the data you've reported above.

Institution: University of Florida (134130)User ID: 88G4433
Prepared by This survey component was prepared by: Keyholder SFA Contact HR Contact Finance Contact Academic Library Contact Other Name: Patrice Lecomte Email: [email protected] How long did it take to preparethis survey component?
32 hours minutes
The name of the preparer is being collected so that we can follow up with the appropriate person inthe event that there are questions concerning the data. The Keyholder will be copied on all emailcorrespondence to other preparers.The time it took to prepare this component is being collected so that we can continue to improveour estimate of the reporting burden associated with IPEDS. Please include in your estimate thetime it took for you to review instructions, query and search data sources, complete and review thecomponent, and submit the data through the Data Collection System.Thank you for your assistance.

Institution: University of Florida (134130) User ID: 88G4433Summary
Finance Survey Summary
IPEDS collects important information regarding your institution. All data reported in IPEDS surveycomponents become available in the IPEDS Data Center and appear as aggregated data in variousDepartment of Education reports. Additionally, some of the reported data appears specifically foryour institution through the College Navigator website and is included in your institution’s DataFeedback Report (DFR). The purpose of this summary is to provide you an opportunity to view someof the data that, when accepted through the IPEDS quality control process, will appear on theCollege Navigator website and/or your DFR. College Navigator is updated approximately threemonths after the data collection period closes and Data Feedback Reports will be available throughthe Data Center and sent to your institution’s CEO in November 2015.
Please review your data for accuracy. If you have questions about the data displayed below afterreviewing the data reported on the survey screens, please contact the IPEDS Help Desk at: 1-877-225-2568 or [email protected].
Core Revenues
Revenue Source Reported values Percent of total core revenues Core revenues per FTEenrollment
Tuition and fees $358,655,000 15% $7,553
State appropriations $605,890,000 25% $12,760
Local appropriations $0 0% $0
Government grants and contracts $527,947,000 21% $11,119
Private gifts, grants, and contracts $786,790,000 32% $16,570
Investment income $66,400,000 3% $1,398
Other core revenues $117,367,000 5% $2,472
Total core revenues $2,463,049,000 100% $51,872
Total revenues $2,592,991,000 $54,609
Other core revenues include federal appropriations; sales and services of educational activities; other operating andnonoperating sources; and other revenues and additions (e.g., capital appropriations, capital grants and gifts, etc.). Corerevenues exclude revenues from auxiliary enterprises (e.g., bookstores, dormitories), hospitals, and independent operations.
Core Expenses
Expense function Reported values Percent of total core expenses Core expenses per FTEenrollment
Instruction $757,936,000 32% $15,962
Research $645,337,000 27% $13,591
Public service $476,883,000 20% $10,043
Academic support $184,581,000 8% $3,887
Institutional support $179,069,000 8% $3,771
Student services $39,567,000 2% $833
Other core expenses $65,841,000 3% $1,387
Total core expenses $2,349,214,000 100% $49,475
Total expenses $2,473,160,000 $52,085
Other core expenses include scholarships and fellowships, net of discounts and allowances, and other expenses. Core expensesexclude expenses from auxiliary enterprises (e.g., bookstores, dormitories), hospitals, and independent operations.
Calculated value

FTE enrollment 47,483
The full-time equivalent (FTE) enrollment used in this report is the sum of the institution’s FTE undergraduate enrollment andFTE graduate enrollment (as calculated from or reported on the 12-month Enrollment component). FTE is estimated using 12-month instructional activity (credit and/or contact hours). All doctor’s degree students are reported as graduate students.

Institution: University of Florida (134130) User ID: 88G4433Edit Report
Finance
University of Florida (134130)
Source Description Severity Resolved OptionsScreen: Revenues Part 3
ScreenEntry
The amount of additions to permanent endowments reported in Part B (line22) should not be zero or blank. Please confirm that the data reported arecorrect. (Error #5231)
Confirmation Yes
RelatedScreens:
Revenues Part 3

Human Resources 2014-15Institution: University of Florida (134130)User ID: 88G4433
OverviewHuman Resources Overview
Welcome to the IPEDS Human Resources (HR) survey component. The HR component collects important informationabout your institution's staff.
Data Reporting Reminders • Report each employee only once. If an employee could be coded in more than one occupation,
code the employee in the occupation that requires the highest level of skill OR if there is nomeasurable difference in skill requirements, code the employee in the occupation in which theyspend the most time.
• Report staff members difficult to categorize in the "Human Resources Survey Evaluation" boxat the end of the survey.
• Enter data on each displayed screen. If a screen is not applicable, enter at least one zero in afield on the screen and save before continuing.
• When reporting salary data (applicable to degree-granting institutions only) include all full-time, non-medical school, instructional staff - both with and without faculty status.
See the instructions for the Key Reporting Concepts section -- basic reporting concepts that will assist you incompleting the Human Resources survey component.
Resources: • To download the survey materials for this component: Survey Materials
• To access your prior year data submission for this component: Reported Data• All staff must now be reported using the new IPEDS occupational categories, which align with the 2010
Standard Occupational Classfication (SOC) codes. Additional information and resources can be found in theIPEDS HR/SOC Information Center, including general information about the SOC, the IPEDS/SOCcrosswalk, a SOC Browse Tool, frequently asked questions, and web tutorials.
If you have questions about completing this survey, please contact the IPEDS Help Desk at 1-877-225-2568.

Institution: University of Florida (134130)User ID: 88G4433
Human Resources Screening QuestionsDoes your institution have any part-time staff?If you answer Yes to this question, you will be provided the screens to report part-time staff. Yes No
Does your institution have 15 or more full-time staff? Yes No
Do ALL of the instructional staff at your institution fall into any of the following categories?If you answer Yes to any of the questions below, you will NOT be required to report Part G - Salaries for instructionalstaff. However, Part G will still be required for reporting data for full-time non-instructional staff. No Yes Are ALL of the instructional staff military personnel?
No Yes Do ALL of the instructional staff contribute their services (e.g., members of a religious order)?
No Yes Do ALL of the instructional staff teach pre-clinical or clinical medicine?
The reporting of data by gender AND race/ethnicity is optional this year as it is in even-numbered years.Do you wish to report data by gender AND race/ethnicity this year?If you answer No, screens to report data by employment status (full-time and part-time) and occupational category willbe displayed.If you answer Yes, screens to report data by employment status (full-time and part-time), occupational category, andgender AND race/ethnicity will be displayed and you must complete all applicable screens.
No, I will not report data by gender and race/ethnicity this year
Yes, I will report data by gender and race/ethnicity this year
You may use the space below to provide context for the data you've reported above.

Institution: University of Florida (134130)User ID: 88G4433
Human Resources Screening QuestionsDoes your institution have a tenure system?If you answer Yes to this question, you will be provided the screens to report some data by tenure status. Yes No
Does your institution have graduate assistants?If you answer Yes to this question, you will be provided the screens to report graduate assistants. Yes No
Did your institution hire any full-time permanent staff who were included on the payroll of the institutionbetween July 1 and October 31, 2014 either for the first time (new to the institution) or after a break in serviceAND who were still on the payroll of the institution as of November 1, 2014? (Exclude persons who havereturned from sabbatical leave and full-time instructional staff who are working less-than-9-month contracts.)If you answer Yes to this question, you will be provided the screens to report full-time permanent new hires in Part H. Yes No

Institution: University of Florida (134130)User ID: 88G4433
Part A1 - Full-time Instructional Staff by Academic Rank and Tenure Status - TenuredNumber of Full-time Instructional Staff
With Faculty StatusTenured
As of November 1, 2014•Report Hispanic/Latino individuals of any race as Hispanic/Latino•Report race for non-Hispanic/Latino individuals only•Include both Primarily Instruction and Instruction Combined with Research and/or Public Service•Include both medical school and non-medical school staff
MenRace/ethnicity Academic Rank
ProfessorsAssociateprofessors
Assistantprofessors Instructors Lecturers
No academicrank Total
Nonresident alien 0Hispanic/Latino 32 31 63American Indian or Alaska Native 1 1Asian 96 57 153Black or African American 11 15 26Native Hawaiian or Other Pacific Islander 0White 617 282 5 904Two or more races 6 7 13Race and ethnicity unknown 1 1Total men 763 393 5 0 0 0 1,161
WomenRace/ethnicity Academic Rank
ProfessorsAssociateprofessors
Assistantprofessors Instructors Lecturers
No academicrank Total
Nonresident alien 0Hispanic/Latino 5 15 20American Indian or Alaska Native 0Asian 15 23 38Black or African American 5 17 22Native Hawaiian or Other Pacific Islander 0White 168 148 316Two or more races 2 2Race and ethnicity unknown 0Total women 195 203 0 0 0 0 398
Total (men+women) 958 596 5 0 0 0 1,559Total from prior year 1,592

Institution: University of Florida (134130)User ID: 88G4433
Part A1 - Full-time Instructional Staff by Academic Rank and Tenure Status - OnTenure Track
Number of Full-time Instructional StaffWith Faculty Status
On Tenure Track
As of November 1, 2014•Report Hispanic/Latino individuals of any race as Hispanic/Latino•Report race for non-Hispanic/Latino individuals only•Include both Primarily Instruction and Instruction Combined with Research and/or Public Service•Include both medical school and non-medical school staff
MenRace/ethnicity Academic Rank
ProfessorsAssociateprofessors
Assistantprofessors Instructors Lecturers
No academicrank Total
Nonresident alien 2 2 10 14Hispanic/Latino 2 1 15 18American Indian or Alaska Native 0Asian 3 6 36 45Black or African American 1 1 2 4Native Hawaiian or Other Pacific Islander 1 1White 10 25 122 157Two or more races 1 5 6Race and ethnicity unknown 1 1Total men 18 36 192 0 0 0 246 WomenRace/ethnicity Academic Rank
ProfessorsAssociateprofessors
Assistantprofessors Instructors Lecturers
No academicrank Total
Nonresident alien 1 9 10Hispanic/Latino 7 7American Indian or Alaska Native 0Asian 3 26 29Black or African American 7 7Native Hawaiian or Other Pacific Islander 0White 4 12 82 98Two or more races 3 3Race and ethnicity unknown 1 1Total women 4 16 135 0 0 0 155 Total (men+women) 22 52 327 0 0 0 401Total from prior year 419

Institution: University of Florida (134130)User ID: 88G4433
Part A1 - Full-time Instructional Staff by Academic Rank and Tenure Status - Multi-Year Contract
Number of Full-time Instructional StaffWith Faculty Status
Not on Tenure Track - Multi-Year or Continuing or At-will Contract
As of November 1, 2014•Report Hispanic/Latino individuals of any race as Hispanic/Latino•Report race for non-Hispanic/Latino individuals only•Include both Primarily Instruction and Instruction Combined with Research and/or Public Service•Include both medical school and non-medical school staff
MenGender and race/ethnicity Academic Rank
ProfessorsAssociateprofessors
Assistantprofessors Instructors Lecturers
No academicrank Total
Nonresident alien 0 0 0 0 0 0Hispanic/Latino 0 0 0 0 0American Indian or Alaska Native 0 0Asian 0 0 0 0 0 0Black or African American 0 0 0 0Native Hawaiian or Other Pacific Islander 0White 0 0 0 0 0 0Two or more races 0 0Race and ethnicity unknown 0 0Total men 0 0 0 0 0 0 0 WomenGender and race/ethnicity Academic Rank
ProfessorsAssociateprofessors
Assistantprofessors Instructors Lecturers
No academicrank Total
Nonresident alien 0 0 0 0Hispanic/Latino 0 0 0 0American Indian or Alaska Native 0 0Asian 0 0 0 0 0Black or African American 0 0 0 0Native Hawaiian or Other Pacific Islander 0White 0 0 0 0 0 0Two or more races 0 0 0Race and ethnicity unknown 0 0 0Total women 0 0 0 0 0 0 0 Total (men+women) 0 0 0 0 0 0 0Total from prior year

Institution: University of Florida (134130)User ID: 88G4433
Part A1 - Full-time Instructional Staff by Academic Rank and Tenure Status - AnnualContract
Number of Full-time Instructional StaffWith Faculty Status
Not on Tenure Track - Annual Contract
As of November 1, 2014•Report Hispanic/Latino individuals of any race as Hispanic/Latino•Report race for non-Hispanic/Latino individuals only•Include both Primarily Instruction and Instruction Combined with Research and/or Public Service•Include both medical school and non-medical school staff
MenRace/ethnicity Academic Rank
ProfessorsAssociateprofessors
Assistantprofessors Instructors Lecturers
No academicrank Total
Nonresident alien 1 1 6 4 1 13Hispanic/Latino 1 1 5 2 9American Indian or Alaska Native 1 1Asian 3 2 3 2 7 17Black or African American 2 4 4 10Native Hawaiian or Other Pacific Islander 0White 7 6 14 95 48 170Two or more races 1 1Race and ethnicity unknown 1 1 1 3Total men 12 11 26 0 113 62 224 WomenRace/ethnicity Academic Rank
ProfessorsAssociateprofessors
Assistantprofessors Instructors Lecturers
No academicrank Total
Nonresident alien 2 1 5 8Hispanic/Latino 1 11 4 16American Indian or Alaska Native 1 1Asian 1 2 17 6 26Black or African American 1 11 2 14Native Hawaiian or Other Pacific Islander 0White 5 4 20 124 66 219Two or more races 1 1 2Race and ethnicity unknown 1 1 2Total women 9 4 25 0 166 84 288 Total (men+women) 21 15 51 0 279 146 512Total from prior year 491

Institution: University of Florida (134130)User ID: 88G4433
Part A1 - Full-time Instructional Staff by Academic Rank and Tenure Status - Less-Than-Annual Contract
Number of Full-time Instructional StaffWith Faculty Status
Not on Tenure Track - Less-than-annual Contract
As of November 1, 2014•Report Hispanic/Latino individuals of any race as Hispanic/Latino•Report race for non-Hispanic/Latino individuals only•Include both Primarily Instruction and Instruction Combined with Research and/or Public Service•Include both medical school and non-medical school staff
MenRace/ethnicity Academic Rank
ProfessorsAssociateprofessors
Assistantprofessors Instructors Lecturers
No academicrank Total
Nonresident alien 0 0Hispanic/Latino 0American Indian or Alaska Native 0Asian 0Black or African American 0Native Hawaiian or Other Pacific Islander 0White 0Two or more races 0Race and ethnicity unknown 0Total men 0 0 0 0 0 0 0 WomenRace/ethnicity Academic Rank
ProfessorsAssociateprofessors
Assistantprofessors Instructors Lecturers
No academicrank Total
Nonresident alien 0 0Hispanic/Latino 0American Indian or Alaska Native 0Asian 0Black or African American 0Native Hawaiian or Other Pacific Islander 0White 0Two or more races 0Race and ethnicity unknown 0Total women 0 0 0 0 0 0 0 Total (men+women) 0 0 0 0 0 0 0Total from prior year

Institution: University of Florida (134130)User ID: 88G4433
Part A1 - Full-time Instructional Staff - Without Faculty StatusNumber of Full-time Instructional Staff
Without Faculty StatusAs of November 1, 2014
•Report Hispanic/Latino individuals of any race as Hispanic/Latino•Report race for non-Hispanic/Latino individuals only•Include both Primarily Instruction and Instruction Combined with Research and/or Public Service•Include both medical school and non-medical school staff
MenRace/ethnicity Without Faculty StatusNonresident alien 0Hispanic/Latino American Indian or Alaska Native Asian Black or African American Native Hawaiian or Other Pacific Islander White Two or more races Race and ethnicity unknown Total men 0
WomenRace/ethnicity Without Faculty StatusNonresident alien 0Hispanic/Latino American Indian or Alaska Native Asian Black or African American Native Hawaiian or Other Pacific Islander White Two or more races Race and ethnicity unknown Total women 0
Total (men+women) 0Total from prior year

Institution: University of Florida (134130)User ID: 88G4433
Part A2 - Full-time Instructional Staff by FunctionNumber of Full-time Instructional Staff
As of November 1, 2014•Report Primarily Instruction and Instruction combined with Research and/or Public Service separately, as indicatedbelow•Report Non-medical school and Medical school staff separately, as indicated below
With Faculty statusTenured On
TenureTrack
Not on Tenure TrackMulti-year,
continuing, or at-will contract
Annualcontract
Less-than-annualcontract
WithoutFacultystatus
Total
Non-medical school staff 1,271 289 0 476 0 0 2,036Non-medical school staff fromprior year
1,307 280 452 2,039
Primarily Instruction 1,129 287 0 443 0 0 1,859 Exclusively credit 1,129 287 443 1,859
Exclusively not-for-credit 0
Combined credit/not-for-credit
0
Instruction/research/publicservice staff
142 2 33 177
Medical school staff 288 112 0 36 0 0 436Medical school staff from prioryear
285 139 39 463
Primarily Instruction 211 93 0 29 0 0 333 Exclusively credit 211 93 29 333 Exclusively not-for-credit 0 Combined credit/not-for-
credit 0
Instruction/research/publicservice staff
77 19 7 103
Total carried forward fromprevious screens
1,559 401 0 512 0 0 2,472

Institution: University of Florida (134130)User ID: 88G4433
Part A3 - Full-time Instructional Staff - TotalsTotal number of Full-time Instructional Staff
As of November 1, 2014Race/ethnicity Total men Total women Total (men+women)Nonresident alien 27 18 45Hispanic/Latino 90 43 133American Indian or Alaska Native 2 1 3Asian 215 93 308Black or African American 40 43 83Native Hawaiian or Other Pacific Islander 1 0 1White 1,231 633 1,864Two or more races 20 7 27Race and ethnicity unknown 5 3 8Total 1,631 841 2,472Total from prior year 2,502

Institution: University of Florida (134130)User ID: 88G4433
Part B1 - Full-time Non-instructional Staff by Occupational CategoryNumber of Full-time Non-instructional Staff
by Occupational Category
As of November 1, 2014•Report Hispanic/Latino individuals of any race as Hispanic/Latino•Report race for non-Hispanic/Latino individuals only•Include both medical school and non-medical school staff
MenRace/ethnicity Instructional Staff
(carried forwardfrom Part A)
Research staff Public Service staff
Nonresident alien 27 37 31Hispanic/Latino 90 16 59American Indian or Alaska Native 2 1 1Asian 215 70 107Black or African American 40 8 24Native Hawaiian or Other Pacific Islander 1 2 White 1,231 178 421Two or more races 20 1 4Race and ethnicity unknown 5 4 5Total men 1,631 317 652
WomenRace/ethnicity Instructional Staff
(carried forwardfrom Part A)
Research staff Public Service staff
Nonresident alien 18 16 13Hispanic/Latino 43 13 50American Indian or Alaska Native 1 0 1Asian 93 38 72Black or African American 43 2 39Native Hawaiian or Other Pacific Islander 0 White 633 94 441Two or more races 7 6Race and ethnicity unknown 3 2 1Total women 841 165 623
Total (men+women) 2,472 482 1,275Total from prior year 2,502 492 1,242

Institution: University of Florida (134130)User ID: 88G4433
Part B1 - Full-time Non-instructional Staff by Occupational CategoryNumber of Full-time Non-instructional Staff
by Occupational Category
As of November 1, 2014•Report Hispanic/Latino individuals of any race as Hispanic/Latino•Report race for non-Hispanic/Latino individuals only•Include both medical school and non-medical school staff
MenRace/ethnicity Archivists, Curators, and
Museum Technicians25-4010
Librarians25-4020
LibraryTechnicians
25-4030
Student and Academic Affairs and OtherEducation Services Occupations25-2000 + 25-3000 + 25-9000
Nonresident alien 1 1 1Hispanic/Latino 1 5American Indian orAlaska Native
Asian 1 2 7Black or AfricanAmerican
2 2 4 25
Native Hawaiian orOther Pacific Islander
White 27 19 16 124Two or more races 1Race and ethnicityunknown
1
Total men 30 22 24 164
WomenRace/ethnicity Archivists, Curators, and
Museum Technicians25-4010
Librarians25-4020
LibraryTechnicians
25-4030
Student and Academic Affairs and OtherEducation Services Occupations25-2000 + 25-3000 + 25-9000
Nonresident alien 2Hispanic/Latino 1 1 5 38American Indian orAlaska Native
3
Asian 1 3 1 9Black or AfricanAmerican
1 3 6 52
Native Hawaiian orOther Pacific Islander
White 23 43 22 269Two or more races 5Race and ethnicityunknown
1 3
Total women 26 50 35 381
Total (men+women) 56 72 59 545Total from prior year 64 75 59 527

Institution: University of Florida (134130)User ID: 88G4433
Part B1 - Full-time Non-instructional Staff by Occupational CategoryNumber of Full-time Non-instructional Staff
by Occupational Category
As of November 1, 2014•Report Hispanic/Latino individuals of any race as Hispanic/Latino•Report race for non-Hispanic/Latino individuals only•Include both medical school and non-medical school staff
MenRace/ethnicity Management
Occupations11-0000
Business andFinancial
OperationsOccupations
13-0000
Computer, Engineering,and Science Occupations15-0000 + 17-0000 + 19-
0000
Community, Social Service,Legal, Arts, Design,
Entertainment, Sports, andMedia Occupations
21-0000 + 23-0000 + 27-0000
HealthcarePractitioners
and TechnicalOccupations
29-0000Nonresidentalien
1 26 1
Hispanic/Latino 13 19 85 6 4American Indianor Alaska Native
1 3 1
Asian 8 4 70 1 4Black or AfricanAmerican
26 13 38 5 6
Native Hawaiianor Other PacificIslander
2
White 369 168 917 93 55Two or moreraces
5 2 16 2 1
Race andethnicityunknown
2 2 4 1
Total men 424 209 1,161 108 72
WomenRace/ethnicity Management
Occupations11-0000
Business andFinancial
OperationsOccupations
13-0000
Computer, Engineering,and Science Occupations15-0000 + 17-0000 + 19-
0000
Community, Social Service,Legal, Arts, Design,
Entertainment, Sports, andMedia Occupations
21-0000 + 23-0000 + 27-0000
HealthcarePractitioners
and TechnicalOccupations
29-0000Nonresidentalien
18 2
Hispanic/Latino 18 51 79 28 30American Indianor Alaska Native
1 1 1 1 1
Asian 15 35 112 5 17Black or AfricanAmerican
36 68 37 23 51
Native Hawaiianor Other PacificIslander
1 2
White 363 514 536 177 385Two or moreraces
6 7 10 4 6
Race andethnicityunknown
1 1 5 1 1
Total women 440 678 800 241 491
Total(men+women)
864 887 1,961 349 563
Total from prioryear
783 850 1,927 325 565

Institution: University of Florida (134130)User ID: 88G4433
Part B1 - Full-time Non-instructional Staff by Occupational CategoryNumber of Full-time Non-instructional Staff
by Occupational Category
As of November 1, 2014•Report Hispanic/Latino individuals of any race as Hispanic/Latino•Report race for non-Hispanic/Latino individuals only•Include both medical school and non-medical school staff
MenRace/ethnicity Service Occupations
31-0000 + 33-0000 + 35-0000 + 37-0000+ 39-0000
Sales andRelatedOccupations41-0000
Office andAdministrativeSupportOccupations43-0000
Natural Resources,Construction, andMaintenanceOccupations45-0000 + 47-0000 + 49-0000
Production,Transportation,and MaterialMovingOccupations51-0000 + 53-0000
GrandTotal(All full-timestaff)
Nonresidentalien
126
Hispanic/Latino 20 1 21 32 4 376AmericanIndian orAlaska Native
2 2 6 1 20
Asian 15 5 3 512Black orAfricanAmerican
195 39 50 15 492
NativeHawaiian orOther PacificIslander
1 6
White 147 1 198 474 29 4,467Two or moreraces
2 6 8 68
Race andethnicityunknown
3 1 28
Total men 384 2 271 575 49 6,095
WomenRace/ethnicity Service Occupations
31-0000 + 33-0000 + 35-0000 + 37-0000+ 39-0000
Sales andRelatedOccupations41-0000
Office andAdministrativeSupportOccupations43-0000
Natural Resources,Construction, andMaintenanceOccupations45-0000 + 47-0000 + 49-0000
Production,Transportation,and MaterialMovingOccupations51-0000 + 53-0000
GrandTotal(All full-timestaff)
Nonresidentalien
3 72
Hispanic/Latino 48 1 112 2 1 521AmericanIndian orAlaska Native
2 3 15
Asian 22 28 451Black orAfricanAmerican
266 4 308 6 945
NativeHawaiian orOther PacificIslander
1 1 5
White 147 1,259 24 3 4,933Two or moreraces
2 15 68
4 7 30

Race andethnicityunknownTotal women 495 5 1,733 32 4 7,040
Total(men+women)
879 7 2,004 607 53 13,135
Total from prioryear
886 9 2,006 598 56 12,966

Institution: University of Florida (134130)User ID: 88G4433
Part B2 - Full-time Non-instructional Staff by Occupational Category and TenureStatus
Number of Full-time Non-instructional Staff
As of November 1, 2014 Non-medical school staffOccupational category With Faculty status
Tenured OnTenureTrack
Not on Tenure TrackMulti-year,
continuing, or at-will contract
Annualcontract
Less-than-annualcontract
WithoutFacultystatus
Total
Research staff 93 32 226 351Public Service staff 135 96 257 488Archivists, Curators, and MuseumTechnicians25-4010
56 56
Librarians25-4020
37 29 6 72
Library Technicians25-4030
59 59
Student and Academic Affairs andOther Education ServicesOccupations25-2000 + 25-3000 + 25-9000
28 59 433 520
Management Occupations11-0000
166 13 48 459 686
Business and Financial OperationsOccupations13-0000
695 695
Computer, Engineering, and ScienceOccupations15-0000 + 17-0000 + 19-0000
1,550 1,550
Community, Social Service, Legal,Arts, Design, Entertainment, Sports,and Media Occupations21-0000 + 23-0000 + 27-0000
320 320
Healthcare Practitioners andTechnical Occupations29-0000
177 177
Total 459 170 0 596 0 3,749 4,974Total from prior year 459 171 592 3,624 4,846 Medical school staffOccupational category With Faculty status
Tenured OnTenureTrack
Not on Tenure TrackMulti-year,
continuing, or at-will contract
Annualcontract
Less-than-annualcontract
WithoutFacultystatus
Total
Research staff 131 131Public Service staff 1 786 787Archivists, Curators, and MuseumTechnicians25-4010
0
Librarians25-4020
0
Library Technicians25-4030
0
Student and Academic Affairs andOther Education ServicesOccupations25-2000 + 25-3000 + 25-9000
25 25
Management Occupations11-0000
19 2 35 122 178
Business and Financial OperationsOccupations
192 192

13-0000Computer, Engineering, and ScienceOccupations15-0000 + 17-0000 + 19-0000
411 411
Community, Social Service, Legal,Arts, Design, Entertainment, Sports,and Media Occupations21-0000 + 23-0000 + 27-0000
29 29
Healthcare Practitioners andTechnical Occupations29-0000
386 386
Total 20 2 0 952 0 1,165 2,139Total from prior year 21 0 903 1,139 2,063

Institution: University of Florida (134130)User ID: 88G4433
Part B2 - Full-time Non-instructional Staff by Medical School StatusNumber of Full-time Non-instructional Staff
As of November 1, 2014
Occupational category Total(carriedforward
from Part B1)
Non-medical schoolstaff
Medical schoolstaff
Service Occupations31-0000 + 33-0000 + 35-0000 + 37-0000 + 39-0000
879 806 73
Sales and Related Occupations41-0000
7 7
Office and Administrative Support Occupations43-0000
2,004 1,492 512
Natural Resources, Construction, and MaintenanceOccupations45-0000 + 47-0000 + 49-0000
607 607
Production, Transportation, and Material Moving Occupations51-0000 + 53-0000
53 51 2
Total 2,963 587Total from prior year 2,953 602

Institution: University of Florida (134130)User ID: 88G4433
Part C - Full-time Summary Non-medical school staffSummary of Full-time Non-medical School Staff
As of November 1, 2014•Data will not be generated on this screen until the relevant screens in the previous section have been completed.
Occupational category With Faculty statusTenured On
TenureTrack
Not on Tenure TrackMulti-year,continuing,
or at-willcontract
Annualcontract
Less-than-annualcontract
WithoutFacultystatus
Total
Primarily Instruction 1,129 287 0 443 0 0 1,859 Exclusively credit 1,129 287 443 1,859 Exclusively not-for-credit 0 Combined credit/not-for-credit 0Instruction/research/public service staff 142 2 33 177Research staff 93 32 226 351Public Service staff 135 96 257 488Archivists, Curators, and MuseumTechnicians25-4010
56 56
Librarians25-4020
37 29 6 72
Library Technicians25-4030
59 59
Student and Academic Affairs and OtherEducation Services Occupations25-2000 + 25-3000 + 25-9000
28 59 433 520
Management Occupations11-0000
166 13 48 459 686
Business and Financial OperationsOccupations13-0000
695 695
Computer, Engineering, and ScienceOccupations15-0000 + 17-0000 + 19-0000
1,550 1,550
Community, Social Service, Legal, Arts,Design, Entertainment, Sports, and MediaOccupations21-0000 + 23-0000 + 27-0000
320 320
Healthcare Practitioners and TechnicalOccupations29-0000
177 177
Service Occupations31-0000 + 33-0000 + 35-0000 + 37-0000 + 39-0000
806
Sales and Related Occupations41-0000
7
Office and Administrative SupportOccupations43-0000
1,492
Natural Resources, Construction, andMaintenance Occupations45-0000 + 47-0000 + 49-0000
607
Production, Transportation, and MaterialMoving Occupations51-0000 + 53-0000
51
Total 9,973

Institution: University of Florida (134130)User ID: 88G4433
Part C - Full-time Summary Medical school staffSummary of Full-time Medical School Staff
As of November 1, 2014•Data will not be generated on this screen until the relevant screens in the previous section have been completed.
Occupational category With Faculty statusTenured On
TenureTrack
Not on Tenure TrackMulti-year,continuing,
or at-willcontract
Annualcontract
Less-than-annualcontract
WithoutFacultystatus
Total
Primarily Instruction 211 93 0 29 0 0 333 Exclusively credit 211 93 29 333 Exclusively not-for-credit 0 Combined credit/not-for-credit 0Instruction/research/public service staff 77 19 7 103Research staff 131 131Public Service staff 1 786 787Archivists, Curators, and MuseumTechnicians25-4010
0
Librarians25-4020
0
Library Technicians25-4030
0
Student and Academic Affairs and OtherEducation Services Occupations25-2000 + 25-3000 + 25-9000
25 25
Management Occupations11-0000
19 2 35 122 178
Business and Financial OperationsOccupations13-0000
192 192
Computer, Engineering, and ScienceOccupations15-0000 + 17-0000 + 19-0000
411 411
Community, Social Service, Legal, Arts,Design, Entertainment, Sports, and MediaOccupations21-0000 + 23-0000 + 27-0000
29 29
Healthcare Practitioners and TechnicalOccupations29-0000
386 386
Service Occupations31-0000 + 33-0000 + 35-0000 + 37-0000 + 39-0000
73
Sales and Related Occupations41-0000
Office and Administrative SupportOccupations43-0000
512
Natural Resources, Construction, andMaintenance Occupations45-0000 + 47-0000 + 49-0000
Production, Transportation, and MaterialMoving Occupations51-0000 + 53-0000
2
Total 3,162

Institution: University of Florida (134130)User ID: 88G4433
Part G - Salaries WorksheetNumber of Full-time Non-medical School Instructional Staff
For Calculation of Total Number of Months
Annual Salary, 2014-15•Report the number of instructional staff based on the number of months to be worked•Months reported should correspond with the number of months that staff worked (which may differ from the number ofmonths over which they are paid)•Include ONLY full-time, non-medical school instructional staff•Include instructional staff with faculty status and without faculty status•Include instructional staff regardless of tenure status•Balance column should include instructional staff whose annual salary covers less than 9 months worked
Gender andacademicrank
Months worked12
months11
months10
months9
months
Total Stafffor Salaryreporting
TotalNumber of
Months
Total full-time non-medical school
instructional staff fromPart A
Balance (allother full-time
instructional staff)
MenProfessors 223 388 611 6,168 Associateprofessors
109 239 348 3,459
Assistantprofessors
77 98 175 1,806
Instructors 0 0 Lecturers 42 71 113 1,143 No academicrank
51 1 52 621
Total men 502 0 0 797 1,299 13,197
WomenProfessors 56 119 175 1,743 Associateprofessors
65 134 199 1,986
Assistantprofessors
50 79 129 1,311
Instructors 0 0 Lecturers 53 109 162 1,617 No academicrank
69 3 72 855
Total women 293 0 0 444 737 7,512
Total (men +women)
795 0 0 1,241 2,036 20,709 2,036 0

Institution: University of Florida (134130)User ID: 88G4433
Part G - Salary outlays for instructional staffSalary Outlays
for Full-time Non-medical School Instructional Staff
Annual Salary Outlays, 2014-15•Report the TOTAL ANNUAL salary outlays for the full-time Non-medical School instructional staff reported in the 12months, 11 months, 10 months, and 9 months columns on the previous screen
Gender and academicrank
Total staff for salaryreporting(from Part G,screen 1)
Total Number ofMonths(from Part G,screen 1)
Total AnnualSalary Outlays
Weighted Average MonthlySalaries
MenProfessors 611 6,168 91,816,230 14,886Associate professors 348 3,459 34,957,217 10,106Assistant professors 175 1,806 17,058,505 9,445Instructors 0 0 Lecturers 113 1,143 8,164,604 7,143No academic rank 52 621 4,344,489 6,996Total men 1,299 13,197 156,341,045 11,847
WomenProfessors 175 1,743 23,526,306 13,498Associate professors 199 1,986 18,873,081 9,503Assistant professors 129 1,311 11,041,851 8,422Instructors 0 0 Lecturers 162 1,617 10,119,529 6,258No academic rank 72 855 4,783,902 5,595Total women 737 7,512 68,344,669 9,098
Total (men + women) 2,036 20,709 224,685,714 10,850

Institution: University of Florida (134130)User ID: 88G4433
Part G - Salary outlays for non-instructional staffSalary Outlays
for Full-time Non-medical School Non-instructional Staff
Annual Salary Outlays, 2014-15Occupational category Number of
full-time staff(carried forward from
previous screens)
Total annualsalary outlays
Research staff 351 31,037,910Public Service staff 488 36,340,087Library and Student and Academic Affairs and Other EducationServices Occupations25-4000 + 25-2000 + 25-3000 + 25-9000
707 32,501,038
Management Occupations11-0000
686 83,723,045
Business and Financial Operations Occupations13-0000
695 40,402,608
Computer, Engineering, and Science Occupations15-0000 + 17-0000 + 19-0000
1,550 86,880,116
Community, Social Service, Legal, Arts, Design, Entertainment, Sports,and Media Occupations21-0000 + 23-0000 + 27-0000
320 15,211,658
Healthcare Practitioners and Technical Occupations29-0000
177 9,691,360
Service Occupations31-0000 + 33-0000 + 35-0000 + 37-0000 + 39-0000
806 24,115,522
Sales and Related Occupations41-0000
7 239,998
Office and Administrative Support Occupations43-0000
1,492 58,707,381
Natural Resources, Construction, and Maintenance Occupations45-0000 + 47-0000 + 49-0000
607 23,411,830
Production, Transportation, and Material Moving Occupations51-0000 + 53-0000
51 1,552,170

Institution: University of Florida (134130)User ID: 88G4433
Part D - Part-time Staff by Occupational CategoryNumber of Part-time Staff by Occupational Category
As of November 1, 2014•Report Hispanic/Latino individuals of any race as Hispanic/Latino•Report race for non-Hispanic/Latino individuals only•Include both medical school and non-medical school staff
MenRace/ethnicity Instructional staff Research staff Public Service staffNonresident alien 5 2 Hispanic/Latino 8 2 17American Indian or Alaska Native Asian 12 7 16Black or African American 7 2Native Hawaiian or Other Pacific Islander White 225 35 119Two or more races 2 2 Race and ethnicity unknown 6 1 2Total men 265 49 156
WomenRace/ethnicity Instructional staff Research staff Public Service staffNonresident alien 3 1Hispanic/Latino 12 3 15American Indian or Alaska Native Asian 15 5 29Black or African American 4 1 4Native Hawaiian or Other Pacific Islander White 169 20 138Two or more races 2 3Race and ethnicity unknown 1 1Total women 206 29 191
Total (men+women) 471 78 347Total from prior year 452 87 341

Institution: University of Florida (134130)User ID: 88G4433
Part D - Part-time Staff by Occupational CategoryNumber of Part-time Staff by Occupational Category
As of November 1, 2014•Report Hispanic/Latino individuals of any race as Hispanic/Latino•Report race for non-Hispanic/Latino individuals only•Include both medical school and non-medical school staff
MenRace/ethnicity Archivists,
Curators, andMuseum
Technicians25-4010
Librarians25-4020
LibraryTechnicians
25-4030
Student and Academic Affairsand Other Education Services
Occupations25-2000 + 25-3000 + 25-9000
Library and Student andAcademic Affairs and
Other EducationServices Occupations
Nonresident alien 0Hispanic/Latino 0American Indian orAlaska Native
0
Asian 0Black or AfricanAmerican
0
Native Hawaiian orOther PacificIslander
0
White 1 0 1 4 6Two or more races 0Race and ethnicityunknown
0
Total men 1 0 1 4 6
WomenRace/ethnicity Archivists,
Curators, andMuseum
Technicians25-4010
Librarians25-4020
LibraryTechnicians
25-4030
Student and Academic Affairsand Other Education Services
Occupations25-2000 + 25-3000 + 25-9000
Library and Student andAcademic Affairs and
Other EducationServices Occupations
Nonresident alien 0Hispanic/Latino 0American Indian orAlaska Native
0
Asian 1 1Black or AfricanAmerican
0
Native Hawaiian orOther PacificIslander
0
White 1 10 11Two or more races 0Race and ethnicityunknown
0
Total women 2 0 0 10 12
Total(men+women)
3 0 1 14 18
Total from prioryear
5 1 4 12 22

Institution: University of Florida (134130)User ID: 88G4433
Part D - Part-time Staff by Occupational CategoryNumber of Part-time Staff
As of November 1, 2014•Report Hispanic/Latino individuals of any race as Hispanic/Latino•Report race for non-Hispanic/Latino individuals only•Include both medical school and non-medical school staff
MenRace/ethnicity Management
Occupations11-0000
Business andFinancial
OperationsOccupations
13-0000
Computer, Engineering,and Science Occupations15-0000 + 17-0000 + 19-
0000
Community, Social Service,Legal, Arts, Design,
Entertainment, Sports, andMedia Occupations
21-0000 + 23-0000 + 27-0000
HealthcarePractitioners
and TechnicalOccupations
29-0000Nonresidentalien
Hispanic/Latino 1 2 American Indianor Alaska Native
Asian 2 Black or AfricanAmerican
Native Hawaiianor Other PacificIslander
White 2 1 13 3 2Two or moreraces
Race andethnicityunknown
Total men 3 1 17 3 2
WomenRace/ethnicity Management
Occupations11-0000
Business andFinancial
OperationsOccupations
13-0000
Computer, Engineering,and Science Occupations15-0000 + 17-0000 + 19-
0000
Community, Social Service,Legal, Arts, Design,
Entertainment, Sports, andMedia Occupations
21-0000 + 23-0000 + 27-0000
HealthcarePractitioners
and TechnicalOccupations
29-0000Nonresidentalien
1 1 1
Hispanic/Latino 1 1 2American Indianor Alaska Native
Asian 1 6 1Black or AfricanAmerican
1
Native Hawaiianor Other PacificIslander
White 6 15 17 10 35Two or moreraces
Race andethnicityunknown
Total women 8 16 24 12 39
Total(men+women)
11 17 41 15 41
Total from prioryear
17 15 33 14 42

Institution: University of Florida (134130)User ID: 88G4433
Part D - Part-time Staff by Occupational CategoryNumber of Part-time Staff
As of November 1, 2014•Report Hispanic/Latino individuals of any race as Hispanic/Latino•Report race for non-Hispanic/Latino individuals only•Include both medical school and non-medical school staff
MenRace/ethnicity Service Occupations
31-0000 + 33-0000 + 35-0000 + 37-0000+ 39-0000
Sales andRelatedOccupations41-0000
Office andAdministrativeSupportOccupations43-0000
Natural Resources,Construction, andMaintenanceOccupations45-0000 + 47-0000 + 49-0000
Production,Transportation,and MaterialMovingOccupations51-0000 + 53-0000
GrandTotal(All part-timestaff)
Nonresidentalien
7
Hispanic/Latino 30AmericanIndian orAlaska Native
0
Asian 37Black orAfricanAmerican
1 10
NativeHawaiian orOther PacificIslander
0
White 1 1 1 409Two or moreraces
4
Race andethnicityunknown
9
Total men 1 0 1 2 0 506
WomenRace/ethnicity Service Occupations
31-0000 + 33-0000 + 35-0000 + 37-0000+ 39-0000
Sales andRelatedOccupations41-0000
Office andAdministrativeSupportOccupations43-0000
Natural Resources,Construction, andMaintenanceOccupations45-0000 + 47-0000 + 49-0000
Production,Transportation,and MaterialMovingOccupations51-0000 + 53-0000
GrandTotal(All part-timestaff)
Nonresidentalien
1 8
Hispanic/Latino 5 2 41AmericanIndian orAlaska Native
0
Asian 1 59Black orAfricanAmerican
1 3 14
NativeHawaiian orOther PacificIslander
0
White 2 24 2 449Two or moreraces
5
Race andethnicityunknown
2

Total women 9 0 30 2 0 578
Total(men+women)
10 0 31 4 0 1,084
Total from prioryear
7 31 4 1,065

Institution: University of Florida (134130)User ID: 88G4433
Part D - Graduate assistantsNumber of Graduate Assistants
As of November 1, 2014•Report Hispanic/Latino individuals of any race as Hispanic/Latino•Report race for non-Hispanic/Latino individuals only
MenRace/ethnicity Teaching
25-1191Research Management
Occupations11-0000
Businessand
FinancialOperations
Occupations13-0000
Computer,Engineering,and ScienceOccupations
15-0000+ 17-0000+ 19-0000
Community,Social
Service,Legal, Arts,
Design,Entertainment,
Sports, andMedia
Occupations21-0000
+ 23-0000+ 27-0000
Library andStudent andAcademicAffairs and
OtherEducationServices
Occupations25-4000
+ 25-2000+ 25-3000+ 25-9000
HealthcarePractitioners
andTechnical
Occupations29-0000
Total
Nonresidentalien
200 439 48 687
Hispanic/Latino 49 66 12 127AmericanIndian orAlaska Native
3 1 4
Asian 29 96 7 132Black orAfricanAmerican
20 35 11 66
NativeHawaiian orOther PacificIslander
1 1
White 316 492 86 894Two or moreraces
13 14 5 32
Race andethnicityunknown
41 72 12 125
Total men 671 1,216 0 181 0 0 0 0 2,068
WomenRace/ethnicity Teaching
25-1191Research Management
Occupations11-0000
Businessand
FinancialOperations
Occupations13-0000
Computer,Engineering,and ScienceOccupations
15-0000+ 17-0000+ 19-0000
Community,Social
Service,Legal, Arts,
Design,Entertainment,
Sports, andMedia
Occupations21-0000
+ 23-0000+ 27-0000
Library andStudent andAcademicAffairs and
OtherEducationServices
Occupations25-4000
+ 25-2000+ 25-3000+ 25-9000
HealthcarePractitioners
andTechnical
Occupations29-0000
Total
Nonresidentalien
137 260 64 461
Hispanic/Latino 59 62 19 140AmericanIndian orAlaska Native
1 1 2
Asian 32 65 12 109Black orAfricanAmerican
30 42 18 90
0

NativeHawaiian orOther PacificIslanderWhite 335 363 139 837Two or moreraces
8 7 4 19
Race andethnicityunknown
29 49 11 89
Total women 631 849 0 267 0 0 0 0 1,747
Total(men+women)
1,302 2,065 0 448 0 0 0 0 3,815
Total from prioryear
1,317 2,099 477 3,893

Institution: University of Florida (134130)User ID: 88G4433
Part E - Part-time Staff by Occupational Category and Tenure StatusNumber of Part-time Staff
As of November 1, 2014 Non-medical school staffOccupational category With Faculty status
Tenured OnTenureTrack
Not on Tenure TrackMulti-year,
continuing, orat-will contract
Annualcontract
Less-than-annualcontract
WithoutFacultystatus
Total
Primarily Instruction 30 3 0 348 0 0 381 Exclusively credit 30 3 348 381
Exclusively not-for-credit
0
Combined credit/not-for-credit
0
Instruction/research/public service staff 3 1 4Research staff 2 54 56Public Service staff 1 131 132Archivists, Curators, and MuseumTechnicians25-4010
3 3
Librarians25-4020
0
Library Technicians25-4030
1 1
Student and Academic Affairs and OtherEducation Services Occupations25-2000 + 25-3000 + 25-9000
2 1 8 11
Management Occupations11-0000
1 1 5 7
Business and Financial OperationsOccupations13-0000
13 13
Computer, Engineering, and ScienceOccupations15-0000 + 17-0000 + 19-0000
32 32
Community, Social Service, Legal, Arts,Design, Entertainment, Sports, and MediaOccupations21-0000 + 23-0000 + 27-0000
8 8
Healthcare Practitioners and TechnicalOccupations29-0000
13 13
Total 38 4 0 536 0 83 661Total from prior year 38 5 519 78 640 Medical school staffOccupational category With Faculty status
Tenured OnTenureTrack
Not on Tenure TrackMulti-year,
continuing, orat-will contract
Annualcontract
Less-than-annualcontract
WithoutFacultystatus
Total
Primarily Instruction 19 5 0 60 0 0 84 Exclusively credit 19 5 60 84 Exclusively not-for-
credit 0
Combined credit/not-for-credit
0
Instruction/research/public service staff 2 2Research staff 22 22Public Service staff 215 215
0

Archivists, Curators, and MuseumTechnicians25-4010Librarians25-4020
0
Library Technicians25-4030
0
Student and Academic Affairs and OtherEducation Services Occupations25-2000 + 25-3000 + 25-9000
3 3
Management Occupations11-0000
1 1 2 4
Business and Financial OperationsOccupations13-0000
4 4
Computer, Engineering, and ScienceOccupations15-0000 + 17-0000 + 19-0000
9 9
Community, Social Service, Legal, Arts,Design, Entertainment, Sports, and MediaOccupations21-0000 + 23-0000 + 27-0000
7 7
Healthcare Practitioners and TechnicalOccupations29-0000
28 28
Total 21 6 0 298 0 53 378Total from prior year 25 5 299 54 383

Institution: University of Florida (134130)User ID: 88G4433
Part E - Part-time Staff by Medical School StatusNumber of Part-time Staff
As of November 1, 2014
Occupational category Total(carriedforward
from Part D)
Non-Medicalschool staff
Medicalschoolstaff
Service Occupations31-0000 + 33-0000 + 35-0000 + 37-0000 + 39-0000
10 9 1
Sales and Related Occupations41-0000
0
Office and Administrative Support Occupations43-0000
31 26 5
Natural Resources, Construction, and Maintenance Occupations45-0000 + 47-0000 + 49-0000
4 4
Production, Transportation, and Material Moving Occupations51-0000 + 53-0000
0
Total 39 6PY Total 34 8 Graduate Assistants 3,815 3,399 416PY Graduate Assistants 3,476 417 Teaching
25-1191 1,302 1,246 56
Research 2,065 1,765 300 Management Occupations
11-0000 0
Business and Financial Operations Occupations13-0000
448 388 60
Computer, Engineering, and Science Occupations15-0000 + 17-0000 + 19-0000
0
Community, Social Service, Legal, Arts, Design, Entertainment, Sports, andMedia Occupations21-0000 + 23-0000 + 27-0000
0
Library and Student and Academic Affairs and Other Education ServicesOccupations25-4000 + 25-2000 + 25-3000 + 25-9000
0
Healthcare Practitioners and Technical Occupations29-0000
0

Institution: University of Florida (134130)User ID: 88G4433
Part F - Part-time Summary Non-medical school staffSummary of Part-time Non-medical School Staff
As of November 1, 2014 Occupational category With Faculty status
Tenured OnTenureTrack
Not on Tenure TrackMulti-year,
continuing, orat-will contract
Annualcontract
Less-than-annualcontract
WithoutFacultystatus
Total
Primarily Instruction 30 3 0 348 0 0 381 Exclusively credit 30 3 348 381 Exclusively not-for-credit 0 Combined credit/not-for-credit 0Instruction/research/public service staff 3 1 4Research staff 2 54 56Public Service staff 1 131 132Archivists, Curators, and MuseumTechnicians25-4010
3 3
Librarians25-4020
0
Library Technicians25-4030
1 1
Student and Academic Affairs and OtherEducation Services Occupations25-2000 + 25-3000 + 25-9000
2 1 8 11
Management Occupations11-0000
1 1 5 7
Business and Financial OperationsOccupations13-0000
13 13
Computer, Engineering, and ScienceOccupations15-0000 + 17-0000 + 19-0000
32 32
Community, Social Service, Legal, Arts,Design, Entertainment, Sports, and MediaOccupations21-0000 + 23-0000 + 27-0000
8 8
Healthcare Practitioners and TechnicalOccupations29-0000
13 13
Service Occupations31-0000 + 33-0000 + 35-0000 + 37-0000+ 39-0000
9
Sales and Related Occupations41-0000
Office and Administrative SupportOccupations43-0000
26
Natural Resources, Construction, andMaintenance Occupations45-0000 + 47-0000 + 49-0000
4
Production, Transportation, and MaterialMoving Occupations51-0000 + 53-0000
Graduate Assistants 3,399 Teaching25-1191
1,246
Research 1,765 Management Occupations11-0000
Business and Financial OperationsOccupations13-0000
388

Computer, Engineering, and ScienceOccupations15-0000 + 17-0000 + 19-0000
Community, Social Service, Legal, Arts,Design, Entertainment, Sports, andMedia Occupations21-0000 + 23-0000 + 27-0000
Library and Student and Academic Affairsand Other Education ServicesOccupations25-4000 + 25-2000 + 25-3000 + 25-9000
Healthcare Practitioners and TechnicalOccupations29-0000
Total 4,099

Institution: University of Florida (134130)User ID: 88G4433
Part F - Part-time Summary Medical school staffSummary of Part-time Medical School Staff
As of November 1, 2014 Occupational category With Faculty status
Tenured OnTenureTrack
Not on Tenure TrackMulti-year,
continuing, at-will contract
Annualcontract
Less-than-annualcontract
WithoutFacultystatus
Total
Primarily Instruction 19 5 0 60 0 0 84 Exclusively credit 19 5 60 84 Exclusively not-for-credit 0 Combined credit/not-for-credit 0Instruction/research/public service staff 2 2Research staff 22 22Public Service staff 215 215Archivists, Curators, and Museum Technicians25-2000 + 25-3000 + 25-9000
0
Librarians25-4020
0
Library Technicians25-4030
0
Student and Academic Affairs and OtherEducation Services Occupations25-2000 + 25-3000 + 25-9000
3 3
Management Occupations11-0000
1 1 2 4
Business and Financial OperationsOccupations13-0000
4 4
Computer, Engineering, and ScienceOccupations15-0000 + 17-0000 + 19-0000
9 9
Community, Social Service, Legal, Arts,Design, Entertainment, Sports, and MediaOccupations21-0000 + 23-0000 + 27-0000
7 7
Healthcare Practitioners and TechnicalOccupations29-0000
28 28
Service Occupations31-0000 + 33-0000 + 35-0000 + 37-0000 + 39-0000
1
Sales and Related Occupations41-0000
Office and Administrative Support Occupations43-0000
5
Natural Resources, Construction, andMaintenance Occupations45-0000 + 47-0000 + 49-0000
Production, Transportation, and MaterialMoving Occupations51-0000 + 53-0000
Graduate Assistants 416 Teaching25-1191
56
Research 300 Management Occupations11-0000
Business and Financial OperationsOccupations13-0000
60
Computer, Engineering, and ScienceOccupations15-0000 + 17-0000 + 19-0000

Community, Social Service, Legal, Arts,Design, Entertainment, Sports, and MediaOccupations21-0000 + 23-0000 + 27-0000
Library and Student and Academic Affairsand Other Education Services Occupations25-4000 + 25-2000 + 25-3000 + 25-9000
Healthcare Practitioners and TechnicalOccupations29-0000
Total 800

Institution: University of Florida (134130)User ID: 88G4433
Part H - New Hires, Full-time Instructional Staff by Tenure StatusNumber of Newly Hired Full-time Permanent Instructional Staff
(Hired full-time between July 1 and October 31, 2014 andstill on the payroll of the institution as of November 1, 2014)
•Report Hispanic/Latino individuals of any race as Hispanic/Latino•Report race for non-Hispanic/Latino individuals only•Include Primarily Instruction and Instruction Combined with Research and Public Service•Include both medical school and non-medical school staff
MenRace/ethnicity With Faculty status
Tenured On TenureTrack
Not on Tenure TrackMulti-year, continuing,
or at-will contractAnnualcontract
Less-than-annualcontract
WithoutFacultystatus
Total
Nonresident alien 1 4 5Hispanic/Latino 1 2 3American Indian orAlaska Native
0
Asian 1 3 4 8Black or AfricanAmerican
1 2 3
Native Hawaiian or OtherPacific Islander
0
White 4 6 10 20Two or more races 1 1 2Race and ethnicityunknown
1 1
Total men 6 13 0 23 0 0 42
WomenRace/ethnicity With Faculty status
Tenured On TenureTrack
Not on Tenure TrackMulti-year, continuing,
or at-will contractAnnualcontract
Less-than-annualcontract
WithoutFacultystatus
Total
Nonresident alien 1 4 5Hispanic/Latino 1 1American Indian orAlaska Native
0
Asian 1 1 2 4Black or AfricanAmerican
3 3
Native Hawaiian or OtherPacific Islander
0
White 6 3 17 26Two or more races 0Race and ethnicityunknown
2 2
Total women 8 8 0 25 0 0 41
Total (men+women) 14 21 0 48 0 0 83

Institution: University of Florida (134130)User ID: 88G4433
Part H - New Hires, Full-time Staff by Occupational CategoryNumber of Newly Hired Full-time Staff
(Hired full-time between July 1 and October 31, 2014 andstill on the payroll of the institution as of November 1, 2014)
•Report Hispanic/Latino individuals of any race as Hispanic/Latino•Report race for non-Hispanic/Latino individuals only•Include both medical school and non-medical school staff
MenRace/ethnicity Instructional
Staff(from Part H,
screen 1)
Researchstaff
PublicService
staff
Library and Student and Academic Affairs and OtherEducation Services Occupations
25-4000 + 25-2000 + 25-3000 + 25-9000
Nonresident alien 5 6 1Hispanic/Latino 3 3 5 American Indian orAlaska Native
0
Asian 8 6 Black or AfricanAmerican
3 2 2
Native Hawaiian or OtherPacific Islander
0
White 20 3 11 5Two or more races 2 Race and ethnicityunknown
1 1 2 1
Total men 42 7 32 9
WomenRace/ethnicity Instructional
Staff(from Part H,
screen 1)
Researchstaff
PublicService
staff
Library and Student and Academic Affairs and OtherEducation Services Occupations
25-4000 + 25-2000 + 25-3000 + 25-9000
Nonresident alien 5 1 2 Hispanic/Latino 1 2 2American Indian orAlaska Native
0
Asian 4 7 Black or AfricanAmerican
3 2 4
Native Hawaiian or OtherPacific Islander
0
White 26 2 20 11Two or more races 0 Race and ethnicityunknown
2
Total women 41 3 33 17
Total (men+women) 83 10 65 26

Institution: University of Florida (134130)User ID: 88G4433
Part H - New Hires, Full-time Staff by Occupational CategoryNumber of Newly Hired Full-time Staff
(Hired full-time between July 1 and October 31, 2014 andstill on the payroll of the institution as of November 1, 2014)
•Report Hispanic/Latino individuals of any race as Hispanic/Latino•Report race for non-Hispanic/Latino individuals only
MenRace/ethnicity Management
Occupations11-0000
Business andFinancial
OperationsOccupations
13-0000
Computer, Engineering,and Science Occupations15-0000 + 17-0000 + 19-
0000
Community, Social Service,Legal, Arts, Design,
Entertainment, Sports, andMedia Occupations
21-0000 + 23-0000 + 27-0000
HealthcarePractitioners
and TechnicalOccupations
29-0000Nonresidentalien
Hispanic/Latino 1 1 American Indianor Alaska Native
1
Asian 2 Black or AfricanAmerican
2
Native Hawaiianor Other PacificIslander
White 5 8 15 2 1Two or moreraces
1
Race andethnicityunknown
1
Total men 7 8 21 3 1
WomenRace/ethnicity Management
Occupations11-0000
Business andFinancial
OperationsOccupations
13-0000
Computer, Engineering,and Science Occupations15-0000 + 17-0000 + 19-
0000
Community, Social Service,Legal, Arts, Design,
Entertainment, Sports, andMedia Occupations
21-0000 + 23-0000 + 27-0000
HealthcarePractitioners
and TechnicalOccupations
29-0000Nonresidentalien
1
Hispanic/Latino 1 2 1 3American Indianor Alaska Native
Asian 3 Black or AfricanAmerican
1 2 1 1 3
Native Hawaiianor Other PacificIslander
1
White 8 17 13 9 16Two or moreraces
1
Race andethnicityunknown
Total women 9 20 22 11 22
Total(men+women)
16 28 43 14 23

Institution: University of Florida (134130)User ID: 88G4433
Part H - New Hires, Full-time Staff by Occupational CategoryNumber of Newly Hired Full-time Staff
(Hired full-time between July 1 and October 31, 2014 andstill on the payroll of the institution as of November 1, 2014)
•Report Hispanic/Latino individuals of any race as Hispanic/Latino•Report race for non-Hispanic/Latino individuals only•Include both medical school and non-medical school staff
MenRace/ethnicity Service Occupations
31-0000 + 33-0000 + 35-0000 + 37-0000+ 39-0000
Sales andRelatedOccupations41-0000
Office andAdministrativeSupportOccupations43-0000
Natural Resources,Construction, andMaintenanceOccupations45-0000 + 47-0000 + 49-0000
Production,Transportation,and MaterialMovingOccupations51-0000 + 53-0000
GrandTotal(All full-timenewhires)
Nonresidentalien
12
Hispanic/Latino 1 1 15AmericanIndian orAlaska Native
1 2
Asian 1 17Black orAfricanAmerican
1 1 11
NativeHawaiian orOther PacificIslander
0
White 9 6 16 1 102Two or moreraces
1 4
Race andethnicityunknown
6
Total men 10 0 11 17 1 169
WomenRace/ethnicity Service Occupations
31-0000 + 33-0000 + 35-0000 + 37-0000+ 39-0000
Sales andRelatedOccupations41-0000
Office andAdministrativeSupportOccupations43-0000
Natural Resources,Construction, andMaintenanceOccupations45-0000 + 47-0000 + 49-0000
Production,Transportation,and MaterialMovingOccupations51-0000 + 53-0000
GrandTotal(All full-timenewhires)
Nonresidentalien
1 10
Hispanic/Latino 3 1 16AmericanIndian orAlaska Native
0
Asian 4 18Black orAfricanAmerican
5 6 28
NativeHawaiian orOther PacificIslander
1
White 3 43 1 169Two or moreraces
1

Race andethnicityunknown
2 4
Total women 14 0 54 1 0 247
Total(men+women)
24 0 65 18 1 416

Institution: University of Florida (134130)User ID: 88G4433
Human Resources Survey EvaluationWere any staff members difficult to categorize? If so, please explain in the box below. No.

Institution: University of Florida (134130)User ID: 88G4433
Prepared by This survey component was prepared by: Keyholder SFA Contact HR Contact
Finance Contact Academic Library Contact Other
Name: Noelle A. Mecoli, Assistant Director Email: [email protected] How long did it take to prepare thissurvey component?
20hours minutes
The name of the preparer is being collected so that we can follow up with the appropriate person in the event that thereare questions concerning the data. The Keyholder will be copied on all email correspondence to other preparers.The time it took to prepare this component is being collected so that we can continue to improve our estimate of thereporting burden associated with IPEDS. Please include in your estimate the time it took for you to review instructions,query and search data sources, complete and review the component, and submit the data through the Data CollectionSystem.Thank you for your assistance.

Institution: University of Florida (134130) User ID: 88G4433Summary
Human Resources Component Summary
IPEDS collects important information regarding your institution. All data reported in IPEDSsurvey components become available in the IPEDS Data Center and appear as aggregated datain various Department of Education reports. Additionally, some of the reported data appearsspecifically for your institution through the College Navigator website and is included in yourinstitution’s Data Feedback Report (DFR). The purpose of this summary is to provide you anopportunity to view some of the data that, when accepted through the IPEDS quality controlprocess, will appear on the College Navigator website and/or your DFR. College Navigator isupdated approximately three months after the data collection period closes and Data FeedbackReports will be available through the Data Center and sent to your institution’s CEO inNovember 2015.
Please review your data for accuracy. If you have questions about the data displayed belowafter reviewing the data reported on the survey screens, please contact the IPEDS Help Desk at:1-877-225-2568 or [email protected].
Number of staff by employment status and occupational category:Fall 2014
Occupational category Reported values FTEstaff
Number offull-time staff
Number ofpart-time staff
Total number of staff 13,135 1,084 13,496
Instructional Staff 2,472 471 2,629
Primary Instruction 2,192 465 2,347
Exclusively credit 2,192 465 2,347
Exclusively not-for-credit 0 0 0
Combined credit/not-for-credit 0 0 0
Instruction/research/public service 280 6 282
Research Staff 482 78 508
Public Service Staff 1,275 347 1,391
Library and Student and Academic Affairs and Other EducationServices Occupations SOC
732 18 738
Librarians, Curators, and ArchivistsSOC 25-4000
187 4 188
Archivists, Curators, and Museum TechniciansSOC 25-4010
56 3 57
LibrariansSOC 25-4020
72 0 72
Library TechniciansSOC 25-4030
59 1 59
Student and Academic Affairs and Other Education ServicesOccupationsSOC 25-2000 + 25-3000 + 25-9000
545 14 550
Management OccupationsSOC 11-0000
864 11 868
Business and Financial Operations OccupationsSOC 13-0000
887 17 893
Computer, Engineering, and Science OccupationsSOC 15-0000 + 17-0000 + 19-0000
1,961 41 1,975
Community, Social Service, Legal, Arts, Design, Entertainment,Sports and Media OccupationsSOC 21-0000 + 23-0000 + 27-0000
349 15 354
Healthcare Practitioners and Technical OccupationsSOC 29-0000
563 41 577
Service OccupationsSOC 31-0000 + 33-0000 + 35-0000 + 37-0000 + 39-0000
879 10 882
Sales and Related OccupationsSOC 41-0000
7 7
Office and Administrative Support OccupationsSOC 43-0000
2,004 31 2,014
Natural Resources, Construction, and Maintenance OccupationsSOC 45-0000 + 47-0000 + 49-0000
607 4 608

Number of staff by employment status and occupational category:Fall 2014
Production, Transportation, and Material Moving OccupationsSOC 51-0000 + 53-0000
53 53
NOTE: Full-time-equivalent (FTE) staff is calculated by summing the total number of full-time staff and adding one-third of the total number of part-time staff. Graduate assistants are not included in the above figures. Many of theFTE figures may be included in the DFR.
Salaries of full-time instructional staff by contract length and academic rank:Academic year 2014-15
Academicrank
Months Covered by Annual Salary12
months11
months10
months9 months
Total Stafffor Salaryreporting
TotalNumber
of MonthsSalary
Outlays
WeightedAverageMonthlySalaries
All Ranks 795 1,241 2,036 20,709 $224,685,714 $10,850
Professor 279 507 786 7,911 $115,342,536 $14,580
Associateprofessor
174 373 547 5,445 $53,830,298 $9,886
Assistantprofessor
127 177 304 3,117 $28,100,356 $9,015
Instructor
Lecturer 95 180 275 2,760 $18,284,133 $6,625
No academicrank
120 4 124 1,476 $9,128,391 $6,185
NOTE: The above data are based on the Salary Outlays part of the IPEDS HR component. The Weighted averagemonthly salaries of full-time instructional staff by academic rank are calculated by adding the salary outlays reportedfor Men plus Women by academic rank, then dividing the sum by the "Total Number of Months" for Men plus Womenby academic rank. Salaries of full-time instructional staff paid less than 9 months per year are not collected. Also,salaries of medical school staff are not collected. The weighted average monthly salaries may be included in the DFR.

Institution: University of Florida (134130) User ID: 88G4433Edit Report
Human Resources
University of Florida (134130)
Source Description Severity Resolved OptionsScreen: D - PT Staff, Occupation - 2
ScreenEntry
This number is outside the expected range of between 1 and 30based on the prior year value. Please correct your data or explain.(Error #1387)
Explanation Yes
Reason: The PT Librarian from 201314 is no longer employeed

Human Resources 2014-15Institution: University of Florida-Online (484473)User ID: 88G4433
OverviewHuman Resources Overview
Welcome to the IPEDS Human Resources (HR) survey component. The HR component collects important informationabout your institution's staff.
Data Reporting Reminders • Report each employee only once. If an employee could be coded in more than one occupation,
code the employee in the occupation that requires the highest level of skill OR if there is nomeasurable difference in skill requirements, code the employee in the occupation in which theyspend the most time.
• Report staff members difficult to categorize in the "Human Resources Survey Evaluation" boxat the end of the survey.
• Enter data on each displayed screen. If a screen is not applicable, enter at least one zero in afield on the screen and save before continuing.
• When reporting salary data (applicable to degree-granting institutions only) include all full-time, non-medical school, instructional staff - both with and without faculty status.
See the instructions for the Key Reporting Concepts section -- basic reporting concepts that will assist you incompleting the Human Resources survey component.
Resources: • To download the survey materials for this component: Survey Materials
• To access your prior year data submission for this component: Reported Data• All staff must now be reported using the new IPEDS occupational categories, which align with the 2010
Standard Occupational Classfication (SOC) codes. Additional information and resources can be found in theIPEDS HR/SOC Information Center, including general information about the SOC, the IPEDS/SOCcrosswalk, a SOC Browse Tool, frequently asked questions, and web tutorials.
If you have questions about completing this survey, please contact the IPEDS Help Desk at 1-877-225-2568.

Institution: University of Florida-Online (484473)User ID: 88G4433
Human Resources Screening QuestionsDoes your institution have any part-time staff?If you answer Yes to this question, you will be provided the screens to report part-time staff. Yes No
Does your institution have 15 or more full-time staff? Yes No
Do ALL of the instructional staff at your institution fall into any of the following categories?If you answer Yes to any of the questions below, you will NOT be required to report Part G - Salaries for instructionalstaff. However, Part G will still be required for reporting data for full-time non-instructional staff. No Yes Are ALL of the instructional staff military personnel?
No Yes Do ALL of the instructional staff contribute their services (e.g., members of a religious order)?
The reporting of data by gender AND race/ethnicity is optional this year as it is in even-numbered years.Do you wish to report data by gender AND race/ethnicity this year?If you answer No, screens to report data by employment status (full-time and part-time) and occupational category willbe displayed.If you answer Yes, screens to report data by employment status (full-time and part-time), occupational category, andgender AND race/ethnicity will be displayed and you must complete all applicable screens.
No, I will not report data by gender and race/ethnicity this year
Yes, I will report data by gender and race/ethnicity this year
You may use the space below to provide context for the data you've reported above.

Institution: University of Florida-Online (484473)User ID: 88G4433
Human Resources Screening QuestionsDoes your institution have a tenure system?If you answer Yes to this question, you will be provided the screens to report some data by tenure status. Yes No
Does your institution have graduate assistants?If you answer Yes to this question, you will be provided the screens to report graduate assistants. Yes No
Did your institution hire any full-time permanent staff who were included on the payroll of the institutionbetween July 1 and October 31, 2014 either for the first time (new to the institution) or after a break in serviceAND who were still on the payroll of the institution as of November 1, 2014? (Exclude persons who havereturned from sabbatical leave and full-time instructional staff who are working less-than-9-month contracts.)If you answer Yes to this question, you will be provided the screens to report full-time permanent new hires in Part H. Yes No

Institution: University of Florida-Online (484473)User ID: 88G4433
Part A1 - Full-time Instructional Staff by Academic Rank and Tenure Status - TenuredNumber of Full-time Instructional Staff
With Faculty StatusTenured
As of November 1, 2014•Report Hispanic/Latino individuals of any race as Hispanic/Latino•Report race for non-Hispanic/Latino individuals only•Include both Primarily Instruction and Instruction Combined with Research and/or Public Service MenRace/ethnicity Academic Rank
ProfessorsAssociateprofessors
Assistantprofessors Instructors Lecturers
No academicrank Total
Nonresident alien 0Hispanic/Latino 0American Indian or Alaska Native 0Asian 0Black or African American 0Native Hawaiian or Other Pacific Islander 0White 1 1Two or more races 0Race and ethnicity unknown 0Total men 0 1 0 0 0 0 1
WomenRace/ethnicity Academic Rank
ProfessorsAssociateprofessors
Assistantprofessors Instructors Lecturers
No academicrank Total
Nonresident alien 0Hispanic/Latino 0American Indian or Alaska Native 0Asian 0Black or African American 0Native Hawaiian or Other Pacific Islander 0White 0Two or more races 0Race and ethnicity unknown 0Total women 0 0 0 0 0 0 0
Total (men+women) 0 1 0 0 0 0 1Total from prior year

Institution: University of Florida-Online (484473)User ID: 88G4433
Part A1 - Full-time Instructional Staff by Academic Rank and Tenure Status - OnTenure Track
Number of Full-time Instructional StaffWith Faculty Status
On Tenure Track
As of November 1, 2014•Report Hispanic/Latino individuals of any race as Hispanic/Latino•Report race for non-Hispanic/Latino individuals only•Include both Primarily Instruction and Instruction Combined with Research and/or Public Service MenRace/ethnicity Academic Rank
ProfessorsAssociateprofessors
Assistantprofessors Instructors Lecturers
No academicrank Total
Nonresident alien 0 0Hispanic/Latino 0American Indian or Alaska Native 0Asian 0Black or African American 0Native Hawaiian or Other Pacific Islander 0White 0Two or more races 0Race and ethnicity unknown 0Total men 0 0 0 0 0 0 0 WomenRace/ethnicity Academic Rank
ProfessorsAssociateprofessors
Assistantprofessors Instructors Lecturers
No academicrank Total
Nonresident alien 0 0Hispanic/Latino 0American Indian or Alaska Native 0Asian 0Black or African American 0Native Hawaiian or Other Pacific Islander 0White 0Two or more races 0Race and ethnicity unknown 0Total women 0 0 0 0 0 0 0 Total (men+women) 0 0 0 0 0 0 0Total from prior year

Institution: University of Florida-Online (484473)User ID: 88G4433
Part A1 - Full-time Instructional Staff by Academic Rank and Tenure Status - Multi-Year Contract
Number of Full-time Instructional StaffWith Faculty Status
Not on Tenure Track - Multi-Year or Continuing or At-will Contract
As of November 1, 2014•Report Hispanic/Latino individuals of any race as Hispanic/Latino•Report race for non-Hispanic/Latino individuals only•Include both Primarily Instruction and Instruction Combined with Research and/or Public Service MenGender and race/ethnicity Academic Rank
ProfessorsAssociateprofessors
Assistantprofessors Instructors Lecturers
No academicrank Total
Nonresident alien 0 0Hispanic/Latino 0American Indian or Alaska Native 0Asian 0Black or African American 0Native Hawaiian or Other Pacific Islander 0White 0Two or more races 0Race and ethnicity unknown 0Total men 0 0 0 0 0 0 0 WomenGender and race/ethnicity Academic Rank
ProfessorsAssociateprofessors
Assistantprofessors Instructors Lecturers
No academicrank Total
Nonresident alien 0Hispanic/Latino 0American Indian or Alaska Native 0Asian 0Black or African American 0Native Hawaiian or Other Pacific Islander 0White 0Two or more races 0Race and ethnicity unknown 0Total women 0 0 0 0 0 0 0 Total (men+women) 0 0 0 0 0 0 0Total from prior year

Institution: University of Florida-Online (484473)User ID: 88G4433
Part A1 - Full-time Instructional Staff by Academic Rank and Tenure Status - AnnualContract
Number of Full-time Instructional StaffWith Faculty Status
Not on Tenure Track - Annual Contract
As of November 1, 2014•Report Hispanic/Latino individuals of any race as Hispanic/Latino•Report race for non-Hispanic/Latino individuals only•Include both Primarily Instruction and Instruction Combined with Research and/or Public Service MenRace/ethnicity Academic Rank
ProfessorsAssociateprofessors
Assistantprofessors Instructors Lecturers
No academicrank Total
Nonresident alien 0Hispanic/Latino 0American Indian or Alaska Native 0Asian 0Black or African American 0Native Hawaiian or Other Pacific Islander 0White 1 1Two or more races 0Race and ethnicity unknown 0Total men 0 0 0 0 1 0 1 WomenRace/ethnicity Academic Rank
ProfessorsAssociateprofessors
Assistantprofessors Instructors Lecturers
No academicrank Total
Nonresident alien 0Hispanic/Latino 0American Indian or Alaska Native 0Asian 0Black or African American 0Native Hawaiian or Other Pacific Islander 0White 2 1 3Two or more races 0Race and ethnicity unknown 0Total women 0 0 0 0 2 1 3 Total (men+women) 0 0 0 0 3 1 4Total from prior year

Institution: University of Florida-Online (484473)User ID: 88G4433
Part A1 - Full-time Instructional Staff by Academic Rank and Tenure Status - Less-Than-Annual Contract
Number of Full-time Instructional StaffWith Faculty Status
Not on Tenure Track - Less-than-annual Contract
As of November 1, 2014•Report Hispanic/Latino individuals of any race as Hispanic/Latino•Report race for non-Hispanic/Latino individuals only•Include both Primarily Instruction and Instruction Combined with Research and/or Public Service MenRace/ethnicity Academic Rank
ProfessorsAssociateprofessors
Assistantprofessors Instructors Lecturers
No academicrank Total
Nonresident alien 0 0Hispanic/Latino 0American Indian or Alaska Native 0Asian 0Black or African American 0Native Hawaiian or Other Pacific Islander 0White 0Two or more races 0Race and ethnicity unknown 0Total men 0 0 0 0 0 0 0 WomenRace/ethnicity Academic Rank
ProfessorsAssociateprofessors
Assistantprofessors Instructors Lecturers
No academicrank Total
Nonresident alien 0Hispanic/Latino 0American Indian or Alaska Native 0Asian 0Black or African American 0Native Hawaiian or Other Pacific Islander 0White 0Two or more races 0Race and ethnicity unknown 0Total women 0 0 0 0 0 0 0 Total (men+women) 0 0 0 0 0 0 0Total from prior year

Institution: University of Florida-Online (484473)User ID: 88G4433
Part A1 - Full-time Instructional Staff - Without Faculty StatusNumber of Full-time Instructional Staff
Without Faculty StatusAs of November 1, 2014
•Report Hispanic/Latino individuals of any race as Hispanic/Latino•Report race for non-Hispanic/Latino individuals only•Include both Primarily Instruction and Instruction Combined with Research and/or Public Service MenRace/ethnicity Without Faculty StatusNonresident alien 0Hispanic/Latino American Indian or Alaska Native Asian Black or African American Native Hawaiian or Other Pacific Islander White Two or more races Race and ethnicity unknown Total men 0
WomenRace/ethnicity Without Faculty StatusNonresident alien 0Hispanic/Latino American Indian or Alaska Native Asian Black or African American Native Hawaiian or Other Pacific Islander White Two or more races Race and ethnicity unknown Total women 0
Total (men+women) 0Total from prior year

Institution: University of Florida-Online (484473)User ID: 88G4433
Part A2 - Full-time Instructional Staff by FunctionNumber of Full-time Instructional Staff
As of November 1, 2014•Report Primarily Instruction and Instruction Combined with Research and/or Public Service separately, as indicatedbelow
With Faculty statusTenured On
TenureTrack
Not on Tenure TrackMulti-year,
continuing, or at-will contract
Annualcontract
Less-than-annualcontract
WithoutFacultystatus
Total
Instructional staff 1 0 0 4 0 0 5Total carried forward fromprevious screens
1 0 0 4 0 0 5
Primarily Instruction 1 0 0 4 0 0 5 Exclusively credit 1 4 5
Exclusively not-for-credit 0
Combined credit/not-for-credit 0 Instruction/research/publicservice staff
0
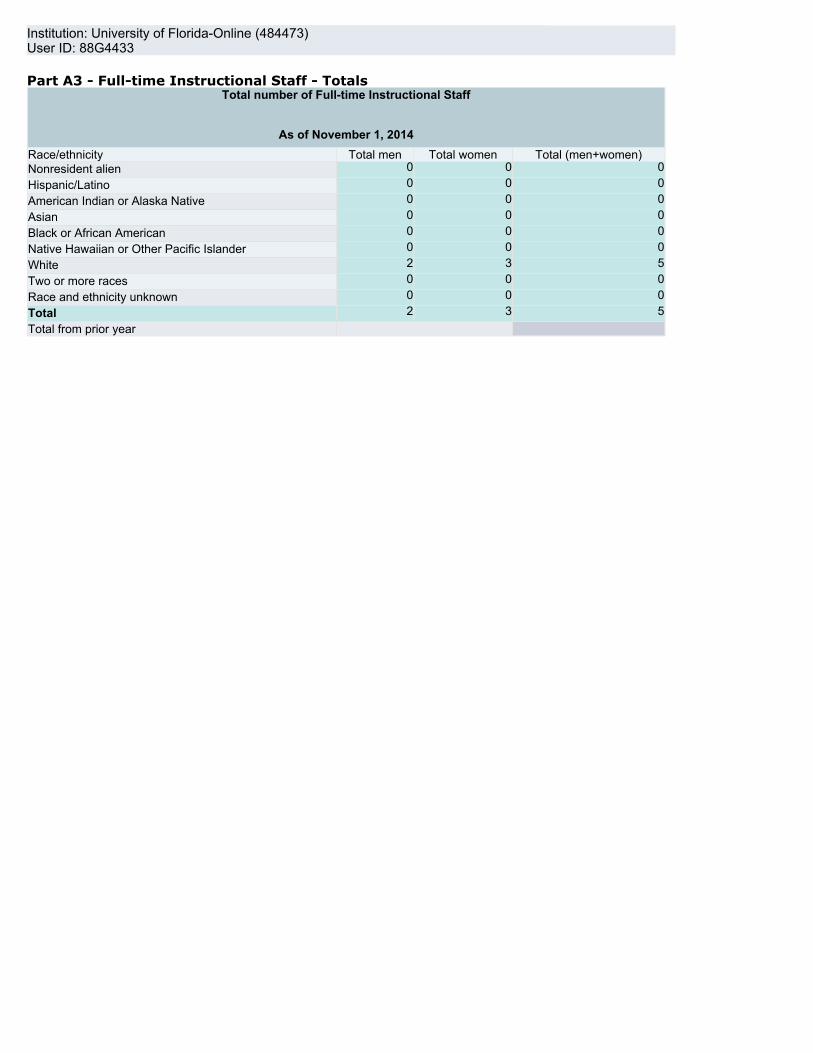
Institution: University of Florida-Online (484473)User ID: 88G4433
Part A3 - Full-time Instructional Staff - TotalsTotal number of Full-time Instructional Staff
As of November 1, 2014Race/ethnicity Total men Total women Total (men+women)Nonresident alien 0 0 0Hispanic/Latino 0 0 0American Indian or Alaska Native 0 0 0Asian 0 0 0Black or African American 0 0 0Native Hawaiian or Other Pacific Islander 0 0 0White 2 3 5Two or more races 0 0 0Race and ethnicity unknown 0 0 0Total 2 3 5Total from prior year

Institution: University of Florida-Online (484473)User ID: 88G4433
Part B1 - Full-time Non-instructional Staff by Occupational CategoryNumber of Full-time Non-instructional Staff
by Occupational Category
As of November 1, 2014•Report Hispanic/Latino individuals of any race as Hispanic/Latino•Report race for non-Hispanic/Latino individuals only MenRace/ethnicity Instructional Staff
(carried forwardfrom Part A)
Research staff Public Service staff
Nonresident alien 0 Hispanic/Latino 0 American Indian or Alaska Native 0 Asian 0 Black or African American 0 Native Hawaiian or Other Pacific Islander 0 White 2 Two or more races 0 Race and ethnicity unknown 0 0 Total men 2 0 0
WomenRace/ethnicity Instructional Staff
(carried forwardfrom Part A)
Research staff Public Service staff
Nonresident alien 0 0 Hispanic/Latino 0 American Indian or Alaska Native 0 Asian 0 Black or African American 0 Native Hawaiian or Other Pacific Islander 0 White 3 Two or more races 0 Race and ethnicity unknown 0 Total women 3 0 0
Total (men+women) 5 0 0Total from prior year

Institution: University of Florida-Online (484473)User ID: 88G4433
Part B1 - Full-time Non-instructional Staff by Occupational CategoryNumber of Full-time Non-instructional Staff
by Occupational Category
As of November 1, 2014•Report Hispanic/Latino individuals of any race as Hispanic/Latino•Report race for non-Hispanic/Latino individuals only MenRace/ethnicity Archivists, Curators, and
Museum Technicians25-4010
Librarians25-4020
LibraryTechnicians
25-4030
Student and Academic Affairs and OtherEducation Services Occupations25-2000 + 25-3000 + 25-9000
Nonresident alien Hispanic/Latino American Indian orAlaska Native
Asian Black or AfricanAmerican
Native Hawaiian orOther Pacific Islander
White 2Two or more races Race and ethnicityunknown
Total men 0 0 0 2
WomenRace/ethnicity Archivists, Curators, and
Museum Technicians25-4010
Librarians25-4020
LibraryTechnicians
25-4030
Student and Academic Affairs and OtherEducation Services Occupations25-2000 + 25-3000 + 25-9000
Nonresident alien Hispanic/Latino American Indian orAlaska Native
Asian Black or AfricanAmerican
1
Native Hawaiian orOther Pacific Islander
White 5Two or more races Race and ethnicityunknown
Total women 0 0 0 6
Total (men+women) 0 0 0 8Total from prior year

Institution: University of Florida-Online (484473)User ID: 88G4433
Part B1 - Full-time Non-instructional Staff by Occupational CategoryNumber of Full-time Non-instructional Staff
by Occupational Category
As of November 1, 2014•Report Hispanic/Latino individuals of any race as Hispanic/Latino•Report race for non-Hispanic/Latino individuals only MenRace/ethnicity Management
Occupations11-0000
Business andFinancial
OperationsOccupations
13-0000
Computer, Engineering,and Science Occupations15-0000 + 17-0000 + 19-
0000
Community, Social Service,Legal, Arts, Design,
Entertainment, Sports, andMedia Occupations
21-0000 + 23-0000 + 27-0000
HealthcarePractitioners
and TechnicalOccupations
29-0000Nonresidentalien
Hispanic/Latino American Indianor Alaska Native
Asian Black or AfricanAmerican
1 1
Native Hawaiianor Other PacificIslander
White 1 4 1 Two or moreraces
1
Race andethnicityunknown
Total men 0 2 6 1 0
WomenRace/ethnicity Management
Occupations11-0000
Business andFinancial
OperationsOccupations
13-0000
Computer, Engineering,and Science Occupations15-0000 + 17-0000 + 19-
0000
Community, Social Service,Legal, Arts, Design,
Entertainment, Sports, andMedia Occupations
21-0000 + 23-0000 + 27-0000
HealthcarePractitioners
and TechnicalOccupations
29-0000Nonresidentalien
Hispanic/Latino American Indianor Alaska Native
Asian Black or AfricanAmerican
Native Hawaiianor Other PacificIslander
White 2 2 1 1 Two or moreraces
1
Race andethnicityunknown
Total women 2 3 1 1 0
Total(men+women)
2 5 7 2 0
Total from prioryear

Institution: University of Florida-Online (484473)User ID: 88G4433
Part B1 - Full-time Non-instructional Staff by Occupational CategoryNumber of Full-time Non-instructional Staff
by Occupational Category
As of November 1, 2014•Report Hispanic/Latino individuals of any race as Hispanic/Latino•Report race for non-Hispanic/Latino individuals only MenRace/ethnicity Service Occupations
31-0000 + 33-0000 + 35-0000 + 37-0000+ 39-0000
Sales andRelatedOccupations41-0000
Office andAdministrativeSupportOccupations43-0000
Natural Resources,Construction, andMaintenanceOccupations45-0000 + 47-0000 + 49-0000
Production,Transportation,and MaterialMovingOccupations51-0000 + 53-0000
GrandTotal(All full-timestaff)
Nonresidentalien
0 0
Hispanic/Latino 0AmericanIndian orAlaska Native
0
Asian 0Black orAfricanAmerican
2
NativeHawaiian orOther PacificIslander
0
White 10Two or moreraces
1
Race andethnicityunknown
0
Total men 0 0 0 0 0 13
WomenRace/ethnicity Service Occupations
31-0000 + 33-0000 + 35-0000 + 37-0000+ 39-0000
Sales andRelatedOccupations41-0000
Office andAdministrativeSupportOccupations43-0000
Natural Resources,Construction, andMaintenanceOccupations45-0000 + 47-0000 + 49-0000
Production,Transportation,and MaterialMovingOccupations51-0000 + 53-0000
GrandTotal(All full-timestaff)
Nonresidentalien
0 0
Hispanic/Latino 0AmericanIndian orAlaska Native
0
Asian 0Black orAfricanAmerican
1
NativeHawaiian orOther PacificIslander
0
White 14Two or moreraces
1
0

Race andethnicityunknownTotal women 0 0 0 0 0 16
Total(men+women)
0 0 0 0 0 29
Total from prioryear

Institution: University of Florida-Online (484473)User ID: 88G4433
Part B2 - Full-time Non-instructional Staff by Occupational Category and TenureStatus
Number of Full-time Non-instructional Staff
As of November 1, 2014 Occupational category With Faculty status
Tenured OnTenureTrack
Not on Tenure TrackMulti-year,
continuing, or at-will contract
Annualcontract
Less-than-annualcontract
WithoutFacultystatus
Total
Research staff 0Public Service staff 0Archivists, Curators, and MuseumTechnicians25-4010
0
Librarians25-4020
0
Library Technicians25-4030
0
Student and Academic Affairs andOther Education Services Occupations25-2000 + 25-3000 + 25-9000
8 8
Management Occupations11-0000
2 2
Business and Financial OperationsOccupations13-0000
5 5
Computer, Engineering, and ScienceOccupations15-0000 + 17-0000 + 19-0000
7 7
Community, Social Service, Legal,Arts, Design, Entertainment, Sports,and Media Occupations21-0000 + 23-0000 + 27-0000
2 2
Healthcare Practitioners and TechnicalOccupations29-0000
0
Total 0 0 0 0 0 24 24Total from prior year

Institution: University of Florida-Online (484473)User ID: 88G4433
Part C - Full-time Summary Summary of Full-time Staff
As of November 1, 2014•Data will not be generated on this screen until the relevant screens in the previous section have been completed.
Occupational category With Faculty statusTenured On
TenureTrack
Not on Tenure TrackMulti-year,
continuing, orat-will
contract
Annualcontract
Less-than-annualcontract
WithoutFacultystatus
Total
Primarily Instruction 1 0 0 4 0 0 5 Exclusively credit 1 4 5 Exclusively not-for-credit 0 Combined credit/not-for-credit 0Instruction/research/public service staff 0Research staff 0Public Service staff 0Archivists, Curators, and Museum Technicians25-4010
0
Librarians25-4020
0
Library Technicians25-4030
0
Student and Academic Affairs and OtherEducation Services Occupations25-2000 + 25-3000 + 25-9000
8 8
Management Occupations11-0000
2 2
Business and Financial OperationsOccupations13-0000
5 5
Computer, Engineering, and ScienceOccupations15-0000 + 17-0000 + 19-0000
7 7
Community, Social Service, Legal, Arts,Design, Entertainment, Sports, and MediaOccupations21-0000 + 23-0000 + 27-0000
2 2
Healthcare Practitioners and TechnicalOccupations29-0000
0
Service Occupations31-0000 + 33-0000 + 35-0000 + 37-0000 + 39-0000
0
Sales and Related Occupations41-0000
0
Office and Administrative Support Occupations43-0000
0
Natural Resources, Construction, andMaintenance Occupations45-0000 + 47-0000 + 49-0000
0
Production, Transportation, and MaterialMoving Occupations51-0000 + 53-0000
0
Total 29

Institution: University of Florida-Online (484473)User ID: 88G4433
Part G - Salaries WorksheetNumber of Full-time Instructional Staff
For Calculation of Total Number of Months
Annual Salary, 2014-15•Report the number of instructional staff based on the number of months to be worked•Months reported should correspond with the number of months that staff worked (which may differ from the number ofmonths over which they are paid)•Include ONLY full-time instructional staff•Include instructional staff with faculty status and without faculty status•Include instructional staff regardless of tenure status•Balance column should include instructional staff whose annual salary covers less than 9 months worked
Gender andacademic rank
Months worked12
months11
months10
months9
months
Total Stafffor Salaryreporting
TotalNumber of
Months
Total full-timeinstructional staff
from Part A
Balance (All otherfull-time instructional
staff)MenProfessors 0 0 Associateprofessors
1 1 9
Assistantprofessors
0 0
Instructors 0 0 Lecturers 1 1 9 No academicrank
0 0
Total men 0 0 0 2 2 18 2 0
WomenProfessors 0 0 Associateprofessors
0 0
Assistantprofessors
0 0
Instructors 0 0 Lecturers 1 1 2 21 No academicrank
1 1 12
Total women 2 0 0 1 3 33 3 0
Total (men +women)
2 0 0 3 5 51 5 0

Institution: University of Florida-Online (484473)User ID: 88G4433
Part G - Salary outlays for instructional staffSalary Outlays
for Full-time Instructional Staff
Annual Salary Outlays, 2014-15•Report the TOTAL ANNUAL salary outlays for the full-time instructional staff reported in the 12 months, 11 months, 10months, and 9 months columns on the previous screen
Gender and academicrank
Total staff for salaryreporting(from Part G,screen 1)
Total Number ofMonths(from Part G,screen 1)
TotalAnnualSalary Outlays
Weighted Average MonthlySalaries
MenProfessors 0 0 Associate professors 1 9 96,323 10,703Assistant professors 0 0 Instructors 0 0 Lecturers 1 9 80,322 8,925No academic rank 0 0 Total men 2 18 176,645 9,814
WomenProfessors 0 0 Associate professors 0 0 Assistant professors 0 0 Instructors 0 0 Lecturers 2 21 101,756 4,846No academic rank 1 12 46,431 3,869Total women 3 33 148,187 4,491
Total (men + women) 5 51 324,832 6,369

Institution: University of Florida-Online (484473)User ID: 88G4433
Part G - Salary outlays for non-instructional staffSalary Outlays
for Full-time Non-instructional Staff
Annual Salary Outlays, 2014-15Occupational category Number of
full-time staff(carried forward from
previous screens)
Total annualsalary outlays
Research staff 0 Public Service staff 0 Library and Student and Academic Affairs and Other EducationServices Occupations25-4000 + 25-2000 + 25-3000 + 25-9000
8 431,555
Management Occupations11-0000
2 164,636
Business and Financial Operations Occupations13-0000
5 286,954
Computer, Engineering, and Science Occupations15-0000 + 17-0000 + 19-0000
7 429,923
Community, Social Service, Legal, Arts, Design, Entertainment, Sports,and Media Occupations21-0000 + 23-0000 + 27-0000
2 90,552
Healthcare Practitioners and Technical Occupations29-0000
0
Service Occupations31-0000 + 33-0000 + 35-0000 + 37-0000 + 39-0000
0
Sales and Related Occupations41-0000
0
Office and Administrative Support Occupations43-0000
0
Natural Resources, Construction, and Maintenance Occupations45-0000 + 47-0000 + 49-0000
0
Production, Transportation, and Material Moving Occupations51-0000 + 53-0000
0

Institution: University of Florida-Online (484473)User ID: 88G4433
Part D - Part-time Staff by Occupational CategoryNumber of Part-time Staff by Occupational Category
As of November 1, 2014•Report Hispanic/Latino individuals of any race as Hispanic/Latino•Report race for non-Hispanic/Latino individuals only MenRace/ethnicity Instructional staff Research staff Public Service staffNonresident alien Hispanic/Latino 2 American Indian or Alaska Native Asian Black or African American Native Hawaiian or Other Pacific Islander White 16 Two or more races Race and ethnicity unknown Total men 18 0 0
WomenRace/ethnicity Instructional staff Research staff Public Service staffNonresident alien 1 Hispanic/Latino 2 American Indian or Alaska Native Asian 2 Black or African American 3 Native Hawaiian or Other Pacific Islander White 15 Two or more races 1 Race and ethnicity unknown 1 Total women 25 0 0
Total (men+women) 43 0 0Total from prior year

Institution: University of Florida-Online (484473)User ID: 88G4433
Part D - Part-time Staff by Occupational CategoryNumber of Part-time Staff by Occupational Category
As of November 1, 2014•Report Hispanic/Latino individuals of any race as Hispanic/Latino•Report race for non-Hispanic/Latino individuals only MenRace/ethnicity Archivists,
Curators, andMuseum
Technicians25-4010
Librarians25-4020
LibraryTechnicians
25-4030
Student and Academic Affairsand Other Education Services
Occupations25-2000 + 25-3000 + 25-9000
Library and Student andAcademic Affairs and
Other EducationServices Occupations
Nonresident alien 0Hispanic/Latino 0American Indian orAlaska Native
0
Asian 0Black or AfricanAmerican
0
Native Hawaiian orOther PacificIslander
0
White 2 2Two or more races 0Race and ethnicityunknown
0
Total men 0 0 0 2 2
WomenRace/ethnicity Archivists,
Curators, andMuseum
Technicians25-4010
Librarians25-4020
LibraryTechnicians
25-4030
Student and Academic Affairsand Other Education Services
Occupations25-2000 + 25-3000 + 25-9000
Library and Student andAcademic Affairs and
Other EducationServices Occupations
Nonresident alien 0Hispanic/Latino 0American Indian orAlaska Native
0
Asian 0Black or AfricanAmerican
0
Native Hawaiian orOther PacificIslander
0
White 2 2Two or more races 0Race and ethnicityunknown
0
Total women 0 0 0 2 2
Total(men+women)
0 0 0 4 4
Total from prioryear

Institution: University of Florida-Online (484473)User ID: 88G4433
Part D - Part-time Staff by Occupational CategoryNumber of Part-time Staff
As of November 1, 2014•Report Hispanic/Latino individuals of any race as Hispanic/Latino•Report race for non-Hispanic/Latino individuals only MenRace/ethnicity Management
Occupations11-0000
Business andFinancial
OperationsOccupations
13-0000
Computer, Engineering,and Science Occupations15-0000 + 17-0000 + 19-
0000
Community, Social Service,Legal, Arts, Design,
Entertainment, Sports, andMedia Occupations
21-0000 + 23-0000 + 27-0000
HealthcarePractitioners
and TechnicalOccupations
29-0000Nonresidentalien
Hispanic/Latino 1 American Indianor Alaska Native
Asian 1 Black or AfricanAmerican
Native Hawaiianor Other PacificIslander
White 3 Two or moreraces
Race andethnicityunknown
Total men 0 0 5 0 0
WomenRace/ethnicity Management
Occupations11-0000
Business andFinancial
OperationsOccupations
13-0000
Computer, Engineering,and Science Occupations15-0000 + 17-0000 + 19-
0000
Community, Social Service,Legal, Arts, Design,
Entertainment, Sports, andMedia Occupations
21-0000 + 23-0000 + 27-0000
HealthcarePractitioners
and TechnicalOccupations
29-0000Nonresidentalien
Hispanic/Latino American Indianor Alaska Native
Asian Black or AfricanAmerican
Native Hawaiianor Other PacificIslander
White 2 Two or moreraces
Race andethnicityunknown
Total women 0 2 0 0 0
Total(men+women)
0 2 5 0 0
Total from prioryear

Institution: University of Florida-Online (484473)User ID: 88G4433
Part D - Part-time Staff by Occupational CategoryNumber of Part-time Staff
As of November 1, 2014•Report Hispanic/Latino individuals of any race as Hispanic/Latino•Report race for non-Hispanic/Latino individuals only MenRace/ethnicity Service Occupations
31-0000 + 33-0000 + 35-0000 + 37-0000+ 39-0000
Sales andRelatedOccupations41-0000
Office andAdministrativeSupportOccupations43-0000
Natural Resources,Construction, andMaintenanceOccupations45-0000 + 47-0000 + 49-0000
Production,Transportation,and MaterialMovingOccupations51-0000 + 53-0000
GrandTotal(All part-timestaff)
Nonresidentalien
0 0
Hispanic/Latino 3AmericanIndian orAlaska Native
0
Asian 1Black orAfricanAmerican
0
NativeHawaiian orOther PacificIslander
0
White 21Two or moreraces
0
Race andethnicityunknown
0
Total men 0 0 0 0 0 25
WomenRace/ethnicity Service Occupations
31-0000 + 33-0000 + 35-0000 + 37-0000+ 39-0000
Sales andRelatedOccupations41-0000
Office andAdministrativeSupportOccupations43-0000
Natural Resources,Construction, andMaintenanceOccupations45-0000 + 47-0000 + 49-0000
Production,Transportation,and MaterialMovingOccupations51-0000 + 53-0000
GrandTotal(All part-timestaff)
Nonresidentalien
0 1
Hispanic/Latino 2AmericanIndian orAlaska Native
0
Asian 2Black orAfricanAmerican
3
NativeHawaiian orOther PacificIslander
0
White 19Two or moreraces
1
Race andethnicityunknown
1

Total women 0 0 0 0 0 29
Total(men+women)
0 0 0 0 0 54
Total from prioryear

Institution: University of Florida-Online (484473)User ID: 88G4433
Part D - Graduate assistantsNumber of Graduate Assistants
As of November 1, 2014•Report Hispanic/Latino individuals of any race as Hispanic/Latino•Report race for non-Hispanic/Latino individuals only
MenRace/ethnicity Teaching
25-1191Research Management
Occupations11-0000
Businessand
FinancialOperations
Occupations13-0000
Computer,Engineering,and ScienceOccupations
15-0000+ 17-0000+ 19-0000
Community,Social
Service,Legal, Arts,
Design,Entertainment,
Sports, andMedia
Occupations21-0000
+ 23-0000+ 27-0000
Library andStudent andAcademicAffairs and
OtherEducationServices
Occupations25-4000
+ 25-2000+ 25-3000+ 25-9000
HealthcarePractitioners
andTechnical
Occupations29-0000
Total
Nonresidentalien
3 3
Hispanic/Latino 0AmericanIndian orAlaska Native
0
Asian 0Black orAfricanAmerican
1 1
NativeHawaiian orOther PacificIslander
0
White 3 3Two or moreraces
0
Race andethnicityunknown
0
Total men 7 0 0 0 0 0 0 0 7
WomenRace/ethnicity Teaching
25-1191Research Management
Occupations11-0000
Businessand
FinancialOperations
Occupations13-0000
Computer,Engineering,and ScienceOccupations
15-0000+ 17-0000+ 19-0000
Community,Social
Service,Legal, Arts,
Design,Entertainment,
Sports, andMedia
Occupations21-0000
+ 23-0000+ 27-0000
Library andStudent andAcademicAffairs and
OtherEducationServices
Occupations25-4000
+ 25-2000+ 25-3000+ 25-9000
HealthcarePractitioners
andTechnical
Occupations29-0000
Total
Nonresidentalien
2 2
Hispanic/Latino 1 1AmericanIndian orAlaska Native
0
Asian 0Black orAfricanAmerican
1 1
0

NativeHawaiian orOther PacificIslanderWhite 1 1Two or moreraces
1 1
Race andethnicityunknown
0
Total women 5 0 0 1 0 0 0 0 6
Total(men+women)
12 0 0 1 0 0 0 0 13
Total from prioryear

Institution: University of Florida-Online (484473)User ID: 88G4433
Part E - Part-time Staff by Occupational Category and Tenure StatusNumber of Part-time Staff
As of November 1, 2014 Occupational category With Faculty status
Tenured OnTenureTrack
Not on Tenure TrackMulti-year,
continuing, orat-will contract
Annualcontract
Less-than-annualcontract
WithoutFacultystatus
Total
Primarily Instruction 7 3 0 33 0 0 43 Exclusively credit 7 3 33 43
Exclusively not-for-credit
0
Combined credit/not-for-credit
0
Instruction/research/public service staff 0Research staff 0Public Service staff 0Archivists, Curators, and MuseumTechnicians25-4010
0
Librarians25-4020
0
Library Technicians25-4030
0
Student and Academic Affairs and OtherEducation Services Occupations25-2000 + 25-3000 + 25-9000
4 4
Management Occupations11-0000
0
Business and Financial OperationsOccupations13-0000
2 2
Computer, Engineering, and ScienceOccupations15-0000 + 17-0000 + 19-0000
5 5
Community, Social Service, Legal, Arts,Design, Entertainment, Sports, and MediaOccupations21-0000 + 23-0000 + 27-0000
0
Healthcare Practitioners and TechnicalOccupations29-0000
0
Total 7 3 0 33 0 11 54Total from prior year

Institution: University of Florida-Online (484473)User ID: 88G4433
Part F - Part-time Summary Summary of Part-time Staff
As of November 1, 2014 Occupational category With Faculty status
Tenured OnTenureTrack
Not on Tenure TrackMulti-year,
continuing, orat-will contract
Annualcontract
Less-than-annualcontract
WithoutFacultystatus
Total
Primarily Instruction 7 3 0 33 0 0 43 Exclusively credit 7 3 33 43 Exclusively not-for-credit 0 Combined credit/not-for-credit 0Instruction/research/public service staff 0Research staff 0Public Service staff 0Archivists, Curators, and MuseumTechnicians25-4010
0
Librarians25-4020
0
Library Technicians25-4030
0
Student and Academic Affairs and OtherEducation Services Occupations25-2000 + 25-3000 + 25-9000
4 4
Management Occupations11-0000
0
Business and Financial OperationsOccupations13-0000
2 2
Computer, Engineering, and ScienceOccupations15-0000 + 17-0000 + 19-0000
5 5
Community, Social Service, Legal, Arts,Design, Entertainment, Sports, and MediaOccupations21-0000 + 23-0000 + 27-0000
0
Healthcare Practitioners and TechnicalOccupations29-0000
0
Service Occupations31-0000 + 33-0000 + 35-0000 + 37-0000 +39-0000
0
Sales and Related Occupations41-0000
0
Office and Administrative SupportOccupations43-0000
0
Natural Resources, Construction, andMaintenance Occupations45-0000 + 47-0000 + 49-0000
0
Production, Transportation, and MaterialMoving Occupations51-0000 + 53-0000
0
Graduate Assistants 13 Teaching25-1191
12
Research 0 Management Occupations11-0000
0
Business and Financial OperationsOccupations13-0000
1
0

Computer, Engineering, and ScienceOccupations15-0000 + 17-0000 + 19-0000
Community, Social Service, Legal, Arts,Design, Entertainment, Sports, and MediaOccupations21-0000 + 23-0000 + 27-0000
0
Library and Student and Academic Affairsand Other Education ServicesOccupations25-4000 + 25-2000 + 25-3000 + 25-9000
0
Healthcare Practitioners and TechnicalOccupations29-0000
0
Total 67

Institution: University of Florida-Online (484473)User ID: 88G4433
Part H - New Hires, Full-time Instructional Staff by Tenure StatusNumber of Newly Hired Full-time Permanent Instructional Staff
(Hired full-time between July 1 and October 31, 2014 andstill on the payroll of the institution as of November 1, 2014)
•Report Hispanic/Latino individuals of any race as Hispanic/Latino•Report race for non-Hispanic/Latino individuals only•Include Primarily Instruction and Instruction Combined with Research and Public Service MenRace/ethnicity With Faculty status
Tenured On TenureTrack
Not on Tenure TrackMulti-year, continuing,
or at-will contractAnnualcontract
Less-than-annualcontract
WithoutFacultystatus
Total
Nonresident alien 0 0Hispanic/Latino 0American Indian orAlaska Native
0
Asian 0Black or AfricanAmerican
0
Native Hawaiian or OtherPacific Islander
0
White 0Two or more races 0Race and ethnicityunknown
0
Total men 0 0 0 0 0 0 0
WomenRace/ethnicity With Faculty status
Tenured On TenureTrack
Not on Tenure TrackMulti-year, continuing,
or at-will contractAnnualcontract
Less-than-annualcontract
WithoutFacultystatus
Total
Nonresident alien 0 0Hispanic/Latino 0American Indian orAlaska Native
0
Asian 0Black or AfricanAmerican
0
Native Hawaiian or OtherPacific Islander
0
White 0Two or more races 0Race and ethnicityunknown
0
Total women 0 0 0 0 0 0 0
Total (men+women) 0 0 0 0 0 0 0

Institution: University of Florida-Online (484473)User ID: 88G4433
Part H - New Hires, Full-time Staff by Occupational CategoryNumber of Newly Hired Full-time Staff
(Hired full-time between July 1 and October 31, 2014 andstill on the payroll of the institution as of November 1, 2014)
•Report Hispanic/Latino individuals of any race as Hispanic/Latino•Report race for non-Hispanic/Latino individuals only MenRace/ethnicity Instructional
Staff(from Part H,
screen 1)
Researchstaff
PublicService
staff
Library and Student and Academic Affairs and OtherEducation Services Occupations
25-4000 + 25-2000 + 25-3000 + 25-9000
Nonresident alien 0 Hispanic/Latino 0 American Indian orAlaska Native
0
Asian 0 Black or AfricanAmerican
0
Native Hawaiian or OtherPacific Islander
0
White 0 1Two or more races 0 Race and ethnicityunknown
0
Total men 0 0 0 1
WomenRace/ethnicity Instructional
Staff(from Part H,
screen 1)
Researchstaff
PublicService
staff
Library and Student and Academic Affairs and OtherEducation Services Occupations
25-4000 + 25-2000 + 25-3000 + 25-9000
Nonresident alien 0 Hispanic/Latino 0 American Indian orAlaska Native
0
Asian 0 Black or AfricanAmerican
0
Native Hawaiian or OtherPacific Islander
0
White 0 Two or more races 0 Race and ethnicityunknown
0 0
Total women 0 0 0 0
Total (men+women) 0 0 0 1

Institution: University of Florida-Online (484473)User ID: 88G4433
Part H - New Hires, Full-time Staff by Occupational CategoryNumber of Newly Hired Full-time Staff
(Hired full-time between July 1 and October 31, 2014 andstill on the payroll of the institution as of November 1, 2014)
•Report Hispanic/Latino individuals of any race as Hispanic/Latino•Report race for non-Hispanic/Latino individuals only
MenRace/ethnicity Management
Occupations11-0000
Business andFinancial
OperationsOccupations
13-0000
Computer, Engineering,and Science Occupations15-0000 + 17-0000 + 19-
0000
Community, Social Service,Legal, Arts, Design,
Entertainment, Sports, andMedia Occupations
21-0000 + 23-0000 + 27-0000
HealthcarePractitioners
and TechnicalOccupations
29-0000Nonresidentalien
0
Hispanic/Latino American Indianor Alaska Native
Asian Black or AfricanAmerican
Native Hawaiianor Other PacificIslander
White Two or moreraces
Race andethnicityunknown
Total men 0 0 0 0 0
WomenRace/ethnicity Management
Occupations11-0000
Business andFinancial
OperationsOccupations
13-0000
Computer, Engineering,and Science Occupations15-0000 + 17-0000 + 19-
0000
Community, Social Service,Legal, Arts, Design,
Entertainment, Sports, andMedia Occupations
21-0000 + 23-0000 + 27-0000
HealthcarePractitioners
and TechnicalOccupations
29-0000Nonresidentalien
0
Hispanic/Latino American Indianor Alaska Native
Asian Black or AfricanAmerican
Native Hawaiianor Other PacificIslander
White Two or moreraces
Race andethnicityunknown
Total women 0 0 0 0 0
Total(men+women)
0 0 0 0 0

Institution: University of Florida-Online (484473)User ID: 88G4433
Part H - New Hires, Full-time Staff by Occupational CategoryNumber of Newly Hired Full-time Staff
(Hired full-time between July 1 and October 31, 2014 andstill on the payroll of the institution as of November 1, 2014)
•Report Hispanic/Latino individuals of any race as Hispanic/Latino•Report race for non-Hispanic/Latino individuals only MenRace/ethnicity Service Occupations
31-0000 + 33-0000 + 35-0000 + 37-0000+ 39-0000
Sales andRelatedOccupations41-0000
Office andAdministrativeSupportOccupations43-0000
Natural Resources,Construction, andMaintenanceOccupations45-0000 + 47-0000 + 49-0000
Production,Transportation,and MaterialMovingOccupations51-0000 + 53-0000
GrandTotal(All full-timenewhires)
Nonresidentalien
0 0
Hispanic/Latino 0AmericanIndian orAlaska Native
0
Asian 0Black orAfricanAmerican
0
NativeHawaiian orOther PacificIslander
0
White 1Two or moreraces
0
Race andethnicityunknown
0
Total men 0 0 0 0 0 1
WomenRace/ethnicity Service Occupations
31-0000 + 33-0000 + 35-0000 + 37-0000+ 39-0000
Sales andRelatedOccupations41-0000
Office andAdministrativeSupportOccupations43-0000
Natural Resources,Construction, andMaintenanceOccupations45-0000 + 47-0000 + 49-0000
Production,Transportation,and MaterialMovingOccupations51-0000 + 53-0000
GrandTotal(All full-timenewhires)
Nonresidentalien
0 0
Hispanic/Latino 0AmericanIndian orAlaska Native
0
Asian 0Black orAfricanAmerican
0
NativeHawaiian orOther PacificIslander
0
White 0Two or moreraces
0

Race andethnicityunknown
0
Total women 0 0 0 0 0 0
Total(men+women)
0 0 0 0 0 1

Institution: University of Florida-Online (484473)User ID: 88G4433
Human Resources Survey EvaluationWere any staff members difficult to categorize? If so, please explain in the box below. No.

Institution: University of Florida-Online (484473)User ID: 88G4433
Prepared by This survey component was prepared by: Keyholder SFA Contact HR Contact
Finance Contact Academic Library Contact Other
Name: Noelle A. Mecoli, Assistant Director Email: [email protected] How long did it take to prepare thissurvey component?
40hours minutes
The name of the preparer is being collected so that we can follow up with the appropriate person in the event that thereare questions concerning the data. The Keyholder will be copied on all email correspondence to other preparers.The time it took to prepare this component is being collected so that we can continue to improve our estimate of thereporting burden associated with IPEDS. Please include in your estimate the time it took for you to review instructions,query and search data sources, complete and review the component, and submit the data through the Data CollectionSystem.Thank you for your assistance.

Institution: University of Florida-Online (484473) User ID: 88G4433Summary
Human Resources Component Summary
IPEDS collects important information regarding your institution. All data reported in IPEDSsurvey components become available in the IPEDS Data Center and appear as aggregated datain various Department of Education reports. Additionally, some of the reported data appearsspecifically for your institution through the College Navigator website and is included in yourinstitution’s Data Feedback Report (DFR). The purpose of this summary is to provide you anopportunity to view some of the data that, when accepted through the IPEDS quality controlprocess, will appear on the College Navigator website and/or your DFR. College Navigator isupdated approximately three months after the data collection period closes and Data FeedbackReports will be available through the Data Center and sent to your institution’s CEO inNovember 2015.
Please review your data for accuracy. If you have questions about the data displayed belowafter reviewing the data reported on the survey screens, please contact the IPEDS Help Desk at:1-877-225-2568 or [email protected].
Number of staff by employment status and occupational category:Fall 2014
Occupational category Reported values FTEstaff
Number offull-time staff
Number ofpart-time staff
Total number of staff 29 54 47
Instructional Staff 5 43 19
Primary Instruction 5 43 19
Exclusively credit 5 43 19
Exclusively not-for-credit 0 0 0
Combined credit/not-for-credit 0 0 0
Instruction/research/public service 0 0 0
Research Staff 0 0 0
Public Service Staff 0 0 0
Library and Student and Academic Affairs and Other EducationServices Occupations SOC
8 4 9
Librarians, Curators, and ArchivistsSOC 25-4000
0 0 0
Archivists, Curators, and Museum TechniciansSOC 25-4010
0 0 0
LibrariansSOC 25-4020
0 0 0
Library TechniciansSOC 25-4030
0 0 0
Student and Academic Affairs and Other Education ServicesOccupationsSOC 25-2000 + 25-3000 + 25-9000
8 4 9
Management OccupationsSOC 11-0000
2 0 2
Business and Financial Operations OccupationsSOC 13-0000
5 2 6
Computer, Engineering, and Science OccupationsSOC 15-0000 + 17-0000 + 19-0000
7 5 9
Community, Social Service, Legal, Arts, Design, Entertainment,Sports and Media OccupationsSOC 21-0000 + 23-0000 + 27-0000
2 0 2
Healthcare Practitioners and Technical OccupationsSOC 29-0000
0 0 0
Service OccupationsSOC 31-0000 + 33-0000 + 35-0000 + 37-0000 + 39-0000
0 0 0
Sales and Related OccupationsSOC 41-0000
0 0 0
Office and Administrative Support OccupationsSOC 43-0000
0 0 0
Natural Resources, Construction, and Maintenance OccupationsSOC 45-0000 + 47-0000 + 49-0000
0 0 0

Number of staff by employment status and occupational category:Fall 2014
Production, Transportation, and Material Moving OccupationsSOC 51-0000 + 53-0000
0 0 0
NOTE: Full-time-equivalent (FTE) staff is calculated by summing the total number of full-time staff and adding one-third of the total number of part-time staff. Graduate assistants are not included in the above figures. Many of theFTE figures may be included in the DFR.
Salaries of full-time instructional staff by contract length and academic rank:Academic year 2014-15
Academicrank
Months Covered by Annual Salary12
months11
months10
months9 months
Total Stafffor Salaryreporting
TotalNumber of
MonthsSalary
Outlays
WeightedAverageMonthlySalaries
All Ranks 2 3 5 51 $324,832 $6,369
Professor
Associateprofessor
1 1 9 $96,323 $10,703
Assistantprofessor
Instructor
Lecturer 1 2 3 30 $182,078 $6,069
No academicrank
1 1 12 $46,431 $3,869
NOTE: The above data are based on the Salary Outlays part of the IPEDS HR component. The Weighted averagemonthly salaries of full-time instructional staff by academic rank are calculated by adding the salary outlays reportedfor Men plus Women by academic rank, then dividing the sum by the "Total Number of Months" for Men plus Womenby academic rank. Salaries of full-time instructional staff paid less than 9 months per year are not collected. Also,salaries of medical school staff are not collected. The weighted average monthly salaries may be included in the DFR.

Institution: University of Florida-Online (484473) User ID: 88G4433Edit Report
Human Resources
University of Florida-Online (484473)
There are no errors for the selected survey and institution.