institute of nutrition institute of nutrition study on ... · vsweeteners, particularly those ... -...
TRANSCRIPT

1
Institute of Nutrition Institute of Nutrition
Study on Dietary Exposure
of Sweeteners in Thai Consumers
Songsak Srianujata, R.Ph., Ph.D.
Pharrunrat Tanaviyutpakdee, Ph.D.
Chaniphan Butryee, Ph.D.
Pacharee Munkong, M.S.
Institute of Nutrition, Mahidol University
Thailand Risk Assessment and Surveilance Center (TRAC)
Institute of Nutrition
Outline of presentation
1. Introduction
2. Objectives
3. Method of study
4. Results of the study
5. Conclusion and recommendation
Institute of Nutrition
1. Introduction
v Sweeteners, particularly those of low
or no caloric value, have been approved
by various organizations, particularly
Codex. They were used widely as food
additives in many countries around the
world.
v The additives became the compounds
of choice while the health awareness is
paid more and more attention.

Institute of Nutrition
v The obesity is increasing as the
global trend and it leads to the
increase in NCDs. The consumption of
energy condensed food, especially
with high consumption of sugar from
food and drink, is one of the important
factors, due to the habit of sweet taste
preference.
Institute of Nutrition
v Societies are looking for alternative
sources of sweetness to be used in
place of sugar in various foods.
v Low/non caloric sweeteners (LNCS)
become more popular and are used
widely, particularly drinks and other
food items in the form of diet
products. The use has been growing
rapidly in recent years
Institute of Nutrition
v Recently, the process of approval for
use of those sweeteners as food
additive, by the regulatory authority, has
been using the risk analysis concept set
by Codex.
v The risk assessment is applied in
setting the maximum use level of
sweeteners in combination with the
food consumption data of the
population in the country.
Institute of Nutrition
v Thailand, by the Thai FDA has been
using the national food consumption
data surveyed in 2006 (ACFS). The data
set does not cover some of the food
items developed in the recent years.
v Therefore, the dietary exposure of
three important sweeteners (aspartame,
acesulfame-k and sucralose) has been
studied in Thai consumers.

Institute of Nutrition
Specific:
1. Market survey of product containing LNCS (follow
CODEX category for screen, industrial information
and ACFS list of foods)
2. To determine the household use of LNCS sweetener
in foods/beverages containing sweeteners and
others sources as mentioned above which
consumed at home.
General:
To determine the usage and potential/actual exposure
of consumers to Low/No Calorie sweeteners (LNCS:
focus on Aspartame, Ace-K and sucralose)
G l
Institute of Nutrition
3. To determine the consumption of LNCS
sweetener in foods/beverages containing
sweeteners and others sources as mentioned
above which consumed outside the home by
individual consumers.
4. To determine the levels of LNCS sweetener in
foods/beverages containing sweeteners or
dishes and processed foods available to
consumers
5. To evaluate the total exposure of LNCS
sweetener from the data obtained from survey
studies.
Institute of Nutrition
1) Study process
Institute of Nutrition
2) Ethics Certification in Human by MU-SSIRB

Institute of Nutrition
Market survey of product containing LNCS (follow
CODEX category for screen, industrial information
and ACFS list of foods)
Objective 1:
Institute of Nutrition
3) Market survey
üNakhon Pathom province
- Lotus (Salaya)
- 7-11 (Sa haporn branch at Salaya)
- Food land (The Biro Salaya)
- Max value (Salaya Mall)
- TOP Supermarket (Central Salaya)
üSamut Sakhon province and Phetchaburi
- CJ (Bann Bor branch)
- Mae-kim-lite (แมก่มิไล)้ (Phetchaburi)
üBangkok
- Gourmet Market (Siam Paragon)
- Home Fresh Mart (The Mall Bangkhae) and
- Villa Market (Soi Aree)
Market survey places
Institute of Nutrition
Results of “Market survey”
LNCS sweetener items could be separated in to 2 items,
1. Add in food type and
2. Mixed in food type.
LNC sweetener products in Thailand markets
Note: Data of June to July 2015
Institute of Nutrition
The examples of LNCS product groups in Thailand
Mixed in foodsAdd in foods

Institute of Nutrition
To determine the household use of LNCS in
foods/beverages containing sweeteners which are
consumed at home and outside.
Objective 2:
Ø Tool development
Ø Selection of study areas and study design
Ø Standardization and training of interviewers
Ø Pretest and pilot study
Ø Consumption survey of products containing
LNCS
Institute of Nutrition
1) Photo book preparation
2) Questionnaire
─ General question
─ Food Frequency
Questionnaire; FFQ
─ 24-hr dietary recall
Ø Tool development
Institute of Nutrition
The study was conducted in comparison between urban
area (Bangkok) and rural area (Suphanburi).
ü Muang Suphanburi District
• 4 sub districts
ü Doembang-nangbuat District
• 4 sub districts
1) Khet Pathum Wan
2) Khet Bang Khen
3) Khet Bang Khae
4) Khet Lat Krabang
Ø Selection of study areas
• Area cluster random sampling was used to select study areas
Institute of Nutrition
The household and population size to be studied
were calculated statistically from the available literature data
and from the statistic of population size in each area.
• The estimation of sample size using below equation
1.96 = Z value (∞ = 0.05) or 95% confidence level
P = estimated prevalence of LNCS sweetener consumption = 0.5
1-P = estimated prevalence of not consume LNCS sweetener = 0.5
DEFF = Estimated design effect = in this study estimate as 2
d = tolerable error = 5 %
Required number of participants = 768.32 cases ~ 770 cases
Estimated sample size
Sample size = 770 cases + 10% non response
Sample size =770 + 77 = 847 cases that could be divided into
age groups
Ø Study population
Institute of Nutrition
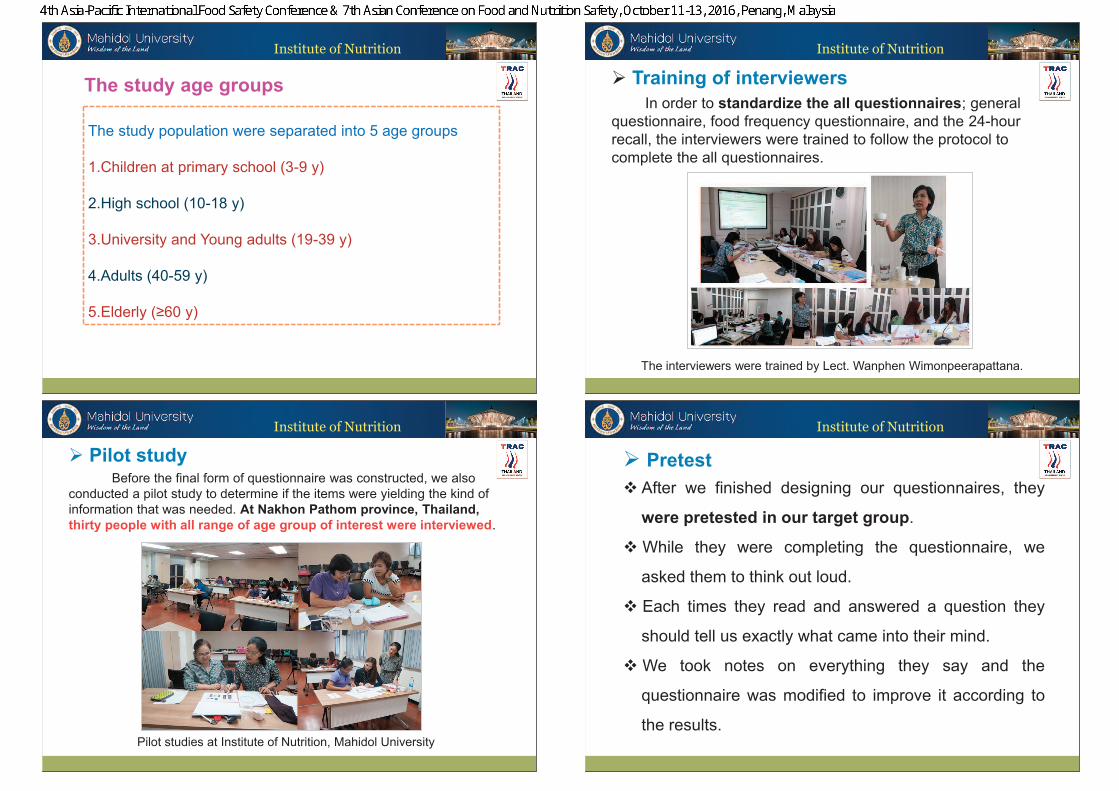
The study population were separated into 5 age groups
1.Children at primary school (3-9 y)
2.High school (10-18 y)
3.University and Young adults (19-39 y)
4.Adults (40-59 y)
5.Elderly (≥60 y)
The study age groups
Institute of Nutrition
Ø Training of interviewers
In order to standardize the all questionnaires; general
questionnaire, food frequency questionnaire, and the 24-hour
recall, the interviewers were trained to follow the protocol to
complete the all questionnaires.
The interviewers were trained by Lect. Wanphen Wimonpeerapattana.
Institute of Nutrition
Ø Pilot studyBefore the final form of questionnaire was constructed, we also
conducted a pilot study to determine if the items were yielding the kind of
information that was needed. At Nakhon Pathom province, Thailand,
thirty people with all range of age group of interest were interviewed.
Pilot studies at Institute of Nutrition, Mahidol University
Institute of Nutrition
Ø Pretest
v After we finished designing our questionnaires, they
were pretested in our target group.
v While they were completing the questionnaire, we
asked them to think out loud.
v Each times they read and answered a question they
should tell us exactly what came into their mind.
v We took notes on everything they say and the
questionnaire was modified to improve it according to
the results.

Institute of Nutrition
Consumption Survey Activity in Suphanburi
province, Thailand
• Banpho Municipal district
Institute of Nutrition
Consumption Survey Activity in
Bangkok Metropolitan, Thailand
• Khet Bangkhen District
Institute of Nutrition
Results: Consumption Survey of Suphanburi
province, Thailand
The total number of study population in Suphanburi
province were 814 cases.
• Muang Suphanburi District 420 cases,
• Doembangnangbuat District 394 cases
Number of study population in Muang Suphanburi District
Institute of Nutrition
Number of study population in Doembangnangbuat District
28
Results: Consumption Survey of Suphanburi province,
Thailand

Institute of Nutrition
Results: Consumption Survey of Bangkok province,
Thailand
Total number of study population in Bangkok province were 806 cases.
Number of study population by age group in Bangkok
Institute of Nutrition
• The estimation of sample size using below equation
1.96 = Z value (∞ = 0.05) or 95% confidence level
P = estimated prevalence of LNCS sweetener consumption = 0.5
1-P = estimated prevalence of not consume LNCS sweetener = 0.5
DEFF = Estimated design effect = in this study estimate as 2
d = tolerable error = 5 %
Required number of participants = 768.32 cases ~ 770 cases per area
Estimated sample size per area
Sample size = 770 cases + 10% non response
Sample size =770 + 77 = 847 cases that could be divided in to age
group
• From the estimation of sample size per area, so
total cases of study population: 847 X 2 = 1694
• Total population in this study: 1620 cases
Institute of Nutrition
Results: Distribution of population between male and
female
43%57%
Suphanburi province
Female Male
40%60%
Bangkok
Female Male
• Total population in this study: 1620 cases
Institute of Nutrition
Result: Consumption data
Item 1
Item 2
Item 3
Item 4
Item 5
Item 6
Item 7
Item 8
Item 9
Item 10
Item 11
89%
2. Coffee
1. Soft drink
6
%3
%
3. Energy drink
89%
Type of frequently consumed foods/beverages by study population

Institute of Nutrition
Results: Other essential information
Age group Male Female
3-9 26.4 26.1
10-18 52.1 46.9
19-39 69.2 58.8
40-59 69.7 61.3
≥60 61.2 57.1
Average body weight (kg),
which were used for
calculation of exposure.
Institute of Nutrition
To determine the levels of LNCS sweeteners
in foods/beverages or dishes and processed
foods available to consumers
T d t
Objective 3:
To fulfill the objective 3, the following activities were done.
• Samples containing LNCS were
collected from the market and
were sent to laboratory for
determination of LNCS by HPLC.
• Some data of actual LNCS
concentration were contributed by
the company, the member of
Thailand Industry Council.
Institute of Nutrition
Criteria in selection of samples for LNCS analysis and re-analysis
Criteria 1 in selection of samples for LNCS analysis and re-analysis
by HPLC
1. Selected items that were consumed more than 1% of eater only (>13
cases consumed that item)
2. Re-analysis the items, which already knew concentration (data from
the company and labelling [% containing])
Criteria 2 used maximum limit (ML) level in foods
1. Items that were consumed less than 1% of eater only and
2. Candy and chewing gum Codex standard (ML)
Depend on food / beverage
• Aspartame 300-10000 mg/kg
• Aspartame-Acesulfame K 200-1000
mg/kg
• Acesulfame K 200-2000 mg/kg
• Sucralose 30-2500 mg/kg
GENERAL STANDARD FOR FOOD
ADDITIVES
CODEX STAN 192-1995
Adopted in 1995. Revision 1997, 1999,
2001, 2003, 2004, 2005, 2006, 2007,
2008, 2009, 2010,
2011, 2012, 2013, 2014. 2016
Institute of Nutrition
Food groups (items) Aspartame Aceusulme-K Sucarlose
1. Add in food (sweetener pack, light sugar pack, etc.)
(15)
21.800 1.133 6.140
2. Mixed in food (316)
2.1 General food (yogurt, jelly and
sweet fish sauce) (13)
0.005 0.258 0.160
2.2 Specific food (Supplement/
Medical food) (39)
0.564 0.565 1.393
2.3 Beverage (162) 0.291 0.279 0.156
2.3.1 Coffee (Can/ 3 in 1) (62) 0.126 0.189 0.265
2.3.2 Tea (3 in 1) (7) 3.235 1.700 0.086
2.3.3 Co-co/ Chocolate and malt (3 in 1) (6) 0.225 0.325 0.150
2.3.4 Ginger/ Cereal and Other (3 in 1) (12) 0.100 0.236 0.200
2.3.5 Soft drinks (Ready to drink) (70) 0.144 0.183 0.068
2.3.6 Energy drinks (Ready to drink) (5) 0.800 0.800 0.025
2.4 Candy (59) 0.958 0.341 0.844
2.5 Chewing gum (41) 3.168 1.041 0.544
2.6 Seasoning (2) 0.000 0.125 0.475
Results: Mean concentration of LNCS in product groups (mg/g)

37
Institute of Nutrition
To determine the household use of LNCS sweeteners in
foods/beverages consumed at home and outside
Objective 2:
To determine the levels of LNCS sweeteners in
foods/beverages or dishes and processed foods
available to consumers
Objective 3:
Amount of consumption
LNCS data were
obtained
Concentration data were obtained and were
used for exposure or intake calculation
Mean or percentile data
were used for exposure
or intake calculation
Institute of Nutrition
To fulfill the objective 5, dietary exposure assessment activities were done
by combining food consumption data with LCNS concentration data
To evaluate the total exposure of LNCS sweetener from the
data obtained from survey studies.
Objective 4 and 5
Food
consumptionConcentration
of chemical X
Dietary exposure
mg/kg BW/day
g/day mg/g
General equation for dietary exposure
÷
39
Institute of Nutrition
Point estimation or deterministic estimation model
for calculation of dietary exposure
� Calculation of an average dietary exposure is
the product of the average consumption of the
foods of interest and the average residues of the
substance of interest in those foods.
¡All estimated intake from all products were added
up to obtain total intake.
This study used
40
Institute of Nutrition
UUL = allowed maximum
(upper use) levels in the
different categories of foodsMean or
97.5th-
percentile
ExamplePoint estimation model
• used actual concentration
from laboratory
• In case of the detected value
was specified not detected or
lower than LOD, used half
LOQ
or
Ref.: The TAMDI was used by the European Scientific Committee onFood (SCF) to assess potential exposure to
single flavourings (EC, 2003).

41
Institute of Nutrition
Age groups Sex NSum of Mean exposure
(mg/kgBW/day)
Sum of Percentile at 95
Exposure (mg/kgBW/day)
3-9 yr. Male 170 1.95 8.30
Female 197 1.67 6.65
Total 367 1.80 -
10-18 yr. Male 184 1.77 8.40
Female 217 1.07 5.37
Total 401 1.39 -
19-39 yr. Male 168 0.61 2.99
Female 145 0.43 2.53
Total 313 0.53 -
40-59 yr. Male 81 0.31 1.36
Female 255 0.18 0.70
Total 336 0.23 -
≥ 60 yr. Male 67 0.05 0.18
Female 136 0.12 0.50
Total 203 0.09 -
Total Male 670 1.18 -
Female 950 0.72 -
Total 1620 0.91 -
Aspartame-Per capita LNCS intake
42
Institute of Nutrition
Age groups Sex NSum of Mean exposure
(mg/kgBW/day)
Sum of Percentile at 95
Exposure (mg/kgBW/day)
3-9 yr.Male 170 2.45 10.26
Female 197 2.13 8.56
Total 367 2.28 -
10-18 yr.
Male 184 2.09 10.14
Female 217 1.32 6.76
Total 401 1.68 -
19-39 yr.
Male 168 0.68 3.12
Female 145 0.60 3.19
Total 313 0.64 -
40-59 yr.
Male 81 0.30 1.69
Female 255 0.19 0.87
Total 336 0.22 -
≥ 60 yr.Male 67 0.06 0.21
Female 136 0.10 0.46
Total 203 0.09 -
Acesulfame K
Per capitaLNCS intake
43
Institute of Nutrition
LNCS intake
Age groups Sex NSum of Mean exposure
(mg/kgBW/day)
Sum of Percentile at 95
Exposure (mg/kgBW/day)
3-9 yr. Male 170 1.01 4.33
Female197 0.91 3.70
Total 367 0.96 -
10-18 yr. Male 184 0.79 3.80
Female217 0.60 2.89
Total 401 0.69 -
19-39 yr. Male 168 0.32 1.53
Female145 0.38 1.91
Total 313 0.35 -
40-59 yr. Male 81 0.23 1.37
Female255 0.14 0.61
Total 336 0.17 -
≥ 60 yr. Male 67 0.04 0.17
Female136 0.09 0.38
Total 203 0.07 -
Sucralose- Per capita
Institute of Nutrition
The components of
risk assessment
The next step
in our study
Risk
characterization

Institute of Nutrition
Risk estimation from exposure of Low/No Caloric
Sweetener
Dietary
exposure
ADIHazard Quotient (HQ) =
The resulting estimated dietary exposure is used in
the fourth step of risk assessment, the risk
characterization step.
Institute of Nutrition
Risk estimation from exposure of LNCS sweetener
Age groups Sex N
Sum of Mean
exposure
(mg/kgBW/day)
% of ADI (Codex)
Sum of Percentile
at 95
Exposure
(mg/kgBW/day)
% of ADI
(Codex)
3-9
yr.
Male 170 1.95 4.87 8.30 20.76
Female197 1.67 4.17 6.65 16.62
Total 367 1.80 4.50 - -
10-18 yr. Male 184 1.77 4.44 8.40 20.99
Female217 1.07 2.68 5.37 13.43
Total 401 1.39 3.49 - -
19-39 yr. Male 168 0.61 1.52 2.99 7.47
Female145 0.43 1.07 2.53 6.32
Total 313 0.53 1.32 - -
40-59 yr. Male 81 0.31 0.77 1.36 3.40
Female255 0.18 0.45 0.70 1.76
Total 336 0.23 0.57 - -
≥ 60
yr.
Male 67 0.05 0.14 0.18 0.45
Female136 0.12 0.30 0.50 1.24
Total 203 0.09 0.23 - -
Total Total 1620 0.91 2.28
Aspartame-Per capita ADI value of codex 40 mg/Kg bw/day
Institute of Nutrition
Age
groupsSex
Sum of Mean
exposure
(mg/kgBW/day)
% of ADI (Codex)
Sum of Percentile
at 95
Exposure
(mg/kgBW/day)
% of ADI
(Codex)
3-9
yr.
Male 3.47 8.68 13.27 33.18
Female 3.11 7.77 8.18 20.45
Total 3.32 8.31 - -
10-18 yr. Male 4.93 12.32 19.61 49.02
Female2.91 7.28 14.92 37.29
Total 4.06 10.14 - -
19-39 yr. Male 2.55 6.38 11.22 28.06
Female 1.98 4.94 13.88 34.70
Total 2.37 5.92 - -
40-59 yr. Male 2.46 6.15 1.69 4.22
Female 1.63 4.08 1.54 3.84
Total 1.93 4.83 - -
≥ 60
yr.
Male 1.26 3.14 0.00 0.00
Female 1.18 2.95 1.40 3.50
Total 1.66 4.14 - -
Aspartame-Eater only ADI value of codex 40 mg/Kg bw/day
Institute of Nutrition
Age groups Sex N
Sum of Mean
exposure
(mg/kgBW/day)
% of ADI
(Codex)
Sum of Percentile
at 95
Exposure
(mg/kgBW/day)
% of ADI
(Codex)
3-9
yr.
Male 170 2.45 16.31 10.26 68.42
Female 197 2.13 14.18 8.56 57.05
Total 367 2.28 15.17 - -
10-18 yr.
Male 184 2.09 13.91 10.14 67.57
Female 217 1.32 8.83 6.76 45.07
Total 401 1.68 11.17 - -
19-39 yr.
Male 168 0.68 4.52 3.12 20.83
Female 145 0.60 4.02 3.19 21.25
Total 313 0.64 4.29 - -
40-59 yr.
Male 81 0.30 1.98 1.69 11.30
Female 255 0.19 1.29 0.87 5.80
Total 336 0.22 1.46 - -
≥ 60
yr.
Male 67 0.06 0.43 0.21 1.42
Female 136 0.10 0.66 0.46 3.06
Total 203 0.09 0.59 - -
Acesulfame K- Per capita ADI value of codex 15 mg/Kg bw/day.

Institute of Nutrition
Age groups SexSum of Mean
exposure
(mg/kgBW/day)
% of ADI (Codex)
Sum of Percentile at
95
Exposure
(mg/kgBW/day)
% of ADI (Codex)
3-9
yr.
Male 3.86 25.74 15.67 104.50
Female 3.37 22.48 10.86 72.38
Total 3.65 24.30 - -
10-18 yr. Male 4.44 29.63 21.15 140.99
Female 2.88 19.23 11.98 79.89
Total 3.91 26.05 - -
19-39 yr. Male 2.27 15.15 11.97 79.80
Female 2.06 13.73 5.90 39.32
Total 2.22 14.81 - -
40-59 yr. Male 1.65 10.99 2.40 15.98
Female 1.14 7.60 2.99 19.91
Total 1.37 9.11 - -
≥ 60
yr.
Male 1.21 8.08 0.00 0.02
Female 0.97 6.49 1.82 12.13
Total 1.46 9.72 - -
Acesulfame K -Eater onlyADI value of codex 15 mg/Kg bw/day.
Institute of Nutrition
Age groups Sex N
Sum of Mean
exposure
(mg/kgBW/day)
% of ADI
(Codex)
Sum of Percentile
at 95
Exposure
(mg/kgBW/day)
% of ADI
(Codex)
3-9
yr.
Male 170 1.01 6.75 4.33 28.85
Female197 0.91 6.07 3.70 24.64
Total 367 0.96 6.39 - -
10-18 yr. Male 184 0.79 5.28 3.80 25.36
Female217 0.60 3.97 2.89 19.28
Total 401 0.69 4.57 - -
19-39 yr. Male 168 0.32 2.12 1.53 10.17
Female145 0.38 2.56 1.91 12.73
Total 313 0.35 2.32 - -
40-59 yr. Male 81 0.23 1.54 1.37 9.13
Female255 0.14 0.92 0.61 4.10
Total 336 0.17 1.11 - -
≥ 60
yr.
Male 67 0.04 0.26 0.17 1.12
Female136 0.09 0.62 0.38 2.57
Total 203 0.07 0.49 - -
Sucralose- Per capita ADI value of codex 15 mg/Kg bw/day.
Institute of Nutrition
Age groups Sex
Sum of Mean
exposure
(mg/kgBW/day)
% of ADI (Codex)
Sum of Percentile at
95
Exposure
(mg/kgBW/day)
% of ADI (Codex)
3-9
yr.
Male 1.71 11.37 8.94 59.57
Female 1.63 10.90 9.80 65.30
Total 1.66 11.08 - -
10-18 yr. Male 1.98 13.18 8.75 58.32
Female 1.49 9.93 18.64 124.24
Total 1.72 11.47 - -
19-39 yr. Male 1.34 8.93 3.42 22.78
Female 1.39 9.26 5.95 39.70
Total 1.33 8.89 - -
40-59 yr. Male 1.08 7.18 2.50 16.64
Female 0.75 5.03 3.16 21.06
Total 0.87 5.81 - -
≥ 60
yr.
Male 0.47 3.15 0.00 0.01
Female 1.06 7.04 0.99 6.60
Total 0.96 6.40 - -
Sucralose -Eater only ADI value of codex 15 mg/Kg bw/day.
52
Institute of Nutrition
� This study is the first study to find the actual consumption of LNCS, which focused on aspartame, acesulfame K and sucralose.
� LNCS items in Thailand could be separated into 2 items, add in food type and mixed in food type. Cover 114 brands, 331 items.
� The top 3 items that frequently consumed by study population were soft-drink or ready-to-drink, energy drink and coffee (3 in 1, can)
4. Conclusion

Institute of Nutrition
• The overall picture shows that the most exposed age
group for these three LNCS are 3-9, 10-18, and 19-39 yrs.
• However, it can be seen that the mean exposure to three
LNCS is quite far below the ADI assigned by JECFA.
• Some risk of exposure are found in eater only group
• For Acesulfame K in male with the age group of 3-9 yr
and 10-18 yr
• For Sucralose in female with the age group of 10-18 yr.
Conclusion
Institute of Nutrition
v It is recommended that the use of these
sweeteners should be aware that some groups of
population may be at risk of over exposure. The
use according to the guideline levels is observed
and the principle of GMP should be followed
carefully.
v The criteria of the use of food additives is to use
as low as technologically needed, no need to use
as ML.
5. Recommendation
Institute of Nutrition
Acknowledgements
1. Institute of Nutrition Mahidol University
2. Nutrition Foundation, Thailand
3. Research teams
4. ILSI SEA Region
5. Thailand Industry Council
(Thailand Industry Council)
Institute of Nutrition