institute of chemical technology department of food chemistry and analysis technicka 3, 16628...
TRANSCRIPT

INSTITUTE OFINSTITUTE OF CHEMICAL TECHNOLOGYCHEMICAL TECHNOLOGYDepartment of Food ChemistryDepartment of Food Chemistry and Analysisand AnalysisTechnicka 3, 16628 Prague, Czech Technicka 3, 16628 Prague, Czech [email protected]@vscht.cz
Jana HajslovaJana Hajslova, Lukas Vaclavik, Lukas Vaclavik, , Tomas Cajka, Jan Poustka, Ondrej Tomas Cajka, Jan Poustka, Ondrej Lacina, Lacina, Jakub SchurekJakub Schurek
Rapid Control of FoodRapid Control of Food / Environmental / Environmental Safety Safety:
NEW CHALLENGES IN MASS NEW CHALLENGES IN MASS SPECTROMETRYSPECTROMETRY

Ambient mass spectrometryAmbient mass spectrometry

Ambient mass spectrometryAmbient mass spectrometry provides solution provides solution!!
…….An awkward feature of mass .An awkward feature of mass spectrometry is that the sample must be spectrometry is that the sample must be introduced into introduced into vacuumvacuum or into an or into an inaccessible regioninaccessible region closely coupled to closely coupled to the vacuum system…..the vacuum system…..
the direct analysis of ordinary objects in the open atmosphere of the laboratory or in their natural environment is possible

DESI DESI Purdue Univ. Purdue Univ. USAUSA
DART DART JEOL, JEOL, USAUSA

Recent review
The ambient ionization methods retain the signature advantages of MS:
speedspeed
chemical specificitychemical specificity
low detection limitslow detection limits
moreover: no sample preparationis needed !!!

a Techniques where ESI mechanisms are mainly responsible for ionization.
b Methods where chemical ionization is responsible for ionization (photoionization - PI, ion evaporation - IE and electrical discharge)
AMBIENT DESORPTION IONIZATION METHODSAMBIENT DESORPTION IONIZATION METHODS
desorptiondesorption production of ionizing chemical reagentsproduction of ionizing chemical reagents


DESI ►
DART ▼

Spray and fluid velocity illustration. Droplets are black spheres eight times their actual size. Background color indicates velocity magnitude of surrounding fluid. The blue line shows the optimum collection angle from experiments (~ 10°)
DESI ▼

Because mass spectrometer orifice is continually bathed Because mass spectrometer orifice is continually bathed in hot inert gas, in hot inert gas, the DART source is remarkably resistant the DART source is remarkably resistant to contamination and sample carryoverto contamination and sample carryover..

Comparison of the intensities of the molecular ion of warfarin, [M + H]+ = 309, dissolved in different solvents after DART ionization at 250 C.

Objectives of study:
Optimization of conditions for triacylglycerols (TAG) dentification
Identification of oil type
Assessment of processing technology
Assessment of
DIRECT CHARACTERIZATION DIRECT CHARACTERIZATION OF EDIBLE OILS OF EDIBLE OILS
Case studyCase study no no.. 1 1

EXPERIMENTAL CONDITIONS
DART–TOFMS SETTINGS:Ion mode: POSITIVEGas: HELIUMGas temperature: 300°CNeedle voltage: 3000 VElectrode 1: 150 VElectrode 2: 250 VCone voltage: 20 VPeaks voltage: 1100 VMCP voltage: 2500 VInternal calib.: PEG 600
Neat oils were sampled with glass melting point tubes
A cotton swab dipped into diluted ammonium hydroxide was placed near the sampling gap to enhance formation of [M+NH4] ions from triACYLglycerides
AccuTOF-DARTTM system was operated under settings given below

MS[1];1.161..1.226;-1.0*MS[1];1.280..1.305; / ESI+ / 20080327_SMPL1
100 200 300 400 500 600 700 800 900 1000m/z
0
10
20
30
40
50
Intensity (53000)x103
902.80217
603.52369
876.78826
903.80598
577.50761
604.52704
300.28567904.81267
874.77212411.39026
428.41634409.37558283.25981
397.37614 605.53391
339.28483905.81777121.06356 850.77295460.40515
169.08399575.49223265.24844
638.56034
848.75652143.10375492.39474
918.79683639.56475493.39059932.83527
804.65857764.65900640.56840
VIRGIN OLIVE OIL – DART positive mass spectrum, 300°C, m/z 100 - 1000IN
TE
NS
ITY
m/z
FREE FATTY ACIDSDAGsDAGs
TAGsTAGs
SQUALENE

VIRGIN OLIVE OIL – DART positive mass spectrum, 300°CMS[1];1.161..1.226;-1.0*MS[1];1.280..1.305; / ESI+ / 20080327_SMPL1
100 200 300 400 500 600 700 800 900 1000m/z
0
10
20
30
40
50
Intensity (53000)x103
902.80217
603.52369
876.78826
903.80598
577.50761
604.52704
300.28567904.81267
874.77212411.39026
428.41634409.37558283.25981
397.37614 605.53391
339.28483905.81777121.06356 850.77295460.40515
169.08399575.49223265.24844
638.56034
848.75652143.10375492.39474
918.79683639.56475493.39059932.83527
804.65857764.65900640.56840
INT
EN
SIT
Y
m/z
MS[1];1.161..1.226;-1.0*MS[1];1.280..1.305; / ESI+ / 20080327_SMPL1
250 260 270 280 290 300 310m/z
0
2
4
6
8
10
12
14
16
18Intensity (18000)x10
3
300.28567
283.25981
298.27006
265.24844
301.28791
281.24361
263.23150261.25264 274.26920
284.26364259.24115
297.25313279.23295257.24114
302.29691266.25120 296.25205273.25029 285.26526255.22840
PALMITIC ACID[M+H]+
LINOLEIC ACID[M+H]+
PALMITIC ACID[M+NH4]+
LINOLEIC ACID[M+NH4]+
OLEIC ACID[M+NH4]+
zoom m/z 250 - 310
FFA are formed by heat-induced decomposition of
TAGs
OLEIC ACID[M+H]+

MS[1];1.161..1.226;-1.0*MS[1];1.280..1.305; / ESI+ / 20080327_SMPL1
100 200 300 400 500 600 700 800 900 1000m/z
0
10
20
30
40
50
Intensity (53000)x103
902.80217
603.52369
876.78826
903.80598
577.50761
604.52704
300.28567904.81267
874.77212411.39026
428.41634409.37558283.25981
397.37614 605.53391
339.28483905.81777121.06356 850.77295460.40515
169.08399575.49223265.24844
638.56034
848.75652143.10375492.39474
918.79683639.56475493.39059932.83527
804.65857764.65900640.56840
VIRGIN OLIVE OIL – DART positive mass spectrum
MS[1];1.161..1.226;-1.0*MS[1];1.280..1.305; / ESI+ / 20080327_SMPL1
830 840 850 860 870 880 890 900 910 920m/z
0
10
20
30
40
50
Intensity (53000)x103
902.80217
876.78826
903.80598
877.79200
904.81267
900.78660
874.77212
878.79777
905.81777850.77295
898.77137851.77835848.75652 872.75676 885.77583
918.79683906.82251886.77858857.74721
859.76004 892.78342 907.82448846.73857
PPL
zoom m/z 825 - 920
PPL
PLL
POL
POO
PSO
LLO
LOO
OOO
SOO
SSO
TAGs are detected as [M+NH4]+
m/z

MS[1];1.172..1.224;-1.0*MS[1];1.131..1.134; / ESI+ / 20080404_SMPL2
200 400 600 800 1000m/z
0
100
200
Intensity (250000)x103
902.82343900.80768
898.79193195.06811
903.82637
603.53673896.77583
904.83115874.79130159.10278212.09508 872.77618601.52033 604.53975141.09257 298.27530 916.80068397.38353
870.76074577.52025 605.54566 792.67815127.07741
AUTOOXIDATION OF RAPESEED OIL – DART POSITIVE SPECTRA, 300°C
MS[1];1.311..1.340;-1.0*MS[1];1.278..1.279; / ESI+ / 20080404_SMPL1
0
100
200
Intensity (250000)x103
195.06810
902.82547
898.79463
903.82940
212.09470896.77918 904.83495177.05622 603.53884
872.78018397.38522905.84028300.29173
431.38977 638.57692151.07533 577.52298 792.68308
FRESH SUNFLOWER OIL (PEROXIDE VALUE = 0.17)
SUNFLOWER OIL OXIDIZED IN MICROWAVE OVEN FOR 25´
(PEROXIDE VALUE = 27.31)

MS[1];1.560..1.606;-1.0*MS[1];1.651..1.659; / ESI+ / 20080401_SMPL2
0
100
200
Intensity (220000)x103
902.83503
903.83664876.81803
603.54516904.84198
874.80156
577.52839 604.54797905.84728409.39106
850.80103605.55584
339.29877918.82604575.51335460.42209191.18731
300.29606121.07013
804.68756
EXTRAVIRGIN (a) vs. POMACE OLIVE OIL (b), m/z 100 - 1000
MS[1];1.286..1.319;-1.0*MS[1];1.213..1.223; / ESI+ / 20080404_SMPL3
200 400 600 800 1000m/z
0
100
200
Intensity (220000)x103
896.77443
872.77526 900.80295
902.81763
601.51933903.82286870.75937397.38443
912.76939604.53931298.27594263.23981 846.74041431.38553 764.64615
(a)
(b)

MS[1];1.560..1.606;-1.0*MS[1];1.651..1.659; / ESI+ / 20080401_SMPL2
0
100
200
Intensity (220000)x103
902.83503
903.83664876.81803
877.82148 904.84198900.81646
874.80156
878.82606 905.84728850.80103898.80036
872.78615 918.82604906.84850879.82910 934.82643852.80730846.76452
MS[1];1.286..1.319;-1.0*MS[1];1.213..1.223; / ESI+ / 20080404_SMPL3
820 840 860 880 900 920 940m/z
0
100
200
Intensity (220000)x103
896.77443
872.77526900.80295
874.78857
902.81763894.75854
903.82286870.75937 877.80075848.77364912.76939855.74741 892.75319846.74041 928.82074
932.84465820.68615
EXTRAVIRGIN (a) vs. POMACE OLIVE OIL (b), m/z 820 - 950
(a)
(b)

DART positive mass spectra – various edible oils m/z 100-1000MS[1];1.161..1.226;-1.0*MS[1];1.280..1.305; / ESI+ / 20080327_SMPL1
100 200 300 400 500 600 700 800 900 1000m/z
0
10
20
30
40
50
Intensity (53000)x103
902.80217
603.52369
876.78826
903.80598
577.50761
604.52704
300.28567904.81267
874.77212411.39026
428.41634409.37558283.25981
397.37614 605.53391
339.28483905.81777121.06356 850.77295460.40515
169.08399575.49223265.24844
638.56034
848.75652143.10375492.39474
918.79683639.56475493.39059932.83527
804.65857764.65900640.56840
MS[1];0.610..0.652;-1.0*MS[1];0.062..0.066; / ESI+ / 20080327_SMPL3
100 200 300 400 500 600 700 800 900 1000m/z
0
20
40
60
80
100
120
140
160Intensity (160000)x10
3
879.72880
881.74263
601.50626
599.49132
153.12515
882.74659
603.52052
883.75598
855.72925575.49074
281.24387 397.37493
900.78217
298.27001263.23305
604.52489309.27406
157.11994 901.78684617.50059
902.79489398.37863311.28914
634.52834169.12084903.80213743.60614
171.11006491.36684
636.54304551.49032
854.71954939.81134
MS[1];1.469..1.541;-1.0*MS[1];0.165..0.185; / ESI+ / 20080327_SMPL4
100 200 300 400 500 600 700 800 900 1000m/z
0
10
20
30
40
50
60
70
80
90
100Intensity (100000)x10
3
181.09221
902.82082
283.26847
603.53756900.80590
300.29352
182.09330
125.09881
898.79058903.82543
281.25212601.52131
127.11396 604.54071397.38635
180.08298 279.23654 383.37015 876.80590904.83174265.25662
183.07936 301.29702 577.52114872.77673605.54709199.10315 398.38906
905.83666381.35436 575.50697257.24789
MS[1];0.796..0.831;-1.0*MS[1];0.703..0.719; / ESI+ / 20080327_SMPL5
100 200 300 400 500 600 700 800 900 1000m/z
0
10
20
30
40
50
60
70
80
90
100
Intensity (105000)x103
601.52197281.25286
263.24209
603.53783
575.50699
283.26760
881.76479
604.54081 879.75161
855.75044
883.77903
605.55088
898.78987153.13009 337.27897
355.28899617.51782
409.38352902.81983
257.24810413.37995 551.50623
245.23069618.52240
903.82521441.37543211.17217 503.37835848.77632
443.38779 634.54780905.83663783.63753743.62718
MS[1];0.650..0.710;-1.0*MS[1];0.589..0.595; / ESI+ / 20080327_SMPL6
100 200 300 400 500 600 700 800 900 1000m/z
0
10
20
30
40
50
Intensity (56000)x103
439.38271
495.44431
383.31999
467.41310411.35080
257.21719
551.50615
201.15896
523.47442
355.28853
577.52197313.27804145.12636
656.58649712.65161
600.52369
768.71592684.61872
794.73166173.13900
796.74525 850.79474
851.79839
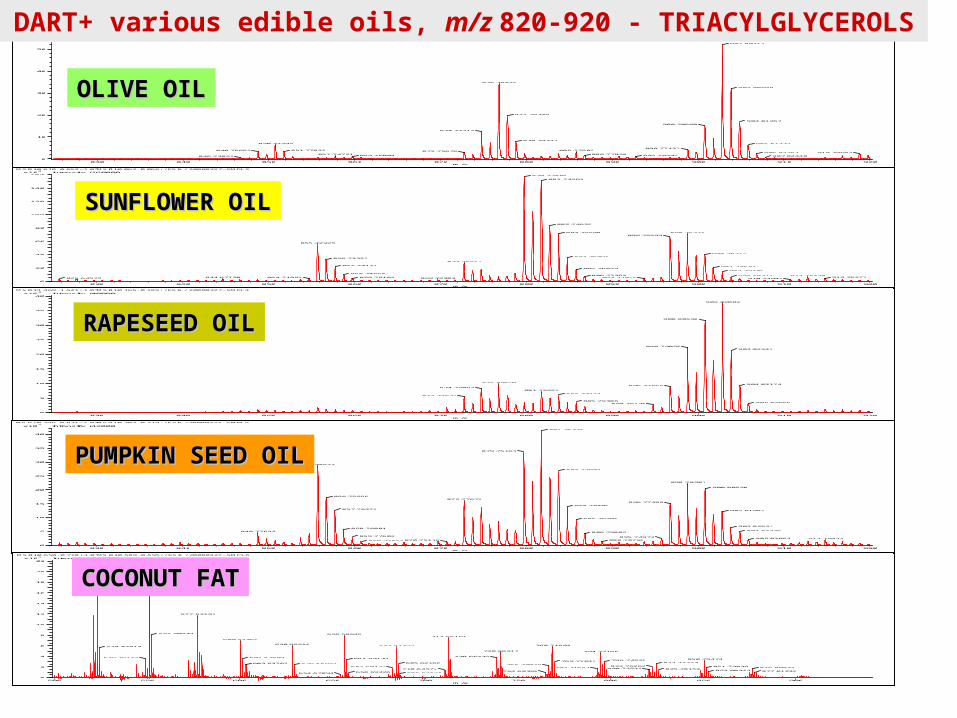
OLIVE OILOLIVE OIL
SUNFLOWER OILSUNFLOWER OIL
RAPESEED OILRAPESEED OIL
PUMPKIN SEED OILPUMPKIN SEED OIL
COCONUT FATCOCONUT FAT
MS[1];1.161..1.226;-1.0*MS[1];1.280..1.305; / ESI+ / 20080327_SMPL1
830 840 850 860 870 880 890 900 910 920m/z
0
10
20
30
40
50
Intensity (53000)x103
902.80217
876.78826
903.80598
877.79200
904.81267
900.78660
874.77212
878.79777
905.81777850.77295
898.77137851.77835848.75652 872.75676 885.77583
918.79683906.82251886.77858857.74721
859.76004 892.78342 907.82448846.73857
DART+ various edible oils, m/z 820-920 - TRIACYLGLYCEROLS
MS[1];0.610..0.652;-1.0*MS[1];0.062..0.066; / ESI+ / 20080327_SMPL3
830 840 850 860 870 880 890 900 910 920m/z
0
20
40
60
80
100
120
140
160Intensity (160000)x10
3
879.72880
881.74263
882.74659
883.75598 898.76725
896.75293
855.72925
900.78217
884.76096856.73323
872.75512
857.74127901.78684
885.76879
902.79489
858.74550886.77352 903.80213 912.75370
914.76277854.71954 859.75183 893.71016825.64572 844.67120910.73942869.72303
MS[1];1.469..1.541;-1.0*MS[1];0.165..0.185; / ESI+ / 20080327_SMPL4
830 840 850 860 870 880 890 900 910 920m/z
0
5
10
15
20
25
30
35
40Intensity (40000)x10
3
902.82082
900.80590
898.79058
903.82543
876.80590904.83174
896.77559874.79093
881.76552
883.77924872.77673
885.79386905.83666
894.76138
MS[1];0.796..0.831;-1.0*MS[1];0.703..0.719; / ESI+ / 20080327_SMPL5
830 840 850 860 870 880 890 900 910 920m/z
0
5
10
15
20
25
30
35
40
Intensity (42000)x103
881.76479
879.75161
855.75044
883.77903
898.78987
900.80520
856.75556
872.77672
896.77488
884.78409
857.76372902.81983
885.79306
903.82521858.76881
904.83336886.79809
848.77632
859.77602895.74973
905.83663 914.79044870.75116 888.78756860.77843
MS[1];0.650..0.710;-1.0*MS[1];0.589..0.595; / ESI+ / 20080327_SMPL6
500 550 600 650 700 750 800 850 900m/z
0
2
4
6
8
10
12
14
16
18
20
22Intensity (22000)x10
3
551.50615
523.47442
577.52197
552.50939 656.58649
712.65161
600.52369
628.55516768.71592
524.47814 684.61872
740.68417 794.73166
738.66732601.52604549.49137 657.59133
796.74525850.79474
769.71843824.77723685.62166603.53763 629.55932
766.70029822.76262 851.79839682.60422
792.71651 876.80844820.74532 825.78153710.63577852.80343764.68368 877.81236
658.59326686.62526654.57094
OLIVE OILOLIVE OIL
SUNFLOWER OILSUNFLOWER OIL
RAPESEED OILRAPESEED OIL
PUMPKIN SEED OILPUMPKIN SEED OIL
COCONUT FATCOCONUT FAT
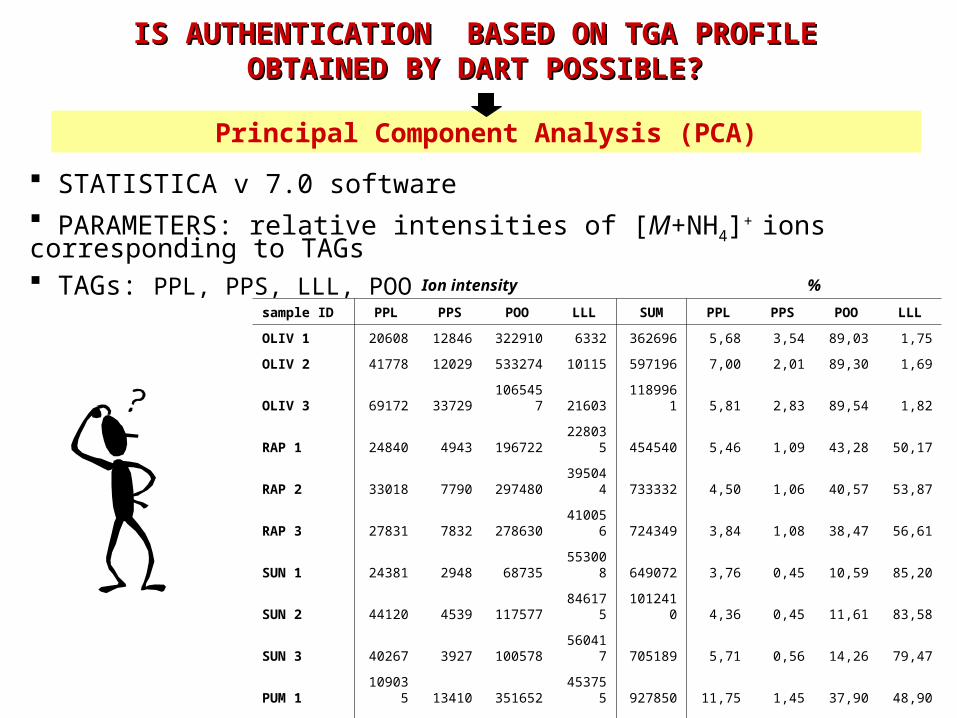
IS AUTHENTICATION BASED ON IS AUTHENTICATION BASED ON TGA TGA PROFILE PROFILE OBTAINED BOBTAINED BY DART POSSIBLE?Y DART POSSIBLE?
Principal Component Analysis (PCA)
STATISTICA v 7.0 software PARAMETERS: relative intensities of [M+NH4]+ ions corresponding to TAGs TAGs: PPL, PPS, LLL, POO
Ion intensity %
sample ID PPL PPS POO LLL SUM PPL PPS POO LLL
OLIV 1 20608 12846 322910 6332 362696 5,68 3,54 89,03 1,75
OLIV 2 41778 12029 533274 10115 597196 7,00 2,01 89,30 1,69
OLIV 3 69172 33729 1065457 21603 1189961 5,81 2,83 89,54 1,82
RAP 1 24840 4943 196722 228035 454540 5,46 1,09 43,28 50,17
RAP 2 33018 7790 297480 395044 733332 4,50 1,06 40,57 53,87
RAP 3 27831 7832 278630 410056 724349 3,84 1,08 38,47 56,61
SUN 1 24381 2948 68735 553008 649072 3,76 0,45 10,59 85,20
SUN 2 44120 4539 117577 846175 1012410 4,36 0,45 11,61 83,58
SUN 3 40267 3927 100578 560417 705189 5,71 0,56 14,26 79,47
PUM 1 109035 13410 351652 453755 927850 11,75 1,45 37,90 48,90
PUM 2 116889 12194 450107 555663 1134853 10,30 1,07 39,66 48,96
PUM 3 74094 7499 190976 240820 513390 14,43 1,46 37,20 46,91
COC 1 62659 46259 67906 3795 180619 34,69 25,61 37,60 2,10
COC 2 82780 73501 97024 7205 260510 31,78 28,21 37,24 2,77
COC 3 111532 86232 113997 8343 320104 34,84 26,94 35,61 2,61
-4 -3 -2 -1 0 1 2 3
Fa cto r 1 : 6 2 .7 1 %
-1 .5
-1 .0
-0 .5
0 .0
0 .5
1 .0
1 .5
2 .0
2 .5
Fa
ctor 2
: 36
.31
%
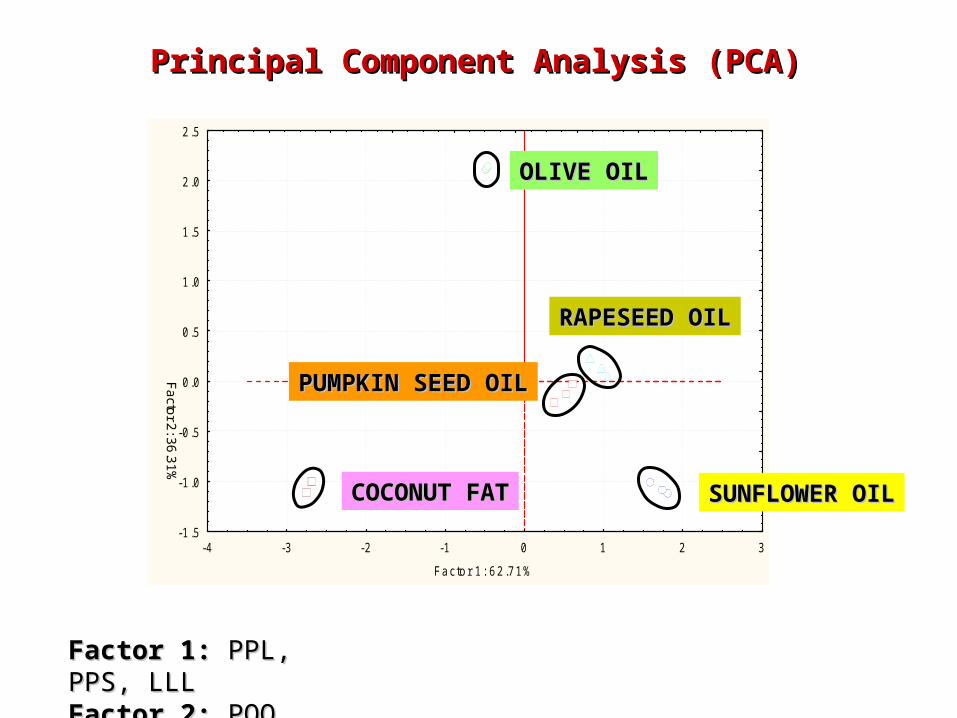
Principal Component Analysis (PCA)Principal Component Analysis (PCA)
Factor 1:Factor 1: PPL, PPS, LLL PPL, PPS, LLLFactor 2:Factor 2: POO POO
OLIVE OILOLIVE OIL
SUNFLOWER OILSUNFLOWER OIL
RAPESEED OILRAPESEED OIL
PUMPKIN SEED OILPUMPKIN SEED OIL
COCONUT FATCOCONUT FAT

MS[1];0.695..0.706;-1.0*MS[1];0.664..0.669; / ESI+ / 20080401_SMPL9
100 200 300 400 500 600 700 800 900 1000m/z
-10
0
10
20
30
40
50
60
70
80
Intensity (88423)x103
898.81927
896.80575
210.07359900.83415
634.56481
872.80574
901.83941636.57957
397.39989
903.85342601.54131193.04613 638.59615431.40718
298.28782
575.52424 904.86402337.28885848.80411639.59896211.07496 432.41506175.03349 905.86880
640.60845 790.68947
MS[1];0.695..0.706;-1.0*MS[1];0.664..0.669; / ESI+ / 20080401_SMPL9
850 860 870 880 890 900 910 920 930 940m/z
0
10
20
30
40
50
60
70
80
Intensity (88423)x103
898.81927
896.80575
900.83415
872.80574
874.81975901.83941
875.82287903.85342
904.86402877.83940
878.82974905.86880
850.81640 914.81604883.80391 906.87476856.77843 870.78378
Sunflower oil TAG

MS[1];0.244..0.255;-1.0*MS[1];0.212..0.217; / ESI+ / 20080406_OILS2
100 200 300 400 500 600 700 800 900 1000m/z
0
20
40
60
80
100
120
140
160
180
200
220
240
Intensity (243699)x103
298.29240
153.08585
299.29325
279.24784 431.40900
166.09705
124.04826 397.40278300.30438205.11117
372.33056
118.09509432.41414 634.57022
636.58514 898.82846617.54326112.05967 433.41619 638.60008 872.81238
MS[1];0.346..0.366;-1.0*MS[1];0.388..0.395; / ESI+ / 20080406_OILS2
850 860 870 880 890 900 910 920 930 940m/z
0
1000
2000
3000
4000
5000
6000
7000
8000
Intensity (8598)
898.84522
896.82024
899.85888
900.86054
901.85258
872.82932
873.83176
928.85559916.84721902.84705
930.86190902.90921918.85595914.84642
Sunflower seeds - direct sampling
TAG
Matrix components

Case studyCase study nno.o. 2 2
Traceability Traceability of honey origin of honey origin

GCxGC/TOF MS

DARTDART: : comparisoncomparison of of two two honey sampleshoney samples
Different origin
Different origin

Processing of measured data is not easy…..Processing of measured data is not easy…..Name Meas. Calc. Diff(u) Abund. GBL 85.0294 85.0290 0.0005 23.1410 Pyruvic_acid 87.0129 87.0082 0.0047 28.4476 Lactic_acid 89.0241 89.0239 0.0002 12.2362 Cresol 107.0463 107.0497 -0.0034 3.4462 Uracil 111.0156 111.0195 -0.0038 19.2750 Creatinine 112.0506 112.0511 -0.0004 71.6850 Succinic/fumaric/maleic acid 115.0058 115.0031 0.0026 39.3193 Methylmalonic_acid 117.0225 117.0187 0.0038 13.1083
Computer Computer analysisanalysis

STROBILURIN FUNGICIDES IN STROBILURIN FUNGICIDES IN GRAINSGRAINS
Case study no.Case study no. 33
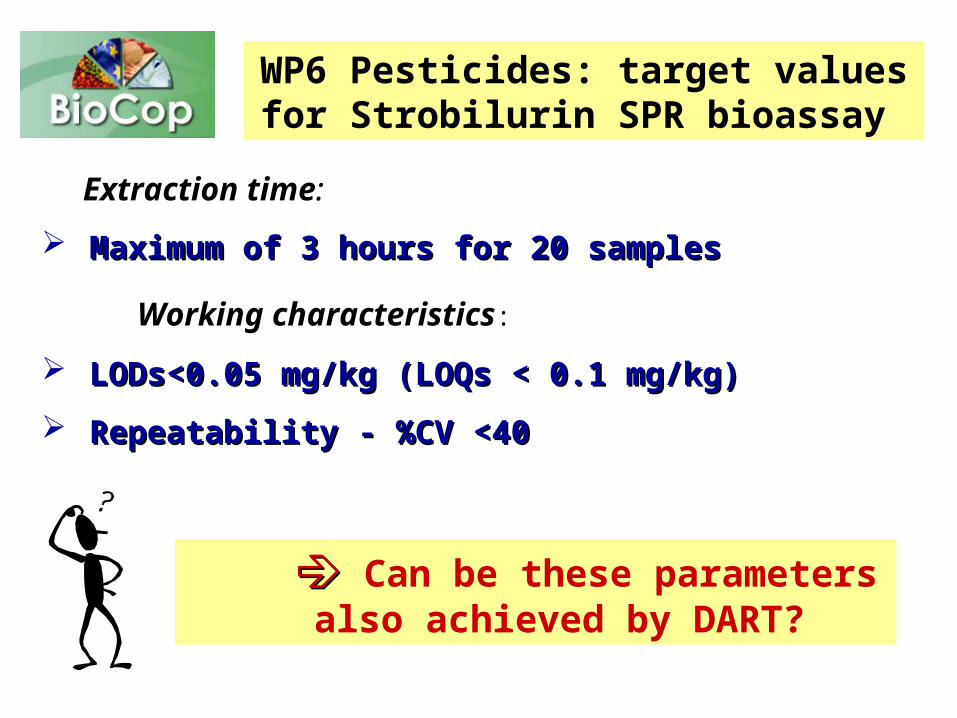
Extraction time:
Maximum of 3 hours for 20 samplesMaximum of 3 hours for 20 samples
Working characteristics:
LODs<0.05 mg/kg (LOQs < 0.1 mg/kg)LODs<0.05 mg/kg (LOQs < 0.1 mg/kg)
Repeatability - %CV <40 Repeatability - %CV <40
WP6 Pesticides: target values for Strobilurin SPR bioassay
Can be these parameters also achieved by DART?

CONCLUSIONSCONCLUSIONS
The total time needed for analysis of one sample by novel The total time needed for analysis of one sample by novel
validated approach (SLE extraction) is 8 min.validated approach (SLE extraction) is 8 min.
The screening of strobilurins direct in milled wheat grains is The screening of strobilurins direct in milled wheat grains is
possible by analysis employing AccuTOF™DART™. possible by analysis employing AccuTOF™DART™.
All target strobilurins can be determined by novel, simple All target strobilurins can be determined by novel, simple
and fast approach at concentration levels below LODs inand fast approach at concentration levels below LODs in

Case study no. 4Case study no. 4

DART AccuTOFDART AccuTOF LC-plus system LC-plus system withwith LEAP HTC PAL LEAP HTC PAL auautosamplertosampler (1) (1) Sample is placed in sampling hole, Sample is placed in sampling hole, DIP-itDIP-itTMTM
sampler sticks are used for sample transfersampler sticks are used for sample transfer(1b)
(1a)
(2)(2)
(2) (2) Sampling stick is immersed into the Sampling stick is immersed into the samplesample for 4sfor 4s
(3)(3)
(3)(3) Sampling stick is transferred between the DART ion source and MS inlet, mass spectra are acquired for 7s
(4)(4)
(4)(4) Used stick Used stick disposeddisposed
TOTAL RUN TIME: TOTAL RUN TIME: 35 35 ss
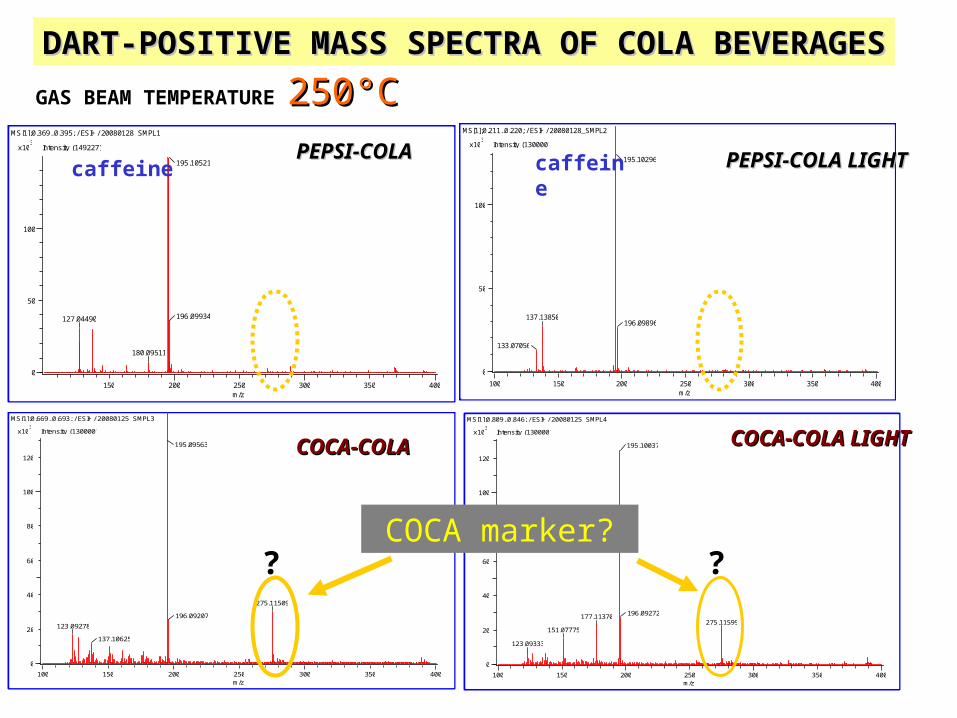
GAS BEAM TEMPERATURE 250250°C°CDART-POSITIVE MASS SPECTRA OF COLA BEVERAGESDART-POSITIVE MASS SPECTRA OF COLA BEVERAGES
MS[1];0.369..0.395; / ESI+ / 20080128_SMPL1
150 200 250 300 350 400m/z
0
50
100
Intensity (149227)x103
195.10521
196.09934127.04490
180.09511
MS[1];0.211..0.220; / ESI+ / 20080128_SMPL2
100 150 200 250 300 350 400m/z
0
50
100
Intensity (130000)x103
195.10296
137.13850196.09896
133.07056
MS[1];0.809..0.846; / ESI+ / 20080125_SMPL4
100 150 200 250 300 350 400m/z
0
20
40
60
80
100
120
Intensity (130000)x103
195.10037
196.09272177.11370275.11599
151.07775
123.09333
MS[1];0.669..0.693; / ESI+ / 20080125_SMPL3
100 150 200 250 300 350 400m/z
0
20
40
60
80
100
120
Intensity (130000)x103
195.09563
275.11509
196.09207
123.09278
137.10625
COCA-COLACOCA-COLA COCA-COLA COCA-COLA LIGHTLIGHT
PEPSI-COLAPEPSI-COLA PEPSI-COLA LIGHTPEPSI-COLA LIGHT
? ?
caffeine caffeine
COCA marker?

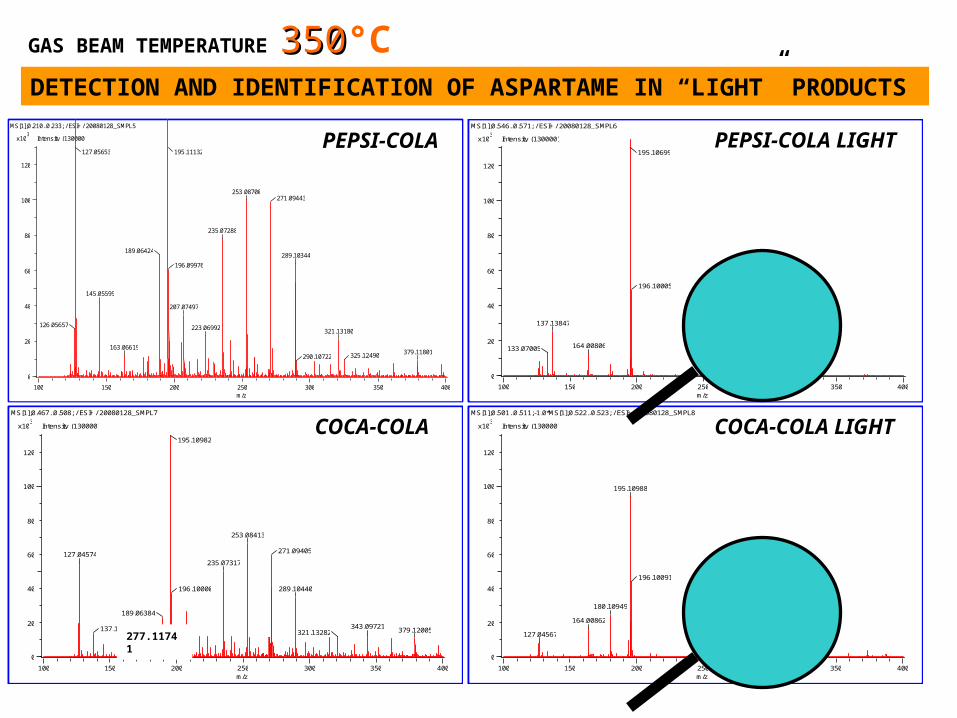
GAS BEAM TEMPERATURE 335050°C
MS[1];0.210..0.233; / ESI+ / 20080128_SMPL5
100 150 200 250 300 350 400m/z
0
20
40
60
80
100
120
Intensity (130000)x103
127.05653 195.11132
253.08700271.09443
235.07288
189.06424289.10344
196.09976
145.05599
207.07497
126.05657 223.06992 321.13180
163.06619325.12490 379.11801
290.10722
MS[1];0.546..0.571; / ESI+ / 20080128_SMPL6
100 150 200 250 300 350 400m/z
0
20
40
60
80
100
120
Intensity (130000)x103
195.10699
295.14051196.10005
137.13847
133.07005 164.00806
296.14362
MS[1];0.467..0.508; / ESI+ / 20080128_SMPL7
100 150 200 250 300 350 400m/z
0
20
40
60
80
100
120
Intensity (130000)x103
195.10982
253.08413
271.09405127.04574235.07317
196.10000 289.10440
189.06384
137.13910 343.09721321.13282 379.12005
MS[1];0.501..0.511;-1.0*MS[1];0.522..0.523; / ESI+ / 20080128_SMPL8
100 150 200 250 300 350 400m/z
0
20
40
60
80
100
120
Intensity (130000)x103
195.10988
196.10091
295.14109
180.10949
164.00862
127.04567
COCA-COLACOCA-COLA COCA-COLA LIGHT
PEPSI-COLAPEPSI-COLA PEPSI-COLA PEPSI-COLA LIGHTLIGHT
HIGH S
UGAR CONTENT (~
100g/L)
SUGAR CONTENT IS
VERY L
OW (<
0.1g/L)
HEAT-INDUCED HEAT-INDUCED SUGAR FRAGMENTATION IN NORMAL COLASSUGAR FRAGMENTATION IN NORMAL COLAS

MS[1];0.467..0.508; / ESI+ / 20080128_SMPL7
100 150 200 250 300 350 400m/z
0
20
40
60
80
100
120
Intensity (130000)x103
195.10982
253.08413
271.09405127.04574235.07317
196.10000 289.10440
189.06384
137.13910 343.09721321.13282 379.12005
DETECTION AND IDENTIFICATION OF ASPARTAME IN “LIGHT” PRODUCTSMS[1];0.210..0.233; / ESI+ / 20080128_SMPL5
100 150 200 250 300 350 400m/z
0
20
40
60
80
100
120
Intensity (130000)x103
127.05653 195.11132
253.08700271.09443
235.07288
189.06424289.10344
196.09976
145.05599
207.07497
126.05657 223.06992 321.13180
163.06619325.12490 379.11801
290.10722
MS[1];0.546..0.571; / ESI+ / 20080128_SMPL6
100 150 200 250 300 350 400m/z
0
20
40
60
80
100
120
Intensity (130000)x103
195.10699
295.14051196.10005
137.13847
133.07005 164.00806
296.14362
MS[1];0.501..0.511;-1.0*MS[1];0.522..0.523; / ESI+ / 20080128_SMPL8
100 150 200 250 300 350 400m/z
0
20
40
60
80
100
120
Intensity (130000)x103
195.10988
196.10091
295.14109
180.10949
164.00862
127.04567
COCA-COLA COCA-COLA LIGHT
PEPSI-COLA PEPSI-COLA LIGHT
277.11741
GAS BEAM TEMPERATURE 335050°C
MS[1];0.467..0.508; / ESI+ / 20080128_SMPL7
100 150 200 250 300 350 400m/z
0
20
40
60
80
100
120
Intensity (130000)x103
195.10982
253.08413
271.09405127.04574235.07317
196.10000 289.10440
189.06384
137.13910 343.09721321.13282 379.12005
MS[1];0.210..0.233; / ESI+ / 20080128_SMPL5
100 150 200 250 300 350 400m/z
0
20
40
60
80
100
120
Intensity (130000)x103
127.05653 195.11132
253.08700271.09443
235.07288
189.06424289.10344
196.09976
145.05599
207.07497
126.05657 223.06992 321.13180
163.06619325.12490 379.11801
290.10722
MS[1];0.546..0.571; / ESI+ / 20080128_SMPL6
100 150 200 250 300 350 400m/z
0
20
40
60
80
100
120
Intensity (130000)x103
195.10699
295.14051196.10005
137.13847
133.07005 164.00806
296.14362
MS[1];0.501..0.511;-1.0*MS[1];0.522..0.523; / ESI+ / 20080128_SMPL8
100 150 200 250 300 350 400m/z
0
20
40
60
80
100
120
Intensity (130000)x103
195.10988
196.10091
295.14109
180.10949
164.00862
127.04567
COCA-COLA COCA-COLA LIGHT
PEPSI-COLA PEPSI-COLA LIGHT
277.11741
DETECTION AND IDENTIFICATION OF ASPARTAME IN “LIGHT” PRODUCTS
GAS BEAM TEMPERATURE 335050°C

MS[1];0.467..0.508; / ESI+ / 20080128_SMPL7
100 150 200 250 300 350 400m/z
0
20
40
60
80
100
120
Intensity (130000)x103
195.10982
253.08413
271.09405127.04574235.07317
196.10000 289.10440
189.06384
137.13910 343.09721321.13282 379.12005
MS[1];0.210..0.233; / ESI+ / 20080128_SMPL5
100 150 200 250 300 350 400m/z
0
20
40
60
80
100
120
Intensity (130000)x103
127.05653 195.11132
253.08700271.09443
235.07288
189.06424289.10344
196.09976
145.05599
207.07497
126.05657 223.06992 321.13180
163.06619325.12490 379.11801
290.10722
MS[1];0.546..0.571; / ESI+ / 20080128_SMPL6
100 150 200 250 300 350 400m/z
0
20
40
60
80
100
120
Intensity (130000)x103
195.10699
295.14051196.10005
137.13847
133.07005 164.00806
296.14362
MS[1];0.501..0.511;-1.0*MS[1];0.522..0.523; / ESI+ / 20080128_SMPL8
100 150 200 250 300 350 400m/z
0
20
40
60
80
100
120
Intensity (130000)x103
195.10988
196.10091
295.14109
180.10949
164.00862
127.04567
COCA-COLA COCA-COLA LIGHT
PEPSI-COLA PEPSI-COLA LIGHT
MS[1];0.329..0.344; / ESI+ / 20080129_SMPL1
270 280 290 300 310m/z
0
100
200
300
400
Area (486304)x103
295.12968
296.13086
277.11741
278.10914
MS[1];0.321..0.348; / ESI+ / 20080129_SMPL1
270 280 290 300 310m/z
0
100
200
300
400
Area (497691)x103
295.12984
296.13114
277.11726
278.10806
295.12984
277.11726
277.11741
295.12968
ASPARTAME E951
meas. mass 295.1298
calc. mass 295.1294
difference +1.51ppm
[M-H2O+H]+
[M+H]+
[M+H]+

MS[1];0.865..0.895; / ESI+ / 20080128_SMPL12
100 150 200 250 300 350 400m/z
0
20
40
60
80
100
120
Intensity (130000)x103
195.11482
196.10203
127.04609
295.14354164.00930
MS[1];0.421..0.502;-1.0*MS[1];0.503..0.504; / ESI+ / 20080128_SMPL11
100 150 200 250 300 350 400m/z
0
20
40
60
Intensity (76789)x103
195.10382
127.04821
253.08425
271.09503235.07264
189.06482289.10535145.05699
315.10421173.09991 361.11046
MS[1];0.555..0.607; / ESI+ / 20080128_SMPL10
100 150 200 250 300 350 400m/z
0
20
40
60
80
100
120
Intensity (130000)x103
195.10356
295.14244
196.10049164.00913
137.13920
MS[1];0.311..0.333; / ESI+ / 20080128_SMPL9
100 150 200 250 300 350 400m/z
0
20
40
60
80
100
120
Intensity (130000)x103
195.11695127.04968253.09184
271.09562
235.07846
189.06506
289.10397
343.09629
361.10677315.09898
145.05639 173.09947
COCA-COLA COCA-COLA LIGHT
PEPSI-COLA PEPSI-COLA LIGHT
ASPARTAME
ASPARTAME
GAS BEAM TEMPERATURE 445050°C

Coffee - qualityCoffee - quality,, authenticity authenticity
Example no Example no 33

MS[1];0.597..0.608; / ESI+ / 20080125_SMPL4
260 280 300 320 340 360 380 400m/z
0
2
4
6
8
10
12
14
16
18
20
22
24
Intensity (24939)x103
275.11657
327.20489 389.17218
283.17693
371.23050
255.12331
257.24976390.17652
MS[1];0.679..0.690; / ESI+ / 20080125_SMPL3
260 280 300 320 340 360 380 400m/z
2
4
6
8
10
12
14
16
18
20
22
24
Intensity (24961)x103
275.11501
276.11924
389.17114279.16366
283.17493255.12275 327.20298361.27811
321.14738
MS[1];0.597..0.608; / ESI+ / 20080125_SMPL4
260 280 300 320 340 360 380 400m/z
0
2
4
6
8
10
12
14
16
18
20
22
24
Intensity (24939)x103
275.11657
327.20489 389.17218
283.17693
371.23050
255.12331
257.24976390.17652
Arabica Roasted
Robusta Roasted Robusta Roasted(Douwe Egberts)
reference match
No match

SPME preconcentration – SPME preconcentration – another challenge!!!another challenge!!!

MS[1];1.923..1.976; / ESI+ / 20080129_SMPL4
100 150 200 250 300 350 400 450 500 550m/z
0
10
20
30
40
50
60
70
Intensity (70000)x103
89.06596
75.08532
90.06969 371.12527223.08086117.10025 445.14986177.12490
373.11881297.10207355.09426225.07013
Blank SPME fiber (PDMS/CX/DVB, Supelco)
Bleed: siloxans
WHAWHATT ABOUT USING SPME FOR ABOUT USING SPME FOR SAMPLE FLAVOUR COMPONENTS SAMPLE FLAVOUR COMPONENTS COLLECTION / PRE.CONCENTRATION??COLLECTION / PRE.CONCENTRATION??

MS[1];0.259..0.279; / ESI+ / 20080129_SMPL3
100 150 200 250 300 350 400 450 500 550m/z
0
10
20
30
40
50
60
70
Intensity (70300)x103
81.03992
98.10317
127.04709
161.07056
100.11893
160.08553
175.09728189.11335
190.10231
204.11824 371.12327
236.14312 275.13111 445.14831372.12754
Coffee (Nescafe Gold) 1g of matrix, HS-SPME (40°C, 60 min, PDMS/CX/DVB)
bleed
coffee volatiles

MS[1];0.264..0.293; / ESI+ / 20080129_SMPL3
80 100 120 140 160 180 200 220 240m/z
0
10
20
30
40
50
60
70
Intensity (70000)x103
81.04171 127.04733
96.05144
98.10277
161.07101
109.08318
95.06595
100.11877160.08558
113.06757175.09743123.09897
189.1133985.03399
129.06215
139.09329176.08793 190.10163148.08532 165.10705
156.11213122.07035 203.12821195.10213
180.13511166.10736 205.10902 219.12607 231.12856
Coffee (Nescafe Gold) ZOOM (m/z 75-245) 1g of matrix, HS-SPME (40°C, 60 min, PDMS/CX/DVB)
pyrazine
methylpyrazine
caffeine
2-(2-furfuryl)pyrazine
2-acetylpyrrole

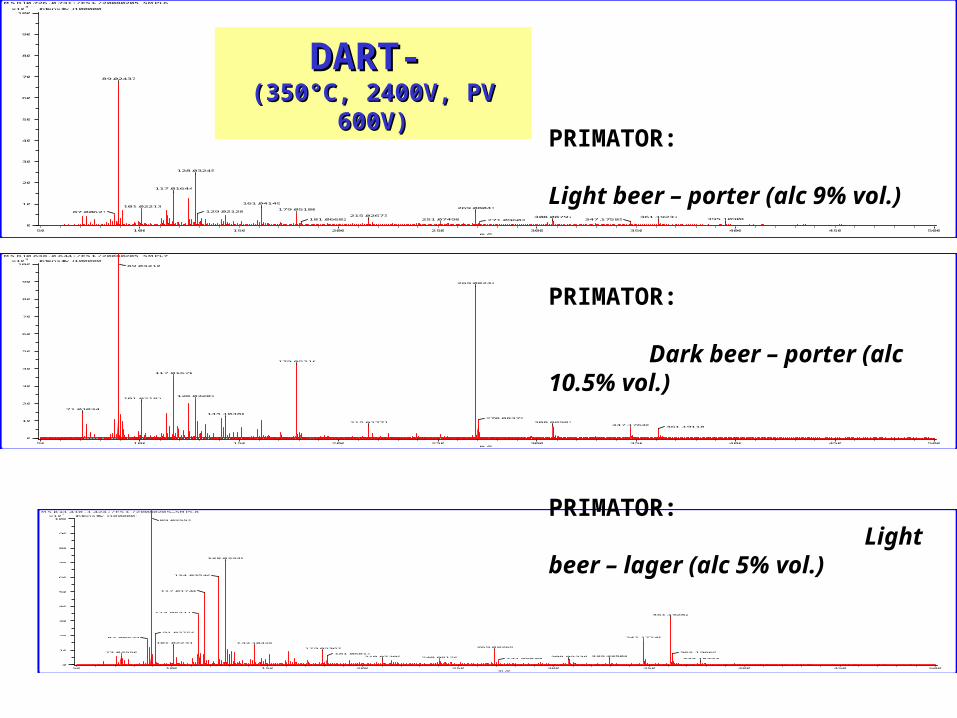
BEERS PROFILINGBEERS PROFILING
Example no Example no 55
MS[1];0.726..0.731; / ESI- / 20080205_SMPL6
50 100 150 200 250 300 350 400 450 500m/z
0
10
20
30
40
50
60
70
80
90
100
Intensity (100000)x103
89.02437
128.03245
117.01644
161.04149101.02213 269.08043179.05180
129.0212887.00621215.02673 308.08797 361.19237
181.06682 347.17585271.09602 395.10908251.07498
DART-DART- (350°C, 2400V, PV 600V)(350°C, 2400V, PV 600V)
m/z 250400
MS[1];0.638..0.644; / ESI- / 20080205_SMPL7
50 100 150 200 250 300 350 400 450 500m/z
0
10
20
30
40
50
60
70
80
90
100
Intensity (100000)x103
89.03210
269.08242
179.05216
117.01670
128.03203101.02187
71.01034
143.10480
270.08372
308.08983215.02771347.17636
361.19118
PRIMATOR: Light beer – porter (alc 9% vol.)
PRIMATOR: Dark beer – porter (alc 10.5% vol.)
MS[1];1.410..1.424; / ESI- / 20080205_SMPL8
50 100 150 200 250 300 350 400 450 500m/z
-0
10
20
30
40
50
60
70
80
90
100
Intensity (100000)x103
89.02559
128.03345
124.03546
117.01740
114.05311361.19282
91.03758
87.00634 347.17748
101.02231 143.10428
269.08269179.05367
362.1966973.02556181.06814
329.22502308.09338210.07305271.09830
240.08128377.18773
PRIMATOR: Light beer – lager (alc 5% vol.)

MS[1];0.716..0.766; / ESI+ / 20080204_SMPL6
60 80 100 120 140 160 180 200 220 240m/z
0
10
20
30
40
50
60
Intensity (60000)x103
116.07892
89.06748 130.05354
145.05138
93.09751
105.07718
216.1229881.04271
73.07489
166.09312200.12530
70.07551 176.09215146.07910 218.12376 248.12142
MS[1];0.720..0.773; / ESI+ / 20080204_SMPL7
60 80 100 120 140 160 180 200 220 240m/z
0
10
20
30
40
50
60
Intensity (60000)x103
127.04469 145.0520573.07541
85.03718
97.03636
103.08255
216.12366
130.05368
105.07718
158.08384
219.08789180.09805
163.06178 200.12550
214.1391672.09100 232.14016191.09152
MS[1];0.334..0.387; / ESI+ / 20080204_SMPL8
60 80 100 120 140 160 180 200 220 240m/z
0
10
20
30
40
Intensity (40000)x103
89.06791
103.08311
73.07509
75.05402 116.07663
130.05376145.05178
76.0501481.04312
173.15371
70.07590 166.09237 180.10244 201.16460 216.12735 234.11630
MS[1];1.298..1.347; / ESI+ / 20080204_SMPL10
60 80 100 120 140 160 180 200 220 240m/z
0
10
20
30
40
50
60
Intensity (60000)x103
116.07703
127.04348
105.07864
130.05383
145.05203
81.04274
89.0663599.05199
162.0920075.05384 176.09296
152.0750570.07582 216.12354
180.09280 231.11132242.10964
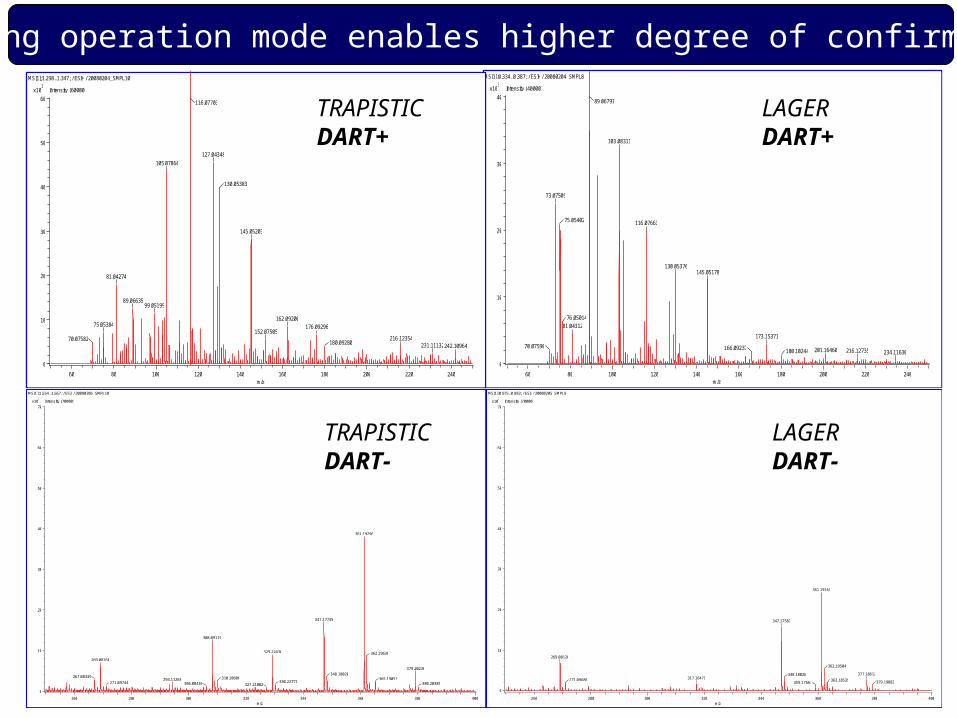
PORTER (Dark)PORTER (Dark) LAGERLAGER
TRAPISTICTRAPISTICPORTER (Light)PORTER (Light)
DART-DART- (350°C, 2400V, PV 600V)(350°C, 2400V, PV 600V)
MS[1];0.975..0.983; / ESI- / 20080205_SMPL9
260 280 300 320 340 360 380 400m/z
0
10
20
30
40
50
60
70
Intensity (70000)x103
361.19161
347.17587
269.08120
362.19504
348.18026 377.18612
271.09680 363.18539317.16471379.19882359.17667
MS[1];1.554..1.567; / ESI- / 20080205_SMPL10
260 280 300 320 340 360 380 400m/z
0
10
20
30
40
50
60
70
Intensity (70000)x103
361.19296
347.17745
308.09119
362.19636329.22430
269.08160
379.20236348.18020
267.08339 310.10606 365.19053330.22771294.11268
271.09744 306.08436 380.20385327.21002
MS[1];0.334..0.387; / ESI+ / 20080204_SMPL8
60 80 100 120 140 160 180 200 220 240m/z
0
10
20
30
40
Intensity (40000)x103
89.06791
103.08311
73.07509
75.05402 116.07663
130.05376145.05178
76.0501481.04312
173.15371
70.07590 166.09237 180.10244 201.16460 216.12735 234.11630
MS[1];1.298..1.347; / ESI+ / 20080204_SMPL10
60 80 100 120 140 160 180 200 220 240m/z
0
10
20
30
40
50
60
Intensity (60000)x103
116.07703
127.04348
105.07864
130.05383
145.05203
81.04274
89.0663599.05199
162.0920075.05384 176.09296
152.0750570.07582 216.12354
180.09280 231.11132242.10964
Switching operation mode enables higher degree of confirmation.
LAGERDART+
TRAPISTICDART+
LAGERDART-
TRAPISTICDART-

Head Space SPME(DVB/CX/PDMS)
45 minutes at 75°C(pre-incubation 5 minutes)
Direct SPME(DVB/CX/PDMS)
45 minutes at 75°C(pre-incubation 10 minutes)
Analytical scheme - volatiles profiling
DART+ (250°C, 2400V, PV 600V)
3 ml of beer 9 ml of beer

MS[1];0.175..0.237;-1.0*MS[1];0.098..0.133; / ESI+ / 20080404_js2
50 100 150 200 250 300 350 400 450 500m/z
0
50
100
Intensity (120000)x103
363.20446349.18569
364.20315
105.06545
339.23757
223.08841
401.24879
293.12643173.14639 415.26074331.17933199.16142 467.25615
365.20457145.11585 281.12652 431.25678
275.15962 453.24218224.09233 468.2589993.08679
81.02993
MS[1];0.211..0.239;-1.0*MS[1];0.183..0.202; / ESI+ / 20080402_js4
0
20
40
60
80
100
120Intensity (120000)x10
3
105.08000 199.18571173.16689
89.06691
145.13326
205.21080
106.0819581.04239 277.23627
174.17037137.14140 209.15276 305.26865163.14559267.19377 371.12599345.32437 445.14792
DART+ (250°C, 2400V, PV 600V)Westmalle: trapistic beer (alc 9.5% vol.)
Head Space SPME(DVB/CX/PDMS)
Direct SPME(DVB/CX/PDMS)

MS[1];0.252..0.279;-1.0*MS[1];0.209..0.232; / ESI+ / 20080404_js5
50 100 150 200 250 300 350 400 450 500m/z
0
50
100
Intensity (120000)x103
363.22505349.20735
364.22515
339.25833223.10198
399.25728417.26766
293.14379
307.15943
173.15701151.07810105.07244116.07386 281.14987 431.28235
331.19629145.12497 365.22654265.10630180.10462
433.28140 467.28351319.21285235.09834104.07325 489.32066
MS[1];0.194..0.238;-1.0*MS[1];0.125..0.163; / ESI+ / 20080402_js8
0
20
40
60
80
100
120Intensity (120000)x10
3
173.16326
145.12983
105.07624
201.19569
199.18014
205.2060489.06322
174.16566111.12304 229.22855127.11801 163.14107 371.11744
279.17331 445.13845267.18518 345.31537
81.05659 372.11967305.25959
DART+ (250°C, 2400V, PV 600V)Plzeň: lager (alc 4,4 % vol.)
Head Space SPME(DVB/CX/PDMS)
Direct SPME(DVB/CX/PDMS)

SPME beer profiling enables production origin differentiation!
MS[1];0.186..0.226;-1.0*MS[1];0.095..0.138; / ESI+ / 20080404_js1
0
20
40
60
80
100
120Intensity (120000)x10
3
127.03703
145.04750
85.02635173.15136
105.06835
363.20966
163.05826201.18094
349.19503
198.09668 216.12015 401.26002116.06910 265.0945781.03144 289.15372 317.19085
415.27301364.2127475.07693 231.10119
417.25724241.17586 399.24451307.13460447.26349
MS[1];0.175..0.237;-1.0*MS[1];0.098..0.133; / ESI+ / 20080404_js2
50 100 150 200 250 300 350 400 450 500m/z
0
50
100
Intensity (120000)x103
363.20446349.18569
364.20315
105.06545
339.23757
223.08841
401.24879
293.12643173.14639 415.26074331.17933199.16142 467.25615
365.20457145.11585 281.12652 431.25678
275.15962 453.24218224.09233 468.2589993.08679
81.02993
Chimay: trapistic beer (alc 8% vol.)
Westmalle: trapistic beer (alc 9.5% vol.)

SPME beer profiling enables production origin differentiation!
MS[1];0.252..0.279;-1.0*MS[1];0.209..0.232; / ESI+ / 20080404_js5
50 100 150 200 250 300 350 400 450 500m/z
0
50
100
Intensity (120000)x103
363.22505349.20735
364.22515
339.25833223.10198
399.25728417.26766
293.14379
307.15943
173.15701151.07810105.07244116.07386 281.14987 431.28235
331.19629145.12497 365.22654265.10630180.10462
433.28140 467.28351319.21285235.09834104.07325 489.32066
Plzeň: lager (alc 4,4 % vol.)
MS[1];0.302..0.331;-1.0*MS[1];0.261..0.285; / ESI+ / 20080404_js6
50 100 150 200 250 300 350 400 450 500m/z
0
50
100
Intensity (120000)x103
363.22795
105.07420
349.21056
173.15934
151.08021
364.22852
339.26110
145.12681
367.26019223.10325293.14674201.19082 417.27145
331.1994489.06019 281.17487 467.28731127.04327 431.28419399.2609481.03626 379.22266
265.12441 471.31706
Staropramen: lager (alc 5 % vol.)
MS[1];0.221..0.256;-1.0*MS[1];0.162..0.195; / ESI+ / 20080404_js3
0
20
40
60
80
100
120Intensity (120000)x10
3
363.20630105.06749
339.24246
127.03552
145.04577 417.24984
349.1917397.02554
151.07139 295.21722
364.2084685.02551
399.24004431.26129
173.14891 447.25779279.22254 375.20605297.23250
163.05729277.20570116.06830 216.11739 467.26316
331.1840275.07758180.09274
235.10151 479.25888
Budvar: lager (alc 5 % vol.)
Same technology.Different producers.

MS[1];0.302..0.331;-1.0*MS[1];0.261..0.285; / ESI+ / 20080404_js6
50 100 150 200 250 300 350 400 450 500m/z
0
50
100
Intensity (120000)x103
363.22795
105.07420
349.21056
173.15934
151.08021
364.22852
339.26110
145.12681
367.26019223.10325293.14674201.19082 417.27145
331.1994489.06019 281.17487 467.28731127.04327 431.28419399.2609481.03626 379.22266
265.12441 471.31706
MS[1];0.660..0.676;-1.0*MS[1];0.636..0.646; / ESI+ / 20080404_js4
0
20
40
60
80
100
120
Intensity (120000)x103
105.07144
127.04022
97.02970 151.07684 363.21773
339.2554585.02915 279.23259417.26347
297.24412 399.25374163.0654181.03375 431.27651173.15487 277.11613219.06643
465.26905
MS[1];0.175..0.237;-1.0*MS[1];0.098..0.133; / ESI+ / 20080404_js2
50 100 150 200 250 300 350 400 450 500m/z
0
50
100
Intensity (120000)x103
363.20446349.18569
364.20315
105.06545
339.23757
223.08841
401.24879
293.12643173.14639 415.26074331.17933199.16142 467.25615
365.20457145.11585 281.12652 431.25678
275.15962 453.24218224.09233 468.2589993.08679
81.02993
SPME beer profiling enables production technology differentiation!
LAGER
TRAPISTIC
LIGHT beer
Co
st of b
eer

DART is primarily a DART is primarily a small-moleculesmall-moleculess analysis technique analysis technique (with some exceptions)
SUMMARYSUMMARY
No sample preparation and No sample preparation and components separation neededcomponents separation needed
In situIn situ degradation (pyrolysis) of degradation (pyrolysis) of sample components may provide sample components may provide matrix-characteristic profilesmatrix-characteristic profiles

DARTDART is a dry technique and is a dry technique and DESIDESI is not is not
DESIDESI has proved to be very valuable with peptides and has proved to be very valuable with peptides and
proteins. proteins. DESI DESI forms multiple-charge ions and alkaline forms multiple-charge ions and alkaline
metal ions of these materials, metal ions of these materials, DDARTART does not. does not.
DART DART has not been very effective in producing even has not been very effective in producing even
single-charge ion peptides. Although it is still premature single-charge ion peptides. Although it is still premature
to say, it appears that to say, it appears that DESI DESI may suffer from some of the may suffer from some of the
ion suppression problems that have come to be ion suppression problems that have come to be
associated with electrospray ionisation.associated with electrospray ionisation.
DART DART versusversus DESI DESI ??
... concerns exist about MS contamination problem when using DESI
Thank you for your kind attention Thank you for your kind attention