institute o research poverty - ojp.gov
TRANSCRIPT

. , :::; ..,. .
" :.
MICRbC6PY RESOLUTION TEST CHART NATiONAL BUREAU OF STANDA~DS-1963-A
._ ...... , ' ..
, Microfilming procedures J..lsed to create this fic;he comply with Jhestandardssetforth jn41CFR 101-11.504. ;,....
IPoints of view ot opinIons stated, in thisciocument are those,ofJhe authot(s).and'do not represent the official positipn:',or policiesQf. tllf3 U, S. Department of Justice. _
t.:i
o
Universiiy of 'Wisconsin-Madison ,«]
, . 0
Institute for· Research on Poverty Discussion Papers
e-I)
~ .' ::. ," ;
r::--, j
'~~f ..' ....... .
.~ J q' ."'
~' "
~----:..--~ ~-., ...... -._.- , .... -.. ,--
P ,II
" i~
o
"
Jr.
,'f
UP lf657-81 i,
If you have issues viewing or accessing this file contact us at NCJRS.gov.

:.'< ,
Q
... :y:f. ." o
t·\ ·c
0, \l" . \:I
o
"Racism and thj: Criminal JUSitice System
r::} (~~: 1',
Samuel L. Myers, Jr. Bureau of Economi cs <)
oJ ',!
Federal 'Trade COmmission
April 1981
o
Financial suppo;t from th~ National Institute of Justice (Grant No ~ 78NI-AX-0073), ~heNati?rl.al Science Foundu~ion (Soc-7908295) ~ and the RockefellerFo~dat.ion ,'(RF-78047) is. gratefully acknowledged. Additional support Was provided through funds grant~d to the Institute for Research. on Poverty.attne uItiversityof WiscoQ,sin (Madison) by the Department of Health and Human. S.ervices purswmt to the provisions of the Economic Opportunity Act o~ 1964. Valuable research 'as,;;istance was. provided . by Edward Baldwin, Kelly A. Johnson, and David Merriman •. The views expressed in ~his paper are those of the authoralon~and should not beco~strued to reflect the. opin,ions or official positi<\lns of the Bureau .of E'conomics, the Staff of the Federal Trade Couunbsion or its Commissioners, or of any othe.r governmel'ltal agency.
, ~,
U.S. Department of Justice Nationallnstllute of ",ustice
Tnis document has been reproducfld exactly as received from the person or organizatlon originating It. Points of view or opInIons stated in this document are those. of the authors ;:lOd do not necessarBy represent the official position or policies of the National Institute of Justice.
Permission t~ reproduce this c.·!lI!led material has been granted by Public Danain/NIJ ,U~s. Dept." of Justice
.. ,·tothe·Natlonal·:CrJmlQat.J~ustice Reference Service (NCJRS). ,: .
Further reproduction olJtslde of Ihe NCJRS systElm requires permissi8n of tha ~owner.
o
"
.... ~.
;,.. ... .' ;
'"
ABSTRACT
r..:J
Ii raciaL) differences in t~eatment of offenders in th\! federal
system of criminal Justice were elimin.ated, ~otild the racialodifferences
in<. recidivism disappear? If one believes that the' 'source 0/) the disparate
involvement of blacks in the criminal justice system stems from racial . 0
factors IJ.nk~d to labor markets, then the answer ,ts no. This is ~ view
inferred. from a seminal work by Thorsten Sellina (1976) • But Sellin.' ~
analysis was' based on the evolution of st.ate "prison.s ana not the federal
crWnal' justice system. I& this paper I test the hypothesis that elimin-_'\ '.'
9
ating racial discrimination in federal courts and prisons will reduce the
racial gap in crime. I use a sample .of2,500 felons rel,eased from United
States prisons in1972. The findings strongly s'-1pport the view inferred \~- ,\
. from Sellin: eliminating racisJ'll in,. the ~O'-1rts and prisons will not eliminate
. racial differences in crime rates. However ,reducing the disparities
in pre-prison labor market 9Pportunities will achieve that result. I find \} ()
"',, .
that although pre-prison employment plays a minor role in determining ,) .,
recidiviSm, eq'-1alizing black andowhite employment taxperience represents ()
one of the few means of reducing the. racial gap in crime~
t ~ q f.: ,
;1
:';
. , .

, '< ~ ~~ . n} ltl :~ " I, III
l~ 9·
\1 .>
i)
'0
CI 5
'" !
D a o o
',' /' I; ..... ::
G
. ABSTRACT
If racial differences in treatmen t of offend era in the fed~r~l " '" -'
system of criminal justice were eliminated,would die racial differences . . 0
in recidivism disappear? If one believes that. the source of the' di~parate
involvement of blacks in the criminal justice system stems from racial o
f.actors linked to labor markets, then the answer is no. This is a view
inferred from a seminal work by Thorsten 0 Sellin (1976). But Sellin's
analysis was based on the evolution of state prisons and not the federal o
criminal justice system. In this paper I test the hypothesis that elimin-. 0 . -
ating racial discrilninationoin federal courts and prisons will rediice the
racial ga~') in crilp.e. I US!ea 'sa,mple of 2,5100 felons l'eleased from ¥nited
States prisons in 1972. The findings strongly support the view inferred
o
from Sellin: eliminating racism in .thecourts and prisons will not eliminate
. racial differences irJ/cri:me rates ~'However ,reducing the disparities"
in pre-prison labor market opportunities will achieve that result.. I find Q
that although pre-prison employment plays a minor role in determining 19 :.,
recidivism, e<qualizing black and whiteemploynent experience representEJ . (j
one of the few means of reducing the racial gap inct:ime .•
Q
. J .
o
"
o
, " •
[)
".:<
o
Racism and the. Criminal Ju~tice System
INTRODUCTIQN
A recent study offers intriguing documentation of a historical link
" between labor markets and the criminal juatice system. Thorsten Sellin
(1976) argues that the demands ~f labormalrkets have traditionally shaped.
the penal syste~ and that changes in th~t system through time are more
closely related to changing labor market structures than. to evolving
theories of punishriient. .For example, the Romans , who perhaps held the
larges'i:number of slaves in antiquity, used prisoners to work on public
proj ects. There was little need for prisons .as we know them today because
of the continuous construction of' buildings Slid roads under the Roman
t:ulers.
In .,the mid-seventeenth century. Fl'ench prisoners manned the oars
of galleys. Originally~ ·l.ifetime slavery at the oars had been a form
of commutation of death seutences, but as 'the demand for rowers increased' .0' eVen petty criminals were sent to the galleys. The enlarged supply of
galley convicts swelled,czoeating a n\lijo!-' maintenance expense. At first,
older and infirm convicts were sent to Louisiana and the Fren~.h West
o Indies, but the:y could not match the productiyltyof plack slaves." Hence, ',,'.,;!
in later years, altet:ations in the penal system were sought to deal with
this largely economic problem. Sellin suggests that the development of
industrial prisons in France was thes(01ution.
In the. United States t the crucial link between labor markets and
tJ\~ penal system appears to pe race. The ,failures in the :Labor market--

o " 0
C'
CJ
f,'. :-',-~:"' .. ..:'~ .. >.:..::~., :::::.';::~J.7;,::::,';#G,.-:,'~",_."",~ - --,. - -,,,- _"T_".c-.~_-._,~·-"~'-"-~"'_""=-_' __ ~ .. ~~~~_-. ... _:_.' '~-".-'-".-7'"".$.""" __ "_"""'r-""""""4"~_"""-""' __ .~. ____ ~,_ '"'-. .... -.. -... ---,,~-~~. . .. _,
,<)
jJ
2
the poor, black, disadvantaged workers--are also the failures of the q
system of justice. Blacks .have tower wages, higher unemployment, and G'
fewer marketable skills; they are m~~e often arrested, mor,~ li~lyto be .,
convicted, and then go"' to prison for longer periods than whites7; they
are clearly disproportionately represented in prisons and jails. Sellin
.contends tha.-t this is no accident; it is a legacy of racism and slavery.
The story goes something like this (~ellin ,1976). In the earl'&
years of the nati?n, penitentiaries were designed to house criminals
o
frC?,m the master class. Slaves were punished through beatinga or execut"ion. o
Free black criminals Were sold as. slaves or deported. There was, hqwever,
a significant push to make the penitentiaries occupied,by the master-class " .
criminals self-supporting, since the costs of imprisortment represented a
heavy burden on taxpayers. Why not make the prison turn a profit? In
Kentucky this was tried during the early nineteenth century, and the
convict-lease system. was born. In this system, a profit was made by
hiring out the convicts. Attempt~ngto fight the high prices of Northern
manufacturers and to train machine operators, other S01.lthern states,
including~ouisiana, invited private firms to set up shop in the prispns. c
FollOwing the Civii .War, however, both prison industries and convict-lease
systems faced a major~hallenge in the South. Would these systems apply
to the newly emancipated blacks ? .. Would the master class and the fo:pner
slaves be fprced to wo;rk side-by-side? The answer was simple. Since the
economy was shattered and ~;there was a;rapidoutflow of labo:rfrom tlJe
agricultural sector--whereblacks allegedly 'held' a comparative advantage-
prisons could be used effectively as a means of continuing slavery. With
" ....
. q I
.II
"'.~,
.. '. ';,;
a
.-'---------. ---.
3
a system of penal servitude, private slavery would be replaced with
public slavery. In part, the ThirteenthAmendm~nt to the u.S. Consti-
tution explicitly authorized "involtmtary servitude" as punishm=nt for
illegal activities. Southern le~islatures rushed to enact legislation
and to revise their penal codes, with an almost tmbelievably rapid result:
Within a decade after the Civil War, prison populations in the South
shifted from being virtually .all white to being disproportionatelyLblack.
And, so the story goes, ~his is how prisons have become what they are
today in America.
The federal prison system serves a somewhat different constituency
than. do state penitentiaries. Imprisonment is a sanction in numerous o
sections of u.S. codes, including those relating to ,income tax evasion,
selective-service violations, and interference with federally protected
activities (e.g., civil rights viOlations). With the exception of punish
ment of residents. of the District of Columbia, Indian reservations, and
u.S. territories, the arm of the federal cl:'imimal law rarely extends
to common street crimes. Most forms of robbery, burglary, larcency, auto , "
theft, assault, rape, ~d homicide are prosecuted at the state or local
level, e'Venthough they are prosecuted nationwi¢l.e at the federal level.
In addition, the origins of the federal prisQn system lay principally
.in the North, tlie cal'italist mecca that the Soutnem states were competing (}
'Z:~ith when th~y devised the con'Vict-leasesyst~. and prison industr.ies .•
In some respects, then,it is less obvious as to how the racial disparities
in the federal cr;.:tJdnal justice system are :rooted in the s.ama legacy of ,L •• :~:t..) 1:'(
slavery arid l:'acism detailed by Sellin. We can easily identify the disparities, (.,
..... .,

'9
,. \ ;
~1 ,;
o . ' t f'
+ ---..
l)
of course. In this paper !demonstrate that specific back.gro~d charac
teristics. of blacks and whites differ and that there are ~ignificant
differences in how they are treated within the federal prison system. ,'. 0"
There are also noticeable differences in post-prison, outcomes. . 0
The i~portant question for public ~olicy is, How are these disparities
linked? Can the differ.ences between black and white rearrest rates be
accounted fot by diverging personal characteristics, criminal history,
type of ,offense committed, or othe.r background variables? Or is the Q
black-white rec~divismcgap due'to racially ,~eterlldned di~fe:rences in
freatment? These questions require an explicit examination of the sources
of the racial gap ~n~rime.
Although Sellin never claims that the cause of the raci~l gap in
crime is the legacy of slavery or racism, it is fair to conclude that
~nly eliminating dispar:i"ties in tre'lltment in the criIninal justice,system
will not be. sufficient to reduce crime. c By arguirlg that the disparities
'have evolved out of labhr market phenomena, Sellin i~'plicitly rejecss the.
notion that :merely tampering withothe inequities in courts and prisons
will solve the probl~ofracial differences in crime. To accomplish l,l,
o '.'
that objective would take somethingmore,...-it would.include, among other \),
things, alternating how bla.cks and whites are treated in the economy or,
specifically, in labor 1Ilarkets." o
It is useful, when not'~conduct,ing a full-scale historicaf analysis, "
to state one's'hypothesisin the starkeh fQrm and to test it 1,lSing an D
empirically refutablemQ~el.
follows: \)
The hypothesis, stated starklyc~ is as 01"
o
~ "1'~'-' -~.,..- --~.~. , .....
5
Eliminating racism in the criminal justice system will not eliminate. racial differences in post-prison rearrest rates.
By "racism" we will mean racial differences in treatment of otherwise
comparab+.e individuals. The criminal justice system to which we refer
is restricted, by data limitations,. to the courts, pri,sons, and parole
boards. We measure "crime" by' rearrest upon release from pri~on. The"
model chosen .to test the hypothesis is an economic model of crime. It , '.'
permits the testing of "equal treatment" hypotheses, using standard
econometric techniques. We first describe the sample; we present the model;
we then perform our test.
(,'
THE DATA
A random sample was drawn of all persons released from federal
prisons by parole, mandatory release, or expiration of sentence during
1972. The sample, consisting of 2,495 observations., was restricted to
federal prisoners with. maximum sentences of more than one r,earand one, o
day who were released to the comiilunity as opposed to other legal authorities. c,
For"each sample case, informad.o~ on personal characteristics, previous
employment, cr;i.niinal-justice~system characteristics, . criminal history,
and offense characte.ristics was compiled by researchers at theU. S.
Board of Parole. Follow-up info~tion was obtained for one year after
releas~ from prison concerning whether 'the individual had been rearrested
or whether a warrant for parole or ~andatory release violation had been
issued. NearlY' one-third of the subjects failed in the first yearo to.
remain free of· arrest or of parole or mandatory release viol at ions.,. This jP
mi

,;f
f
I !
6
percentage corresponds roughly to the first' year's performance of a
siJllilar data set reported by Hoffman and Meierho~fer (1979). Although
. in subsequent years additonal subjects fail, the at-risk population for
computing the first-failure (Le., first time to fail) rate is declining.
Hence, so Hoffman and Meierhoeferhave found, ;~the recidivism r~te declines
asymptot,ically when calculated for at-risk populations. After s~ years, c' ~
however, the rates, for different risk groups tend to converge. What
this means '" of course, is that any significant differences in) recidivism
obserVed for' differing groups of ex-offenders one ,rear after· releas.e may
appear less significant in later years.
°In Table 1, characteristics of the United States prison samp1.e are
summarized. These federal ex-offenders are somewhat older than,many
recently .released prisoners fr~m state ap.d locar. prisons. Both \..hi tes ; ~:~~)
and blacks are about 30 years old. The one-quarter t"epresentation "of
()
blacks :f:n the:' sample is decidedly lower th~it isin'the disproportionately \l
bfack prison population in the Ullit~~ States. Educational attainment at . ,
almost 10 years is slightly highe~,ihan that for inmates generally, but
still lower than the national average. Blacks, though, had a mean school
complet.ion rate closer to the average for all inmates in state correctional
institutions.
Employment characteristics are measured in a number of ways, as
defined in the table. "Employed1ll,0re "than 4 years" is a dummy variable
equal to zero if the longest Job held was of ; duration of le~s than '2"::'
four years.. "Longest Job" equals the len~th,:tn years, of the longest
. job he~d if and only if, the longest job lasted less than four years.
''Last eivilian. experience" de1lotes whether the subject wasemployedo
.'J
."
G
---------~~-------~~.~,--------------------------~----------------~----------------------------------------------~------
\ \,
ii"
"
o
Tllble 1
Do!scril'tio\t or the F,~dl!r:ll Prlsonsyatl!lII
~'oth IIncl!Ulb Blad~b 'Whitub
Allitacesa (H-~127) (N-546) (N-lS81) Variabl ..
Paraonal Chara~.ri.tics (H-2224) qe '(in IIOnths) ~ (in yean) IIhek l'elllal. Grade Claimed Married Alcoholic No Drug Use Pxevioualy in Mental Hospital IQ (score) No Drug or Drink Us~
Employment (N-1557)
bployed More than 4 Yearsc " Longest Job if Lesa than 4.Years Last CiVilian Experieneec ~ On-the-Job Training
Criminal Justice System (N-2495)
Hew- Commitment Paxole Violator Maximum Custody" CIos"; Custody Hadiua Cu$tody 0
Hf.nimu1ll. Custlldy 'Work Ilelease Parole Nearings (number) Re1ease'on Parole
Criminal History (N-248B)
Free 'Less thilO 6 ,Months
(in yearlS)
c:
Free More' than 6 Months ,Less than 36 Months Prior Co~tmentd Ptior lnearcerations Parole Revoked lncarc"rations/Convictions
• Ag" at .First Commitment (in YeII.rs)
361.850
.254
.049 9.533
.267
.367
.000
.OB7 103.010
1.316 .789 .316
.822
.127'
.001
.105
.174
.323
.195 1.733
.352 .355 .902
2 •. 550 .407 .368
22.330
30.541
.051 9.452
.264
.091
.828
.121
-
1.762 .464
22.136 .'
30.915
.086 9.036
.214
.036
.855
.104
~.529 .358
21.751 24.(i~
30.412
.039 9.595
.281
.110
.819
.12
,01.84 .50
22.16 ;!3.74 T1ili! SlOr'Ji!d(ift lWm;lili} . '
Previous Convictions (number) 2:\.992
5.836 5.971 6:624 5.74 ':' .200 .,.. ~caPed
Prison P~ishment Commitment I Convictions' First Offender
.288 .297 .285 .• 30
Offense (H .. 2497)
Robhery. Theft. Burelary Sex OIfertae Other Vi~l'ent: ~ Al.c:..<lhol .. 0rllrug ~use l~,"$thatl~?(IO,;" $500 to $S.OOO " Ovii $5,000 . t.lhlte Colln(forgery, counterfeiting, Or fraud)
.Soutce; It;:;·. BOl'rd of Pllr()lo llesenc;h Onit.
c.
-"-<) .130 .1()2,
D /)
.503 .544
.008
.019
.217
.237
.101 .• 059 ",061
.228
):otc: Unlllcc ot'!lIlr\lioo opecified, t1suro8 nrc. proportiona v.ithin D:1llplo;
aL1st~1sc deletion of mi •• ~gv41u~s.
. :141. .12 .075 .11
0·483 .50
q;
.027 .0
.258 .2
1!ElIeludcs selective service Md lmmillrl,ltiori DIld Natu(alization Sernl:e vi.o;tators. Alllo excludes. races other tban b11lc;k.. or" white. Listw1se ddetion OJ; miss in,; vclues.
~ . .' j b C~oyed llIore than 4 years is 4 dummy variaQle e<lual t() 0 if lonccst . 0 hd" wa. J,clIsth:m four years. tolst civUi:ln elCpcrlllnce denotcs whctherenlp~yed IIIOre th:ln: 257: of t~Q"in last two yea'l'D preccd~nl:l iml'riRonrnent. '
"Cotnmlrrn(lOtl! ne court- orDers to I'rillon, whiCh c:,,~.' besusl'enddd. lnrmrccrO'ltion "ill cceulll imprillol\r.lentl ,cm) o.ccur !!lOre Lhon once (or .tll<' S:1Il1ll offense; jailed; oUt Oll
b~Ll; rcjalled for hllllri'on; '('leaf-cd: fo.und /lull':)': CQIr.mLt~l'd to I'rls(ln.
:(1
'0

I ! . I
"~I i I
"
\\
,', !::'=:::-~t:~~:".::::;~=~.:.~_v.~ ___ ,",_""""""""",,,,,,,,,,,,,,, __ ,, __ ,,,,,,_""';'~, ___ .. ,.~= ___ '_~t\"""""';'-~"""''''-''';''''''.~-'-~
0,
8,.
more than 25 percent of the time ~ the last two years 'before impris,?n-o
ment: .As can be seen, only a minority of the ~eleases had" ever =.,.) ,,'i.'
wqrked for more than four years at a stretch. The average employment for
the rest was only about l6,months. Almost a quarter of the sample had
not worked more" ,than 25 percent' of the time i~ the tW? years preceding @'
impri,Eion~nt. These employment measures are allextrelliely correlated." 1"
We concentrate on th~ "~plo~nt-more-thBn-4-yearsll variable in our
analysis.
The criminal justice system, criminal history variables, ~d offense
characteristics displayed in the first column of Table 1 refer to the
entire sample of nearly 2,500 cases. In much of ,\the analysis that follows,
the sample is re~tricted ,to about 2,,100 cases of blacks and whites who were
not violators of either the seLective service Or ,the 'Immigration and
Naturallzation Seryice (INS) laws. P Moreover, few, of the :many criminal o
justice system variable~had,strong independent influences on recidivism.
We therefore highlight here only those.Nariables included in our subsequent I'
analysis.
The average number'" of parol:e hearings was nearly one and three
quarterS, although ~,he average for blacks was lower, than that figure .•
While half Of the white sample" was released on parole, only a little
more thana third of blacks were. Receiving fewer: parole hearings and ; , ''''' o
being. less likely to be released on Jilarole would beunde.;t'standable for
; blacks if they served shorte;sentences. let J time serveci::"-a :measure , '"
~ &
of the severity of,punishment--was 01" average a month longer for "blacks
than for whites. In addition, blacks are somewhat youngerClt their
G
t
I I 1
I
t , ! !
" t I
~ i J [ ,
f
'Q
IJ .'.~.
(J
9 o
first imprisonment, are less likely to be first offenders, and are less "
l,ikely to have received punishment while incarcerated than~ are whites.
The average number of previous convictions is nearly six. This
mean is slightly large.r for blacks ,as is the ratio o~. prison commitments
to 'Convictions, a measure of the certainty of punishment. The type of \,.'
(,
offense committed differs forwhit,es and blacks also. In the entire
sample, about half of the cases relate to robbery, burglary, larceny,
and auto theft. By eliminating selective service or immigration violations,
this fraction rises. Yet blacks are less likely to have been committed
for these "serious" formS of theft than whites. Indeed, the proportion " f\"
of blacks whose offenses were the white-collar crimes of forgery, Gounter-o
feiting, and fraud (which includes income tax evasion) is higher than that
for whites. Nonetheless, the haul was usually smaller: blacks were CD
less likely to have netted over $5,000 in the alleged crime than ~hites.
In swmnary; then, the federal prison-release samp~e differs markedly, ~\ .
by inspectio~, front the typical state prisonpopula,tion. Moreover, there f,'; i,
c' are distinct differences between the black and the white ex-offenders, both
in backgroundchara!!terastics and in treatment within the criminal justice
syst~ (s~e U.S. Depar·tment of Justice, 1979)~)
o
, THE MODEL Q
i)
A full'discus~ion of the specification and estimation of the
r~cic:rivism model is giv'en in Myers (1980). Here, we can briefly describe 'r
the model ofcri~ used. Participation in crime can be viewed as a \:",)
.,'
<;:onsequence of economic "chpices honstrainedby opporttin;ities and 50cio-"' . ()o ~ , _ . •
. ,
~: environmentalfactprs. As the attractive.ness .of illegitimate activities
,/ v.
o·

."'.-'----~-........ -, f ~:ft:"::'.:, :;', . _ '_ .. " ..... __ .. '::..'_':.-""" .. '="""""'"'_~~ __ ~. ____ .~ _____ ~ __ ,. ___ ~ ______ ~_.~ ___ ,~~ ••. __ .=-=~~""'_."
: " 0, '.' i~ \11 r;? . ,.' 10 . ! ~! 9-, ~_ '.
\i increases--e.g., crime payoffs C~.ise, or the certainty and severity of ';!
punishment fallSt$ome pe~Ple "Wil/"~tig~ge' in :more crime. As the attract'1ve-Dj 1
ness of legitimate activities increases--e.g., wages rise or unemployment. i fall~-s~me peopie w;ii'~engage .~ less crime. The theoretical foundations I for this econOmic. :model of crime have been laid by Becker (1968), Ehrlich
(1973), and Block and lIeineke ,_(1975). However ,the precise effects on # 'if !-"". '\) ~ It
crime of :i:mproved legit,.imate opportunities or heightened retu:t:ns to crime
cannot be asc~rtainedby theory alone. Nonetheless, in empiricaf appli.-
cations, :measures of the returns to crime and work, along with l.pdicat()rs
of' sociopsychological factors and ge;neral background characteristics, have
)) been employed in attempts to ,~~edict the. "supply of crimes. ,. . (See Gillespie,
1918 , or Witte, 1979, for a. review of the economic specificad.on~, of the
$upply ()f crime f$ictioriQ~ j, , .... ~ ~
.. (3p/axi ) of a Idgi~'t:i:c ,z:e~:tdivism :fun~tionare displayed.T.he genera~ ~~.\,,~:' :::';-::~:'I: :.'\,-;.,;;~"
findings can be convenientljT. summa.ri:~ed. Olderex-off.ende:r:s, females, :: , :, . "". '~")}~" .~:, ':' "~."-~ ~ t" .. "
andmarrie~tpersons' are>less likE!ry:<~ob\~' ~eCcidivi~ts~ (me~ing,here to be 0
','. "). " . '.:. > .--,,~., >'. ,> .' . """ ,~
rearrested ~r t;o "10late parole ol;"~~~ato1:Y' rele~e l'r~visio)ls) • ".Blacks ,
those with ~eter year~,Of schOOliig;' ,a.r;.~' f'hose whooihave been confined to '\ ", ..
mentalllospitals~re mo,fK~!J.~lY to be ~~cidi~~~tS.'· ,A mO.re stable pr~-" -: :'1 ','
pris'&n elnPloymen~"his;oi:y:is'&eReJ!allY associated' \ti£li~l i';:Wer post-," , " "¥' -& .' ."'. ',~ , ~ .~ I;,~
~. t ~ pris()n fe~idivist rate, while 'ialcohol or drug use is associated with
' ~ .~. ~.
high~;recidivist ral:e$.' More extensive criminal records and l:e~s time (1
between incarcerations are positivel~related to recidivism. There is ..-:. _ .~1< .. ":.', , . . "'
; ,,~-,:f<,
litt~e val;":1;~f:ion .ill the. e,f£ec:ts of type of Cl;"ime on rec1diV'is1ll: all 'J'-" '. ',' ,~... '.
v u\, , ., _' .. ,.. ..... '" ,\ ..
, -
\;
. , :j .. , . . ~
J ~f rl '. d .
_ iL __ JJ
C'
Table 2
Max:l.~UIIl I.i1tal1hoodEatimat •• of the Probability of Recidivism in First Post-Prison Year (t-stat1sUcs in pa~ntbeses)
Independent Variable.
Female
Grade Cla:1med
Han;iecl
No Use of Drug or Drink
Previously 1D Kental Bospital
No. of Parole Hearings
Prison Punishment
!eleaae on Parole
P,.obbery, Tbeft, Burglary
White COllar Offense
Offense Value Greater tban$5000
First Offender
Ale at First COmmitment
.. B.
-.0.33 (~3.868)
-.385 (-1.553)
-.026 (-1.130)
-.350 (-2.923)
-.336 (-2~648)
.493 (3.082)
.109 (~.204)
.,398 (3.SS9)
.010 (.090)
.148 (1.120)
.018 (.117)
-.615 (-2.141)
-.312 ( .. 1.260)
.001 ('.133)
Employe~Mare than 4 Years -.356 c~.:~.? • (-1.728)
Time Se~ec.t
Commitment/Convictions
Q)nvi~.t1ons
-.005 (";1.814)
\) 1~844 (S.607)
" .062 (4.700)
COnstant -.045
Weighted Mean of .328 Dependent·Variable
, Predicted .l:'ro~\Uityat.304 weis.bted Me. ans of f~de~dentVariables ~
, Chi-Sq~are 218.061 ~.' ..
Both
-.007
-.081
-.004
· ... 074
-.071
.104 "
.023
.084
.002
.031
.004
-.130
.0003
-.075
-.001
.390
-.027 ( .. 2.684)
-.360 (-1.044)
White.
-.02~ '(-.!lS61
-.314 (-2.752)
-.375 .(-2.568)
.480 (2.712)
.106 (1.850)
.437 (.3.313)
-.016 (-.118)
.105 (.673)
-.096 (-.491)
-.688 (-2.071)
_.311 (.1.~60)
. all (.965)
-.264 (-1. lOS)
-.004 (-1.279)
1.S46 (3.94$)
.086 (5.242)
.S3S
.318
.293
in.010
Source~~ta from' U.S. :Soarti of .Parole ResE!.areb Unit • },'I Y
-.005
-.074
"".OQ4
-.079-
-.0'1'1
.09.9,
.022
.090.
-.Q03
.021
-.020
-.142
-.065
.002
-.OS4
-.0009
.320
c,
.018
'--
-.OS9 (;-3.289.)
Blacks
-.508 (-1.361)
-.038 (-.9,52).
-.245 (-1.003)
-.424 (-1.S53)
1.162 (2.371)
.127 0. .. 185)
.293 (1.324)
.170 C.716)
.082 (,309)
.049-(.163)
-.387 (-.592)
-.17Q (-.386).
-.043 (-1.918)
-.S44 (-1.217)
-.008 (-1.217)
2.615 (4.129)
.015 (.633)
2.219
.3S7
.321
86.285
-.013
-.008
-.053
-.092
.253
.027
.064
.037
,.018
.010
-.084
-.037
-.009
-.187
-.001 .
.• 570
.003
.-",.
if
I j

, '
I
12
categories have higher recidivism rates relative to the omitted category
of "other offenses. II H,owever, ex-offenders who net over $5, 000 are less
likely to be recidivists: either they ~re ad~Pt in avoiding rearrest, or
they turn to more leg'itimate activities. On the other hand, those who were
punished while in prison,or who appeared more fria!quently before the parole
boards, were more likely to fail, in the sense'of recidivism. Finally,
despite claims that paroled offenders represent ,a biase1i sc;mple of prison
releases, when controlling for other factors, release on 0 parole has no
significant effect on recidivism.
Table 2 alsorev~als that blacks are more prone to recidivi.sm than
whites: 35.7 percent of blacks ,became "recidivists after'Telease from (J
f.ederal prison, whil,e only 31.8 percent of whites do so. When one controls
for any number of seemingly exogenous factors, the. percentages become
32.1 and 29.3 for blacks and whites, respectively (Table 2, second row
from bottom) • This "of course, represents a small narrowing of the gap
in recidivism, but not:;, one of a magnitude to justify further exclUsion
of racislJl." or racial discrimination as a cause of the gap. But if the cause
is racism, 0 then what form of raci~.~ Where is t;his elusive demon? In the
courts ,on the juries, in the prison cells, in the police, stations, on 6>
the streets, in 'the workplace?
A CONCEPTUAL TEST
To illuJ;t3='ate one ~thod Qf addressing these, questions"let "!~ us
examine racial differenc&!j~n the severity .ofpunishment • When released 8 ,.
" - II.' ! !
\
;,0
;,r~-.' , "
from prison, blacks are found to have.served longer sentences than whites.
In addition, blacks are more likely to be rearrested or violate parole .)
than whites. It might be contended that the differing rearrest and parole-
:~ \ \
violation rates follow from the dif;erences in punishment. Are the observed
differences in time served by blacks and whites due to differences in their
ages,' previous criminal records, and I' the types of crime for which they c
were convicted? Or can we assert that the differences are due to some
sort of discrimination against blacks in the ,criminal justice system?
A method has been developed in the econometric literature to compute the
residual effect that race has on the outcome being 1nvest:,igated. Sometimes
called "residual, discrimination analysis," the method requires a fully
specifiedm~de1 of'how the outcome is generated, and it depends on
assumptions concerning the observability of the independent variables and
the lack of correlation between the error or stochastic disturbance t~rm
and the i.ndependent variables.
Suppose, in our example, time served is assumed.to depend on the
type of crime, characteristics of the offender, and prior criminal history
of the Qffender. Then, to isolate the effect of race on time served, one
estimates the equation:
n-1 TS ,. . I:~iai + x a +e,
i-I.' n n
o
where Xf • • • xu_l 'are n-1 independent variables ~asuring type of crime,
CharacteristicS! Qithe of.£ender, and prior criminal history, and x is a ~ . ." n
c;lWlZlllY variable equal to 1, if race is black, 0 otherwise. The aiare the
coefficients to be estimated and reflect the marginal effect on time served
CJ

'"
. 0.
::1 ~':J!:.~.:~~~:;::,,~~~~~~,-~---. ,~""""""""""'''''_~_'''''''''''''_'''_'_'r- --~~~~!
v
co
p
14
of an increase in anyone of the ind~,pendent variables .. Of course, it
is assumed that time .served is. linear in it~.arsuments and that the
error term: is normally distributed. ullder such assumptions, ordinary
least squ~res is an appropria'~emethod ofestimatlng the coefficients
The sample then is partitioned between blacks and whites·~
and the tillie.-served equation is reestimated for botn r.aces t dropping
the race variable. Bence ,we have two equations for time se~ed:
and
W n1',"'l W W W IS = t x.~. + ~ ,
1. 1. i-l
B n~l B B B TS= l: xi.~i + £ ,
i=l
where .the variables ar~ defined as before , bdt where superscl:'ipt B denotes
black and Wdenotes white. The diffet'ence between white and black time
W B 0 . served, TS - TS , would be attributable to the differences in the race-
o . '"" W B f specific errors (i.e., r~,cial discrimination), £ - £ ,alcmeonly i
c'
blacks and whites .were ·~therwiseidentical bOt:h with respect to background
characteristics (type of crime, criminal histot'Y, etc.) .an4 with respect
o
.to die effects these non~race-relatedcharacteri~tics (or at least s.o :regarde~
for purposes of this analyfilis) have on time aerY.ed.. N,ot only do blaciks
and whites have very different charact~istic;:s, but also the effects on
t.i1De served of type of ~rime and cl;'iminal history (among other variaQ!es:). . D .
,; differ betweenplacks and whites. Suppose, however,. that blacks and whites C ',1
were "tl;'eated" euctly the s~, so thatbla.cks' time served could be
computed as
_' _~ _____ ""L
I
o
'\).'
\
,. :.: ', .
r-~~---~~~~-"---~--"----" ___ . ____ ~,~ ______ ._~ ___ ===~__c~:::c:':::;:;;:;c:::::_:,
'I '
"
'.
J. •
15
if
--B are the estimated white coefficients, and TS is the predicted
time served for blacks ,if blacks and whites only differed with respect
to the x's. ,Hence, the residual discrimination is
,Conceptually riddirtgthe system of bhis discrilIlination suggest.s
B .... B replacingtn the black recidivism equation TS with TS. The question
that is arisw~redin so doing is , How much of the racial gap in recidivism
can beeltplained by di$crimination in sentencing? Of course , the same
logic can be applied to questions of differing pre-prison employment.
parole releiise, criminal hiStot'Y, and certainty of punishment.
Tables 3-6 present the results of thefitst-stage estimations r; "-
needed to obtain the racially tmbiased measures used to predict recidivism.
Separate black and white logistic .equations are estimated for
thepro"QabUity of having been employed for more than four years pr~or
to incarcer'l:ltion. As can be seen in Table 3, the effects of age, IQ, '0
and education are about the same for whites and blacks. Being female /J
has an insi$11ificant impact on p re-11ris on employment for both races .•
Being married anlinot having drinking or drug problems raises pre-prison
emplo~nt for both blacks and whites, although at di~ferent rates. Finally, o
prior mental hospital confinement . has no significant effect for blacks
butlUarkedly.lowerspre-prisonemployment for whites.
Itis easy t'o see that blacks are less likely to have had lon's:,
stableempl0YJ!1enthefore impr:tsonment t~anwhi tes • While 12.7 percent
a
(
H.
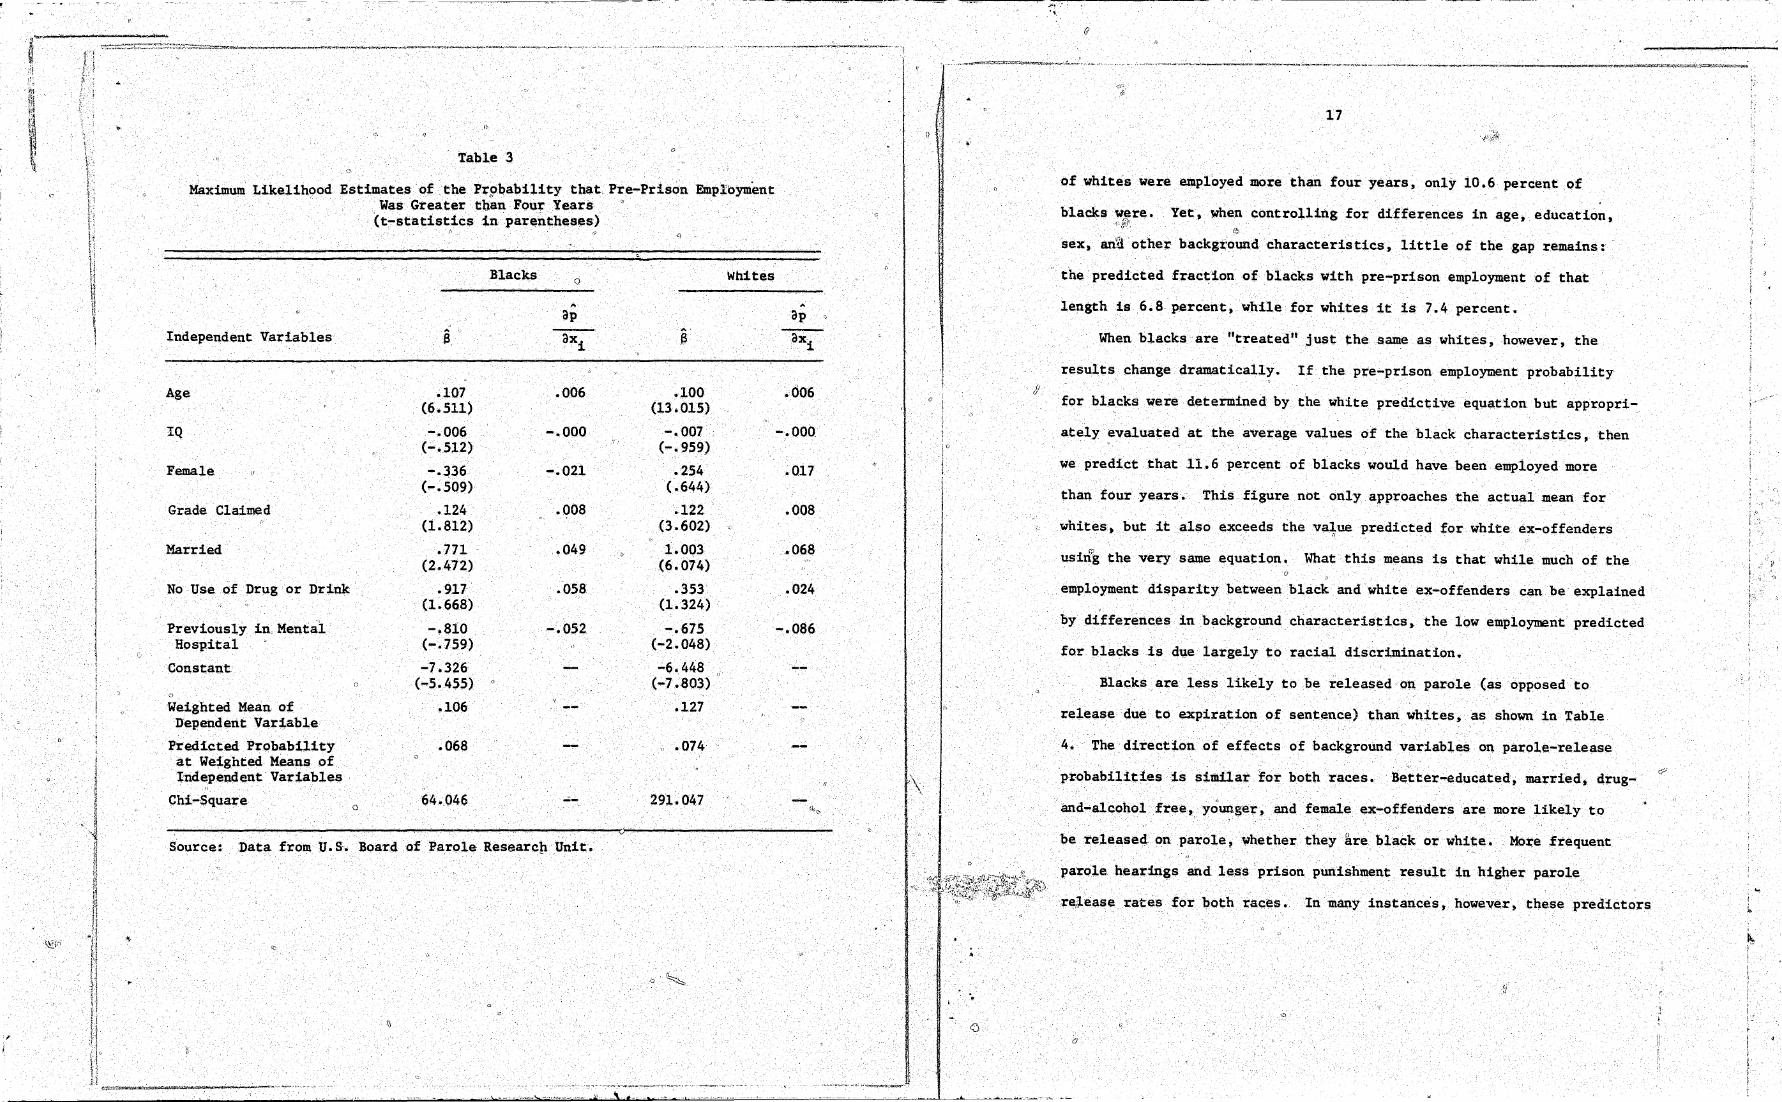
Table 3 o
'Maximum Likelihood Estimates of the Prpbability that. Pre-Prison Emplbyment Was Grea.ter than Four Years
Independent Variables
Age
IQ
Female
Grade Claimed
Married
No Use of Dr~g or Drink
Previously in,Mental Hospital
Constant
o
Weighted Mean of Dependent Variable
Predicted Probability at Weighted Means of Independent . Variables .
" Chi-Square
(l
(t-statistics in parentheses)
.107 (6.511)
-.006 (-.512)
-.336 (-.509)
.124 (1.812)
.771 (2.472)
.9~7 (1.668)
-.810 (-.759)
-7.326 (-5.455)
.106
.068
64.046
Blacks Q
.006
-.000
-.021
.008
.049
.058
·-.052
Source: :Data from U.S. Board of Parole Researcl1 Unit.
" . B,
.100 (13.015)
-.007 (-.959)
.254 (.644)
.122 .(3.602)
1.003 (6.074)
.S53 (1.324)
-.675 (-2.048)
-6.448 (-7.803)
.127
.074
291. 04.7
Whites
o
.006 o
-.000
.017
.008
.068
.024
-.086
, ~'
o
'. -.
;,.. ".
17
of whites were employed more than four years, only 10.6 percent of
blacks were. ,(.\,~
Yet, when. controlling for differences in age, education, (~~
sex, an:~ other backg~oundcharaeteristics, little of the gap remains:
the'predicted fraction. of blacks with pre-prison employment of that
length is 6.8 percent, while for whites it. is 7.4 percent.
When blacks are Utreated" just the same as whites, however, the
results change dramatically. If the pre-prison employment probability
for blacks were determined by the white predictive equation but appropri-
ately evaluated at the average values of the black characteristics, then
we predict that 11.6 percent of blacks would have been employed more
than four years. This figure not only approaches the actual mean for
whites, but it also exceeds the value predicted for white ex-offenders .,
using the very same equation. What this means is that while. much of the o
employment disparity between black and white ex-offenders can .be explained ,
by differences in background characteristics, the low employment pJ:edicted
for. blacks is due largely to racial discrimination.
Blacks are less likely to be released·on parole (as opposed to
release due to expiration of sentence) than .whites, as. shown in Table
4. The direction of effects of background variables on parole-release
probab;i.litiesis similar for both races. Better-educated, married, drug
and-alcohol free, younger,' and female ex-offenders are more likely to
bereleaseci ()n parole, whether they ~re black or white. Mo~efreq~ent .' 0
parole hearin$s and less 'prison punishment result in higher parole
rei).easeratesfor both t'aces. In many instances, however, these predictors
o
"ll
,),

·'~-;,,~\.~:::
''\) ,
-'
~~()
\3
~)
()
()
Table 4 1)
Es·timates of t' h'e Prob.ability of Release on Parole Maximum Likel:ihood (t-statistics in Parentheses)
Blacks Whites
'" 3p " ... oX
i S
Independent Variables e
-.061 -.013 -.057, Age
(-4.573) (-9.166) 0
.295 .064 " .887 Offense Value Greater
(.484) (3.650) than $5000
.125 '- .687 Female .575
(2.314) (1.615) .109
Grade Claimed .046 .010 q
(1.099) (4.957)
~495 .108 .488 u Married
(2.044) (3.766)
:207~ u
.218 .950 Q
No Use of Drug'or Drink (2.948) (1.414)
in Mental -.412 -.090 -.719 Previpusly
(-.735) (-3.727) Hospital
.N\l1D.berof: Parole Hearings. .848 .185 .~76l
(7.071) (11.976)
-.771 .Hi8 .... 823 Prison punis~ent (-6.066) (-3.218)
-.249 ~.05'4 -.658 Robbery, Theft, Burglary
(-.916) . (-4.321) .
.304 • 066 ,-.221 ~ite Collar Offense
(1.032) (-1.219) D
-.342 -1.253 Constant (-1 •. 696) (-.910)
.360 .500 Weighted Mean o~
Dependent 'Variable .502 .322 . Pred'icted:Probability
at Weighted Means of <J
Independent V:ariables x
131.557 '4oL283 Chi-Square
o
'f ". f U S Boar' d 0".£ Par. ole Research Unit. Source: Data rom • • "
" , -.-..... , .. ~,...,"".-~~~ --~-"" ..... ~~.-,- .... - "
i " I
I \
\
I "
(I
C'
,'"' oP' ax'i '
.... 014
.221
.171 6
.027
.122
.054
-.180
.190
-.205
- •. 164
.... 055
~-
----
- ..) "'-......,..,..---"_ ..... '""'e"._._""'~.~..:~~, _.~..; __ . __ . __ ~~~=--~~~=~.::-.::::::=..,~' ~-:;--~---- '---'--~'--~-'---'~9
'J
1 J I
i
j :
are statistically insignificant for blacks. For example, while having .,D
netted over $5,000 i.n the alleged crime will increase a white ex-offender '8
drances o:fbeing released on parole by lDOr.e than 22 ~rcent.;lge pOints,
it has a negligible effect on blacks. i)
Moreover, taking account of these
factors merely narrows the black-white parole release gap from (.360-
.500) to (~322-.502). If, however we predict the black probability from:
the white p{irameters, then the gap narrows to (.451-.502). Indeed, if
blacks were treated exactly like whites· in parole decision-making (but,
of course, their differing background characteristics were appropriately
accounted for), then blacks and whites would be released at nearly the
same rates.
In Tables 5 and 6~ est:tmates are provided for black and white '0
measures of the certainty and severity of punishment. The certainty
OL) punishment is computed as the ratio of previous prison commitments
to previous convictions.' It is essentiallyr'the subjective probability o
of being punished by imprisonment if convicted. This ratio is •. 049
for blacks ;;md .039 for whites. Although being a white female .means
0"Perie'!cing s:f.gnificantlYlow~r probabilities o~ punishment than being
a white male, the marginal effects of all other characteristics are
virtually zero. Hence, when thelj;e characterist'ics are accounted for, >.:;,
the punishmentproQabilitiesfor blacksandtr1hites tend to converge •
Similarly, when the black punishment probability is predicted using
the White, equation,. the estimated .value, .032, moves closer to the
actuq1 value for whites. In ~um;' blacks experience more certain p'unish
ment. th;;m whites , and a part of this can be .accounted for by racial
differences inh9'W theyaretreaeed.
( "
f' , .-~" . i

o
Table 5" "
Maximum Likelihood Est:lm&tes of the Probability of Commitment
o
{j
IlIndependent Variables
Age
IQ
Female
Grade Claimed
,Marri.ed
I)
No, Use of Drug or Drink
Previously in, Mental Hospital .
,Constant
Weighted Mean of Dependent Variable
u ' Predicted Pro~bility of Weighted Means of ,Independent Vari~?les
Chi-Sq!fare
G:1ven Conviction ' ft-statistics in parentheses)
o
.0.62 (3.169)
.0.10. (.599)
-10.4.242 (-.0.62)
-.0.62 (-.715)
-.615 (-1.0.91)
-.0.61 (-.10.6)
-222.771 (-.577)
-5,.230. (-3.0.84)
.0.49
.0.0.0
23.~81
,CO'I Blacks
.0.00
.,000.
-.0.00
-.0.00 o
-.0.00.
o
;;:'.00.0.
-.000
!I
Source: nata from U.S" Boa1:'d of Parole Research unit.
.0.792 (7 • .382)
.0.24 (1.828)
-14.387 (-5.533)
.0.43 . (-.824)
-.942 (";2.720.)
.296 (.687)
.240.
-8.198 (-5,.872)
~,
.0.39
.0.14
7Q.738
Whites
"
o
.0.0.1
.0.0.0
.211
-.013
~Q04
.0.0.3
l\~
i'I'1
ii,
, i I "
'\\'
I
''1 )
. •
D
,I
co
Table 6 "
Ordinary Least Squares Estimafion of In (Time Served) and'ln (Convictions) 6
Independent Variables :(, '
Age
(,
In (Time Served)
Whites a .008
(~ .00.)
Blacks a ' .0.0.9
(3.00)
In (Convictions)
Whi~l;s ,])
.0.16 (16.0.0.)
Bla~ks
B "
.0.29 (9.67)
, Sex 'I -.184 (,.;2.52)
= -~527
Married
No Use of tirugor Drink II
"I>
Grade Claimed
IQ
Ro bbery" Theft, Burglary '0
OffenseVa1l.1,e Greater than $5000
White Collar ;O£fense
,'y:'~
Prison Pun:1sh!!l(!nt
Paroled
Number of Parole He,arings
Constant:
~ultipleR '2
X, ,'l Adjust4d F,.2
" c
.011 ( .34):
.027 (.73)
-.010. (-1.67)'
.002 (2.,00)
-.185 «-5.0.0.)
.... 243 (,..5.40)
.0.15 (.26)
.370 (11.21)
-:331 (-lD,,68)
• .221 ' (17.0.0.)
2.356
.534
.285
.280
(5.55)
-.114-.169 'e
( -1. 84) ( ..,4 .12)
-.149 (-2.0.4)
-.0.30 (-2.73)
.0.04 (2.0.0)
-.510. (-7.61)
.098 (.62)
-.552 (-7.56)
.353 (5.98),
"
-.246 (-4.17)
-.186 (-6.64)
2.120.
.521
.271
.256 '
.... 195 (-4.15)
, _.075e
(;"10.]1)
o
n
.0.04 (4.0.0.)
, --
1.477
.367
•. 135
.• 132
,:0 [)
Source; ~ta 'from U. S. BQard of Parole Research Unit. "
.. (/
r.l.',
" ,,'
o
-.165 (.2.26)
-.097 '(-1.14)
-.039 (-3~o.o.)
-.00.1 (.50.)
1.35-5 , .4~8
.175
.165
, \ i-,
;1
" ,1 , ,

~""""",:;:.!\.;~:".,:'7::;:::::;''';;;::'A;J,.~~~'%l;<. .. __ ii4:;'''' .... __ ~ ... _~.-.-.._ .. ~--.-.•. ,--,------"-"<-.. --..,--" .. - ...... "",~,.,., .. ~.-,, "
,,-----.,,-'. -'-~-'~-'---'-'-~-"-""""-~-":'-~"I
... 0'). 22
,,\ '.1
Blacks also eJ>."Perience more' severe puniShment than wbites. 0 Recall
from Ta~le 1 eha't theaver'ige t'iJDe served by blacks was 24. 7 ~onths ,"
d 1: 2 ':1 7 nths Takin·g· a'ccount" .0., f .. pe.rsonal back,while whit es serye on Y'.:J. mo. • Ij 9\..:, l.;\
ground charac~eristics andf,~ctors related to the crime, the average time (j' .. .,. ./
served for blacks i~'preiic:ted to be 19.06 months ~f1en evaluated. at the i
., white parameters. This dramatic reduction is ,suggestive of the same
discritrlnatory process involving previouscr~na.l recprds.On average,
Q bla,cks ,in the sample had 6. ~,pr~vious corivi~~;ton~, 'while whites had only:
5.7: :'But if black convictions were generated, by t~e s~"process as
whiteconvictions--ifthey were "e:reated" t!,e same-:--tllen, apPl-,opriatelY
taking into accountblackb~ckground characteristi~s, black convi:tionSd
n ',\
would total 4.5;~ '~" '
~~
In summary ,. there are dispa.rities between black .and ,;white federal.
ex-offenders in (a) pre-prison emplo~nt,experiences, (b) method of
release from prison, (c) certain,ty and severftyof punishment, and (d)
criminal, histories. I,neve~ instance, treating blacks' lik,e whites'
narrows tne disparity. So~ of· the gap,we have s~en, can be accounted
for principally bydffferences in background chara.cteris~ic.s such' as
age, sex, and ~ducation" '!'his. was true of pre-prison employment. Q .
But
in other categories, notably release on pa1701e, the only way to construc;
any significant na,rrowit:lS of the gap is to effect an equal tt;eatment
of whites and blacks.
To extend the t'onceptu.al·~xper~menta step further, it becomes
useful, to, replace, fox: black.s the actual values for pre-P7cison,e:mployment, ~ . n ,!)
certainty and severity of punishment, criminal' history, ali'd metthod ·of ':1
o
o o
I ')
o
o ,
(.~
o
I
I
'. , ..
o - -.-" - ,.--" '"'- .... ,-""-.---"--"'~---.~. -_. -~ ... ~-~<--,-...... -.--~.-.,--........ ,~~
23
prison .release with the predicted "discrimination-free" values. Table
7 displays reestimates of the black re.cidivism functions. The odd-numbered r;1
columns list theestimafed coefficients and associated statistics. ,\ .
In the
even-numbered columns a;i:-e the partial derivations of the pZ:~,dicted probability
of recidivism~ First, :!:ncolumn "1 the black recidivism function from
'I!able2 :!sreproduced. :.t'l0te that the actual failure rate is 35.7 percent
and the predicted rate. i~ 32.1 percent. In column 3, we replace the '.-, r
actual time served withl~h~discrimination-free predicted value". Now the
" ,margi~al effect of an eXj:ra month in ,yrison is larger, but since blacks .~, .:.
serve shorter sentences jLn this racially neutral scenario, the recidivism i
rate rem;:lins the same. In column 5we insert the predicted certainty-of~
punishment ,value. More ~~ertain punishment lowers recidiyism, ~;pt racially
n~utralcertainty of punj~shment Iileansthat blacks now have lower probabilities
of being punished by impj~isQnment; hence they .aremorelikely tP'~e ~ecidivists. {\\~ It <
In column 7 blacks get tci be paroled at nearly the\'same rate as whites.
But from COlUllml we realfize that release on parole really does not affect .. .
cp :'
. recidivism substantiallyJ '. ~,
So equal opportunity in rel\~(lsefromprison .. , ..
(or,. 1Il0re accurately, af.~!il1fjAtive action in 'release from prison) does not
assure lower rearrestprpbabilities.Column 11 "qetails the effects of
reducing id.isparitiesiii'~rim ... inalh:istories. Since theeffG~t of a. previous '-' - t::)
conviction record is smal,l,' e~UaliZing this factor between blacks and 1.\
whites h~s no effect on recidivism. lloweve.r. ,eliminating the ''rac;i~l l\
disparity inpr.e-prison employment has a decidedly directe£fect on
blacks'post-prisonfail\1re rates.; The predicted recidivism probability '1~
falls ,:from.32Ito .318~. as seen in c'column 9. Although this reducUon
( "

·'''l!w; .. 10 "
& i
i,rl'';~ Q,
r
(J' ,( , ,
I ' ~
,dl
"
Independent Variables
Tiae Served,
Predicted T1ae Served
re-le
Grade Cia1aed
KIlrded
(1) ;,
8
-.059 (-3;289)
-.008 (.;1.423)
-.508 (-1.361)
-.018 (-.952)
-.245 (-1.003)
",
Table 7
Kaxiaw. Likelihood EstiauteB of Black Rceidf,v1s. and Residual D16crilllination (t-atatiaticB ,in ,parenthoses)
(2) ", ap/ax!.
-.Oll
-.001
-.111
-.oo~
-.053
Recidivba With Predicted b Tiale Served
(ll (4)
II ap/3d
-.041 -.009 (-1.987)
-.110 -.024 (-1.871)
-.786 (-1.894) 0_.043
(-1.090)
-.220 (-.900)
-,.171
-.009
-.048
RecidiViSM With Predic:ted Ratio of CO .... itlienta/ COilvictionsc
(5) (6)
a aptax:i.
-.010 -~002 (-.414)
-.004 -,001 (-.885)
-.737" (-1.890)
-.038 (-.963)
-.353 (-1.322)
-.162
-.008
-.077
Recidivifilll With Predicted Re1e8lie , d on Parole
(7) (8)
aaplaxi
-.034 -.007 (-1.079)
-.008 -.001 (-1.494)
-.811 (-1.65';)
-.Oa9 (-1.370)
,c -.479 (;"1. 38P)
-.177
-.019
-.104
Recidivism With Predicted e i!a:p10yJIIl!Rt
(9) (10)
II 3Ptaxi
-.029 -.006 (~.8U)
-.009 -.002 (-1.556)
_.444, (-l.:18B)
-.018 (;;.419)
.046 (.129)
-.096
_.004
,010
Recid1vba With Predicted f COnvictio.,.
(11) (12) . B ap/3x1
-.051 -.011 (-1.850)
-.008 -.001 (-1.411)
~.545
(-1.010)
-.048 (-.601)
-.263 (~.889)
-.119
-.010
-.051
No Use 01 Dru, or Drink
,",e -.424 -.092 -.319 ';".069 -.266 (-.987)
-.058 -.494 -.107 -.325, -.070 -.449 -.0,98
e,
,PrevloiJsly tnKental Hospital
110 .,of Parola 118a&:in,a
JIobbe~. (;/;~f~. lIurglar:iG-
2ele •• e on Farqla
PtedtctedRe1e~.a on ~Fuole
White Collar Ofran._
Of(enile Valua G~t,u than~5000 '
First Of render
.Age at Ftnt Q, .. naent
(;';1.553)
1.162 (2.371)
.127 (1.185)
, .,293 (1.324)
.062 (.309)
.170 (.716)
'::)
'.253
.027
.064
.018
.037
.049' .010 (.163)
-.387",'-.084 (-.S94)}
-.170 (";.l86)
:;
- •. 043 (-1.918)
-.037
(-1.160)
1.117 (2.395)
{\
,656 (2.068)
1.039 (2.119)
-.237 (-.687)
"1,,,
-.572 (-l.200)
, -.387 (-.917) -;435 (-.6~)
-.U6 (-.264)
Co_ltaentalCoavictlOila '2.615) (4.m)
.5702.534 (4.1)98)
P~dl~ted eo.itMnU/ ", f41wictfDna
;~.,...:.. ,.;: 1"
;; 'I ",'. "'0
l"»~-"_""'~--""_'-'''"'"'L''''''~ __ ~_'''''''''''''';''''''''~'''';' , . . .... 'fl.,
-<
,~' .,
~: r·' I'.',
.\ . ~ .. ~, .. -'
;256
.IU
.226
-.051
-.124
-,084
-.095
, ',552
(\
1.142 (2.315)
.110 (1.033)
,223 (l.021)
'.IS0 (.572)
.043 (.189)
.251
.024
.049
.033
.009
.137 .031) (~457) "
-,240 -.052 (-.379) ",.380
(-.879)
-.,068 (-3.348)
,.4.193 (-,775)
-.083
-.015
(-1.723)
1.481 (2.514)
-.203 j(-.,S32)
.648 • (1.465)
, .380 (.917)
2.385 (.974)
, .161 ,,(.499)
-.747 (-.999)
-.164 (-.374)
-.041 (-1;856)
2.576 (4.101)
l'abI. (lIlltlllua". , •
,"
, "
'0
.323
-.P44
.141
.083
.520
',035
,-.163
-.0)5
-.0011
,5fil
(-1.114)
1.020 (2.012)
.128 (1.197)
;J08 (1.384)
.095 (.356)
.180 (.756)
.221
.028
.066
.020
.039
.059 .012 ( .196)
-.359 ,~, -.078 (-.556)
-.160 (-.367)
-.~9 (-2.164)
2;5!16 (,4.035)
'c?
-.P34
.561
(-1.294)
1.191 (2.416)
.127 (1.186)
.2114 (1.3~4)
.097 (-.361)
.141 (.627.)
.26P
.027
.OM
,021
.Ol2
;072 .• 015 (.2J()
-.402, .. ,8P7"" ( ... 617)'
.... 210 (-.485)
-.047 ( ... 2.241)
2.5].9 (4.111)
.n . '
-;046
-.010
.549"
'" ;! ,.c:.; .. ;-, () " \
If j i ,
1-
,4
')
" ~"
~ , t .
a
l..'J' .
\,
.'
Q
--"'~t
Gn

()
'. r'.·
, ''0
0
~f/
(/
d
. . 1i.,.J
__ , .. ,, ____ •. ~ ~~_ •• _~,._.~,~._~" .• ~ •. _~_ , .. _,_"'. _~.'~, ,_._.~ ___ ~_",.l", .~_P __ . ,_'~ __ r~',",,_"==.=. _"'"~~~~ __ -_~ ___ ~. __ ...
~ ~
I Table 7 (~t1nued)
-'0,
Rec1divisa With Becidivf_ With RecidivisaWith Predicte.d Ratio Predicted
Recidivi.a Predicted b Tillie Served
(1) (2) (3) .. ... ,. . /I 3p/bi 11.
Convictions .015 .003 .012 (.633) ( -.496)
Predicted Convj,ctions
EmployedHQre tban 4 -0/544 ~.187 , -.569
Yelllrs(\\ D (,..1.217) ( ... 1.274) <f
Predicted EDtployalent Greater than 4 Years
2.21.9 3.118 Constantc:::c I (2.·786) 0.139)
WeightedHeanqf .' .357 .357 DependenJ Variable
PredictedProbabil1ty .321 .321 of Weighted Means of Independent Variables'
Chi-SquaTe 86.285 87.109
SaUTee:
jJ~
f[
Data fro. U.S. B~Td of Parole Researcb ",it.
a.Froll Table 2.
bpredicted values COIIIputed from Table 6.
cPrecl1cted value.eJ computed ·frOt! T,.bIe s. d . . . Predicted values cOlllputedfrom Tabl,e4.
epredictedvalues computed froll'Table 3.
fpredicted Y14lues computed fro.Tablet».
(4)
3p/3Xi
.002
-.124
of Co_itaenta/ . Releaae Conviction.c on Paroled
(5) (6) • (7) (8)
a 3p/3x! ...
" /I 3p/ax!
... 013 -.003 .012 .002 (-.S~7) (.516)
o.
-.826 -.181 .523 -.114 (-1.866) (-1.174)
1.851 -- 1.256 (2.175) <.946)
.356 .357
.326 ~~} .321
70.092 " "86.738 --
~'.~*'~ .~.,- i'~ •• Y' ." .............. ."... ... ~ .. ,,,'''' __ .<,,''.'-,,., . ."..,._, .. ,_"tf ...... ""-..... __ ..... -t __ ·"'-,,,._~~,,<<-· '''''-'''' -, ~.""., . , ' ~
.(, ".,
.-:'.'.,.:
.. -
.......
I:,
() ',!:I
.. '"
,~ (~) \'

o ..
o
,,-~,
'\
r,\ ,~
•
, 0
o
26
is lIlinor, it is seen as the only means ofnan"Qwing .the recidivism
gap'.
CONCLUSION
Other w:r:iters have alluded to the legacy of racism in the criminal
justice systeIl1 due to slavery and its aftermath. Blacks are disproportionately
represented in the penal system; they serve longer sentences;- they are
more likely to be incarcerated" rather than, put on probation; they are less
likely to. be paroled; and, .because they 'are more likely to be rearrested,
b d t is"on Ind~ed, one wri~e<r, has' they a.re more l~kely to ereturne _ 0 pr _ • _
argued that this state of affairs is int1matelylinked to labor markets:
after the Civil War, a l~ss of a whole classoof workers in Southern
agriculture mandated that the prison system--alre~dyevolv1ng as a labor:>
market lIlechanism--supply public labor when private involuntary .servitude
had been abandoned "(Sellin, 1976).
Prison populations have swelled with unskille.d blacks during the " (;}
past two decades. Has the penal systelQ been operating again asa labor
market equilibrating device? Do long prison sentences, low parole-release
rates t and high rearrest rates for blac~s act to buff.er the high under-
and unemployment rates among members of this group? These questions cannot
be answered within the c(mtext o'f this study. But other kinds of questions
can be answered. Are there racial disparities in a system like the federal o
prison .system,wh1ch .is les,~ beholden to the slavery past? Are these D
disparities linked to one.another? And, 1f they were eliminated, would
crimerateS"iall?
" .
.'
\ \
A <\
'I t·] .. ,-\~
1 '" .-i
J:
i c
j !
27
We conclude that in the federal prison system, seen through a
sample of nearly 2.l00ex-felons released in 1972', there are significant
racial disparities in treatment. And there are apparent racial differences
in post-prison outcomes. Although there are only minor differences in
pre-prison employment experiences, equalizing those experiences represents
about the only means of reducing the racial difference in recidivism.
Blacks and whites expe~~ence differing certainty and severity of punish
ment, yet equal treatment in that area will not close the gap between
whiteS and blacks in post-p.rison recidivism. Blacks and whites are treated
dif.ferently in the prisons; and blacks are decidedly less likely to be-
.releasedonparole. Yet equal treatment in those areas will not close
the gap between races in recidivism. Blacks and whites have different
criminal records; unfortunately, equalization of previous criminal
histor~,es does nothing to ·'clos~ the racial gap in rearrests. Equal
treatment in pre-prison employment, we have found, will reduce the post
prison recidivism gap, though by only a small amount. Thus we reach the
following pesSimistic conclusion: Eliminating racism or racial discrimination
'as it manifests itself inexpet'iences of offenders before or duting . -.",
imprisonment will have little impact on post-prison lapse into criminal ~ '.
behav!or.
At first,) glance this conclUsion appears inconsistent with the
progressive V!ews advanced by authors, likeiiSellin,. of work.s on prison
. reform. If eliminating racisIn will not reduce crime,· why bother to
tamper with the vestiges of t.he past? But: our results suggest anc~~her
interpretation. Whileelilninating ~acial discrimination in·the courts

o
1 I
I f I
.. 28 "n"
o
and prisons may not reduce the racial gap in crime, neither will it ,
widen the gap. The longer prison sentences, the higher parole denial
rates, and the higher prison commitment ;rat;es for blacks--all amount
to harsher treatment to no avail. In the economist's jargon, this. sort .\
of equilibrium is "Pareto-inefficient." The inefficiency comes about
because theadd~\d public expenditures for incarcerating blacks 1IlOre (J
frequently and for periods of greater duration relative to whit.es arEt
not matched by .offsetting benefi,ts. Black crime rates do not fall
appreciably, at leastamong;released felons. And so there is no apparent :?-
gain by meting out more severe punishment to t~em relative to truly
comparable white offenders. Hence ,the moralistic cry that. the unequal Q
treatment of blacks and wh~tes in the criminal justice system :isun~air
is not hear4 alone; the unequal treatment is clearly and unambiguously
inefficient.
. 0
.0
Q
n
~
a
I.
I I
\ \.
1
o
,=
.. ~',~
•
o 29
REFERENCES
Becker, G. S. 1968. "Crime and punishment: An economic approach."
Journal of Political EconolllY 76: 169-217 •
B10ck,M. K.., and Heineke ,.1. M. 1975. "A labor theoretic analysis
of the criminal choice. n American Ecqnomic Review 65: 314-325.
Ehrlich, 1. 1973. "Participation in illegitimate activities: A
theoretical and empirical investigation." journal of Political
Economy 81: 521-567.
Gillespie, R. 1978. "Economic factors in crime and delinquency: A
critical review of the empirical. evidence." Reproduced in' U.S.
Congress, House of Representatives J Unemployment and Crime: Hearings
before the Subcommittee on Crime of the Committee on the Judiciary,
95th Cong., 1st and 2nd sess. W hi t D C as ng on, •• : U. S. Government
Printing Office. iJ~~ C> '~';i"Hoffman, P. ,an<l,Meierhoefer, B. 1979. "Post-release "arrest experiences
of federal prisone;rs: A six-year follow-up." JourAal, of Criminal
Justice 7 (3): 193-216.
Myers,S. t.,Jr. 1980 ;'Emplo~ent Opportunities and Crime. Washingtgn, '0
D.C •. : National Criminal JusticeRe~erence. Service.
Sellin ,T. 1976. Slavery and the Penal System. New York : Elsevier •
Witte ,A. "D. 1979. "Unemployment and cri~ : Insights f;rom research on
indiyiduals. I' Statement Prepared fol:." the Hearing of . the Joint
Economi.c Col!lDlittee on' the. So' cial Costs f' U 1 o· . nemp oyment, U.S. COngress J
October. l1ilueo.
Jii,
II~

*
.0
30, "
U •. s. Depart1ll.entof Justice. 1979. fro file of 0 .state Prison Inmates. .' {,
National Prisoner Statistics Special Report SD-NPS-SR-4. Washington,
D."C'. : U.S. Department of Justice.
(!
j o
! ()
j
·~~·I \-
1
I D
\
\ , -0;
.,
~:
II
:;:;-
C;!
" "_ .... ...,.- •• ~ •• _>< ) •• ,:~ -.~~·-,tr-;-:::-:.c:~:!;:"", .. .l~i ...... ~
,i

o
•. ~~
\ 1 r
o
o
"'" I,
-:-", .-
I
=-~
c
0
.~ ~ ..
r:!' -t·
0
,
"
':! ... ,!;\., •
Q
..
,0
'~'~.
'.
;.,r ....... ~ ,
" .... ;;;;~;~;::;-;~:;.~~,~' :l,.-.· ;;...:-.. .~:;.::;.;:.:::::;=~=;:;;;:==:; .. ::~:r.,.~~-:~.~~~~~.t.~ .. ; .. ' .. ;:..~~.~~~~~"~,
I I ·t·· , .~
.t
II
: "~I ..
1
l :f .) S. f
~
;~~z=-_-=-~...;:.:.~-...... :~-~"'-~-::==-~-.-.~_-:~~;:~~ .... - .... ---.= .. ,.., '! ,~ . ~ (;
:1 ; ~
·r
V._'~
"~~-:''''''',-,--*-,-,.,.--.-""..~ ........ ,~.-:.~ .. ,.-~1
C ;:'
o.
"
. ,