institute for transport studies faculty of environment competition between cities – a toll setting...
TRANSCRIPT

Institute for Transport StudiesFACULTY OF ENVIRONMENT
Competition between cities – a toll setting game with experimental results
Dr Chandra BalijepalliInstitute for Transport StudiesUniversity of Leeds UK
October 2015

Introduction
• Recent changes to policy in the UK led to forming regional partnerships e.g. Leeds City Region. Local authorities have been given more power to decide in return for an increase in economic growth.
• However, we know that cities do compete with each other.
• Two main questions arise:
• (i) how might the cities react to regional collaborations, whether to compete or to cooperate; and
• (ii) whether sharing of critical information such as welfare to residents will have any influence on decision making processes

In this paper…
• We model the competition between cities as a game to maximise the own welfare by a demand management strategy viz., cordon tolls
• A land use transport model of two cities has been developed which includes interactions between residents and businesses to locate themselves
• Residents have a choice of mode e.g. car, public transport - bus, rail, walking & cycling
• We innovate on ‘Small Models’ besides integrating the simulation of land use interactions with a classroom style experimental game

Previous research
• Generally use a static network assignment model of one city
• Includes private traffic with demand response and route choice included
• Looked at the twin city problem under various regimes – global regulation versus game with/without collusion
• Koh, A., Shepherd, S.P. and Watling, D.P. (2012) Competition between Cities: An Exploration of Response Surfaces and Possibilities for Collusion, Transportmetrica
…thus,
• In this research a dynamic model of two cities with land use responses + multimodal choices has been developed
Some definitions…
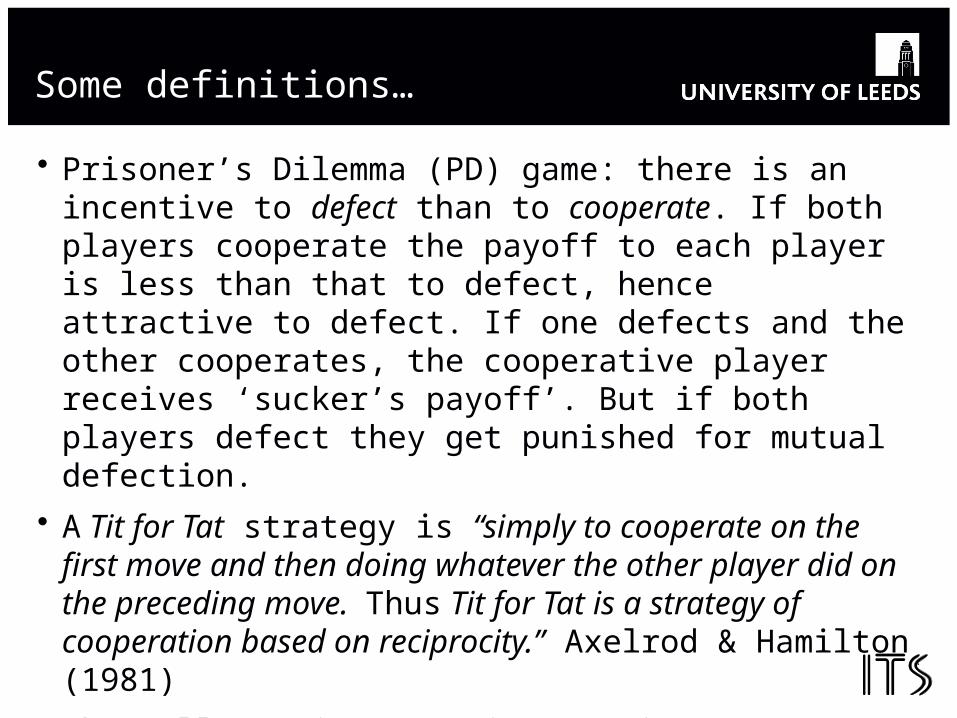
• Prisoner’s Dilemma (PD) game: there is an incentive to defect than to cooperate. If both players cooperate the payoff to each player is less than that to defect, hence attractive to defect. If one defects and the other cooperates, the cooperative player receives ‘sucker’s payoff’. But if both players defect they get punished for mutual defection.
• A Tit for Tat strategy is “simply to cooperate on the first move and then doing whatever the other player did on the preceding move. Thus Tit for Tat is a strategy of cooperation based on reciprocity.” Axelrod & Hamilton (1981)
• The toll setting game in MARS is a continuous repeated PD game
What is MARS model?
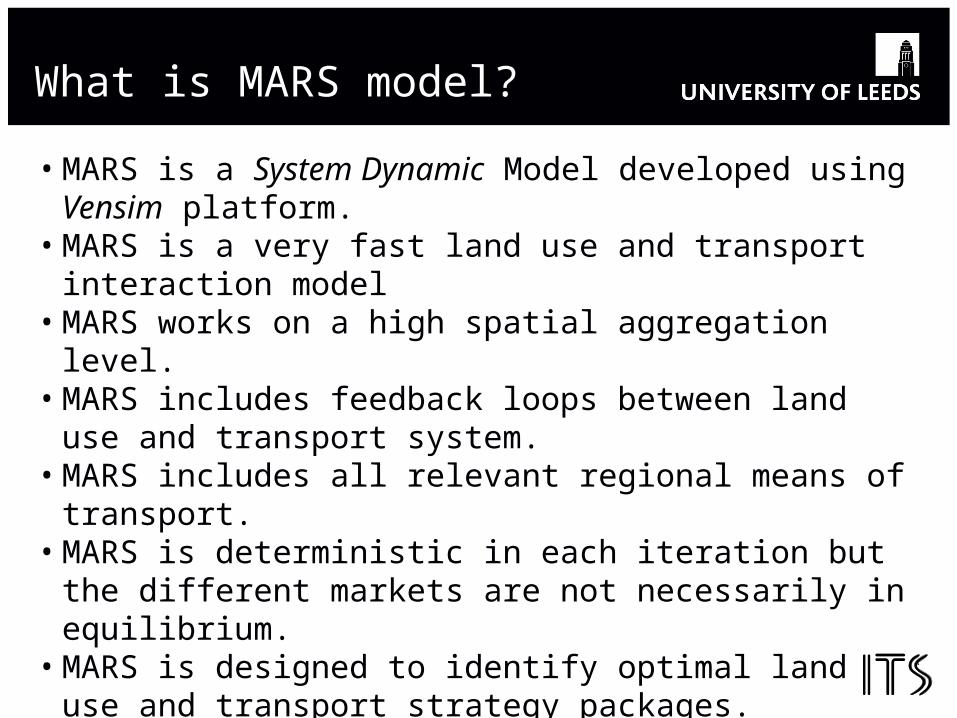
• MARS is a System Dynamic Model developed using Vensim platform.
• MARS is a very fast land use and transport interaction model
• MARS works on a high spatial aggregation level.• MARS includes feedback loops between land use and
transport system.• MARS includes all relevant regional means of transport.• MARS is deterministic in each iteration but the different
markets are not necessarily in equilibrium.• MARS is designed to identify optimal land use and transport
strategy packages.

Major cause effect relations
• Pfaffenbichler, P., Emberger, G. and Shepherd, S.P. (2010): A system dynamics approach to land use transport interaction modelling: the strategic model MARS and its application. System Dynamics Review vol 26, No 3 (July–September 2010): 262–282
Transport sub-model
Land use residential location sub-model
Land use workplace location sub-model
Rent, Land price, Available land
Accessibility
Spatial distribution residents Spatial distribution
workplaces

Leeds model 33 Wards

Used an aggregate version of MARS based on Leeds
Extended to two cities of same size similar to Leeds.Used similar welfare measure as for static case – and applied tollsto enter zones 1 and 3
As MARS models a long period, tolls were defined in a starting year which remained flat until the end year 2030
4
3
2
1
City BCity A
Region2-zone model
33-zone model
Zone1 (1-13 of 33 zones) 342879 343384
Zone2 (14-33 of 33 zones) 621780 621801
Total 964659 965185
Population of Leeds in 2030
Welfare measure
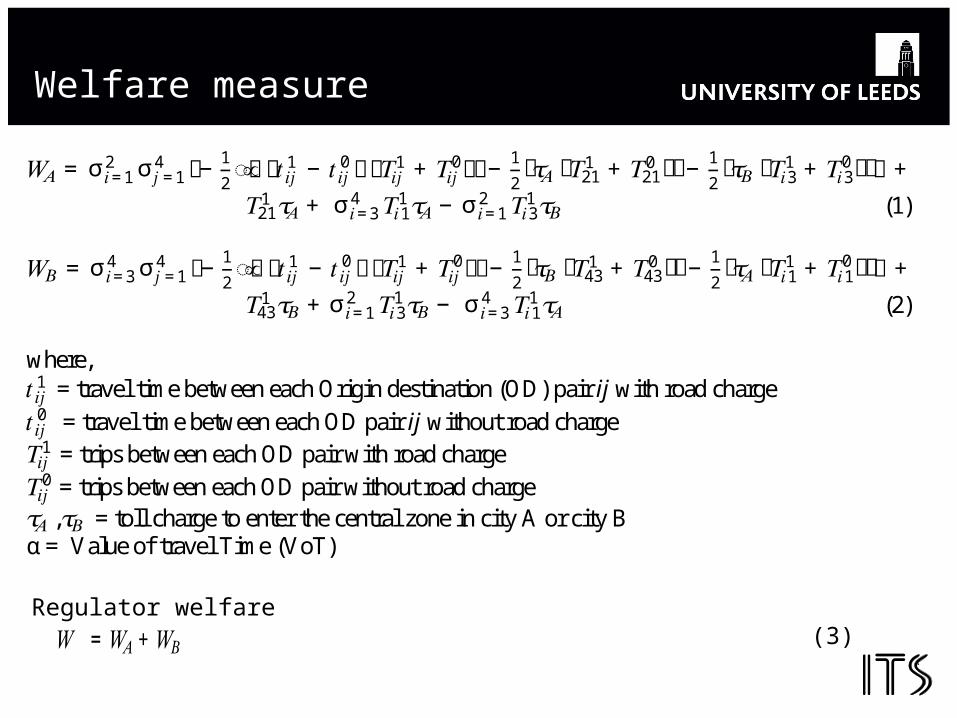
𝑊𝐴 = σ σ ቄ−12ൣ�∝ ൫𝑡𝑖𝑗1 − 𝑡𝑖𝑗0൯ ൫𝑇𝑖𝑗1 + 𝑇𝑖𝑗0൯൧− 12ሾ𝜏𝐴 ሺ𝑇211 + 𝑇210 ሻሿ− 12ሾ𝜏𝐵 ሺ𝑇𝑖31 + 𝑇𝑖30ሻሿቅ +4𝑗=12𝑖=1 𝑇211 𝜏𝐴+ σ 𝑇𝑖11𝜏𝐴4𝑖=3 − σ 𝑇𝑖31𝜏𝐵2𝑖=1 (1) 𝑊𝐵 = σ σ ቄ−12ൣ�∝ ൫𝑡𝑖𝑗1 − 𝑡𝑖𝑗0൯ ൫𝑇𝑖𝑗1 + 𝑇𝑖𝑗0൯൧− 12ሾ𝜏𝐵 ሺ𝑇431 + 𝑇430 ሻሿ− 12ሾ𝜏𝐴 ሺ𝑇𝑖11 + 𝑇𝑖10ሻሿቅ +4𝑗=14𝑖=3 𝑇431 𝜏𝐵 + σ 𝑇𝑖31𝜏𝐵2𝑖=1 − σ 𝑇𝑖11𝜏𝐴4𝑖=3 (2) where, 𝑡𝑖𝑗1 = travel time between each Origin destination (OD) pair ij with road charge 𝑡𝑖𝑗0 = travel time between each OD pair ij without road charge 𝑇𝑖𝑗1 = trips between each OD pair with road charge 𝑇𝑖𝑗0 = trips between each OD pair without road charge 𝜏𝐴 ,𝜏𝐵 = toll charge to enter the central zone in city A or city B α = Value of travel Time (VoT)
𝑊 = 𝑊𝐴+ 𝑊𝐵 Regulator welfare
(3)

Welfare profiles & sensitivity to VoT
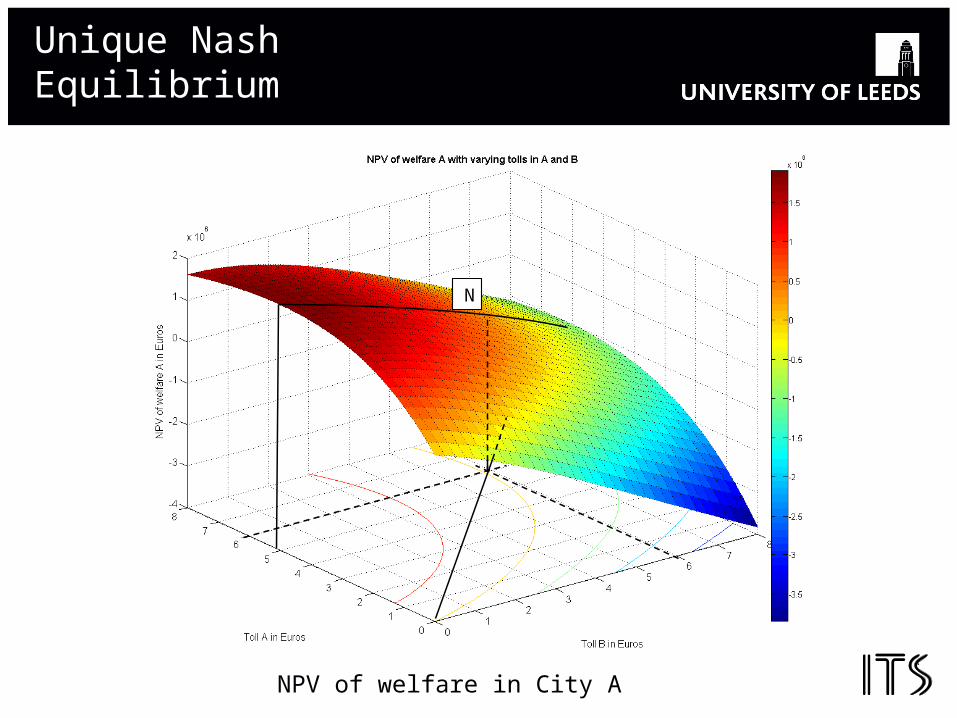
Unique Nash Equilibrium
Figure 5(a) NPV of welfare in city A
N
NPV of welfare in City A
Scenarios tested
• City A and City B – pareto case – representing the regulated scenario where tolls are set by the
regulator to maximise the total welfare of all residents
• City A and City B - PD game – where cities aim to maximise their own residents’ welfare in a non-
co-operative environment as set out by equations (1) and (2) for city A and city B respectively

Optimal tolls and welfare
ScenarioOptimalTolls €
NPV of Welfare
A €
NPV of Welfare
B €
NPV of Total
Welfare €Pareto (regulated) case 2.53 815,761 815,761 1,631,522
PD game 6.08 -127,729 -127,729 -255,458
Tolls and NPV of welfare changes per day

Experimental game set up
• 16 pairs of players (A and B)
• Task description – aim to win the game by obtaining highest NPV for their city.
• Change tolls every 5 years simultaneously from year 5 to 30.
• 6 rounds or games (each with 5 decision points)
• After game 3 – 8 pairs are told about the regulator solution. Optimal toll €2.53 and NPV of €815k for both players.
• Aim – to see whether information about the low toll regulator solution influences their decisions
• Note that 8 pairs did not get information and were the control group

Screenshot of player A’s screen
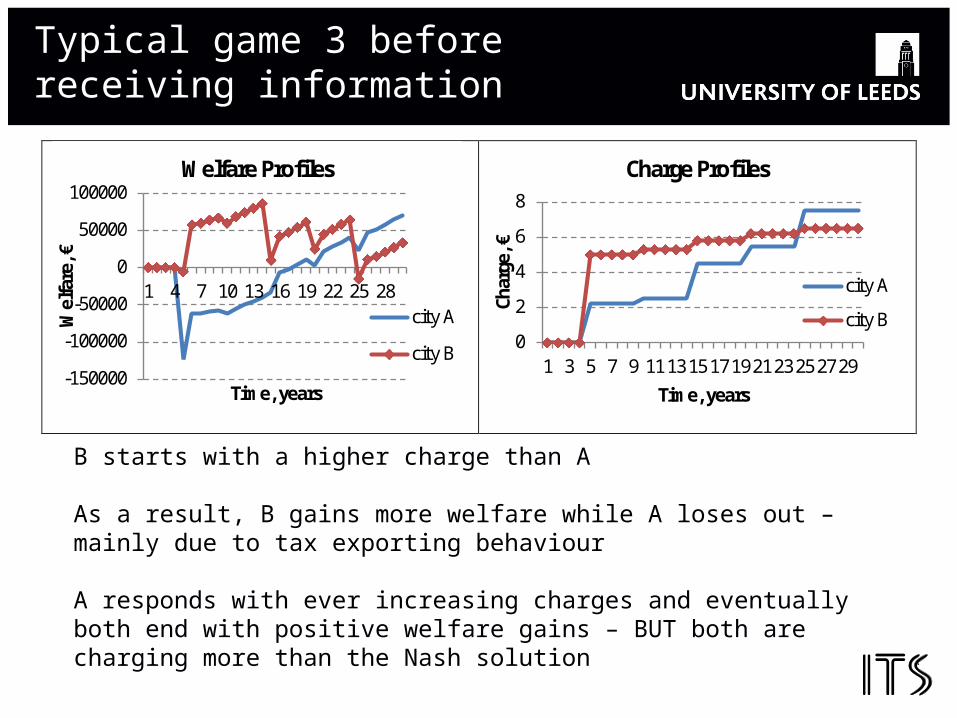
Typical game 3 before receiving information
-150000
-100000
-50000
0
50000
100000
1 4 7 10 13 16 19 22 25 28
Wel
fare
, €
Time, years
Welfare Profiles
city A
city B0
2
4
6
8
1 3 5 7 9 11 13 15 17 19 21 23 25 27 29
Char
ge, €
Time, years
Charge Profiles
city A
city B
B starts with a higher charge than A
As a result, B gains more welfare while A loses out – mainly due to tax exporting behaviour
A responds with ever increasing charges and eventually both end with positive welfare gains – BUT both are charging more than the Nash solution

Typical game 6 after receiving information
-100000
-50000
0
50000
100000
150000
1 4 7 10 13 16 19 22 25 28Wel
fare
, €
Time, years
Welfare Profiles
city A
city B
0
1
2
3
4
1 3 5 7 9 11131517192123252729
Char
ge, €
Time, years
Charge Profiles
city A
city B
Both players tend to start with lower charges.
Some minor increments are made
Generally don’t deviate
Evidence of reciprocal behaviour or tit-for-tat until deviation
Both gain positive welfare over 30 years

Mean charges start & end
Charge at the start Charge at the end
Group Mean, € Variance Mean, € Variance
InfA1-3 3.99 6.75 6.29 15.47
InfB1-3 4.10 5.34 7.81 19.47
InfA4-6 2.88 1.27 3.79 2.93
InfB4-6 3.05 1.49 3.64 2.30
CtrlA4-6 7.46 19.7 7.76 27.6
CtrlB4-6 7.12 6.61 9.91 34.5Players A not statistically different to players B for all groupsGames 4-6 statistically different to games 1-3 and with lower variance

NPV of welfare: games 1-3 info
-5000000 -4000000 -3000000 -2000000 -1000000 0 1000000 2000000 3000000
-5000000
-4000000
-3000000
-2000000
-1000000
0
1000000
2000000
3000000
NPV A, k€
NPV
B, k
€
Q2Q3
Q4
Q1
Much worse than Nash solution
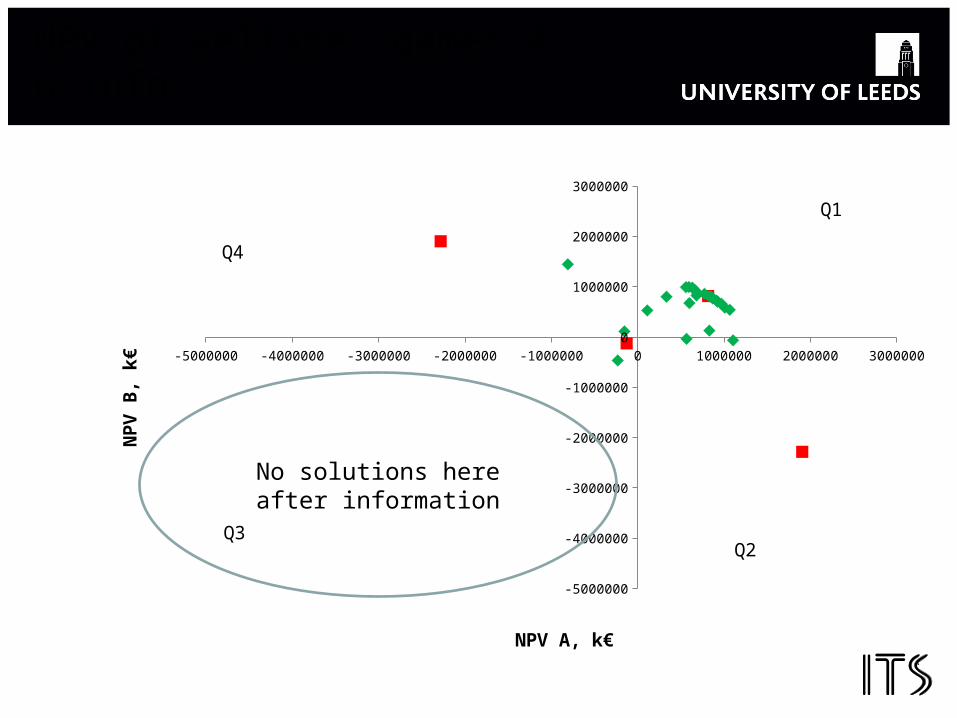
NPV of welfare: games 4-6 info
-5000000 -4000000 -3000000 -2000000 -1000000 0 1000000 2000000 3000000
-5000000
-4000000
-3000000
-2000000
-1000000
0
1000000
2000000
3000000
NPV A, k€
NPV
B, k
€
Q4
Q2
Q1
Q3
No solutions here after information

NPV of welfare: games 4-6 Control
-5000000 -4000000 -3000000 -2000000 -1000000 0 1000000 2000000 3000000
-5000000
-4000000
-3000000
-2000000
-1000000
0
1000000
2000000
3000000
NPV A, k€
NPV
B, k
€
NB one pair played low,low
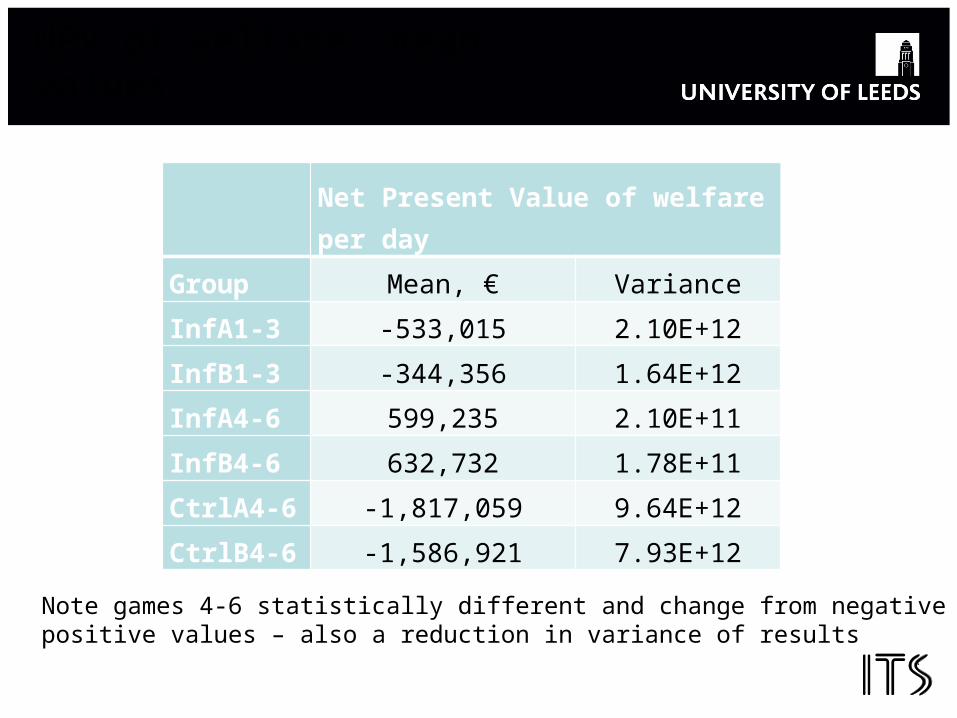
NPV of welfare: mean values
Note games 4-6 statistically different and change from negative topositive values – also a reduction in variance of results
Net Present Value of welfare per day
Group Mean, € Variance
InfA1-3 -533,015 2.10E+12
InfB1-3 -344,356 1.64E+12
InfA4-6 599,235 2.10E+11
InfB4-6 632,732 1.78E+11
CtrlA4-6 -1,817,059 9.64E+12
CtrlB4-6 -1,586,921 7.93E+12

Satisfactory outcomes
• Does welfare improve over each 5 year period?
• B makes 3 good decisions, A makes 4
1 3 5 7 9 11 13 15 17 19 21 23 25 27 29
-150000
-100000
-50000
0
50000
100000
Welfare Profiles
city A city B
Time, years
We
lfa
re, €
Y
N
Y YN
NY
Y
Y
Y

Evidence of learning/collaboration
• In each 3 game set there are 240 decisions (16*5*3).
• 58% were satisfactory in games 1-3
• This increases to 85% in games 4-6
• Both players making satisfactory moves at the same time increases from 38% to 71% in games 4-6.
• Reciprocal behaviour found as in game theory literature
• Players recognise that if one “defects” then the other may retaliate. Co-operative equilibrium is found rather than the Nash non-co-operative one.
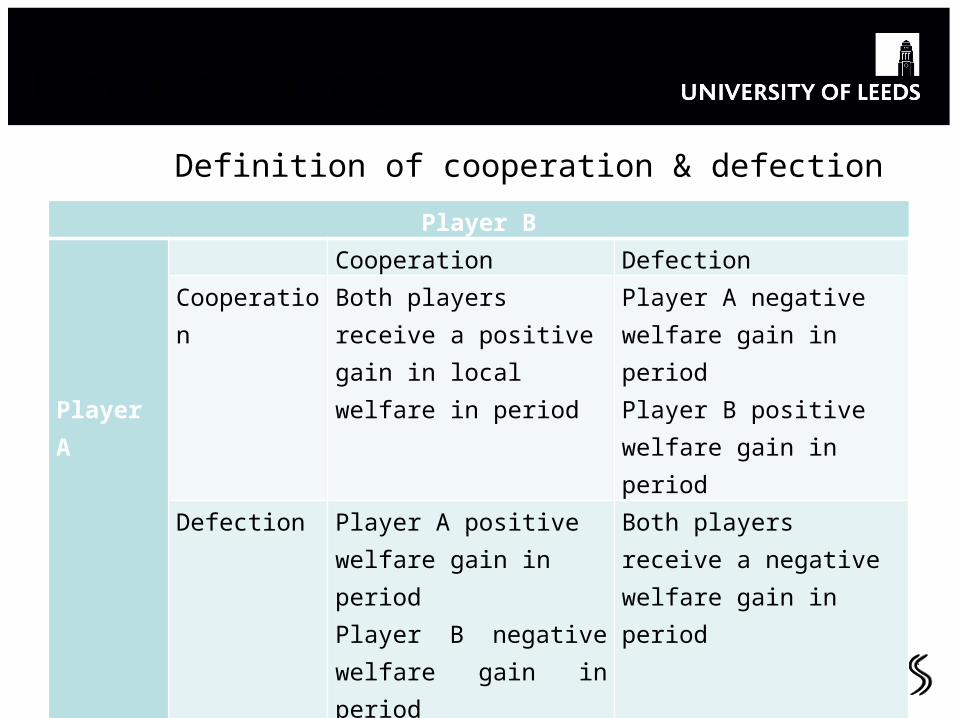
Player’s strategies
Player B Player A
Cooperation DefectionCooperation Both players receive a
positive gain in local welfare in period
Player A negative welfare gain in periodPlayer B positive welfare gain in period
Defection Player A positive welfare gain in periodPlayer B negative welfare gain in period
Both players receive a negative welfare gain in period
Definition of cooperation & defection
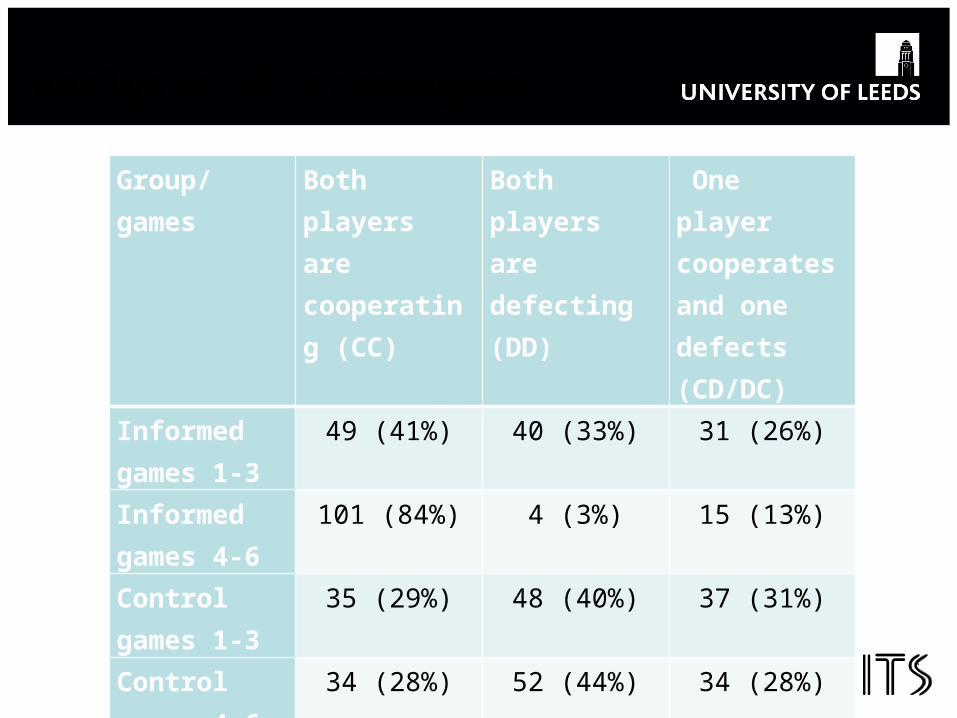
Analysis of strategies
Group/games Both players are cooperating (CC)
Both players are defecting (DD)
One player cooperates and one defects (CD/DC)
Informed games 1-3
49 (41%) 40 (33%) 31 (26%)
Informed games 4-6
101 (84%) 4 (3%) 15 (13%)
Control games 1-3
35 (29%) 48 (40%) 37 (31%)
Control games 4-6
34 (28%) 52 (44%) 34 (28%)
Summary - further research
• The dynamic model contains similar Nash Trap to the static model
• A dynamic game with updates based on experience in recent past can lead to Nash trap if both are aggressive
• BUT the trap can be avoided if cautious approach is taken
Summary (2)
• The game allowed players to learn about the welfare response surface
• Information about the low toll regulated solution appears to change behaviour and a co-operative solution close to this emerges.
• Questions how we assume decisions are made in planning vs implementation
• Interviews suggest authorities combine planning with benchmarking against competitors

Further research
• Asymmetric cities – weaker city has an incentive to collude or accept regulation
• Develop a three player game
• Extend the model to include other decision makers with different objectives
Reference
• Shepherd, S. Balijepalli C (2015) A game of two cities: A toll setting game with experimental results, Transport Policy, 38, pp.95-109. doi: 10.1016/j.tranpol.2014.12.002