institute for research on poverty focus latin america, south africa, and parts of asia shifted from...
TRANSCRIPT

FocusUniversity of Wisconsin–MadisonInstitute for Research on Poverty
Volume 26
Number 1
Summer-Fall 2008
ISSN: 0195–5705
The new global labor marketRichard B. Freeman
Richard B. Freeman is Professor of Economics atHarvard University, Director of the NBER Labor StudiesProgram, and Codirector of the Centre for EconomicPerformance of the London School of Economics.
Before the collapse of Soviet Communism, China’s move-ment toward market capitalism, and India’s decision toundertake market reforms and enter the global trading sys-tem, the global economy encompassed roughly half of theworld’s population comprising the advanced Organisationfor Economic Co-operation and Development (OECD)countries, Latin America and the Caribbean, Africa, andsome parts of Asia. Workers in the United States and otherhigher-income countries and in market-oriented developingcountries such as Mexico did not face competition fromlow-wage Chinese or Indian workers or from workers in theSoviet empire. Then, almost all at once in the 1990s, China,India, and the former Soviet bloc joined the globaleconomy, and the entire world came together into a singleeconomic world based on capitalism and markets.
This change greatly increased the size of the global laborpool, from approximately 1.46 billion workers to 2.93billion workers (Figure 1). I have called this “the great
doubling.”1 In this article I argue that the doubling of theglobal workforce presents the U.S. economy with itsgreatest challenge since the Great Depression. If theUnited States adjusts well, the benefits of having virtu-ally all of humanity on the same economic page willimprove living standards for all Americans. If the coun-try does not adjust well, the next several decades willexacerbate economic divisions in the United States andrisk turning much of the country against globalization.
The promise is that as the world economy grows rapidly,so too will the U.S. economy, creating the opportunityfor shared prosperity for all. The danger is that as manyfirms invest in low-wage labor overseas, low-wageAmericans will lose ground in the economy, as they havein the past two to three decades. Many will be unable toafford the health-care plans their firms offer, and manywill find themselves in jobs with no coverage. Fewer willhave private retirement plans. The sentiments againstglobalization revealed in the North American Free TradeAgreement (NAFTA) debate in the 1990s and in thedebates over ways to deal with illegal immigrants in theearly 2000s could combine to lead many Americans toblame the global economy for their woes. But it will notbe globalization itself that is at fault, but rather the fail-ure of the nation to choose policies that distribute thebenefits of the global economy widely.
The new global labor market 1
Improving individual success forcommunity-college students 7
A primer on U.S. welfare reform 15
Rethinking the safety net: Gaps and instabilityin help for the working poor 27
A longitudinal perspective on income inequalityin the United States and Europe 33

2
This publication was supported with a grant from the U.S. Department of Health and Human Services, Office ofthe Assistant Secretary for Planning and Evaluation, grant number 3 U01 PE000003-06S1. The opinions andconclusions expressed herein are solely those of the author(s) and should not be construed as representing theopinions or policy of any agency of the federal government.
The capital/labor balance
What impact might the doubling of the global workforcehave on workers? To answer this question, imagine whatwould happen if through some cloning experiment a madeconomist doubled the size of the U.S. workforce. Twiceas many workers would seek employment from the samebusinesses. You do not need an economics Ph.D. to seethat this would be good for employers but terrible forworkers. Wages would fall. Unemployment would rise.But if the nation’s capital stock doubled at the same time,demand for labor would rise commensurately, and work-ers would maintain their economic position. In the sim-plest economic analysis, the impact of China, India, andthe former Soviet bloc joining the global economy de-pends on how their entry affects the ratio of capital tolabor in the world. This in turn depends on how muchcapital they brought with them when they entered theglobal system. Over the long run, it depends on theirrates of savings and future capital formation.
Using data from the Penn World tables on yearly invest-ments by nearly every country in the world, I have esti-mated the level of capital stock country by country andadded the estimated stocks into a measure of the globalcapital stock. My estimates indicate that as of 2001, the
doubling of the global workforce reduced the ratio ofcapital to labor in the world economy to 61 percent ofwhat it would have been before China, India, and theformer Soviet bloc joined the world economy. The rea-son the global capital/labor ratio fell greatly was that thenew entrants to the global economy did not bring muchcapital with them. India had little capital because it wasone of the poorest countries in the world. China was alsovery poor and destroyed capital during the Maoist period.The Soviet empire was wealthier than China or India butinvested disproportionately in military goods and heavyindustry, much of which was outmoded or so polluting asto be worthless.
The immediate impact of the advent of China, India, andthe former Soviet bloc to the world economy was thus toreduce greatly the ratio of capital to labor. This hasshifted the global balance of power to capital. With thenew supply of low-wage labor, firms can move facilitiesto lower-wage settings or threaten to do so if workers inexisting facilities do not grant concessions in wages orwork conditions favorable to the firm. Retailers can im-port products made by low-wage workers or subcontractproduction to lower-cost locales. In 2004 the Labor andWorklife Program at Harvard Law School held a confer-ence on the impact of the end of the Multi-Fiber Arrange-ment that gave quotas to different developing countriesfor selling apparel in the United States and other ad-vanced countries. Union leaders representing apparelworkers in Central America told the conference thatfirms were ordering workers to work extra hours withoutany increase in earnings under the threat of moving toChina.2 With wages in Central America three to fourtimes those in China, the threat was a valid one. But theChinese researcher at the meeting noted that the shift ofapparel jobs to China was helping workers much poorerthan those in Central America and thus was reducingworld inequality and poverty.
In the long run, China, India, and the former Soviet blocwill save and invest and contribute to the growth of theworld capital stock. The World Bank estimates thatChina’s savings rate is on the order of 40 percent to 50percent, higher than the savings rate in most other coun-tries, which will help increase global capital rapidly.3
Although China is much poorer than the United States, itsaves about as much as the United States because itssavings rate far exceeds the U.S. savings rate. Still, it willtake about three decades to restore the global capital/labor ratio to what it had been before China, India, andthe former Soviet bloc entered the world economy, and
Figure 1. Old and new global labor markets.
Source: Employment from ILO data, http://laborsta.ilo.org, 2000.Capitol/labor ratio, calculated from Penn World tables, scaled so“before” is 1.0.
Note: “Before” shows the labor market that would have existed inthe global capitalist system in 2000 if China, India, and the formerSoviet bloc had remained outside the global economy. “After”shows the labor market with the addition of the workers and capitalfrom those countries.
0
0.5
1
1.5
2
2.5
3
Labor Force in Billions Capital/Labor (before = 1)
Before After

3
even longer to bring it to where it might have been absenttheir entry. For the foreseeable future the United Statesand other countries will have to adjust to a relative short-fall of capital per worker and to the power this gives tofirms in bargaining with workers. This will affect work-ers in different parts of the world differently.
Effect on workers
The flow of capital to China and India to employ theirlow-wage workers will increase wages in those countries.Indeed, as their rates of economic growth have zoomed,real earnings have risen. In China, the real earnings ofurban workers more than doubled between 1990 and2002. Poverty fell sharply despite a huge rise in inequal-ity in China. Real wages in India also rose rapidly.
But workers in many of the developing countries in LatinAmerica, Africa, and Asia did not fare well. Employmentin Latin America, South Africa, and parts of Asia shiftedfrom the formal sectors associated with economic ad-vancement to informal sectors, where work is precarious,wages and productivity low, and occupational risks andhazards great. The entry of China and India into theworld economy turned many developing countries fromthe low-wage competitors of advanced countries to thehigh-wage competitors of China and India. Countriessuch as Peru, El Salvador, Mexico, and South Africa canno longer develop by producing generic low-wage goodsand services for the global marketplace that the WorldBank/International Monetary Fund model of develop-ment envisaged that they would do. The backlash againstthis orthodox form of globalization in Latin Americareflects this failure.
The doubling of the global workforce also challengesworker well-being in the United States and other ad-vanced countries. First, it creates downward pressures onthe employment and earnings of less-skilled workersthrough trade and immigration. The traditional answer tothis pressure is that the advanced countries should investmore in educating their workers. During the early 1990s’debate in the United States over the impact of theNAFTA treaty with Mexico, proponents of the treatyargued that because U.S. workers were more skilled thanMexican workers and thus more capable of producinghigh-tech goods, the United States would gain high-skilled jobs from increased trade with Mexico while los-ing low-wage, less-skilled jobs. Less-skilled U.S. work-ers would benefit from trade if they made greaterinvestments in human capital and became more skilled.
The argument that the United States will gain skilled jobswhile losing less-skilled jobs would seem to apply evenmore strongly to trade with China and India. The averageworker in China and India has lower skills than the aver-age Mexican worker. From this perspective, Chinese andIndian workers are complements rather than substitutes
for American workers. Their joining the global laborpool reduces the prices of the manufacturing goods theUnited States buys and raises demand and prices for thehigh-tech goods and services the United States sells,which benefits educated labor. Lower prices for shoes, T-shirts, and plastic toys, and higher prices for semicon-ductors and business consulting and finance would be inthe interest of all U.S. workers save perhaps for the lastshoemaker or seamstress.
But these analyses ignore the second challenge that theadvent of the highly populous low-wage countries to theglobal economy poses for the United States and otherdeveloped countries. This is that these countries are be-coming competitive in technologically advanced activi-ties. The model that economists use to analyze tradingpatterns between advanced countries and developingcountries assumes that the advanced countries havehighly educated workers who enable them to monopolizecutting-edge innovative sectors while the developingcountries lack the technology and skilled workforce toproduce anything beyond lower-tech products. In thismodel, American workers benefit from the monopoly theUnited States has in the newest high-tech innovations.The greater the rate of technological advance and theslower the spread of new technology to low-wage coun-tries, the higher paid are U.S. workers compared withworkers in the developing countries.
But the spread of higher education and modem technol-ogy to low-wage countries can reduce advanced coun-tries’ comparative advantage in high-tech products andadversely affect workers in the advanced countries. In2004, when many engineers and computer specialistswere troubled by the offshore transfer of skilled work,Paul Samuelson reminded economists that a country witha comparative advantage in a sector can suffer economicloss when another country competes successfully in thatsector.4 The new competitor increases supplies, and thisreduces the price of those goods on world markets andthe income of the original exporter. Workers have to shiftto less desirable sectors—those with lower chance forproductivity growth, with fewer good jobs, and so on.Some trade specialists reacted negatively to Samuelson’sreminder. What he said was well-known to them butirrelevant. In the real world it would never happen.
Samuelson is right, and his critics are wrong. The as-sumption that only advanced countries have the educatedworkforce necessary for innovation and production ofhigh-tech products is no longer true. Countries aroundthe world have invested in higher education, and thenumber of college and university students and graduatesoutside the United States has grown hugely. In 1970,approximately 30 percent of university enrollmentsworldwide were in the United States; in 2006, approxi-mately 12 percent of university enrollments worldwidewere in the United States. Similarly, at the Ph.D. level theU.S. share of doctorates produced around the world has

4
fallen from about 50 percent in the early 1970s to 18percent in 2004.5 Some of the growth of higher educationoverseas stems from European countries rebuilding theiruniversity systems after World War II, and some owes toJapan and Korea investing in university education. By2005, several EU countries and Korea were sending alarger proportion of their young citizens to universitythan the United States. But much is due to the growth ofuniversity education in developing countries, whose stu-dents made up nearly two-thirds of university enrolleesin 2000. China has been in the forefront of this; between1999 and 2005, China increased the number graduatingwith bachelor’s degrees fivefold to four million people.
At the same time, low-income countries have increasedtheir presence in the most technically advanced areas.China has moved rapidly up the technological ladder,expanded its high-tech exports, and achieved a signifi-cant position in research in what many believe will be thenext big industrial technology—nanotechnology.China’s share of scientific research papers has increasedgreatly. India has achieved a strong position in informa-tion technology and attracts major research and develop-ment (R&D) investments, particularly in Bangalore.China and India have increasing footprints in high techbecause as large populous countries they can produce asmany highly educated scientists and engineers as ad-vanced countries, or more, even though the bulk of theirworkforce is less skilled. Indeed, by 2010 China willgraduate more Ph.D.s in science and engineering than theUnited States. The quality of university education ishigher in the United States than in China, but China willimprove quality over time. India has produced manycomputer programmers and engineers. And Indonesia,Brazil, Peru, and Poland—name the country—more thandoubled their university enrollments in the 1980s and1990s.
Multinational firms have responded to the increased sup-ply of highly educated workers by “global sourcing” forworkers. This means looking for the best candidates inthe world and locating facilities, including high-techR&D and production, where the supply of candidates issufficient to get the work done at the lowest cost. Over750 multinational firms have set up R&D facilities inChina. The offshore transfer of computer programmingor call centers to lower-wage countries is the naturaleconomic response to the availability of educated laborin those countries. The combination of low wages andhighly educated workers in large populous countriesmakes them formidable competitors for an advancedcountry.
The bottom line is that the spread of modern technologyand education to China and India will undo some of theU.S. monopoly in high-tech innovation and productionand place competitive pressures on U.S. workers. Even-tually the wages of workers in China and India willapproach those in the United States, as have the wages of
European, Japanese, and to some extent Korean workers,but that is a long way off.
Finally, the development of computers and the Internetenhances the potential for firms to move work to low-cost operations. Business experts report that if work isdigital—which covers about 10 percent of employmentin the United States—it can and eventually will beoffshored to low-wage highly educated workers in devel-oping countries. The most powerful statement by a busi-ness group on this issue was given in 2005 by the Insti-tute of Directors in the United Kingdom:
The availability of high-speed, low-cost communi-cations, coupled with the rise in high-level skills indeveloping countries meant offshoring has becomean attractive option outside the manufacturing in-dustry. Britain has seen call centres and IT supportmove away from Britain, but now creative servicessuch as design and advertising work are beingoutsourced. There is more to come. In theory, any-thing that does not demand physical contact with acustomer can be outsourced to anywhere on theglobe. For many UK businesses this presents newopportunities, for others it represents a seriousthreat. But welcome it or fear it, it is happeninganyway, and we had better get used to it.6
Transition to a truly global labor market
By bringing modern technology and business practices tomost of humanity, current global capitalism has the po-tential for creating the first truly global labor market.Barring social, economic, or environmental disasters,technological advances should accelerate, permittinghuge increases in the income of the world and eventuallyrough income parity among nations. But even under themost optimistic scenario, decades will be required for theglobal economy to absorb the huge workforces of China,India, and potentially other successful developing coun-tries. After World War II it took 30 or so years forWestern Europe and Japan to reach rough parity with theUnited States. It took Korea about 50 years to move frombeing one of the poorest economies in the world to thesecond rung of advanced economies. If the Chineseeconomy keeps growing rapidly and wages double everydecade, as in the 1990s, Chinese wages would approachlevels that the United States has today in about 30 years,and would approach parity with the United States abouttwo decades later. India will take longer to reach U.S.levels. This period of transition to a truly global labormarket presents both new opportunities and seriousthreats to worker well-being in the United States andother advanced countries.
How American workers fare in the transition will dependon a race between labor-market factors that improve liv-ing standards and factors that reduce those standards. On

5
the improvement side are the likely higher rates of pro-ductivity due to more highly educated workers advanc-ing science and technology and the lower prices of goodsmade by low-wage workers overseas. On the reductionside are the labor-market pressures from those workersand the worsening of terms of trade and loss of compara-tive advantage in the high-tech industries that offer thegreatest prospects for productivity advances and the mostdesirable jobs. Which factors will win the race dependsin part on the economic and labor-market policies thatcountries, the international community, unions, andfirms choose to guide the transition. I can envisage agood transition scenario and a bad transition scenario.
In the good transition scenario, India, China, and otherlow-wage countries rapidly close the gap with the UnitedStates and other advanced countries in the wages paidtheir workers, as well as in their technological compe-tence. Their scientists, engineers, and entrepreneurs de-velop and produce new and better products for the globaleconomy. This reduces costs of production so that pricesof goods fall, which improves living standards. TheUnited States and other advanced countries retain com-parative advantage in enough leading sectors or niches ofsectors to remain hubs in the global development oftechnology. The world savings rate rises so that the glo-bal capital/labor ratio increases rapidly. As U.S. GDPgrows, the country distributes some of the growth in theform of increased social services and social infrastruc-ture—national health insurance, for instance—orthrough earned income tax credits so that living stan-dards rise even for workers whose wages are constrainedby low-wage competitors during the transition.
In the bad transition scenario, China and India developenclave economies in which only their modern-sectorworkers benefit from economic growth while the ruralpoor remain low paid and a sufficient threat to the urbanworkers that wages grow slowly. The global capital stockgrows slowly as Americans maintain high consumptionand low savings. Eventually, citizens in the United Statesbegin to blame globalization for economic problems andtry to abort the transition and introduce trade barriers andlimit the transfer of technology. To add to the nightmare,huge within-country inequalities in China, India, andother countries produce social disorder that creates chaosor gets suppressed by a global “superelite” who use theirwealth and power to control a mass of struggling poor.The bad scenario resembles some recalcitrant Marxist’svision of global capitalism.
The challenge to the United States is to develop business,labor, and government policies to assure that the countryand the world make a good transition. What might thisentail?
First, this requires that the United States invest in scienceand technology and keep attracting the best and brightestscientists, engineers, and others from the rest of the
world. The United States leads in science, technology,and higher education in part because it attracts hugenumbers of highly educated immigrants. In the 1990s,dot-com and high-tech booms in the United Statesgreatly increased employment of scientists and engineerswithout increasing the number of citizens graduating inscience and engineering and without raising the pay ofscientists and engineers relative to that of other profes-sions. This was done by greatly increasing the share offoreign-born workers in the science and engineeringworkforce. Sixty percent of the growth of Ph.D. scien-tists and engineers consisted of foreign-born individuals,with the largest numbers coming from China and India.In 2000, over half of employed doctorate scientists andengineers aged less than 45 were foreign born. Many ofthe foreign born were United States educated, but most ofthose with bachelor’s degrees were educated overseas.The country needs to maintain itself as an attractive opensociety to keep a large flow of highly educated immi-grants.
From the perspective of U.S. university graduates, how-ever, the immigration of large numbers of highly edu-cated workers and global sourcing of jobs to low-wagecountries threatens economic prospects. This reality con-tradicts the notion that skilled Americans need not worryabout competition from workers overseas. If you study orwork in science and engineering, where knowledge isuniversal, you should worry. Your job may not go toBombay or Beijing, but you will be competing with indi-viduals from those countries and other low-wage coun-tries. For the United States to maintain its global lead inscience and technology, it has to encourage Americancitizens to go on in these fields, as well as attract foreigntalent. This requires more spending on basic research anddevelopment, allocating a larger share of research grantsto young researchers as opposed to senior researchers,and giving more and higher-valued scholarships and fel-lowships. The United States needs to educate citizenswith skills that differ sufficiently from those being pro-duced in huge numbers overseas and to modernize thecountry’s infrastructure so that U.S. workers have thebest transportation, sustainable and affordable energy,and state-of-the-art machines and computers in order tocompete with lower-wage workers in other countries.
For less-skilled and lower-paid Americans, there is aneed to restructure the labor market for their services sothey do not fall further behind the rest of the country.Some of the policies that can help workers through thisperiod are “tried and true”: a strengthening of rights atwork that would allow them to gain a share of the profitsof firms in non-traded-goods markets through sharedcapitalist arrangements; trade unions; higher minimumwages, which can raise wages at the bottom of the jobmarket with little cost to employment; expansion of theEarned Income Tax Credit, which will improve incomesand living standards without raising the cost of labor; andprovision of social services such as health insurance that

6
makes them less costly to hire. Given the doubling of theglobal labor force, these workers will need greater socialsupport than in past years to advance in the economy.
With productivity and GDP rising, the country will havethe resources to raise social safety nets and supplementearnings so that work will be attractive even for thosewho face low-wage competition from overseas. Ideally,the competitive market would improve the well-being ofall Americans without any policy interventions, but tothe extent that globalization or any other factor preventssome groups from benefiting from economic growth, thecountry will need to buttress the living standards of thosegroups.
Conclusion
The world has entered a long and epochal transitiontoward a single global economy and labor market. Thereis much for the United States to welcome in the neweconomic world, but also much for the United States tofear. The country needs to develop new creative eco-nomic policies to assure that workers fare well duringthis transition and that the next several decades do notrepeat the experience of the past 20 or 30 years in whichnearly all the American productivity advance ended up inthe pockets of the highest-paid individuals and very little
in the pockets of normal workers. National policies to-ward education, worker rights, taxation, and investmentin infrastructure can help the economy make the adjust-ments to assure that all will benefit. �
1A version of this article, “The Great Doubling: The Challenge of theNew Global Labor Market,” was published as a chapter in EndingPoverty in America: How to Restore the American Dream, eds. J.Edwards, M. Crain, and A. L. Kalleberg (New York: The New Press,2007).
2Harvard Law School, Labor and Worklife Program, “The Ending ofGlobal Textile Quotas: Understanding the New Shape of the WorldEconomy” (briefing book available from Labor and Worklife Pro-gram, May 23–24, 2005).
3World Bank, “World Development Indicators,” Table 4.9, http://devdata.worldbank.org/wdi2005/Section4.htm.
4P. A. Samuelson, “Where Ricardo and Mill Rebut and ConfirmArguments of Mainstream Economists Supporting Globalization,”Journal of Economic Perspectives 18 (2004): 135–46.
5R. B. Freeman, “Does Globalization of the Scientific/EngineeringWorkforce Threaten US Economic Leadership?” Innovation Policyand the Economy 6 (2006): 123–58; and R. B. Freeman, “What DoesGlobal Expansion of Higher Education Mean for the US?” NBER,U.S. Universities in a Global Market, Woodstock, Vermont, October3–4, 2008.
6Institute of Directors, “Offshoring Is Here to Stay,” January 23,2006, http://www.politics.co.uk/issue-of-the-day/institute-directors-offshoring-here-stay-$370499$367012.htm.
Ending Poverty in America: How to Restore the American DreamEdited by John Edwards, Marion Crain and Arne L. Kalleberg
Part One: Confronting Poverty and Declining OpportunityDavid K. Shipler, Jared Bernstein, and Elizabeth Warren
Part Two: The Forces Undermining the American DreamRichard B. Freeman, Jacob S. Hacker, Sara McLanahan, William Julius Wilson
Part Three: Spurring Better Jobs and Creating Higher IncomesKatherine S. Newman, John Karl Scholz, Beth Shulman, Harry J. Holzer, and David Spickard
Part Four: Sharing the Prosperity through Asset BuildingMelvin L. Oliver and Thomas M. Shapiro; Michael S. Barr; Michael Sherraden; Peter Orszag;
Michael A. Stegman; Martin Eakes; and Jack F. Kemp
Part Five: Strengthening Family and CommunityRonald B. Mincy and Hillard Pouncy; Carol Mendez Cassell; Dennis K. Orthner; Hugh B. Price;
Anita Brown-Graham; Ruston Seaman and Michael Ferber; and Angela Glover Blackwell
Published in 2007 by The New Pressin conjunction with the Center on Poverty, Work and Opportunity,
University of North Carolina at Chapel Hill.http://www.thenewpress.com

7
Improving individual success for community-collegestudents
semester “learning community” intervention can providean early boost to freshman, helping students move morequickly through developmental requirements and earnmore credits in their first semester.
Why focus on community colleges?
Community colleges make higher education affordableand accessible to virtually anyone seeking the opportu-nity. Today, about 1,200 community colleges servenearly 12 million students. Almost half of all collegestudents nationwide attend a community college.2 Com-pared with four-year institutions, community collegesenroll more students of color and more low-income stu-dents. They are also more likely to enroll working adultsand parents.3
Community colleges prepare students for transfer tofour-year colleges and universities, and they providetraining in a wide variety of occupations. As shown inFigure 1, recent data from the U.S. Census Bureau indi-
Susan Scrivener
Susan Scrivener is Senior Associate in the Young Adultsand Postsecondary Education Policy Area at MDRC.
Community colleges are “the Ellis Island of Americanhigher education,” according to the January 2008 reportof the National Commission on Community Colleges.1
They provide a pathway into the middle class for manylow-income individuals, including people of color, im-migrants, full- and part-time workers, and students whoare the first in their families to attend college. However,the increased access to post-secondary education thatcommunity colleges offer has not always translated intoindividual success for students. As many as 60 percent ofincoming students at community colleges require at leastone developmental (or remedial) course, and many dropout before receiving a credential, often because theynever progress beyond developmental classes. Promisingevidence from one program in the Opening Doors dem-onstration described in this article suggests that a one-
$19,915
$29,448
$37,990
$54,689
$0 $10,000 $20,000 $30,000 $40,000 $50,000 $60,000
Without a High SchoolDiploma
High School Diploma
Associate's Degree
Bachelor's Degree
Annual Earnings
Figure 1. Average annual earnings, by educational attainment: Adults, nationwide, 2005.
Source: U.S. Census Bureau, Educational Attainment in the United States: 2006, “Table 9: Earnings in 2005 by Educational Attainment of thePopulation 18 Years and Over, by Age, Sex, Race Alone, and Hispanic Origin: 2006.”
Focus Vol. 26, No. 1, Summer-Fall 2008

8
cate that in 2005, an adult with an associate’s degreeearned an average annual income that was almost one-third higher than that of an adult with a high schooldiploma. Given the widening earnings gap between indi-viduals with a postsecondary credential and those with ahigh school diploma, community colleges represent apotential pathway out of poverty and into the middleclass.
Unfortunately, although many people attend communitycolleges, only a minority of students end up receiving adegree. The U.S. Department of Education reported thatonly about one-third of students who entered communitycollege intending to earn a higher-education degree ac-complish this goal within a six-year period.4 Completionrates are particularly low for students who are academi-cally under-prepared and who must begin college withdevelopmental-level courses. The approach describedhere reflects the search for effective strategies to helpcommunity-college students stay in school and succeed.
Opening Doors
The Opening Doors demonstration began in 2003 andincludes four programs at six community colleges. Thisarticle provides a brief summary of a recent report on theeffects of one community college’s Opening Doors pro-gram on students up to two years after they entered thestudy.5 A review of prior research and focus groups withpast, current, and potential community-college studentsrevealed some key factors that hinder students’progress.6 These include: underpreparation for college-level work; the challenges of juggling school, work, andfamily; and institutional barriers such as inadequate sup-port services and insufficient financial aid. OpeningDoors is testing the following three promising strategiesthat colleges could adopt to address these factors:
(1) Curricular and instruction innovations, includinglearning communities in which a group of peers takeblocks of classes together; customized instructional sup-port; academic instruction for students on academic pro-bation; and enhanced orientation courses to help studentsnavigate the college experience.
(2) Enhanced student services, including stronger, morepersonalized academic advisement; career counseling;and tutoring.
(3) Supplementary financial aid, such as special scholar-ships or money directed to specific education-relatedcosts, such as vouchers for textbooks.
Learning communities
Learning communities are a way of linking courses sothat students have opportunities for deeper understand-ing and integration of the material they are studying, as
well as more interaction with teachers and other students.The four most common models of learning communitiesare paired or clustered courses, cohorts in large classes,team-taught programs, and residence-based programs.The first of these models was used for the program de-scribed here. Two or more individually taught coursesare linked, with between 20 and 30 students taking thecourses together as a cohort. The classes are block-scheduled, so that they meet one after the other. By 2002,the National Survey of First-Year Academic Practicesfound that over 60 percent of responding colleges en-rolled at least some cohorts of students into two or morelinked courses. However, these programs generally in-volved only a small proportion of students; fewer than 20percent of these colleges enrolled more than 10 percentof freshmen in such programs.7
Many community colleges adopt learning communitieswith the goal of improving the retention, persistence, andsuccess of their most vulnerable students. Prior researchon learning communities has suggested that they canincrease students’ integration and sense of belonging inthe college community and their overall satisfaction withtheir college experience.8 However, few studies havemeasured the effect of learning communities on key stu-dent outcomes such as persistence, course completion,and degree attainment, and none of the large-scale stud-ies have used a random assignment research design.
The program at Kingsborough CommunityCollege
Kingsborough Community College in Brooklyn, NewYork, targeted its Opening Doors Learning Communitiesprogram to first-time incoming freshmen, ages 17 to 34,who planned to attend full-time during the day.9 Admin-istrators were particularly interested in targeting liberalarts majors, as they believed that many students in thatgroup did not have clear academic or career goals andthus might benefit from a model that provided enhancedstructure and support. They also made an effort to targetstudents who missed the application deadline for the CityUniversity of New York (CUNY) system, and thus ap-plied directly to Kingsborough often just weeks or daysbefore the start of classes. These students tended to havepoor outcomes, suggesting that they might benefit fromthe program.
Program services
The program placed students in groups of up to 25 thattook three classes together during their first semester.The courses included an English course, usually at thedevelopmental level; an academic course required for thestudent’s major; and a one-credit freshman orientationcourse. The program also offered additional componentsdesigned to address students’ barriers to retention andacademic success, including:

9
• Enhanced counseling and support provided by theorientation course instructor. The counselor, usuallycalled a “case manager,” worked proactively to iden-tify and resolve students’ barriers to good attendanceand performance. Ideally, the case manager met regu-larly with the other two learning community instruc-tors in order to create an “early-warning” system toidentify students needing assistance. Each case man-ager was usually responsible for three or four learn-ing communities, or 75 to 100 students.
• Enhanced tutoring. While tutors are generally as-signed to developmental English courses atKingsborough, and may even attend classes, othertutoring is provided at a central lab. In the OpeningDoors program, a tutor was assigned to each learningcommunity and attended the English course, and of-ten the subject-matter course as well. The intentionwas to insure that tutors were familiar with both thematerial being covered and the individual students, inorder to position them to both help with the work in agiven course, and to help students draw connectionsacross the linked courses.
• Textbook vouchers. College textbooks are quite ex-pensive, and studies have shown that many commu-nity-college students do not purchase their ownbooks, but rather try to share or borrow books, orsimply get by without them.10 Opening Door studentsattending the initial 12-week fall or spring sessionreceived a $150 textbook voucher redeemable at thecampus bookstore. Those who returned for a six-week winter or summer module could receive a sec-ond voucher worth up to $75.
Linking courses
The linked-course structure was the heart of the OpeningDoors Learning Communities program. The structure wasdesigned to achieve many goals: to help students buildclose, supportive relationships with their peers to ease thetransition into college; to enhance learning by emphasizingthe substantive linkages across different disciplines; and tofacilitate closer connections among students, faculty, andcase managers. In some learning community programs,courses are fully integrated under a single theme. At theother extreme, courses may be block-scheduled, with littleintegration. The Kingsborough program fell between theseapproaches, with the two linked courses remaining separateand distinct, but being coordinated to varying degrees. Sur-veyed faculty participating in the program all reported thatthey gave at least some joint assignments with their partner,and most reported that they developed a grading schemetogether. Several English instructors reported that they as-signed novels or other readings that related to the subjectmatter of the content course; several teams assigned some ofthe same texts for both courses. Interviewed students ap-peared to both be aware of and appreciate the links betweentheir English and content courses. One student noted: “Itdoesn’t feel like you have different classes. It’s like it’s all
one class but different subjects. You can study easier. Usewhat you learned here [points to another place] here. It’slike a web, it’s all connected.”
Evaluating program effects
In order to determine program effects, students were ran-domly assigned to either receive or not receive the OpeningDoors program treatment. This assignment occurred justbefore students registered for classes. Random assignmentensures that the motivation levels and personal characteris-tics of students in the two groups were similar when theprogram began, so that any subsequent difference in out-comes can be attributed to the program. The study estimatesthe value added of Opening Doors, above and beyond whatstudents normally receive. Kingsborough offers a rich arrayof academic programs and services, so the bar is set rela-tively high for the program to surpass. Also, the studyexamines the effects of the entire package of OpeningDoors services, not the individual effects of each compo-nent.
An implementation study found that, despite a compressedplanning period and the program’s large scale, all of the keyfeatures of Opening Doors were put into practice. The pro-gram received strong, consistent support form the highestlevels of the college administration, and many faculty, stu-dents, and administrators expressed positive views aboutthe program. All of the learning communities had the samebasic structure, but they varied in their content, class size,and in the degree to which faculty worked together andintegrated their courses. Thus, while this study is a strongtest of the structural features of a learning community, andKingsborough’s program appears to be at least as strong as,if not stronger than, the “typical” community college learn-ing communities program, the study may not fully test theeffects of tightly integrating course curricula.
Characteristics of the research sample
Table 1 shows some characteristics of the sample mem-bers based on a questionnaire completed just prior torandom assignment. The research sample, like the popu-lation of Brooklyn, is racially and ethnically diverse.Reflecting the makeup of the college’s entering full-timefreshmen, the sample members were quite young whenthey entered the study. Very few of the Kingsboroughsample members were married or had children (notshown). Most of the sample members had received theirhigh school diploma or General Education Development(GED) certificate during the past year. Most reported thattheir main reason for enrolling in college was either toobtain an associate’s degree or to transfer to a four-yearinstitution. Almost half of the sample members reportedspeaking a language other than English at home—thesame proportion as in Brooklyn overall. Almost three-fourths of the sample members reported that either theyor at least one of their parents was born outside theUnited States.

10
Students at Kingsborough are required to take CUNY skills-assessment tests prior to beginning classes. Three-fourths ofthe study’s sample members passed the reading test, butonly 29 percent passed the writing test, and 29 percentpassed both tests. Only those who passed both assessmenttests could avoid developmental-level English. Of the 40learning communities that operated during the study period,31 included a developmental English course, and the other 9included a credit-bearing freshman English course.
Educational outcomes
Table 2 shows some of the ways that the learning com-munities program directly affected students during theirfirst semester.11 Many higher education experts believethat students’ academic and social experiences duringthat first semester play a substantial role in their futuresuccess—that students who develop strong initial con-nections with the material they study, with other stu-dents, and with faculty are more likely to persist in col-
lege than students who do not. Also, those who makebetter progress in meeting their developmental require-ments may be more motivated to stay in school.
The program improved students’ experiences in college
When surveyed approximately a year after entering thestudy, students in the program group reported that theywere more engaged with their coursework, instructors,and fellow students and had a stronger sense of belong-ing than did control group students. They were morelikely to say that their courses required critical thinkingand that they had acquired valuable academic and workskills. Finally, they were more likely to rate their collegeexperience as “good” or “excellent.” These findingsstrongly suggest that the learning community programprovided a markedly different experience for students.
The program improved several educational outcomes
Figure 2 illustrates some key outcomes during the pro-gram semester, the first semester that each student was inthe study. Students in the program group attempted andpassed about half a course more at Kingsborough duringtheir first semester than control group students did,though this positive effect diminished in later semesters.They also earned almost one more “developmentalcredit.” Developmental courses do not earn collegecredit, but they do count in determining whether a stu-dent is attending school full time. Program group mem-
Table 1Selected Characteristics of Sample Members at Baseline
Percentage ofCharacteristic Full Sample
GenderMale 45%Female 55
Age17–18 years old 4519–20 years old 3421–34 years old 21
Race/ethnicityHispanic/Latino 20Black, non-Hispanic 38White, non-Hispanic 27Asian or Pacific Islander 9Other 6
Diplomas/degrees earnedHigh school diploma 71General Educational Development (GED) certificate 29Occupational/technical certificate 2
Date of high school graduation/GED receiptDuring the past year 70Between 1 and 5 years ago 23More than 5 years ago 7
Main reason for enrolling in collegeTo complete a certificate program 3To obtain an associate’s degree 30To transfer to a 4-year college/university 50To obtain/update job skills 11Other 8
First person in family to attend college 33
Language other than English spoken regularly in home 47
Respondent or respondent’s parent(s) born outside U.S. 74
Source: MDRC calculations using baseline information form data.
Table 2Classroom and College Experiences of Sample Members
Program ControlOutcome Group Group Difference
Integration and sense ofbelonging at school
Low 11% 17% -6%***High 16 13 3
Participation andengagement
Low 15 22 -7***High 18 12 6**
Using knowledge(critical thinking curriculum)
Low 12 18 -6***High 24 22 2
Acquired academic andwork skills
Low 13 18 -6**High 21 16 5**
Rated college experiencegood or excellent 83 76 7***
Source: MDRC calculations from the Opening Doors 12-MonthSurvey.
Notes: A two-tailed t-test was applied to difference between re-search groups. Statistical significance levels are indicated as *** =1 percent; ** = 5 percent; * = 10 percent. Rounding may causeslight discrepancies in differences.

11
bers were also more likely to pass all their courses duringthe first semester (not shown).
Students moved more quickly through developmentalEnglish requirements
A goal of the program was to help students more quicklycomplete developmental requirements and progress tocollege-level English. To enroll in the college-levelcourse at Kingsborough, students who were placed indevelopmental courses must successfully complete themand then retake and pass reading and writing skills as-sessment tests. Figure 3 shows the proportion of the tworesearch groups who took the tests during their first threesemesters in the study and passed the tests by the end ofthat period (including students who passed the tests be-fore starting their freshman year). The program increasedthe proportion of students who attempted and passed thetests. Although not illustrated in the figure, most of theseimpacts are driven by effects in the first (program) se-mester. It is notable, however, that the control groupmembers had not “caught up” in their test-taking andpassing by the end of the follow-up period.
We also examined progression through English coursesfor different subgroups of the research sample. Among
the subset of the sample who failed both English skillsassessment tests before starting their freshman year, pro-gram group members were more likely than their controlgroup counterparts to enroll in developmental Englishduring their first two semesters. Program group memberswho failed one of the tests before entering college werealso more likely to enroll in developmental English dur-ing their first semester and were more likely to enroll inand pass college-level English during their first two se-mesters. The program did not affect progression throughEnglish courses among students who had passed bothEnglish assessment tests before starting their freshmanyear.
Evidence is mixed about whether the program increasesstudent persistence in college
A central goal of all Opening Doors programs is to in-crease persistence in college. Initially, Kingsborough’sprogram did not change the rate at which students re-enrolled in subsequent semesters. In the last semester ofthe two-year follow-up period, however, a differenceemerged: 53 percent of the program group registered forat least one course that semester at Kingsborough, com-pared with 48 percent of the control group. Data from theNational Student Clearinghouse, which provides enroll-
0
1
2
3
4
5
6
7
8
9
Courses Attempted Courses Passed Regular Credits Earned Developmental CreditsEarned
Nu
mb
er
of
Co
urs
es o
r C
red
its
Program Group Control Group
***
******
Figure 2. Educational outcomes during the program semester.
Source: MDRC calculations from Kingsborough Community College transcript data.
Note: A two-tailed t-test was applied to difference between research groups. Statistical significance levels are indicated as *** = 1 percent; ** = 5percent; * = 10 percent.

12
ment information at most colleges in the nation, shows asimilar effect on persistence emerging in the third post-program semester.
What are the implications of the results?
Opening Doors Learning Communities at Kingsboroughsubstantially improved students’ experiences in college andsome key educational outcomes while they were in theprogram, but, for the most part, the effects did not persist.We plan to track sample members’ outcomes for at leastthree years after their random assignment to the study todetermine the longer-term effects on their academic perfor-mance, persistence, and graduation as well as on their lateremployment rates and earnings. Thus, the results in thisarticle are not the last word on Kingsborough’s program.The findings do indicate, however, that the learning com-munity model shows promise as a strategy to help studentsmove through developmental education.
Kingsborough’s program lasted one semester. Thecollege’s administrators decided that there was no practi-cal way to maintain the linked-course structure after the
first semester, since students needed and wanted to take avariety of different courses in subsequent semesters.Also, the program was designed on the assumption thatstudents’ early experiences at college influence theirlater success, and administrators believed that studentsshould transition into the regular college community asquickly as possible.
The question of how long a learning community programshould continue is complicated. Still, the results from theKingsborough study suggest that participating in a learn-ing community program for more than one semester mayyield more substantial effects, since the positive effectson academic outcomes were the largest during the firstsemester. If the options of a multiple-semester learningcommunity or participating in a different learning com-munity after the first semester are not possible, collegescould offer other kinds of enhanced services in latersemesters, such as intensive counseling or more financialsupport. It is worth noting that, in some of the other sitesin the Opening Doors demonstration, the early resultsfollow a similar pattern: effects are largest when studentsreceive enhanced services, and they diminish or evendisappear after the services end.
0
10
20
30
40
50
60
70
80
90
100
AttemptedReading Test
Passed ReadingTest
Attempted WritingTest
Passed WritingTest
Attempted eitherEnglish Skills
Assessment Test
Passed bothEnglish Skills
Assessment Tests
Pe
rce
nta
ge
Program Group Control Group
***
*
***
**
***
*
Figure 3. Effects on developmental requirements.
Source: MDRC calculations from City University of New York skills assessment test data.
Notes: Outcomes include data from the program semester through the second postprogram semester. A two-tailed t-test was applied to differencebetween research groups. Statistical significance levels are indicated as *** = 1 percent; ** = 5 percent; * = 10 percent.

13
The study at Kingsborough uses a specific programmodel, targeted to a certain group of students, in a par-ticular setting. Other learning community models, targetgroups, and institutional settings may well lead to differ-ent results. Another rigorous study, the Learning Com-munities demonstration, was launched in 2006 and isusing random assignment to test the effects of learningcommunities in six colleges.12 �
1College Board, Winning The Skills Race and StrengtheningAmerica’s Middle Class: An Action Agenda for Community Colleges,Report of the National Commission on Community Colleges, CollegeBoard, Center for Innovative Thought, New York, NY, 2008.
2American Association of Community Colleges, “CC STATS,” ac-cessed May 6, 2008, at http://www2.aacc.nche.edu/research/index.htm,.
3L. Horn and S. Nevill, “Profile of Undergraduates in U.S.Postsecondary Education Institutions: 2003–2004. With a SpecialAnalysis of Community College Students,” U.S. Department of Edu-cation, Institute of Education Sciences, National Center for Educa-tion Statistics, 2006.
4U.S. Department of Education, National Center for Education Statis-tics, “Descriptive Summary of 1995–96 Beginning PostsecondaryStudents: Six Years Later,” 2002.
5S. Scrivener, D. Bloom, A. LeBlanc, C. Paxson, C. E. Rouse, and C.Sommo with J. Au, J. J. Teres, and S. Yeh, A Good Start: Two-YearEffects of a Freshmen Learning Community Program atKingsborough Community College, MDRC, New York, NY, 2008.The full report can be found at http:/ /www.mdrc.org/project_31_2.html. The evaluation of the Opening Doors programs isbeing conducted by MDRC, a group of scholars who are part of theMacArthur Foundation-funded Research Network on Transitions toAdulthood, and an expert on the relationship between education andhealth to Princeton University.
6For more information on the focus groups, see L. Matus-Grossmanand S. Gooden with M. Wavelet, M. Diaz, and R. Seupersad, OpeningDoors: Students’ Perspectives on Juggling Work, Family, and Col-lege, MDRC, New York, NY, 2002.
7B. O. Barefoot, Second National Survey of First-Year AcademicPractices, Policy Center on the First Year of College, Brevard, NC,2002.
8K. Taylor with W. Moore, J. MacGregor, and J. Lindblad, LearningCommunity Research and Assessment: What We Know Now, NationalLearning Communities Project Monograph Series, Evergreen StateCollege, Washington Center for Improving the Quality of Under-graduate Education, in cooperation with the American Associationfor Higher Education, Olympia, WA, 2003.
9ESL students were excluded from the study, as they already had alearning communities program. Students in the four “career majors”for whom a separate learning community operated were also excludedfrom the first year of the study.
10“Penny Pinching 101: Hard Up for Cash, Students Skimp on Text-books,” Community College Week Volume 15, No. 14, February 17,2003.
11This article presents effects for the full research sample atKingsborough (1, 534 students) for up to two years after studentsentered the study.
12The demonstration is part of the National Center for PostsecondaryResearch, funded by the U.S. Department of Education.
FOCUS is a Newsletter put out up to three times a year bythe
Institute for Research on Poverty1180 Observatory Drive3412 Social Science BuildingUniversity of WisconsinMadison, Wisconsin 53706(608) 262-6358Fax (608) 265-3119
The Institute is a nonprofit, nonpartisan, university-based research center. As such it takes no stand on publicpolicy issues. Any opinions expressed in its publicationsare those of the authors and not of the Institute.
The purpose of Focus is to provide coverage of poverty-related research, events, and issues, and to acquaint alarge audience with the work of the Institute by means ofshort essays on selected pieces of research. Full texts ofDiscussion Papers and Special Reports are available onthe IRP Web site.
Focus is free of charge, although contributions to the UWFoundation–IRP Fund sent to the above address in sup-port of Focus are encouraged.
Edited by Emma Caspar.
Copyright © 2008 by the Regents of the University ofWisconsin System on behalf of the Institute for Researchon Poverty. All rights reserved.

14
Postdoctoral Fellowships, 2009–2011
The National Poverty Center’s Research and Training Program on Poverty and Public Policy at theGerald R. Ford School of Public Policy, University of Michigan, offers one- and two-year postdoctoralfellowships to American scholars who are members of groups that are underrepresented in the socialsciences (e.g. members of racial and ethnic minority groups, individuals from socio-economicallydisadvantaged backgrounds, etc.).
Fellows will conduct their own research on a poverty-related topic under the direction of SheldonDanziger, Henry J. Meyer Distinguished University Professor of Public Policy and Director, NationalPoverty Center. Funds are provided by the Ford Foundation.
Applicants must have completed their Ph.D.s by August 31, 2009. Preference is given to those whohave received their degree after 2003. Application deadline is January 19, 2009.
Contact: Program on Poverty and Public Policy, Gerald R. Ford School of Public Policy, 735 South StateSt., University of Michigan, Ann Arbor, MI 48109.
Applications can be downloaded from:http://fordschool.umich.edu/research/poverty/fellowship_opps.php
The Oxford Handbook of Economic Inequality
Edited by Wiemer Salverda, Brian Nolan, and Timothy M. Smeeding
The Oxford Handbook of Economic Inequality presents a new and challenging analysis of economicinequality, focusing primarily on highly developed countries. Bringing together some of the world’s topscholars, this comprehensive and authoritative volume contains an array of original research on topicsranging from gender to happiness, from poverty to highest incomes, and from employers to the welfarestate. The authors give their view on the state-of-the-art of scientific research in their fields of expertiseand add their own visions of future research.
Part 1: Inequality: Overview, Concepts and MeasurementPart 2: The Extent of InequalityPart 3: Earnings InequalityPart 4: Dimensions of InequalityPart 5: The Dynamics of InequalityPart 6: Global Perspectives on InequalityPart 7: Can Inequalities be Changed?
Oxford University Press, forthcoming February 2009, 848 pp.http://www.oup.com/uk/catalogue/

15
A primer on U.S. welfare reform
terms of expenditure. The Earned Income Tax Credit(EITC) program, an earnings subsidy program, whichprovides tax credits to low-income families with earn-ings, is third largest. The Food Stamp program, whichprovides food coupons to the poor, and programs forsubsidized housing for the poor are fourth and fifth,respectively. The TANF program is, as the table shows,only the sixth largest program in the United States interms of expenditure, and only half as much is spent on itas is spent on the fifth largest program. TANF’s caseloadis also small, although because it provides a cash benefitfor all needs and not just a supplemental payment likeFood Stamps and the EITC, its expenditure per recipientis larger than that of those two programs.
Robert Moffitt
Robert Moffitt is Kreiger-Eisenhower Professor of Eco-nomics at Johns Hopkins University and an IRP affiliate.
The most well-known transfer program for the poor inthe United States provides cash support to low-incomefamilies with children, most of which are headed by asingle mother. Called the “Aid to Families with Depen-dent Children (AFDC)” program prior to 1996 and the“Temporary Assistance to Needy Families (TANF)” pro-gram thereafter, it underwent a major structural reform inthat year. The unprecedented reform imposed credibleand enforceable work requirements for the first time inthe history of the program, requirements which wereextended to a large fraction of the caseload and wereenforced by the use of sanctions that reduced or elimi-nated benefits for noncompliance. The reform also im-posed lifetime time limits on the receipt of benefits.
Following the reform, the program caseload fell dramati-cally and employment rates of single mothers rose, as didaverage earnings and family income among the single-mother population. Poverty rates of single mothers fell.The often dire warnings of large-scale deprivation whichwere made at the time of the reform did not materialize,although there is some evidence that a small fraction ofthe single-mother population was made worse off by thereform. This article will review the U.S. experience andassess the origins and effects of the 1996 reform.1
Context: The U.S. system of means-testedtransfers
The TANF program is only a small component in thelarger system of means-tested transfer programs in theUnited States today. Table 1 shows the expenditures andcaseloads for the nine largest such programs in 2004. Thelargest by far is the Medicaid program, which provideshealth care to low-income families (it is separate fromthe Medicare program, the social insurance program thatprovides medical care to the elderly regardless of incomelevel). The Medicaid program provides medical care notonly to poor families, including those single motherswho are on TANF, but also to the poor elderly and thedisabled, who account for a much larger fraction of pro-gram expenditures than single mothers. The Supplemen-tal Security Income (SSI) program, which provides cashbenefits to low-income aged, blind, and disabled adultsand children, is much smaller but still quite sizable in
Table 1Annual Expenditures and Caseloads of Nine Large Programs,
FY 2004(Current dollars)
Expenditures Caseloads Expenditures(millions) (thousands) per Recipient
Medicaid $300,300 56,100 $5,353
Supplemental SecurityIncome (SSI) 39,839 7,139 5,581
Earned Income TaxCredit (EITC) 34,012a 19,163b 1,775
Food Stamps 30,993 24,900 1,245
Subsidized Housingc 29,844 4,576d 6,522
Temporary Assistanceto Needy Families(TANF) 14,067 4,746 2,964
Child Care 11,854e 1,743f 6,801
Head Start 8,469 906 9,348
Jobs and Training 7,007 1,175g 6,645g
Source: K. Spar, “Cash and Noncash Benefits for Persons with Lim-ited Income: Eligibility Rules, Recipient and Expenditure Data,FY2002–FY2004,” Congressional Research Service, Washington,DC, 2006, Table 14.
Notes: Federal and state and local spending combined unless other-wise noted.
aRefundable portion only.bNumber of tax units.cSection 8 and public housing, federal only.dNumber of dwelling units.eChild care and development block grant (CCDBG) and TANF childcare.fCCDBG only.gFY 2002.
Focus Vol. 26, No. 1, Summer-Fall 2008

16
The U.S. welfare reforms of the 1990s reduced expendi-tures and caseloads in the AFDC and TANF programs.However, many of the other programs listed in Table 1have grown. Figure 1 shows trends in real total expendi-tures since 1968 in the eighty largest means-tested pro-grams in the United States, revealing that per-capita ex-penditure in total is higher today than ever in its history.The spurt in real expenditure growth in the late 1960sand early 1970s was the result of growth in AFDC, FoodStamp, and Medicaid expenditures, but this was followedby a decade (approximately 1978–1988) of flat expendi-ture growth. However, the period of flat growth wasfollowed by an explosion in expenditure that occurredmore rapidly—in the space of six years, from 1990 to1996—and which was the result of large increases inspending on the EITC, SSI, and Medicaid. Expenditurerose again after 2001 as a result of growth in the Medic-aid and Food Stamp programs. Thus, the decline of theAFDC-TANF program is not representative of means-tested-transfer reduction in the society as a whole, but itdoes represent a shift in the groups to whom expenditureis directed and in the type of benefits provided. Specifi-cally, expenditure growth has been directed more towardspecific groups of individuals (the aged, disabled, work-
ers) and toward discrete needs (food, medical care, hous-ing) rather than general support.
So why does the TANF program continue to receive somuch attention given its current minor status? First, TANFremains the only general-purpose cash transfer program inthe United States and thus most closely fits the public imageof “welfare” as well as the policy and academic notion of anegative income tax. Second, reforms in the TANF programhave been the most prominent in reflecting U.S. society’sincreasing emphasis on work, and it therefore has consider-able symbolic value. Third, it is still an important programfor a particular group—low-income single mothers—whohave difficulty working.
The AFDC program and 1996 welfare reform
In 1935, the Social Security Act created the AFDC pro-gram along with the Old-Age Social Security and Unem-ployment Insurance programs.2 AFDC provided cash fi-nancial support to low-income families with “dependent”children, defined as those who were deprived of thesupport or care of one biological parent by reason of
0
500
1,000
1,500
2,000
2,500
1965 1970 1975 1980 1985 1990 1995 2000 2005
Year
Exp
en
ditu
res (
FY
20
04
do
llars
)
State and Local Federal Total
Figure 1. Real per capita expenditures on means-tested transfers, 1968–2004.
Sources: K. Spar, “Cash and Noncash Benefits for Persons with Limited Income: Eligibility Rules, Recipient and Expenditure Data, FY2002–FY2004,” Congressional Research Service, Washington, DC, 2006, Tables 3 and 4; and U.S. Department of Commerce, Statistical Abstract of theUnited States, U.S. Census Bureau, Washington, DC, 2006, Table 2, Population.
17
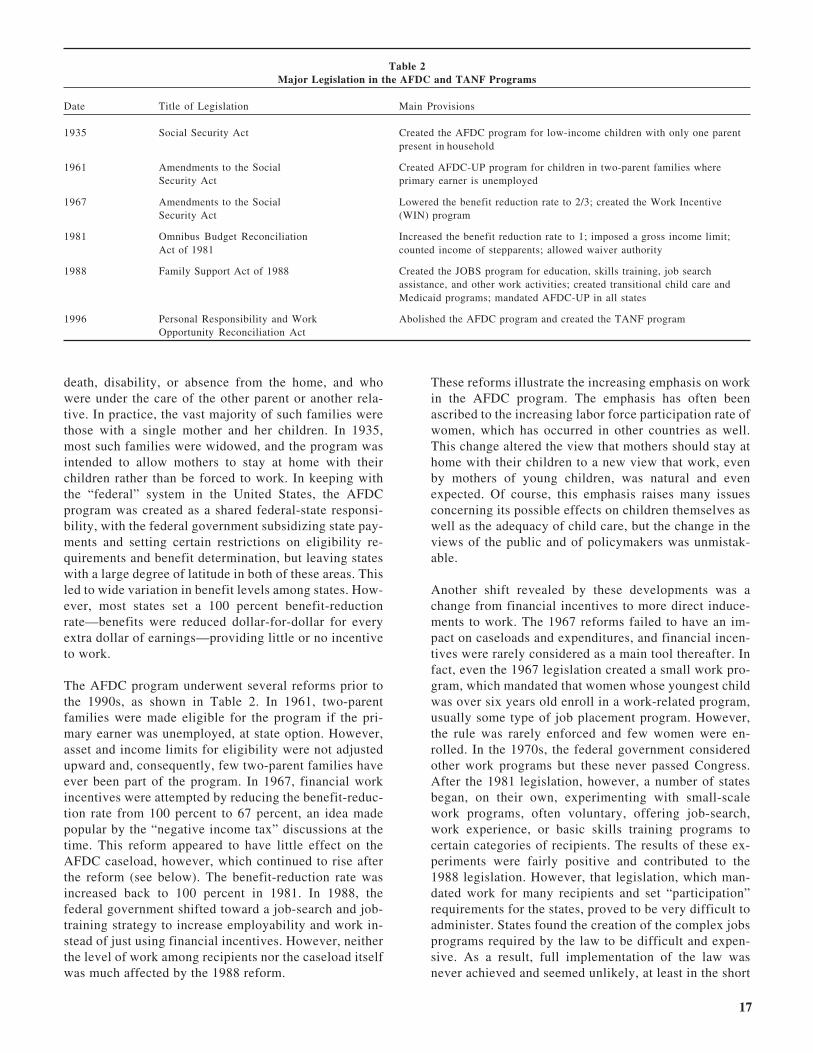
death, disability, or absence from the home, and whowere under the care of the other parent or another rela-tive. In practice, the vast majority of such families werethose with a single mother and her children. In 1935,most such families were widowed, and the program wasintended to allow mothers to stay at home with theirchildren rather than be forced to work. In keeping withthe “federal” system in the United States, the AFDCprogram was created as a shared federal-state responsi-bility, with the federal government subsidizing state pay-ments and setting certain restrictions on eligibility re-quirements and benefit determination, but leaving stateswith a large degree of latitude in both of these areas. Thisled to wide variation in benefit levels among states. How-ever, most states set a 100 percent benefit-reductionrate—benefits were reduced dollar-for-dollar for everyextra dollar of earnings—providing little or no incentiveto work.
The AFDC program underwent several reforms prior tothe 1990s, as shown in Table 2. In 1961, two-parentfamilies were made eligible for the program if the pri-mary earner was unemployed, at state option. However,asset and income limits for eligibility were not adjustedupward and, consequently, few two-parent families haveever been part of the program. In 1967, financial workincentives were attempted by reducing the benefit-reduc-tion rate from 100 percent to 67 percent, an idea madepopular by the “negative income tax” discussions at thetime. This reform appeared to have little effect on theAFDC caseload, however, which continued to rise afterthe reform (see below). The benefit-reduction rate wasincreased back to 100 percent in 1981. In 1988, thefederal government shifted toward a job-search and job-training strategy to increase employability and work in-stead of just using financial incentives. However, neitherthe level of work among recipients nor the caseload itselfwas much affected by the 1988 reform.
These reforms illustrate the increasing emphasis on workin the AFDC program. The emphasis has often beenascribed to the increasing labor force participation rate ofwomen, which has occurred in other countries as well.This change altered the view that mothers should stay athome with their children to a new view that work, evenby mothers of young children, was natural and evenexpected. Of course, this emphasis raises many issuesconcerning its possible effects on children themselves aswell as the adequacy of child care, but the change in theviews of the public and of policymakers was unmistak-able.
Another shift revealed by these developments was achange from financial incentives to more direct induce-ments to work. The 1967 reforms failed to have an im-pact on caseloads and expenditures, and financial incen-tives were rarely considered as a main tool thereafter. Infact, even the 1967 legislation created a small work pro-gram, which mandated that women whose youngest childwas over six years old enroll in a work-related program,usually some type of job placement program. However,the rule was rarely enforced and few women were en-rolled. In the 1970s, the federal government consideredother work programs but these never passed Congress.After the 1981 legislation, however, a number of statesbegan, on their own, experimenting with small-scalework programs, often voluntary, offering job-search,work experience, or basic skills training programs tocertain categories of recipients. The results of these ex-periments were fairly positive and contributed to the1988 legislation. However, that legislation, which man-dated work for many recipients and set “participation”requirements for the states, proved to be very difficult toadminister. States found the creation of the complex jobsprograms required by the law to be difficult and expen-sive. As a result, full implementation of the law wasnever achieved and seemed unlikely, at least in the short
Table 2Major Legislation in the AFDC and TANF Programs
Date Title of Legislation Main Provisions
1935 Social Security Act Created the AFDC program for low-income children with only one parentpresent in household
1961 Amendments to the Social Created AFDC-UP program for children in two-parent families whereSecurity Act primary earner is unemployed
1967 Amendments to the Social Lowered the benefit reduction rate to 2/3; created the Work IncentiveSecurity Act (WIN) program
1981 Omnibus Budget Reconciliation Increased the benefit reduction rate to 1; imposed a gross income limit;Act of 1981 counted income of stepparents; allowed waiver authority
1988 Family Support Act of 1988 Created the JOBS program for education, skills training, job searchassistance, and other work activities; created transitional child care andMedicaid programs; mandated AFDC-UP in all states
1996 Personal Responsibility and Work Abolished the AFDC program and created the TANF programOpportunity Reconciliation Act

18
run, to reduce caseloads and expenditures. The 1988legislation was widely regarded as a failure.
The course of program expenditures and caseloads up tothe early 1990s is illustrated in Figure 2. Both expendi-tures and caseloads rose sharply in the early 1970s for avariety of reasons, including an increase in take-upamong eligibles as welfare stigma fell, as well as thesuperior access to Food Stamp and Medicaid benefits forwomen on AFDC. The 1981 legislation had no discern-ible impact. Both caseloads and expenditures rosesharply in the late 1980s, an event mostly the result of arecession but which surely made implementation and thesuccess of the 1988 legislation more difficult. Thus, by1990, policymakers saw that a number of reform effortshad been attempted over the previous two decades, bothfinancial incentives and more direct work programs, withlittle success in reducing caseloads or expenditures. Inaddition, the evaluation literature indicated that the in-comes or employment rates of low-income single moth-ers were not significantly increased by the reforms.
The 1990s and TANF
Early in the 1990s, in response to the lack of effective-ness of prior reforms, individual states began experi-
menting with quite different types of reforms. An in-creased emphasis on work requirements was the mostimportant single new element. Education and trainingwere generally ruled ineligible to meet the requirements,instead emphasizing work. Government jobs were alsonot generally provided—the rules stipulated that work ina private sector job was necessary. Often an initial periodof job search was allowed, but that had to be followed byactual work. To enforce these requirements, states alsobegan imposing “sanctions”—defined as temporary orpermanent withdrawal of benefits—on recipients for fail-ure to comply with work and other requirements. Al-though such sanctions had been present in some formpreviously in the AFDC program, they had never been asaggressively enforced.
Several other features were often introduced into thestate reforms: (1) a negative-income-tax-like reductionof marginal tax rates on earnings to provide financialincentives to work; (2) time limits on benefits, stipulat-ing that recipients could not receive benefits for morethan a certain number of years, at least within a givencalendar period; and (3) the imposition of family caps,which specified that AFDC recipients would not receivehigher benefits if they had additional children while onAFDC.
0
5
10
15
20
25
1970
1971
1972
1973
1974
1975
1976
1977
1978
1979
1980
1981
1982
1983
1984
1985
1986
1987
1988
1989
1990
1991
1992
1993
1994
1995
1996
1997
1998
1999
2000
2001
2002
2003
2004
Year
Ca
se
loa
d P
er
Th
ou
sa
nd
Po
pu
latio
n
$0
$20
$40
$60
$80
$100
$120
$140
$160
Per Capita Caseload Real 2004 Per Capita Expenditure on AFDC/TANF ($)
Figure 2. Per capita AFDC-TANF caseload and expenditure, 1970–2004.
Sources: U.S. Department of Health and Human Services, “Indicators of Welfare Dependence,” Annual Report to Congress, Appendix A, TableTANF4, Washington, DC: Office of the Assistant Secretary for Planning and Evaluation, 2006; and U.S. Department of Commerce, Statistical Ab-stract of the United States, U.S. Census Bureau, Washington, DC, 2006, Table 2, Population.

19
Congress subsequently took action in 1996 by enacting thePersonal Responsibility and Work Opportunity Reconcilia-tion Act (PRWORA), which simultaneously reduced fed-eral authority over the program but also mandated many(but not all) of the popular state-level features. Table 3summarizes the differences between AFDC and TANF. ThePRWORA legislation converted the previous matchinggrant to a block grant and removed much of the federalregulatory authority over the design of the program. Thusstates were free to set their benefit levels, as before, but alsothe tax rate, income limits, asset requirements, and even the
form of assistance (cash or in-kind services). The last provi-sion is important because it allows states to use TANFdollars to support child care, job search, social services, andother types of expenditures; there are no requirements onhow much or little must be spent on cash aid directly. Inaddition, no federal definition of who is to be included inthe assistance unit was imposed; the AFDC-UP programwas abolished and states were able to cover two-parentfamilies at their discretion. In addition, and importantly, theentitlement nature of the program was ended and stateswere not required to serve all eligibles.
Table 3Comparison of the AFDC and TANF Programs
Item AFDC TANF
Financing Matching grant Block grant
Eligibility Children deprived of support of one Children in low-income families as designated by state; AFDC-UPparent or children in low-income abolished. Minor mothers must live with parents; minor mothers must alsotwo-parent families (AFDC-UP) attend school
Immigrants Illegal aliens ineligible Aliens ineligible for five years after entry and longer at state option
Form of Aid Almost exclusively cash payment States free to use funds for services and noncash benefits
Benefit Levels At state option Same
Entitlement Status Federal government required to pay No individual entitlementmatched share of all recipients
Income Limits Family income cannot exceed gross No provisionincome limits
Asset Limits Federal limits No provision
Treatment of Earnings After 4 months of work, only a lump No provisionDisregards sum $90 deduction plus child care
expenses; and nothing after 12 months
Time Limits None Federal funds cannot be used for payments to adults for more than 60months lifetime (20 percent of caseload exempt)
JOBS Program States must offer a program that meets JOBS program abolishedfederal law
Work Requirements Parents without a child under 3 required Exemptions from work requirements are narrowed and types of qualifiedto participate in JOBS activities are narrowed and prespecified (generally excludes education and
classroom training) and must be 20 hours/week rising to 30/week for singlemothers
Work Requirement JOBS participation requirements Participation for work requirements rise to 50 percent by FY 2002ParticipationRequirements
Child Care Guaranteed for all JOBS participants No guarantee but states are given increased child care funds
Sanctions General provisions Specific provisions mandating sanctions for failure to comply with workrequirements, child support enforcement, schooling attendance, and otheractivities
Child Support States required to allow first $50 of No provisionchild support received by mother tonot reduce benefit
Source: V. Burke, “New Welfare Law: Comparison of the New Block Grant Program with Aid to Families with Dependent Children,” Report No.96-720EPW, Congressional Research Service, Washington, DC, 1996.
Note: “No Provision” means that the law had no requirement of the type (e.g., no income limits and no asset limits).

20
At the same time, however, the law imposed new federalauthority in some specified areas. Federal funds were notto be used to pay adults for more than 60 months ofTANF benefits over their lifetimes, although states wereallowed an exemption from this requirement for 20 per-cent of their caseloads. Minors who had dependent chil-dren were required to stay in school and live with theirparents in order to receive federal TANF dollars. In addi-tion, while the 1988 JOBS program was abolished, newwork requirements were imposed that required that statesenroll significantly greater fractions of the caseload inthem (as many as 50 percent of single-mother recipientsand 90 percent of two-parent families were to comply)and which narrowed the list of exemptions from therequirements. Recipients involved in general educationand training could not be counted toward these participa-tion requirements, as in many of the prior state reforms.The hours of work per week required were also greatlyincreased—up to 30 hours per week for single mothersand more for two-parent families.3
The most dramatic departures from the AFDC programwere TANF’s time limit and work requirement provi-sions. Lifetime time limits were a new concept in U.S.transfer programs and were based on a quite differentphilosophy of the aims of public assistance than had beenthe case theretofore. States were allowed certain types ofexemptions from the time limits and were also allowed togrant temporary extensions to individual families, solong as the total number did not exceed 20 percent of thecaseload. The work requirements in the new legislationwere much stronger than in previous law and changed theorientation from education and training to work per se.The law also allowed states to impose sanctions on re-cipients for failure to comply with the work require-ments, sanctions which were much stronger than in pastlaw and which were rigorously enforced. The work em-phasis of the law was further reinforced by an increase inthe funds made available for child care.4
After the 1996 legislation, states moved forward vigor-ously to design TANF programs along the lines indicatedby the law and, in many cases, went beyond the minimumrequired. For example, many states imposed time limitsshorter than the five-year maximum required by the fed-eral law. Other states imposed sanctions on recipientsmuch stronger than those required. The states also em-braced work requirements and sanctions vigorously. Themost notable movement was toward a “Work First” ap-proach in which recipients and new applicants for ben-efits were moved as quickly as possible into work of anykind, with a de-emphasis on education and training.Again, many states imposed strong sanctions for failureto comply with these requirements, usually beginningwith an initial partial sanction at first noncompliance andthen graduating to a more severe, full sanction at subse-quent noncompliance. The work requirements were alsooften strengthened by frequent requirements for job
search and work registration at the point of applicationfor TANF benefits that had to be complied with beforebenefit receipt could begin. In addition, the majority ofstates lowered their benefit-reduction rates, usually toapproximately 50 percent.
The PRWORA legislation represented more than simply aredirection of the employment goal and an increased em-phasis on work. A new goal appeared, which was to reduce“dependency,” a term much used in public discussions,which is more or less defined as long-term receipt of wel-fare benefits. Such dependency was presumed by thePRWORA legislation to have deleterious effects on adultsand children, and its reduction became a goal in and ofitself. Another new goal of welfare reform in the 1990s wasto reduce the rate of nonmarital childbearing and to encour-age marriage. This goal was explicitly stated in the pre-amble to the PRWORA legislation but the law itself hadvery few provisions directly relating to it.
Effects of the reform
There was a large effort by the research community toevaluate the effects of the welfare reform in the few yearsfollowing 1996. This proved to be quite difficult becauseno evaluation plan was built into the legislation and itsprovisions were not tested prior to passage of the law.5 Ingeneral, four basic types of evaluation methodologieswere used.6 First, analysts examined simple time trendsin the outcomes of interest from before 1996 to after1996, to determine if a break in the trend occurred.7 Thismethod is complicated by the fact that other things, suchas the economy, may have been changing at the sametime. Second, a variation on this method comparedchanges in outcomes over time for the groups mostheavily affected by the reform—for example, less edu-cated or low-income single mothers—to those for groupsnot so affected by the reform but similar in some otherrespects—such as more educated or higher income singlemothers, married women, or women without children.8
Third, many studies made use of the fact that differentstates enacted different programs prior to 1996, allowinga comparison of outcomes for women in different statesas a measure of the effects of reform and allowing acontrol for the state of the local economy.9 These meth-ods are complicated by the fact that states differ in manyother respects that are often difficult to control for and bythe short windows of time allowed for the evaluation.Finally, there were a series of randomized experiments,all begun prior to 1996, which tested elements of thePRWORA legislation by a rigorous experimental-controlmethodology.10 A drawback to this method is that theprograms were not designed to replicate all features ofPRWORA and hence differed from them significantly inmost cases. Another limitation is that experiments, atleast those tested on welfare recipients, will always miss“entry” effects.

21
Another research question related to whether the goal ofassessing the effects of reform was to estimate the cumu-lative effect of all provisions of the law, or to assess theeffects of each component separately. It has proven diffi-cult to evaluate the effects of separate components be-cause, at least after 1996, all states implemented someform of the major components; thus no one of them wasintroduced while the others were not. Much of the knowl-edge of the effects of individual components arises fromthe period before 1996, when different states adopteddifferent policies, but the problem with this type ofanalysis is that many of the policies were quite differentfrom the later TANF versions. In principle, the fourthmethodology—randomized experiments—could be usedto assess the incremental effect of a given componentholding the others fixed. Most of the evidence on theeffects of individual components arises from experimen-tal studies, as discussed below.
Finally, there are a number of issues concerning theoutcomes of interest. A major set of outcomes of interestto policymakers and the public relate to the effect of thereform on individual levels of employment and earnings,and on total family income and rates of poverty. Anotherset of outcomes of interest to some groups were theeffects of the reform on child-bearing and marriage,while another set focuses on children—the effects onchild development, behavior, educational levels, and soon. However, it should also be noted that manypolicymakers regarded a reduction in the welfarecaseload, and in welfare expenditures, as an outcome ofinterest in its own right. In this view, even if employ-ment, earnings, income, and the other outcomes wereunaffected by the law, it could still be regarded as suc-cessful if it reduced the caseload because “dependency”had been reduced.
Findings
Several reviews of the research literature on the effectsof 1990s welfare reform in the United States have beenwritten.11 Here, a relatively short summary of the find-ings is provided.
The simplest method of assessing the effects of the re-form is to examine time-series trends in the outcomes ofinterest. For example, Figure 2 shows trends in AFDC-TANF expenditures and caseloads. These figures show adramatic reduction in both over the relevant period, withthe caseload dropping to levels in 2004 below even thosein the first year shown, 1970. This historically unprec-edented decline is one of the strongest pieces of evidencein support of a welfare reform effect. Two complicatingfactors must be stated, however. One is that the unem-ployment rate was falling at the same time and, indeed, itfell to historically low levels as well; this could havereduced the welfare caseload by itself. The other compli-
cating factor is that the decline in the caseload begansomewhat prior to 1996. Most analysts believe that thiswas partly the result of the state-level welfare reformsthat began in the early 1990s, but contributing factorscould have been the state of the economy as well asconcomitant expansions in the Earned Income TaxCredit.
Table 4 summarizes the findings from reviews of theliterature on the effects of welfare reform. The statisticalstudies of the effect of welfare reform on welfare use ingeneral almost all show that the reform reduced welfareuse. These studies control for the state of the economyand hence indicate that not all of the decline was a resultof changing economic conditions. The central tendencyof the findings suggests that caseloads fell by about 20percent and employment increased by about 4 percent.The studies all show some contribution of the economyto the caseload decreases and employment increases aswell, however, and many attempt to quantify the relativecontributions of welfare reform and the economy to thedecline in welfare use. The estimates range considerablybut some assign at least half of the decline to the effectsof an improved economy. Even if this is correct, it stillimplies a large effect of welfare reform.
The findings on employment and earnings confirm thetime-series evidence presented earlier, indicating consis-tently positive effects of welfare reform. About two-thirds of women who left welfare were employed in theimmediate period following reform, and many more wereemployed at some point over a longer period of one ortwo years.12 This was one of the most surprising results ofwelfare reform, as historical employment rates of womenon welfare had never exceeded 10 percent or 15 percent,and were usually less than 10 percent. The idea that two-thirds of these women were capable of working, or eventhat a selected portion of recipients (the more job-ready)were capable of working at these levels, was a majorsurprise and resulted in a fundamental change inpolicymakers’ views of the work ability of women onwelfare.
A high fraction of those who left welfare worked fulltime (defined as 35 hours per week or more), and hourlywage rates of those who worked were reasonably high.13
Another outcome of interest is whether there were in-creased earnings from individuals in the household otherthan the welfare recipient herself—for example, olderchildren, spouses or cohabitors, or other relatives. Theevidence has indicated considerably greater increases inthis form of earnings than expected.14 The general inter-pretation is that families that went off welfare increasedemployment of many family members in order to sustainfamily income.
Another issue of interest is whether welfare reform af-fects wage growth. Conventional wisdom is that the age-

22
earnings profiles of low-skilled workers are particularlyflat, perhaps because the types of jobs that low-skilledworkers hold have little human capital and training con-tent that would lead to increased earnings. This wouldsuggest that former welfare recipients would also haveslow wage growth after leaving welfare, and a number ofstudies support this suggestion.15 This has generated asource of considerable policy concern because it washoped that former recipients would gain experience inthe labor market, leading to increased wages, whichwould reduce the probability of coming back onto wel-fare in the future. However, the evidence is completelymixed on this issue, with a significant number of high-quality studies also showing that the returns to workexperience are just as high among low-skilled workersand single mothers as among other types of workers.16
The evidence on the effects of welfare reform on totalfamily income, and on poverty rates, is also very impor-tant. The general findings from the statistical studiessupport the poverty rate time trends mentioned earlier,showing that incomes of disadvantaged single-motherfamilies rose and poverty rates fell, relative to variouscomparison groups, in the years following welfare re-form.17 However, the studies have indicated that the largemajority of these income gains occurred among women
who did not enter welfare rather than among those wholeft welfare after reform. This implies that the gains fromwelfare reform were not evenly spread, having their larg-est effects on those low-income family wage-earnerswho already had some job skills, rather than the mostdisadvantaged. In addition, most studies indicated thatthe increased earnings that women obtained after leavingwelfare were either equal to the welfare benefits lost or abit below them. The reason that family incomes rosemodestly is because other family members increasedtheir earnings and because the families were able to se-cure more benefits from welfare programs other thanTANF. It is consequently unclear whether welfare reformworked because it “made work pay.” If “making workpay” means ensuring that earnings of a woman aregreater off welfare than her benefits on welfare, the evi-dence does not indicate a strong effect, if any.
It should be emphasized that these results concerningearnings after welfare are based on averages of allwomen leaving welfare, not just those who were em-ployed. The fact that 60 percent to 70 percent of formerwelfare recipients worked after leaving welfare necessar-ily implies that 30 percent to 40 percent did not.18 Thelatter group typically experienced a reduction in familyincome and, obviously, did not have earnings greater
Table 4Results of Research on the Overall Effects of U.S. Welfare Reform
Outcome Findings
Caseload (1) Most studies show negative effects, both pre-1996 and post-1996, although the improved economy ex-plains a significant portion of the caseload decline as well(2) A large fraction, if not the majority, of the effect arose from decreased entry to the program ratherthan increased exit(3) Those leaving welfare did so partly because of sanctions; those sanctioned were sometimes the moredisadvantaged families rather than the more advantaged(4) Those leaving welfare often lost access to other benefits and services
Employment (1) Most studies show positive net effects on employment rates(2) Women who left welfare had employment rates of approximately 60 percent to 70 percent(3) Employment rates of women on welfare rose from less than 10 percent to over 30 percent(4) Those who were not employed often had income from others in the family or from other transferprograms(5) A high fraction worked full time as well as part time
Earnings (1) Most studies show a positive net effect on earnings(2) Women who left welfare also showed increased earnings from others in the household(3) Hourly wage rates are above the official minimum wage(4) Mixed evidence on whether wages grow with experience after leaving welfare
Family Income and Poverty (1) Most studies show increases in average family income and declines in poverty rates(2) Women who left welfare had, on average, only small increases in income and declines in poverty;those who did not enter welfare experienced strong increases in income and declines in poverty(3) The incomes of women who left welfare rose little because the loss of benefits almost cancelled outthe increase in earnings and increase in other household members’ income(4) Some early studies showed a decline in income and increase in poverty among very low-incomesingle-mother families; this does not show up in consumption
Childbearing and Marriage Most studies show no discernible effect
Source: R. Blank, “Evaluating Welfare Reform in the United States,” Journal of Economic Literature 40 (December 2002): 1105–66; R. Moffitt,ed., Means-Tested Transfer Programs in the United States, (Chicago: University of Chicago Press, 2003); and J. Grogger and L. Karoly, WelfareReform: Effects of a Decade of Change (Cambridge, MA: Harvard University Press, 2005).
23
than their welfare benefits. Their reductions in incomewere lessened by increased other-family-member earn-ings and increased benefits from other programs, butthese did not offset the loss of welfare benefits. For thosewho were employed after leaving welfare, however,earnings were generally somewhat greater than the wel-fare benefits lost, although these families also supple-mented their incomes with other-family-member earn-ings. Thus, it may be that “work pays” if work can in factbe achieved, but that does not necessarily mean thatgoing off welfare pays, in general.
Another piece of information relevant to changes in fam-ily income subsequent to welfare reform is how take-uprates of those eligible for TANF on a financial basischanged. A large part of the reduction in the caseloadwas a result of decreases in the fraction of families thatreceive TANF despite being financially eligible. Partici-pation rates among financial eligibles dropped fromaround 80 percent in the early 1990s to 69 percent in1997, and further dropped to 42 percent by 2004.19 Thesereductions were no doubt a result of families that weresanctioned off welfare as well as eligible families thatchose not to apply for the program because of the newwork requirements or that attempted to apply and wererejected for failure to meet those requirements.
Some research on former welfare recipients examinedwhich other government programs they availed them-selves of after leaving welfare. These data are availableonly for selected states, but indicate a rather sparse set ofother government benefits were received.20 The mostcommonly received form of benefit was food stamps,which 33 percent to 74 percent of former-recipient fami-lies received. However, almost 100 percent of familiesreceived food stamps prior to leaving welfare becausesuch benefits were automatically granted to AFDC re-cipients, so there was a significant reduction in receiptafter leaving welfare.21 Between 7 percent and 20 percentof families received Supplemental Security Income (SSI)benefits, which are made available to families with aged,blind, or disabled adults and children. Between 4 percentand 8 percent received some form of Social Securityincome, often from the Social Security Disability Insur-ance program.
Finally, the evidence on the effects of welfare reform onfamily structure and marriage indicates weak effects, ifany. The proponents of the 1996 legislation hoped thatnonmarital fertility would fall and that marriage rateswould rise as a result of the reform. However, the 1996welfare reform had few provisions directly aimed at fer-tility and marriage, the main exception being optionalstate provisions for family caps. It is also the case thatincreasing earnings among women could work to de-crease marriage, inasmuch as it allows women to be moreeconomically independent. In any case, the results fromthe three surveys mentioned above show, overwhelm-ingly, either insignificant effects of welfare reform over-
all or of individual components on either fertility andmarriage, with rare exceptions, and even the specificstudies of the effects of family caps show weak effects atbest, based on the highest-quality studies.22 On the basisof these findings, it is generally agreed that if the govern-ment is to alter fertility and marriage patterns among thepoor, some other types of policies will be necessary.
Findings on componentsThe results summarized thus far pertain to the overalleffect of welfare reform and not to the effects of specificcomponents such as work requirements, sanctions, ortime limits.
From econometric studies, there is some evidence on atleast two policy components, sanctions and time limits.There have been a few studies of the effects of sanctions,showing them to have a negative effect on the size of thecaseload.23 There have been more econometric studies oftime limits, which have been shown to have a negativeeffect on the caseload and positive effect on employmentrates.24
A larger number of experiments tested the effects ofwork requirements or financial incentives (i.e., reduc-tions in marginal tax rates or increases in earnings sub-sidy rates), or, sometimes, both combined. Experimentsthat imposed work requirements—backed up by sanc-tions—but without financial incentives showed reduc-tions in welfare usage ranging from 3 percent to 12percent, increases in employment rates ranging from es-sentially zero to 15 percent, but no effects on familyincome.25 A much smaller number of experiments testedfinancial incentives essentially alone,26 the most well-known of which was the Minnesota Family InvestmentProgram.27 The “MFIP” program increased welfare usageby about 10 percent, had very little effect on employmentrates, but increased family income. The higher welfareusage rates occurred because negative-income-tax de-creases in a marginal tax rate keep more families onwelfare by allowing them to work at higher earningslevels than before, and the small effects on employmentoccurred because such a program raises the break-evenlevel of earnings (that is, the maximum level of earningsat which benefits can be received) and hence reducesemployment relative to families that leave welfare alto-gether. The positive effects on family income arise be-cause higher benefits are paid to everyone—there is nobenefit reduction for any family, in contrast to workrequirement programs.
A few experiments tested combined work requirementswith financial incentives, the most well-known againbeing the MFIP program, one variant of which requiredrecipients to work.28 Like the first MFIP program dis-cussed above, this program increased welfare usage andfamily income but had significant positive effects onemployment. This result shows that financial incentives

24
can be helpful in increasing employment even whenwork requirements are the major policy reform; the“pull” of financial rewards is an important supplement tothe “push” of mandatory work.
Another component issue that has been examined by ran-domized experiments is whether work requirements thatattempt to move welfare recipients into employment asquickly as possible have greater or smaller effects thanprograms that attempt some form of human-capital invest-ment through increased education or training rather thanimmediate employment.29 The evidence in the studies thathave been conducted on this question indicates that thehuman-capital investment approach does not dominate and,in fact, is often inferior to the Work First approach.30 Rapid-employment programs increase employment and reducewelfare usage quickly, whereas human-capital developmentprograms, which cost much more, have no greater employ-ment effects three years after the initiation of the reform.However, Hotz et al. argue that greater employment gainsfrom the human capital approach appear if a longer-termfollow-up is conducted.31 In any case, Bloom andMichalopoulos argue that the best approach is neither rapid-employment nor human capital for everyone, but rather amore nuanced approach that separates the caseload accord-ing to their needs, requiring rapid-employment for thosewith significant pre-existing job skills and a human-capitalstrategy for those with greater needs for skill improve-ment.32
Remaining and future issues
Most of the remaining and future welfare reform issuescurrently under discussion in the United States concernfine-tuning and modifications in the current reformrather than wholesale change. That the 1996 welfarereform was a success, in overall terms and on average, isalmost universally accepted by policy analysts and re-searchers.
One set of issues revolves around whether work shouldbe substantially increased among women remaining onwelfare or whether the remaining caseload should bethought of as predominantly composed of women whohave great difficulties with working because of a varietyof health, education, and family problems. These ques-tions have not been resolved in any clear way. There iswidespread sentiment that increased assistance of twotypes is needed for the approximately 40 percent offormer welfare recipients who are not working and theapproximately 20 percent of all low-income single moth-ers who are not working and not on welfare. One isincreased work supports in the form of better child careand some type of human-capital strategy. A second typeof assistance is increased support of non-employment-related services to address the health, substance abuse,and family and child issues of this population. Blank hasproposed that states set up new programs designed spe-
cifically for those who have special difficulties with find-ing employment and that a variety of both employment-related and non-employment-related services be pro-vided for such families.33
The concern with providing further assistance to thoseoff welfare who have either employment or non-employ-ment-related problems goes to the heart of the 1996 wel-fare reform: that reform could be viewed as having re-moved the “safety net” for most families by no longerguaranteeing them financial support should their in-comes fall below stipulated levels. While the removal ofthis safety net appears to have had positive effects onmany single mothers by inducing them to work and pro-vide support to their families without the help of welfare,some have not been so successful and are in need ofcontinued assistance. Because they are off welfare, how-ever, providing this assistance is difficult.
An issue that still remains is the effect of time limits.Evidence to date suggests that approximately 25,000families hit a time limit by early 2002, and since thenabout 3,000 families have hit their limits each year.34
These are relatively small numbers compared to the sizeof the caseload, at least since 2002. As a consequence,most analysts believe that time limits have had much lesseffect than anticipated (although it should be reempha-sized that many more women may have left welfare inanticipation of hitting the limit).
Finally, another overarching issue is the relative lack ofprograms and services made available to unskilledprime-age males, both married and unmarried. Mosttransfer programs exclude them, with the exception ofthe EITC for those with dependents, and food stamps area major exception that provides universal support. ButMedicaid, SSI, housing, and child care are not well tar-geted on this group, and TANF provides little support tolow-income married men. Training programs, while im-portant, are too small in scale to make much of a differ-ence. This is a group that many believe is largely ne-glected by the current system, yet has major employmentproblems, which are not being adequately addressed. �
1This article draws from a paper prepared for the Economic Councilof Sweden conference “From Welfare to Work,” Stockholm, May 7,2007.
2A more detailed discussion of the AFDC program’s history can befound in R. Moffitt, ed., Means-Tested Transfer Programs in theUnited States (Chicago: University of Chicago Press, 2003), uponwhich this section partly draws.
3The law imposed specific penalties on the states for not complyingwith these mandated provisions. These penalties took the form ofpercentage reductions in the block grant allocation for each type ofviolation. The work participation requirements were considerablyameliorated by another provision of the law which reduced thoserequirements in proportion to the amount of caseload reduction astate experienced. Because caseloads fell dramatically after the re-form, the participation requirements were greatly reduced as well.

25
4However, the guarantee of child care for working recipients thatexisted under AFDC was abolished under TANF. That guarantee waswidely seen by states as a constraint on their ability to increaseemployment because it meant that states could not force women towork without first providing sufficient child care slots.
5For extensive discussions of the nature of the evaluation difficulties,see R. Moffitt and M. Ver Ploeg, Evaluating Welfare Reform in anEra of Transition (Washington, DC: National Academy Press, 2001),and R. Blank, “Evaluating Welfare Reform in the United States,”Journal of Economic Literature 40 (December 2002): 1105–66.
6For a detailed discussion of evaluation methodologies, see Moffittand Ver Ploeg, Evaluating Welfare Reform.
7See, e.g., K. Murray and W. Primus, “Recent Data Trends ShowWelfare Reform to Be a Mixed Success: Significant Policy ChangesShould Accompany Reauthorization,” Review of Policy Research 22(2005): 301–324.
8See, e.g., D. Ellwood, “The Impact of the Earned Income Tax Creditand Social Policy Reforms on Work, Marriage, and Living Arrange-ments,” National Tax Journal 53 (2000): 1063–1105.
9See, e.g., P. Levine and D. Whitmore, “The Impact of WelfareReform on the AFDC Caseload,” National Tax Association Proceed-ings, 1997 (1998): 24–33.
10See, e.g., C. Miller, V. Knox, L. Gennetian, M. Dodoo, J. Hunter,and C. Redcross, Reforming Welfare and Rewarding Work, Vol. I,Final Report on the Minnesota Family Investment Program: Effectson Adults (New York: MDRC, 2000).
11Blank, “Evaluating Welfare Reform”; Moffitt, Means-Tested Trans-fer Programs; J. Grogger and L. Karoly, Welfare Reform: Effects of aDecade of Change (Cambridge, MA: Harvard University Press,2005); and R. Blank, “What We Know, What We Don’t Know, andWhat We Need to Know about Welfare Reform,” presented at theConference on Welfare Reform Ten Years After, University of Ken-tucky, 2007.
12G. Acs and P. Loprest, Leaving Welfare: Employment and Well-Being of Families That Left Welfare in the Post-Entitlement Era(Kalamazoo, Michigan: Upjohn Institute, 2004).
13Acs and Loprest, Leaving Welfare.
14R. Bavier, “Welfare Reform Data from the Survey of Income andProgram Participation,” Monthly Labor Review 124 (July 2001): 13–24.
15R. Moffitt and A. Rangarajan, “The Effect of Transfer Programs onWork Effort and Human Capital Formation: Evidence from the U.S.,”in The Economics of Social Security, eds. A. Dilnot and I. Walker(Oxford: Oxford University Press, 1989); G. Burtless, “EmploymentProspects for Welfare Recipients,” in The Work Alternative: WelfareReform and the Realities of the Job Market, eds. D. Smith Nightin-gale and R. Haveman (Washington, DC: Urban Institute, 1995); D.Card, C. Michalopoulos, and P. Robins, “The Limits to WageGrowth: Measuring the Growth Rate of Wages for Recent WelfareLeavers,” Working Paper No. 8444, Cambridge, MA: National Bu-reau of Economic Research (NBER), 2001.
16T. Gladden and C. Taber, “Wage Progression among Less SkilledWorkers,” in Finding Jobs: Work and Welfare Reform, eds. R. Blankand D. Card (New York: Russell Sage, 2000); J. Grogger, “WelfareReform, Returns to Experience, and Wages: Using ReservationWages to Account for Sample Selection Bias,” Working Paper No.11621, National Bureau of Economic Research, 2005; H. Connollyand P. Gottschalk, “Do Earnings Subsidies Affect Job Choice? TheImpact of SSP Subsidies on Wage Growth,” working paper, ChestnutHill, MA: Boston College, 2006.
17Blank, “Evaluating Welfare Reform”; J. Grogger and L. Karoly,Welfare Reform: Effects of a Decade of Change (Cambridge, MA:Harvard University Press, 2005).
18R. Blank, “Improving the Safety Net for Single Mothers Who FaceSerious Barriers to Work,” The Future of Children 17 (Fall 2007):183–197, estimates that 20 percent to 25 percent of all low-incomesingle mothers—whether former welfare recipients or not—are nei-ther on welfare nor working, and have low incomes and high povertyrates.
19U.S. Department of Health and Human Services, “Indicators ofWelfare Dependence,” Annual Report to Congress, Table 4a, Wash-ington, DC: Office of the Assistant Secretary for Policy and Evalua-tion, 2007.
20Acs and Loprest, Leaving Welfare, Table 6.2.
21In the general population of all families, participation rates of fami-lies that were eligible for the Food Stamp program fell from 70percent in 1994 to 48 percent in 2000, although they rose back to 55percent by 2004, see U.S. DHHS, “Indicators of Welfare Depen-dence,” Figure 4.
22For an illustrative study, see R. Schoeni and R. Blank, “What HasWelfare Reform Accomplished? Impacts on Welfare Participation,Employment, Income, Poverty and Family Structure,” Working PaperNo. 7627, Cambridge, MA: NBER, 2000.
23Levine and Whitmore, “Impact of Welfare Reform.”
24J. Grogger and C. Michalopoulos, “Welfare Dynamics Under TimeLimits,” Journal of Political Economy 11 (June 2003): 530–554; J.Grogger, “Time Limits and Welfare Use,” Journal of Human Re-sources 39 (Spring 2004): 405–24; and B. Meyer and D. Rosenbaum,“Welfare, the Earned Income Tax Credit, and the Labor Supply ofSingle Mothers,” Quarterly Journal of Economics 116 (2001): 1063–1114.
25See Tables 5.1, 6.1, and 7.1 in Grogger and Karoly, Welfare Reform,for the results from 13 experiments of this type; and D. Bloom and C.Michalopoulos, “How Welfare and Work Policies Affect Employ-ment and Income: A Synthesis of Research,” Next Generation Projectreport, MDRC, New York, 2001, for a discussion of 11 experiments.
26Financial components were considered to be tested “essentially”alone because other reform components were also bundled into thetreatments.
27Miller et al., Reforming Welfare.
28Miller et al., Reforming Welfare.
29See, e.g., S. Danziger and K. Seefeldt, “Ending Welfare ThroughWork First,” Families in Society 81 (2000): 593–604.
30Bloom and Michalopoulos, “How Welfare and Work Policies AffectEmployment and Income.”
31V. J. Hotz, G. Imbens, and J. Klerman, “Evaluating the DifferentialEffects of Alternative Welfare-to-Work Training Components: A Re-analysis of the California GAIN Program,” Journal of Labor Econom-ics 24 (July 2006): 521–566.
32Bloom and Michalopoulos, “How Welfare and Work Policies AffectEmployment and Income.”
33Blank, “Improving the Safety Net.”
34M. Farrell and S. Rich, “Time Limits: An Update on State Policies,Implementation, and Effects on Families,” presented at the WelfareResearch Conference, Washington, DC: U.S. Administration forChildren and Families, 2007.

26
Out of Reach: Place, Poverty, and the New American Welfare State
Scott W. Allard
Sweeping changes in welfare programs since 1996 have transformed the way America cares for its poor.Today, for every dollar spent on cash welfare payments, some twenty dollars are spent on serviceprograms targeted at the working poor—job training, adult education, child care, emergency assis-tance, mental health care, and other social services. Out of Reach examines our current system and thecrucial role that geography plays in the system’s ability to offer help. Drawing on unique survey data from almost 1,500 faith-based and secular service organizations inthree cities, IRP affiliate Scott W. Allard examines which agencies are most accessible to poorpopulations and looks at the profound impact of unstable funding on assistance programs. Allard arguesthat the new system has become less equitable and reliable, and he concludes with practical policyrecommendations that address some of the more pressing issues in improving the safety net.
Yale University Press, forthcoming December, 2008, 280 pp.,http://yalepress.yale.edu/yupbooks/home.asp
Recent IRP Discussion Papers
Holzer, H. “Living Wage Laws: How Much Do (Can) They Matter?” DP no. 1358-08. 2008. 32 pp.
Handel, M. J. “Measuring Job Content: Skills, Technology, and Management Practices.”DP no. 1357-08. 2008. 63 pp.
Baum, C. L. “The Effects of Food Stamp Benefits on Weight Gained by Expectant Mothers.” DP no. 1343-08.2008. 31 pp.
Dahl, M., and T. DeLeire. “The Association between Children’s Earnings and Fathers’ Lifetime Earnings:Estimates Using Administrative Data.” DP no. 1342-08. 2008. 42 pp.
Schmeiser, M. D. “Expanding New York State’s Earned Income Tax Credit Program: The Effect on Work, Income,and Poverty.” DP no. 1341-08. 2008. 30 pp.
Imbens, G. W., and J. M. Wooldridge. “Recent Developments in the Econometrics of Program Evaluation.” DPno. 1340-08. 2008. 91 pp.
Schmeiser, M. D. “Expanding Wallets and Waistlines: The Impact of Family Income on the BMI of Women andMen Eligible for the Earned Income Tax Credit.” DP no. 1339-08. 2008. 33 pp.
Carlson, D., R., Haveman, T. Kaplan, and B. Wolfe. “Long-Term Effects of Public Low-Income Housing Voucherson Work, Earnings, and Neighborhood Quality.” DP no. 1338-08. 2008. 51 pp.
Flinn, C., and J. Mabli. “On-the-Job Search, Minimum Wages, and Labor Market Outcomes in an EquilibriumBargaining Framework.” DP no. 1337-08. 2008. 33 pp.
Plotnick, R. D. “Childlessness and the Economic Well-Being of Elders.” DP no. 1336-08. 2008. 33 pp.
Hamersma, S., and C. Heinrich. “Temporary Help Service Firms’ Use of Employer Tax Credits: Implications forDisadvantaged Workers’ Labor Market Outcomes.” DP no. 1335-08. 2008. 43 pp.
http://www.irp.wisc.edu/publications/dps/dplist.htm

27
Rethinking the safety net:Gaps and instability in help for the working poor
policy and research. Here, I focus on two. First, deliveryof social service programs is very different from deliveryof cash assistance programs. Whereas welfare or foodstamp benefits can be delivered directly to recipientsthrough the mail or an electronic benefits transfer (EBT)card, most social services cannot be mailed or deliveredto an individual at home. Instead, clients typically visit aservice agency, often several times, to receive assistance.Social service programs have a fundamentally local char-acter and can vary more widely by place than we oftenrealize. Poor individuals who do not live near relevantservice providers may lack information about availableservices or may find it difficult to access programs. Thismay be particularly true for low-income populations withlimited access to transportation. For these families, inad-equate access to providers may be the equivalent to beingdenied social service aid.
The next implication of the prominence of social serviceprograms in the contemporary safety net is that fundingof social service programs, more so than most safety netassistance, can change from year to year. Whether due tochanging needs, fluctuation in available revenues, orshifts in public priorities, the allocation of governmentand nongovernment program funds for social servicescan be inconsistent or unpredictable from one year to thenext. Because funds typically contract during economicdownturns and budget crunches, just when demand forassistance increases, public and private social serviceprograms have poor countercyclical properties. The un-even provision of social service funds also fosters insta-bility in the delivery of assistance to poor individuals anddestabilizes the nonprofit sector that provides many ser-vices. Thus, inadequacies in both accessibility and con-sistency have the potential to adversely affect social ser-vice provision for working poor populations.
Despite these realities, few studies examine the spatial orfinancial context of social service provision. In this ar-ticle, I examine these issues through the lens of theMulti-City Survey of Social Service Providers (MSSSP)completed with executives and managers of nearly 1,500public, nonprofit, and for-profit organizations in threemetropolitan areas (Chicago, Los Angeles, and Washing-ton, DC) between June 2004 and August 2005. Capturingthe wide variety of community-based organizations thatadministered programs to working-age adults in house-holds with incomes near or below the federal povertyline, the MSSSP collected information on location, ser-vices, clients, funding, and organizational characteristics
Scott W. Allard
Scott W. Allard is Associate Professor in the School ofSocial Service Administration at the University of Chi-cago, and an IRP affiliate.
Introduction
The “safety net,” a term we use to describe a system ofsecurity that ensures no one falls below a minimum stan-dard of living, can be thought of as the bundle of govern-ment and nongovernment antipoverty programs intendedto help the roughly 60 million low-income Americanswho lack adequate income, food, housing, or access tohealth care.1 Quite often poverty research and policydiscussions of the safety net revolve around its govern-mental components, particularly those programs de-signed to reduce the prevalence of material poverty. Forexample, public assistance programs such as FoodStamps, Temporary Assistance for Needy Families(TANF) welfare cash assistance, and the Earned IncomeTax Credit (EITC), which together provide about $80billion in total aid to working poor families, receivesubstantial attention from researchers and policymakers.Medicaid, which provided coverage to roughly 30 mil-lion non-aged, nondisabled families in 2003 at a cost ofabout $70 billion,2 is also prominent in policy debate.
Less salient in the public mind or in poverty research, butcritical to how the safety net helps working poor popula-tions, are social service programs that promote workactivity and greater personal well-being through jobtraining, adult education, child care, temporary emer-gency food or cash assistance, and substance abuse ormental health treatment.3 Social service programs arefunded primarily by federal, state, and local govern-ments, but nonprofit organizations play a key role inservice provision through the contribution of private pro-gram resources and essential street-level service deliv-ery. Discussing the modern safety net, Smith (2002) con-cludes that “nonprofit social service agencies have amore central role in society’s response to social problemsthan ever before” (p. 150).4 In total, social services nowlikely receive somewhere between $150 and $200 billionin public and private financing annually.5
The prominence of social service programs in the con-temporary safety net has numerous implications for
Focus Vol. 26, No. 1, Summer-Fall 2008
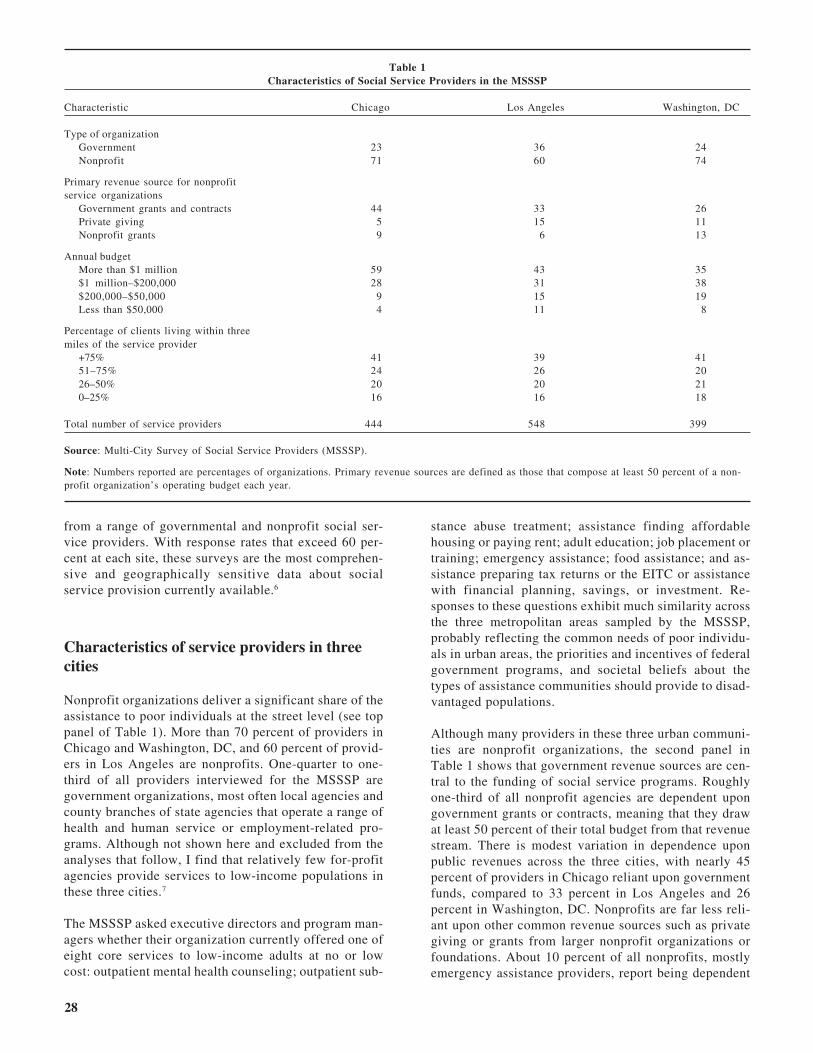
28
from a range of governmental and nonprofit social ser-vice providers. With response rates that exceed 60 per-cent at each site, these surveys are the most comprehen-sive and geographically sensitive data about socialservice provision currently available.6
Characteristics of service providers in threecities
Nonprofit organizations deliver a significant share of theassistance to poor individuals at the street level (see toppanel of Table 1). More than 70 percent of providers inChicago and Washington, DC, and 60 percent of provid-ers in Los Angeles are nonprofits. One-quarter to one-third of all providers interviewed for the MSSSP aregovernment organizations, most often local agencies andcounty branches of state agencies that operate a range ofhealth and human service or employment-related pro-grams. Although not shown here and excluded from theanalyses that follow, I find that relatively few for-profitagencies provide services to low-income populations inthese three cities.7
The MSSSP asked executive directors and program man-agers whether their organization currently offered one ofeight core services to low-income adults at no or lowcost: outpatient mental health counseling; outpatient sub-
stance abuse treatment; assistance finding affordablehousing or paying rent; adult education; job placement ortraining; emergency assistance; food assistance; and as-sistance preparing tax returns or the EITC or assistancewith financial planning, savings, or investment. Re-sponses to these questions exhibit much similarity acrossthe three metropolitan areas sampled by the MSSSP,probably reflecting the common needs of poor individu-als in urban areas, the priorities and incentives of federalgovernment programs, and societal beliefs about thetypes of assistance communities should provide to disad-vantaged populations.
Although many providers in these three urban communi-ties are nonprofit organizations, the second panel inTable 1 shows that government revenue sources are cen-tral to the funding of social service programs. Roughlyone-third of all nonprofit agencies are dependent upongovernment grants or contracts, meaning that they drawat least 50 percent of their total budget from that revenuestream. There is modest variation in dependence uponpublic revenues across the three cities, with nearly 45percent of providers in Chicago reliant upon governmentfunds, compared to 33 percent in Los Angeles and 26percent in Washington, DC. Nonprofits are far less reli-ant upon other common revenue sources such as privategiving or grants from larger nonprofit organizations orfoundations. About 10 percent of all nonprofits, mostlyemergency assistance providers, report being dependent
Table 1Characteristics of Social Service Providers in the MSSSP
Characteristic Chicago Los Angeles Washington, DC
Type of organization Government 23 36 24Nonprofit 71 60 74
Primary revenue source for nonprofitservice organizations
Government grants and contracts 44 33 26Private giving 5 15 11Nonprofit grants 9 6 13
Annual budget More than $1 million 59 43 35$1 million–$200,000 28 31 38$200,000–$50,000 9 15 19Less than $50,000 4 11 8
Percentage of clients living within threemiles of the service provider
+75% 41 39 4151–75% 24 26 2026–50% 20 20 210–25% 16 16 18
Total number of service providers 444 548 399
Source: Multi-City Survey of Social Service Providers (MSSSP).
Note: Numbers reported are percentages of organizations. Primary revenue sources are defined as those that compose at least 50 percent of a non-profit organization’s operating budget each year.

29
upon private giving; a similar percentage indicates de-pendence on funding from other nonprofit organizations.
About 46 percent of all providers, public and nonprofit,have annual budgets over $1 million, with some variationacross the three cities. Nearly two-thirds of governmentagencies reported budgets above $1 million, compared to43 percent of nonprofit organizations. Not only do thelarger organizations provide many different services andretain sizable professional staffs, they also tend to pro-vide more resource-intensive services such as mentalhealth counseling, substance abuse treatment, and em-ployment-related programming. Local safety nets alsoinclude a substantial number of small and modest-sizednonprofit service organizations, many of which aremissed by typical sources of data such as IRS tax-exemptfilings. Nearly one-quarter of all the nonprofit providersinterviewed operate with annual budgets of less than$200,000, with about 9 percent reporting budgets under$50,000. Many of these smaller agencies focus on ad-dressing temporary food and material needs of workingpoor families.
Consistent with the argument that access to service pro-viders is an important determinant of service utilization,most agency caseloads are composed predominately ofresidents from the surrounding neighborhood. Six out often providers across the three cities maintain caseloads inwhich a majority of clients live within a three-mile ra-dius. Even though the three cities vary in size and in typeof public transit systems, there are few differences in theproportion of clients living within three miles. The Cityof Los Angeles covers 1,725 square miles—nearly threetimes the size of Chicago and more than ten times the sizeof the District of Columbia—yet the share of providers inLos Angeles that draw a majority of their clients fromwithin three miles is almost identical to that found inChicago and Washington, DC—65 percent.
Access to service providers
To provide insight into the accessibility of service pro-viders to concentrations of need in these three cities, Icalculate a service accessibility score. The score reflectsa residential census tract’s access to social service oppor-tunities within three miles relative to the average tract inthat city, weighting for the number of poor individualswithin three miles to control for potential demand. I usethese service accessibility scores to make comparisonsamong different types of census tracts or neighborhoods.For example, Neighborhood A, with an access score of1.10, is located within 3 miles of 10 percent more serviceopportunities than the metropolitan mean tract. If Neigh-borhood B has an access score of 0.90, it is located near10 percent fewer service opportunities than the metro-politan mean tract. Neighborhood A thus has access to 22percent more service opportunities than Neighborhood B
(1.10 ÷ 0.90 = 1.22). If providers are more likely tolocate near or within impoverished neighborhoods, thenservice accessibility scores will be at or above one inhigh-poverty neighborhoods. I report mean access scorespooled across the three cities for tracts with differenttypes of race composition and poverty rates in Table 2.Below I distinguish between low-poverty census tracts(defined as having a poverty rate of less than 10 percent),moderate-poverty tracts (poverty rate of 11 percent to 20percent), high-poverty tracts (poverty rate of 21 percentto 40 percent), and extremely high-poverty tracts (pov-erty rate greater than 40 percent).8
In each city there is evidence of mismatches in serviceaccessibility; services are much more accessible inlower- than in higher-poverty areas. On average, censustracts with high or extremely high poverty rates—thosewith the greatest demand or need for assistance—haveaccess to about 30 percent fewer service providers thanthe average residential tract in each city. Although notreported in Table 2, these patterns persist in all threecities. For instance, high-poverty tracts in Chicago, witha score of 0.70, have access to 30 percent fewer serviceproviders or service opportunities than the average tractin Chicago. Similarly, extremely high-poverty tracts inLos Angeles and Washington, DC, have access to 33percent and 31 percent respectively fewer social serviceopportunities than the mean tract.
Table 2Access to Social Service Providers in the MSSSP
Mean AccessType of Census Tract to All Services
Poverty Rate0 to 10% 1.2011 to 20% 0.9221 to 40% 0.76+40% 0.70
Percentage of Tract Population African American0 to 25% 1.1126 to 50% 0.8551 to 75% 0.73+75% 0.58
Percentage of Tract Population Hispanic0 to 25% 1.0926 to 50% 0.9851 to 75% 0.81+75% 0.76
Percentage of Tract Population White0 to 25% 0.6326 to 50% 0.9551 to 75% 1.07+75% 1.25
Source: MSSSP; 2000 Census.
Note: Numbers reported are mean service accessibility scores re-flecting access to all social service providers and controlling for po-tential demand in the surrounding area.

30
Living in neighborhoods highly segregated by race—often high-poverty or extremely high-poverty neighbor-hoods—significantly diminishes access to the safety net.The disparities in access scores between neighborhoodswith large percentages of racial minorities and those withsmaller percentages are quite striking. Census tracts thatare predominately African American—that is, where thepercentage of African Americans exceeds 75 percent—have access to 42 percent fewer service opportunitiesthan the average tract and less than half as much accessas tracts where more than 75 percent are white. Similarly,predominately Hispanic tracts are proximate to 24 per-cent fewer service providers than the average tract, andhave access to 60 percent fewer service opportunitiesthan tracts that are mostly white.9
A number of factors shape the location decisions of so-cial service agencies and affect their accessibility tohigh-poverty neighborhoods. Perhaps most importantly,agencies find it difficult to locate affordable and ad-equate office space near or within high-poverty areas.Location choices may be driven by the need to accesssources of government revenue, fee-based income, orprivate support. At times, agencies can run into difficultyfinding a suitable location when confronted with “not inmy backyard” sentiment. This attitude leads landlords orresidents to resist the establishment of new social serviceprograms or agencies in their immediate community outof concern that programs for low-income populationswill attract individuals viewed as undesirable to the area.Nonprofit service organizations can also be attracted toneighborhoods with strong community-based institutionsand high levels of civic engagement or social capital.Location incentives also vary across different servicesectors. For example, job-training programs might locatecloser to employers than to low-income program clientsbecause proximity to employers may be critical to buildthe relationships necessary to place clients. Employment
service agencies may also choose to locate away fromhigh-poverty areas in order to help clients learn how tocope with the challenges of commuting to a job. Suchproviders may be more likely to locate in outer urban orinner-tier suburban areas because recent job growth inmany communities has occurred outside of the centralcity. In the end, service providers must locate with theinterests and needs of multiple stakeholders, constituen-cies, and obligations in mind. Proximity to clients is onlyone of many considerations when deciding on a location.
Volatility of funding and service delivery
Because access is likely to be shaped by the availabilityof program funding, it is important to note that manygovernment and nonprofit social service providers reportreduced program funding in recent years (Table 3). Cutsin funding occurred fairly consistently across the threecities. About 40 percent of government and nonprofitproviders in Los Angeles and Chicago experienced adecrease in funding recently, as did 30 percent of provid-ers in Washington, DC.
Instability of social service program funding affects theconsistency of assistance that agencies deliver to thepoor. Fewer resources or less reliable resource flows willbe accompanied by fewer or less predictable services. Toprovide insight into the impact of lost program funding,service providers were asked whether they had pursuedany of the following four responses to recent fundinglosses: reductions in staffing levels, reductions in ser-vices offered, reductions in numbers of clients served, ortemporary closure of their facility. Seven out of ten gov-ernment and nonprofit service providers experiencing adecrease in funding reported pursuing at least one of thefour coping strategies, and almost half of them pursuedmore than one.
Table 3Volatility in Funding and Service Provision among Government and Nonprofit Organizations
Percentage of AllGovernment and Nonprofit
Organizationsa
Report Decrease in Funding from Any Revenue Source in Previous Three Years 39%
Percentage of Governmentand Nonprofit Organizations
Reporting a Funding Decreaseb
Reduced Staff in Previous Year Due to Funding Decrease 60%
Reduced Services in Previous Year Due to Funding Decrease 47
Reduced Clients in Previous Year Due to Funding Decrease 38
Temporarily Closed Site in Previous Year Due to Funding Decrease 7
Source: MSSSP.
Notes: a N = 1,323. bN = 510.

31
Funding reductions were most likely to trigger cuts instaffing. Sixty percent of public and nonprofit serviceorganizations experiencing decreases reported reducingthe number of paid staff as a result. Staff salaries andbenefits are large line items in agency budgets, and it canbe difficult to find grants that cover such administrativecosts. By reducing staff, agencies can balance budgetsand attempt to maintain service delivery levels withfewer personnel. Given that service organizations typi-cally are understaffed, however, the loss of staff is likelyto shrink the organization’s capacity to serve over time.For agencies providing staff-intensive services or thoseunable to draw upon volunteers, client caseloads canexpand only so far before the agencies are unable todeliver services in an adequate and timely fashion.
Given the difficulty of finding replacement funds for anentire program, the loss of funds from a key revenuesource may force agencies to simply shut down a pro-gram. Again consistent with expectations, service reduc-tions are quite common among agencies experiencingfunding cuts. Nearly half of all government and nonprofitservice providers reporting funding decreases reducedservices to low-income clients. Highlighting the connec-tion between programs and staffing levels, 84 percent ofagencies reducing services also reported reducing staff.
Funding cuts may affect caseload sizes directly. Overone-third of providers reduced the number of clientsserved in response to lost income. The MSSSP does notprobe to find out how agencies cut caseloads, but thereare several possibilities. Some agencies may restrict newclients or put caps on caseload sizes, limiting the accessof new applicants. In other instances clients may need tospend more time on waiting lists; this option avoids de-nying assistance to anyone in need, but it provides lessimmediate help. In yet other settings, an agency maysimply eliminate a program midstream and cut off clientscurrently receiving help.
In the most extreme scenario, agencies may not be able topersevere with strategic staff layoffs, service cutbacks,or limits on client caseloads. Instead, they may have nochoice but to close their doors temporarily or perma-nently. In addition to the 15 percent of agencies that wereno longer operational when the MSSSP tried to contactthem, another 7 percent of all government and nonprofitservice agencies interviewed had closed their sites tem-porarily in the past year because of funding problems.Taken together, these findings suggest that as many asone-quarter of all agencies that report offering assistanceto poor individuals at a given time will close for at least ashort period and perhaps permanently.
Policy and research implications
Evidence presented here indicates holes in the safety net.Areas most in need are mismatched from the local gov-
ernment and nongovernment agencies that deliver assis-tance. A low-income household living in a high-povertyneighborhood or a predominately minority neighborhoodhas access to far fewer service providers than a low-income household located in an affluent, predominatelywhite neighborhood. Not only is the safety net mis-matched, but it is also volatile and unstable. Many pro-viders report lost program funds in recent years that haveforced cutbacks in program offerings, staff, or the num-ber of clients served. Combined, these results suggestthat social assistance for poor people is not as wellmatched or well suited to social needs as we might other-wise expect.
Improved access to the safety net will hinge on buildinginformation technology systems that better link individu-als in need with community resources and service pro-viders. More attention should be paid to the space andfacility needs of service organizations. Efforts to provideagencies with a mix of technical assistance for facilitiesplanning, data resources to aid facility placement deci-sions, and access to financial resources that can helpacquire or expand facilities may be particularly useful inclosing mismatches between available help and thoseseeking help. Improving service access will also requirepaying greater attention to how changes in the geographyof poverty affect the manner in which communities fundand provide social assistance. Declining poverty rates inmany central city neighborhoods and increasing povertyrates in nearby suburban communities pose complica-tions for providers.10 Agencies operating in areas withsubstantial declines in poverty may become even morevulnerable rather than better able to serve the commu-nity. Increased numbers of poor individuals in outer-urban areas and inner suburbs, where there may be fewpublic or private resources available to increase serviceprovision, will lead to increased demands for assistancethat will outpace the ability of these communities toprovide help.
In addition, public financial commitments to social ser-vice programs should be maintained, particularly at atime when poverty and income inequality are on the rise.Decreases in government social service funding willhamper the ability of low-income populations to achievegreater economic self-sufficiency, and their failure to doso will place additional burdens on both the public andprivate elements of the safety net. As important, cuts inpublic expenditures will increase the vulnerability of lo-cal nonprofits, lynchpins of the contemporary Americansafety net. A retrenchment of social welfare programs,therefore, jeopardizes the foundations of the safety netmore profoundly than is commonly realized. In additionto maintaining or increasing public commitments to thesafety net, I argue that we must also increase privatecommitments. One step toward strengthening the non-profit service sector would be to cultivate greater andmore durable fund-raising capacity. Given the depen-dence of nonprofits upon government sources of revenue

32
and the instability of revenues from year to year, diversi-fying the nonprofits’ funding portfolios will increase thestability of the agencies and the services they provide.
In spite of the central role that social services have cometo play in local safety nets, we have relatively littleinformation about social service organizations and howthey provide services. Research exploring governmentand nonprofit social service provision, therefore, willalso play an important role in identifying how govern-ments and communities can best deliver assistance toworking poor populations. While this article generatesimportant insight into issues of service delivery, futureresearch should seek to develop more precise measuresof program accessibility, particularly measures that canbe more sensitive to the adequacy of service provisionrelative to need and to program quality. To permit mean-ingful comparisons across communities, we should pur-sue data collection efforts that are geographically repre-sentative of several different regions or metropolitanareas and that would allow us to assess the spatial dimen-sions of the social service sector. Finally, there is needfor further inquiry into the needs of working poor fami-lies and the factors shaping utilization of social serviceprograms to address those needs.
Through a combination of private and public efforts, wehave the opportunity as a nation to achieve a uniquelyAmerican safety net that is compassionate toward theneeds of the poor. Communities can work together toprovide bundles of services that support work and pro-vide assistance through periods of economic uncertainty.Better coordination and planning of social service pro-grams can reduce the mismatches, inefficiencies, andinstabilities currently present in local safety nets. Ulti-mately, by strengthening both our public and privatecommitments to helping the poor, we can provide asafety net that offers support to those in need whileremaining true to traditional American values of indi-vidualism, efficiency, and equitable access to opportu-nity. �
1This article draws upon the author’s book Out of Reach: Place,Poverty, and the New American Welfare State (Cumberland, RI: YaleUniversity Press, forthcoming 2008).
2J. Holahan and A. Ghosh, “Understanding the Recent Growth inMedicaid Spending, 2000–2003,” Health Affairs: The Policy Journalof the Health Sphere, Web exclusive, http://content.healthaffairs.org/cgi/reprint/hlthaff.w5.52v1, p. W5–59; S. Zedlewski, G. Adams, L.Dubay, and G. Kenney, “Is There a System Supporting Low-IncomeWorking Families?” Low-Income Working Families Series, No. 4,Urban Institute, Washington, DC, 2006.
3Social services are defined slightly differently in other researchsettings; see S. R. Smith, “Social Services,” in The State of NonprofitAmerica, ed. L. M. Salamon (Washington, DC: The Brookings Insti-tution Press, 2002).
4S. R. Smith, “Social Services.”
5To arrive at this figure, I draw upon data from the CongressionalResearch Service (2003) that finds federal, state, and local govern-
ment to spend about $110 billion annually on a variety of socialservices, including job training, housing, adult education, and energyassistance programs. See Congressional Research Service, Cash andNoncash Benefits for Persons with Limited Income: Eligibility Rules,Recipient and Expenditure Data, FY2000–Y2002 , Report No.RL32233, 2003. In addition, I estimate that the employment serviceand human service nonprofit sector has revenues of about $80 billioneach year, much of which comes from government funding sources.This estimate of the nonprofit service sector is based on InternalRevenue Service data of tax-exempt nonprofit employment and hu-man service organizations drawn from the National Center for Chari-table Statistics at the Urban Institute. These estimates include onlyorganizations with National Taxonomy of Exempt Entities codeslikely corresponding to provision of direct services. I exclude mentalhealth and substance abuse service providers, housing and shelter,and civil rights or legal aid programs because it is difficult to discernwhich agencies within these categories are most likely to providedirect services to working age adults on-site or in an outpatientcapacity. Thus, it is likely that this is a lower-bound estimate ofnonprofit social service revenues.
6Respondents were drawn from databases of government and nongov-ernment service agencies constructed for each city or rural regionfrom community directories, social service directories, county agencyreferral lists, phone books, and Internet searches. Agencies wereincluded in the study if they advertised programs for nondisabledworking age low-income adults. MSSSP interviews in metropolitanWashington, DC, included agencies located in the District of Colum-bia, as well as in Prince George’s County and Montgomery County inMaryland to the northeast and communities in northern Virginia(Alexandria, Arlington, Loudoun County, Fairfax County, and PrinceWilliam County).
7Only 4 percent of all providers interviewed reported for-profit status.
8I calculate city-specific service accessibility scores with data fromthe MSSSP as follows. First, I determine which nonprofit and govern-ment agencies currently are operating programs on-site available tonondisabled working poor adults. Next, I total the number of clientsserved by all agencies or a particular type of agency located withinthree miles of each residential census tract (using tract centroid-to-centroid distances). To account for potential demand for services, Isum the number of individuals with income below the poverty linewithin three miles of each residential tract, and then divide the num-ber of clients served by the total number of persons in poverty. Thus Icalculate a set of demand-, distance-, and organization-weighted ser-vice accessibility scores as follows: A
i = Σ(CS
i) ÷ Σ(P
i), where A
i is
the initial access score for tract i. CSi reflects the number of providers
offering a particular service (S) to low-income adults within threemiles of tract i, multiplied by the number of clients served in eachagency in a typical month (C). To account for potential demand, Idivide by the total number of persons living below the poverty line(P
i) within three miles of tract i. To be able to compare tracts to each
other, I divide this tract-specific access score by the average of thataccess score for the metropolitan area.
9Although here I report access to all service providers in the threecities together, findings are similar within each city and across differ-ent service areas.
10A. Berube and E. Kneebone, “Two Steps Back: City and SuburbanPoverty Trends, 1999–2005,” Metropolitan Policy Program, LivingCensus Series, The Brookings Institution, Washington, DC, 2006; P.A. Jargowsky, “Stunning Progress, Hidden Problems: The DramaticDecline of Concentrated Poverty in the 1990s,” Metropolitan PolicyProgram, Living Census Series, The Brookings Institution, Washing-ton, DC, 2003.

33
A longitudinal perspective on income inequality in theUnited States and Europe
Europe.4 Chief among these differences are the natureand generosity of public safety nets and social servicessystems that result in stronger protection in Europeagainst the effects of adverse economic events. Anotherimportant difference is that labor unions in Europe arebetter able to negotiate more equitable wage policiesthan their counterparts in the United States. In Europe,the combination of more egalitarian tax and transfer sys-tems and more compressed wage structures has contrib-uted to the more equitable standards of living.
Mobility bias in conventional incomeinequality data
This research intends to address important concernsabout the role of time when assessing the impact of moreegalitarian public policies. The vast majority of studiesthat compare economic inequality across nations haverelied on cross-sectional income data for a sample ofhouseholds or individuals whose current or past year’sannual incomes have been recorded. Thus, conventionalresearch rests on snapshots of economic inequality indifferent nations at specific points in time.
The problem with the study of the cross-sectional distri-bution of income is that the data do not account foreconomic mobility at the level of individuals and house-holds. This matters because economic mobility may bean important mechanism that, over time, reduces eco-nomic inequalities that exist at any one point in time. Forexample, some poor or middle-class households maymove up the income ladder, while some middle- or up-per-class households may move down.
The problem is particularly acute in cross-national com-parisons of societies that differ in the level of economicmobility they generate. When countries that appear mostunequal in the cross-sectional data are also those with themost opportunities for upward mobility over time, sig-nificant mobility bias may result.
To address this bias, it is essential to use longer-term datathat follow individual and household incomes over time.The few existing longitudinal studies confirm that eco-nomic mobility has significant egalitarian effects. For ex-ample, studies that used a full decade of income data reportthat cross-sectional inequality indices overstate permanentincome inequality by 25 percent to 30 percent.5
Markus Gangl
Markus Gangl is Professor of Sociology at the Universityof Wisconsin–Madison and an IRP affiliate.
According to conventional inequality measures based oncross-sectional data, the United States has over the last30 years exhibited not only the highest level of incomeinequality among industrialized nations, but also the fast-est growth in the level of income inequality. Many Euro-pean nations have also experienced acceleration in thegrowth of income inequality over the same period, buttheirs has been less dramatic.
Inequality measures based on cross-sectional data may,however, overstate national differences in inequality byignoring the economic mobility of individuals over time.This article addresses that shortcoming by using longitu-dinal data. The results confirm that the United States hasthe highest income inequality, and find no systematiccross-national differences in economic mobility. Theanalysis also sheds some light on why there is relativelylittle economic mobility in the United States.1
The conventional view of income inequalitydifferences
Much research has been conducted in an effort to under-stand why U.S. income inequality is so high and why ithas been growing so rapidly. The research leaves littledoubt that the U.S. economy features both the highestdispersion of wages and the highest inequality of stan-dards of living in the industrialized world.2 The UnitedKingdom has experienced inequality growth similar tothat of the United States, although the growth did notoccur until the 1980s, and it was brought to a halt byTony Blair’s Labour government in the late 1990s. SomeEuropean countries, such as Finland and Sweden, havealso seen brief periods of growth in inequality during the1990s, yet many countries, including Germany, France,and Canada, have experienced even less, if any, growthin income inequality.3
Most analysts agree that these persistent differences inthe level of economic inequality across nations with themost advanced economies are attributable to differencesin economic institutions between the United States and
Focus Vol. 26, No. 1, Summer-Fall 2008
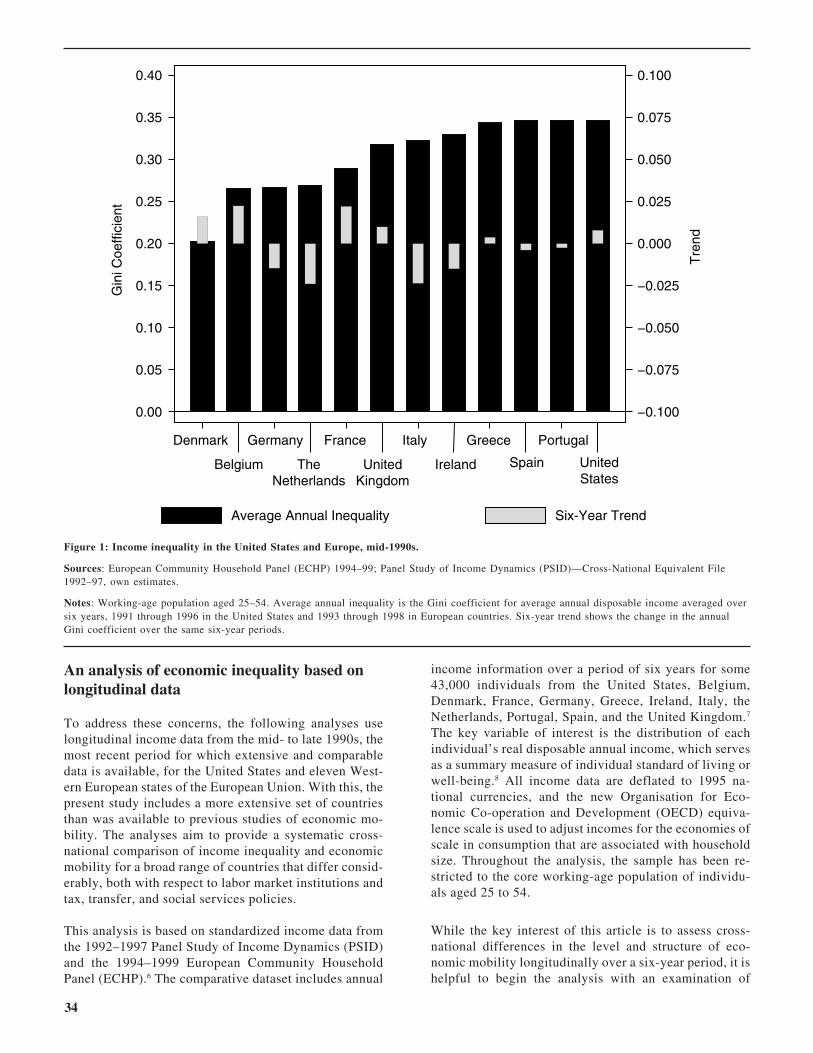
34
An analysis of economic inequality based onlongitudinal data
To address these concerns, the following analyses uselongitudinal income data from the mid- to late 1990s, themost recent period for which extensive and comparabledata is available, for the United States and eleven West-ern European states of the European Union. With this, thepresent study includes a more extensive set of countriesthan was available to previous studies of economic mo-bility. The analyses aim to provide a systematic cross-national comparison of income inequality and economicmobility for a broad range of countries that differ consid-erably, both with respect to labor market institutions andtax, transfer, and social services policies.
This analysis is based on standardized income data fromthe 1992–1997 Panel Study of Income Dynamics (PSID)and the 1994–1999 European Community HouseholdPanel (ECHP).6 The comparative dataset includes annual
income information over a period of six years for some43,000 individuals from the United States, Belgium,Denmark, France, Germany, Greece, Ireland, Italy, theNetherlands, Portugal, Spain, and the United Kingdom.7
The key variable of interest is the distribution of eachindividual’s real disposable annual income, which servesas a summary measure of individual standard of living orwell-being.8 All income data are deflated to 1995 na-tional currencies, and the new Organisation for Eco-nomic Co-operation and Development (OECD) equiva-lence scale is used to adjust incomes for the economies ofscale in consumption that are associated with householdsize. Throughout the analysis, the sample has been re-stricted to the core working-age population of individu-als aged 25 to 54.
While the key interest of this article is to assess cross-national differences in the level and structure of eco-nomic mobility longitudinally over a six-year period, it ishelpful to begin the analysis with an examination of
Figure 1: Income inequality in the United States and Europe, mid-1990s.
Sources: European Community Household Panel (ECHP) 1994–99; Panel Study of Income Dynamics (PSID)—Cross-National Equivalent File1992–97, own estimates.
Notes: Working-age population aged 25–54. Average annual inequality is the Gini coefficient for average annual disposable income averaged oversix years, 1991 through 1996 in the United States and 1993 through 1998 in European countries. Six-year trend shows the change in the annualGini coefficient over the same six-year periods.
−0.100
−0.075
−0.050
−0.025
0.000
0.025
0.050
0.075
0.100
Tre
nd
0.00
0.05
0.10
0.15
0.20
0.25
0.30
0.35
0.40
Gin
i Coe
ffici
ent
Denmark
Belgium
Germany
TheNetherlands
France
UnitedKingdom
Italy
Ireland
Greece
Spain
Portugal
UnitedStates
Average Annual Inequality Six-Year Trend

35
cross-national income inequality differences using cross-sectional data. Figure 1 shows the Gini coefficient forannual disposable incomes averaged over the six-yearobservation window.9 The United States has the highestlevel of income inequality, confirming the conventionalwisdom about cross-national differences.
However, longitudinal trends in income inequalityamong European countries in the mid- to late-1990s werequite heterogeneous. In the United States, the growth ofincome inequality came to a halt during the Clinton ad-ministration. This is reflected in a very small increase ofless than one percentage point in the Gini using 1991 to1996 income data. The only European country with asimilar trend during the 1990s is the United Kingdom.Among the remaining countries in the analysis, Den-mark, Belgium, and France had stronger inequalitygrowth than either the United States or Britain; there wasno change for most of the Southern European economies;and income inequality actually declined significantly inGermany, the Netherlands, Italy, and Ireland.
Cross-national differences in economicinequality, the longer-term view
The longitudinal data underlying Figure 1 also allow usto address cross-national differences in income inequal-ity while using cumulative incomes over a longer (six-year) observation window, thus taking economic mobil-ity into account. Figure 2 shows the outcome of thisanalysis, comparing the findings using the six-year ob-servation window to the average annual income figuresshown in Figure 1.
Figure 2 clearly shows that the Gini coefficient for six-year incomes is consistently smaller than that for single-year incomes. For the United States, the Gini for the six-year period falls by a full three percentage points to .315,which suggests that 10 percent of U.S. income inequalitythat exists at any point in time is eroded over just sixyears. Decreases of similar magnitude between averageannual inequality and six-year cumulative inequality arefound in all 12 countries. The ratio between the Gini
0.00
0.10
0.20
0.30
0.40
Gin
i Coe
ffici
ent
Average Annual Inequality Cumulative Six-Year Inequality
Denmark
Belgium
Germany
TheNetherlands
France
UnitedKingdom
Italy
Ireland
Greece
Spain
Portugal
UnitedStates
Figure 2: Inequality of annual and six-year real equivalent disposable incomes.
Sources: European Community Household Panel (ECHP) 1994–99; Panel Study of Income Dynamics (PSID)—Cross-National Equivalent File1992–97, own estimates.
Notes: Working-age population aged 25–54.

36
coefficient for six-year incomes and the Gini coefficientfor single-year incomes (a measure of inequality persis-tence also known as Shorrock’s R) ranges between .85(Denmark) and .93 (Ireland). Thus, between 7 percent (inIreland) and 15 percent (in Denmark) of point-in-timeinequality is equalized by mobility within just six years.10
The United States, where 10 percent of annual averageincome inequality was eroded over the six-year period,falls well within this range. The data thus provide noindication that European economies that feature strongsafety net institutions would systematically generate anyless mobility than the United States, with its smallersafety net programs and less robust labor union protec-tions.
American exceptionalism revisited, or, Why isthere so little mobility in the United States?
It is surprising that so little economic mobility is evidentin the U.S. data, particularly given the weaker nature ofAmerican labor market institutions and more laissez-faire public policies compared to those of most Europeancountries.
To shed some light on this issue by examining the struc-ture of income dynamics in greater detail, we used aregression model to decompose the data into a permanentincome component (individual’s average income overthe six-year period) that we use to show age-specificlifestyle trends; a linear person-specific trend in indi-vidual income over the six-year observation window; anda transitory variance component that captures randomfluctuations around an individual’s income trend.
The U.S. pattern of economic mobility is clearly distinctfrom that of many European economies in all three in-come trend components. With respect to life-cycle pat-terns of economic mobility, the age-specific trend esti-mates in permanent income provided in Figure 3 showthat, in virtually all European nations, there is a patternof declining disposable incomes (relative to average in-come growth) during an individual’s thirties and increas-ing incomes (again, relative to average income growth)during their forties and fifties. The U.S. pattern is just theopposite: an individual’s standard of living risesthroughout their thirties, but declines sharply afterwards.The degree to which older American workers fall behind,compared to older European workers, is noteworthy.
−0.04
−0.02
0.00
0.02
0.04
25 30 35 40 45 50Age
United States Denmark The Netherlands Belgium
France Ireland Italy Greece
Spain Portugal Germany United Kingdom
Ave
rage
Ann
ual I
ncom
e Tr
end
Figure 3: Life-cycle trends in log real equivalent incomes, age-specific slope parameters.
Sources: European Community Household Panel (ECHP) 1994–99; Panel Study of Income Dynamics (PSID)–Cross-National Equivalent File(CNEF) 1992–97, own estimates.
Notes: Working-age population aged 25–54. Lowess-smoothed age-specific income trend parameters (bandwidth h = 0.25).

37
Another clear-cut U.S.–European difference is evident inthe analysis of individual mobility across the incomedistribution. Figure 4 illustrates the average individualincome trend parameter separately by deciles of the dis-tribution of permanent incomes over the six-year obser-vation period. On this measure, economic mobility overtime decidedly works to the advantage of the poor inmost European countries, as incomes in the lower partsof the income distribution rise disproportionately relativeto overall income growth. In contrast, in the UnitedStates, those at the bottom of the income distributionexperienced income growth significantly below average(in fact, they experienced actual income losses), whileincomes grew well above average for those at the top ofthe distribution.
Finally, the United States is exceptional in terms of thelevel of transitory income dynamics, that is, the level ofrandom income change over time. In that sense, incomeinstability in the United States is about three times ashigh as in European countries like Denmark, Germany,or France, and economic prospects for individuals andfamilies are correspondingly much less predictable.
Summary
Taking a longitudinal perspective does not fundamen-tally alter the conventional wisdom about cross-nationaldifferences in income inequality. During the 1990s, theUnited States continued to be the country with the high-est level of income inequality in the industrialized world,and this outcome holds regardless of whether inequalityis measured cross-sectionally at a single point in time, orlongitudinally following the same households over anumber of years. This finding is explained in part bycross-national differences in life-cycle patterns of eco-nomic mobility and by the polarization of the incomedistribution over time, both of which seem to be follow-ing more equalizing patterns in European countries thanin the United States. If economic inequality is at leastpartly a matter of public policy, then the evidence sug-gests that strengthening labor unions and public safetynet programs in the United States would promote greatereconomic equality. �
−0.04
−0.02
0.00
0.02
0.04
0.06
1 2 3 4 5 6 7 8 9 10Income Decile
United States Denmark The Netherlands Belgium
France Ireland Italy Greece
Spain Portugal Germany United Kingdom
Ave
rage
Ann
ual I
ncom
e Tr
end
Figure 4: Trends in log real equivalent incomes (bi) by permanent income position.
Sources: European Community Household Panel (ECHP) 1994–99; Panel Study of Income Dynamics (PSID)–Cross-National Equivalent File(CNEF) 1992–97, own estimates.
Note: Working-age population aged 25–54. Arithmetic means of individual-specific income trends (parameter bi). Income deciles derived from thedistribution of permanent incomes y0.

38
1This article draws from Markus Gangl, “Income Inequality, Perma-nent Incomes, and Income Dynamics: Comparing Europe to theUnited States,” Work and Occupations 32, No. 2 (May 2005): 140–162.
2A. B. Atkinson, L. Rainwater, and T. M. Smeeding, Income Distribu-tion in OECD Countries: Evidence from the Luxembourg IncomeStudy (Paris: Organisation for Economic Cooperation and Develop-ment, 1995).
3P. Gottschalk and T. M. Smeeding, “Empirical Evidence on IncomeInequality in Industrialized Countries,” in Handbook of Income Dis-tribution , Vol. 1, eds. A. B. Atkinson and F. Bourguignon(Amsterdam: Elsevier, 2000).
4D. Bradley et al., “Distribution and Redistribution in PostindustrialDemocracies,” World Politics 55 (2003): 193–228; S. Moller et al.,“Determinants of Relative Poverty in Advanced Capitalist Democra-cies,” American Sociological Review 68 (2003): 22–51; and B. West-ern and K. Healy, “Explaining the OECD Wage Slowdown Recessionor Labour Decline?” European Sociological Review 15 (1999): 233–249.
5M. Gittleman and M. Joyce, “Have Family Income Mobility PatternsChanged?” Demography 36 (1999): 299–314; and R. Aaberge, A.Björklund, M. Jäntti, M. Palme, P. J. Pedersen, N. Smith, and col-leagues, “Income Inequality and Income Mobility in the Scandina-
vian Countries Compared to the United States,” Review of Incomeand Wealth 48 (2002): 443–469.
6Further information on the data sources underlying this article isavailable in R. V. Burkhauser, B. A. Butrica, M. C. Daly, and D. R.Lillard, The Cross-National Equivalent File: a Product of Cross-National Research (Ithaca, NY: Cornell University, 2001); andEurostat, UDB Manual, European Community Household Panel Lon-gitudinal Users’ Database, Waves 1 to 6, Survey Years 1994 to 1999[DOC. PAN 168/2002-12] (Luxembourg: Eurostat, 2002).
7Austria, Finland, and Sweden joined the European Union in 1995,yet are not considered in this analysis as respective ECHP data haveonly been provided since 1996.
8“Real disposable income” refers to post-tax, post-transfer income.
9The Gini coefficient is a standard statistic for measuring economicinequality. It ranges from 0 (when all individuals have identicalincomes) to 1 (when all income is received by a single individual).
10In addition, this statement even applies in case of a conservativemeasure like the Gini coefficient that is most sensitive to mobilityaround the mode of the distribution. The Shorrock’s R coefficientsare between .65 and .80 for the MLD, and .66 and .84 for the Theilcoefficient, both inequality measures that are more sensitive to thetails of the income distribution.
Coming soon from IRP:
Fast Focus Briefs
We are creating brief summaries of important IRP conferences and papers to keep you up-to-date onour latest poverty research between issues of Focus. The briefs will be sent by e-mail to anyone whocurrently receives e-mail notification of IRP publications, and will also be available on IRP’s Web site atwww.irp.wisc.edu. This is a “green” initiative; we will not be printing or mailing hard copies. If you arenot currently on the IRP Publications Alert list but would like to receive Fast Focus Briefs, please send amessage to [email protected] with the subject line “Fast Focus Briefs.” Please include your name,affiliation, and mailing address along with your email address. The first Fast Focus Brief will be sent laterthis fall.
In the next issue of Focus:
Articles based on the forthcoming book Changing Poverty
Changing Poverty continues the seminal book series on poverty policy and research, which includes Fighting Poverty (1986),
Confronting Poverty (1994), and Understanding Poverty (2001). The book will be edited by Maria Cancian and Sheldon
Danziger, and published in 2009 by the Russell Sage Foundation.
Intro. Changing Poverty in the Context of a Changing Economy, Changing Society, and Changing Public Policies
Section I. Economic Changes, Demographic Changes, and Trends in Poverty
Section II. Mobility and Its Consequences
Section III. The Evolution and Scope of Antipoverty Policies
Section IV. The Politics of Poverty and Its Meaning in a Rich Country
Versions of all book chapters were presented at an IRP conference held at the University of Wisconsin–Madison May 29–30,
2008. All conference papers are currently available as IRP Discussion Papers at http://www.irp.wisc.edu/publications.htm.

39
IRP Publications
Support Focus
For over 30 years, the IRP newsletter, Focus, has informed individuals, organizations, libraries, and members of themedia about important research into the causes and effects of poverty and about policies to ameliorate it. Focus isdistributed free of charge to institutional subscribers and posted in full on the IRP World Wide Web site.
We encourage those who wish to support Focus to send contributions to the UW Foundation/IRP Fund, using theform below. We are grateful for your support.
Institute for Research on Poverty
I wish to support the IRP newsletter, Focus.
Enclosed is my gift of $______.
Name______________________________________
Address____________________________________
City______________________State_______Zip________
Please make check payable to UW Foundation/IRP FundAddress: Institute for Research on Poverty, 1180 Observatory Drive, Madison, WI 53706
Access to IRP Information via Computer: The World Wide Web Site and Listservs
IRP has a World Wide Web site, http://www.irp.wisc.edu/, which offers easy access to Institute publications andto a subscription link for IRP listservs (electronic mailing lists). From the Web site, many Discussion Papers andSpecial Reports and all issues of the Focus newsletter are available for immediate viewing, electronic searching,and downloading in Adobe Acrobat (PDF) format.
The IRP Web site also provides information about the Institute’s staff, research interests, and activities, such asworking groups, conferences, workshops, and seminars. The Web site offers an annotated list of affiliates, withtheir particular areas of expertise, and information about IRP’s outreach, funding, and training and mentoringinitiatives. It offers an extensive set of links to poverty-related sites and data elsewhere on the Web.
Subscribe or unsubscribe to IRP listservs:
Please indicate in the subject line of your message which listserv(s) you would like to subscribe or unsubscribeto and email it to [email protected].
IRP Publications Alert: Periodic notification of and links to recently released Discussion Papers, SpecialReports, and issues of Focus
What’s New at IRP: Periodic messages with IRP news, including recent publications, seminar schedules,conferences, IRP Affiliates’ awards and honors, and other general Institute news
IRP Announcements: A semi-monthly compilation of poverty-related employment and research opportuni-ties prepared as a service to the larger poverty research and policy community
Poverty Dispatches: Biweekly messages with links to Web-based news items dealing with poverty, welfarereform, and related topics
IRP’s home page on the Web can be found at: http://www.irp.wisc.edu/

40
FocusInstitute for Research on PovertyUniversity of Wisconsin–Madison1180 Observatory Drive3412 Social Science BuildingMadison, Wisconsin 53706
Read Focuson the Web
http://www.irp.wisc.edu/