institute for policy reform - united states …pdf.usaid.gov/pdf_docs/pnabl683.pdfof the institute...
TRANSCRIPT

INSTITUTE FOR POLICY
REFORM
Working Paper Series
The objective of the Institute for Policy Reform is to enhance the foundation for broad based economic growth in developing countries Through its research education and training activitie- the Institute will encourage active participation in the dialogue on policy reform focusing on changes that stimulate and sustain economic development At the core of these activities is the search for creative ideas that can be used to design constitutional institutional and policy reforms Research fellows and policy practitioners are engaged by IPR to expandthe analytical core of the reform process This includes all elements of comprehensive and customized reform packages recognizing cultural political economic and environmental elements as crucial dimensions of societies
1400 16th Street NW Suite 350 Washington DC 20036
(202) 939 - 3450
This paper was prepared under a cooperative agreement
between the ntimtic IOr P(dicV Rchim (I IR)and Agncy for
International l)evelopmcnt (USAII)) (oopirative AgrceUimcli
No PD( t 095-00- 1126-00 iew cxpl csscd ill this papcl al c
those of the author and not Iccvsalily those of IPR or USAII)
INSTITUTE
FOR 0 POLICY
o REFORM
Political Freedom and the Response to Economic Incentives LaborMigration in Africa 1972 - 1987
degJohn Mc Millan and
Andrew P Barkley
Staff Economist Institute for Policy Reform
AssistantProfessor Department of Agricultural Economics Kansas State University
May 1992
Policy reforms in developing countries often address in isolation either an economic or a political problem This study examines the interactions between political institutions and responses to economic incentives in a comprehensive framework Migration data from thirtytwo African countries are used to quantify the statistical relationships between politicalinstitutions and labor migration out of agriculture Regression results indicate that the presence of political freedoms and civil liberties increase the responsiveness of labor migration to economic incentives
K 1 Introduction
Development economists have increasingly promoted free markets and
free trade between nations to enhance economic eficiency and stimulate
economic growth Free market prices appear now more than ever to be a prerequisite to a well-functioning economy and sustained economic growth
However the efficient allocation of resources requires not only market
generated price incentives but also the ability of resource owners to acquire
and respond to market incentives
The mobility of labor and capital may be impaired by the government
particularly in countries characterized by military regimes or entrencned despots who benefit from preservation of the status quo People and assets may be less mobile under authoritarian governments for two reasons First if market
information regarding the relative returns of resources is limited by the
government resource mobility will be constrained simply because the relative returns to factors in different uses are not known Second there may be costs
both pecuniary and nonpecuniary associated with the movement of resources
between locations and occupations A government may tax migration by searching and seizing assets carried by migratory laborers Resource mobility
may also be limited by coercion or policies that increase transactions costs
associated with the transfer of resources within an economy
Given these constraints free-market prices can be considered necessary
but not sufficient conditions for the efficient allocation of resources and economic growth Economies characterized by free markets may not perform
well if political suppression of either market information or resource mobility is present Previous studies on labor migration in developing nations have
concentrxed primarily on the economic costs and returns to migration While
2
economic incentives have been confirmed to be important determinants of migration in general and of rural to urban migration in particular previous
studies may be biased by the omission of variables that measure the levels of civil liberties and political freedom within the economy under investigation
The fundamental hypothesis of this research is that the politicI
institutions and the freedoms extended under these institutions have a significant impact on migration decisions Political restrictions may result in a
lack of complete information supplied to potential migrants concerning
opportunities in other regions or occupations Similarly constraints on civil liberties may impose dire consequences on individuals who attempt to take
advantage of economic opportunities by migrating The outcome of these possibilities is the refutable hypothesis that economies characterized by greater
political freedoms and civil liberties experience a higher level of resource
mobility in response to economic incentives This hypothesis was stated in
1776 by Adam Smith when he wrote The Wealth of Nations
If in the same neighborhood there was any employment evidently either more or less advantageous than the rest so may people woild crowd into it in the one case and so many would desert it in the other that its advantages would soon return to the level of other employments This would at least be the case in a society where things were left to follow their natural course where there was perfect liberty and where every man was perfectly free to choose the occupation he thought proper and to change it as often as he thought proper (Chapter X)
The objective of this research is to identify and quantify the statistical
relationships between political freedoms and the migration of labor out of
agriculture in a cross-section of 32 African nations over the period 1972 to
1987 Africa provides a particularly well-suited and important venue to test this
3
hypothesis Many African nations have been beset by dire poverty poor
economic performance low productivity growth huge increases in population
and increasing urbanization (Eicher) Politically the continent remains troubled with seemingly constant changes of governments coups riots and repression
(Turok) Given the severity of the economic and political problems that exist in Africa a deeper understanding of the relationships between political institutions
and economic behavior is crucial The incorporation of institutional variables into economic analyses clarifies our knowledge of what has taken place in the
past and enhances our ability to prescribe policies in the future
IaThe Migrationf Labor out of Agriculture
As economic development occurs the agricultural sector becomes less prominent relative to the industrial sector This is a result of the low income
elasticity for food as per capita income increases a diminishing share of economic resources including labor are devoted to the production of
agricultural products An enormous literature on labor migration has provided many insights into the determinants of the flow of persons between locations
and occupations Perhaps the most obvious result of this literature is the enormity of the possible determinants of migration Migration of human
beings is a complex personal economic social demographic psychological
and political process (Graves arid Clawson)
The literature has provided details about the type of individual who is most likely to migrate young better educated than the average resident
and predominantly male in Africa (Yap p 239) Econometric studies have confirmed that people move for economic gain from poorer areas to wealthier
areas (Yap p 240) This forms the foundation upon which the present
4 investigation is built potential migrants base their decision to migrate on the benefits and costs associated with migration Previous studies have concentrated on the economic benefits of migration in the form of higher anticipated earnings This analysis considers economic incentives as the primary determinant of migratory behavior but asserts that the economic motivation to mirvrate is conditioned by political institutions Specifically migration in response to a given economic incentives is expected to be higher in nations with greater political freedoms
In Transforming Tradition iaAgjl]u T W Schultz described two reasons why political factors might result in an under investment in human capital Since labor migration can be considered to be an investment in human capital (Sjaastad) these political forces are expected to affect the level of rural to urban migration The first political handicap to the promotion of human capital is powerful landowners According to Schultz
Some poor countries are still saddled with politically influential landowners It should be expected that this group would oppose and delay public expenditure for schooling for the rank and file of farmpeople Such schooling in their view could serve no usefil purpose and could be harmful It might become a disturbance weakening their political postion (Schultz p 197)
Migratory behavior is expected to be directly related to the level of education and the level of knowledge attained by farm laborers If government officials and politically powerful landlords have costs associated with a change in the status quo market information concerning opportunities outside of the traditional sector may be repressed
The second political cause of an under investment in human capital cited by Schultz was the use of coercive power to attain ideological goals
5
According to Schultz
In countries where ideology dictates that the state must be the landlord and farm people must be strictly workers the state proceeds to eliminate in principle all property rights In extreme cases largenumbers of farmers have been literally liquidated among them the most skilled in agriculture (Schultz pp 198-99)
Carl Eicher reports a specific example of the use of force in Africa there are many unanswered questions about Tanzanias experiment with agrarian socialism such as why President Nyerere authorized the use of coercion to round up farmers living in scattered farmsteads and forced them to live in villages (p 462)
Many African countries have attempted to slow the rapid urbanization process through policies that deter migration through either moral suasion or more severe incentives This example clarifies why the incorporation of political institutions into models of migration is necessary to further our understanding of the determinants of the movement of labor
Most previous studies of migration out of agriculture have not addressed the possibility of brute force imposed by the government One exception is a study by T Paul Schultz of rural to urban migration in Columbia where differences in the level of violence had an impact on the rate of migration
between regions
Todaros pathbreaking analysis of migrant behavior in Kenya emphasized the importance of expected rather than actual urban income and rural wages as the determinants of migration Todaros motivation was to enhance economic theory by including more realistic measures of human decision making In this study we combine measurements of expectations of urban and rural wages with
measurements of political freedom
6 Ib Measurements of Political Rights and Civil Liberties
In spite of overwhelming evidence that property rights and political institutions are important determinants of economic performance economists have only recently incorporated political variables into empirical models of economic development One example is Gerald Scullys empirical evidence that politically open societies attained higher rates of economic growth than politically closed nations during the period of 1960 to 1980
Scully employed data on institutional variables that were taken from
Ereedom House and include two measures of liberty political liberty and civil liberty Political and civil liberties are annually rated by the Freedom House using a scale of 1 (representing the highest degree of liberty) to 7 (representing the lowest degree of liberty) These ratings are constnicted by averaging a checklist of different aspects of a nations political rights and civil liberties (seven for political rights and thirteen for civil liberties) Each item in the list is given a score of zero one or two based on a set of procedures that is standard across countries and years These raw scores are averaged and represented on the seven point scale
Political rights as defined by Freedom Hous are those rights that enable individuals to participate freely in the political process A political system is considered to be genuinely free or democratic to the extent that people hav a choice in determining the nature of the system and its leaders The definition of political freedoms also includes an individuals freedom from domination by the military foreign powers totalitarian parties religious hierarchies economic oligarchies or any other powerful group
Civil liberties are considered to be the freedoms that develop views institutions and personal autonomy apart from the state The ranking of civil
7 liberties include a requiremet~t for free and independent media literature and other cultural expressions Also included are rights to have open public discus-ion and freedom of assemby and demonstration The ranking of civil liberties includes a requirement for free media literature and other cultural expressions Also included are rights to have open public discussions and freedom of assembly and demonstration
The rankings sumnarized in table 1 are based on the degree to which individuals in a state have control over those who govern In the category of political rights most Westeni democracies score a one while nations ruled by despots who feel little constraint from public traditions score a seven A civil liberties score of one represents nations in which publication and expression are not closed especially if the intent is to influence the legitimate political process A civil libcrties score of seven represents nations where there is pervasiv_ fear little independent expression and a police state environment Further
descriptions of features of the freedom score are listed in table 1 The cross section of African countries employed in this study includes a
high degree of variability in the Freedom House rankings of political rights (21 to 70) and civil liberties (24 to 68) The nations of Botswana Gambia and Mauritius are the most free countries in the sample of African nations while Benin Mali and Somalia are among the least free Generally countries in Africa tend to have more freedoms in civil liberties than in political rights
The Freedom House rankings of civil liberties are expected to be particularly relevant in the study of labor property rights freedom of movement choice of residence exploitation by or dependency on landlords employers union leaders bureaucrats or any other types of denigrating
obstacles to a share of legitimate economic gains (Freedom House p 20)
8 The subjective nature of the rankings requires emphasis The rankings are not purely mechanical they also reflect judgement (Freedom House p 21)
While the ranking procedure is subjective to a degree the measures of political rights and civil liberties provide an approximation for the degree of freedom that exists in a country The rankings have been used to study the relationship between economic growth and political institutions in Scully and in
McMillan Rausser and Johnson
9
II Theoretical Model
We now turn to the development of a theoretical framework that incorporates political freedoms into an individuals decision to migrate Following Sjaastad migratory behavior is analyzed using a model of occupational choice that considers migration to be an investment in human capital The economy is composed of two sectors agriculture and nonagriculture as in Mundlak Consider an individual currently employed in agriculture and facing two possible occupations agriculture (a) and nonfarm employment (n) Occupational decisions are assumed to be made by comparing the discounted utility derived from each occupation over the individuals career where t=O is the date of occupational choice and t-T is the date of retirement To simplify assume that there are S individuals currently employed in the
agricultural sector
The utility of individual s is assumed to be an function of the expected annual earnings from working in agriculture in year t Occupational choice can be characterized by the comparison of the discounted utility derived from expected earnings in agriculture (y1) and nonagriculture (y) over the remaining career of the individual or maximization of the net utility function
where r is the discount rate
T T
()NU 3 e - U(y) d e U(yZ - co) f
Migration is not costless transactions costs and nonpecuniary or psychic costs are included in the term can which represents the annual costs of moving from agriculture to the nonagricultural sector Migration is expected to occur when
10 net utility is negative or when the lifetime utility derived from the nonfarm occupation rises above the expected lifetime utility derived from the nonfarm occupation rises above the expected lifetime utility from the current agricultural
job net of moving costs By summing annual earnings from t=0 to T annual earnings can be
converted into career earnings in each occupation given by Y and Y Annual migration costs (c) are also summed into career costs Cat and the net utility function restated as
(2) NU = U(Y2) - U(Y - Cam)
Previous studies of migration have emphasized that off-farm migratory behavior is motivated by expected earnings in the nonfarm sector Political institutions are expected to be an integral component of these expectations governments can influence the expected annual earnings in the nonfarm sector by either providing misinformation about the magnitude of expected earnings or by limiting the quality of information that is used to form these expectations
Assume that individuals can predict future agricultural earnings accurately but that the government can influence the expectations of nonfarm
earnings
(3) Y = Y r = Yr 0 lt x lt1
where wr may be interpreted as a discount factor applied by risk averse individuals to uncertain or inaccurately forecast future earnings The value of
11
v is a function of the degree of freedom prevailing in a country at time t (Zt)
(4) = r(Z) gt 0
In open societies with no suppression of information or censorship r = 1 and
Lhe expectations of future nonfarm earnings can be accurately predicted In
countries where the government systematically alters the expectation formation
process or where the quality of information is limited ir lt 1 and expected
future nonfarm earnings are reduced in magnitude For example expected
earnings in the nonfarm sector coud be systematically under stated by a
government interested in maintaining a large farm labor force
Even in free-market economies where earnings are determined by the
forces of supply and demand political institutions can influence migration
patterns Governments have the ability to alter transactions costs through either
financial incentives or coercion The ability to respond to price incentives is
expected to be directly related co the level of political freedom in a given
nation In extreme cases such as forced relocation the costs of changing
occupations become a matter of life or death and completely overwhelm the
comparison of lifetime earnings
In this scenario expected earnings may not be altered but the costs of
migration are increased by government policies or political instability The
degree of civil liberties includes the ability of individuals to change occupations
and locations so the costs of transferring labor between the farm and nonfarm
sectors are a function of the level of political freedom Greater levels of civil
liberties are directly related to the ability to choose and change locations so
there is a positive relation between Z the degree of political freedom and C
12
the costs of migration
()caw = c(zj) c(Z) gt 0
Substitution of (3) and (4) into (2) yields the net utility of individual s
and depends on the interaction of political institutions interact with economic
variables
(6) NU = U(Y) - U(Y r(Z) - C(Z))
Occupational migration of individual s occurs when the net utility is
negative (NU lt 0) To aggregate Qll individual decisions an index function
I is employed to distinguish migrants from nonmigrants as in equation (3)
The level of gross migration from occupation a to n (M) for all S individuals
is found by the summation of I as in (7)
NU Ia lt 0 when (7) 1= 1 if NU lt 0 (migration occurs)
0 if NU gt 0 (migration doesnt occur)
S (8) M I
Some persons may flow from occupation j to occupation i so the level of net
migration is simply M = M - M
The specification of a migration equation that is suitable for empirical
13
testing is an extension of previous work by Mundlak and Barkley Migration is limited to occupational migration between agricultural employment (L) and nonfarm employment (L) The number of employed persons in an economy in year t (L) is equal to the sum of workers employed in th agricultural sector
and nonfarm employment
(9) L = L + L
Temporal changes in the sectoral labor force levels occur for two reasons First through additions to the labor force determined by sectoral population growth rates (X and Xn) and second through the migration of labor between sectors defined to be positive when workers leave agriculture
(10) L = (1 + X) Lx- M
(1) L = (1 + X) L + M
Sectoral population growth rates are unavailable for African countries Two assumptions are that these sectoral rates are equal to overall population rates or that these growth rates vary in given proportion Kuzrets suggests that this ratio may be as large as 31 (rural growth rate to urban growth rate) This
alternative assumption yields
(1 + X Lit - L1+ (Tad ) rv-dc)
Lit
To measure relative returns define P as the ratio of observed (actual)
14
nonfarm labor returns to observed agricultural returns (YY) The larger the divergence between farm and nonfarm returns the more individuals will find that the difference in earnings justifies migration (Mundlak) Because migrants make decisions based on the expected value of rnlative returns we must relate expected earnings to actual earnings This is accomplished in equation (13) where we define yto be the inverse of the discount factor x
Y _ at(13) P - Y
The governments influence on the ratio of labor returns occurs through the variable -y The magnitude of y is expected to decline with greater levels of
political freedom and in the case of perfect information concerning nonfarm earnings yt = 1 In cases of restricted information -yt gt 1 and P diverges
from the ratio of actual labor returns P The rate of migration is specified as a function of the expected returns ratio P the costs of migration C and a
vector of exogenous variables X
(14) m =f (P C X)
This study focuses on the response of the migration rate to the actual returns
ratio P and the degree of political freedom Z The expected directions of change can be derived by differentiating m with respect to the independent
variables P and Z
(15) O m = am P = M
ThP diPi i P a Pt
The derivative in equation 13 is negative because higher agricultural earnings
15
relative to expected nonfarm earnings induce lower rates of migration The
impact of an increase in political freedom can be found by taking the derivative
of migration with respect to the degree of political freedom Z
(16) am am ap aY am aC az aP a- az acaZ
Where there are two effects of freedoms on migration both positive in sign
The first is an indirect effect which increases the responsiveness to a given
price signal and the second is a direct effect which changes the costs of
migrating
16
M_Ja Annual migration figures are estimated using data from _YtoldTable
1991 published by the World Bank The agricultural percentage of the labor force series (the data which is most directly needed to calculate sectoral migration rates) is available for the period 1972 - 1980 However a related series the urban percentage of the population is available for the entire period 1972 - 1987 We use this available series to extend the labor force series through 1987
The agricultural percentage of the labor force (Pi) is regressed on the urban percentage of the population (Pui) for the years 1969 - 1980 for each of the 32 countries listed in Table 1
(17) Pi- a + BP+ i = Algeria Zimbabwe t = 1969 1980
Using the parameters estimated in equation (1) a new series was created for P which covers the period 1969 - 1987
(18) ir) + B P i = Algeria Ziiababwe t = 1969 1987
Regression results (not reported here but available upon request from the authors) indicate a relatively good fit with r of over 99 in 2 of the 32 countries One problem in the data is Algerias large estimated slope which when extrapolated into the 1980-1987 period results in only 9 of the labor force engaged in agriculture by 1987 compared with 31 engaged in agriculture in 1980 Since this is unrealistic we substituted Egypts estimated slope for Algeria and adjusted the intercept so that the estimates match the
17
actual data in 1975
The percent agricultural labor force series when multiplied with country population estimates and combined with annual country population growth rates yields sectoral labor force series used to estimate the sectoral migration out of agriculture (mi) This migration series is summarized for each country in Table 1 Migration estimates range from a low annual average of 2 for Burundi to a high of 987 for Libya This number indicates that out of every 1000 farmers in Burundi each year 2 change occupations from agriculture to
the nonagricultural sector
The returns to labor in each sector of the economy are measured by the average product of labor in agriculture and nonagriculture The ratio of returns is used as a measure of relative labor returns Data on the sectoral value added in African countries come from the World Bank publication African Economic
and Financial Data Th returns to labor in each sector are estimated by the value added in each sector divided by the previously estimated sectoral labor
forces This measure of average products ior each sector is also reported in Table 1 The average product in the agricultural sector is lowest in the poorest countries Burkina-Faso Ethiopia Lesotho and Malawi Average products in the nonfarm sector are highest in countries that have either diamond deposits
such as Botswana or oil reserves such as Algeria Libya and Nigeria The ratio of average products (also reported in Table 1) is generally less than one although it is slightly larger tha unity for Niger and close to unity for Ghana
18
Economic variables migration rates and institutional variables described
in section three are used to test the relationships developed in section two
Specifically we estimate the following regression
J-7 kak
(19 E+il fl P + E sk X41 J-1 k-1
where mi is the sectoral migration rate in country i in year t Pi is the price
signal the ratio of sectoral average products in country i in year t ZPt are
dummy variable transformations of Freedom House ratings of civil liberties and
political rights (Zji = 1 if the Freedom House rating = j 0 otherwise) and Xki are K exogenous variables which also affect migration in country i and year t Additional exogenous variables used in the regression are the level of per capita
GDP and the percentage of population in the agricultural sector This specification allows for the possibility of different effects in different
institutional environments of ecoh~omic incentives on sectoral migration through
the interaction of institutional dummy variables and the price variable The
important statistical tests of the paper focus on the equality of the estimated
in equation 1 If the hypothesis that the flk are equivalent can be rejected then
this provides evidence that political and civil freedoms are an important filter which conditions the response of migration to economic incentives
Additionally since we expect that political and civil freedoms aid rather than
hinder the response to economic incentives we expect that the estimated
magnitude of fk should be larger for the institutional dummy variables which represent the presence of greater freedoms Thus given our labeling
conventions we expect that (in absolute value) 02 gt 03 gt 07
19
Regression results are reported in table three separating effects for different ratings of civil liberties and in table four separating effects for different ratings of political rights The first numerical column in these tables reports the coefficients estimated by ordinary least square The second culumn reports the probability that the estimated coefficient is zero with standard errors computed using Whites method of computing the variancecovariance
matrix since Whites test indicated the presence of heteroscedasticity in the sample The means of the dependant and independent variables reported in the third and fourth columns are used to compute the elasticities reported in the fifth column Since each of the seven average product ratiofreedom house rating composite variables are right censored equal to the average product ratio if the freedom house rating dummy variable is equal to one equal to zero otherwise the dependant and independent variable means are computed
conditional on the composite variable not equal to zero This accounts for the different values for the dependant variable means for the composite variables A final calculation reported in these tables is the ratio of average products for which sectoral migration will equal zero Zero migration represents an
equilibrium where workers are indifferent to working in either sector If this equilibrium occurs where average products are equalized (and thus their ratio is one) this implies no compensating differential need be paid to workers to
compensate them Cr working in a less desirable sector These tables also report tests restricting coefficients across freedom house
ratings The first test restricts coefficients across all freedom house ratings groups Next we test sequentially beginning with the most free rating whether each rating group is statistically different from the adjacent more
restrictive rating group If this test is not rejected then the two groups are
20
combined and the next adjacent group is tested for difference from this
composite group else it is assumed that the more free rating group represents a group different from others The bottom block in the tables reports regression
results in a format identical to top block of regressions imposing the
restrictions not rejected in the sequential test procedure
Table three reports results measuring the response of migration to
differences in sectoral average products in environments differing by the
Freedom House rating of civil liberties The response is of the expected
negative sign (a lower average product in the agricultural sector relative to the
non agricultural sector induces migration out of agriculture) and is significant
in all but the most restrictive civil liberties environment In addition societies
with higher per capita GDPs and a lower percentage of their labor force in the
agricultural sector experience greater migration The sizes of these responses
measured by the elasticities decline with a decrease in civil liberties The
elasticity of the response in the most free societies measured by a civil liberties
rating equal to two is 10770 which exceeds the response in societies with
civil liberties ratings equal to five where the elasticity is 0979 which exceeds
the non-significant or zero response in the most restrictive societies where the
civil liberties are rated seven
An F-test rejects the hypothesis that responses are similar across
societies in favor of the hypothesis that migration responses to price signals
differ in environments of different freedoms This F-statistIc is 39910 and the
hypothesis is rejected at a probability level of 0015 Sequentially testing
restrictions across groups we find that groups two and three are not statistically
different (the F-statistic is 14961 and the probability level 2219) that groups
two three and four are not statistically different but that group five is different
21
from the composite group containing ratings two three and four Group six is
not different from group five but group seven is differentiated from this
composite group
The bottom block in table three reports regression results with three
aggregated groups the first containing civil liberties ratings two three and
four the second containing civil liberties ratings five and six and the third
containing civil liberties ratings seven These results again confirm the hypothesis that the migration response to price signals is greater in
environments where freedoms are greater When dummy variables representing
the civil rights categories were added to the regression their estimated
coefficients were insignificant suggesting the absence of a direct effect of civil
liberties on sectoral migration
An alternative measure of freedom is the Freedom Houses ratings of
political rights Table four reports regression results using this measure of
freedoms in place of the civil liberties ratings Results in table four are quite
similar to results reported in table one although there are some differences
Most importantly societies with greater freedoms also experience the strongest
migration response to price signals While in the case of civil libcrties this
result was monotonic across the ratings for political liberties there appears to
be Rgap In the restricted regression results the most free societies those with
political rights rated two have the largest elasticity 6393 of migration to average product ratio Societies with political rights rated three or four have an
insignificant migration response to prices while in societies with political rights
rated five the response is significant but smaller than in the most free societies
and the societies with political rights rated six or seven have the smallest
significant elasticity One conjecture which explains these results is that in the
22
process of building free political institutions sectoral mobility is restricted as a transitional policy to maintain political support for these reforms Additional research is needed to move this hypotheses beyond the level of conjecture
The estimated elasticities are in the same range of previous estimates by Mundlak using a cross-section of 70 countries of 0 to 5 (increasing monotonically over the period 1951-1972) by Mundlak using Argentine data of 346 to 540 and by Barkley using United States data of 334 to 450 Interesting in these results and consistent with our findings in Africa is that elasticities are higher where political freedoms are greater
Ratios of average products at which sectoral migration would be zero are
also calculated and reported in tables three and four There is an interesting relationship between freedoms and the calculated zero migration average product ratio free societies have a lower ratio than non-free societies This implies a bias in free societies towards rural and agricultural areas and a bias in non-free societies towards urban and non agricultural areas
23
V Sensitivity Analysis
The almost certain presence of measurement error in the aggregate
economic statistics (a problem magnified in African countries) cautions the acceptance of the econometric results of section IV Several diagnostics are available to measure the sensitivity of these results to the presence of measurement errors reversed regressions weighted regression and a
comparison of between and within estimators
One procedure to evaluate the possible impacts of measurement error is
reversed regressions Klepper and Learner show that in evaluating a regression
with k independent variables
(20) + kY = 0oo 301 x1
the coefficient estimates from the k reversed regressions
+ + X(21) Xj = -Yjo Y E YJi j 1
which may be rewritten as
Y = flio + Ek 0lx I k -I(22)
_o 6 =j -j T1e
together with the directly estimated coefficient may provide bounds for the estimates of the coefficients Specifically if for each j the k+ 1 estimates of B are either all greater or all less than zero then max[Lji] and minWL8j provide
24
upper and lower bounds for the estimate of 9ji If for some j some estimates of Oi are greater than zero while others are less than zero while for the other k-1 variables the above conditions hold the assumption that this jth variable is measured without error allows the use of bounds for the other k-1 coefficients
Reversed regression results are reported in table five The result is that only for the per-capita GDP variable do regression coefficients change sign The assumption that this variable is measured without error would then allow us
to bound the coefficients of the remaining variables allowing for their probable measurement errors Among the variables in the regression the GDP variable is the most probable to be measured without error measurement errors are most likely in the sectoral value added and in the sectoral labor force figures than in the aggregated GDP figures These results suggest that even in the presence of measurement errors in sectoral average products and in sectoral labor forces there is still evidence of a negative and statistically zignificant
relationship between sectoral migration and the agricultural percent of labor
force and a negative and statistically significant relationship between sectoral
migration rates and the ratio of sectoral average products
These results are derived with the assumption that the r of the regression after removing all errors of measurement is 1 and that the r2
between erroneously measured observed variables and their correct but unobserved counterparts is 0 Making weaker assumptions allows tighter
bounds on the coefficient estimates Figures two and three plot the upper and lower bounds of coefficient estimates against assumed r2s of the regression
after removing all errors of measurement
In Figure two if there are no errors of measurement then the maximum
r is equal to the r of the direct regression or 736 As errors of measurement
25
increase then their potential removal increases maximum possible r2 of the
direct regression If errors of measurement account for all the error in the regression the maximum possible r2 is one Upper and lower coefficient
bounds calculated by a methodology described by Klepper and Learner are plotted for each of the average product ratio - civil liberties variables The v
which intersects the vertical axis at -022 represents bounds for the variable ratio I civil liberties = 234 (C234) while the v which intersects the vertical
axis at
-00583 represents the bounds for the variable ratio I civil liberties = 56
(8C56) Note that -022 and 00583 are the estimates of 0C234 and O 5 6 in the direct regressions The lower bound for f-56 intersects the upper bound forcf 4
at a value of maximum r2 of 756 indicating the improvement in r2 (from 736
to 756) which may be due to removal of errors of measurement without overturning the hypothesis that (in absolute value) OC234 gt 05( The hypothesis that OC234 gt 0 (that the migration response to average products is greater in
these societies than in societies with civil liberties rated 7) is insensitive to
errors of measurement The hypothesis that average product ratios affect migration is more robust to errors of measurement This is tested by the maximum r2 at which the upper bound for W56 intersects the coefficient estimate
- 0 line or at r2 = 8
Figure three plots coefficient bounds for the effects on migration of the
average product - political rights variables At zero measurement error representing a maximum r2 of 762 the v representing the effect of average product for political rights = 2 (fiP2) intersects the vertical axis at -045 while the v represent the effect of average product for political rights = 5 (fl) intersects the vertical axis at -018 and the v representing the effect of average
26 product for political rights = 6 or 7 (flP67) intersects the vertical axis at -007 The hypothesis that OP2 gt O5P5 is not rejected so long as the removal of errors of measurement does not increase the r2 of the regression beyond 79
A summary statistic labeled gap in table 5 repors the portion of the gap in r between the direct regression r2 and 1 which may be due to measurement errors without overturning the measured signs of the coefficients in the direct regression A value of g equal to zero means the allowance of even the slightest errors in measurement invalidate direct regression results while a value of g equal to one means that the signs of the direct regression coefficients are robust to all types of measurement error Estimated values for this test statistic of 24 and 25 indicate that the results are somewhat robust to errors in measurement of the independent variables
Additional information is available which may reduce the sensitivity of estimates to measurement errors We know when the censuses are conducted in each of the countries and it is reasonable to assume that observations further away from these census years contain larger errors in measurement Table 6 reports regression results where observations are weighted by 1(1 +TC) where TC i5 the time from the most recent census and TC ranges from a minimum of 0 (for census years) to 17 (for countries which have never had a census) This weighting procedure gives larger weights to years which are closer to census years and smaller weights to years further removed from census years Results are similar to the unweighted pooled regressions migration responds in the predicted negative sign to the average product ratio and the size of the response is larger where freedoms are greater
Two additional estimators for panel data aixe the between and the within estimators The between estimator averages the data across time for each crossshy
27 sectional unit while the within estimator adds dummy variables for each crossshysectional unit Results for these estimators are reported in table 7 for the between estimator and in table 8 for the within estimator
Institutional variables are treated slightly differently in the between estimation The Freedom House ratings are averaged across time and countries with an average rating ess than five are g-uped in a free category and those with average ratings greater than five are grouped in a not-free category Differential responses of migration to price signals are estimated in table 7 for civil rights and for political rights measurements of freedoms The results are similar to the pooled regression results the price response is significant and of the expected sign and is greater the greater are societal freedoms These elasticities -44 for free civil liberties and -45 for free political rights compare closely to the estimates of -31 for civil liberties and -63 for political rights in the pooled regressions
Table 8 reports results of the within estimation Dummy variables for 31 countries (Zimbabwe is excluded) are added to the estimation but estimated
coefficients are not reported It is well known that the within estimator amplifies problems of measurement error and this amplification is seen in the results in table 8 Estimated coefficients are generally insignificant and are of the incorrect sign when significant These results for the vithin estimator suggest that errors in measurement are likely present and that diagnostics such as the reversed regression and the weighted regression are important additions
to the pooled regression in understanding the sensitivity of results to
measurement errors
28
VI ConclusiQn The theoretical notion that free-market prices provide signals which guide
the efficient use of resojrces has achieved strong and growing empirical suppnrt However there have been few investigations into the relationship between political institutions and the ability of individuals to act on the information provided by market prices This research has provided a first step towards an enhanced understanding of the link between economic signals and
institutional
constraints The migration of labor out of agriculture in a cross section of 32 African countries was show to be responsive to market signals that reflect the relative returns to labor in a given nation
Regression results indicate that the effect of price signals on labor migration is conditional on the degree of political freedom and civil liberties higher levels of political freedom result in greater rates of migration from agriculture to the nonfarm sector given the price signal The major implication for policy makers is that policies that are directed at correcting price signals alone may not be as successful as policies that also address institutional issues Stated differently policies that correct price signals will be more effective in environments where there is greater political and civil freedom
Given the severity of the economic and political problems in Africa this conclusion is timely and important In a continent besieged by low productivity growth high rates of population growth and overwhelming political instability a strengtened based of knowledge allows for an increased understanding of what has occurred int he past as well as a foundation upon which to build
policies for the future
Table 1
Definitions of Freedom House Ratings Categories
Political Rights
I Fully competitive electoral process and those elected clearly rule Most West European Democracies belong here
92 Although electoral process works and the elected rule there are factors which lowerrating of the effective equality of the process including economic inequality illiteracy or intimidating violence
3 through 5 Less effective inplementation of democratic processes Mexico for examplehas periodic elections and limited opposition but for many years its governments have been selected outside the public view by the leaders of factions within the one dominant Mexican partyGovernments of states rated 5 sometimes have no effective voting processes at all but strive for consensus among a variety of gruups in society in a way weakly analogous to those of the democracies
e6 Does not allow competitive electoral processes that would give the people a chance to voice their desire for a new ruling party or for a change in policy The rulers of states at this level assume that one person or a small group has the right to decide what is best for the nation and that no one should be allowed to challenge that right Such rulers do respond however to popular desire in some areas or respect belief systems (Islam) that are the property of the society as a whole
7 Political despots at the top appear by their actions to feel little constraint from either public opinion or popular tradition
Civil Liberties
I Publications are not closed because of the expression of rational political opinion especially when the intent of the expression is to affect the legitimate political process
e2 The police and courts have more authoritarian traditions than states rated 1 In some cases they may simply have a less institutionalized or secure set of liberties
03 through 5 May hold political prisoners and generally varying fons of censorship Too often their security services practice torture
e6 Almost always have political prisoners usually the legitimate media are completelyunder government supe-vision there is no right of assembly and often travel residence and occupation are narrowly restricted However there still may be relative freedom in privateconversation especially in the home illegal demonstrations do take place underground literature is published and sc on
7 There is pervading fear little independent expression takes place even in privatealmost no public expressions of opposition emerge in the police-state environment and imprisonment or execution is often swift and sure
Table Two Country Averages for Selected Data 1972 - 1987
Migratio Average Product
Average Product
Average Product Political Civil
Country Rate Ag Non-Ag Ratio Rights Liberties -shy - 1980 U S Dollars
Algeria 394 463 2826 01638 61 60 Benin 238 192 573 03349 70 64 Botswana 324 152 2932 00517 21 31 Burkina-Faso 043 91 769 01202 53 46 Burundi 020 142 1009 01404 69 63 Cameroon 279 331 1855 01787 61 54 Cent Afr Rep 205 182 761 02398 69 63 Chad 102 106 702 01507 66 65 Cote DIvoire 290 481 1998 02410 58 52 Egypt 315 238 715 03325 51 4 7 Ethiopia 112 61 245 02508 66 66 Gambia 070 132 1422 00926 24 28 Ghana 158 400 420 09514 59 50 Guinea- RiT u 061 115 396 02911 61 61 Kenya 103 149 1287 01159 53 47 Lesotho 074 82 1110 00741 51 46 Libya 987 873 14248 00613 64 62 Malawi 136 75 641 01171 64 66 Mali 054 152 745 02035 70 63 Mauritania 321 198 979 02019 64 60 Mauritius 112 599 1272 04709 22 24 Morocco 418 344 1313 02619 42 46 Niger 171 421 362 11614 69 60 Nigeria 116 441 2377 01855 48 39 Senegal 077 144 2194 00656 44 41 Sierre Leone 148 140 712 01969 52 50 Somalia 103 213 595 03572 70 68 Sudan 124 169 704 02399 54 55 Togo 115 150 1012 01482 68 59 Tunisia 300 546 1449 03766 56 51 Zambia 115 141 2201 00640 50 52 Zimbabwe 132 147 2402 00612 47 51
Table Three Regression of Sectoral Average Produqct Ratio on MigrationAllowing Differential Effects by Civil Liberties Ratings
Mean Mean
Est Coeff Prob=O Dep Var
Ind Var
Constant Ratio I Civ Lib = 2 Ratio I Civ Lib a 3 Ratio I Civ Lib = 4 Ratio Civ Lib m5 Ratio Civ Lib = 6 Ratio Civ Lib = 7 Per Capita GDP Labor Force Ag
005108 -003201 -001457 -002018 -000819 -000594 000158 000535
-005044
00000 00159 00100 00017 00228 00005 06820 00000 00000
00104 00208 00142 00191 00218 00169 00190 00190
03499 01577 01933 02282 03025 02384 08493 06799
r squared 07397 obs 505
Average Product Ratio I Civil Liberties Rating Coefficient Restriction Tests
F Statistic Probability
2=3=4=5=6=7 39910 000152=3 14961 02219 2=3=4 07938 04527 2=3=4=5 22755 00790 5=6 06659 04149 5=6=7 29213 00548
Mean Mean Dep Ind
Est Coeff Prob=O Var Var
Constant 004932 00000 Ratio I Civ Lib = 234 -002240 00000 00154 02177 Ratio I Civ Lib = 56 -000583 00010 00207 02710 Ratio I Civ Lib = 7 000179 06382 00169 02384 Per Capita GDP 000549 00000 00190 08439 Labor Force Ag -004828 00000 00190 06799
r squared 07359 obs 505
Ratio Elas mig=O
-10770 08748 -01105 13875 -02747 09128 -00979 26434 -00824 39848 00223 -103777 02397
-18083
Ratio Elas mig=O
-03166 09165 -00763 38789 00253 -91473 02441
-17309
Table Four Regression of Sectoral Average Product Ratio on Migration Allowing Differential Effects by Political Rights Ratings
Est Coeff Prob-O
Mean Dep Var
Mean Ind Var Elas
Ratio migm0
Constant Ratio I Pol Rts - 2 Ratio I Pol Rts = 3 Ratio I Pol Rts = 4 Ratio I Pol Rts = 5 Ratio I Pol Rts shy 6 Ratio I Pol Rts = 7 Per Capita GDP Labor Force Ag
005077 -004512 -000367 000743
-001689 -000654 -000659 000539
-004950
00000 00043 03606 05680 00254 00192 00027 00000 00000
00156 00165 00258 00157 00234 00166 00190 00190
02189 02184 02070 01696 02456 03312 08493 06799
-06331 -00486 00596
-01825 -00686 -01315 02414
-17746
05499 50524
-32551 11360 38305 27663
r squared 07631 obs 505
Average Product Ratio I Political Rights Rating Coefficient Restriction Tests
F Statistic Probability
2=3=4=5=6=7 2=3 3=4 3=4=5 5=6 6=7
286596 848189 090248 369151 301437 000062
00146 00037 03426 00256 00832 09801
Est Coeff Prob-O
Mean Dep Var
Mean Ind Var Elas
Ratio mig0
Constant Ratio I Pol Rts = 2 Ratio I Pol Rts = 34 Ratio I Pol Rts m5 Ratio I Pol Rts = 67 Per Capita GDP Labor Force Ag
005130 -004556 000047
-001756 -000683 000535
-004999
00000 00039 09326 00162 00016 00000 00000
00 5 00216 00157 00120 00190 00190
02189 02121 01697 02887 08439 06799
-06393 00046
-01898 -01644 02380
-17922
05446 -463671
10925 31684
r squared 07621 obs 505
Table 5 Reversed Regression Results
Civil Uberties
Independant Direction of Minimization
Variable m rc234 rc56 pag gdp
rc234 rc56 pag gdp
-002199 -000556 -000048
000001
-006409 -006207 -000166 -000000
-024537 -020391 -000327 -000002
-007579 -003769 -000022 -000000
001364 001759 000023 000002
r squared 073590
r squared m 079936
Gap 024028
Political Rights
Independant Variable m
Direction of Minimization rp2 rpS rp67 gdp pag
rp2 rp5 rp67 gdp pag
-004569 -001775 -000691 000001 -00005
-002460 -008715 -003343
000000 -000110
-022427 -016154 -011736 -000001 -000234
-022109 -030160 -014361 -000001 -000221
-000837 003494 001337
-000002 000015
-009977 -008274 -003039 -000000 000147
r squared 07621
r squared m 082246
gap 025371
Table 6
Weighted Regression Results
Civil Uberties
Est Coeff Prob-O
Mean Dep Var
Mean Ind Var Elas
Ratio mig-O
Constant Ratio ICiv Lib = 234 Ratio I Civ Lib = 56 Ratio ICiv Ub - 7 Per Capita GDP Labor Force Ag
005376 -001884 -000667 -000139
000529 -005346
00000 00000 00057 08301 00000 00000
00154 00207 00169 00190 00190
02177 02710 02384 08439 06799
-02663 -00873 -00196
02354 -19166
11318 35174
120729
r squared 07304 obs 505
Political Rights
Est Coeff Prob=0
Mean Dep Var
Mean Ind Var Elas
Ratio mig=0
Constant Ratio IPol Rts = 2 Ratio IPol Rts = 34 Ratio IPol Rts a 5 Ratio i Pol Rts = 67 Per Capita GDP Labor Force Ag
006452 -008927 -001155 -003524 -001163
000430 -006458
00000 00000 00019 00000 00000 00000 00000
00156 00216 00157 00120 00190 00190
02189 02121 01697 02887 08439 06799
-12526 -01134 -03809 -02793
01913 -23152
03198 21853 06309 20992
r squared 07190 obs 505
Table 7
Between Regression Results
Civil Liberties
Mean Mean Dep Ind Ratio
Est Coeff Prob-O Var Var Elas migO
Constant Ratio I Civ Lib lt 5 Ratio I Civ Lib gt 5
005400 -004106 -001261
00002 00346 01085
00165 00208
01771 02787
-04403 -01693
14147 59107
Per Capita GDP 005996 00013 00194 01933 05974 Labor Force Ag -005157 00005 00194 02282 -06066
r squared 08494 obs 32
Political Rights
Mean Mean Dep Ind Ratio
Est Coeff Prob=0 Var Var Elas mig=0
Constant 005116 00018 Ratio IPol Rights lt 5 Ratio I Pol Rightsgt 5
-004722 -001248
00414 02726
00178 00199
01699 02685
-04496 -01686
16170 59200
Per Capita GDP 006456 00065 00194 01933 06433 Labor Force Ag -004988 00009 00194 02282 -05867
r squared 08896 obs 32
1
Table 8
Within Regression Results
Civil Liberties
Mean Mean Dep Ind Ratio
Est Coeff Prob=0 Var Var Elas mignO
Constant 009319 00000 Ratio ICiv Lib - 234 001629 00202 00154 02177 02302 -11280 Ratio I Civ Lib = 56 001126 00412 00207 02710 01475 -17756 Ratio I Civ Lib = 7 000517 03718 00169 02384 00730 -17774 Per Capita GDP -000079 04172 00190 08439 -00350 Labor Force Ag -010984 00000 00190 06799 -39378
r squared 09367 obs 505
Political Rights
Mean Mean Dep Ind Ratio
Est Coeff ProbO Var Var Elas mig=0
Constant 008952 00000 Ratio IPol Rts = 2 000330 05190 00156 02189 00464 -72399 Ratio j Pol Rts = 34 002234 00007 00216 02121 02193 -09276 Ratio I Po Rts = 5 -000076 08816 00157 01697 -00082 215273 Ratio I Pol Rts = 67 000694 00682 00120 02887 01670 -24381 Per Capita GDP -000064 05269 00190 08439 -00285 Labor Force Ag -010518 00000 00190 06799 -37707
r squared 09428 obs 505
Figure One 32 Countries Included in Migration Study
sV
_
- S -
--
j -o deg deg
t
Figure 2 Measurement Error Bounds
Coefficient Estimate 002 - Upper Bound Civ Lib = 56
0
-002i
-004
-006 Lower Bound Civ Lib 56
-008
-01 L
-012
-014
-01I6 I I I I I I I I I 1 0736 0786 0836
Maximum r squared Effect of Ratio I Civil Liberties
Figure 3 Measurement Error Bounds
Coefficient Estimate 005 -
Upper Bound Pol Rts = 5 0
Upper Bound Pol =Rts 2-005
-01 Lower Bound Pol Rts = 67
-01 - Lower Bound Pol Rts =2
-015 Lower Bound Pol Rts 5
-02 1 1 1 1
0762 0812 0862
Maximum r squared Effects of Ratio I Pol Rights
REFERENCES
Barkey Andrew P The Determinants of the Migration of Labor Out ofAgriculture in the United States 1940-1985 American Journal of AgriculturalEconomic 72(August 1990) 567-573
Eicher Carl K Facing Up to Africas Food Crisis In AgricultralDevelopment in the Third World eds Carl K Eicher and John M Staatz Baltimore The Johns Hopkins University Press 1984
Freedom House Freedom in the World Westport Conn Greenwood Press 1989
Graves Philip E and Marion Clawson Rural to Urban Migration PopulationDistribution Patterns In A Survey of Agricultural Economic Literature VolumeIlI Ed Lee Martin Minneapolis MN University of Minnesota Press 1981
Klepper S and E Learner Sets of Maximum Likelihodd Estimates forRegressions with all Variables Measured with Error Econometrica (Jan 1984) 168-83
McMillan John Gordon Rausser and Stan Johnson Freedoms and Economic Growth Institute for Policy Reform Working Paper Series November 1991
Mundlak Yair Intersectoral Factor Mobility and Agricultural Growth Washington DC International Food Price Research Institute 1979
Schultz T P Rural-Urban Migration in Colombia The Review of Economics and isi 53(May 1971) 157-163
Schultz T W Transforming Traditional Agriculture Chicago University of Chicago Press 1964
Scully Gerald The Institutional Framework and Economic DevelopmentJournal of Political Economy 96(1988) 652-662
Sjaastad Larry The Costs and Returns of Human Migration Journal of Political
EcnoMy 70(1962)80-93
Smith Adam An Inquiry Into the Nature and Causes of the Wealth of Nations Oxford Clarendon Press 1979
Todaro M P A Model of Labor Migration and Urban Unemployment in Less Developed Countries American Economic Review 59(1969)138-148
daro M P Internal Migration in Developing Countries A Review of the Theory Evidence Methodology and Research Priorities Geneva International Labor Organization 1976
Turok Ben Africa What Can Be Done London Institute for African Alternatives Zed Books Ltd 1987
United States Bureau of the Census International Data Base (unpublished mimeo)
World Bank African Economic and Financial Data United Nations DevelopmentProgramme New York New York and the World Bank Washington DC 1989
World Bank World Tables Baltimore and London The Johns Hopkins University Press 1991
Yap LYL The Attraction of the Cities A Review of the MigrationLiterature Journal of Development Economics 4(1977)239-264
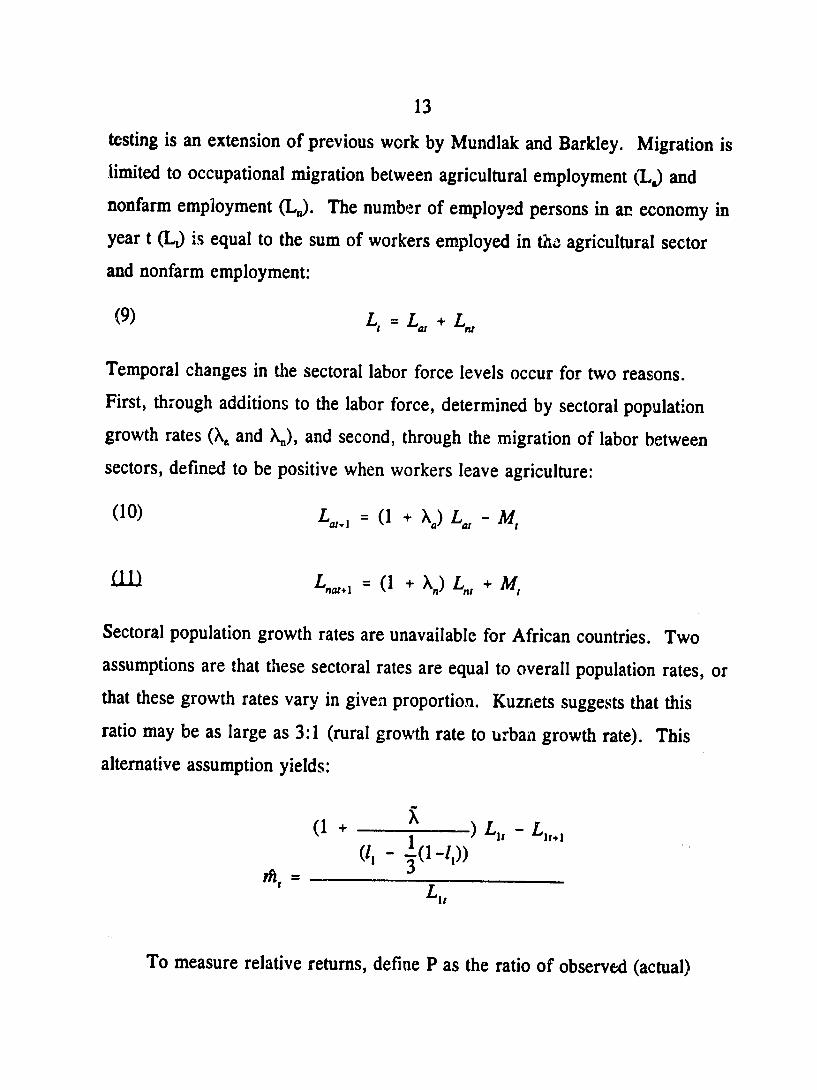
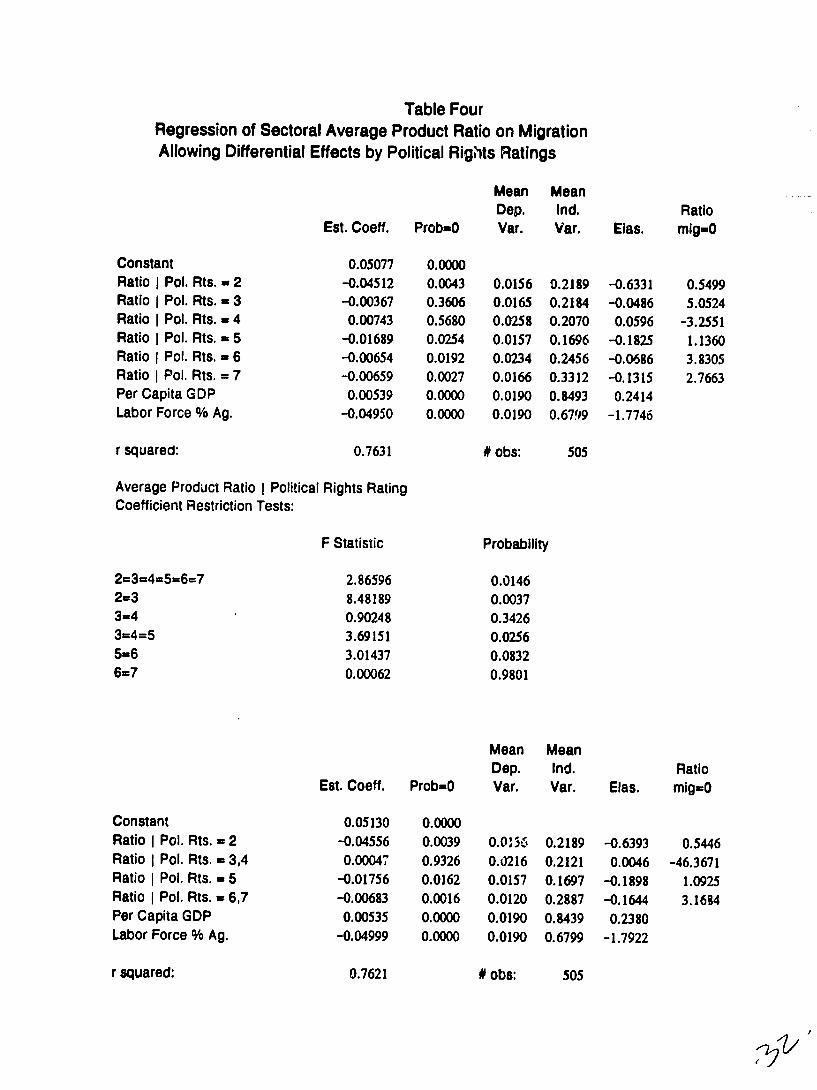
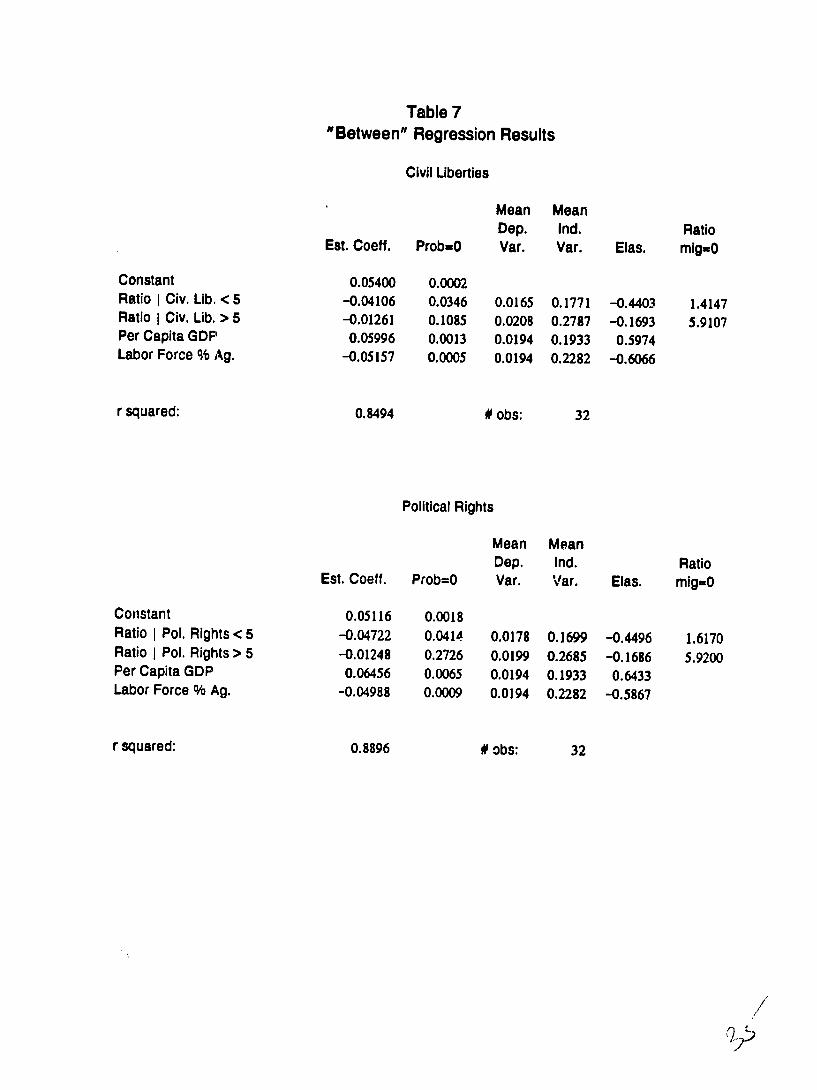
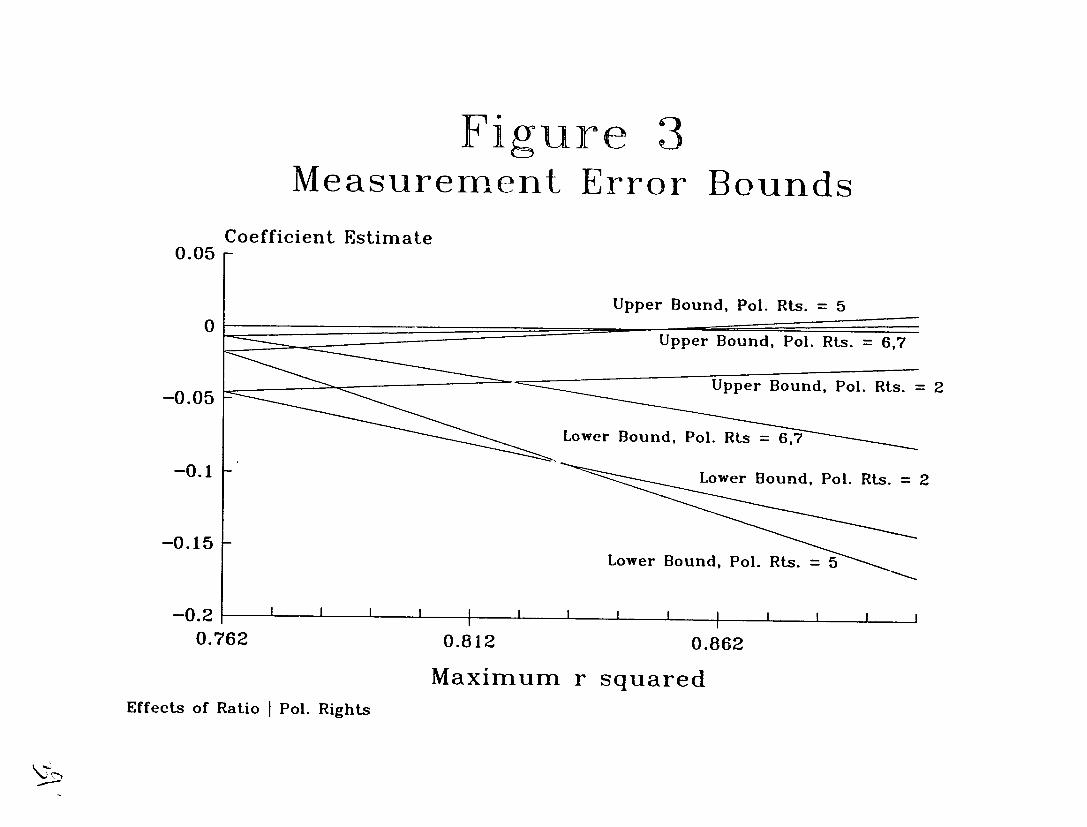