institut für mittelstandsforschung bonn - ifm bonn: home · institut für mittelstandsforschung...
TRANSCRIPT

Institut für Mittelstandsforschung Bonn
Materialien
SMEs in Germany Facts and Figures
2004
von
Brigitte Günterberg und Gunter Kayser
IfM-Materialien Nr. 161

Impressum
Herausgeber
Institut für Mittelstandsforschung Bonn Maximilianstr. 20, 53111 Bonn Telefon + 49/(0)228/72997-0 Telefax + 49/(0)228/72997-34 www.ifm-bonn.org Ansprechpartner Brigitte Günterberg IfM-Materialien Nr. 161 ISSN 2193-1852 (Internet) ISSN 2193-1844 (Print) Bonn, 2004
Das IfM Bonn ist eine Stiftung des privaten Rechts.

CONTENT I
CONTENT
page
Figures II Tables III
I. "MITTELSTAND" IN THE GERMAN ECONOMY - A DEFINITION 1 1. Qualitative Aspects 1 2. Quantitative Aspects 2 3. The Pragmatic Definition 3 4. The Economic Weight of the German "Mittelstand" 5
II. STATISTICAL DESCRIPTION OF THE GERMAN "MITTELSTAND" 5
1. Number of Enterprises and Turnover by Size-Classes 6 2. Development of Self-Employment, Enterprise Start-Ups
and Closures 13 3. "Mittelstand" and Employment 21
III. SPECIAL ASPECTS 24
1. Labour Intensive Production 24 2. High Relevance for Professional Training 26 3. SME and Internationalization 29 4. Research and Development in SMEs 30
APPENDIX 32

II CONTENT
page
Figures
Figure 1: Share of SMEs in number of enterprises and turnover by economic sections, Germany, 2002 8
Figure 2: SMEs by legal forms, Germany, 2002 12
Figure 3: Enterprise start-ups and liquidations, Germany, 1991 - 2003 16
Figure 4: Intensity of enterprise start-ups and liquidations, Germany, 1991 - 2003 17
Figure 5: Investment intensity and investment ratio in production industries, Germany, 2002 25
Figure 6: Organisational structure of the IfM Bonn 2003 33

CONTENT III
Tables
Table 1: Enterprise- and turnover-size structure for selected economic sections, Germany, 2002 10
Table 2: Self-employed persons and self-employed ratio, Germany 1991 - 2003 (excluding agricultural sector) 15
Table 3: Business insolvencies by economic sections, Germany, 1994 - 2003 18
Table 4: Rate of business insolvencies by economic sections, Germany, 1994 - 2003 19
Table 5: Business insolvencies by enterprise age, legal form and enterprise size, Germany, 2003 20
Table 6: Size structure of establishments and employment, Germany, 1999 - 2003 22
Table 7: Employment by economic sections and size-classes, Germany, 2003 23
Table 8: Vocational trainees and training-ratio, Germany, 1999 - 2003 27
Table 9: Structure of vocational trainees by economic sections and employment size-classes, Germany, 2003 28
Table 10: Exporting enterprises and their export based turnover, Germany, 2002 - absolute figures and export-ratios 29
Table 11: R&D-expenditures of the business enterprise sector by employment size-classes, Germany, 1991 - 2001 30
Table 12: R&D-expenditures of the business sector in relation to turnover by employment size-classes, Germany, 1991 - 2001 31
Table 13: Share of R&D-personnel in overall employment by employ-ment size-classes, Germany, 1991 - 2001 31


I. "MITTELSTAND" IN THE GERMAN ECONOMY ─ A DEFINITION 1
I. "MITTELSTAND" IN THE GERMAN ECONOMY ─ A DEFINITION
In most countries the term "Small and Medium-Sized Enterprises" (SMEs) is in common use. In general this term is used to be defined by statistical figures. It means that part of the supply side of the economy, that consists out of enterprises which in relation to "Large Size Enterprises" (LSEs) are either small or medium. The definable border line between SMEs and LSEs is drawn above all by two variables, the number of employees and the annual turnover. In Germany the term "Mittelstand" instead of SMEs is in use. This term up to a certain degree is identical with the statistically oriented definition mentioned above, but it also comprises characteristics which hardly can be deducted from official statistics.
The German term "Mittelstand" relates to economic aspects as well as to social and psychological characteristics. It includes quantitative and qualitative features. This aspect of the definition is essential for the complete understanding of the behaviour, motives, conditions, peculiarities and impacts of an economic field, constituted by (economically and legally) independent entrepreneurs and businesses.
Deriving the "Mittelstand´s" economic and social functions only from statistics therefore would neglect the facts that "Mittelstand" is an essential force in a dynamic, competitive and market oriented economy. By this "Mittelstand" is not only defined by size patterns but by characteristics like private ownership, freedom in decision making and contracting, individual responsibility of entrepreneurs for the success or failure of the own enterprise. Specially the soft facts constituting the qualitative part of the definition, require an adequate legislative frame concerning the legal protection of private property in an enterprise, the freedom of trade, stable financial environment and a reliable fiscal and economic policy.
1. Qualitative Aspects
The central (qualitative) characteristic of the "Mittelstand" focuses at the coherence between enterprise (professional office resp.) and owner. This is crucial for the understanding of what "Mittelstand" means. The close connection between a person and an economic unit strongly influences the market behaviour and performance of privately owned SMEs and determines the social and political role of the "Mittelstand". Qualitative factors like

2 I. "MITTELSTAND" IN THE GERMAN ECONOMY ─ A DEFINITION
• identity between ownership and personal responsibility for the enterprise’s activities
• identity of ownership and personal liability for the entrepreneur’s and the enterprise’s financial situation
• personal responsibility for the enterprise´s success or failure and
• personal relationship between employer and employees
are responsible for the fact the "Mittelstand" is not only an economic but also an outstanding social factor.
Mostly the qualitative criteria dominate the overall enterprise’s activities in such a degree that quantitative aspects for example size, sector or market share are of less importance. By these reasons even enterprises exceeding the size-classes of the statistically drawn limit - from a qualitative perspective - in many cases can be regarded as SMEs.
To finalise: The qualitative aspects of the "Mittelstand" influence the choice of the legal form of the enterprise as well as its way of financing, innovative behaviour, the number of products or offered services and the managerial attitudes to run the business.
2. Quantitative Aspects
Bearing in mind the qualitative aspects described above, the term "Mittelstand", from the quantitative point of view, describes enterprises of all economic sectors as far as they do not exceed a certain size.
Different definitorial indicators have been discussed in the past, such as profit, fixed assets, balance sheet total, value added, number of employees or annual turnover. Each of these criteria needs to be discussed carefully before being applied for comparative studies. In general, other characteristics of the enterprise such as production method or market share could also be used as defining criteria. Yet, official statistics at least in Germany do not provide the data needed to quantify most of these criteria. Thus like in many other countries also in Germany a rather pragmatic approach is used in order to estimate and describe the number of enterprises by size-classes or to generate and compare empirical findings. In most cases sector, annual turnover and the number of employees are used as size-indicators.

I. "MITTELSTAND" IN THE GERMAN ECONOMY ─ A DEFINITION 3
Especially the sector of economic activity is of crucial importance for a statistical analysis of the SME-sector. Each economic sector is characterised by its own micro- and macro-economic specialities, for example the capital and/or labour intensity, the size of the relevant markets, the production technology, relationship to customers and suppliers etc. These additional variables must be taken under consideration when SMEs are analysed and compared. Regardless the indicators finally chosen, the quantitative definition of SMEs will always be a helpful approximation which makes the empirical analysis somewhat easier.
3. The Pragmatic Definition
Despite all methodological and theoretical objections, for a comprehensive statistical evaluation it is necessary to classify firms by their size. In some cases other variables such as economic sector, legal form, location, age of enterprise must also be taken into consideration.
In general, the Institut für Mittelstandsforschung Bonn (IfM Bonn; Institute for SME-Research Bonn, Germany) applies the following pattern of classification for its SME-related research projects:
Classification Scheme for Small and Medium-Sized Enterprises used by IfM Bonn
Size of Enterprise Number of Employees Turnover (€/Year)
small up to 9 up to 1 Million medium-sized 10 to 499 1 to 50 Million
large 500 and more 50 Million and more IfM Bonn
The European Union uses and recommends to the member states a definition that in one point differs from the definition which is still in use in Germany. This difference relates to the number of employees.
Classification Scheme for SMEs after the EU
Size of Enterprise Number of Employees Turnover (€/Year)
small up to 49 up to 9 Million medium-sized 50 to 249 9 to 50 Million
large 250 and more more than 50 Million IfM Bonn

4 I. "MITTELSTAND" IN THE GERMAN ECONOMY ─ A DEFINITION
The EU definition also comprises elements concerning the enterprises annual balance sheet and the degree of partnerships or in other words the independency of the enterprise from holding companies.
In practise also in Germany the EU definition by employment size more and more replaces the traditional definition, at least in public support programs.
In May 2003 the European Commission has approved changes to the recommended EU definition of micro, small and medium-sized enterprises which is used to determine eligibility for national SME support schemes and EU-wide SME programs. These changes will apply from 1 January 2005.
New Classification Scheme for SMEs after the EU (from 2005)
Size of Enterprise Number of Employees
Turnover (€/Year)
Balance sheet total (€/Year)
micro up to 9 up to 2 Million up to 2 Million small 10 to 49 2 to 10 Million 2 to 10 Million
medium-sized 50 to 249 10 to 50 Million 10 to 43 Million large 250 and more more than 50 Million more than 43 Million
IfM Bonn
While it is compulsory to respect the staff headcount thresholds an SME has to satisfy either the turnover or the balance sheet ceiling and may exceed one of them without losing its status.

I. "MITTELSTAND" IN THE GERMAN ECONOMY ─ A DEFINITION 5
4. The Economic Weight of the German "Mittelstand"
05 06 014© IfM Bonn
2003
3.38 million SMEs with approximately 19.98 million employees
4.
They provide vocational training for
81.9 % of all apprentices.
1.
These are 99.7 %
of all enterprises subject to VAT.
2.
They realise 41.2 %
of all turnoverssubject to VAT.
3.
They employ 70.2 %
of all employeesin private business.
99.7 % 41.2 %
70.2 % 81.9 %
= Share of SMEs

6 II. STATISTICAL DESCRIPTION OF THE GERMAN "MITTELSTAND"
II. STATISTICAL DESCRIPTION OF THE GERMAN "MITTELSTAND"
1. Number of Enterprises and Turnover by Size-Classes
The most important information source on enterprises and their turnover by size distribution is offered by the Statistics of Value Added Tax (VAT). Data used to be compiled in a two-year interval. Since 1997 they are published annually with a time-lag of two years. The data are supplied by the Financial Administration and subsequently elaborated and published by the Federal Statistical Office Germany.
Based on VAT-Statistics figure 1 illustrates the total number of SMEs of selected economic divisions and their turnover as percentage of the total number of enterprises and of the total turnover. Remarkably, the (quantitatively defined) "Mittelstand" tends to present lower shares in the manufacturing sector than in the other economic sections.
Table 1 provides some in depth informations about the size distribution of special relevant sections and the total number of enterprises and their turnover for 2002. The sections "agriculture, hunting and forestry", "fishing", "mining and quarrying", "electricity, gas and water supply", "public administration and defence, compulsory social security" and "education" are not explicitly mentioned. That is due to the fact that in these sections many numerical values are not to be disclosed and that most of the turnover in some of these sections is not subject to VAT.
Figure 2 illustrates the SMEs in Germany by their legal form. Nearly 70 per cent of all small and medium-sized enterprises are led as sole proprietorships meeting no formal or legal requirements. As far as they exceed a certain size they are obliged to register in a trade register which normally is necessary when the enterprise employs employees for which social security payments are obligatory. A sole proprietorship is the typical legal form for German SMEs of all sectors. Especially in "manufacturing" as well as in "wholesale and commission trade (except motor vehicles)" a large number of SMEs are constituted as limited liability companies (GmbH).
Next to the sole proprietorship, the limited liability companies represent the second most selected legal form for SMEs. In the case of an enterprise constituted as a limited liability however, the unity of risk and management may

II. STATISTICAL DESCRIPTION OF THE GERMAN "MITTELSTAND" 7
not always exist, as the enterprise could be owned by a group of companies (bearing the entrepreneurial risk but not being involved in the daily management of the enterprise). Thus, an important (qualitative) criterion for the definition of an SME is missing. As a general rule, however, it can be assumed that the legal form of a limited liability is primarily chosen in order to restrict the financial risk of the involved owner-manager(s). This is to say that enterprises in the legal form of limited liabilities in most cases have to be regarded as classic SMEs; as long as they do not exceed the respective quantitative size-thresholds.

8 II. STATISTICAL DESCRIPTION OF THE GERMAN "MITTELSTAND"
Figure 1: Share of SMEs in number of enterprises and turnover by economic sections, Germany, 2002
05 06 023© IfM Bonn
17
18
19
20
21
22
23
24
25
26
27
28
29
30
31
32
33
34
35
36
37
NACE Rev. 1.1
Enterprises Turnover
M. o. medical, precision and opticalinstruments, watches and clocks
Publishing, printing and reproduction of ecorded media
M. o. wood and of products of wood and cork, exept furniture; M. o. articles of straw and plaiting materials
Tanning and dressing of leather; M. o. luggage, handbags, saddlery, harness and footwear
M. o. motor vehicles, trailers and semi-trailers
M. o. radio, telev. a. commun. equipm. a. apparat.
M. o. electrical machinery and apparatus n.e.c.
M. o. fabr. metal products,exc. machin. a. equip.
M.o. coke, ref. petroleum products and nucl. fuel
M. o. wearing apparel; dressing and dyeing of fur
in %
Manufacture of textiles
M. o. pulp, paper and paper products
M. o. chemicals and chemical products
M. o. rubber and plastic products
M. o. other non-metallic mineral products
M. o. basic metals
M. o. machinery and equipment n.e.c.
M. o.office machinery and computers
M. o. other transport equipment
M. o. furniture; manufacturing n.e.c
Recycling
99.260.5
99.0
99.3
47.6
41.6
99.770.2
95.429.7
99.351.0
82.80.7
94.413.0
97.941.9
99.353.9
96.715.1
99.567.1
98.238.2
99.218.5
98.123.0
98.024.0
99.346.9
95.53.3
97.817.3
99.663.3
99.464.5

II. STATISTICAL DESCRIPTION OF THE GERMAN "MITTELSTAND" 9
Continue Figure 1
05 06 024© IfM Bonn
45
50
51
52
55
60
61
62
63
64
70
71
72
73
74
90
92
93
NACE Rev. 1.1
Enterprises Turnover
Sale, maintenance and repair of motor vehicles and motorcycles; retail sale of automotive fuel
Wholesale trade and commission tradeexcept of motor vehicles and motorcycles
Retail trade, except of motor vehicles and motorcycles; repair of personal and household goods
Renting of machinery and equipment without operator and of personal and household goods
Supporting and auxiliary transport activities; activities of travel agencies
Sewage and refuse disposal, sanitation and similar activities
Construction
Hotels and restaurants
Land transport; transport via pipelines
Water transport
Air transport
Post and telecommunications
Real estate activities
Computer and related activities
Research and development
Other business activities
Recreational, cultural and sporting activities
Other service activities
in %
99.982.9
99.766.6
99.037.5
99.947.9
100.090.0
99.960.0
99.476.6
97.18.1
99.548.9
99.43.2
99.977.6
99.850.6
99.861.2
99.858.9
99.956.0
99.067.0
99.952.5
100.089.6
Source: Federal Statistical Office Germany, VAT-Statistics 2002, Wiesbaden 2004; own
calculations by IfM Bonn

10 II. STATISTICAL DESCRIPTION OF THE GERMAN "MITTELSTAND"
Table 1: Enterprise- and turnover-size structure for selected economic sections,1) Germany, 2002
Sections A-O Section D All economic sections Manufacturing
Enterprises 2) Turnover 3) Enterprises 2) Turnover 3)
Enterprises with turnover from € ... to below ... abs. in % in Mill. € in % abs. in % in Mill. € in % 16 620 - 50 000 804 626 27.5 25 185.9 0.6 44 153 15.5 1 400.0 0.1 50 000 - 100 000 578 390 19.8 41 654.0 1.0 37 644 13.2 2 736.2 0.2 100 000 - 250 000 664 344 22.7 106 003.9 2.5 59 286 20.8 9 826.6 0.6 250 000 - 500 000 349 435 11.9 123 331.8 2.9 45 494 16.0 16 272.1 1.1 500 000 - 1 Mill. 229 728 7.8 161 249.7 3.8 34 682 12.2 24 431.1 1.6 1 Mill. - 2 Mill. 139 597 4.8 194 936.8 4.6 22 971 8.1 32 272.4 2.1 2 Mill. - 5 Mill. 90 936 3.1 279 699.0 6.6 18 995 6.7 59 754.1 3.9 5 Mill. - 10 Mill. 32 958 1.1 229 488.1 5.4 9 089 3.2 63 996.4 4.2 10 Mill. - 25 Mill. 20 990 0.7 322 505.2 7.6 6 778 2.4 105 858.1 7.0 25 Mill. - 50 Mill. 7 638 0.3 265 989.0 6.3 2 852 1.0 99 483.6 6.5 50 Mill. and more 7 928 0.3 2 502 518.8 58.8 3 176 1.1 1 105 231.6 72.7 Total 2 926 570 100.0 4 252 562.3 100.0 285 120 100.0 1 521 262.2 100.0
Section F Division G 50
Construction Sale. maintenance and repair of motor vehicles and motorcycles; retail sale of automotive fuel
Enterprises 2) Turnover 3) Enterprises 2) Turnover 3)
Enterprises with turnover from € ... to below ... abs. in % in Mill. € in % abs. in % in Mill. € in % 16 620 - 50 000 62 577 19.6 2 023.0 1.0 16 248 15.4 518.2 0.3 50 000 - 100 000 56 510 17.7 4 096.5 2.1 14 527 13.8 1 057.1 0.6 100 000 - 250 000 78 696 24.7 12 878.5 6.6 21 661 20.5 3 561.5 2.0 250 000 - 500 000 53 479 16.8 19 034.7 9.7 15 710 14.9 5 639.1 3.1 500 000 - 1 Mill. 36 039 11.3 25 113.1 12.8 14 119 13.4 10 078.2 5.5 1 Mill. - 2 Mill. 18 032 5.7 24 846.9 12.7 10 323 9.8 14 464.0 8.0 2 Mill. - 5 Mill. 9 430 3.0 28 164.9 14.4 7 523 7.1 23 304.2 12.8 5 Mill. - 10 Mill. 2 536 0.8 17 386.1 8.9 2 893 2.7 20 129.6 11.1 10 Mill. - 25 Mill. 1 267 0.4 18 799.9 9.6 1 705 1.6 25 485.9 14.0 25 Mill. - 50 Mill. 284 0.1 9 763.0 5.0 483 0.5 16 782.3 9.2 50 Mill. and more 190 0.1 33 375.8 17.1 296 0.3 60 687.3 33.4 Total 319 040 100.0 195 482.4 100.0 105 488 100.0 181 707.4 100.0
Division G 51 Division G 52
Wholesale trade and commission trade. except of motor vehicles and motorcycles
Retail trade. except of motor vehicles and motorcycles; repair of personal and household
goods Enterprises 2) Turnover 3) Enterprises 2) Turnover 3)
Enterprises with turnover from € ... to below ... abs. in % in Mill. € in % abs. in % in Mill. € in % 16 620 - 50 000 37 366 20.3 1 178.1 0.2 91 478 21.9 2 901.9 0.7 50 000 - 100 000 28 097 15.3 2 025.9 0.3 77 208 18.5 5 610.3 1.3 100 000 - 250 000 34 992 19.0 5 666.1 0.8 106 665 25.5 17 267.9 4.0 250 000 - 500 000 22 469 12.2 8 029.5 1.1 59 604 14.3 20 928.1 4.9 500 000 - 1 Mill. 18 761 10.2 13 365.9 1.8 38 669 9.2 27 313.7 6.4 1 Mill. - 2 Mill. 14 880 8.1 21 150.6 2.9 26 081 6.2 36 340.7 8.5 2 Mill. - 5 Mill. 13 223 7.2 41 824.4 5.8 12 996 3.1 38 466.3 9.0 5 Mill. - 10 Mill. 6 152 3.3 43 238.4 6.0 3 120 0.7 21 305.9 5.0 10 Mill. - 25 Mill. 4 645 2.5 72 072.5 10.0 1 359 0.3 20 625.3 4.8 25 Mill. - 50 Mill. 1 809 1.0 62 870.1 8.7 398 0.1 13 900.5 3.3 50 Mill. and more 1 780 1.0 452 684.0 62.5 544 0.1 222 510.6 52.1 Total 184 174 100.0 724 105.5 100.0 418 122 100.0 427 171.3 100.0
Section H Section I Hotels and restaurants Transport. storage and communication
Enterprises 2) Turnover 3) Enterprises 2) Turnover 3)
Enterprises with turnover from € ... to below ... abs. in % in Mill. € in % abs. in % in Mill. € in % 16 620 - 50 000 69 624 28.1 2 246.4 4.3 33 936 27.1 1 089.7 0.4 50 000 - 100 000 66 275 26.7 4 807.1 9.1 23 955 19.1 1 719.0 0.7 100 000 - 250 000 71 936 29.0 11 288.9 21.4 27 198 21.7 4 333.0 1.7 250 000 - 500 000 25 343 10.2 8 682.0 16.5 14 939 11.9 5 280.2 2.1 500 000 - 1 Mill. 9 183 3.7 6 232.1 11.8 10 684 8.5 7 534.6 3.0 1 Mill. - 2 Mill. 3 470 1.4 4 743.9 9.0 6 747 5.4 9 490.2 3.7 2 Mill. - 5 Mill. 1 540 0.6 4 575.9 8.7 4 694 3.7 14 563.7 5.7 5 Mill. - 10 Mill. 316 0.1 2 129.9 4.0 1 637 1.3 11 313.7 4.4 10 Mill. - 25 Mill. 117 0.0 1 717.1 3.3 933 0.7 14 146.3 5.5 25 Mill. - 50 Mill. 29 0.0 977.6 1.9 268 0.2 9 288.6 3.6 50 Mill. and more 28 0.0 5 249.2 10.0 287 0.2 176 617.6 69.2 Total 247 861 100.0 52 650.0 100.0 125 278 100.0 255 376.6 100.0 © IfM Bonn

II. STATISTICAL DESCRIPTION OF THE GERMAN "MITTELSTAND" 11
Continue of table 1 Section J Division K 70
Financial intermediation Real estate activities Enterprises 2) Turnover 3) Enterprises 2) Turnover 3)
Enterprises with turnover from € ... to below ... abs. in % in Mill. € in % abs. in % in Mill. € in % 16 620 - 50 000 6 572 42.0 200.5 0.6 110 978 43.5 3 305.8 2.8 50 000 - 100 000 3 461 22.1 243.7 0.7 52 236 20.5 3 708.0 3.1 100 000 - 250 000 2 612 16.7 401.0 1.2 44 079 17.3 6 874.6 5.8 250 000 - 500 000 1 130 7.2 397.5 1.2 18 848 7.4 6 628.3 5.6 500 000 - 1 Mill. 623 4.0 438.0 1.3 12 495 4.9 8 808.5 7.4 1 Mill. - 2 Mill. 455 2.9 637.5 1.9 8 162 3.2 11 413.5 9.6 2 Mill. - 5 Mill. 359 2.3 1 126.8 3.3 5 299 2.1 16 219.4 13.7 5 Mill. - 10 Mill. 187 1.2 1 319.1 3.9 1 616 0.6 11 313.8 9.5 10 Mill. - 25 Mill. 121 0.8 1 846.1 5.5 957 0.4 14 458.9 12.2 25 Mill. - 50 Mill. 56 0.4 1 942.3 5.8 276 0.1 9 454.4 8.0 50 Mill. and more 73 0.5 25 207.9 74.7 181 0.1 26 559.5 22.4 Total 15 649 100.0 33 760.3 100.0 255 127 100.0 118 744.7 100.0
Division K 71 Division K 72 Renting of machinery and equipment without
operator and of personal and household goods Computer and related activities
Enterprises 2) Turnover 3) Enterprises 2) Turnover 3)
Enterprises with turnover from € ... to below ... abs. in % in Mill. € in % abs. in % in Mill. € in % 16 620 - 50 000 7 657 29.3 237.8 0.7 16 115 29.1 499.2 1.1 50 000 - 100 000 4 897 18.7 350.0 1.0 11 896 21.5 865.4 1.9 100 000 - 250 000 5 341 20.4 853.2 2.4 13 788 24.9 2 122.5 4.7 250 000 - 500 000 2 799 10.7 991.2 2.8 5 172 9.4 1 829.3 4.1 500 000 - 1 Mill. 2 127 8.1 1 501.2 4.2 3 587 6.5 2 516.5 5.6 1 Mill. - 2 Mill. 1 459 5.6 2 033.9 5.7 2 156 3.9 3 020.6 6.7 2 Mill. - 5 Mill. 1 123 4.3 3 533.4 9.9 1 517 2.7 4 701.0 10.4 5 Mill. - 10 Mill. 393 1.5 2 725.3 7.7 563 1.0 3 898.9 8.6 10 Mill. - 25 Mill. 184 0.7 2 763.1 7.8 314 0.6 4 828.5 10.7 25 Mill. - 50 Mill. 87 0.3 3 023.0 8.5 94 0.2 3 296.4 7.3 50 Mill. and more 63 0.2 17 580.9 49.4 95 0.2 17 519.0 38.8 Total 26 130 100.0 35 593.0 100.0 55 297 100.0 45 097.1 100.0
Division K 73 Division K 74 Research and development Other business activities
Enterprises 2) Turnover 3) Enterprises 2) Turnover 3)
Enterprises with turnover from € ... to below ... abs. in % in Mill. € in % abs. in % in Mill. € in % 16 620 - 50 000 2 488 33.3 77.0 1.3 144 210 32.3 4 501.7 1.6 50 000 - 100 000 1 589 21.3 113.8 1.9 97 481 21.8 6 980.5 2.5 100 000 - 250 000 1 662 22.3 257.3 4.4 102 409 22.9 16 014.9 5.6 250 000 - 500 000 643 8.6 226.4 3.9 46 557 10.4 16 396.3 5.8 500 000 - 1 Mill. 476 6.4 337.7 5.8 28 777 6.4 20 053.4 7.1 1 Mill. - 2 Mill. 262 3.5 367.6 6.3 14 871 3.3 20 601.0 7.3 2 Mill. - 5 Mill. 223 3.0 668.5 11.5 8 275 1.9 25 149.7 8.9 5 Mill. - 10 Mill. 56 0.8 375.9 6.4 2 391 0.5 16 380.0 5.8 10 Mill. - 25 Mill. 36 0.5 575.2 9.9 1 280 0.3 19 358.3 6.8 25 Mill. - 50 Mill. 12 0.2 437.9 7.5 394 0.1 13 660.7 4.8 50 Mill. and more 17 0.2 2 401.3 41.1 513 0.1 124 782.6 44.0 Total 7 464 100.0 5 838.7 100.0 447 158 100.0 283 879.2 100.0
Section N Section O Health and social work Other community, social and
personal service activities Enterprises 2) Turnover 3) Enterprises 2) Turnover 3)
Enterprises with turnover from € ... to below ... abs. in % in Mill. € in % abs. in % in Mill. € in % 16 620 - 50 000 12 111 30.0 375.6 0.9 118 138 42.1 3 654.0 3.9 50 000 - 100 000 7 933 19.7 569.2 1.4 69 794 24.8 4 966.5 5.3 100 000 - 250 000 9 395 23.3 1 503.3 3.7 55 714 19.8 8 561.6 9.1 250 000 - 500 000 5 391 13.4 1 922.8 4.7 19 044 6.8 6 611.4 7.0 500 000 - 1 Mill. 3 180 7.9 2 182.6 5.3 9 353 3.3 6 478.8 6.9 1 Mill. - 2 Mill. 1 071 2.7 1 452.2 3.6 4 631 1.6 6 416.9 6.8 2 Mill. - 5 Mill. 548 1.4 1 682.6 4.1 2 507 0.9 7 716.8 8.2 5 Mill. - 10 Mill. 246 0.6 1 745.4 4.3 898 0.3 6 258.2 6.6 10 Mill. - 25 Mill. 181 0.4 2 956.4 7.2 504 0.2 7 590.2 8.0 25 Mill. - 50 Mill. 115 0.3 4 190.1 10.3 202 0.1 7 014.6 7.4 50 Mill. and more 141 0.3 22 243.7 54.5 158 0.1 29 288.2 31.0 Total 40 312 100.0 40 823.8 100.0 280 943 100.0 94 557.2 100.0 © IfM Bonn
1) NACE Rev. 1.1. 2) Only enterprises liable to VAT with annual deliveries and other performances (turnover)
exceeding Euro 16 620. 3) Excl. VAT. Source: Federal Statistical Office Germany, VAT-Statistics 2002, Wiesbaden, 2004; own
calculations by IfM Bonn

12 II. STATISTICAL DESCRIPTION OF THE GERMAN "MITTELSTAND"
Figure 2: SMEs by legal forms, Germany, 2002
05 06 025© IfM Bonn
Sole proprietorships
Other legal forms
15.4 %
2.0 %
Enterprises1)
Limited liability companies
(GmbH)
Sole proprietorships
Limited liability companies (GmbH)
Partnerships (OHG-unlimited company,
KG-limited partnership)
Other legal forms
Turnover1)
2)
General commercial partnerships incl. civil-law ass., limited commercial partnerships incl. those with a GmbH as partner, public limited companies, partnerships limited by shares, mining comp., trade and industrial co-operatives, others.
1)
Excl. VAT.2)
Total turnover of all SMEs: 1 750 043 Mill. €
Total number of all SMEs: 2 918 642
Partnerships (OHG-unlimited company,
KG-limited partnership)12.6 %
37.6 %
29.5 %
5.6 %
27.3 %
69.9 %
Source: Federal Statistical Office Germany, VAT-Statistics 2002, Wiesbaden 2004; own
calculations by IfM Bonn
II. STATISTICAL DESCRIPTION OF THE GERMAN "MITTELSTAND" 13
2. Development of Self-Employment, Enterprise Start-Ups and Closures
There are more than 3.4 million self-employed persons in Germany. In 2003 nearly one fifth of the self-employed belonged to the manufacturing industry, nearly one third in trade, transport and communication and the rest of the self-employed belonged to the service sector (agricultural sector excluded).
Table 2 represents the number and shares of self-employed in the economic sectors: manufacturing, trade/transport/communication, services. The table also provides the ratio of self-employed persons related to the total of working persons by sectors. The latter often is interpreted as indicator for the start-up emphasis among a national population.
The ratio increases between 1991 and 2003 from 7.3 % (1991) to 9.8 % (2003) due to an ongoing start-up emphasis in Germany. It can be shown, that the number of self-employed persons in service sector is increasing and in the manufacturing sector decreasing. This gives evidence to the fact that Germany like all other economies is transforming to a certain extent from an industrial to a service dominated economy.
Figure 3 shows the annual number of enterprise start-ups and closures over the period 1991 - 2003 in Germany. Since 1996 also the persons entering (or leaving) self-employment by way of taking over an existing enterprise (or transferring the enterprise to a new owner) are included. It is evident, that beginning with 1998 start-up emphasis decreased in Germany, but after a stabilisation in 2002 increased again in the year 2003. One reason for this can be seen in a considerable increase of start-ups carried out by unemployed persons. Stimulated by public subsidies for entering self-employment ("Überbrückungsgeld", and in addition since 2003 "Ich-AG") many unemployed persons prefer to change their status into that of a self employ business starter.
As a measure for the start-up and closure dynamics the indicators "intensity of enterprise start-ups and liquidations" are presented in figure 4. These indicators bring the number of start-ups and liquidations resp. in relation to 10 000 inhabitants in working age (18 - 64 years).
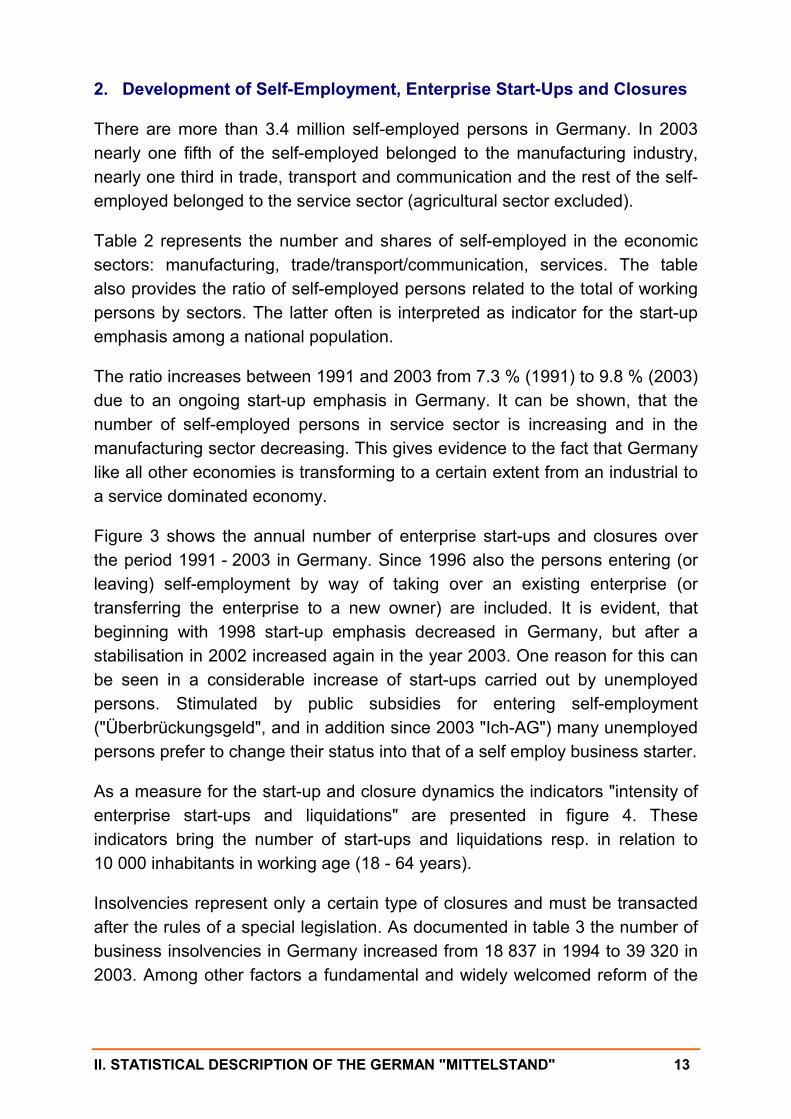
Insolvencies represent only a certain type of closures and must be transacted after the rules of a special legislation. As documented in table 3 the number of business insolvencies in Germany increased from 18 837 in 1994 to 39 320 in 2003. Among other factors a fundamental and widely welcomed reform of the

14 II. STATISTICAL DESCRIPTION OF THE GERMAN "MITTELSTAND"
insolvency legislation in the year 1999 is responsible for the increase of the number of insolvencies.
The rate of business insolvencies (number of insolvencies per 1 000 enterprises) by economic sections is presented in table 4. While in the years 1994 - 2003 the intensity of liquidations only slightly increased and reached its maximum in 1999, the rate of business insolvencies has continuously increased (with one exception in 1999). In 2003 it reached a level that is almost the double from 1994. Especially the sections "construction", "financial intermediation" and "transport, storage and communication" show a particularly high rate of business insolvencies.
In table 5 business insolvencies in Germany 2003 are differentiated by enterprise age and legal forms resp., as well as by employment size. Approx. 80 % of the insolvencies of enterprises (with stated number of employees) concern enterprises with 0 to 5 employees, and only 0.8 % enterprises with 101 and more employees. Approx. 60 % of these enterprises with 0 to 5 employees are younger than 8 years, whereas approx. 70 % of the large enterprises are more than 8 years old. Differentiated by legal forms most business insolvencies concern limited liability companies (GmbH) (51.0 %), followed by sole proprietorships incl. small business ("Kleingewerbe").

II. STATISTIC
AL D
ESCR
IPTION
OF TH
E GER
MA
N "M
ITTELSTAN
D" 15
Table 2: Self-employed persons and self-employed ratio, Germany 1991 - 2003 (excluding agricultural sector)
Manufacturing Sector Trade/Transport/ Communication Services Total
Year
Self-employed
Self-employed
ratio1)
Self-employed
Self-employed
ratio1)
Self-employed
Self-employed
ratio1)
Self-employed
Self-employed
ratio1) in 1 000 in %2) in % in 1 000 in %2) in % in 1 000 in %2) in % in 1 000 in %2) in % 1991 723 27.6 4.7 709 27.0 10.6 1 190 45.4 8.6 2 622 100.0 7.3 1992 758 28.2 5.2 710 26.4 10.7 1 224 45.5 8.6 2 692 100.0 7.6 1993 773 27.8 5.5 717 25.8 10.9 1 293 46.5 9.0 2 783 100.0 7.9 1994 794 27.2 5.8 741 25.4 11.3 1 382 47.4 9.4 2 917 100.0 8.4 19953) 725 24.4 5.6 1 062 35.8 12.9 1 182 39.8 8.6 2 969 100.0 8.5 1996 757 24.6 6.0 1 066 34.6 13.0 1 255 40.8 8.9 3 078 100.0 8.8 1997 778 24.3 6.3 1 088 34.0 13.3 1 337 41.7 9.4 3 203 100.0 9.2 1998 772 23.6 6.4 1 103 33.7 13.4 1 397 42.7 9.6 3 272 100.0 9.4 1999 762 23.3 6.3 1 091 33.3 13.1 1 422 43.4 9.6 3 275 100.0 9.3 2000 774 23.3 6.4 1 074 32.3 12.8 1 475 44.4 9.8 3 323 100.0 9.3 2001 763 23.0 6.4 1 055 31.8 12.4 1 501 45.2 9.7 3 319 100.0 9.3 2002 760 22.7 6.5 1 032 30.9 12.4 1 553 46.4 10.0 3 345 100.0 9.4 2003 771 22.4 6.8 1 035 30.0 12.5 1 640 47.6 10.4 3 446 100.0 9.8 © IfM Bonn
1) Self-employed ratio = self-employed as share of total working population (incl. self-employed), in %. 2) Horizontal structure. 3) A direct comparison with the values of the previous years is not possible as in 1995 the classification of economic sections has been
changed.
Source: Federal Statistical Office Germany, Position and Development of Gainful Employment (Microcensus), Wiesbaden, various volumes; own calculations by IfM Bonn

16 II. STATISTICAL DESCRIPTION OF THE GERMAN "MITTELSTAND"
Figure 3: Enterprise start-ups1) and liquidations1), Germany, 1991 - 2003
© IfM Bonn05 06 022© IfM Bonn
531494 486 493
528507 507 513
493472
455 452
506
308 312339
372407 418 405 413 423
394 386 389 397
223182
147121 121
89 102 10070 78 69 63
109
1991 1992 1993 1994 1995 1996 1997 1998 1999 2000 2001 2002 2003
Start-ups Liquidations Balance
1) 2)
Since 1997 modified calculations on the basis of business registrations and deregistrations as recorded by the Federal Statistical Office Germany.
Provisional estimation.
1)
2)
in thousands
1) Since 1996 including persons entering (leaving) self-employment by way of taking
over an existing enterprise (by transferring the enterprise to a new owner).
Source: Own compilation by IfM Bonn on the basis of business registrations and deregistrations as regarded by the Federal Statistical Office Germany

II. STATISTICAL DESCRIPTION OF THE GERMAN "MITTELSTAND" 17
Figure 4: Intensity of enterprise start-ups1) and liquidations1), Germany, 1991 - 2003
© IfM Bonn05 06 026© IfM Bonn
Enterprise start-ups and liquidations resp. per 10 000 inhabitants in working age (18 - 64 years).Provisional estimation.
1)2)
1991 1992 1993 1994 1995 1996 1997 1998 1999 2000 2001 2002 2003 50.0
60.0
70.0
80.0
90.0
100.0
110.0
Intensity of start-ups Intensity of liquidations
2)
1) 1)
58.4 58.8
63.8
70.0
76.578.5
76.0 77.679.6
74.3 73.5 75.5
100.7
93.191.5 92.8
99.395.2 95.3 96.3
92.788.9
85.8 85.5
96.3
72.8
1) Since 1996 including persons entering (leaving) self-employment by way of taking
over an existing enterprise (by transferring the enterprise to a new owner).
Source: Own compilation by IfM Bonn on the basis of business registrations and deregistrations and the current population projection as regarded by the Federal Statistical Office Germany

18 II. STATISTIC
AL D
ESCR
IPTION
OF TH
E GER
MA
N "M
ITTELSTAN
D"
Table 3: Business insolvencies by economic sections, Germany, 1994 - 2003
Business insolvencies2) Heading of classifi-cation1)
Economic section
1994 1995 1996 1997 1998 19993) 2000 20014) 2002 2003 A Agriculture, hunting and forestry 328 381 403 479 509 509 470 538 559 677 B Fishing 2 3 4 3 7 7 7 7 2 1 C Mining and quarrying 16 15 22 14 26 26 24 31 37 32 D Manufacturing 3 183 3 348 3 643 3 598 3 287 3 139 3 305 3 655 4 344 4 556 E Electricity, gas and water supply 2 8 10 11 7 19 17 20 27 27 F Construction 3 971 5 542 7 041 7 788 8 112 7 766 8 103 9 026 9 160 8 697 G Wholesale and retail trade; repair of motor vehicles,
motorcycles and personal and household goods 4 824 5 584
5 967 6 111 6 144 5 668 5 624 6 005 7 491
7 913 G 50 Sale, maintenance and repair of motor vehicles and
motorcycles retail sale of automotive fuel 633 755
717 776 758 786 926 1 004 1 135
1 221 G 51 Wholesale trade and commission trade, except of
motor vehicles and motorcycles 2 038 2 440
2 595 2 537 2 317 2 215 2 009 2 183 2 510
2 387 G 52 Retail trade, except of motor vehicles and
motorcycles; repair of personal and household goods
2 153 2 389
2 655 2 798 3 069 2 667 2 689 2 818 3 846
4 305
H Hotels and restaurants 1 006 1 235 1 476 1 679 1 819 1 674 1 927 2 204 2 655 3 104 I Transport, storage and communication 1 321 1 457 1 499 1 558 1 468 1 299 1 714 2 137 2 451 2 593 J Financial intermediation 146 140 182 198 191 185 198 233 383 438 K Real estate, renting and business activities 3 314 3 825 4 353 4 878 5 031 4 797 5 151 6 694 8 174 8 671
K 70/71 Real estate activities, renting of machinery and equipment without operator and of personal and household goods 823 1 101
1 409 1 689 1 821 1 734 1 806 2 124 2 238
2 304 K 72-74 Computer and related activities, research and
development, other business activities 2 491 2 724
2 944 3 189 3 210 3 063 3 345 4 570 5 936
6 367 M Education 130 127 97 101 89 94 132 120 154 214 N Health and social work 99 99 161 224 265 305 385 426 498 576 O Other community, social and personal service
activities 495 580
672 832 873 988 1 178 1 182 1 644
1 821 A-K,M-O Total 18 837 22 344 25 530 27 474 27 828 26 476 28 235 32 278 37 579 39 320
1) Classification of economic activities: 1994 - 2002: WZ 93 (German version of NACE Rev. 1), since 2003: WZ 2003 (NACE Rev. 1.1). 2) Incl. small business ("Kleingewerbe"). 3) Since 1999 a new insolvency law is effective. 4) In December 2001 the insolvency law was amended.
Source: Federal Statistical Office Germany, Insolvency-Statistics, Wiesbaden, various volumes
II. STATISTIC
AL D
ESCR
IPTION
OF TH
E GER
MA
N "M
ITTELSTAN
D" 19
Table 4: Rate of business insolvencies by economic sections, Germany, 1994 - 2003
Rate2) of business insolvencies3) Heading of
classifi-cation1)
Economic section
1994 1995 1996 1997 1998 19994) 2000 20015) 2002 20036)
A Agriculture, hunting and forestry 5.7 6.6 7.0 8.1 8.3 8.0 7.2 8.1 8.2 9.9 B Fishing 2.2 3.4 4.6 3.4 7.9 7.7 7.6 7.6 2.2 1.1 C Mining and quarrying 5.2 4.9 7.1 4.5 8.3 8.4 7.8 10.2 12.4 10.7 D Manufacturing 10.6 11.3 12.4 12.3 11.2 10.7 11.3 12.6 15.2 15.9 E Electricity, gas and water supply 0.3 1.2 1.3 1.4 0.8 2.0 1.7 1.8 2.3 2.3 F Construction 13.3 18.4 23.0 25.0 25.5 24.1 25.1 28.1 28.7 27.2 G Wholesale and retail trade; repair of motor vehicles,
motorcycles and personal and household goods 6.2 7.3 8.0 8.2 8.2 7.7 7.7 8.3 10.6 11.2
G 50 Sale, maintenance and repair of motor vehicles and motorcycles retail sale of automotive fuel
6.4 7.7 7.3 7.7 7.4 7.6 8.9 9.6 10.8 11.6
G 51 Wholesale trade and commission trade, except of motor vehicles and motorcycles
9.5 11.7 12.8 12.6 11.6 11.4 10.5 11.6 13.6 12.9
G 52 Retail trade, except of motor vehicles and motorcycles repair of personal and household goods
4.6 5.3 6.0 6.3 6.9 6.0 6.2 6.6 9.2 10.3
H Hotels and restaurants 3.7 4.6 5.7 6.5 7.1 6.6 7.7 8.9 10.7 12.5 I Transport, storage and communication 10.3 11.5 11.9 12.4 11.5 10.2 13.5 16.9 19.6 20.7 J Financial intermediation 8.2 8.0 10.6 11.9 11.3 11.2 12.3 14.7 24.5 27.9 K Real estate, renting and business activities 5.2 5.9 6.6 7.1 7.0 6.5 6.8 8.6 10.3 10.9
K 70/71 Real estate activities, renting of machinery and equipment without operator and of personal and household goods
3.5 4.6 5.8 6.8 7.0 6.5 6.6 7.6 8.0 8.2
K 72-74 Computer and related activities, research and development, other business activities
6.2 6.6 7.1 7.4 7.0 6.5 6.9 9.1 11.6 12.5
M Education 5.4 5.2 4.0 4.1 3.5 3.5 4.8 4.2 5.3 7.3 N Health and social work 3.5 3.5 5.6 7.4 8.3 9.2 11.1 11.5 12.4 14.3 O Other community, social and personal service activities 2.2 2.5 2.9 3.5 3.5 3.8 4.4 4.3 5.9 6.5
A-K,M-O Total 6.8 8.1 9.2 9.8 9.7 9.2 9.7 11.1 12.8 13.4 © IfM Bonn
1) Classification of economic activities: 1994-2002: WZ 93 (German version of NACE Rev.1), since 2003: WZ 2003 (NACE Rev. 1.1). 2) Number of insolvencies per 1 000 enterprises (according to VAT-Statistics). 3) Incl. small business ("Kleingewerbe"). 4) Since 1999 a new insolvency law is effective. 5) In December 2001 the insolvency law was amended. 6) Estimated.
Source: Table 3

20 II. STATISTICAL DESCRIPTION OF THE GERMAN "MITTELSTAND"
Table 5: Business insolvencies by enterprise age, legal form and enterprise size, Germany, 2003
Enterprises with … employees Total 0 1 2-5 6-10 11-100 101 + unknown Enterprise age less than 8 years 17 226 6 888 2 041 3 146 1 218 1 580 79 2 274 thereof: up to 3 years 8 349 3 275 997 1 572 606 751 30 1 118
4 - 8 years 8 877 3 613 1 044 1 574 612 829 49 1 156 8 and more years 12 404 4 328 1 334 2 058 1 101 2 062 166 1 355 Unknown 9 690 4 712 1 101 1 448 400 401 20 1 608 Total 39 320 15 928 4 476 6 652 2 719 4 043 265 5 237 Legal form Sole proprietorships1) 15 041 7 445 1 781 2 539 687 509 8 2 072 Partnerships (OHG - unlimited company), KG - limited partnership)
3 269 1 113 254 522 248
645
87 400 Limited liability companies (GmbH)
20 034 7 061 2 364 3 473 1 702
2 714
143 2 577
Public limited companies (AG), partnerships partly limited by shares (KGaA)
508 140 46 75 48
113
21 65
Other legal forms 468 169 31 43 34 62 6 123 Total 39 320 15 928 4 476 6 652 2 719 4 043 265 5 237
1) Incl. liberal professions.
Source: Table 3

II. STATISTICAL DESCRIPTION OF THE GERMAN "MITTELSTAND" 21
3. "Mittelstand" and Employment
In general, job creation process derives from two origins. It happens in existing enterprises which increase their workforce or by the creation of enterprises. Jobs get lost when existing establishments reduce the number of employees or are closed either by insolvency or by closure.
Unfortunately there are no more official data available, which illustrate the job balance as a result of either the growth of existing or the result of market entries of new enterprises and the job losses as result of size reduction or market exits of existing enterprises.
The only data base providing the size distribution of German "Mittelstand" by employees is generated by the Federal Labour Agency in Nürnberg. In contrast to the above document VAT-Statistics the employment statistics exist only for units that employ persons which pay contributions to the social ensurance. Furthermore the firm registered is not in any case the enterprise but can also be a local establishment (one enterprise can comprise more than one establishments).
Table 6 presents the distribution of German establishments by employment size-classes for the period 1999 - 2003. It reveals that the number of establishments as well as the number of employees decreased between 1999 and 2003. After a short increase between 1999 and 2000, the total establishments decreased in the period 1999 - 2003 almost by nearly 50 000. Three quarter of the establishments closed had 1 - 9 employees, 99.6 % had 1 - 49 employees.
Compared to 1999 the total number of employees decreased by 450 000 until 2003. Between 2001 and 2003 overall employment declined by even 850 000 since 2001. 77 % of the working places lost existed in establishments with 1 - 49 employees and approx. 25 % in large establishments with 500 and more employees.
The size and sector distribution of labour places in Germany (Table 7) reveals, that manufactoring sector still is characterised by a dominance of bigger companies and by this contributes more than 27 % to the overall employment. In the other economic sectors the size distribution by employment is more evenly and the shares of SMEs correspond better to the introductory remarks.

22 II. STATISTIC
AL D
ESCR
IPTION
OF TH
E GER
MA
N "M
ITTELSTAN
D"
Table 6: Size structure of establishments1) and employment, Germany, 1999 - 2003
Establishments with ... employees 1 2 - 9 10 - 19 20 - 49 50 - 99 100 - 249 250 - 499 500 a.m. Total2)
1999 abs. 604 662 1 068 417 199 027 120 999 42 227 23 978 7 195 4 418 2 070 923 Establishmentsin % 29.2 51.6 9.6 5.8 2.0 1.2 0.3 0.2 100.0
Employees abs. 604 662 4 347 526 2 663 393 3 646 443 2 911 175 3 622 904 2 468 218 5 369 195 25 633 516 in % 2.4 17.0 10.4 14.2 11.4 14.1 9.6 20.9 100.0 2000
abs. 605 836 1 068 399 200 432 122 614 43 113 24 582 7 355 4 482 2 076 813 Establishmentsin % 29.2 51.4 9.7 5.9 2.1 1.2 0.4 0.2 100.0
Employees abs. 605 836 4 353 445 2 682 721 3 699 555 2 971 755 3 715 015 2 529 911 5 445 491 26 003 729 in % 2.3 16.7 10.3 14.2 11.4 14.3 9.7 20.9 100.0 2001
abs. 601 153 1 058 919 197 693 122 149 43 217 24 872 7 344 4 554 2 059 901 Establishmentsin % 29.2 51.4 9.6 5.9 2.1 1.2 0.4 0.2 100.0
Employees abs. 601 153 4 312 551 2 646 208 3 692 176 2 980 513 3 756 182 2 521 078 5 509 948 26 019 809 in % 2.3 16.6 10.2 14.2 11.5 14.4 9.7 21.2 100.0 20023)
abs. 604 199 1 053 352 196 679 120 841 42 923 24 773 7 276 4 457 2 054 500 Establishmentsin % 29.4 51.3 9.6 5.9 2.1 1.2 0.4 0.2 100.0
Employees abs. 604 199 4 291 230 2 633 456 3 651 068 2 959 413 3 737 990 2 502 168 5 412 294 25 791 818 in % 2.3 16.6 10.2 14.2 11.5 14.5 9.7 21.0 100.0 20033)
abs. 598 371 1 037 611 190 757 117 423 41 875 24 305 7 154 4 281 2 021 777 Establishmentsin % 29.6 51.3 9.4 5.8 2.1 1.2 0.4 0.2 100.0
Employees abs. 598 371 4 214 848 2 552 042 3 544 586 2 889 996 3 666 700 2 460 728 5 249 628 25 176 899 in % 2.4 16.7 10.1 14.1 11.5 14.6 9.8 20.9 100.0 © IfM Bonn
1) Establishments (local units) with employees subject to social security contributions (reporting date: June 30th). 2) All economic sections excl. public administration and defence, compulsatory social security activities of households as employers of
domestic staff and extra-territorial organisations and bodies (NACE Rev. 1.1: A-K,M-O). 3) Provisional figures. Source: Federal Labour Agency Germany, Statistics of Establishments and Employees, Nürnberg, various volumes; own calculations by
IfM Bonn

II. STATISTIC
AL D
ESCR
IPTION
OF TH
E GER
MA
N "M
ITTELSTAN
D" 23
Table 7: Employment by economic sections and size-classes, Germany, 20031)
Employees Establishments with ... employees
1 2 - 9 10 - 19 20 - 49 50 - 99 100 - 249 250 - 499 500 and more
Total
Economic section
Heading of
classifi-cation2)
abs. in % abs. in % abs. in % abs. in % abs. in % abs. in % abs. in % abs. in % abs. in % Agriculture, hunting and forestry; fishing
A,B 29 634 5.0 104 022 2.5 55 721 2.2 70 394 2.0 32 954 1.1 20 202 0.6 4 696 0.2 3 511 0.1 321 134 1.3
Mining and Quarrying
C 486 0.1 7 415 0.2 8 664 0.3 13 280 0.4 9 242 0.3 10 750 0.3 8 412 0.3 62 250 1.2 120 499 0.5
Manufacturing D 42 815 7.2 471 538 11.2 423 823 16.6 740 954 20.9 711 711 24.6 1 171 465 31.9 939 577 38.2 2 436 027 46.4 6 937 910 27.6 Electricity, gas and water supply
E 719 0.1 6 508 0.2 8 726 0.3 22 060 0.6 27 180 0.9 44 657 1.2 45 924 1.9 94 280 1.8 250 054 1.0
Construction F 52 259 8.7 533 613 12.7 350 611 13.7 353 395 10.0 190 063 6.6 159 125 4.3 61 818 2.5 45 003 0.9 1 745 887 6.9 Wholesale and retail trade; repair of motor vehicles, motorcycles and personal and household goods
G 133 003 22.2 962 728 22.8 578 742 22.7 759 917 21.4 536 058 18.5 553 918 15.1 254 550 10.3 251 738 4.8 4 030 654 16.0
Hotels and restaurants
H 59 020 9.9 271 824 6.4 120 904 4.7 158 234 4.5 68 824 2.4 52 300 1.4 22 329 0.9 12 741 0.2 766 176 3.0
Transport, storage and communication
I 28 632 4.8 209 377 5.0 167 508 6.6 250 437 7.1 187 064 6.5 221 887 6.1 152 264 6.2 272 111 5.2 1 489 280 5.9
Financial intermediation
J 21 238 3.5 75 744 1.8 47 124 1.8 90 219 2.5 101 544 3.5 178 842 4.9 149 574 6.1 386 402 7.4 1 050 687 4.2
Real estate, renting and business activities
K 132 436 22.1 593 825 14.1 361 316 14.2 487 695 13.8 417 146 14.4 496 859 13.6 267 461 10.9 360 547 6.9 3 117 285 12.4
Education M 10 669 1.8 109 303 2.6 119 650 4.7 149 049 4.2 113 755 3.9 145 477 4.0 92 032 3.7 293 459 5.6 1 033 394 4.1 Health and social work
N 35 854 6.0 569 990 13.5 183 692 7.2 290 743 8.2 359 339 12.4 430 587 11.7 338 416 13.8 874 543 16.7 3 083 164 12.2
Other community, social and personal service activities
O 51 606 8.6 298 961 7.1 125 561 4.9 158 209 4.5 135 116 4.7 180 631 4.9 123 675 5.0 157 016 3.0 1 230 775 4.9
Total A-K, M-O
598 371 100.0 4 214 848 100.0 2 552 042 100.0 3 544 586 100.0 2 889 996 100.0 3 666 700 100.0 2 460 728 100.0 5 249 628 100.0 25 176 899 100.0
© IfM Bonn
1) Provisional figures (reporting date: June 30th). 2) Classification of economic activities WZ 2003 (German version of NACE Rev. 1.1). Source: Federal Labour Agency Germany, Statistics of Establishments and Employees, Nürnberg, 2004; own calculations by IfM Bonn

24 III. SPECIAL ASPECTS
III. SPECIAL ASPECTS
1. Labour Intensive Production
Some characteristics of the "Mittelstand" can be revealed by statistical data even if the qualitative features are not (directly) measurable. This concerns among other things the labour intensive methods of production and the extensive vocational training activities performed by enterprises of the German "Mittelstand".
Figure 5 illustrates the development of the investment intensity (investments per one employee) and the investment ratio (expressed as investments per turnover) by enterprise size-classes (number of employees). It has to be mentioned that the distribution of investment ratios obviously does not depend on an enterprises size. Regardless of size, enterprises in the section "mining, quarrying and manufacturing" invest between 3.3 % and 3.8 % of their turnover. However, this finding does not hold for the investment intensity. Here, investment spendings per employee increase remarkably with the size of the enterprise.
SMEs with 20 - 499 employees show an investment ratio of 3.4 % and an investment intensity of 5 360 € (enterprises with 20 - 249: 3.4 % and 4 929 €).
In the section "construction industry" the investment ratio of large firms does not follow a clear trend. SMEs with 20 - 499 employees have an investment ratio of 2.5 % and an investment intensity of 2 811 € (enterprises with 20 - 249: 2.6 % and 2 742 €).

III. SPECIAL ASPECTS 25
Figure 5: Investment intensity and investment ratio in production industries, Germany, 2002
© IfM Bonn05 06 027© IfM Bonn
20-49 50-99 100-249 250-499 500-999 1000 + Total0
2000
4000
6000
8000
10000
12000
14000
16000
18000
0.0
1.0
2.0
3.0
4.0
Mining, quarrying and manufacturing Mining, quarrying and manufacturing Construction industry Construction industry
Investment intensity = investment per employee in €.Investment ratio = share of investment in turnover in %.
1)2)
Inve
stm
ent i
nten
sity
Investment ratio
2)1)
Employees
4 003
2 356
4 745
2 705
5 548
3 347
6 539
3 431
7 740
5 092
11 109
3 268
7 858
2 963
3.5 3.53.3
3.53.7 3.8
3.6
2.6 2.5 2.6
2.0
3.1
1.5
2.3
Source: Federal Statistical Office Germany, Statistics of Production Industries, Wiesbaden,
2004

26 III. SPECIAL ASPECTS
2. High Relevance for Professional Training
The "Mittelstand" accounts for approximately 49 % of gross national value added but employs about 70 % of all employees. Figure 5 provides also an explanation for this phaenomenon. In general, low investment spendings per employee hints at a rather labour intensive way of production. On the other hand, high investment expenditures per employee indicate a more capital intensive way of production. From this it can be concluded that compared to large enterprises SMEs feature on average a higher labour intensity, that is to say SMEs produce one output unit by employing relatively more labour and less capital. This result seems plausible since "Mittelstand" is not specialised in mass production but in differentiated (often customer-tailored) goods and services. This requires a highly skilled labour force and often makes investments in human capital more necessary than in capital goods. The "Mittelstand´s" strong emphasis on the formation of human capital is - among other things - well documented by the fact that small and medium-sized enterprises provide more than 80 % of the vocational training-places in Germany.
As documented in table 8 SMEs still are the backbone of the professional education system in Germany regardless the fact that the overall number of professional education contracts since 2001 is decreasing. Due to the low dynamics in business cycle in 2001/2002 enterprises of all size classes had been forced to reduce the number of apprentices. But this is a general phenomenon and does not influence the SME-share in overall professional education. Additionally it can be seen, that micro enterprises with only one employee intensify constantly their educational activities.
The overall findings again strongly are influenced by the special conditions characterising the manufactoring sectors as it is documented in table 9.

III. SPECIA
L ASPEC
TS 27
Table 8: Vocational trainees1) and training-ratio2), Germany, 1999 - 2003
Establishments with ... employees
1
2 - 9
10 - 19
20 - 49
50 - 99
100 - 249
250 - 499
500 a.m.
Total3)
SMEs4)
1 - 249 employees
SMEs5)
1 - 499 employees
1999 Vocational trainees abs. 24 982 369 429 213 954 244 969 172 309 211 467 154 956 300 825 1 692 891 1 237 110 1 392 066
in % 1.5 21.8 12.6 14.5 10.2 12.5 9.2 17.8 100.0 73.1 82.2 Training-ratio in % 4.2 8.6 8.0 6.7 5.8 5.7 6.1 5.5 6.5 6.9 6.8 2000 Vocational trainees abs. 25 726 372 076 213 304 245 196 175 997 217 256 156 919 302 404 1 708 878 1 249 555 1 406 474
in % 1.5 21.8 12.5 14.3 10.3 12.7 9.2 17.7 100.0 73.1 82.3 Training-ratio in % 4.3 8.7 8.0 6.6 5.9 5.8 6.1 5.4 6.5 6.9 6.8 20016) Vocational trainees abs. 26 136 370 669 209 510 243 882 175 797 220 218 162 971 303 426 1 712 609 1 246 212 1 409 183
in % 1.5 21.6 12.2 14.2 10.3 12.9 9.5 17.7 100.0 72.8 82.3 Training-ratio in % 4.4 8.7 7.9 6.6 5.9 5.8 6.4 5.4 6.6 7.0 6.9 20026) Vocational trainees abs. 26 215 362 663 200 408 232 621 170 465 217 476 154 663 299 444 1 663 955 1 209 848 1 364 511
in % 1.6 21.8 12.0 14.0 10.2 13.1 9.3 18.0 100.0 72.7 82.0 Training-ratio in % 4.4 8.6 7.8 6.5 5.8 5.8 6.1 5.5 6.5 6.9 6.8 20036) Vocational trainees abs. 27 410 356 604 192 142 224 382 167 211 216 111 152 406 294 984 1 631 250 1 183 860 1 336 266
in % 1.7 21.9 11.8 13.8 10.3 13.2 9.3 18.1 100.0 72.6 81.9 Training-ratio in % 4.7 8.7 7.7 6.4 5.8 5.9 6.2 5.6 6.5 6.9 6.8 © IfM Bonn
1) Reporting date: December 31th. 2) Training-ratio = number of vocational trainees in relation to the total number of employees. 3) All economic sections excl. public administration and defence, compulsatory social security activities of households as employers of
domestic staff and extra-territorial organisations and bodies (NACE Rev. 1.1: A-K,M-O). 4) According to the EU-definition. 5) According to IfM Bonn's definition. 6) Provisional figures.
Source: Federal Labour Agency Germany, Statistics of Establishments and Employees, Nürnberg, various volumes; own calculations by IfM Bonn

28 III. SPECIA
L ASPEC
TS
Table 9: Structure of vocational trainees by economic sections and employment size-classes, Germany, 20031)
Vocational trainees Establishments with ... employees
1 2 - 9 10 - 19 20 - 49 50 - 99 100 - 249 250 - 499 500 and more
Total
Economic section
Heading of
classifi-cation2) abs. in % abs. in % abs. in % abs. in % abs. in % abs. in % abs. in % abs. in % abs. in %
Agriculture, hunting and forestry; fishing
A,B 3 881 14.2 9 310 2.6 4 382 2.3 5 111 2.3 2 076 1.2 532 0.2 56 0.0 345 0.1 25 693 1.6
Mining and Quarrying C 6 0.0 124 0.0 106 0.1 309 0.1 239 0.1 376 0.2 404 0.3 4 408 1.5 5 972 0.4 Manufacturing D 2 860 10.4 44 720 12.5 34 451 17.9 45 670 20.4 35 749 21.4 56 127 26.0 43 606 28.6 109 986 37.3 373 169 22.9 Electricity, gas and water supply
E 5 0.0 99 0.0 190 0.1 925 0.4 1 620 1.0 3 451 1.6 2 874 1.9 6 528 2.2 15 692 1.0
Construction F 4 975 18.2 57 362 16.1 34 511 18.0 30 010 13.4 13 456 8.0 9 555 4.4 3 055 2.0 2 032 0.7 154 956 9.5 Wholesale and retail trade; repair of motor vehicles, motorcycles and personal and household goods
G 4 797 17.5 71 236 20.0 48 944 25.5 64 129 28.6 43 550 26.0 36 343 16.8 14 846 9.7 12 051 4.1 295 896 18.1
Hotels and restaurants H 737 2.7 17 435 4.9 16 032 8.3 21 138 9.4 10 738 6.4 6 995 3.2 1 649 1.1 1 758 0.6 76 482 4.7 Transport, storage and communication
I 589 2.1 5 373 1.5 3 540 1.8 6 810 3.0 6 672 4.0 10 746 5.0 7 943 5.2 10 243 3.5 51 916 3.2
Financial intermediation J 775 2.8 3 899 1.1 1 746 0.9 4 876 2.2 6 275 3.8 12 566 5.8 11 382 7.5 21 609 7.3 63 128 3.9 Real estate, renting and business activities
K 5 065 18.5 47 427 13.3 23 379 12.2 19 513 8.7 9 612 5.7 9 885 4.6 6 216 4.1 11 424 3.9 132 521 8.1
Education M 107 0.4 1 724 0.5 2 264 1.2 8 067 3.6 15 565 9.3 38 349 17.7 27 936 18.3 38 023 12.9 132 035 8.1 Health and social work N 1 143 4.2 67 914 19.0 13 748 7.2 10 108 4.5 15 031 9.0 20 937 9.7 24 124 15.8 63 923 21.7 216 928 13.3 Other community, social and personal service activities
O 2 470 9.0 29 981 8.4 8 849 4.6 7 716 3.4 6 628 4.0 10 249 4.7 8 315 5.5 12 654 4.3 86 862 5.3
Total A-K, M-O 27 410 100.0 356 604 100.0 192 142 100.0 224 382 100.0 167 211 100.0 216 111 100.0 152 406 100.0 294 984 100.0 1 631 250 100.0 © IfM Bonn
1) Reporting date: December 31th, provisional figures. 2) Classification of economic activities: WZ 2003 (German version of NACE Rev. 1.1). Source: Federal Labour Agency Germany, Statistics of Establishments and Employees 2003, Nürnberg, 2004; own calculations by IfM Bonn

III. SPECIAL ASPECTS 29
3. SME and Internationalization
In the year 2002 Germany realised an export performance of more than 736 billion €. SMEs share in this figure reaches nearly 21 %.
Though the share of exporting enterprises in the total of enterprises broken down by size-classes increases with the enterprises size, table 10 gives proof to the fact, that even in smaller size-classes with an annual turnover between 250 000 € and 500 000 € one out of seven SMEs is actively involved in export business. In the next size-class 500 000 € - 1 Mill. € already more than 20 % of all enterprises perform export based turnover.
Table 10: Exporting enterprises and their export based turnover, Germany, 2002 - absolute figures and export-ratios
Enterprises with turnover from € ... to below ...
Exporting enterprises1)
Export based turnover2)
Exporting enterprises rel. to the
total number of all enter-
prises
Export based turn-over rel. to
the total turnover of all enter-
prises abs. in % in Mill. € in % in % in %
16 620 - 50 000 19 417 6.0 165.9 0.0 2.4 0.7 50 000 - 100 000 25 235 7.8 387.0 0.1 4.4 0.9 100 000 - 250 000 51 832 16.0 1 439.7 0.2 7.8 1.4 250 000 - 500 000 48 862 15.1 2 477.4 0.3 14.0 2.0 500 000 - 1 Mill. 50 246 15.5 4 849.6 0.7 21.9 3.0 1 Mill. - 2. Mill. 43 761 13.5 8 749.7 1.2 31.3 4.5 2 Mill. - 5 Mill. 40 166 12.4 20 506.3 2.8 44.2 7.3 5 Mill. - 10 Mill. 18 910 5.8 25 063.4 3.4 57.4 10.9 10 Mill. - 25 Mill. 13 849 4.3 44 605.4 6.1 66.0 13.8 25 Mill. - 50 Mill. 5 556 1.7 45 431.7 6.2 72.7 17.1 50 Mill. a.m. 6 255 1.9 582 338.4 79.1 78.9 23.3 Total 324 089 100.0 736 014.4 100.0 11.1 17.3 SMEs 317 834 98.1 153 676.0 20.9 10.9 8.8 © IfM Bonn
1) Only enterprises liable to VAT with annual deliveries and other perfomances (turnover) exceeding Euro 16 620.
2) Excl. VAT.
Source: Federal Statistical Office Germany, VAT-Statistics 2002, Wiesbaden, 2004; own calculations by IfM Bonn

30 III. SPECIAL ASPECTS
4. Research and Development in SMEs
An official R&D-Statistic is not available in Germany. By this in this chapter the results of the survey of the Institute Statistics in Sciences (Wissenschaftsstatis-tik GmbH) are presented. The Institute analyses in a two-years turn by a postal questionnaire the spendings of the German business sector in research and development. The results are processed in size-classes and sectors. The most recent data origin from the 2001 survey.
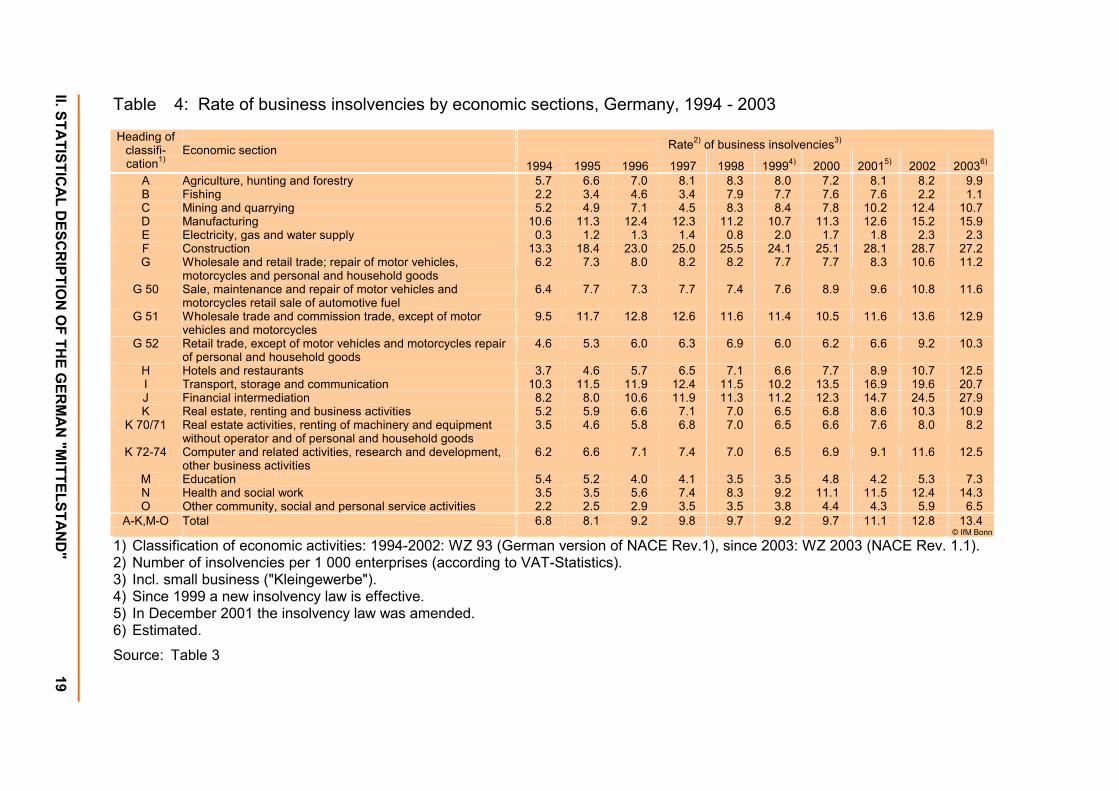
The tables demonstrate, that expressed in an absolute amount of money, SMEs spend less for R&D reasons than large enterprises. Nevertheless table 11 shows that between 1991 and 2001 SMEs as well as enterprises of the bigger size-classes increased their spendings in R&D.
As percentage of turnover (table 12) small enterprises invest relatively more money in R&D activities than the rest of the business sector. The same is true even in a higher degree for the employment ratios as shown in table 13. SMEs with 100 employees at a maximum employ significantly more of their employees in R&D activities than the rest of the business sector.
Table 11: R&D-expenditures of the business enterprise sector by employment size-classes, Germany, 1991 – 2001
R&D-Expenditures1) 1991 1993 1995 1997 1999 2001
Enterprises with ... employees
in Mill. € in Mill. € in Mill. € in Mill. € in Mill. € in Mill. € less than 20 298.0 20 - 49 521.9 50 - 99
} 1 113.6 } 1 403.9 } 1 587.7 } 1 784.0 } 1 541.4
842.2 100 - 249 1 580.7 1 627.0 1 776.1 250 - 499 } 2 424.0 } 2 368.2 } 2 562.9 1 335.6 1 609.5 2 056.0 500 - 999 1 328.8 1 573.7 1 432.6 1 820.0 2 211.1 2 322.7 1 000 - 1 999 1 803.2 2 178.6 2 022.3 2 964.4 3 391.3 3 829.5 2 000 - 4 999 3 265.2 3 427.3 3 556.8 4 311.7 4 325.2 5 010.9 5 000 - 9 999 2 944.9 2 652.6 2 656.7 2 861.8 5 443.1 4 710.7 10 000 and more 15 927.4 15 554.5 15 752.2 16 371,6 19 106.8 21 871.1 Total 28 807.2 29 158.7 29 571.2 33 029.8 39 255.4 43 239.2 © IfM Bonn
1) Internal and external R&D-expenditures.
Source: Science-Statistics (Wissenschaftsstatistik GmbH), Essen, various volumes
III. SPECIAL ASPECTS 31
Table 12: R&D-expenditures of the business sector in relation to turnover by employment size-classes, Germany, 1991 - 2001
R&D-Expenditures1) 1991 1993 1995 1997 1999 2001
Enterprises with ... employees
in % in % in % in % in % in % less than 20 13.9 20 - 49 6.6 50 - 99
} 4.8 } 5.6 } 6.1 } 6.2 } 5.7 4.9
100 - 249 3.5 3.5 3.6 250 - 499 } 2.6 } 2.9 } 2.7 2.7 2.7 2.9 500 - 999 2.1 3.4 3.0 3.5 3.1 3.5 1 000 - 1 999 2.9 2.9 2.5 3.5 3.6 4.5 2 000 - 4 999 2.4 2.6 2.5 2.9 2.6 2.2 5 000 - 9 999 4.3 3.3 3.5 3.4 4.3 3.4 10 000 and more 5.0 5.3 4.8 4.7 5.5 5.9 Total 3.8 4.0 3.7 3.9 4.2 4.2 © IfM Bonn
1) Internal and external R&D-expenditures.
Source: Science-Statistics (Wissenschaftsstatistik GmbH), Essen, various volumes
Table 13: Share of R&D-personnel in overall employment by employment size-classes, Germany, 1991 - 2001
Percentage of employees involved in R&D2) 1991 1993 1995 1997 1999 2001
Enterprises1) with ... employees
in % in % in % in % in % in % less than 20 21.8 20 - 49 11.0 50 - 99
} 7.8 } 9.0 } 9.9 } 10.3 } 10.4 8.0
100 - 249 5.5 5.5 5.7 250 - 499 } 4.1 } 4.4 } 4.5 4.4 4.6 4.8 500 - 999 3.7 4.7 5.1 6.1 5.6 6.5 1 000 - 1 999 4.4 5.0 4.9 6.1 6.0 6.8 2 000 - 4 999 4.4 4.9 4.9 6.2 5.5 6.6 5 000 - 9 999 5.6 5.3 6.1 6.2 8.1 6.8 10 000 and more 5.6 5.9 6.3 6.7 7.9 8.1 Total 5.0 5.5 5.8 6.4 6.9 7.2 © IfM Bonn
1) Enterprises with R&D expenditures. 2) Internal and external R&D-expenditures.
Source: Science-Statistics (Wissenschaftsstatistik GmbH), Essen, various volumes
32 APPENDIX
APPENDIX:
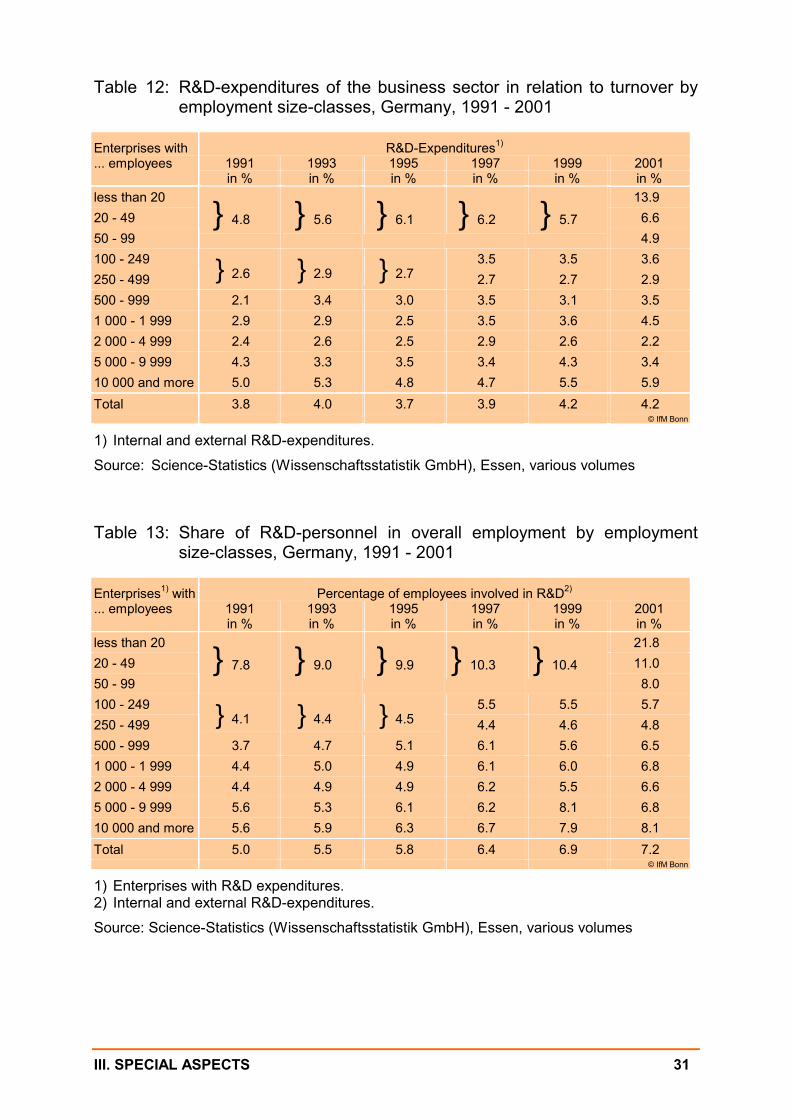
Institut für Mittelstandsforschung Bonn (IfM Bonn) Institute for SME-Research Bonn, Germany The IfM Bonn was founded as foundation of private law in the year 1957. Founders are the Federal Republic of Germany and the Land of North Rhine-Westphalia represented by the Federal Ministry of Economy and Labour and the Ministry of Economy and Labour of the land North Rhine-Westphalia. According to its statute the IfM Bonn has to analyse the status-quo, the development, chances and problems of small and medium-sized enterprises and to the support herewith the activities of the ministries. In accordance with its founders the institute developes an annual research program. In addition the institute annually carries out a number of research projects financed by third private or public bodies.
In addition to performing basic research and consultancy work on current issues concerning the small business sector, the IfM Bonn concentrates its efforts on the following fields of research: SME Statistics - Observation of Economic Development, SMEs and Public Sector, Life Cycles of Enterprises, SME-Management, SME-Finance, SME-Sales, SME-Employment and Personal Department, Co-operation of SMEs.
From time to time the IfM Bonn also conducts national and international colloquia and seminars. Within the framework of specific, internal seminars technical problems occurring in the context of SME-related studies are discussed with national and international experts. Furthermore, the IfM Bonn participates in national and international meetings and conferences in its fields of research and thereby submits its research findings for discussion.
All results of IfM´s research projects and major investigations are published in the series "Schriften zur Mittelstandsforschung NF". Additionally, the IfM Bonn provides discussion papers regarding current issues of economic and management policy. These papers appear in IfM's minor series, entitled "IfM Materialien". Since 1999 IfM Bonn is represented in internet:
www.ifm-bonn.org.

APPENDIX 33
Figure 6: Organisational structure of the IfM Bonn 2003
05 06 013© IfM Bonn
Institut für Mittelstandsforschung
(IfM)Bonn
Boar
dFo
unde
rs Federal Republic of Germany
Land of North Rhine - Westphalia
(NRW)
Federal Ministryof Finance
Federal Ministryof Economyand Labour
(chair)
NRW - Ministryof Economyand Labour
Dean of the University of
Cologne
NRW - Ministry of Environment and Nature
Conservation, Agriculture and
Consumer Protection
NRW - Ministry of Science and
Research
Dean of the University of
Bonn
Directory
Prof. Dr. Dr. Dieter BösProf. Dr. Uschi Backes-Gellner
Advisory
Board
Managing Director
Dr. Gunter Kayser
Staff: 28 Persons
Address: Institut für Mittelstandsforschung BonnMaximilianstraße 20D-53111 BonnGermany
Phone: (+49-228) 72 99 7-0Fax: (+49-228) 72 99 7-34
E-Mail: [email protected]