installation & user guide - lg-nortel.es & user guide . ... lg-nortel reserves the right to...
TRANSCRIPT

Network Management System
Installation & User Guide
IPECS NMS Feature Description & Operation Issue 1
Copyright© 2008 LG-Nortel Co., Ltd. All Rights Reserved This material is copyrighted by LG-Nortel Co., Inc. Any unauthorized reproductions, use or disclosure of this material, or any part thereof, is strictly prohibited and is a violation of Copyright Laws. LG-Nortel reserves the right to make changes in specifications at any time without notice. The information furnished by LG-Nortel in this material is believed to be accurate and reliable, but is not warranted to be true in all cases. LG-Nortel and iPECS are trademarks of LG-Nortel Co., Inc. All other brand and product names are trademarks or registered trademarks of their respective companies.
Revision History
ISSUE DATE DESCRIPTION OF CHANGES
1.0a Aug. ‘08 Initial Release
1.0b Sep. ‘08 Access Control, System DB, Prompt Upload, System Greeting

IPECS Network Management System Issue 1
ii
Table of Contents
1. Introduction......................................................................................... 1
1.1 Overview ............................................................................................................1
1.2 Feature Summary...............................................................................................1
2. Installation........................................................................................... 4
2.1 System Requirements ........................................................................................4
2.1.1 NMS Server Requirements ....................................................................................4
2.1.2 iPECS System & Device Requirements.................................................................4
2.2 Software Installation Procedure..........................................................................5
2.2.1 iPECS NMS Software Components .......................................................................5
2.2.2 Installing Software Components ............................................................................5
2.2.3 Executing iPECS-NMS Application ......................................................................27
2.3 iPECS System Admin Configuration.................................................................30
3. Getting Started.................................................................................. 32
3.1 Overview of Set-up...........................................................................................32
3.2 Checking Windows Service Status ...................................................................32
3.3 Accessing the iPECS NMS Server Using a Web Browser ...............................33
3.4 NMS Message Exchange Overview.................................................................36
4. NMS Management............................................................................. 37
4.1 Modify Superuser Configuration.......................................................................37
4.2 NMS Server Management................................................................................37
4.2.1 NMS Mail Server Configuration ...........................................................................38
4.2.2 Trap Community Configuration ............................................................................39
4.2.3 System KeepAlive Interval Configuration.............................................................39
4.2.4 External Link Configuration..................................................................................39
4.3 User Management............................................................................................40
4.3.1 User Configuration ...............................................................................................40
4.3.2 Set E-mail Notification to User Account ...............................................................43
4.3.3 User Access Control ............................................................................................43
4.4 System Management .......................................................................................44
4.4.1 System Configuration...........................................................................................45
4.4.2 System Group Configuration................................................................................46
4.4.3 Web Admin Configuration ....................................................................................48
4.4.4 Web Admin Access ..............................................................................................48

IPECS Network Management System Issue 1
iii
4.4.5 Firmware Upgrade ...............................................................................................49
4.4.6 System DB Management .....................................................................................53
4.4.7 Prompt Upload.....................................................................................................59
4.4.8 System Greeting Management ............................................................................61
5. Reviewing System Info and Status ................................................. 66
5.1 System Info Screen ..........................................................................................66
5.1.1 Using System Explorer ........................................................................................66
5.1.2 System Information View .....................................................................................66
5.1.3 Attendant, CO and Station Group Information Views...........................................67
5.2 Device Inventory Page .....................................................................................68
5.2.1 System Device Inventory .....................................................................................68
5.2.2 System Group Device Inventory ..........................................................................69
5.3 Status Page......................................................................................................71
5.3.1 Device Based Status View ...................................................................................71
5.3.2 CO Channel Status View .....................................................................................75
5.3.3 Station Channel Status View................................................................................76
6. Alarm/Fault Management................................................................. 78
6.1 Alarm/Fault Analysis Screen ............................................................................78
6.1.1 Event Log Analysis...............................................................................................79
6.2 Alarm/Fault Configuration.................................................................................80
7. Call Statistics Management ............................................................. 82
7.1 Call Traffic Analysis ..........................................................................................82
7.2 Call Traffic Configuration ..................................................................................88
7.3 SMDR Analysis.................................................................................................88
7.4 SMDR Statistics................................................................................................90
7.5 DECT Statistics ................................................................................................91
7.5.1 MFIM Statistics.....................................................................................................93
7.5.2 DECT G/W Statistics............................................................................................95
8. Network Traffic Monitoring ............................................................ 103
8.1 Ping Test ........................................................................................................103
8.2 Traceroute Test ..............................................................................................106
8.3 Device Network Traffic ...................................................................................108
8.4 iPECS Device Ping Test .................................................................................114
8.5 iPECS Device Network Traffic ........................................................................118
9. Log & History Management ........................................................... 123
9.1 NMS Access Log............................................................................................123

IPECS Network Management System Issue 1
iv
9.2 NMS Operation Log........................................................................................126
10. NMS Database Backup & Restore................................................. 130
10.1 Basic Backup & Restore.................................................................................130
10.1.1 Basic Backup Operation ....................................................................................131
10.1.2 Basic Restore Operation....................................................................................131
10.2 Entire Backup & Restore ................................................................................133
10.2.1 Entire Database Backup Operation ...................................................................134
10.2.2 Entire Database Restore Operation...................................................................134
Appendix 1 iPECS System Set-up for NMS........................................A1-1
Appendix 2 iPECS System Information View.....................................A2-1
IPECS NMS Feature Description & Operation Issue 1
1
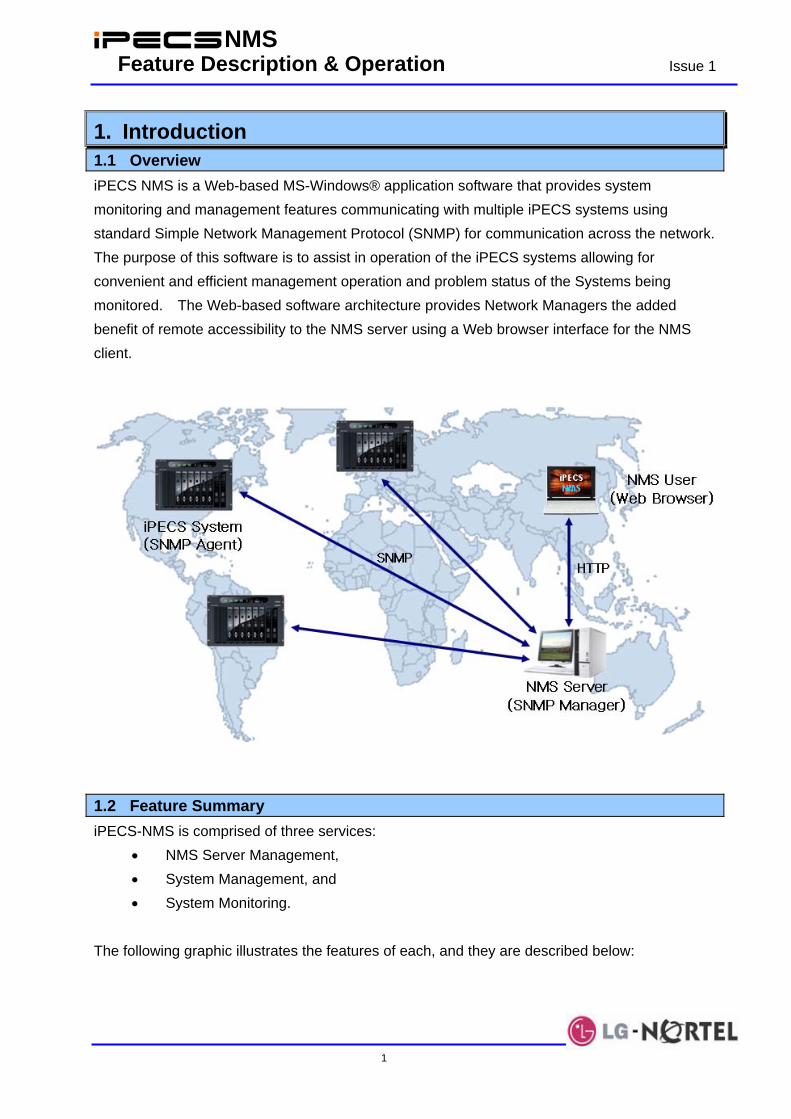
1. Introduction 1.1 Overview iPECS NMS is a Web-based MS-Windows® application software that provides system monitoring and management features communicating with multiple iPECS systems using standard Simple Network Management Protocol (SNMP) for communication across the network. The purpose of this software is to assist in operation of the iPECS systems allowing for convenient and efficient management operation and problem status of the Systems being monitored. The Web-based software architecture provides Network Managers the added benefit of remote accessibility to the NMS server using a Web browser interface for the NMS client.
1.2 Feature Summary iPECS-NMS is comprised of three services:
• NMS Server Management, • System Management, and • System Monitoring.
The following graphic illustrates the features of each, and they are described below:

IPECS Network Management System Issue 1
2
NMS Server Management— NMS Server Management is for the configuration of common operating parameters of the NMS server and for managing NMS operation history & log. It provides NMS user-related features such as NMS user registration, access control, system assignment and E-Mail notification configuration. NMS operational history can be checked using the NMS Access Log & Operation Log, and iPECS-NMS Control program that is a separate MS-Windows application supporting NMS service-related features such as the execution of the iPECS-NMS Service and backup & restore operations on the NMS local database. System Management— System Management is for facilitating efficient management & operation of iPECS systems. It provides features for registering iPECS systems to the NMS server, creating system groups, and managing system Web Admin passwords for direct access to iPECS System Web Admin through iPECS-NMS. Call Statistics operations present tables and graphs with traffic analysis data for attendant calls, completed calls, CO group calls, and voice mail service requests as well as various tables for DECT statistics information. In regard to Station Message Detail Recording (SMDR) data, the System Management facet of the program additionally provides searching operations in table format for detailed analysis. iPECS device firmware can be upgraded using Firmware Upgrade operations for specified systems at a designated time, and system database, system greeting and prompt files can be uploaded or downloaded.

IPECS Network Management System Issue 1
3
System Monitoring— System Monitoring provides features for monitoring the operational status of iPECS systems. General system configuration information and detailed device information can be examined, and real-time status information of each device and its channels is also provided. Device channel status information is displayed in either device-based or CO/Station channel-based format. An Alarm/Fault management feature provides information on normal and abnormal system status changes and stores them in a log so that they can be managed by the administrator. Network Traffic Monitoring feature provides a means to monitor network traffic and connection status for general network devices as well as iPECS devices.

IPECS Network Management System Issue 1
4
2. Installation 2.1 System Requirements 2.1.1 NMS Server Requirements
When 20 or less systems are to be registered: • CPU – Intel Core 2 Duo 2.33 GHz or higher • RAM – 2 GB or higher • HDD – At least 4 GB of free disk space • O/S – Microsoft Windows XP Professional or Windows Server 2003 (32-bit Version
with NTFS File System) • Display – 1280 x 1024 or higher
When 200 or less systems are to be registered
• CPU – Intel Dual-Core Xeon 2.4 GHz or higher • RAM – 2 GB or higher • HDD – At least 20 GB of free disk space • O/S – Microsoft Windows XP Professional or Windows Server 2003 (32-bit Version
with NTFS File System) • Display – 1280 x 1024 or higher
When 500 or less systems are to be registered
• CPU – Intel Quad-Core Xeon 2.66 GHz or higher • RAM – 2 GB or higher • HDD – At least 50 GB of free disk space • O/S – Microsoft Windows XP Professional or Windows Server 2003 (32-bit Version
with NTFS File System) • Display – 1280 x 1024 or higher
2.1.2 iPECS System & Device Requirements
MFIM Firmware version 5.0 or higher (iPECS-50/100/300/600) Gateways and IP-phones developed before iPECS Phase 3 can be used for basic NMS features. However, in order to support all the additional features provided by NMS (e.g. iPECS device traffic monitoring), those developed after iPECS Phase 4 should be used, and firmware should be upgraded with latest versions that support NMS features.

IPECS Network Management System Issue 1
5
2.2 Software Installation Procedure 2.2.1 iPECS NMS Software Components
Software components needed for iPECS NMS are: • PostgreSQL DBMS (PostgreSQL Global Development Group) • Apache HTTP Server (The Apache Software Foundation) • PHP Hypertext Preprocessor (The PHP Group) • Zend Optimizer (Zend Technologies Ltd.) • Microsoft Message Queue (Microsoft Corporation) • iPECS-NMS Server (LG-Nortel)
Software components listed above should be installed in the sequence described in this document. Since there are additional configurations during the installation procedure, the installer should read this section carefully before starting software installation. 2.2.2 Installing Software Components 2.2.2.1 PostgreSQL Installation
After decompressing the ‘PostgreSQL’ software into a temporary folder, double-click on ‘postgresql-8.2.msi’ file to start the installation procedure (8.2 is the software version in this manual). Perform the following to Install: On the language selection window, select a language and click [Start >]:

IPECS Network Management System Issue 1
6
As recommended in the window, close all the programs running on the NMS server and then click [Next >]. The Installation Notes screen will display. The installation notes describe requirements concerning restrictions on the use of the 64-bit version of Windows® and FAT32 file system. Read the notes and verify before starting the installation. After reading the ‘Installation Notes’, click [Next >] to proceed. On the ‘Installation Options’ window, select a folder in which ‘PostgreSQL’ is to be installed (or just note the default location identified by the program), and click [Next >].

IPECS Network Management System Issue 1
7
PostgreSQL is used as a service, check the “Install as a service” box and enter all field values (as applicable), then click on the [Next >]. In this document, ‘postgres’ and ‘postgrespw’ are used for ‘Account Name’ and ‘Account Password’ fields, respectively. Of course, other strings can be used for both fields. If the account name configured in the previous step does not currently exist, the Account Error message may appear asking if the account should be created; click [Yes]. If the password configured in the previous step is not complex enough, a Password notification screen may appear to suggest replacing the password with a more complex one. Click [Yes] to change the password to a more complex one (randomly generated string) for increased password security, or [No] to proceed without changing the password. Within the Initialize Database Cluster screen, make the following entries then click on [Next >]: Select the appropriate language / country for ‘Locale’ field. Select UTF8 for the Encoding (Server) field. (Keep the default value for Client field. – v8.3 Option) Enter the Superuser name and the Password to be used internally by the PostgreSQL database. The ‘Superuser Name’ and ‘Password’ field values should be noted because they will be used for ‘iPECS-NMS Control’ program when configuring ‘Database User Information’.

IPECS Network Management System Issue 1
8
Click [Next >] on the Enable Procedural Languages screen. The default value is selected, however, if there is a reason this value may be changed. The Enable contrib. modules screen lists, routines which contribute to the application (default is recommended). Click [Next >] to continue. When the ready to install screen appears, click [Next >] to begin the installation.

IPECS Network Management System Issue 1
9
After the installation is complete, the Installation Complete screen will display; click [Finish]. (Because Stack Builder does not need to be executed, ‘Launch Stack Builder at exit’ check-box may be unchecked before finishing. – v8.3 Option) In order for 3rd-party applications like iPECS NMS to use ‘PostgreSQL’, a path to the ‘PostgreSQL’ binary files folder must be set-up. ‘PostgreSQL’ does not configure the Path during the installation procedure, so this should be done manually. To set-up the Path, perform the following Steps: Access the Control Panel>System Properties, and click on the Advanced tab. Click on the Environment Variables button at the bottom of the screen.

IPECS Network Management System Issue 1
10
In the System variables pane, select the Path variable item, and then click [Edit]. On the Edit System Variable screen, check if the ‘bin’ directory of PostgreSQL already exists in the Variable value field. If it does not exist, append the directory name of the ‘bin’ folder at the end of the path variable, and then click [OK]. NOTE—When entering the path to the PostgreSQL ‘bin’ folder, type a semicolon (;) at the end of the variable, and then the directory name of ‘bin’ folder. In this example, the ‘;D:\Program Files\Postgres\PostgreSQL\8.2\bin’ string was appended at the end of the ‘Path’ variable. The modified ‘Path’ variable is applied after restarting Windows. However, since the new ‘Path’ is not required until the iPECS NMS Control program is executed, continue the installation without restarting Windows at this time.
2.2.2.2 Apache HTTP Server Installation
To install the Apache HTTP Server, perform the following: Double-click on the ‘apache_2.2.8-win32-x86-no_ssl.msi’ file (2.2.8 is the software version used in this manual).

IPECS Network Management System Issue 1
11
Click [Next >] button to proceed with the installation. Read the ‘Apache License’ notes within the License Agreement screen; click [I accept the terms in the license agreement] to accept the terms and then click [Next >] button to proceed. A ‘Read This First’ screen will display. Once you have read the screen, click [Next >]. In the Server Information screen, fill in the blanks for ‘Network Domain’, ‘Server Name’, and ‘Administrator’s Email Address’ fields: -- Administrator’s Email Address’ field must be entered. -- If HTTP port 80 (the normal HTTP server port) is to be used, select [for All Users, on Port 80, as a Service – Recommended]. When finished, click [Next >] to proceed.

IPECS Network Management System Issue 1
12
Select the type of installation; if customized installation is not needed, select [Typical] and click [Next >]. On the Destination Folder screen, note the default location for the Apache HTTP Server files, OR Click on the Change button to select a folder where the files should be installed. Click [Next >] to continue. Click [Install] on the ‘Ready to Install the Program’ window to start installation.
IPECS Network Management System Issue 1
13
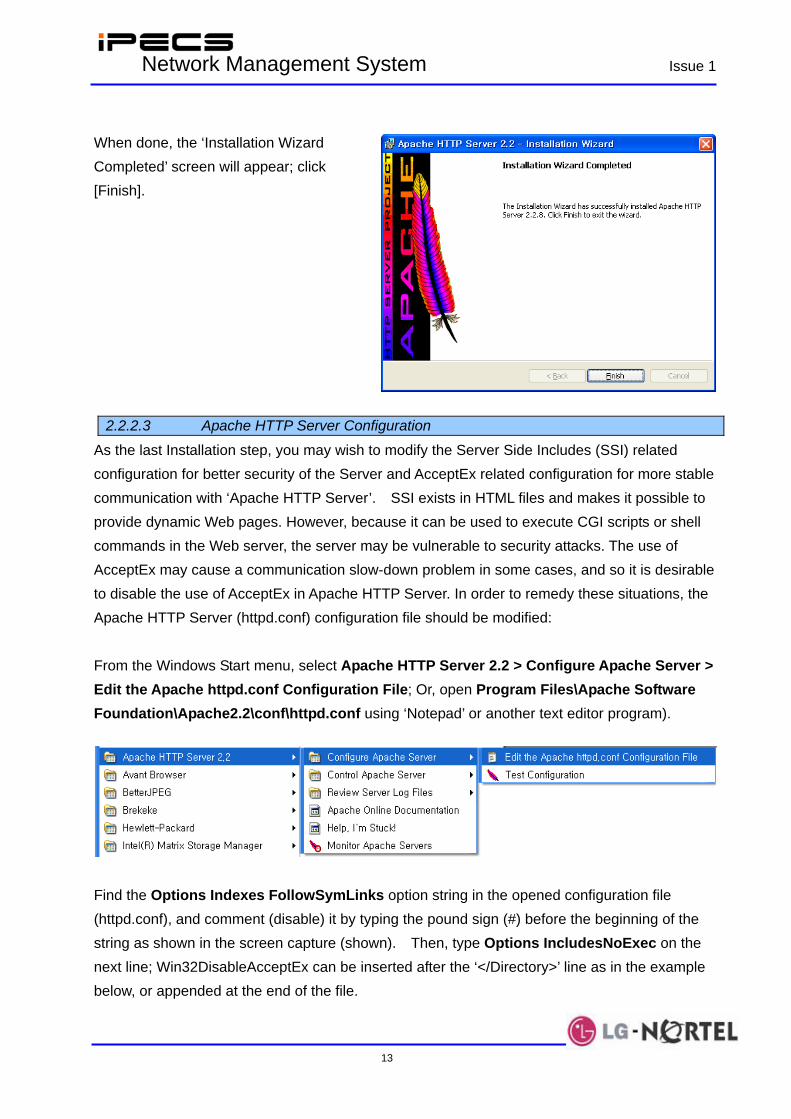
When done, the ‘Installation Wizard Completed’ screen will appear; click [Finish].
2.2.2.3 Apache HTTP Server Configuration
As the last Installation step, you may wish to modify the Server Side Includes (SSI) related configuration for better security of the Server and AcceptEx related configuration for more stable communication with ‘Apache HTTP Server’. SSI exists in HTML files and makes it possible to provide dynamic Web pages. However, because it can be used to execute CGI scripts or shell commands in the Web server, the server may be vulnerable to security attacks. The use of AcceptEx may cause a communication slow-down problem in some cases, and so it is desirable to disable the use of AcceptEx in Apache HTTP Server. In order to remedy these situations, the Apache HTTP Server (httpd.conf) configuration file should be modified: From the Windows Start menu, select Apache HTTP Server 2.2 > Configure Apache Server > Edit the Apache httpd.conf Configuration File; Or, open Program Files\Apache Software Foundation\Apache2.2\conf\httpd.conf using ‘Notepad’ or another text editor program).
Find the Options Indexes FollowSymLinks option string in the opened configuration file (httpd.conf), and comment (disable) it by typing the pound sign (#) before the beginning of the string as shown in the screen capture (shown). Then, type Options IncludesNoExec on the next line; Win32DisableAcceptEx can be inserted after the ‘</Directory>’ line as in the example below, or appended at the end of the file.

IPECS Network Management System Issue 1
14
Apache HTTP Server writes the access log into the ‘access.log’ file, and the size of the file grows relatively faster depending on the number of access lines to the server. Therefore, as an option, in order to prevent unwanted waste of HDD space by disabling writes to the access log, find CustomLog “logs/access.log” common string in the configuration file (shown) and disable it by typing pound sign (‘#’) before the beginning of the string. When finished, save the configuration file and then close the text editor program.
The modified configuration will be applied after restarting Windows or Apache HTTP Server 2.2. However, since the new configuration is not required until the iPECS NMS Control program is executed, continue the installation without restarting Windows at this time. .

IPECS Network Management System Issue 1
15
2.2.2.4 PHP Hypertext Preprocessor Installation
To install the PHP Hypertext Preprocessor, perform the following Steps: Double-click on the php-5.2.5-win32-installer.msi file to start the PHP Hypertext Preprocessor installation procedure (5.2.5 is the software version used in this manual). On the Welcome to the PHP Setup Wizard screen, click [Next] to proceed. First read the PHP License within the End-User License Agreement screen; click [I accept the terms in the License Agreement] to Accept the terms and then click [Next >] to proceed.
IPECS Network Management System Issue 1
16
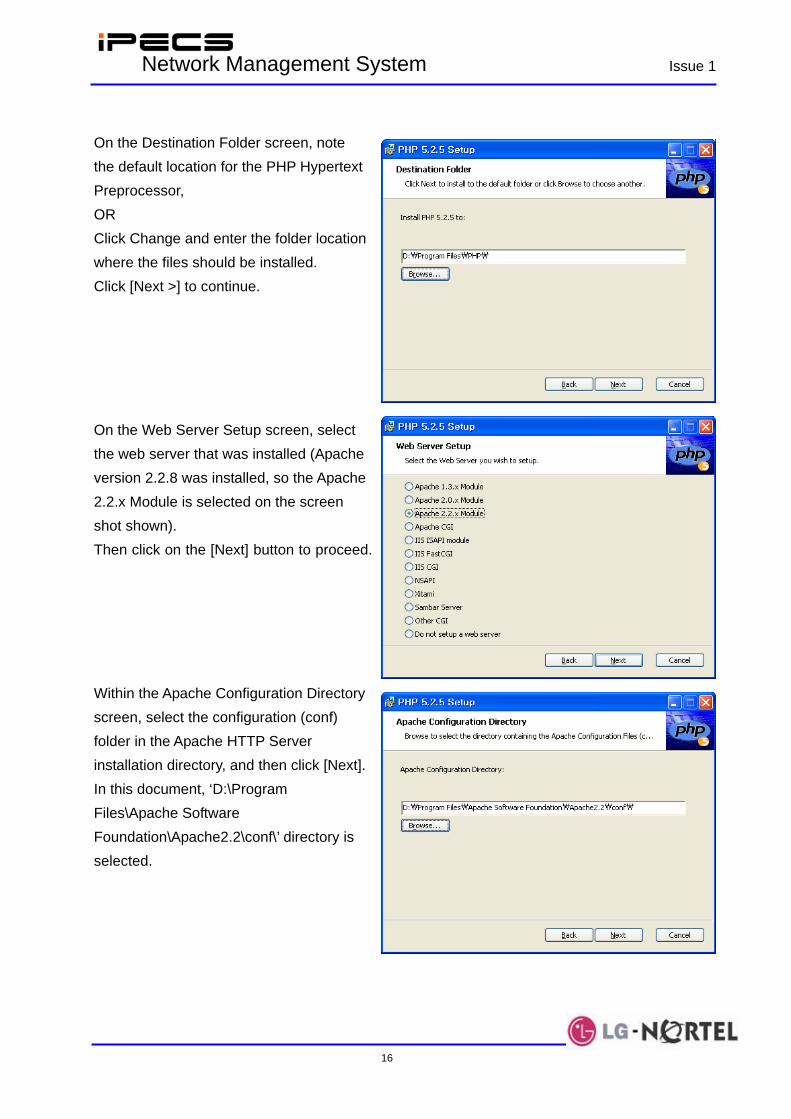
On the Destination Folder screen, note the default location for the PHP Hypertext Preprocessor, OR Click Change and enter the folder location where the files should be installed. Click [Next >] to continue. On the Web Server Setup screen, select the web server that was installed (Apache version 2.2.8 was installed, so the Apache 2.2.x Module is selected on the screen shot shown). Then click on the [Next] button to proceed. Within the Apache Configuration Directory screen, select the configuration (conf) folder in the Apache HTTP Server installation directory, and then click [Next]. In this document, ‘D:\Program Files\Apache Software Foundation\Apache2.2\conf\’ directory is selected.
IPECS Network Management System Issue 1
17
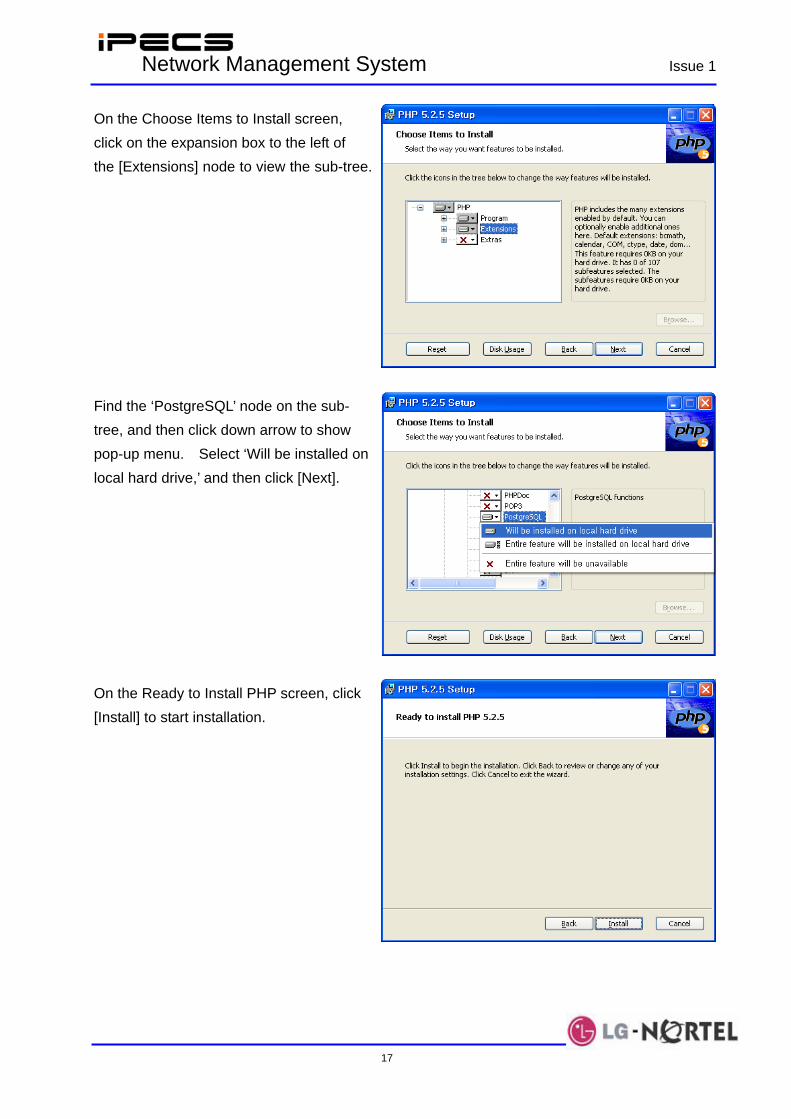
On the Choose Items to Install screen, click on the expansion box to the left of the [Extensions] node to view the sub-tree. Find the ‘PostgreSQL’ node on the sub-tree, and then click down arrow to show pop-up menu. Select ‘Will be installed on local hard drive,’ and then click [Next]. On the Ready to Install PHP screen, click [Install] to start installation.
IPECS Network Management System Issue 1
18
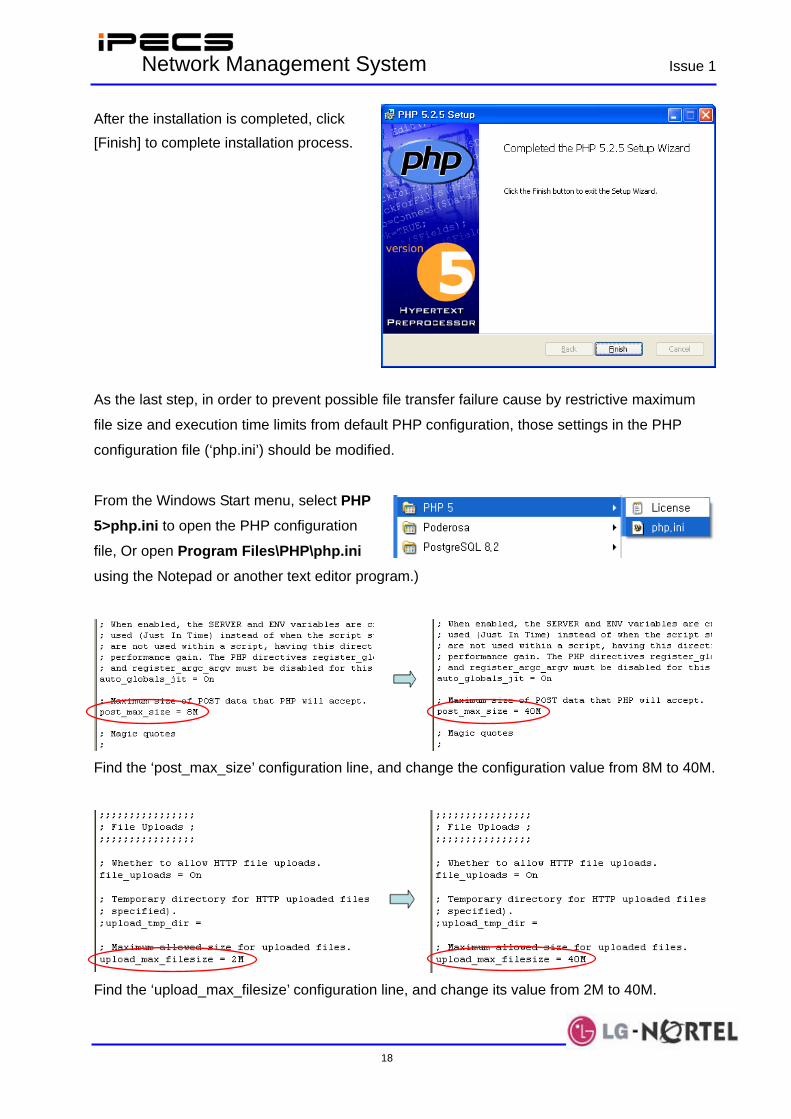
After the installation is completed, click [Finish] to complete installation process. As the last step, in order to prevent possible file transfer failure cause by restrictive maximum
file size and execution time limits from default PHP configuration, those settings in the PHP
configuration file (‘php.ini’) should be modified.
From the Windows Start menu, select PHP 5>php.ini to open the PHP configuration
file, Or open Program Files\PHP\php.ini using the Notepad or another text editor program.)
Find the ‘post_max_size’ configuration line, and change the configuration value from 8M to 40M.
Find the ‘upload_max_filesize’ configuration line, and change its value from 2M to 40M.
IPECS Network Management System Issue 1
19
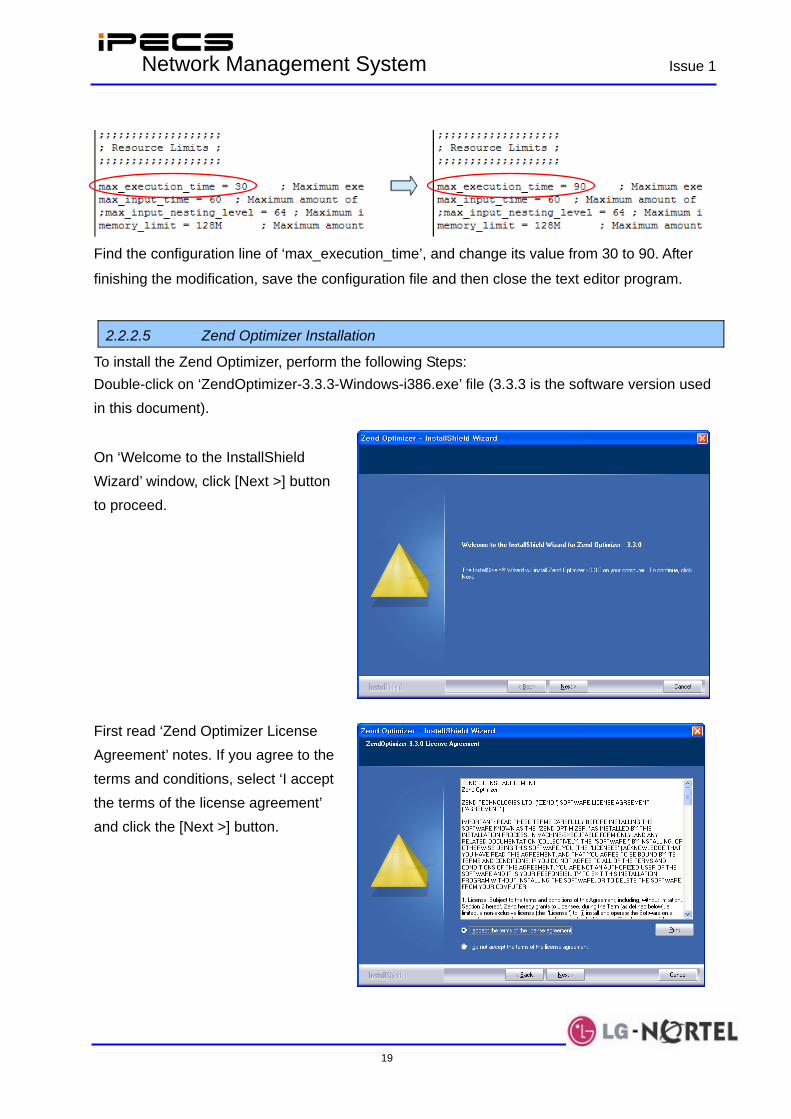
Find the configuration line of ‘max_execution_time’, and change its value from 30 to 90. After
finishing the modification, save the configuration file and then close the text editor program.
2.2.2.5 Zend Optimizer Installation
To install the Zend Optimizer, perform the following Steps: Double-click on ‘ZendOptimizer-3.3.3-Windows-i386.exe’ file (3.3.3 is the software version used in this document).
On ‘Welcome to the InstallShield Wizard’ window, click [Next >] button to proceed.
First read ‘Zend Optimizer License Agreement’ notes. If you agree to the terms and conditions, select ‘I accept the terms of the license agreement’ and click the [Next >] button.

IPECS Network Management System Issue 1
20
On ‘Choose Destination Folder’ window, select a folder in which ‘Zend Optimizer’ is to be installed, Or note the default location for installation, then click the [Next] button.
Then, on the ‘Choose Web server’
window, select the web server
installed in the previous procedure,
and then click the [Next >] button to
proceed. Since Apache version 2.2.8
was installed, [Apache 2.x] is selected.
On ‘Choose the php.ini folder’ window, the directory of ‘PHP Hypertext Preprocessor’ software is configured. The ‘php.ini’ file is saved in the ‘Program Files\PHP” directory. After selecting (or noting the default) directory, click the [Next >] button.
IPECS Network Management System Issue 1
21
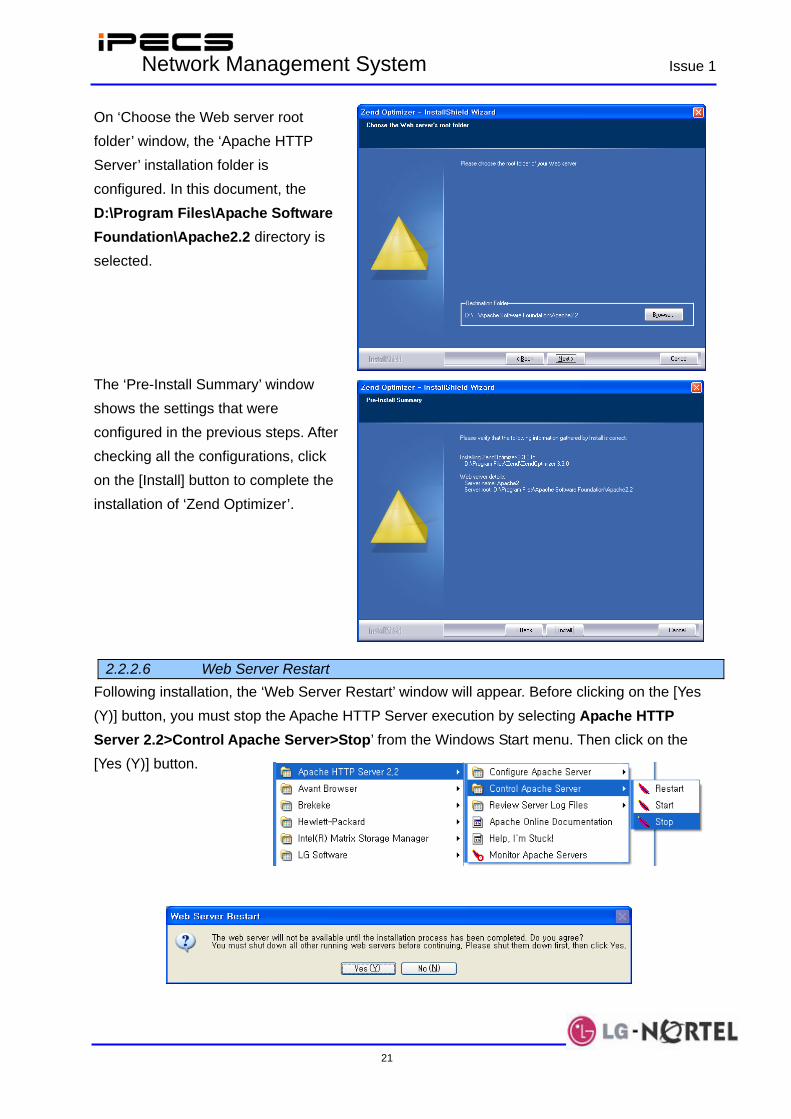
On ‘Choose the Web server root folder’ window, the ‘Apache HTTP Server’ installation folder is configured. In this document, the D:\Program Files\Apache Software Foundation\Apache2.2 directory is selected.
The ‘Pre-Install Summary’ window shows the settings that were configured in the previous steps. After checking all the configurations, click on the [Install] button to complete the installation of ‘Zend Optimizer’.
2.2.2.6 Web Server Restart Following installation, the ‘Web Server Restart’ window will appear. Before clicking on the [Yes (Y)] button, you must stop the Apache HTTP Server execution by selecting Apache HTTP Server 2.2>Control Apache Server>Stop’ from the Windows Start menu. Then click on the [Yes (Y)] button.
IPECS Network Management System Issue 1
22
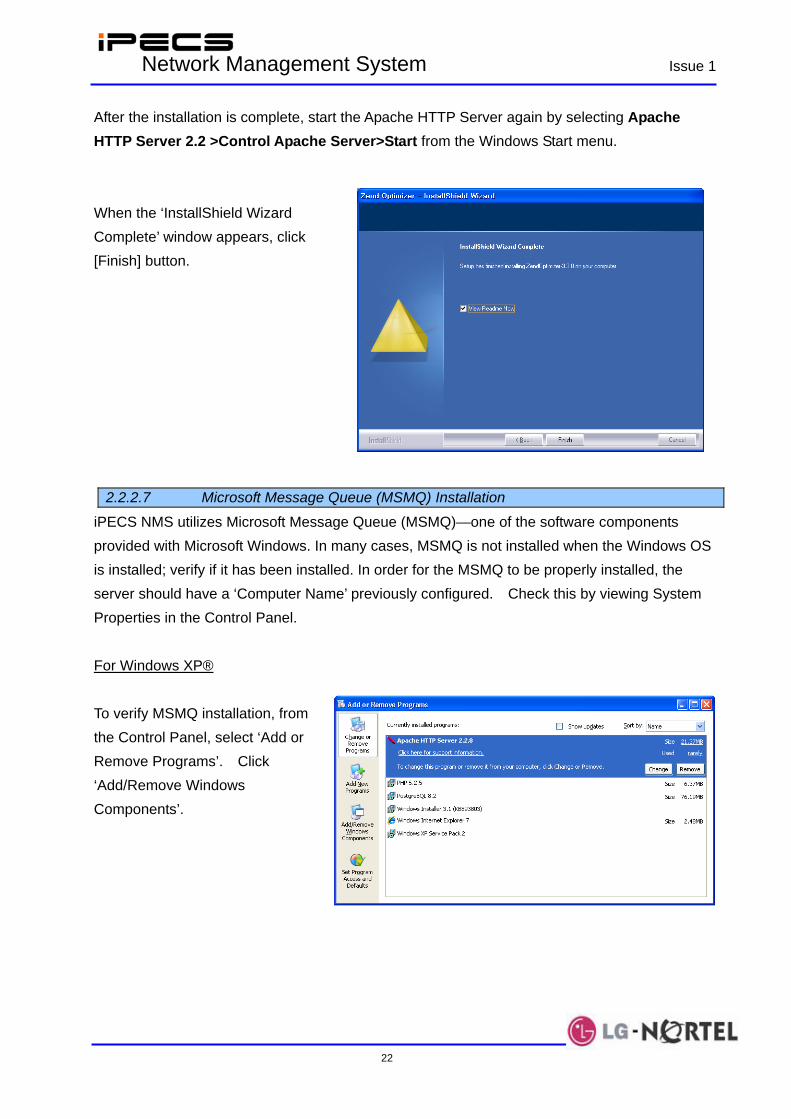
After the installation is complete, start the Apache HTTP Server again by selecting Apache HTTP Server 2.2 >Control Apache Server>Start from the Windows Start menu. When the ‘InstallShield Wizard Complete’ window appears, click [Finish] button.
2.2.2.7 Microsoft Message Queue (MSMQ) Installation
iPECS NMS utilizes Microsoft Message Queue (MSMQ)—one of the software components provided with Microsoft Windows. In many cases, MSMQ is not installed when the Windows OS is installed; verify if it has been installed. In order for the MSMQ to be properly installed, the server should have a ‘Computer Name’ previously configured. Check this by viewing System Properties in the Control Panel. For Windows XP® To verify MSMQ installation, from the Control Panel, select ‘Add or Remove Programs’. Click ‘Add/Remove Windows Components’.

IPECS Network Management System Issue 1
23
In the Windows Components screen, locate the Message Queuing item and verify if it is installed. If it has not been installed (box is not checked), click the checkbox, and then click [Details…].
Message Queuing includes Active Directory Integration. If a domain controller or controller server that provides directory service does not exist, clear the Active Directory Integration checkbox, and click [OK]. After returning to the Windows Components screen, click the [Next >] to start installation. After installation is completed, click [Finish].
IPECS Network Management System Issue 1
24
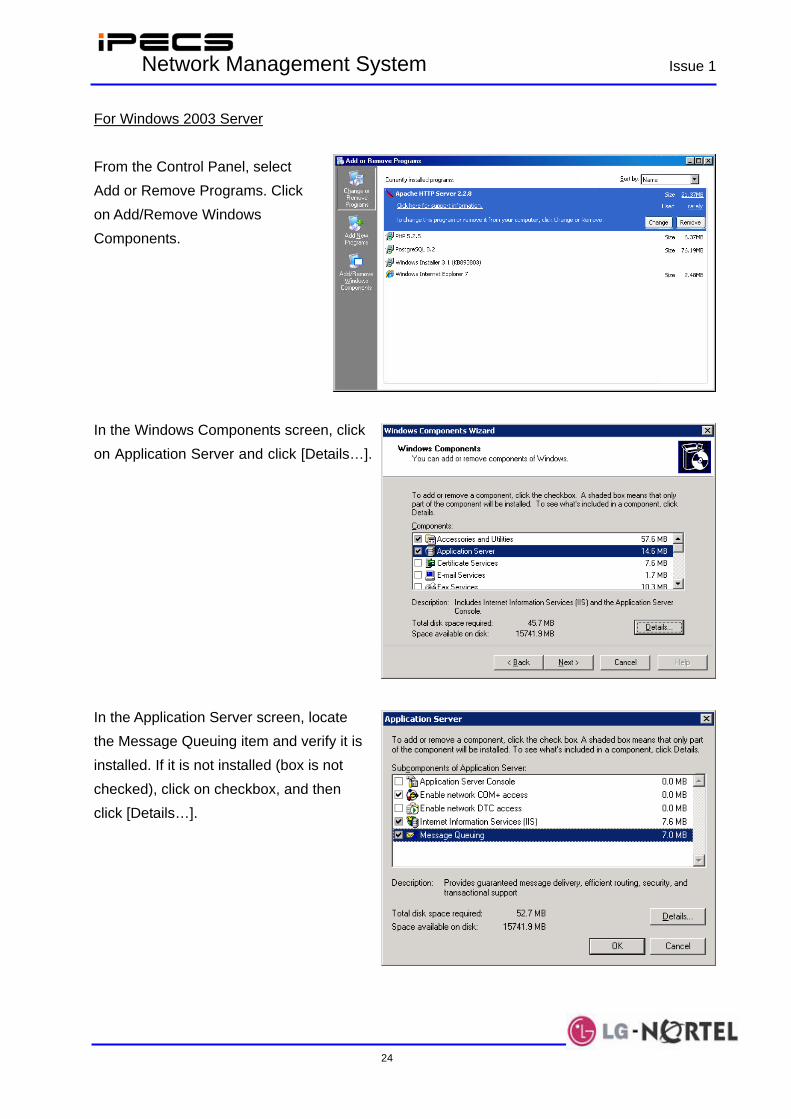
For Windows 2003 Server From the Control Panel, select Add or Remove Programs. Click on Add/Remove Windows Components. In the Windows Components screen, click on Application Server and click [Details…]. In the Application Server screen, locate the Message Queuing item and verify it is installed. If it is not installed (box is not checked), click on checkbox, and then click [Details…].
IPECS Network Management System Issue 1
25
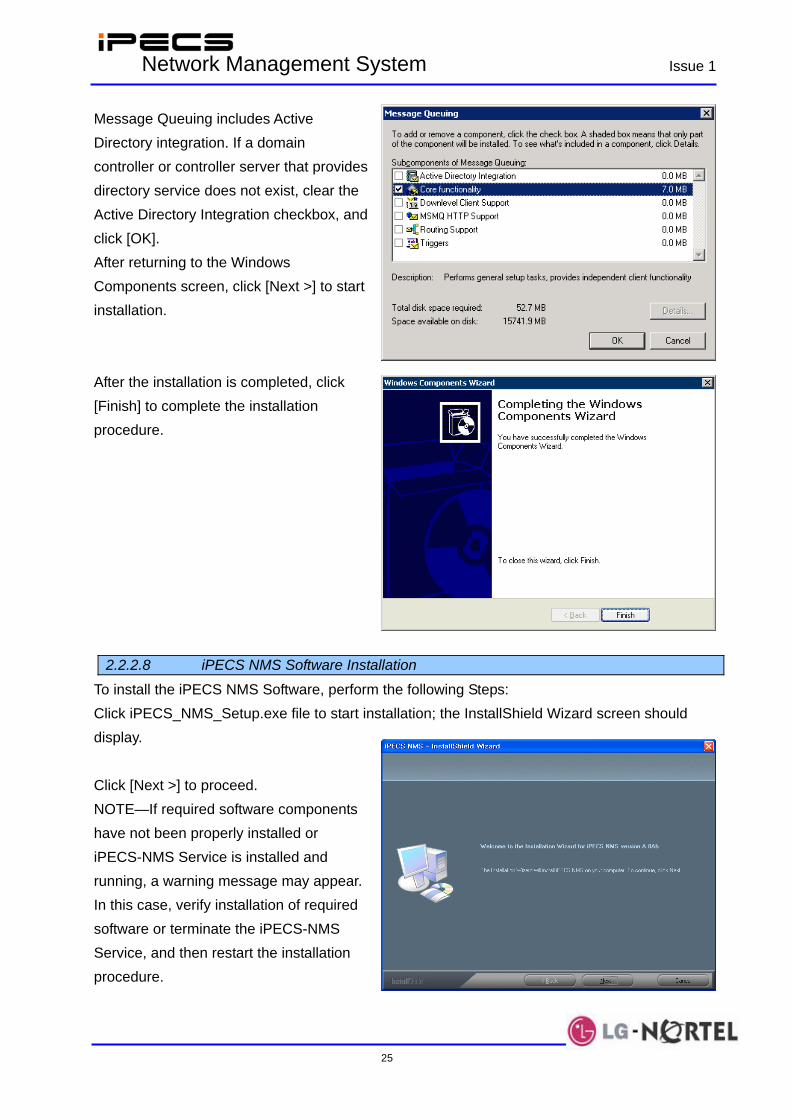
Message Queuing includes Active Directory integration. If a domain controller or controller server that provides directory service does not exist, clear the Active Directory Integration checkbox, and click [OK]. After returning to the Windows Components screen, click [Next >] to start installation. After the installation is completed, click [Finish] to complete the installation procedure.
2.2.2.8 iPECS NMS Software Installation
To install the iPECS NMS Software, perform the following Steps: Click iPECS_NMS_Setup.exe file to start installation; the InstallShield Wizard screen should display. Click [Next >] to proceed. NOTE—If required software components have not been properly installed or iPECS-NMS Service is installed and running, a warning message may appear. In this case, verify installation of required software or terminate the iPECS-NMS Service, and then restart the installation procedure.

IPECS Network Management System Issue 1
26
In the Customer Information window, enter the User Name and Company Name fields, and click [Next]. Normally the default destination location for program files need not be modified, click [Next>] to continue. If a different destination is desired, click [Change] and select the new location, and then click [Next >]. On the Select Web service root directory screen, select the ‘htdocs’ folder under the Apache HTTP Server installation directory, D:\Program Files\Apache Software Foundation\Apache2.2\htdocs was used in this example. After the folder is chosen, click [Next >] to proceed. NOTE—if the location for the Apache server files was changed, that directory should be selected by clicking [Change…].
IPECS Network Management System Issue 1
27
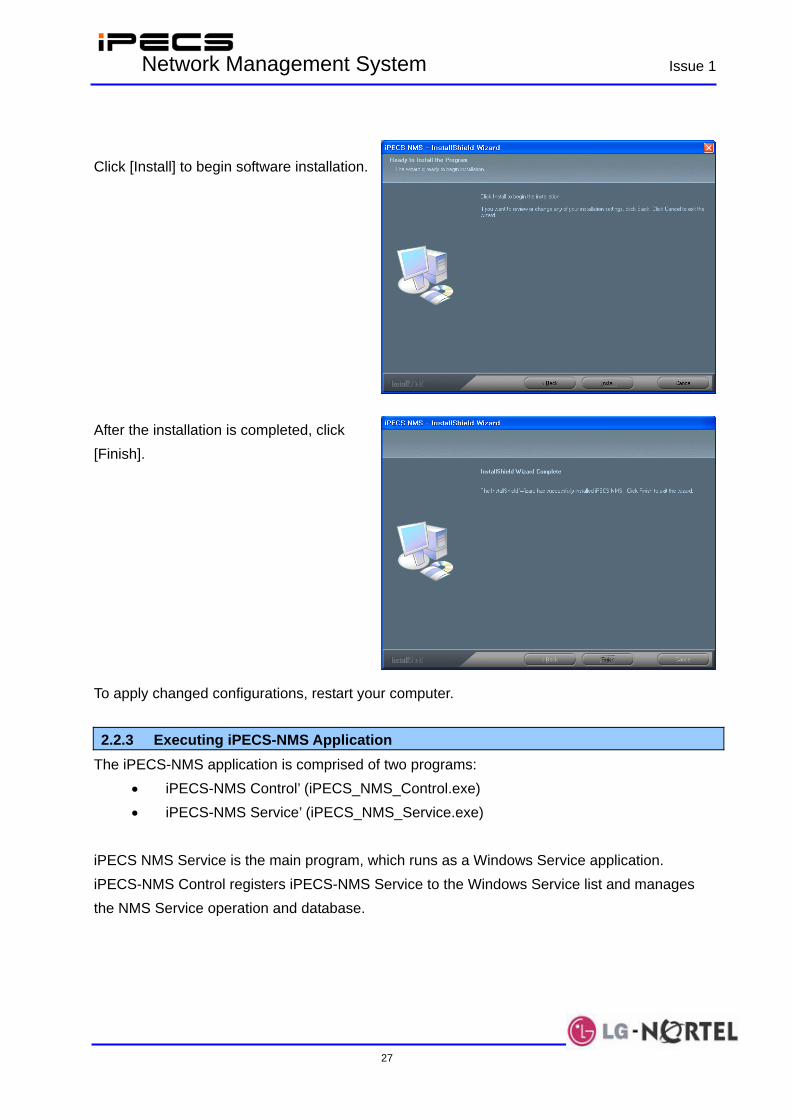
Click [Install] to begin software installation. After the installation is completed, click [Finish]. To apply changed configurations, restart your computer. 2.2.3 Executing iPECS-NMS Application
The iPECS-NMS application is comprised of two programs: • iPECS-NMS Control’ (iPECS_NMS_Control.exe) • iPECS-NMS Service’ (iPECS_NMS_Service.exe)
iPECS NMS Service is the main program, which runs as a Windows Service application. iPECS-NMS Control registers iPECS-NMS Service to the Windows Service list and manages the NMS Service operation and database.
IPECS Network Management System Issue 1
28
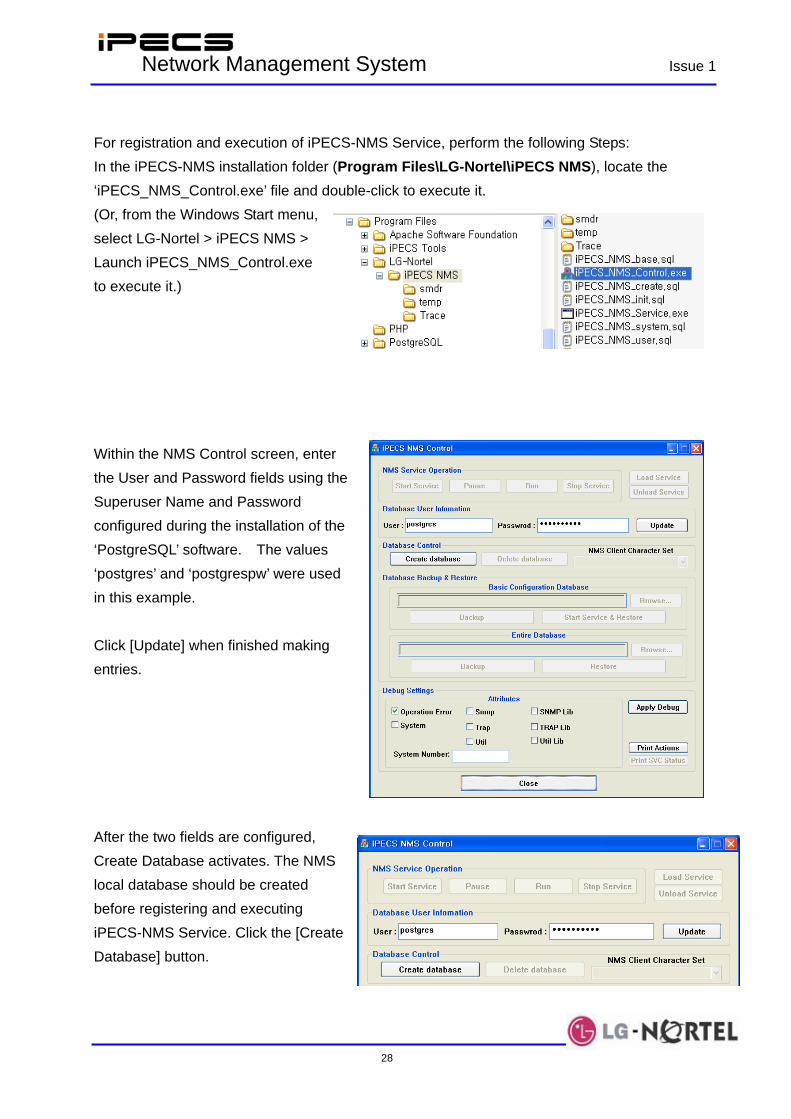
For registration and execution of iPECS-NMS Service, perform the following Steps: In the iPECS-NMS installation folder (Program Files\LG-Nortel\iPECS NMS), locate the ‘iPECS_NMS_Control.exe’ file and double-click to execute it. (Or, from the Windows Start menu, select LG-Nortel > iPECS NMS > Launch iPECS_NMS_Control.exe to execute it.) Within the NMS Control screen, enter the User and Password fields using the Superuser Name and Password configured during the installation of the ‘PostgreSQL’ software. The values ‘postgres’ and ‘postgrespw’ were used in this example. Click [Update] when finished making entries. After the two fields are configured, Create Database activates. The NMS local database should be created before registering and executing iPECS-NMS Service. Click the [Create Database] button.
IPECS Network Management System Issue 1
29
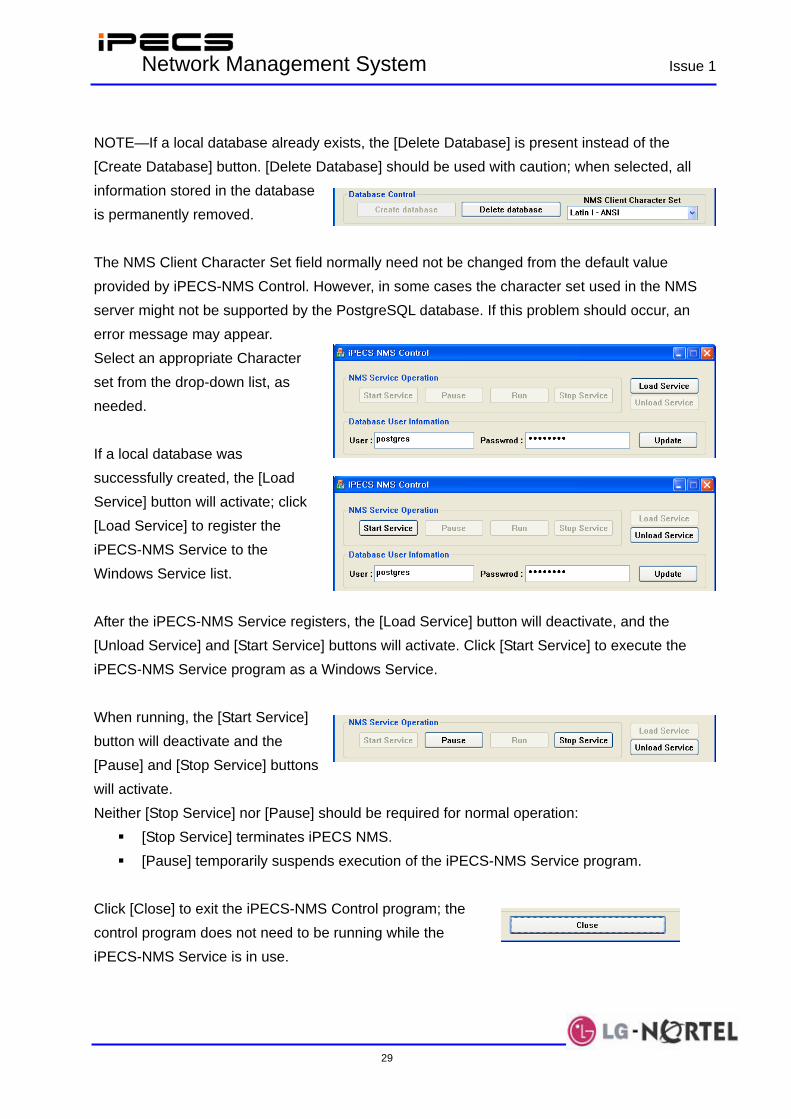
NOTE—If a local database already exists, the [Delete Database] is present instead of the [Create Database] button. [Delete Database] should be used with caution; when selected, all information stored in the database is permanently removed. The NMS Client Character Set field normally need not be changed from the default value provided by iPECS-NMS Control. However, in some cases the character set used in the NMS server might not be supported by the PostgreSQL database. If this problem should occur, an error message may appear. Select an appropriate Character set from the drop-down list, as needed. If a local database was successfully created, the [Load Service] button will activate; click [Load Service] to register the iPECS-NMS Service to the Windows Service list. After the iPECS-NMS Service registers, the [Load Service] button will deactivate, and the [Unload Service] and [Start Service] buttons will activate. Click [Start Service] to execute the iPECS-NMS Service program as a Windows Service. When running, the [Start Service] button will deactivate and the [Pause] and [Stop Service] buttons will activate. Neither [Stop Service] nor [Pause] should be required for normal operation:
[Stop Service] terminates iPECS NMS. [Pause] temporarily suspends execution of the iPECS-NMS Service program.
Click [Close] to exit the iPECS-NMS Control program; the control program does not need to be running while the iPECS-NMS Service is in use.

IPECS Network Management System Issue 1
30
2.3 iPECS System Admin Configuration Before registering iPECS systems to the iPECS-NMS, NMS-related system admin fields should
be configured. After logging-in to iPECS Web Admin, click ‘SNMP Attribute (P196)’ from the
System Data list to enter the NMS configuration page.
‘The ’SNMP Attribute (P196)’
screen is categorized into
three parts:
SNMP Agent – SNMP Service field is used for enabling or disabling (ON or OFF) the SNMP agent service running on MFIM; this field should be set to ‘ON’ for communication with iPECS-NMS using SNMP protocol. - SNMP Port - Standard SNMP port number 161 should be used unless there is a specific reason for changing this port number.
SNMP Security – SNMP community and NMS server IP address can be configured; the SNMP community designates a SNMP communication group to which an SNMP message belongs, and is also a logical relationship between the SNMP agent (MFIM) and SNMP manager (NMS). - Read Only Community – defines a community string that should be used when SNMP manager (NMS) is trying to read data from the SNMP agent (MFIM), and its default value is set to ‘public’ - Read Write Community – is used for both read and write data by the SNMP manager (NMS), and its default value is ‘private’. This value should be the same as set up on the iPECS-NMS community string (default=private, but could be changed following

IPECS Network Management System Issue 1
31
installation as needed) - Accept SNMP Packet from Any NMS Server – if IP Address is not fixed, click to accept SNMP packets from any SNMP manager (or from any IP address), OR - Accept SNMP Packets from These NMS Servers – if IP Address is fixed, click to designate IP addresses to be allowed and the method of data transaction (Read Only / Read Write).
SNMP Trap – configuration is for setting the destination IP address to which Trap messages (ex., alarm/fault events) are to be sent from the SNMP agent (MFIM). Trap Community – designates a Trap communication group to which a Trap message belongs, and is also a logical relationship between the SNMP agent (MFIM), and SNMP manager (NMS). This value should be same as the Trap community string defined in iPECS-NMS in order for the Trap messages sent from SNMP agent to be accepted by the iPECS-NMS server. NOTE—Trap communities should be set-up same for all the iPECS systems registered to an iPECS-NMS server (default=public, but could be changed following installation as needed), whereas the SNMP community may be defined with different strings for each iPECS system. - Trap Destination – is for designating the IP address of the iPECS-NMS server, the Trap port number (default=162), and the Trap type field (Notification, Inform, and Trap). Notification – defined in SNMPv2c that is sent once without checking the reception of the message. Inform - similar to Notification, but checks the reception of the message using a Response message sent from the receiving SNMP manager (NMS); messages not transmitting a response will be assumed lost and will be sent again (ex., used in an unstable network where there is packet loss, but may decrease network performance when too many messages are present in the MFIM. Trap – defined in SNMPv1, but because iPECS-NMS and the SNMP agent on MFIM use SNMPv2c, it is not recommended.
After finishing all configurations, click on the [Save] button to save and apply the field values.
IPECS Network Management System Issue 1
32
3. Getting Started 3.1 Overview of Set-up Once the NMS Server is installed and running, it will monitor registered iPECS systems and be available to service NMS clients, and Web browsers. After initial installation, check the Windows Service status (Section 3.2), and configuration of the following:
• NMS Management Functions (Section 4.1, NMS Server Management) • NMS Users and Authority (Section 4.2, User Accounts Management) • Register iPECS Systems for services (Section 4.3, System Management)
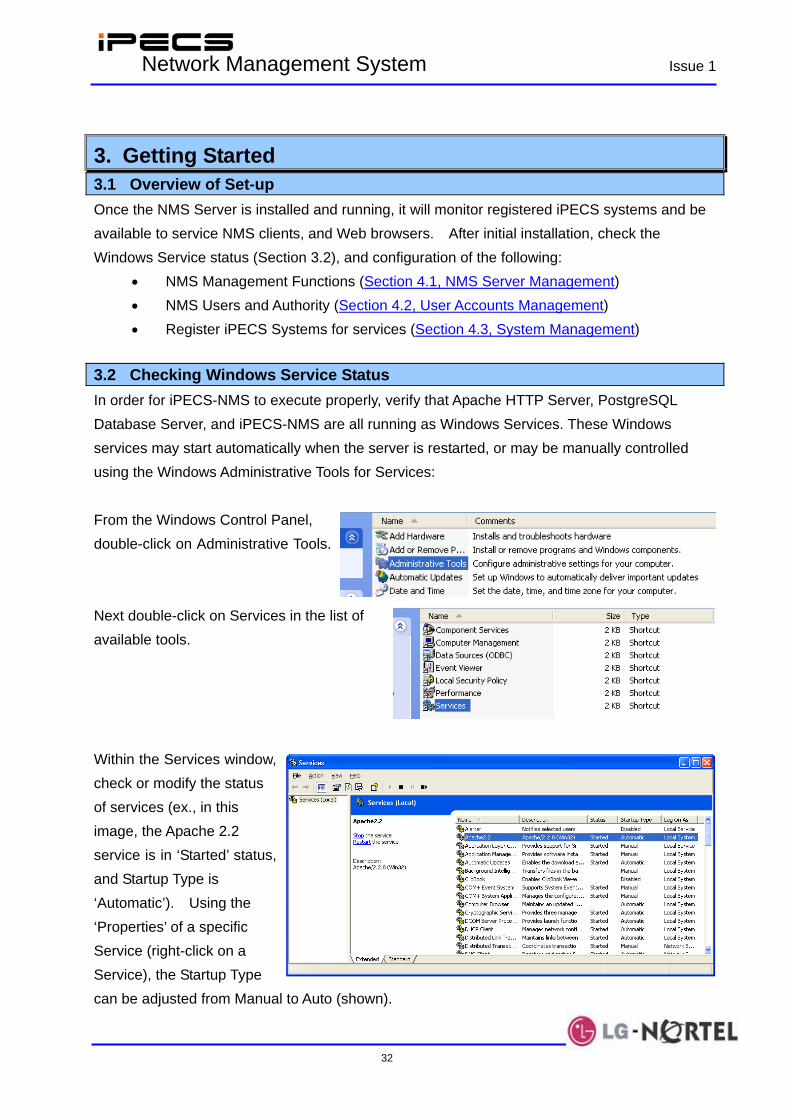
3.2 Checking Windows Service Status In order for iPECS-NMS to execute properly, verify that Apache HTTP Server, PostgreSQL Database Server, and iPECS-NMS are all running as Windows Services. These Windows services may start automatically when the server is restarted, or may be manually controlled using the Windows Administrative Tools for Services: From the Windows Control Panel, double-click on Administrative Tools. Next double-click on Services in the list of available tools. Within the Services window, check or modify the status of services (ex., in this image, the Apache 2.2 service is in ‘Started’ status, and Startup Type is ‘Automatic’). Using the ‘Properties’ of a specific Service (right-click on a Service), the Startup Type can be adjusted from Manual to Auto (shown).
IPECS Network Management System Issue 1
33
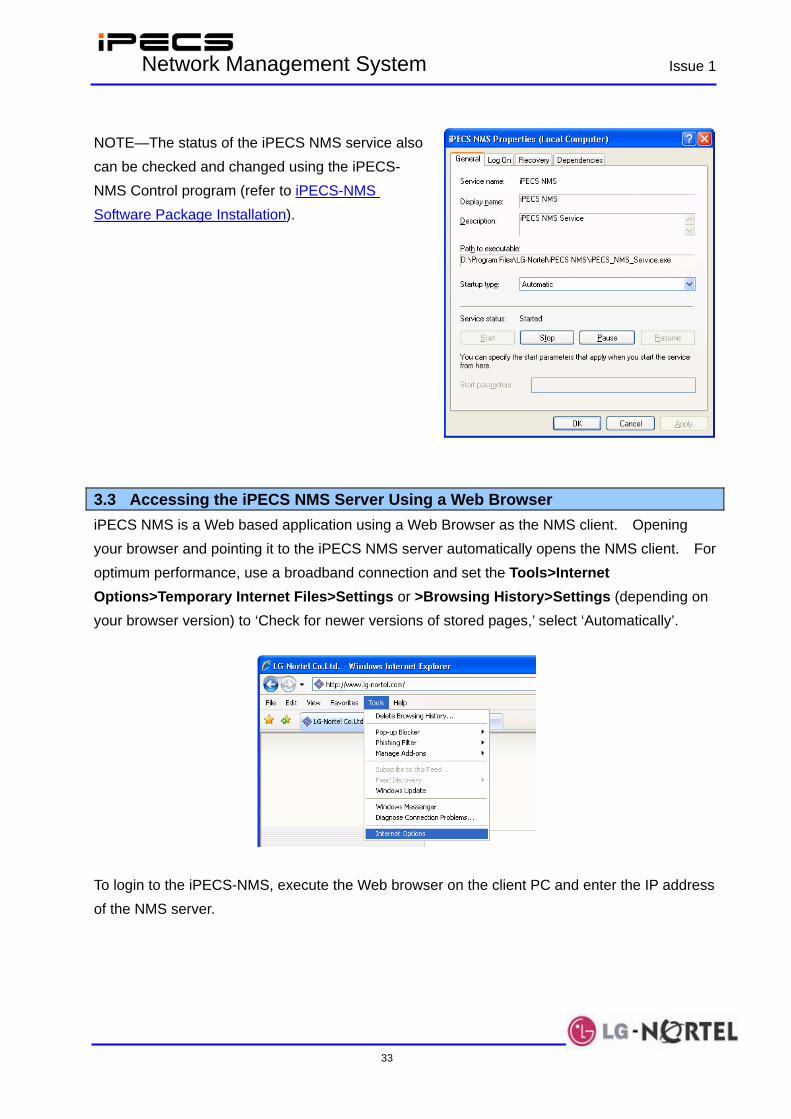
NOTE—The status of the iPECS NMS service also can be checked and changed using the iPECS-NMS Control program (refer to iPECS-NMS Software Package Installation). 3.3 Accessing the iPECS NMS Server Using a Web Browser iPECS NMS is a Web based application using a Web Browser as the NMS client. Opening your browser and pointing it to the iPECS NMS server automatically opens the NMS client. For optimum performance, use a broadband connection and set the Tools>Internet Options>Temporary Internet Files>Settings or >Browsing History>Settings (depending on your browser version) to ‘Check for newer versions of stored pages,’ select ‘Automatically’.
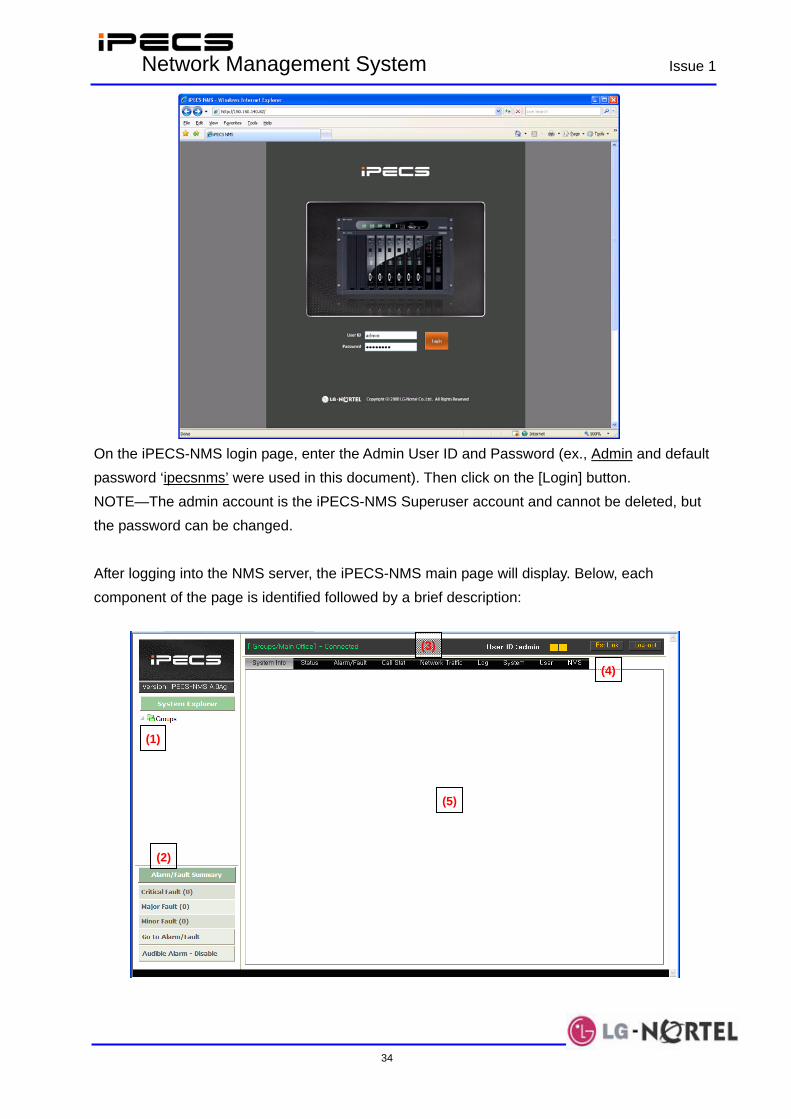
To login to the iPECS-NMS, execute the Web browser on the client PC and enter the IP address of the NMS server.
IPECS Network Management System Issue 1
34
On the iPECS-NMS login page, enter the Admin User ID and Password (ex., Admin and default password ‘ipecsnms’ were used in this document). Then click on the [Login] button. NOTE—The admin account is the iPECS-NMS Superuser account and cannot be deleted, but the password can be changed. After logging into the NMS server, the iPECS-NMS main page will display. Below, each component of the page is identified followed by a brief description:
(1)
(3)
(4)
(5)
(2)

IPECS Network Management System Issue 1
35
(1) iPECS System Explorer –Lists registered systems with Station, CO, and other devices shown in a tree format. If system groups are created to manage systems (refer to Section 4.4.2), those groups are also displayed in tree format. (2) Alarm/Fault Summary – For alarm/fault events shows the number of events not yet checked by the administrator. For quick access to events, clicking on [Go to Alarm/Fault Management] moves to the Alarm/Fault management screen. When an alarm/fault event occurs that is configured to play audible alarm in ‘Alarm/Fault Config’, an alarm sound is played depending on the setting of ‘Audible Alarm’ (Toggle=One Time, Repeat, or Disabled). When set to ‘Repeat’, alarm can be stopped by clicking [Alarm/Fault Summary] or [Go to Alarm/Fault], or clicking the [Alarm/Fault Analysis] menu tab (Toggle=color change from orange when a new alarm/fault occurs). (3) Information and Control bar - Displays the selected iPECS System Name (on left) and, the NMS User ID and two indicator blocks (on right): - Block #1(left) – The left block indicates status of NMS client running on Web browser (blinks at a 5 second interval). - Block #2 – The right block indicates communication status between NMS client and server (blinks at a 10 second interval). In the small space to the right of block 2, an animating indicator shows when the NMS client is retrieving data from the MFIM. (4) NMS Menu - Provides tabs to access NMS Web pages for iPECS system related information and the System, User and NMS configuration pages; clicking on a tab moves to the corresponding functional page. (5) Displays functional pages corresponding to each menu – Some pages may have a 2nd-level menu depending on the number of features they provide. To log out from iPECS-NMS: Click on the [Log-out] button at the top-right of the screen. If a client web browser is closed without logging-out from the iPECS-NMS (by clicking on the [Log-out] button), the client status will be cleared after about 1 minute, automatically logging out the User. The iPECS-NMS provides various kinds of information in table format. Most of the tables accept those with row naming (ex., System Information, Additional System Information, Channel
IPECS Network Management System Issue 1
36
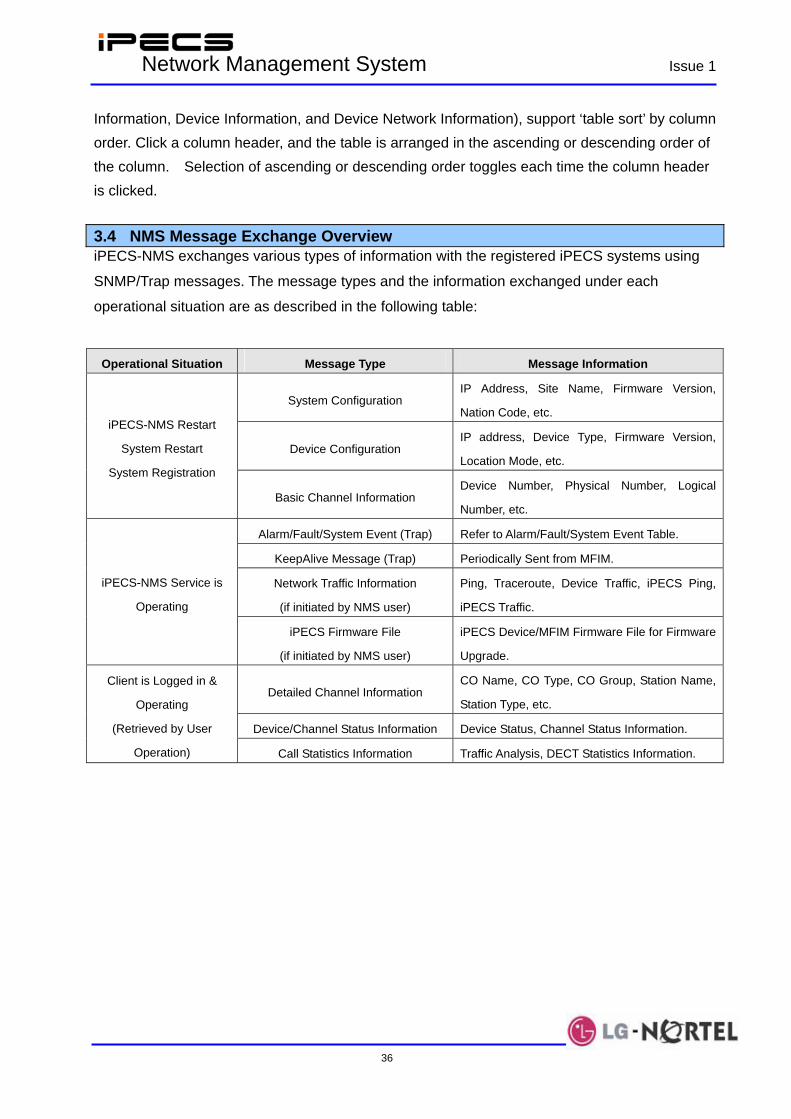
Information, Device Information, and Device Network Information), support ‘table sort’ by column order. Click a column header, and the table is arranged in the ascending or descending order of the column. Selection of ascending or descending order toggles each time the column header is clicked. 3.4 NMS Message Exchange Overview iPECS-NMS exchanges various types of information with the registered iPECS systems using
SNMP/Trap messages. The message types and the information exchanged under each
operational situation are as described in the following table:
Operational Situation Message Type Message Information
System Configuration IP Address, Site Name, Firmware Version,
Nation Code, etc.
Device Configuration IP address, Device Type, Firmware Version,
Location Mode, etc.
iPECS-NMS Restart
System Restart
System Registration
Basic Channel Information Device Number, Physical Number, Logical
Number, etc.
Alarm/Fault/System Event (Trap) Refer to Alarm/Fault/System Event Table.
KeepAlive Message (Trap) Periodically Sent from MFIM.
Network Traffic Information
(if initiated by NMS user)
Ping, Traceroute, Device Traffic, iPECS Ping,
iPECS Traffic.
iPECS-NMS Service is
Operating
iPECS Firmware File
(if initiated by NMS user)
iPECS Device/MFIM Firmware File for Firmware
Upgrade.
Detailed Channel Information CO Name, CO Type, CO Group, Station Name,
Station Type, etc.
Device/Channel Status Information Device Status, Channel Status Information.
Client is Logged in &
Operating
(Retrieved by User
Operation) Call Statistics Information Traffic Analysis, DECT Statistics Information.

IPECS Network Management System Issue 1
37
4. NMS Management 4.1 Modify Superuser Configuration
It is recommended to change the information of the Superuser (Admin) account when the
Superuser logs in for the first time. To change a User account, refer to User Account Configuration.
To change the information of the Superuser:
From the NMS Menu, click on the [User] tab and then [User Config] sub-menu. If you click the
‘admin’ item from the ‘List of All Users’ then the User information of ‘admin’ will be displayed. The
initial password for ‘admin’ should be changed for the security of your iPECS-NMS.
when finished making changes, click on the [Modify] button to apply the information to the
Superuser account. To confirm the modification, log out iPECS-NMS (by clicking the [Log Out]
button) and log-in again with the new password.
4.2 NMS Server Management The NMS Management screen is used to establish common iPECS NMS characteristics, including:
• NMS Mail Server • Trap Community • KeepAlive Timer • External Web Link.
Each of these is discussed in the following paragraphs. To access the NMS Management page:

IPECS Network Management System Issue 1
38
After logging-in to the iPECS NMS, click the [NMS] tab in the NMS Menu (shown). 4.2.1 NMS Mail Server Configuration
If an alarm or fault event occurs, iPECS NMS server will attempt to send an e-mail to User accounts assigned to receive notification. In order to send an e-mail, NMS server must have an e-mail account on a Simple Mail Transfer Protocol (SMTP) server. While an existing e-mail account could be used, it is recommended a separate iPECS NMS account be created in the e-mail server. To set-up e-mail service in iPECS NMS: From the the NMS Mail Server (SMTP) Configuration area of the screen, enter the name or IP address of the e-mail server, e-mail domain name, SMTP port, account name and password.
IPECS Network Management System Issue 1
39
SMTP Server/Port – if it is not clear what information to input, contact your System Administrator for help.
E-Mail Domain Name – is the domain name part of an E-Mail address managed on the SMTP server (normally the part of an e-mail address following the ‘@’ symbol).
Click [Save] to store the NMS e-mail account information. After completing NMS mail server (SMTP) configuration, [E-Mail Send Test] button can be used to check if E-Mail is sent properly using the configuration. The E-Mail is sent to the E-Mail address of currently logged-in user (verify the E-Mail address of the user is configured in ‘User Config’ of ‘User’ menu before clicking the [E-Mail Send Test] button). 4.2.2 Trap Community Configuration
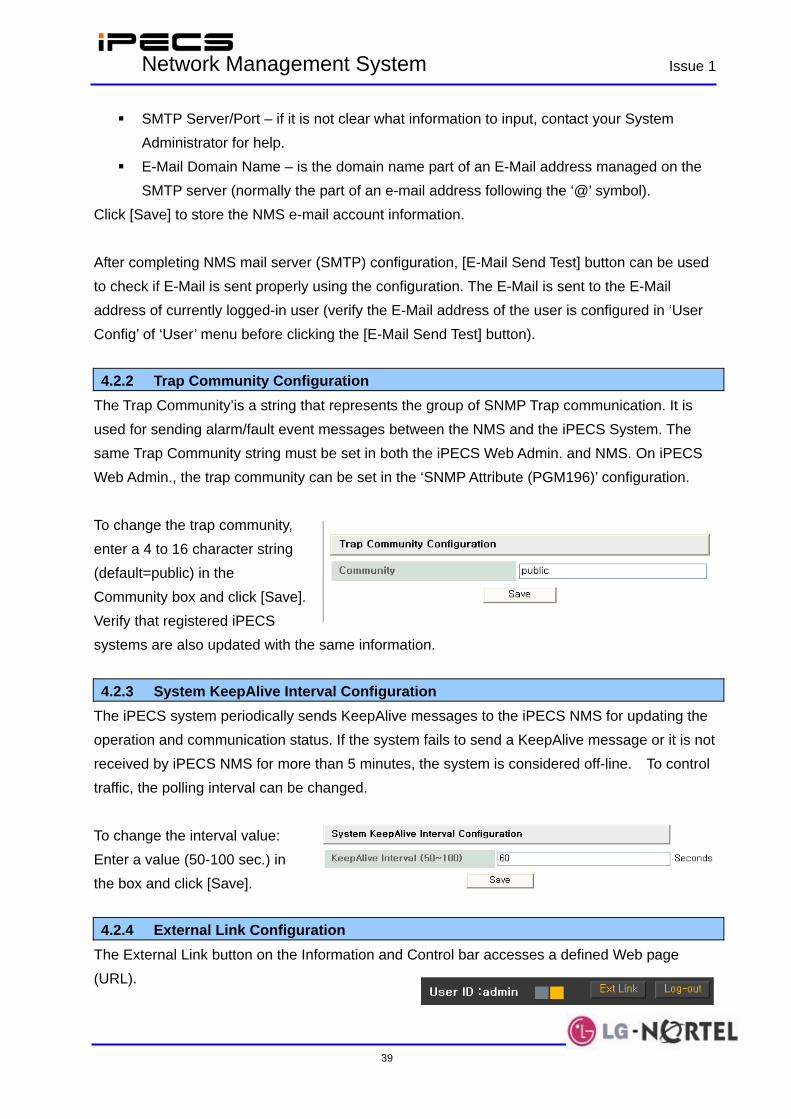
The Trap Community’is a string that represents the group of SNMP Trap communication. It is used for sending alarm/fault event messages between the NMS and the iPECS System. The same Trap Community string must be set in both the iPECS Web Admin. and NMS. On iPECS Web Admin., the trap community can be set in the ‘SNMP Attribute (PGM196)’ configuration. To change the trap community, enter a 4 to 16 character string (default=public) in the Community box and click [Save]. Verify that registered iPECS systems are also updated with the same information. 4.2.3 System KeepAlive Interval Configuration
The iPECS system periodically sends KeepAlive messages to the iPECS NMS for updating the operation and communication status. If the system fails to send a KeepAlive message or it is not received by iPECS NMS for more than 5 minutes, the system is considered off-line. To control traffic, the polling interval can be changed. To change the interval value: Enter a value (50-100 sec.) in the box and click [Save]. 4.2.4 External Link Configuration
The External Link button on the Information and Control bar accesses a defined Web page (URL).

IPECS Network Management System Issue 1
40
To set-up the External Link control: Enter the desired URL for the External Link button to connect to, and click [Save]. To confirm the desired configuration, click the [Ext Link] button; the new web browser window will be opened and the designated ‘External Link URL’ web page will be displayed. NOTE—Depending on the configuration of your web browser, some problems may occur on opening the new browser window (ex., security level, or blocked link). In this case, you should allow opening new browser window for the specific URL. 4.3 User Management ‘User Management’ provides the means to manage user accounts and assign users to each system to implement management domain for each user. Access control function provides the information of the users currently logged-in to iPECS-NMS, and allows making a selected user to be logged out of iPECS-NMS if needed. The pages for these features can be entered by clicking [User] tab on the top level menu. 4.3.1 User Configuration
User Accounts are managed under the [User Config] menu. Accounts can be added, modified and deleted, as well as specific iPECS systems may be assigned to an account. Up to a maximum of 100 accounts can be created, and 10 users including ‘admin’, may access the server simultaneously. It is also possible to assign specific users to each system so that only assigned users can operate on the system.
To access the User configuration screen, click [User Config] under the ‘User’ menu.

IPECS Network Management System Issue 1
41
The User configuration screen includes a List of All Users, User information and iPECS system assignment windows. The User information window manages User Accounts and specific iPECS systems are assigned to a User account in the ‘System Assignment to…’ window.
4.3.1.1 User Account Configuration
Each User account has an associated unique User ID (4 - 16 characters) and password. Each account has an assigned Privilege. User Account levels (Privileges) available are:
• Administration - allows full access to iPECS NMS server; note the ‘admin’ account is the super-user account with access to all functions of NMS and information on all systems registered to NMS. This account cannot be deleted, but the password can be changed. If this is a first time installation, for security purposes, it is recommended the ‘admin’ user account password be changed from the default.
• Operation - allows access to all of the NMS services except for User, NMS or System configurations screens at the Top-level menu.
• Monitoring - allows access to the System Info, Status and Alarm/Fault screens from the Top-level menu.
Additionally, the language preference and e-mail address (up to 40 characters) can be entered. Language selection only applies to messages from the iPECS NMS server and not from other services or Windows. To receive e-mail notification, notification must be assigned in the System Configuration screen (refer to Section 4.4.1). To add a new account, enter the desired User ID to create in the User Information window and click [Add]. To modify or delete an account, select the desired account in the ‘List of All Users,’ change the necessary User Information and click [Modify], or click [Delete] to erase the account. NOTE—Once a User ID is created, it cannot be changed.
IPECS Network Management System Issue 1
42
The [Clear Field] button is used to empty all field values in the ‘User Information’ except ‘Privilege’ and ‘Language.’
4.3.1.2 System Assignment to User Account
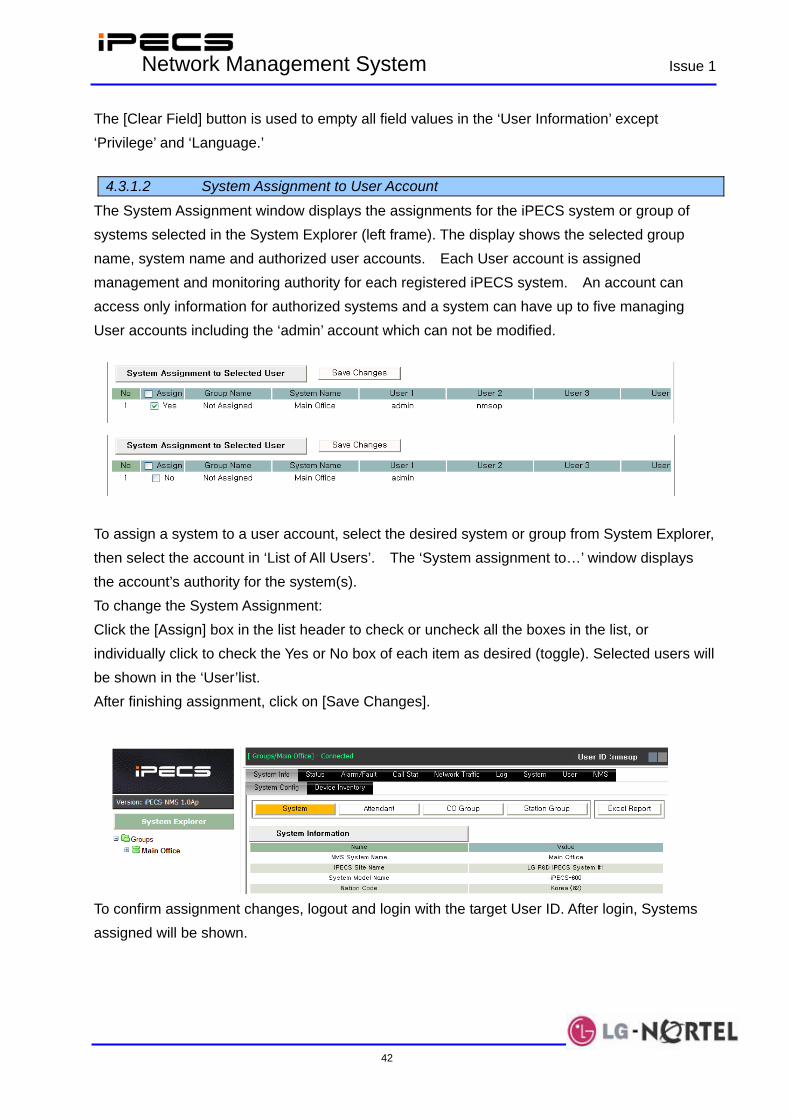
The System Assignment window displays the assignments for the iPECS system or group of systems selected in the System Explorer (left frame). The display shows the selected group name, system name and authorized user accounts. Each User account is assigned management and monitoring authority for each registered iPECS system. An account can access only information for authorized systems and a system can have up to five managing User accounts including the ‘admin’ account which can not be modified.
To assign a system to a user account, select the desired system or group from System Explorer, then select the account in ‘List of All Users’. The ‘System assignment to…’ window displays the account’s authority for the system(s). To change the System Assignment: Click the [Assign] box in the list header to check or uncheck all the boxes in the list, or individually click to check the Yes or No box of each item as desired (toggle). Selected users will be shown in the ‘User’list. After finishing assignment, click on [Save Changes].
To confirm assignment changes, logout and login with the target User ID. After login, Systems assigned will be shown.
IPECS Network Management System Issue 1
43
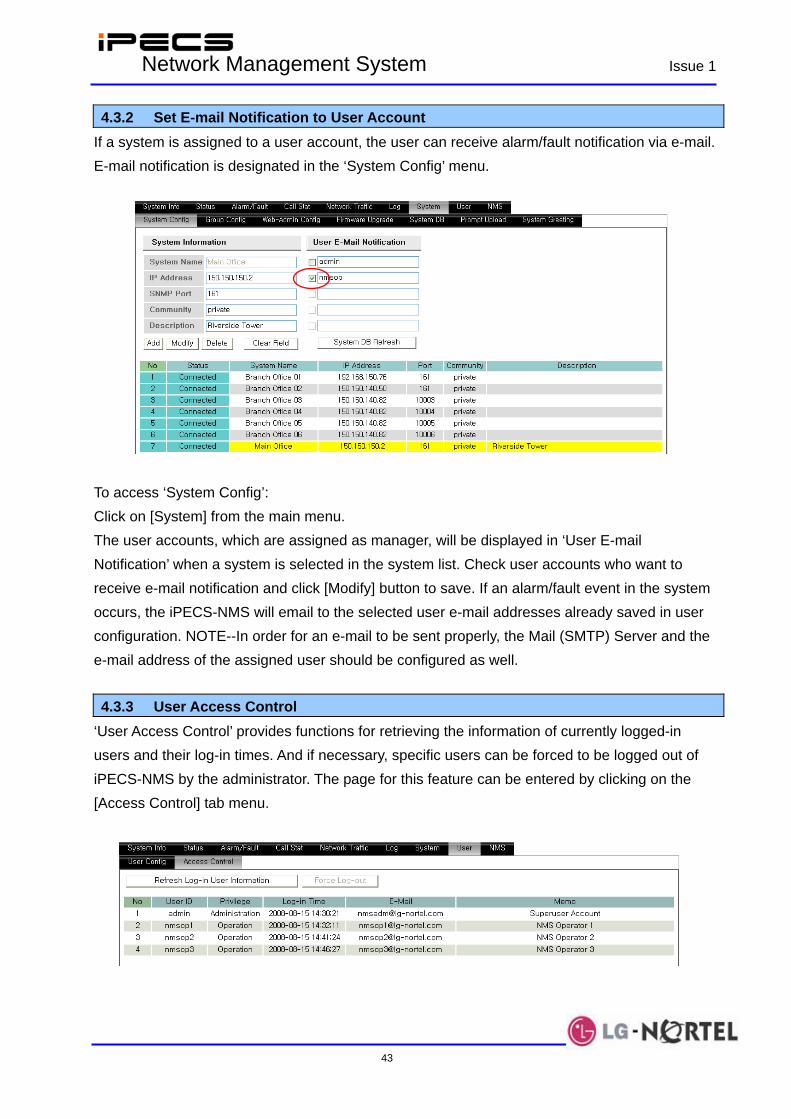
4.3.2 Set E-mail Notification to User Account If a system is assigned to a user account, the user can receive alarm/fault notification via e-mail. E-mail notification is designated in the ‘System Config’ menu.
To access ‘System Config’: Click on [System] from the main menu. The user accounts, which are assigned as manager, will be displayed in ‘User E-mail Notification’ when a system is selected in the system list. Check user accounts who want to receive e-mail notification and click [Modify] button to save. If an alarm/fault event in the system occurs, the iPECS-NMS will email to the selected user e-mail addresses already saved in user configuration. NOTE--In order for an e-mail to be sent properly, the Mail (SMTP) Server and the e-mail address of the assigned user should be configured as well. 4.3.3 User Access Control
‘User Access Control’ provides functions for retrieving the information of currently logged-in users and their log-in times. And if necessary, specific users can be forced to be logged out of iPECS-NMS by the administrator. The page for this feature can be entered by clicking on the [Access Control] tab menu.
IPECS Network Management System Issue 1
44
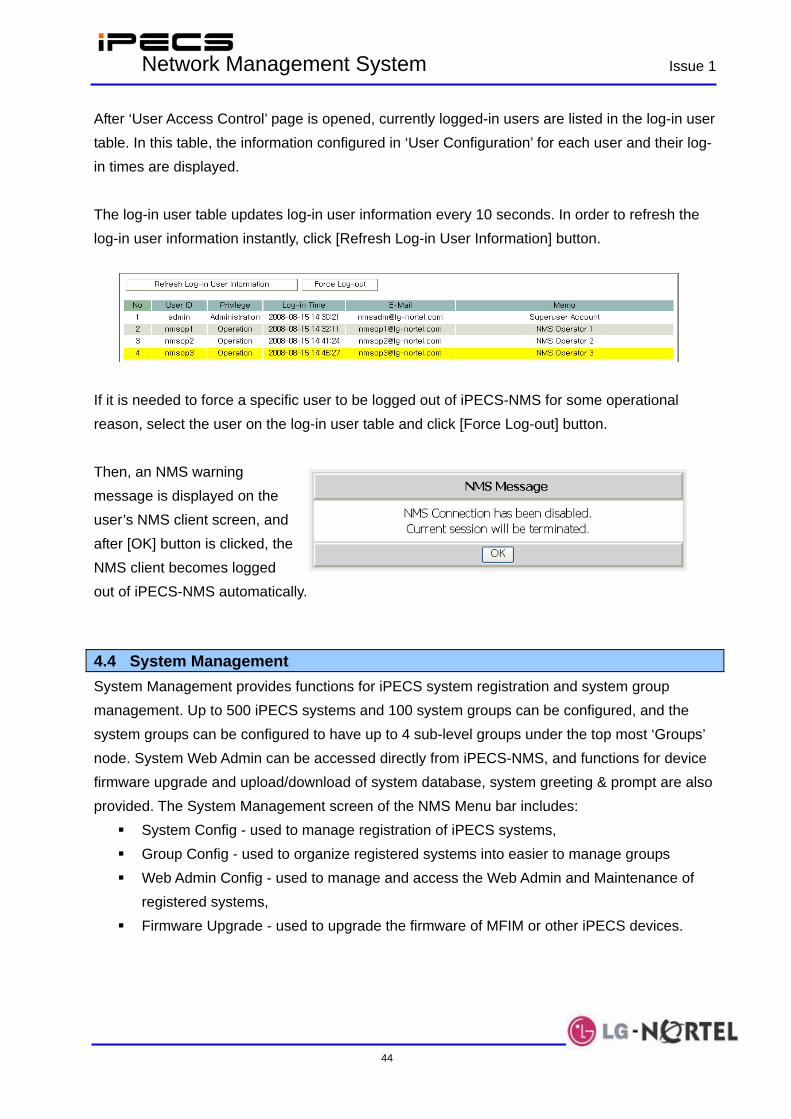
After ‘User Access Control’ page is opened, currently logged-in users are listed in the log-in user table. In this table, the information configured in ‘User Configuration’ for each user and their log-in times are displayed. The log-in user table updates log-in user information every 10 seconds. In order to refresh the log-in user information instantly, click [Refresh Log-in User Information] button.
If it is needed to force a specific user to be logged out of iPECS-NMS for some operational reason, select the user on the log-in user table and click [Force Log-out] button. Then, an NMS warning message is displayed on the user’s NMS client screen, and after [OK] button is clicked, the NMS client becomes logged out of iPECS-NMS automatically. 4.4 System Management System Management provides functions for iPECS system registration and system group management. Up to 500 iPECS systems and 100 system groups can be configured, and the system groups can be configured to have up to 4 sub-level groups under the top most ‘Groups’ node. System Web Admin can be accessed directly from iPECS-NMS, and functions for device firmware upgrade and upload/download of system database, system greeting & prompt are also provided. The System Management screen of the NMS Menu bar includes:
System Config - used to manage registration of iPECS systems, Group Config - used to organize registered systems into easier to manage groups Web Admin Config - used to manage and access the Web Admin and Maintenance of
registered systems, Firmware Upgrade - used to upgrade the firmware of MFIM or other iPECS devices.
IPECS Network Management System Issue 1
45
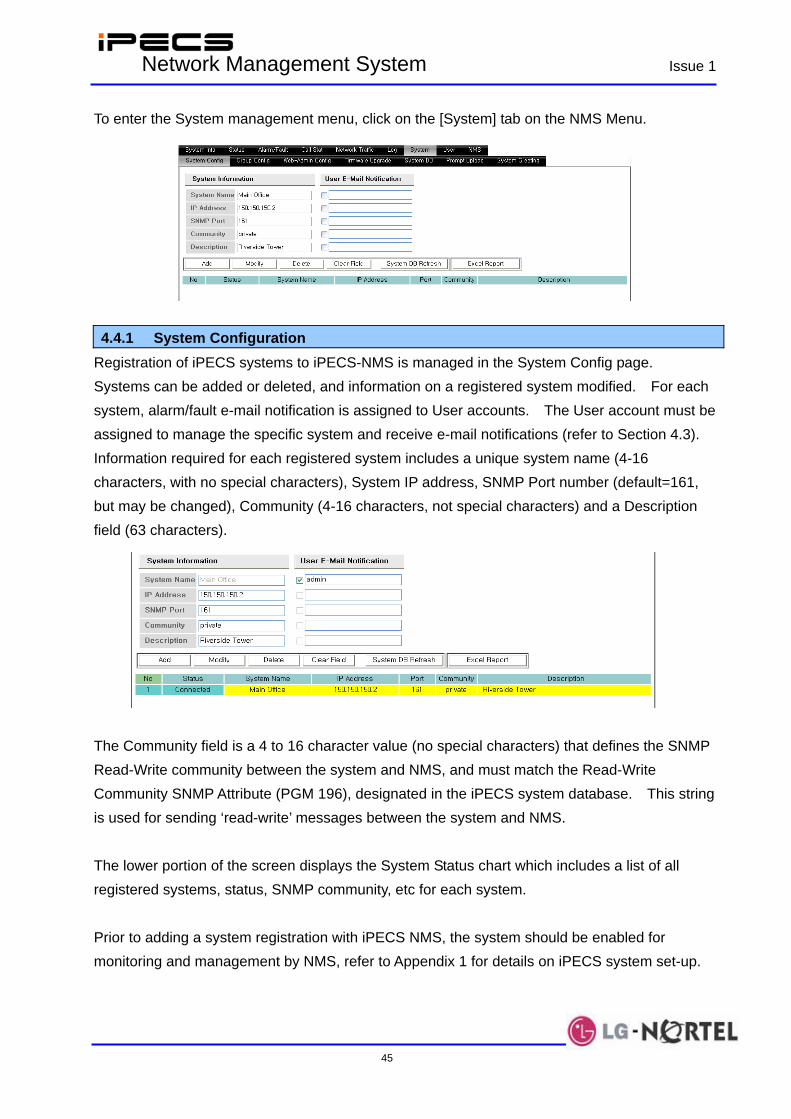
To enter the System management menu, click on the [System] tab on the NMS Menu.
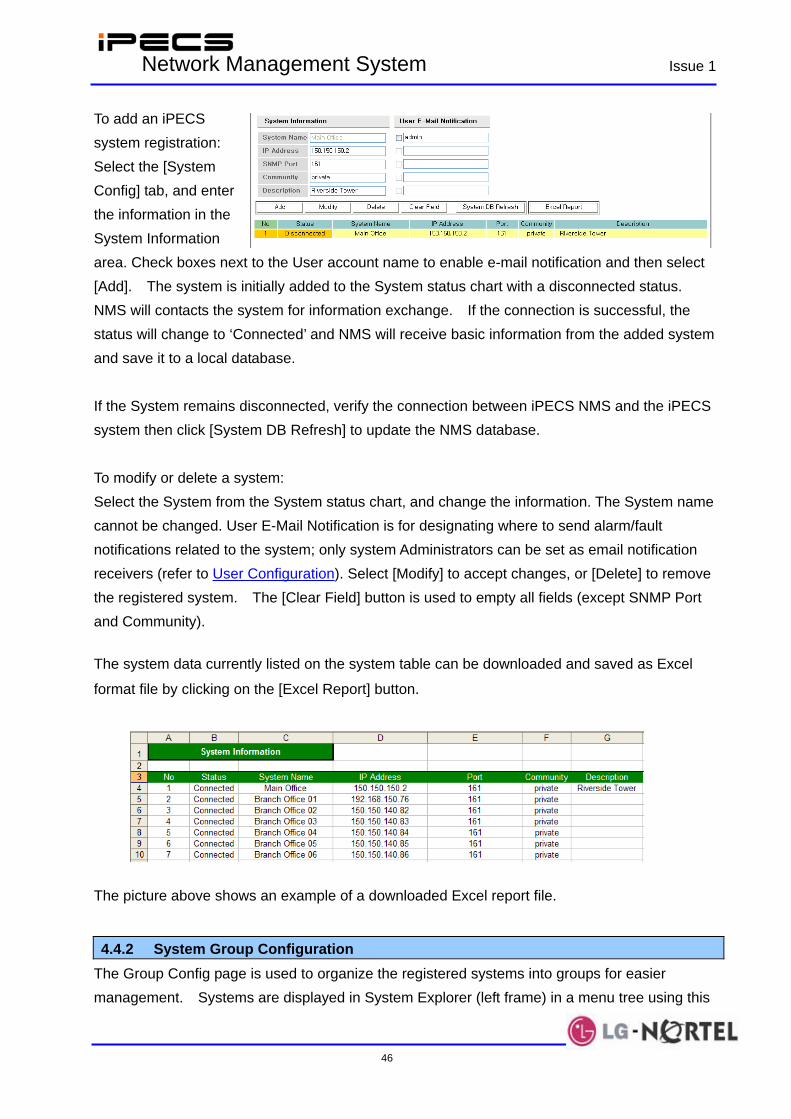
4.4.1 System Configuration
Registration of iPECS systems to iPECS-NMS is managed in the System Config page. Systems can be added or deleted, and information on a registered system modified. For each system, alarm/fault e-mail notification is assigned to User accounts. The User account must be assigned to manage the specific system and receive e-mail notifications (refer to Section 4.3). Information required for each registered system includes a unique system name (4-16 characters, with no special characters), System IP address, SNMP Port number (default=161, but may be changed), Community (4-16 characters, not special characters) and a Description field (63 characters).
The Community field is a 4 to 16 character value (no special characters) that defines the SNMP Read-Write community between the system and NMS, and must match the Read-Write Community SNMP Attribute (PGM 196), designated in the iPECS system database. This string is used for sending ‘read-write’ messages between the system and NMS. The lower portion of the screen displays the System Status chart which includes a list of all registered systems, status, SNMP community, etc for each system. Prior to adding a system registration with iPECS NMS, the system should be enabled for monitoring and management by NMS, refer to Appendix 1 for details on iPECS system set-up.
IPECS Network Management System Issue 1
46
To add an iPECS system registration: Select the [System Config] tab, and enter the information in the System Information area. Check boxes next to the User account name to enable e-mail notification and then select [Add]. The system is initially added to the System status chart with a disconnected status. NMS will contacts the system for information exchange. If the connection is successful, the status will change to ‘Connected’ and NMS will receive basic information from the added system and save it to a local database. If the System remains disconnected, verify the connection between iPECS NMS and the iPECS system then click [System DB Refresh] to update the NMS database. To modify or delete a system: Select the System from the System status chart, and change the information. The System name cannot be changed. User E-Mail Notification is for designating where to send alarm/fault notifications related to the system; only system Administrators can be set as email notification receivers (refer to User Configuration). Select [Modify] to accept changes, or [Delete] to remove the registered system. The [Clear Field] button is used to empty all fields (except SNMP Port and Community). The system data currently listed on the system table can be downloaded and saved as Excel
format file by clicking on the [Excel Report] button.
The picture above shows an example of a downloaded Excel report file.
4.4.2 System Group Configuration
The Group Config page is used to organize the registered systems into groups for easier management. Systems are displayed in System Explorer (left frame) in a menu tree using this
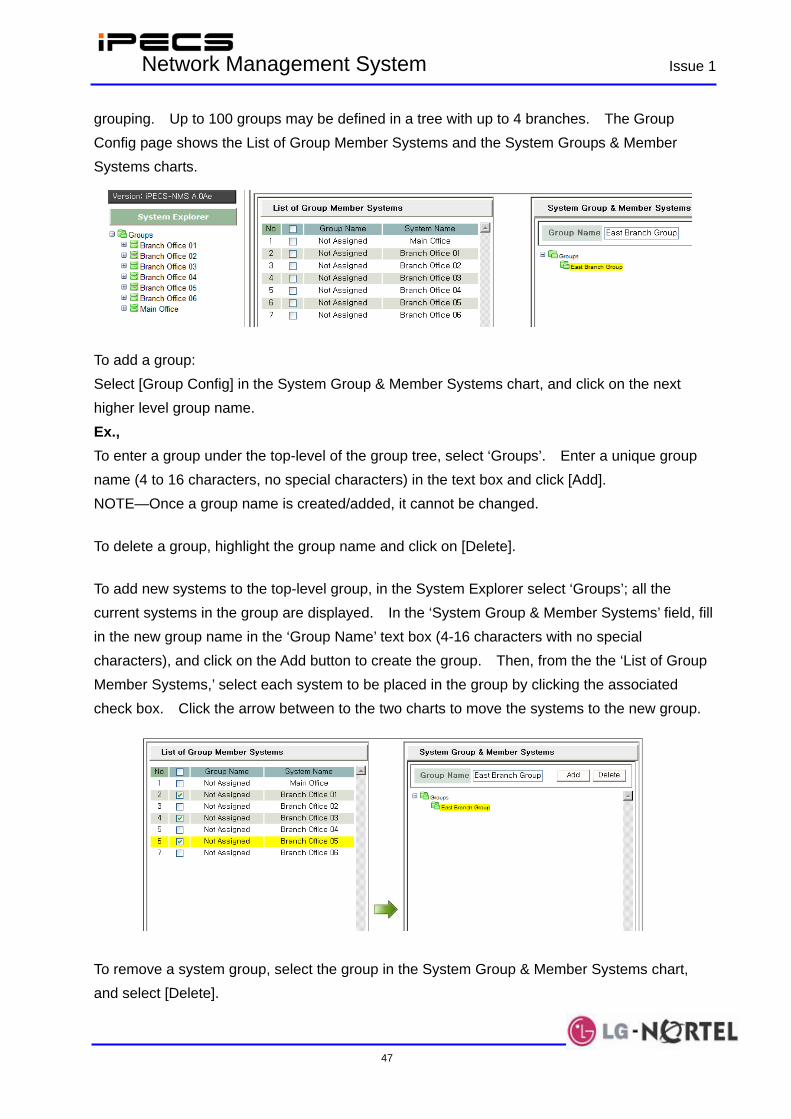
IPECS Network Management System Issue 1
47
grouping. Up to 100 groups may be defined in a tree with up to 4 branches. The Group Config page shows the List of Group Member Systems and the System Groups & Member Systems charts.
To add a group: Select [Group Config] in the System Group & Member Systems chart, and click on the next higher level group name. Ex., To enter a group under the top-level of the group tree, select ‘Groups’. Enter a unique group name (4 to 16 characters, no special characters) in the text box and click [Add]. NOTE—Once a group name is created/added, it cannot be changed. To delete a group, highlight the group name and click on [Delete]. To add new systems to the top-level group, in the System Explorer select ‘Groups’; all the current systems in the group are displayed. In the ‘System Group & Member Systems’ field, fill in the new group name in the ‘Group Name’ text box (4-16 characters with no special characters), and click on the Add button to create the group. Then, from the the ‘List of Group Member Systems,’ select each system to be placed in the group by clicking the associated check box. Click the arrow between to the two charts to move the systems to the new group.
To remove a system group, select the group in the System Group & Member Systems chart, and select [Delete].
IPECS Network Management System Issue 1
48
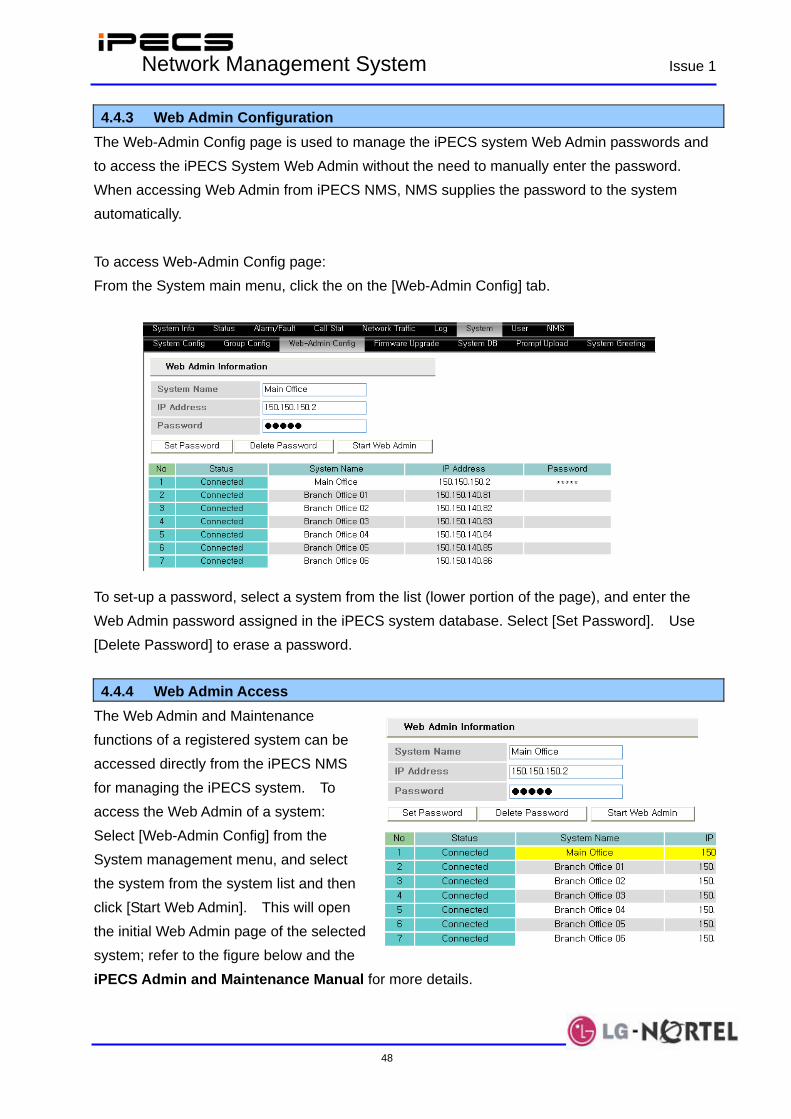
4.4.3 Web Admin Configuration The Web-Admin Config page is used to manage the iPECS system Web Admin passwords and to access the iPECS System Web Admin without the need to manually enter the password. When accessing Web Admin from iPECS NMS, NMS supplies the password to the system automatically. To access Web-Admin Config page: From the System main menu, click the on the [Web-Admin Config] tab. To set-up a password, select a system from the list (lower portion of the page), and enter the Web Admin password assigned in the iPECS system database. Select [Set Password]. Use [Delete Password] to erase a password. 4.4.4 Web Admin Access
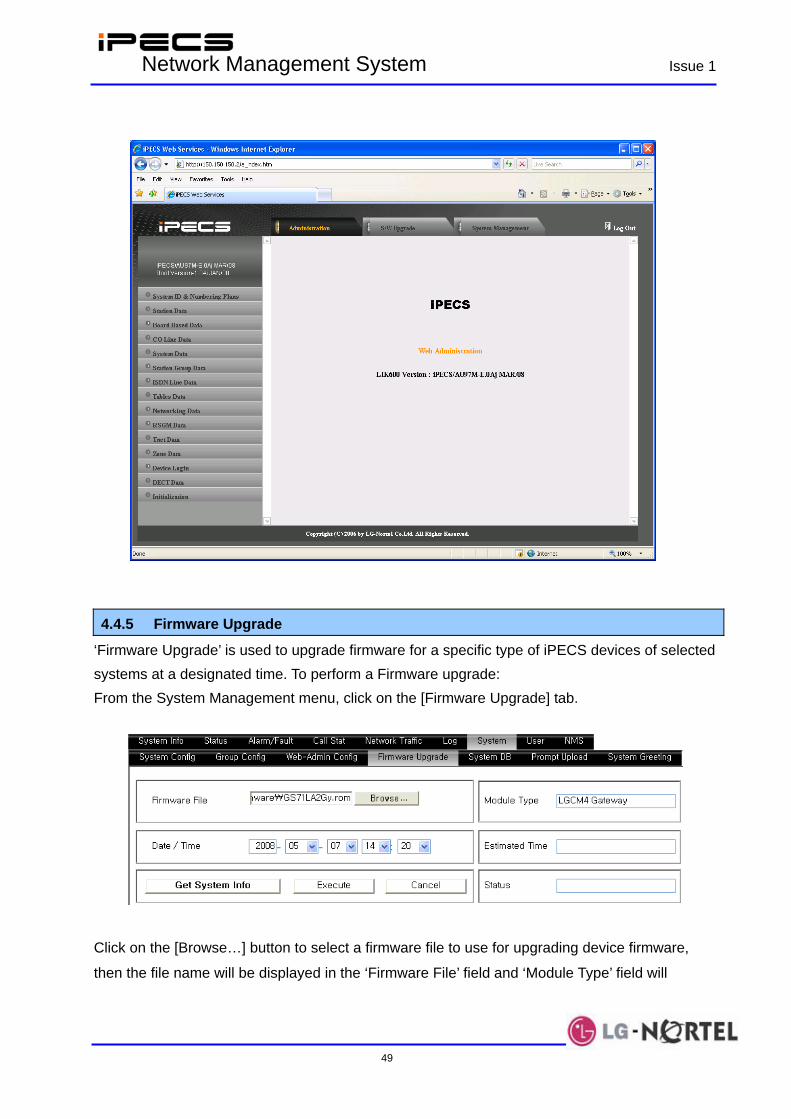
The Web Admin and Maintenance functions of a registered system can be accessed directly from the iPECS NMS for managing the iPECS system. To access the Web Admin of a system: Select [Web-Admin Config] from the System management menu, and select the system from the system list and then click [Start Web Admin]. This will open the initial Web Admin page of the selected system; refer to the figure below and the iPECS Admin and Maintenance Manual for more details.
IPECS Network Management System Issue 1
49
4.4.5 Firmware Upgrade
‘Firmware Upgrade’ is used to upgrade firmware for a specific type of iPECS devices of selected systems at a designated time. To perform a Firmware upgrade: From the System Management menu, click on the [Firmware Upgrade] tab.
Click on the [Browse…] button to select a firmware file to use for upgrading device firmware,
then the file name will be displayed in the ‘Firmware File’ field and ‘Module Type’ field will
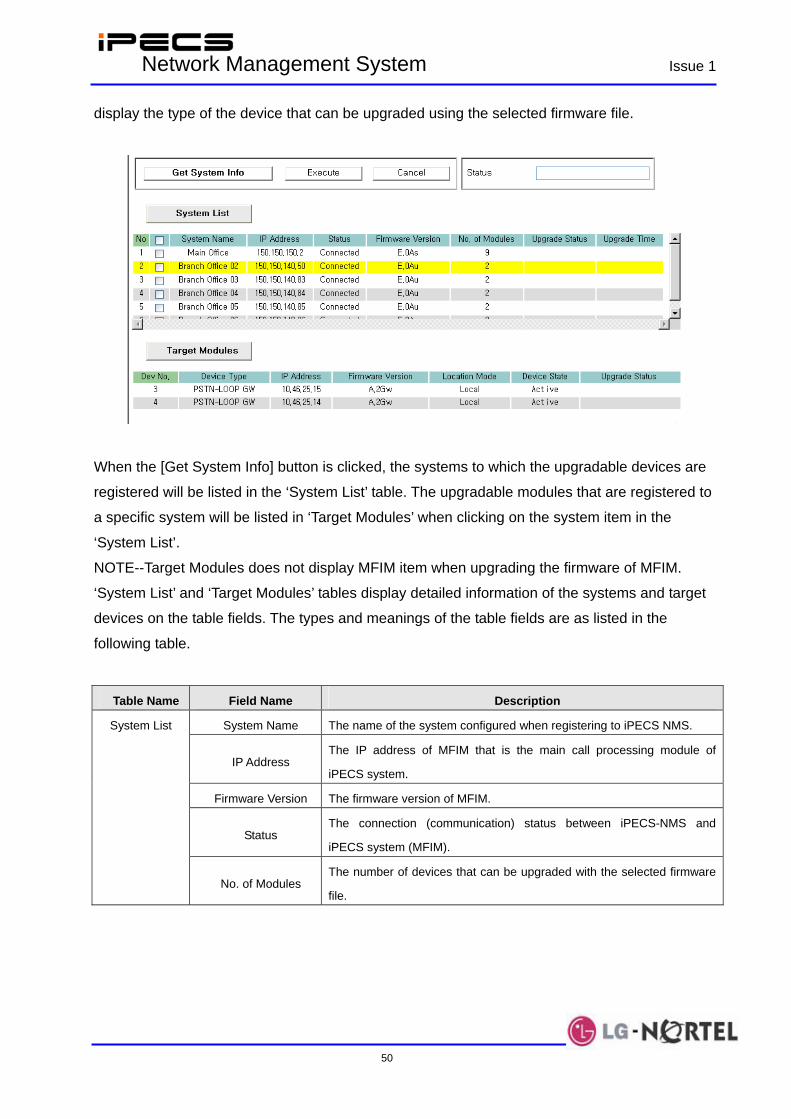
IPECS Network Management System Issue 1
50
display the type of the device that can be upgraded using the selected firmware file.
When the [Get System Info] button is clicked, the systems to which the upgradable devices are
registered will be listed in the ‘System List’ table. The upgradable modules that are registered to
a specific system will be listed in ‘Target Modules’ when clicking on the system item in the
‘System List’.
NOTE--Target Modules does not display MFIM item when upgrading the firmware of MFIM.
‘System List’ and ‘Target Modules’ tables display detailed information of the systems and target
devices on the table fields. The types and meanings of the table fields are as listed in the
following table.
Table Name Field Name Description
System Name The name of the system configured when registering to iPECS NMS.
IP Address The IP address of MFIM that is the main call processing module of
iPECS system.
Firmware Version The firmware version of MFIM.
Status The connection (communication) status between iPECS-NMS and
iPECS system (MFIM).
System List
No. of Modules The number of devices that can be upgraded with the selected firmware
file.

IPECS Network Management System Issue 1
51
Table Name Field Name Description
Upgrade Status
Upgrade Status shows the process status of firmware upgrade of the
system, and includes the status values of ‘Connecting FTP’, ‘Transferring
by FTP’, ‘Transferring by HTTP’, ‘Upgrade MFIM’, ‘Upgrading Device’,
‘Finished’, and ‘Failed’.
In normal cases, the status will display ‘Connecting FTP’ when the
firmware upgrade is started, and the FTP connection is made between
NMS server and MFIM. After the FTP connection is established, the
status changes to ‘Transferring by FTP’ and the firmware file is
transferred from NMS server to MFIM. After the file transfer is completed,
the status becomes ‘Upgrading MFIM’ or ‘Upgrading Device’ and
performs the firmware upgrade for MFIM or target devices. When
firmware upgrade is finished, the displays as ‘Finished’ status.
NOTE-‘Transferring by HTTP’ status may be shown when firmware
upgrade is being performed by Web Admin.
Upgrade Time When the firmware upgrade for the system is finished.
Dev. No. (Device Number) is the device sequence number of the device on iPECS
Web Admin.; a unique number is assigned to each registered device.
Device Type The name of the device
IP Address The IP address of the device
Firmware Version The firmware (software) version of the device
Location Mode
Location of the device that was configured when the device was
registered on system (Local, Remote, Local-Remote, and Remote
RSGM).
Device Status Device Status shows the operation and registration status of the device
(Disconnect, Active, T-Net, Downloading, Out-of Service and N/A). Target Modules
Upgrade Status
Upgrade Status shows the process status of firmware upgrade of the
device (Ready, Started, Transferring, Transfer Completed, Success, and
Failed.
In normal cases, the status of all the target devices will display ‘Ready’
when the firmware upgrade for the system is started. After the firmware
upgrade is started for each device, the firmware file is transferred to the
device under ‘Transferring’ status. After the firmware transfer is
completed, the status changes to ‘Transfer Completed’, and then
becomes ‘Success’ when the firmware upgrade is finished.

IPECS Network Management System Issue 1
52
To select target systems to upgrade, click the check-box of each system. The ‘Estimated Time’ field will be updated and will show the estimated time for the overall firmware upgrade procedure on all the selected systems. Estimated time is calculated based on the number of systems and target devices, so it may be somewhat different from the actual upgrade time. Because a system can be configured for one firmware upgrade at a time, only the systems that are not already scheduled for other firmware upgrade can be selected in ‘System List’.
In order to schedule a firmware upgrade at a specific date and time, configure the target date and time for firmware upgrade in ‘Date/Time’ field, and then click on the [Execute] button. The firmware upgrade will be automatically started at the designated date and time for the selected systems. If the ‘Date/Time’ field is configured with the current date/time or a past date/time, the firmware upgrade will immediately start after clicking on the [Execute] button. If the [Cancel] button is clicked while the firmware upgrade is in process for multiple systems, the schedules for waiting systems can only be canceled, and the systems that are performing firmware upgrade at the moment proceed the firmware upgrade to the end and finish their upgrade procedure.
The ‘Status’ field shows the overall process status of the firmware upgrade for all the selected systems (Transferring to NMS, Scheduled, Upgrading, and Finished). ‘Transferring to NMS’ designates the status of the transferring firmware file from the NMS client browser to NMS server; this is performed immediately after clicking on the [Execute] button. After firmware file transfer to NMS server is completed, the ‘Status’ will change to ‘Scheduled’ if

IPECS Network Management System Issue 1
53
the ‘Date/Time’ field is configured with future date and time, or will change to ‘Upgrading’ if the firmware upgrade is started after the current time has exceeded the date and time configured in the ‘Date/Time’ field. When the firmware upgrade for all selected systems is finished, the ‘Status’ field will display ‘Finished’ to show that the overall firmware upgrade procedure is finished.
4.4.6 System DB Management
‘System DB Management’ provides the means to upload or download system a DB file to/from the iPECS system, and also periodically backup the system database to the NMS server. The pages for these features can be located by clicking on the [System DB] tab menu under ‘System Management’.
4.4.6.1 System DB Upload
‘System DB Upload’ function is for uploading a system DB file stored in the NMS client PC or in the NMS server to selected iPECS systems. The page for this function can be opened by clicking on the [Upload] button on top of the ‘System DB Management’ screen.
In order to upload a system DB file stored in the NMS User PC to the iPECS system, the system
DB file should be selected first. Click on the [Browse…] button to select the system DB file, then
the selected file name is displayed in the ‘DB File’ field. The appended string ‘(Local)’ means
that the file is selected from the NMS user’s PC. The ‘DB Type’ field displays the DB type of the
selected system DB file.
After a system DB file is selected, the check-boxes of the systems that can be uploaded with the
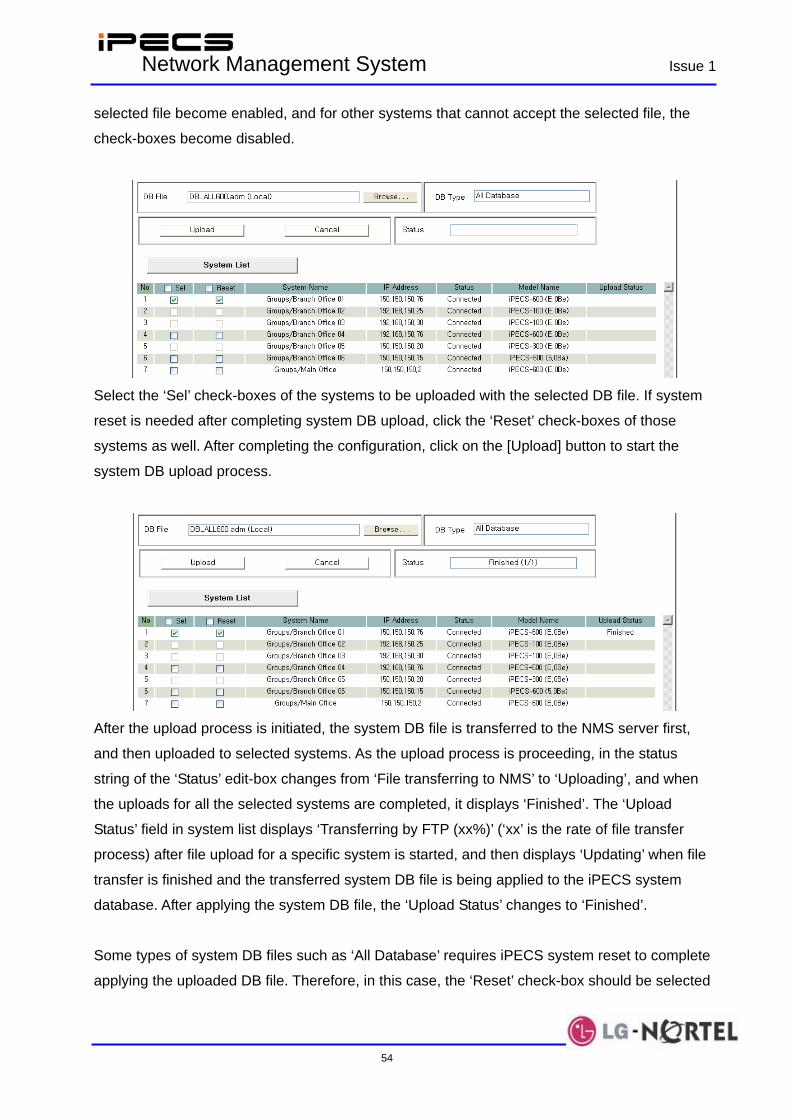
IPECS Network Management System Issue 1
54
selected file become enabled, and for other systems that cannot accept the selected file, the
check-boxes become disabled.
Select the ‘Sel’ check-boxes of the systems to be uploaded with the selected DB file. If system
reset is needed after completing system DB upload, click the ‘Reset’ check-boxes of those
systems as well. After completing the configuration, click on the [Upload] button to start the
system DB upload process.
After the upload process is initiated, the system DB file is transferred to the NMS server first,
and then uploaded to selected systems. As the upload process is proceeding, in the status
string of the ‘Status’ edit-box changes from ‘File transferring to NMS’ to ‘Uploading’, and when
the uploads for all the selected systems are completed, it displays ‘Finished’. The ‘Upload
Status’ field in system list displays ‘Transferring by FTP (xx%)’ (‘xx’ is the rate of file transfer
process) after file upload for a specific system is started, and then displays ‘Updating’ when file
transfer is finished and the transferred system DB file is being applied to the iPECS system
database. After applying the system DB file, the ‘Upload Status’ changes to ‘Finished’.
Some types of system DB files such as ‘All Database’ requires iPECS system reset to complete
applying the uploaded DB file. Therefore, in this case, the ‘Reset’ check-box should be selected
IPECS Network Management System Issue 1
55
so that the iPECS system can be automatically restarted after uploading and applying the
system DB file.
In the case that ‘All Database’ files are backed-up in NMS server using the ‘Scheduled Backup’
feature, a system DB backup file can be uploaded to the iPECS system. Before performing this,
select a system that has been configured to use ‘Scheduled Backup’ from the system list to
check if the system DB file to be uploaded has been backed-up in the NMS server.
When a system DB file is selected for uploading in the ‘System DB in NMS Server’, the selected
IPECS Network Management System Issue 1
56
file name is displayed in ‘DB File’ field. The appended string ‘(NMS Server)’ means that the file
is selected from the backup files stored in NMS server. After DB file is selected, select the ‘Sel’
check-boxes of the systems to be uploaded with the selected DB file. If system reset is needed
after completing system DB upload, selected ‘Reset’ check-boxes of those systems as well.
After finishing all the configurations, click on the [Upload] button to start the system DB upload
process.
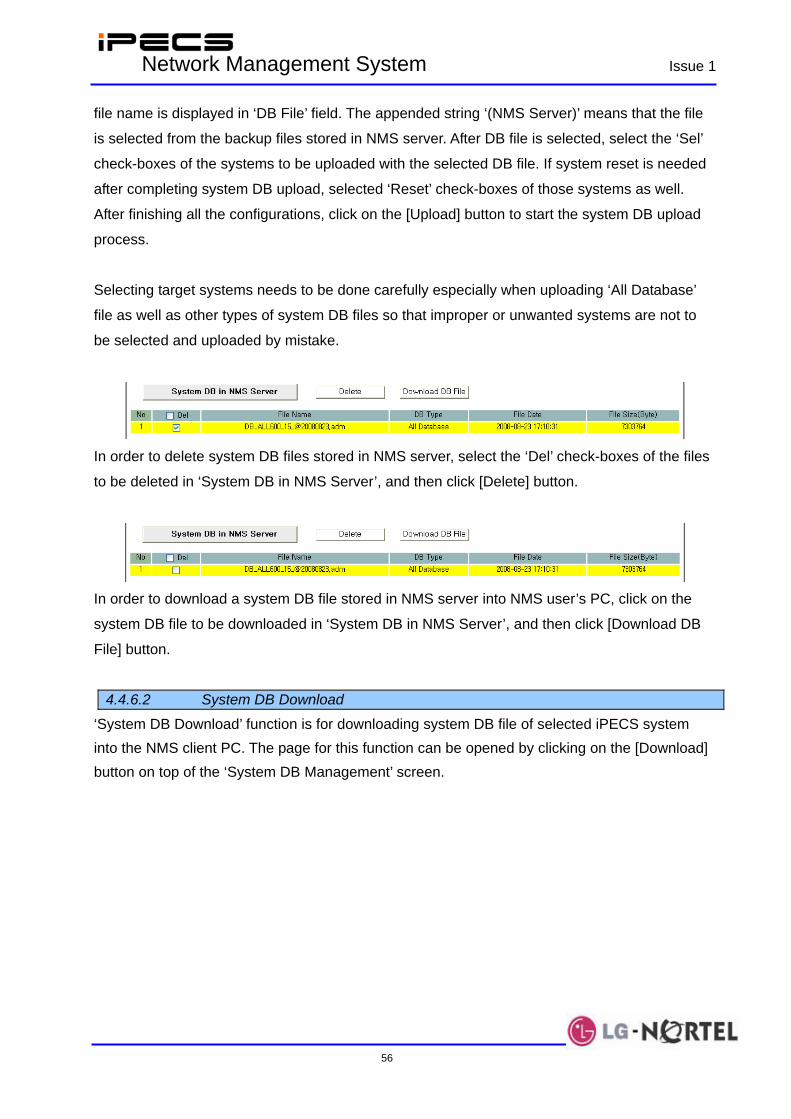
Selecting target systems needs to be done carefully especially when uploading ‘All Database’
file as well as other types of system DB files so that improper or unwanted systems are not to
be selected and uploaded by mistake.
In order to delete system DB files stored in NMS server, select the ‘Del’ check-boxes of the files
to be deleted in ‘System DB in NMS Server’, and then click [Delete] button.
In order to download a system DB file stored in NMS server into NMS user’s PC, click on the
system DB file to be downloaded in ‘System DB in NMS Server’, and then click [Download DB
File] button.
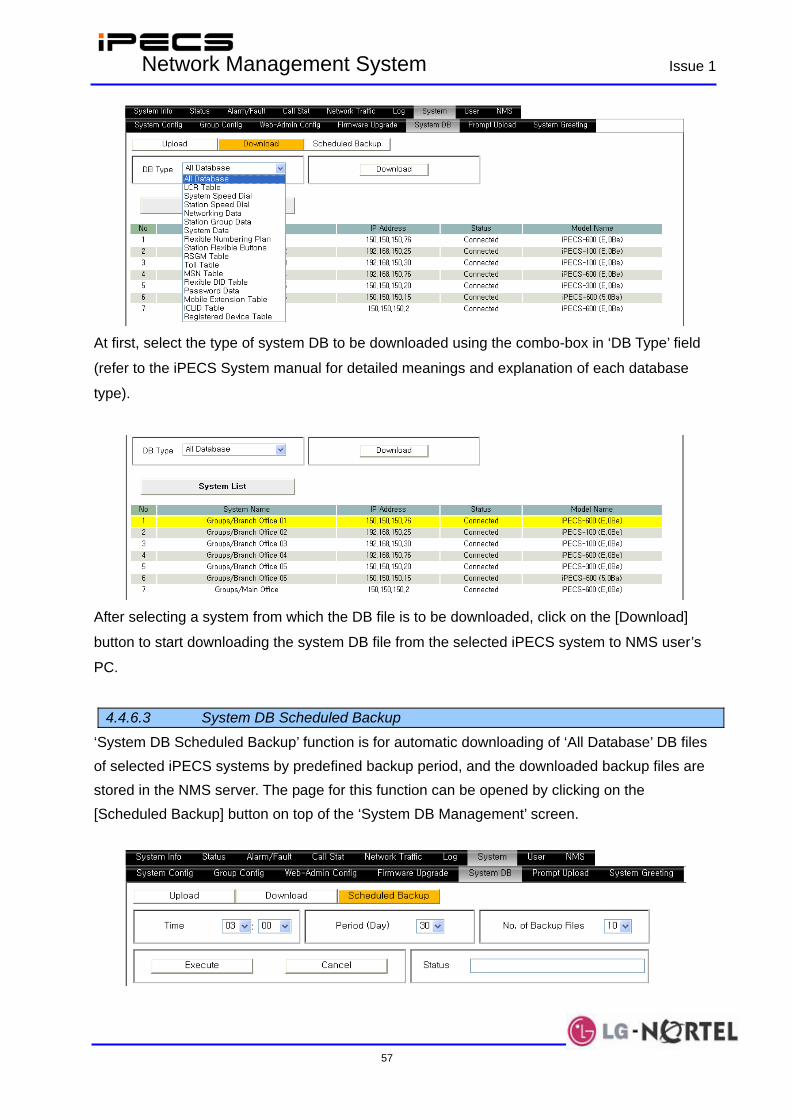
4.4.6.2 System DB Download
‘System DB Download’ function is for downloading system DB file of selected iPECS system into the NMS client PC. The page for this function can be opened by clicking on the [Download] button on top of the ‘System DB Management’ screen.
IPECS Network Management System Issue 1
57
At first, select the type of system DB to be downloaded using the combo-box in ‘DB Type’ field
(refer to the iPECS System manual for detailed meanings and explanation of each database
type).
After selecting a system from which the DB file is to be downloaded, click on the [Download]
button to start downloading the system DB file from the selected iPECS system to NMS user’s
PC.
4.4.6.3 System DB Scheduled Backup
‘System DB Scheduled Backup’ function is for automatic downloading of ‘All Database’ DB files of selected iPECS systems by predefined backup period, and the downloaded backup files are stored in the NMS server. The page for this function can be opened by clicking on the [Scheduled Backup] button on top of the ‘System DB Management’ screen.
IPECS Network Management System Issue 1
58
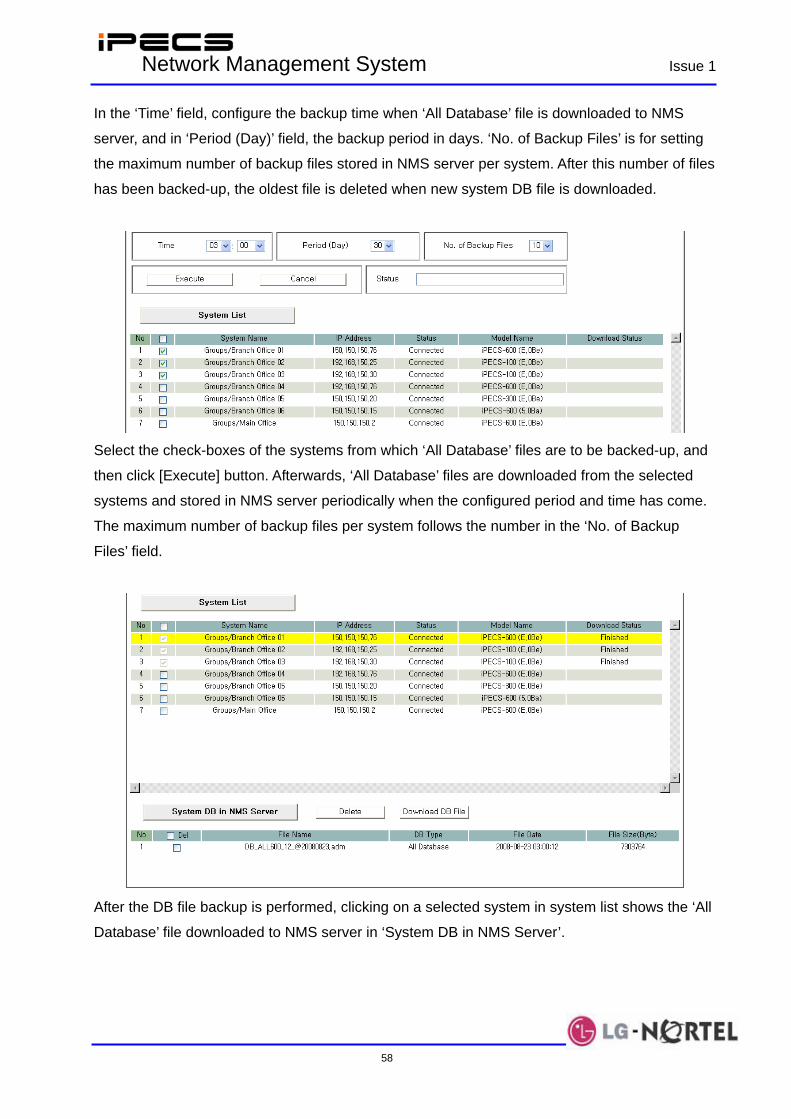
In the ‘Time’ field, configure the backup time when ‘All Database’ file is downloaded to NMS
server, and in ‘Period (Day)’ field, the backup period in days. ‘No. of Backup Files’ is for setting
the maximum number of backup files stored in NMS server per system. After this number of files
has been backed-up, the oldest file is deleted when new system DB file is downloaded.
Select the check-boxes of the systems from which ‘All Database’ files are to be backed-up, and
then click [Execute] button. Afterwards, ‘All Database’ files are downloaded from the selected
systems and stored in NMS server periodically when the configured period and time has come.
The maximum number of backup files per system follows the number in the ‘No. of Backup
Files’ field.
After the DB file backup is performed, clicking on a selected system in system list shows the ‘All
Database’ file downloaded to NMS server in ‘System DB in NMS Server’.
IPECS Network Management System Issue 1
59
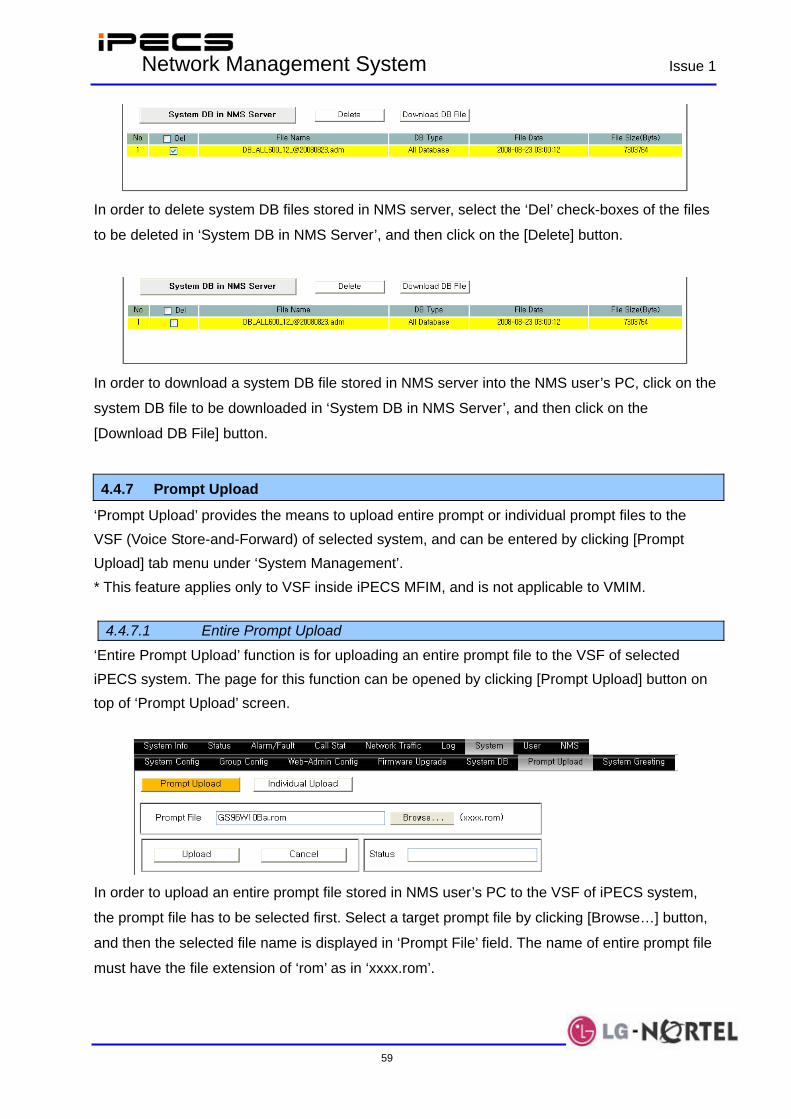
In order to delete system DB files stored in NMS server, select the ‘Del’ check-boxes of the files
to be deleted in ‘System DB in NMS Server’, and then click on the [Delete] button.
In order to download a system DB file stored in NMS server into the NMS user’s PC, click on the
system DB file to be downloaded in ‘System DB in NMS Server’, and then click on the
[Download DB File] button.
4.4.7 Prompt Upload
‘Prompt Upload’ provides the means to upload entire prompt or individual prompt files to the VSF (Voice Store-and-Forward) of selected system, and can be entered by clicking [Prompt Upload] tab menu under ‘System Management’. * This feature applies only to VSF inside iPECS MFIM, and is not applicable to VMIM.
4.4.7.1 Entire Prompt Upload
‘Entire Prompt Upload’ function is for uploading an entire prompt file to the VSF of selected iPECS system. The page for this function can be opened by clicking [Prompt Upload] button on top of ‘Prompt Upload’ screen.
In order to upload an entire prompt file stored in NMS user’s PC to the VSF of iPECS system,
the prompt file has to be selected first. Select a target prompt file by clicking [Browse…] button,
and then the selected file name is displayed in ‘Prompt File’ field. The name of entire prompt file
must have the file extension of ‘rom’ as in ‘xxxx.rom’.
IPECS Network Management System Issue 1
60
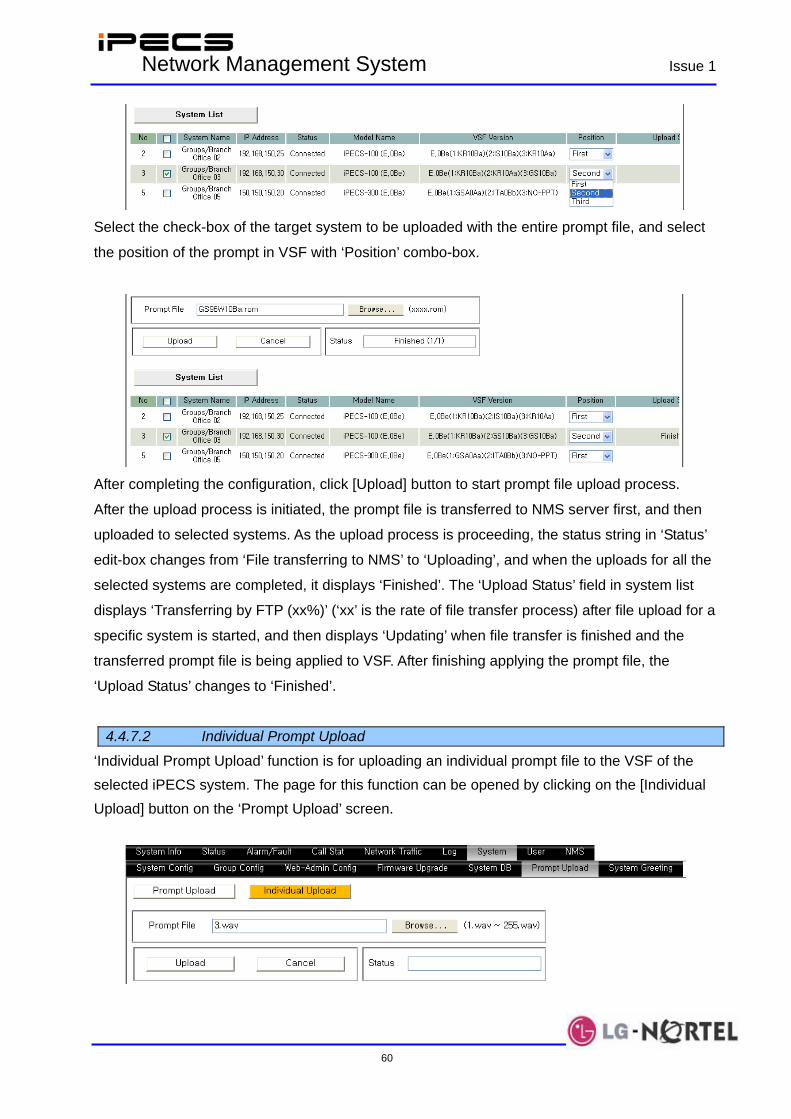
Select the check-box of the target system to be uploaded with the entire prompt file, and select
the position of the prompt in VSF with ‘Position’ combo-box.
After completing the configuration, click [Upload] button to start prompt file upload process.
After the upload process is initiated, the prompt file is transferred to NMS server first, and then
uploaded to selected systems. As the upload process is proceeding, the status string in ‘Status’
edit-box changes from ‘File transferring to NMS’ to ‘Uploading’, and when the uploads for all the
selected systems are completed, it displays ‘Finished’. The ‘Upload Status’ field in system list
displays ‘Transferring by FTP (xx%)’ (‘xx’ is the rate of file transfer process) after file upload for a
specific system is started, and then displays ‘Updating’ when file transfer is finished and the
transferred prompt file is being applied to VSF. After finishing applying the prompt file, the
‘Upload Status’ changes to ‘Finished’.
4.4.7.2 Individual Prompt Upload
‘Individual Prompt Upload’ function is for uploading an individual prompt file to the VSF of the selected iPECS system. The page for this function can be opened by clicking on the [Individual Upload] button on the ‘Prompt Upload’ screen.

IPECS Network Management System Issue 1
61
In order to upload an individual prompt file stored in the NMS user’s PC to the VSF of the
iPECS system, the prompt file has to be selected first. Select a target prompt file by clicking on
the [Browse…] button; the selected file name is displayed in ‘Prompt File’ field. The individual
prompt file must have the ‘wav’ file extension (ex., xxx.wav). Here, ‘xxx’ is the prompt number of
the file, and can have the value of 1 ~255. In addition to the ‘wav’ file format, the file should be
encoded with G.711 µ-Law (or CCITT µ-Law) at 8kHz sampling rate.
Select the check-box of the target system where the individual prompt file will be uploaded, and
select the position of the prompt in VSF with the ‘Position’ combo-box.
After completing the configuration, click on the [Upload] button to start the prompt file upload
process.
The ‘Status’ and ‘Upload Status’ fields of the system list will update as the file upload progresses,
until Finished appears in the Upload Status field.
4.4.8 System Greeting Management
‘System Greeting Management’ provides the means to upload/download all or individual system greeting files to/from the VSF (Voice Store-and-Forward) of selected system, and can be entered by clicking on the [System Greeting] tab menu under ‘System Management.’ NOTE – This feature applies only to VSF inside iPECS MFIM, and is not applicable to VMIM.
4.4.8.1 Entire System Greeting Management
‘Entire System Greeting Management’ function is for uploading/downloading entire system greeting file to/from the VSF of selected iPECS system. The page for this function can be

IPECS Network Management System Issue 1
62
opened by clicking on the [System Greeting] button (shown below).
In order to upload an entire system greeting file stored in NMS user’s PC to the VSF of the
iPECS system, the system greeting file has to be selected first. Select a target system greeting
file by clicking on the [Browse…] button, and then the selected file name is displayed in the
‘System Greeting File’ field. The system greeting file must have the ’rom’ file extension (ex.,
‘SGTYPEx.rom’). Here, ‘x’ is the position of the system greeting in VSF, and can have the value
of 1~3. However, this position value does not have meaning when executing the upload process.
Select the check-box of the target system to be uploaded with the entire system greeting file,
and select the position of the system greeting in VSF using the ‘Position’ combo-box.
After completing the configuration, click on the [Upload] button to start the system greeting
upload process.
After the upload process is initiated, the system greeting file is transferred to the NMS server
first, and then uploaded to selected systems. As the upload process is proceeding, the status
string in the ‘Status’ edit-box changes from ‘File transferring to NMS’ to ‘Uploading’, and when
the uploads for all the selected systems are completed, it displays ‘Finished’. The ‘Upload
Status’ field in the system list displays ‘Transferring by FTP (xx%)’ (‘xx’ is the rate of file transfer
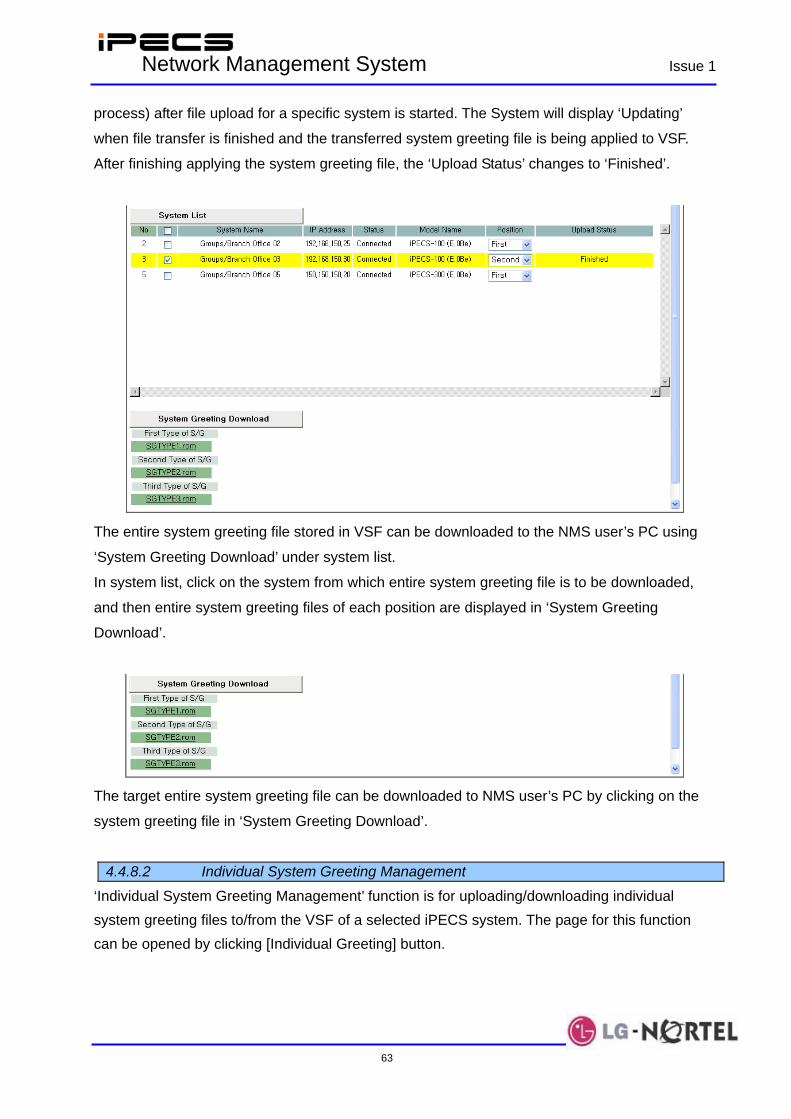
IPECS Network Management System Issue 1
63
process) after file upload for a specific system is started. The System will display ‘Updating’
when file transfer is finished and the transferred system greeting file is being applied to VSF.
After finishing applying the system greeting file, the ‘Upload Status’ changes to ‘Finished’.
The entire system greeting file stored in VSF can be downloaded to the NMS user’s PC using
‘System Greeting Download’ under system list.
In system list, click on the system from which entire system greeting file is to be downloaded,
and then entire system greeting files of each position are displayed in ‘System Greeting
Download’.
The target entire system greeting file can be downloaded to NMS user’s PC by clicking on the
system greeting file in ‘System Greeting Download’.
4.4.8.2 Individual System Greeting Management
‘Individual System Greeting Management’ function is for uploading/downloading individual system greeting files to/from the VSF of a selected iPECS system. The page for this function can be opened by clicking [Individual Greeting] button.

IPECS Network Management System Issue 1
64
In order to upload an individual system greeting file stored in the NMS user’s PC to the VSF of
the iPECS system, the system greeting file has to be selected first. Select a target system
greeting file by clicking on the [Browse…] button, and then the selected file name is displayed in
the ‘System Greeting File’ field. The name of individual system greeting file must have the ‘wav’
file extension (Ex., ‘yy.rom’ or ‘x_yy.wav). Here, ‘x’ is the position of the system greeting in VSF,
and can have the value of 1~3. However, this position value does not have meaning when
executing the upload process. ‘yy’ is the individual system greeting number, and can have the
value of 1~72. In addition, the file should be encoded with G.711 µ-Law (or CCITT µ-Law) at
8kHz sampling rate.
Click-on the check-box of the target system to be uploaded with the individual system greeting
file, and select the position of the system greeting in VSF using the ‘Position’ combo-box.
After completing the configuration, click on the [Upload] button to start the system greeting
upload process.
The ‘Status’ and ‘Upload Status’ fields of the system list will update as the file upload progresses,
until Finished appears in the Upload Status field.
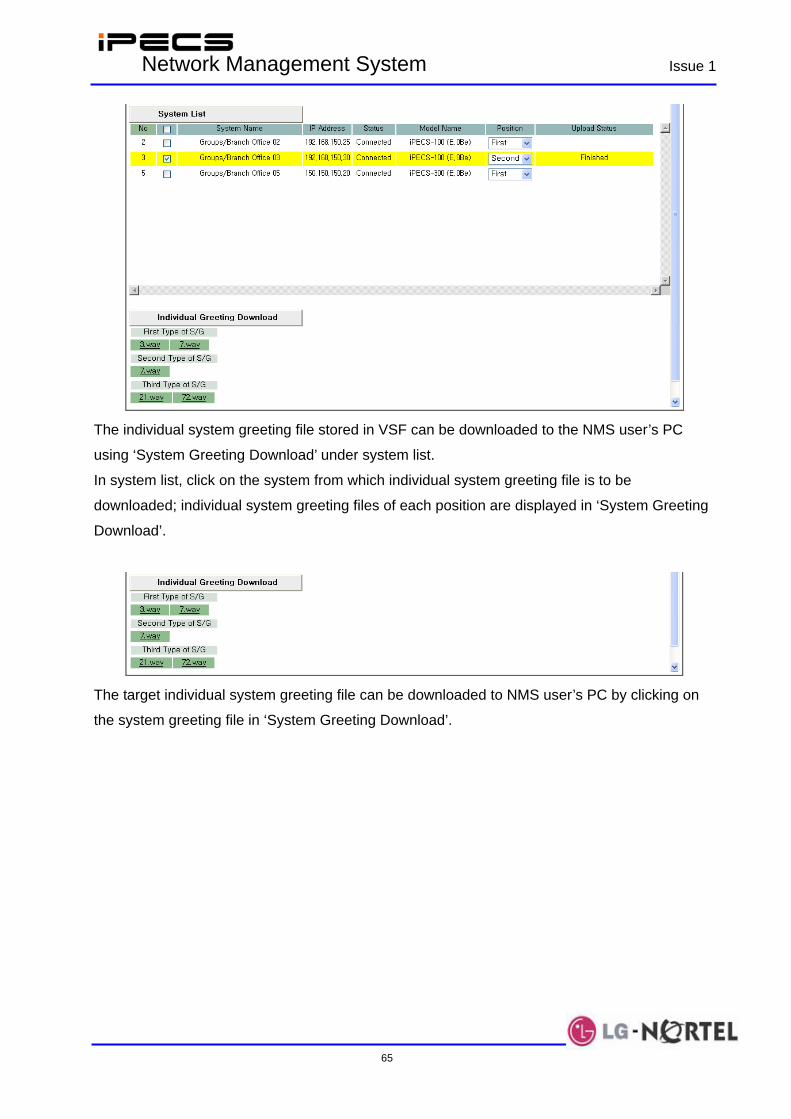
IPECS Network Management System Issue 1
65
The individual system greeting file stored in VSF can be downloaded to the NMS user’s PC
using ‘System Greeting Download’ under system list.
In system list, click on the system from which individual system greeting file is to be
downloaded; individual system greeting files of each position are displayed in ‘System Greeting
Download’.
The target individual system greeting file can be downloaded to NMS user’s PC by clicking on
the system greeting file in ‘System Greeting Download’.

IPECS Network Management System Issue 1
66
5. Reviewing System Info and Status 5.1 System Info Screen The System Information page gives basic information on the system selected in System Explorer, including Attendant, CO Group, and Station Group information. It also provides device inventory information that shows a summary of System capacity and component devices. To access the System Info screen: From the NMS menu, click on the System Info tab. 5.1.1 Using System Explorer
The System Explorer (left-hand frame of main screen) displays each system and system group configured in iPECS NMS in a menu tree structure. Each system in the tree can be expanded to display basic configuration (CO lines, stations and etc. or other devices). An iPECS system or device (CO, Station, etc.) is selected from System Explorer for the page view.
To access System Info for a system, highlight the system in System Explorer, then click the [System Info] on the NMS menu. 5.1.2 System Information View
The System Information view displays the basic network configuration of the selected system. Information displayed is derived from the iPECS system database. For details on each of the items listed, refer to the iPECS Admin and Maintenance Manual.
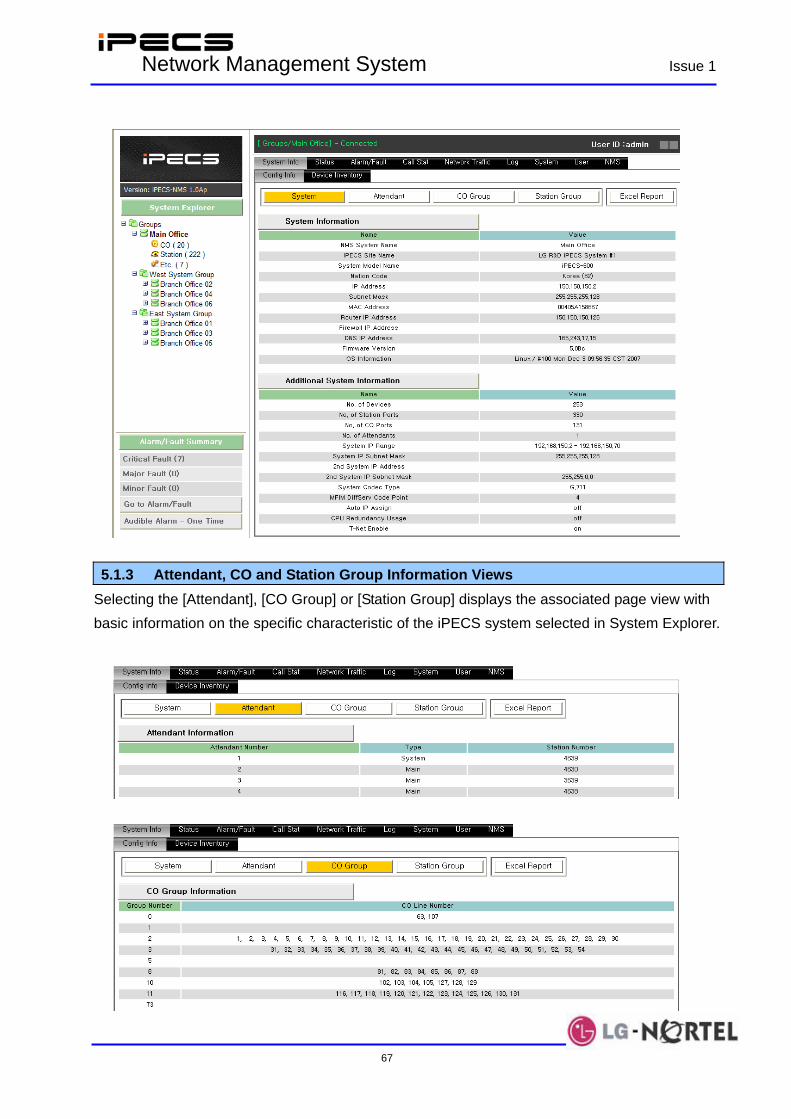
IPECS Network Management System Issue 1
67
5.1.3 Attendant, CO and Station Group Information Views
Selecting the [Attendant], [CO Group] or [Station Group] displays the associated page view with basic information on the specific characteristic of the iPECS system selected in System Explorer.
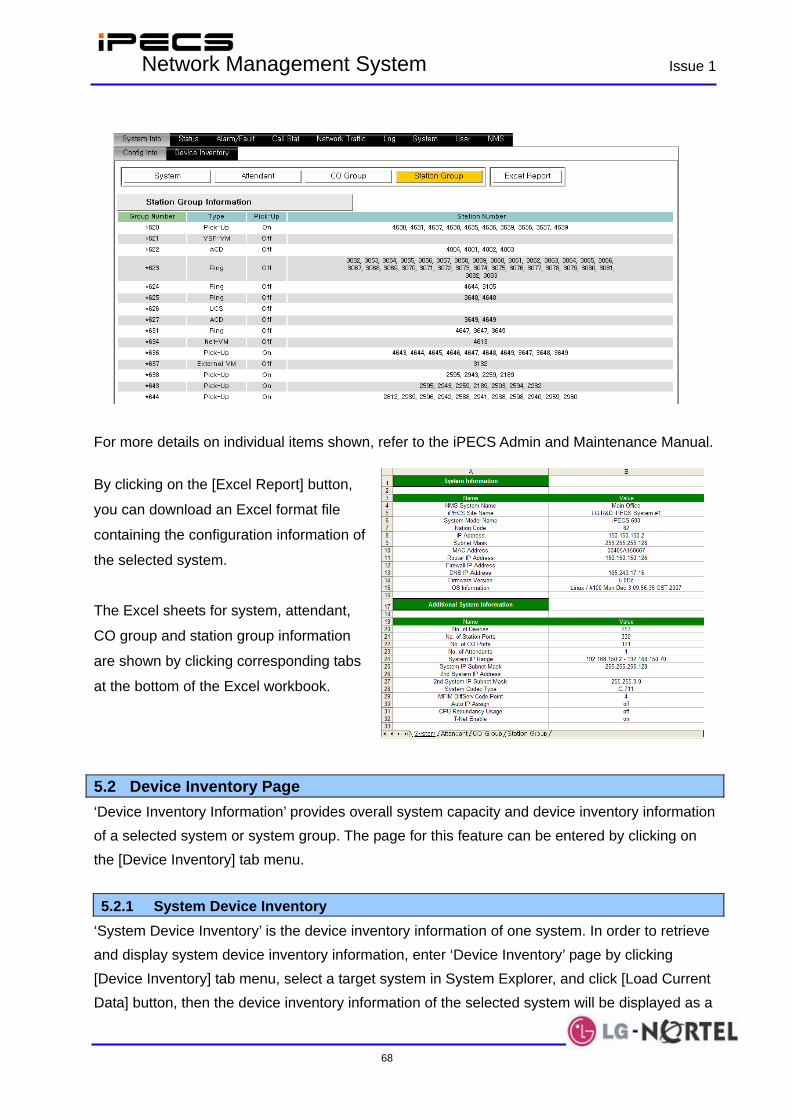
IPECS Network Management System Issue 1
68
For more details on individual items shown, refer to the iPECS Admin and Maintenance Manual. By clicking on the [Excel Report] button,
you can download an Excel format file
containing the configuration information of
the selected system.
The Excel sheets for system, attendant,
CO group and station group information
are shown by clicking corresponding tabs
at the bottom of the Excel workbook.
5.2 Device Inventory Page ‘Device Inventory Information’ provides overall system capacity and device inventory information of a selected system or system group. The page for this feature can be entered by clicking on the [Device Inventory] tab menu. 5.2.1 System Device Inventory
‘System Device Inventory’ is the device inventory information of one system. In order to retrieve and display system device inventory information, enter ‘Device Inventory’ page by clicking [Device Inventory] tab menu, select a target system in System Explorer, and click [Load Current Data] button, then the device inventory information of the selected system will be displayed as a

IPECS Network Management System Issue 1
69
list of table fields.
‘System Information’ table shows the system name, address, and firmware version information, and ‘System Capacity’ table shows the number of devices and channels (ports) of the selected system. ‘Device Information’ shows the list of devices of the system and the number of modules of the corresponding device type.
By clicking [Excel Report] button, Excel
format file for the device inventory
information of the selected system can be
downloaded.
5.2.2 System Group Device Inventory
‘System Group Device Inventory’ is the device inventory information of a system group and its sub-groups. In order to retrieve and display system group device inventory information, select
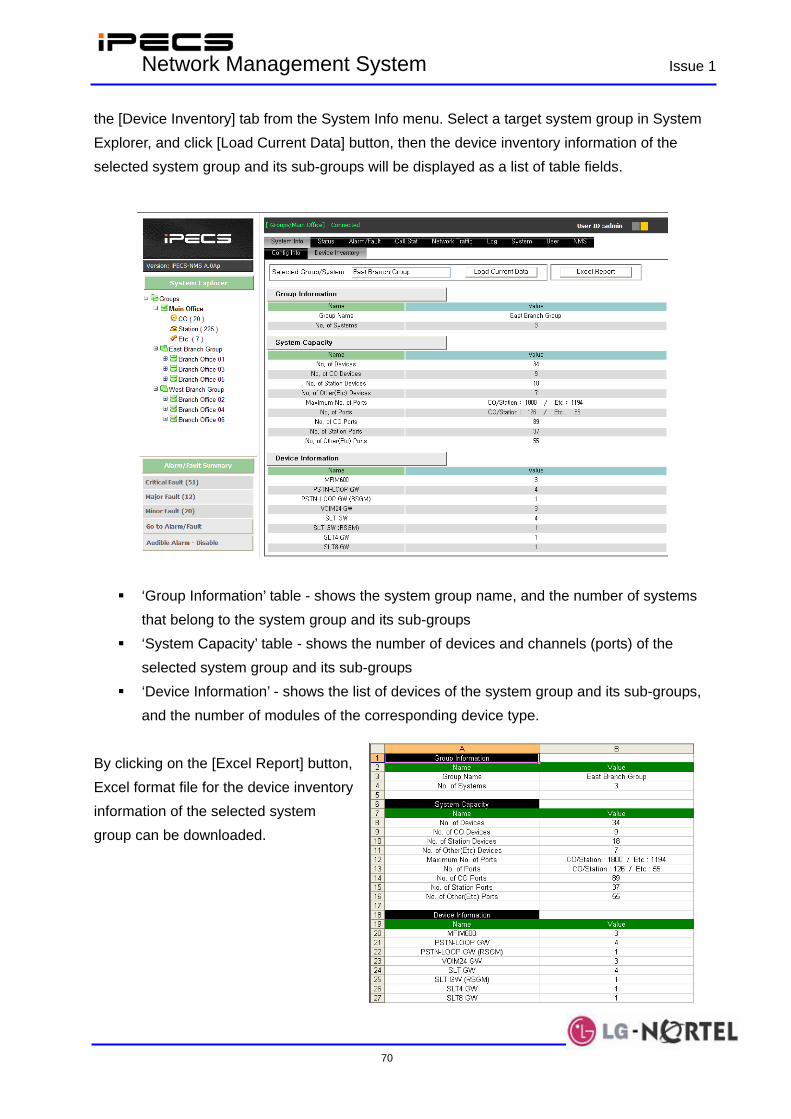
IPECS Network Management System Issue 1
70
the [Device Inventory] tab from the System Info menu. Select a target system group in System Explorer, and click [Load Current Data] button, then the device inventory information of the selected system group and its sub-groups will be displayed as a list of table fields.
‘Group Information’ table - shows the system group name, and the number of systems
that belong to the system group and its sub-groups ‘System Capacity’ table - shows the number of devices and channels (ports) of the
selected system group and its sub-groups ‘Device Information’ - shows the list of devices of the system group and its sub-groups,
and the number of modules of the corresponding device type. By clicking on the [Excel Report] button, Excel format file for the device inventory information of the selected system group can be downloaded.

IPECS Network Management System Issue 1
71
5.3 Status Page The Status pages view real-time information on the state of devices and channels registered to the iPECS system device (CO, Station, Etc.) highlighted in System Explorer. On the page are the Device Base Status, CO channel Status and Station Channel Status view controls, selecting the control displays the desired view.
To view a Status page, select a system and device type in System Explorer, select Status from the NMS menu bar, then select the desired status view. Of course the device type in System Explorer can be changed and the Status page view will change appropriately. 5.3.1 Device Based Status View
The Device Base Status view displays the status of the device type highlighted in System Explorer for the iPECS system.
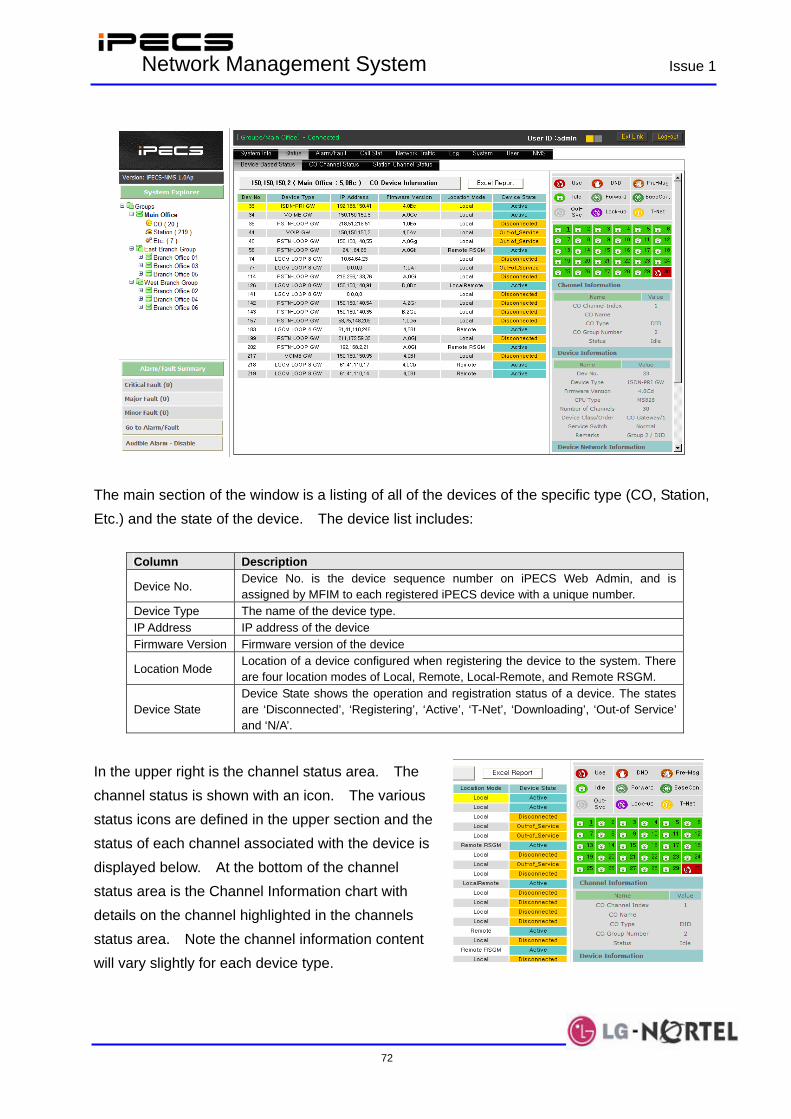
IPECS Network Management System Issue 1
72
The main section of the window is a listing of all of the devices of the specific type (CO, Station, Etc.) and the state of the device. The device list includes:
Column Description
Device No. Device No. is the device sequence number on iPECS Web Admin, and is assigned by MFIM to each registered iPECS device with a unique number.
Device Type The name of the device type. IP Address IP address of the device Firmware Version Firmware version of the device
Location Mode Location of a device configured when registering the device to the system. There are four location modes of Local, Remote, Local-Remote, and Remote RSGM.
Device State Device State shows the operation and registration status of a device. The states are ‘Disconnected’, ‘Registering’, ‘Active’, ‘T-Net’, ‘Downloading’, ‘Out-of Service’ and ‘N/A’.
In the upper right is the channel status area. The channel status is shown with an icon. The various status icons are defined in the upper section and the status of each channel associated with the device is displayed below. At the bottom of the channel status area is the Channel Information chart with details on the channel highlighted in the channels status area. Note the channel information content will vary slightly for each device type.

IPECS Network Management System Issue 1
73
Below the channel information are the Device Information and the Device Network Information charts. The Device Information listed includes:
Field Name Description Dev No. Device No. is the device sequence number on iPECS
Web Admin, and is assigned by MFIM to each registered iPECS device with a unique sequence number.
Device Type The name of the device type Firmware Version
Firmware version of the device
CPU Type CPU type in the device Number of Channels
The number of channels of the device
Device Class/Order
Devices are grouped by their functionality to make ‘Device Class’, and the classes are ‘CO Gateway’, ‘Station’, ‘MISC Gateway’, ‘VSF Gateway’, ‘MCIM Gateway’, ‘WTIM Gateway’, ‘UCS Server’ and ‘Not Defined’. ‘Order’ is the order of the device within its device class.
Service Switch The position of the service switch on the front panel of gateway device. The value can be ‘Normal’ or ‘Service’.
Remarks
The ‘Remark’ field value of ‘System & Device IP Address (PGM 102~103)’ on iPECS Web Admin. This field is for additional information of each device entered by system administrator.
The Device Network Information includes:
Field Name Description IP Address IP address of the device MAC Address MAC address of the device NAPT IP Address
This is the WAN side IP address translated by NAPT router where the remote mode device is installed behind the NAPT router
Location Mode Location of a device configured when registering the device to the system. There are four location modes of Local, Remote, Local-Remote, and Remote RSGM.
ARP Usage The ‘ARP’ field value of ‘System & Device IP Address (PGM 102~103)’ on iPECS Web Admin. If this field is set to ‘ON’, ARP protocol is used to get MAC address for the packet exchange between local mode device and MFIM. If this is set to ‘OFF’, the MAC address information exchanged during registration process is used instead of using ARP protocol.
Reg. Signal Type
Local mode devices can utilize either of multicast or unicast signaling for device registration. Multicast signaling supports automatic configuration and registration feature for Plug&Play of local mode devices. Remote and local-remote devices always use unicast signaling.
T-Net Reg. Type
This field shows the T-Net configuration and registration status of a device, and the values are ‘Not T-Net’, ‘T-Net Registered’, ‘T-Net Register Failed’, ‘LM-Registered’ and ‘LM-Register Failed’.
Zone Number The zone number to which the device belongs. Device zone number is configured using ‘Device Zone Number (PGM 436)’ on iPECS Web Admin.
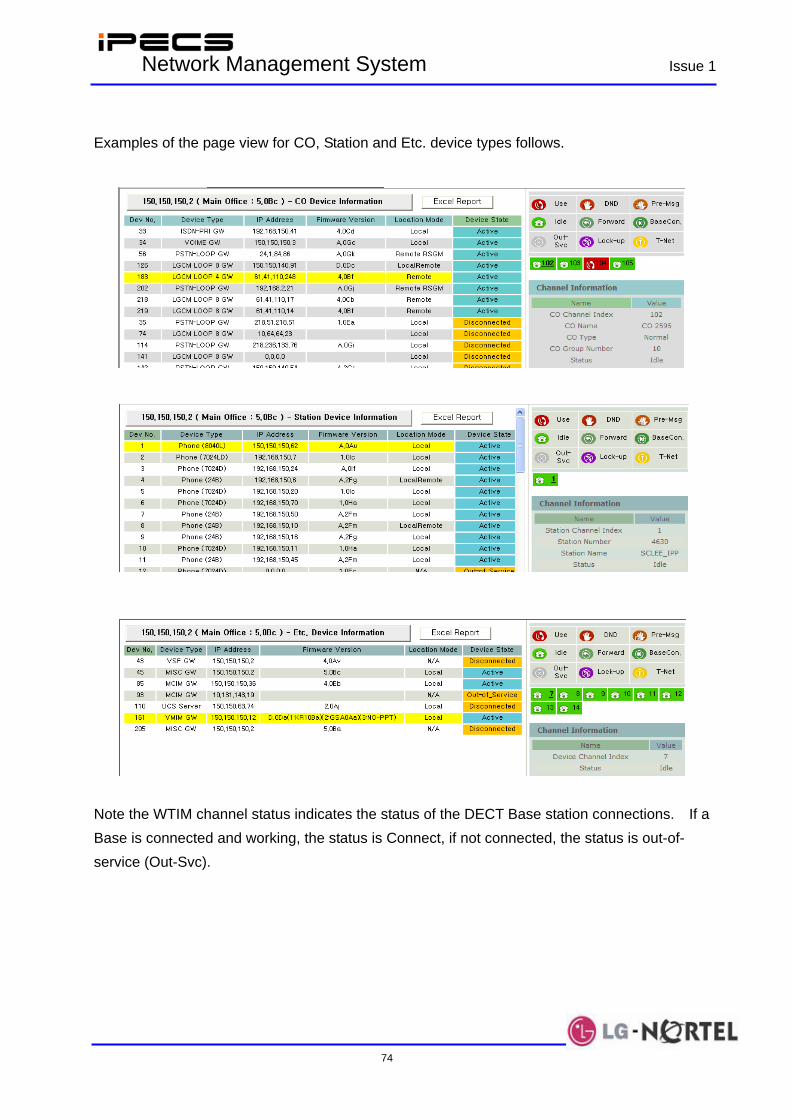
IPECS Network Management System Issue 1
74
Examples of the page view for CO, Station and Etc. device types follows.
Note the WTIM channel status indicates the status of the DECT Base station connections. If a Base is connected and working, the status is Connect, if not connected, the status is out-of-service (Out-Svc).

IPECS Network Management System Issue 1
75
If the station or CO status is ‘Forward’, current forward configuration information can be displayed by clicking on the ‘Status’ field. The information of CO, Station and Etc. devices of a selected system can be downloaded and
saved in an Excel format file by clicking on the [Excel Report] button.
The picture above shows an example of the downloaded Excel report file. The Excel sheets for
CO, Station and Etc. device information are shown by clicking on the corresponding tabs at the
bottom of the Excel program.
5.3.2 CO Channel Status View
The main section of the CO channel Status view shows all CO channels registered to the iPECS system selected in System Explorer. Each channel of all CO/IP devices (PSTN, PRI, BRI, and VoIP modules) is represented graphically with icons indicating the real-time status of the channel. The right side of the screen shows the channel information and the Device and Network Information charts for the highlighted CO channel as in the Device Based Status view. Refer to section 5.2.1 for more detail.
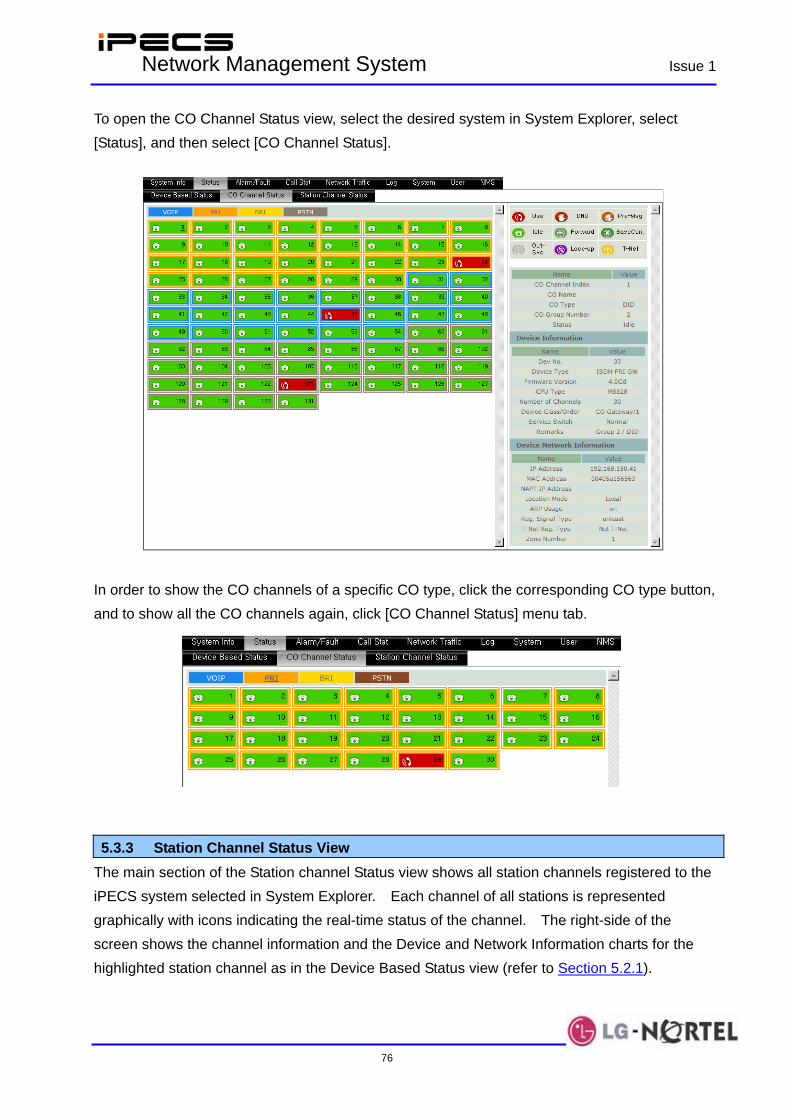
IPECS Network Management System Issue 1
76
To open the CO Channel Status view, select the desired system in System Explorer, select [Status], and then select [CO Channel Status].
In order to show the CO channels of a specific CO type, click the corresponding CO type button, and to show all the CO channels again, click [CO Channel Status] menu tab.
5.3.3 Station Channel Status View
The main section of the Station channel Status view shows all station channels registered to the iPECS system selected in System Explorer. Each channel of all stations is represented graphically with icons indicating the real-time status of the channel. The right-side of the screen shows the channel information and the Device and Network Information charts for the highlighted station channel as in the Device Based Status view (refer to Section 5.2.1).

IPECS Network Management System Issue 1
77
To open the Station Channel Status view, select on the desired system in System Explorer, select [Status], and then select [Station Channel Status].
In order to show the station channels of a specific station type, click the corresponding station type button, and to show all the station channels again, click [Station Channel Status] menu tab.

IPECS Network Management System Issue 1
78
6. Alarm/Fault Management iPECS NMS receives event notification messages from each registered iPECS system. Event messages are analyzed and, based on Alarm/Fault Configuration, section 6.2, events are logged and stored. If assigned, User accounts with management authority for the iPECS system are immediately notified by e-mail of the event.
The iPECS NMS Event Log stores up to 10,000 event records for each registered iPECS system. The Event Log can be searched, analyzed and output as an Excel® file as outlined in section 6.1 below. 6.1 Alarm/Fault Analysis Screen The Alarm/Fault Analysis screen includes tools to isolate and search events from registered iPECS systems stored in the NMS Event Log. Events from a specific system, of a specific type, status and level can be isolated and searched based on event codes, location and date. Each event record includes a record number, a delete check box and status check box. The status check box indicates the management status of the record, new or checked. In addition, each record includes fields for the following:
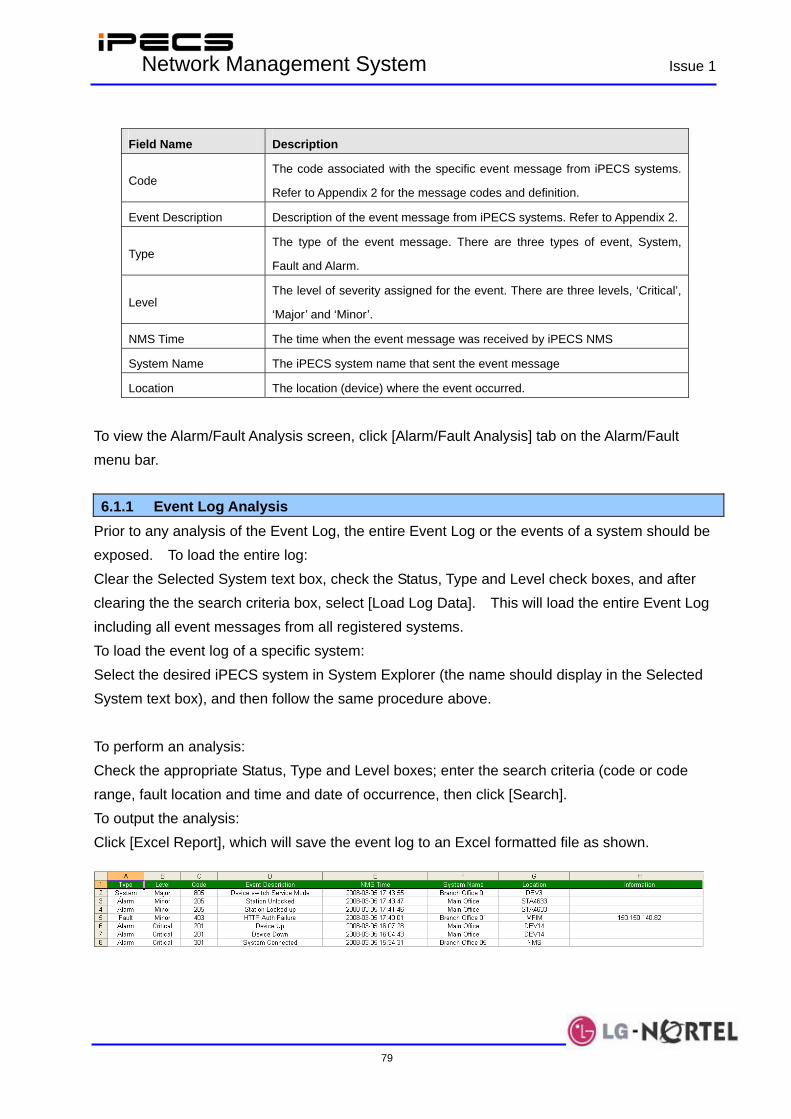
IPECS Network Management System Issue 1
79
Field Name Description
Code The code associated with the specific event message from iPECS systems.
Refer to Appendix 2 for the message codes and definition.
Event Description Description of the event message from iPECS systems. Refer to Appendix 2.
Type The type of the event message. There are three types of event, System,
Fault and Alarm.
Level The level of severity assigned for the event. There are three levels, ‘Critical’,
‘Major’ and ‘Minor’.
NMS Time The time when the event message was received by iPECS NMS
System Name The iPECS system name that sent the event message
Location The location (device) where the event occurred.
To view the Alarm/Fault Analysis screen, click [Alarm/Fault Analysis] tab on the Alarm/Fault menu bar. 6.1.1 Event Log Analysis
Prior to any analysis of the Event Log, the entire Event Log or the events of a system should be exposed. To load the entire log: Clear the Selected System text box, check the Status, Type and Level check boxes, and after clearing the the search criteria box, select [Load Log Data]. This will load the entire Event Log including all event messages from all registered systems. To load the event log of a specific system: Select the desired iPECS system in System Explorer (the name should display in the Selected System text box), and then follow the same procedure above. To perform an analysis: Check the appropriate Status, Type and Level boxes; enter the search criteria (code or code range, fault location and time and date of occurrence, then click [Search]. To output the analysis: Click [Excel Report], which will save the event log to an Excel formatted file as shown.

IPECS Network Management System Issue 1
80
6.2 Alarm/Fault Configuration iPECS NMS logs three types of events, Alarm, Fault and System. The list and description of events reported to iPECS NMS by iPECS systems is given in Appendix 2. Each event has a code and is assigned a level of importance, critical, major, or minor. The default level for each event is defined by the iPECS system but can be changed to support a specific need. Should a specific event code occur, the User accounts assigned management authority for the iPECS system can receive an e-mail notification. Note that for e-mail notification, the NMS mail server must be configured on the NMS management page (section 4.2.1), the User account must be assigned to receive notification in the User management pages (section 4.3), and the User account must be assigned to receive notification for the system on the System Management Configuration page (Section 4.4.1). To alert a NMS client with an audible alarm when an alarm/fault occurs: Check the ‘Audible Alarm’ box of the desired event. The iPECS NMS event log stores only event codes assigned for storage; this can be used to remove events considered insignificant for a given analysis. To configure events and notification: Select the [Alarm/Fault Config] tab from the Alarm/Fault menu bar; after modifying the desired event configuration, click [Save] to implement the changes.
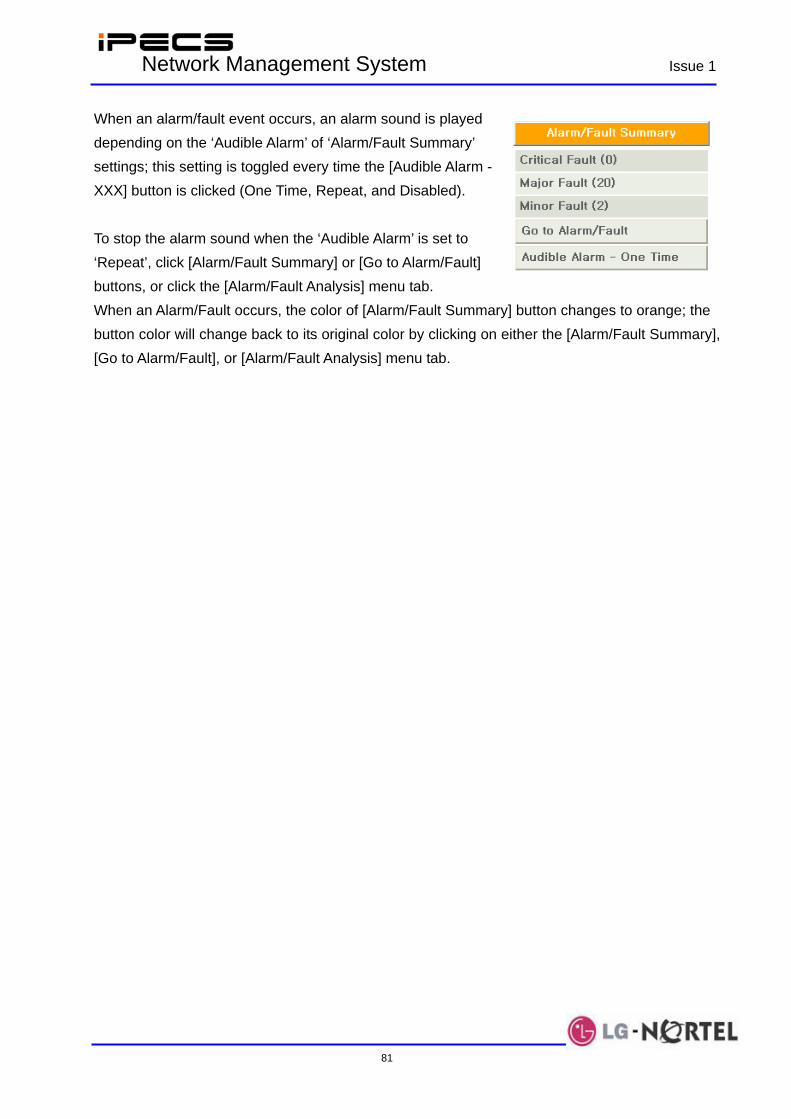
IPECS Network Management System Issue 1
81
When an alarm/fault event occurs, an alarm sound is played depending on the ‘Audible Alarm’ of ‘Alarm/Fault Summary’ settings; this setting is toggled every time the [Audible Alarm - XXX] button is clicked (One Time, Repeat, and Disabled). To stop the alarm sound when the ‘Audible Alarm’ is set to ‘Repeat’, click [Alarm/Fault Summary] or [Go to Alarm/Fault] buttons, or click the [Alarm/Fault Analysis] menu tab. When an Alarm/Fault occurs, the color of [Alarm/Fault Summary] button changes to orange; the button color will change back to its original color by clicking on either the [Alarm/Fault Summary], [Go to Alarm/Fault], or [Alarm/Fault Analysis] menu tab.
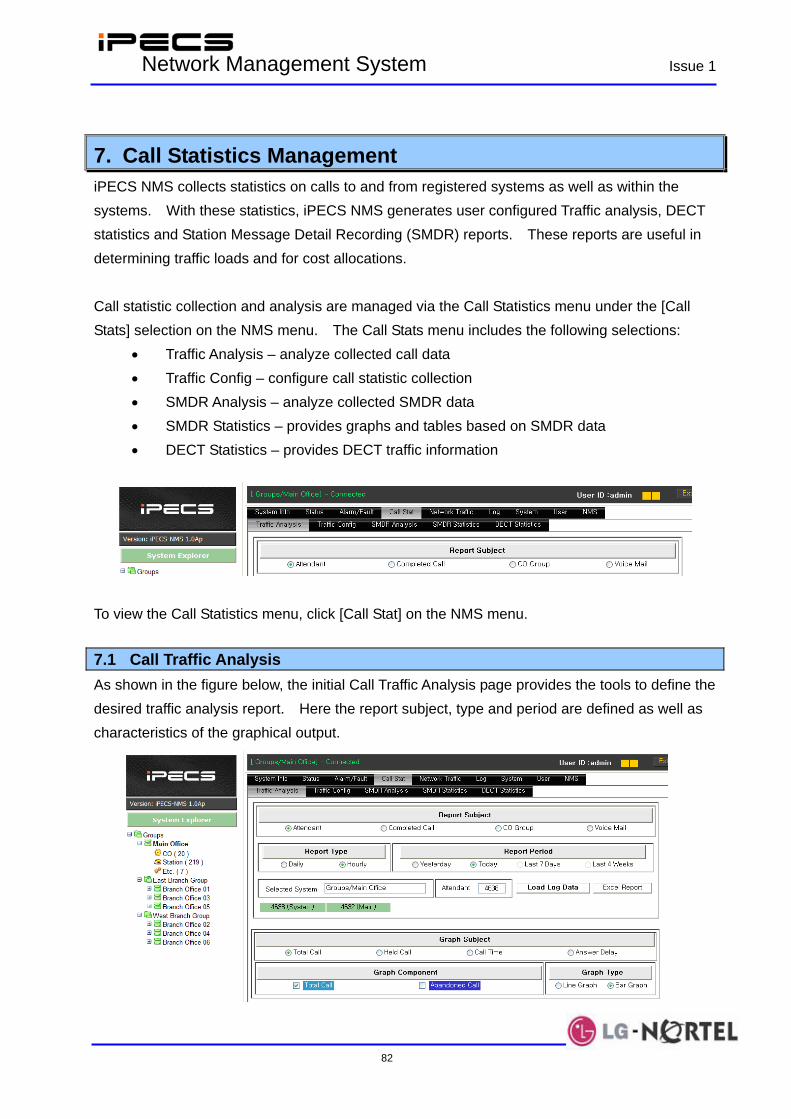
IPECS Network Management System Issue 1
82
7. Call Statistics Management iPECS NMS collects statistics on calls to and from registered systems as well as within the systems. With these statistics, iPECS NMS generates user configured Traffic analysis, DECT statistics and Station Message Detail Recording (SMDR) reports. These reports are useful in determining traffic loads and for cost allocations. Call statistic collection and analysis are managed via the Call Statistics menu under the [Call Stats] selection on the NMS menu. The Call Stats menu includes the following selections:
• Traffic Analysis – analyze collected call data • Traffic Config – configure call statistic collection • SMDR Analysis – analyze collected SMDR data • SMDR Statistics – provides graphs and tables based on SMDR data • DECT Statistics – provides DECT traffic information
To view the Call Statistics menu, click [Call Stat] on the NMS menu. 7.1 Call Traffic Analysis As shown in the figure below, the initial Call Traffic Analysis page provides the tools to define the desired traffic analysis report. Here the report subject, type and period are defined as well as characteristics of the graphical output.

IPECS Network Management System Issue 1
83
To structure a report: Select a system in System Explorer, and select the Report Subject (the report only includes calls associated with the selected subject) from the list.
• Attendant • Completed Calls • CO Group • Voice Mail
Select the Report Type. • Daily, use ‘Yesterday’, ‘Today’, ‘Last 7 Days’ or ‘Last 4 Weeks’ as the Report period
(For ‘Last 7 Days’ and ‘Last 4 Weeks’, ‘Call Traffic Configuration’ is needed.) • Hourly, use ‘Yesterday’ or ‘Today’ as the Report period
Select a Report Period. When Attendant or CO Group is selected as the subject, select the Attendant or CO group to consider for the report. Select a Graph Subject, the subject will appear to the left of the y-axis of the graph. Graph Subjects available varies based on the Report Subject selected above, and Graph Components varies depending on the Graph Subject selection. The charts below define the available y-axis for each Report Subject.
Report Subject -Attendant Graph Subject Description Graph Component
Total Call Total Call Calls routed to the attendant (except group & recalls) Abandoned Call Total Held Held Call Calls held by the attendant Held-Abandoned Available Time Talk Time
Call Time Call times for each attendant status (talk, held, idle)
Held Time Answer Delay
No-Answer Delay
Answer Delay Delay time before call is answered or abandoned by caller.
Denied
Report Subject - Completed Call
Graph Subject Description Graph Component Completed Call Number of completed calls Completed Call
Report Subject – CO Group
Graph Subject Description Graph Component Total Seizure CO Group Usage Number of line seizures of the group for each type of
call (total, incoming, outgoing and overflow) Incoming Seizure

IPECS Network Management System Issue 1
84
Graph Subject Description Graph Component Outgoing Seizure Group Overflow
All CO Busy Total time that all CO/IP lines in the group were simultaneously busy
All CO Busy
Report Subject - Voice Mail
Graph Subject Description Graph Component Requested Voice Mail Number of voice mail (VSF/VMIM) service
requests/denials Denied
Select the Graph Component. Select the Graph Type, line or bar. Click [Load Log Data] iPECS NMS will load data from the call statistics database and generate a graph and tabular report as shown below. The Graph Subject, Component and Type can be changed and are reflected immediately to provide the best representation of the data. The tabular report for each Report Subject varies, a sample of each subject report with explanation of each column is provided below.
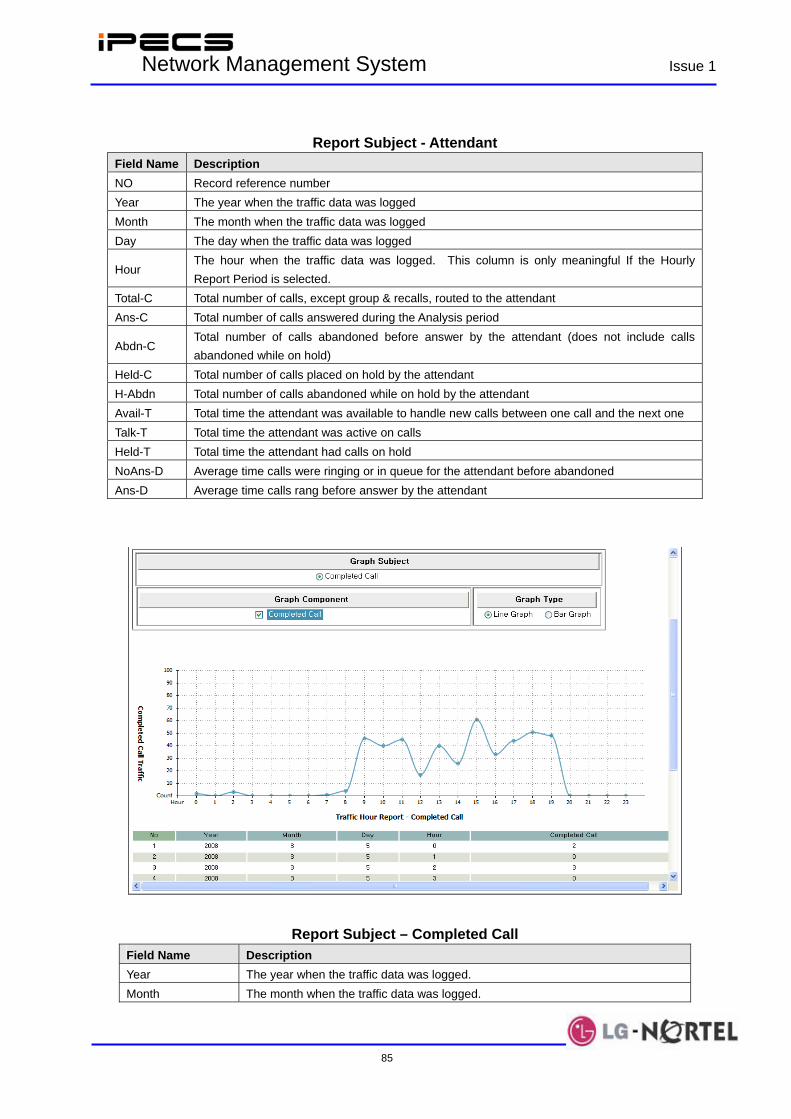
IPECS Network Management System Issue 1
85
Report Subject - Attendant
Field Name Description NO Record reference number Year The year when the traffic data was logged Month The month when the traffic data was logged Day The day when the traffic data was logged
Hour The hour when the traffic data was logged. This column is only meaningful If the Hourly Report Period is selected.
Total-C Total number of calls, except group & recalls, routed to the attendant Ans-C Total number of calls answered during the Analysis period
Abdn-C Total number of calls abandoned before answer by the attendant (does not include calls abandoned while on hold)
Held-C Total number of calls placed on hold by the attendant H-Abdn Total number of calls abandoned while on hold by the attendant Avail-T Total time the attendant was available to handle new calls between one call and the next one Talk-T Total time the attendant was active on calls Held-T Total time the attendant had calls on hold NoAns-D Average time calls were ringing or in queue for the attendant before abandoned Ans-D Average time calls rang before answer by the attendant
Report Subject – Completed Call
Field Name Description Year The year when the traffic data was logged. Month The month when the traffic data was logged.
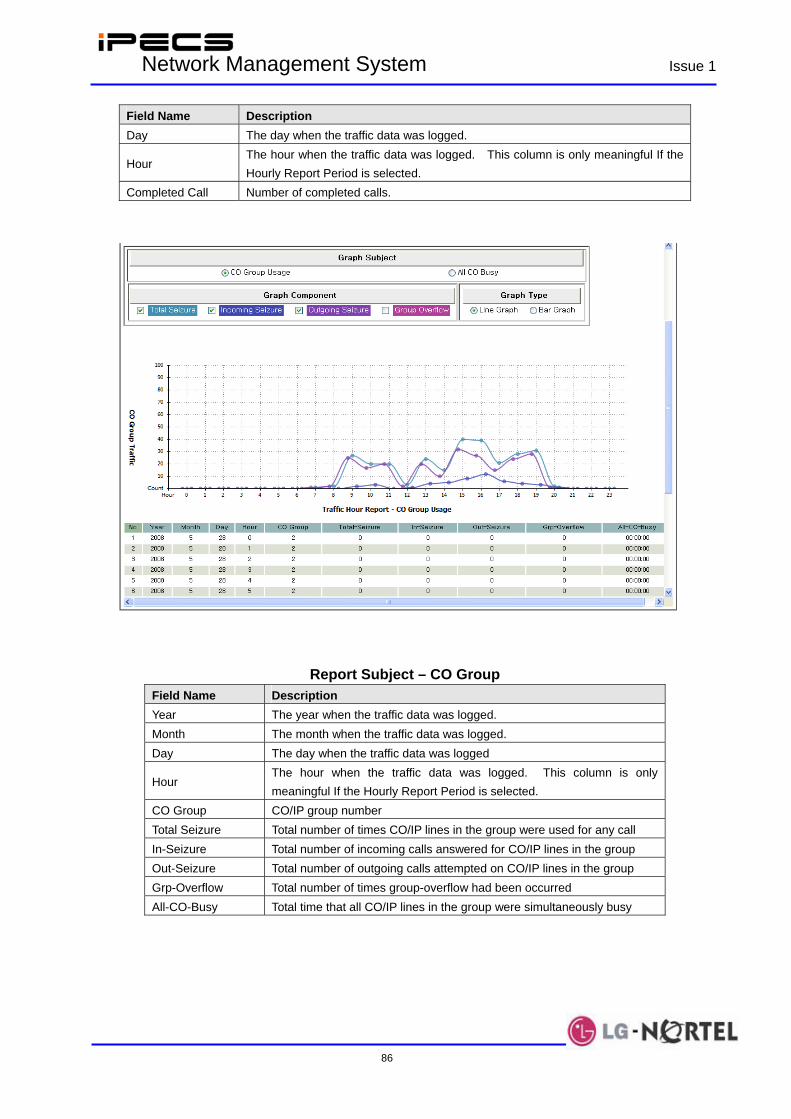
IPECS Network Management System Issue 1
86
Field Name Description Day The day when the traffic data was logged.
Hour The hour when the traffic data was logged. This column is only meaningful If the Hourly Report Period is selected.
Completed Call Number of completed calls.
Report Subject – CO Group Field Name Description Year The year when the traffic data was logged. Month The month when the traffic data was logged. Day The day when the traffic data was logged
Hour The hour when the traffic data was logged. This column is only meaningful If the Hourly Report Period is selected.
CO Group CO/IP group number Total Seizure Total number of times CO/IP lines in the group were used for any call In-Seizure Total number of incoming calls answered for CO/IP lines in the group Out-Seizure Total number of outgoing calls attempted on CO/IP lines in the group Grp-Overflow Total number of times group-overflow had been occurred All-CO-Busy Total time that all CO/IP lines in the group were simultaneously busy

IPECS Network Management System Issue 1
87
Report Subject – Voice Mail
Field Name Description Year The year when the traffic data was logged.
Month The month when the traffic data was logged. Day The day when the traffic data was logged.
Hour The hour when the traffic data was logged. This column is only meaningful If the Hourly Report Period is selected.
Requested Total number of voice mail service requests Denied Total number of denied voice mail service requests
By clicking on the [Excel Report] button, you can download an Excel format file for the traffic table data.
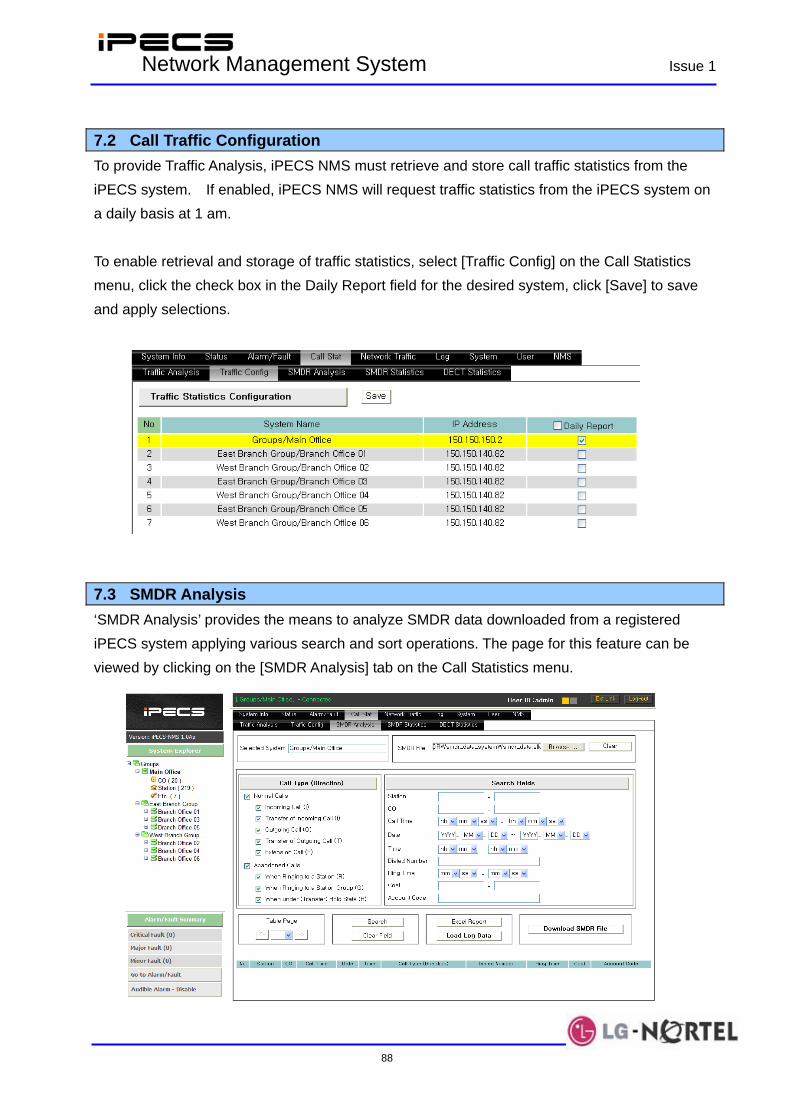
IPECS Network Management System Issue 1
88
7.2 Call Traffic Configuration To provide Traffic Analysis, iPECS NMS must retrieve and store call traffic statistics from the iPECS system. If enabled, iPECS NMS will request traffic statistics from the iPECS system on a daily basis at 1 am. To enable retrieval and storage of traffic statistics, select [Traffic Config] on the Call Statistics menu, click the check box in the Daily Report field for the desired system, click [Save] to save and apply selections.
7.3 SMDR Analysis ‘SMDR Analysis’ provides the means to analyze SMDR data downloaded from a registered iPECS system applying various search and sort operations. The page for this feature can be viewed by clicking on the [SMDR Analysis] tab on the Call Statistics menu.
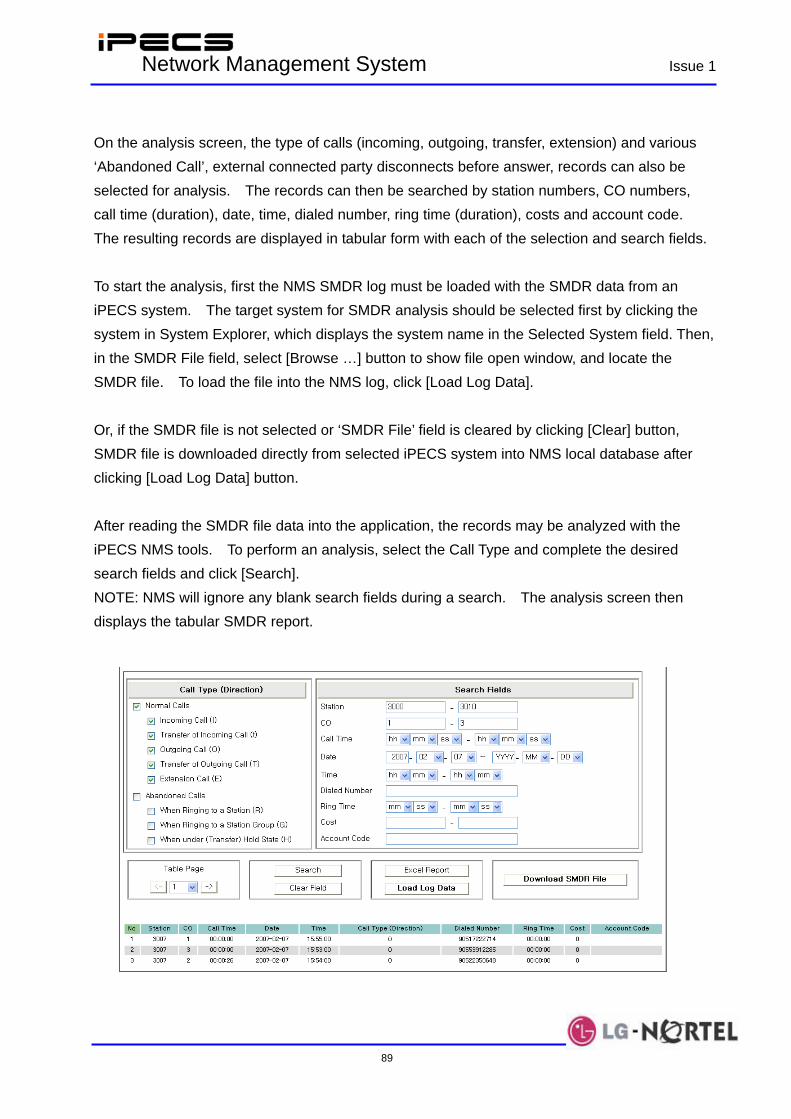
IPECS Network Management System Issue 1
89
On the analysis screen, the type of calls (incoming, outgoing, transfer, extension) and various ‘Abandoned Call’, external connected party disconnects before answer, records can also be selected for analysis. The records can then be searched by station numbers, CO numbers, call time (duration), date, time, dialed number, ring time (duration), costs and account code. The resulting records are displayed in tabular form with each of the selection and search fields. To start the analysis, first the NMS SMDR log must be loaded with the SMDR data from an iPECS system. The target system for SMDR analysis should be selected first by clicking the system in System Explorer, which displays the system name in the Selected System field. Then, in the SMDR File field, select [Browse …] button to show file open window, and locate the SMDR file. To load the file into the NMS log, click [Load Log Data]. Or, if the SMDR file is not selected or ‘SMDR File’ field is cleared by clicking [Clear] button, SMDR file is downloaded directly from selected iPECS system into NMS local database after clicking [Load Log Data] button. After reading the SMDR file data into the application, the records may be analyzed with the iPECS NMS tools. To perform an analysis, select the Call Type and complete the desired search fields and click [Search]. NOTE: NMS will ignore any blank search fields during a search. The analysis screen then displays the tabular SMDR report.

IPECS Network Management System Issue 1
90
Additional search operations can be performed and are immediately reflected in the table. After modifying Call Type (Direction) and Search Fields, click [Search] to perform a new search. The example above shows a table generated when all normal calls were searched for station 3000 to 3010 and CO 1 to 3 on Feb, 7, 2007.
In order to download and save the data shown in the SMDR table as an Excel format file, click [Excel Report] button. The picture above shows an example of downloaded Excel file. By clicking [Download SMDR File] button, SMDR file can be downloaded from the selected iPECS system and saved in the NMS user’s PC. 7.4 SMDR Statistics ‘SMDR Statistics’ provides additional presentations of the results from the most recent SMDR Analysis, refer to section 7.3. Results are provided in graphical and tabular formats. After completing an analysis, this page can be entered by clicking [SMDR Statistics] on the Call Statistics menu.

IPECS Network Management System Issue 1
91
The ‘Selected System’ and ‘SMDR File’ fields cannot be changed here, but just show the system and SMDR file names that were configured and used in ‘SMDR Analysis’. These fields can only be changed in ‘SMDR Analysis’ menu.
Additional graphs and tables can be generated by selecting an x and y axis. To apply the selected x and y axis select the type of graph, line or bar. 7.5 DECT Statistics The DECT Statistics screen provides DECT statistics information such as traffic, call, end-of-call, cell, RF access, and station statistics of a DECT gateway as well as the statistics information for all the DECT stations registered to an MFIM. The page for this feature can be entered by clicking [DECT Statistics] tab menu.
IPECS Network Management System Issue 1
92
DECT statistics can be classified into two parts. One is the statistics information collected and managed by MFIM, and provides statistics information for all the DECT stations registered to the MFIM. The other one is the statistics information collected and managed by each DECT gateway, and provides various statistics information such as traffic, call, end-of-call, cell, RF access, station statistics of a DECT gateway. As the first step, the target system for DECT statistics should be selected using System Explorer, and then either of [MFIM] or [DECT G/W] is to be selected in order to specify whether the information collected by MFIM or the information from DECT gateway is to be used for data retrieval. The types and meanings of the statistics information provided by ‘MFIM Statistics’ and ‘DECT G/W Statistics’ are as follows.
Table Name Field Name Description
MFIM Statistics All DECT Station
Statistics
This provides the statistics data of the number of total and abnormal
calls for all the DECT stations registered to an MFIM. The statistics
data are collected and managed by MFIM.
Traffic Statistics This provides the statistics data of the wireless hold time and traffic
density of a DECT gateway.
Call Statistics This provides the statistics data of incoming and outgoing calls for
each cell.
End-of-Call StatisticsThis provides the statistics data of normal and abnormal end of calls
for each cell.
Cell Statistics This provides the statistics data of the frequency usage for each slot
of a selected cell.
RF Access StatisticsThis provides the statistics data of channel access, handover, and
their loads (%) for each cell.
DECT G/W Statistics
Station Statistics
This provides the information for normal & abnormal end of calls
and the last cell where a DECT station has been most recently
located.
‘MFIM Statistics’ information is retrieved directly from MFIM because its data are collected and managed in MFIM. However, because ‘DECT G/W Statistics’ data are collected in each DECT gateway, the data should be sent from DECT gateway to MFIM and then retrieved from MFIM to iPECS-NMS, which causes some processing delay. All the statistics information received from MFIM is stored into NMS local database, and then presented to NMS users as tables of statistics information.

IPECS Network Management System Issue 1
93
After storing the statistics data into NMS local database, NMS user can utilize the information previously stored in the database in order to get the last referenced data (with minimal processing delay). Or, if the current statistics information is needed, all the data can be retrieved again, stored into NMS local database, and then presented to NMS users. 7.5.1 MFIM Statistics
‘MFIM Statistics’ information is collected and managed in MFIM, and provides the statistics of total number of calls and abnormal calls for all the DECT stations registered to the MFIM.
After checking ‘Selected System’ field and the [MFIM] radio-button to be selected, check if ‘Statistics Time’ field shows a date and time. The ‘Statistics Time’ field value means the date and time when MFIM statistics information was retrieved from MFIM and stored into NMS local database. So, if this field shows a date and time, the statistics data previously stored in NMS local database can be retrieved by clicking [Load Existing Data] button. If this field is blank, it means there is no previously stored MFIM statistics data in NMS local database. In this case, current MFIM Statistics data may be retrieved from MFIM by clicking [Load Current Data] button, and the received data will be stored in NMS local database and then presented to NMS user as a table of statistics information.
After clicking on the [Load Current Data] button, current MFIM Statistics information is sent to iPECS-NMS, stored in NMS local database, and then presented to the NMS user as a statistics table. While in process, the ‘Loading Status’ field displays the current status of the procedure, and the types and meanings of the status messages are as follows.
Loading Status Description
MFIM Data Requested The first step that designates the data request state from iPECS-
NMS to MFIM for MFIM statistics data.

IPECS Network Management System Issue 1
94
Loading Status Description
Loading Data (NMS MFIM) The second step that designates the state of the transmission of
MFIM statistics data from MFIM to iPECS-NMS.
Data Loading Completed
The last step that designates the completion of the transmission of
MFIM statistics data, and the storage of the data into NMS local
database.
MFIM statistics data (e.g. number of Call Drops, or other counter values) can be cleared to ‘0’ and statistics data accumulation re-started from the beginning, by clicking on the [Clear Statistics] button. Because this does not remove the statistics data currently stored in NMS local database, the NMS user is still able to retrieve statistics data from NMS local database by clicking [Load Existing Data] button.
In order to download and save the currently loaded MFIM statistics data as an Excel format file,
click on the [Excel Report] button. The picture above shows an example of the downloaded
Excel file.
‘All DECT Station Statistics’ provides the statistics of total number of calls and abnormal calls for all the DECT stations registered to the MFIM. The meaning of each table field is as follows.
Field Name Description
Total Call Total number of calls including both normal and abnormal calls.
Call Drop
Number of call drops caused by power-off or disconnection of wireless channel. (The
figure inside the parentheses designates the proportion (%) of call drops to the total
number of calls)

IPECS Network Management System Issue 1
95
Field Name Description
No Response
Counted when a DECT station cannot receive an incoming call (no response for
signaling messages) due to power-off or other reasons. (The figure inside the
parentheses designates the proportion (%) of no responses to the total number of calls)
Codec Unavailable
Counted when a call cannot be made because all the codec channels of a DECT
gateway are already used for other calls. (The figure inside the parentheses designates
the proportion (%) of codec unavailable cases to the total number of calls)
7.5.2 DECT G/W Statistics
‘DECT G/W Statistics’ information is collected and managed in each DECT gateway, and provides various statistics information such as traffic, call, end-of-call, cell, RF access, station statistics of a DECT gateway.
After checking ‘Selected System’ field and the [DECT G/W] radio-button to be selected, click on the target DECT gateway in the list of DECT gateways registered to the MFIM.
The ‘Statistics Time’ field value means the date and time when DECT G/W Statistics information was retrieved and stored into NMS local database. So, if this field shows a date and time, the statistics data previously stored in NMS local database can be retrieved by clicking [Load Existing Data] button. If this field is blank, it means there is no previously stored DECT G/W Statistics data in NMS local database. In this case, current DECT G/W Statistics data can be retrieved from MFIM by clicking [Load Current Data] button, and the received data will be stored in NMS local database and then presented to NMS user as tables of statistics information.

IPECS Network Management System Issue 1
96
After clicking [Load Current Data] button, current DECT G/W Statistics information is sent to iPECS-NMS, stored in NMS local database, and then presented to NMS user as statistics tables. This needs additional procedure and takes relatively longer time than retrieving existing data directly from NMS local database using [Load Existing Data] button. So, in order to give more information about the steps of information retrieval process, ‘Loading Status’ field displays the current status of the procedure, and the types and meanings of the status messages as listed.
Loading Status Description
DECT Data Requested The first step that designates the data request state from iPECS-
NMS to MFIM for DECT G/W statistics data.
Loading Data (MFIM DECT) The second step that designates the state of the transmission of
DECT G/W statistics data from DECT gateway to MFIM.
Data Loaded to MFIM
The third step that designates the completion of the transmission of
DECT G/W statistics from DECT gateway, and the storage of the
data into a memory space in MFIM.
Loading Data (NMS MFIM) The forth step that designates the state of the transmission of
DECT G/W statistics data from MFIM to iPECS-NMS.
Data Loading Completed
The last step that designates the completion of the transmission of
DECT G/W statistics data from MFIM, and the storage of the data
into NMS local database.
During the statistics data request and transmission, it is possible to receive an error caused by problems in network communication or in the DECT gateway itself. The types and meanings of the error messages are as follows.
Loading Error Description
No Data in MFIM
The data transmission from DECT gateway to MFIM has not been
properly performed due to the internal problem of the DECT
gateway.
Invalid Data from DECT Malformed or invalid data message has been sent from DECT
gateway.
Data Not Available DECT gateway had not been properly registered to MFIM when the
statistics data were requested to the DECT gateway.
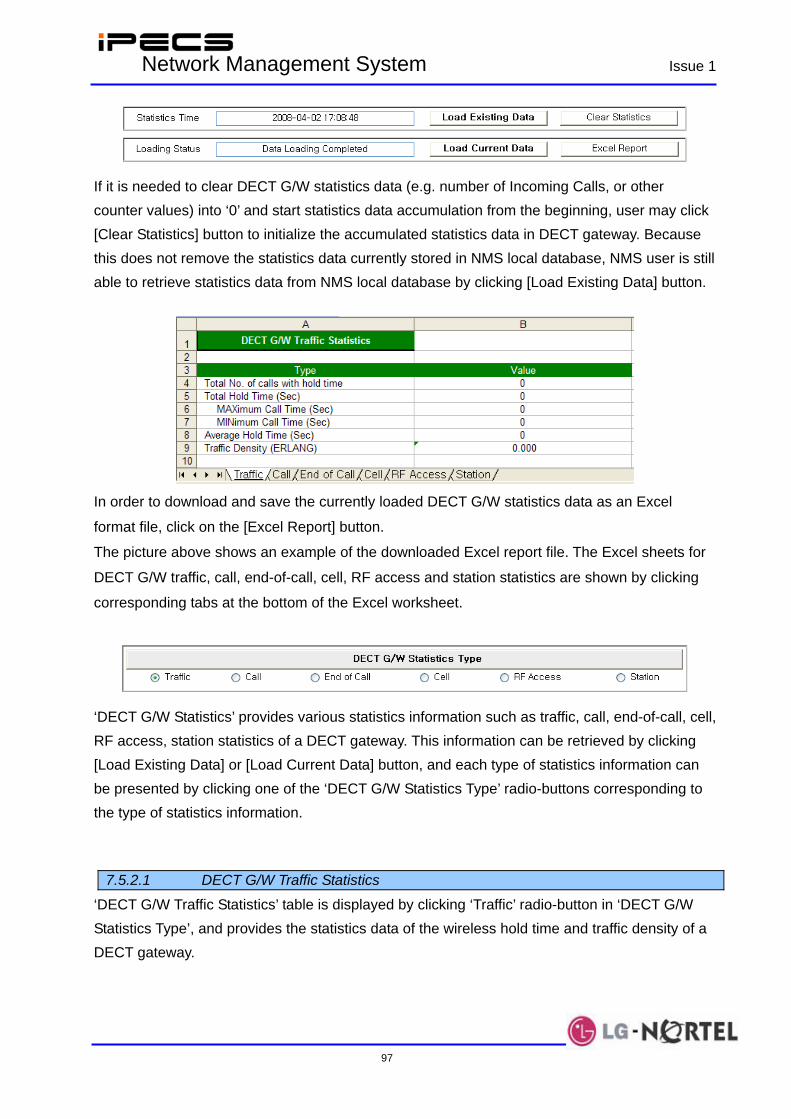
IPECS Network Management System Issue 1
97
If it is needed to clear DECT G/W statistics data (e.g. number of Incoming Calls, or other counter values) into ‘0’ and start statistics data accumulation from the beginning, user may click [Clear Statistics] button to initialize the accumulated statistics data in DECT gateway. Because this does not remove the statistics data currently stored in NMS local database, NMS user is still able to retrieve statistics data from NMS local database by clicking [Load Existing Data] button.
In order to download and save the currently loaded DECT G/W statistics data as an Excel
format file, click on the [Excel Report] button.
The picture above shows an example of the downloaded Excel report file. The Excel sheets for
DECT G/W traffic, call, end-of-call, cell, RF access and station statistics are shown by clicking
corresponding tabs at the bottom of the Excel worksheet.
‘DECT G/W Statistics’ provides various statistics information such as traffic, call, end-of-call, cell, RF access, station statistics of a DECT gateway. This information can be retrieved by clicking [Load Existing Data] or [Load Current Data] button, and each type of statistics information can be presented by clicking one of the ‘DECT G/W Statistics Type’ radio-buttons corresponding to the type of statistics information.
7.5.2.1 DECT G/W Traffic Statistics
‘DECT G/W Traffic Statistics’ table is displayed by clicking ‘Traffic’ radio-button in ‘DECT G/W Statistics Type’, and provides the statistics data of the wireless hold time and traffic density of a DECT gateway.

IPECS Network Management System Issue 1
98
This table shows statistics data for ‘Total No. of Calls with Hold Time’, ‘Total Hold Time’, ‘Maximum Call Time’, ‘Minimum Call Time’, ‘Average Hold Time’, and Traffic Density (ELANG)’. The meanings of the table fields are as follows. (The time fields in the table can have values between 0~999999999 in the unit of seconds, and if the value exceeds the maximum value, FFFFFFFFF will be displayed to indicate overflow.)
Field Name Description
Total Number of Calls with Hold Time Total number of calls for which wireless connections were completely
made.
Total Hold Time Sum of the wireless connection holding time of each call.
Maximum Call Time The longest wireless holding time among all the calls made on the DECT
gateway. (The time for failed calls is not counted.)
Minimum Call Time The shortest wireless holding time among all the calls made on the DECT
gateway. (The time for failed calls is not counted.)
Average Hold Time Average wireless holding time.
Traffic Density (ERLANG)
Traffic density of the DECT gateway. Erlang is calculated by the following
formula.
Erlang = (Average Hold Time x Total Number of Calls) / 3600 second
7.5.2.2 DECT G/W Call Statistics
‘DECT G/W Call Statistics’ table is displayed by clicking ‘Call’ radio-button in ‘DECT G/W Statistics Type’, and provides the statistics data of incoming and outgoing calls for each cell.
This table shows statistics data for ‘Incoming’ calls, ‘Outgoing’ calls, and the ‘Total’ number of calls. The meanings of the table fields are as follows. (The table fields can have values between 0~99999, and if the value exceeds the maximum

IPECS Network Management System Issue 1
99
value, FFFFF will be displayed to indicate overflow.)
Field Name Description
Incoming Number of incoming calls to DECT stations in the cell.
Outgoing Number of outgoing calls from DECT stations in the cell.
Total Sum of incoming and outgoing calls.
7.5.2.3 DECT G/W End of Call Statistics
‘DECT G/W End of Call Statistics’ table is displayed by clicking ‘End of Call’ radio-button in ‘DECT G/W Statistics Type’, and provides the statistics data of normal and abnormal end of calls for each cell.
This table shows statistics data for ‘Normal Call’, ‘Abnormal Call’ (‘Call Fail’, ‘MSG Error’, ‘No Subs.’, ‘No RF Channel’), and ‘No Response’. The meanings of the table fields are as follows. (The table fields can have values between 0~99999, and if the value exceeds the maximum value, FFFFF will be displayed to indicate overflow.)
Field Name Description
Normal Call Number of calls that were released normally.
Abnormal Call Number of calls that were released abnormally. This type is assorted into
four sub-types such as Call Fail, MSG Error, No Subs., No RF Channel.
Call Fail Number of call releases caused by disconnection of wireless channels,
timer expiration, etc.
MSG Error Number of call releases caused by signaling message error.
No Subs. Number of call releases caused by trying to make call to non-subscribed
wireless terminal.
No RF Channel Number of call releases due to no available RF channel.
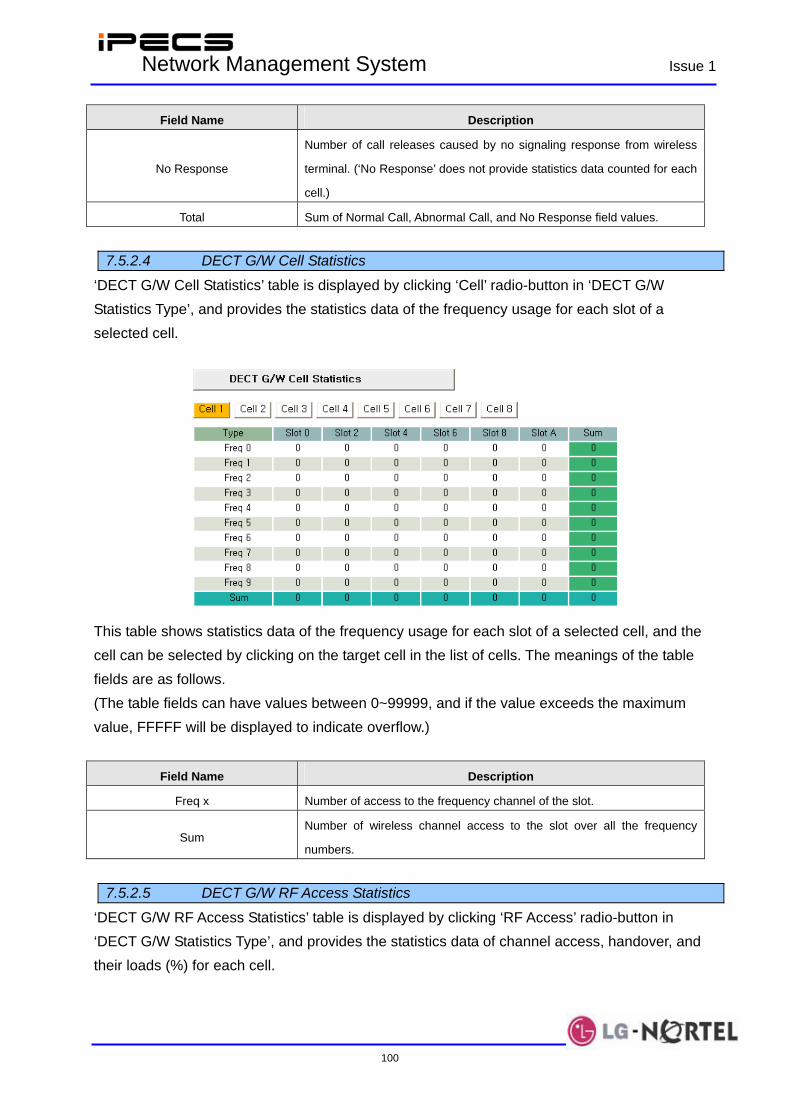
IPECS Network Management System Issue 1
100
Field Name Description
No Response
Number of call releases caused by no signaling response from wireless
terminal. (‘No Response’ does not provide statistics data counted for each
cell.)
Total Sum of Normal Call, Abnormal Call, and No Response field values.
7.5.2.4 DECT G/W Cell Statistics
‘DECT G/W Cell Statistics’ table is displayed by clicking ‘Cell’ radio-button in ‘DECT G/W Statistics Type’, and provides the statistics data of the frequency usage for each slot of a selected cell.
This table shows statistics data of the frequency usage for each slot of a selected cell, and the cell can be selected by clicking on the target cell in the list of cells. The meanings of the table fields are as follows. (The table fields can have values between 0~99999, and if the value exceeds the maximum value, FFFFF will be displayed to indicate overflow.)
Field Name Description
Freq x Number of access to the frequency channel of the slot.
Sum Number of wireless channel access to the slot over all the frequency
numbers.
7.5.2.5 DECT G/W RF Access Statistics
‘DECT G/W RF Access Statistics’ table is displayed by clicking ‘RF Access’ radio-button in ‘DECT G/W Statistics Type’, and provides the statistics data of channel access, handover, and their loads (%) for each cell.
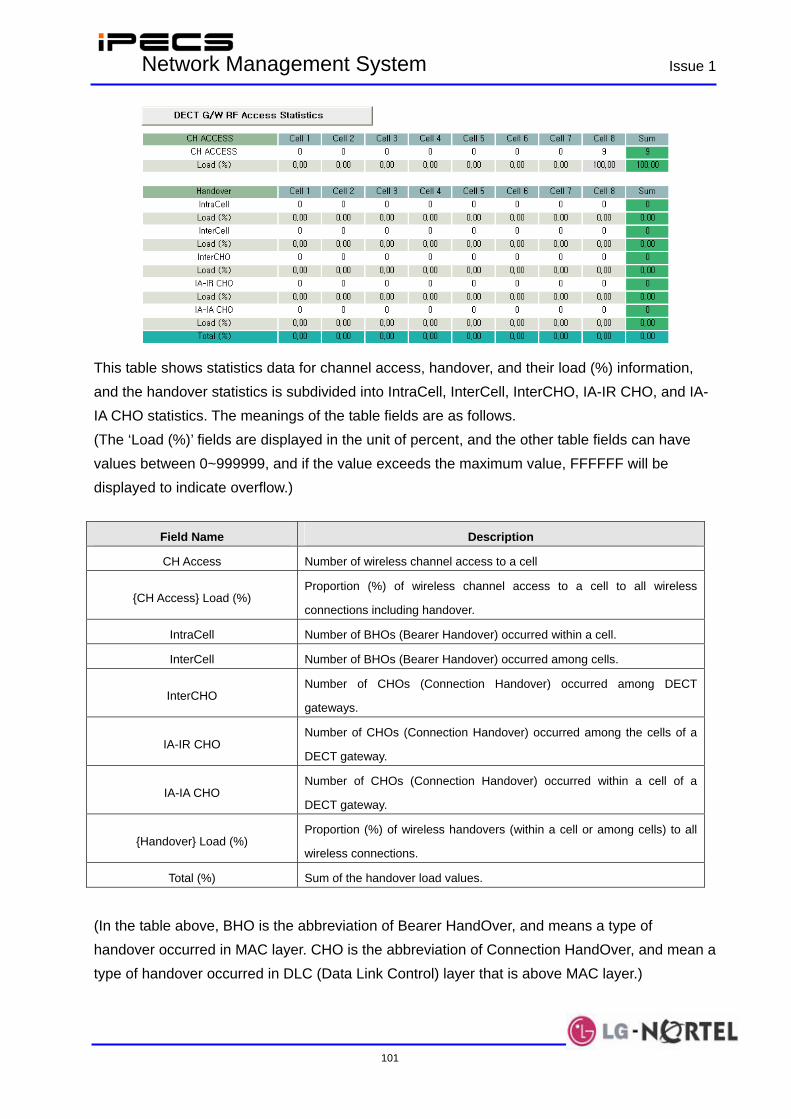
IPECS Network Management System Issue 1
101
This table shows statistics data for channel access, handover, and their load (%) information, and the handover statistics is subdivided into IntraCell, InterCell, InterCHO, IA-IR CHO, and IA-IA CHO statistics. The meanings of the table fields are as follows. (The ‘Load (%)’ fields are displayed in the unit of percent, and the other table fields can have values between 0~999999, and if the value exceeds the maximum value, FFFFFF will be displayed to indicate overflow.)
Field Name Description
CH Access Number of wireless channel access to a cell
{CH Access} Load (%) Proportion (%) of wireless channel access to a cell to all wireless
connections including handover.
IntraCell Number of BHOs (Bearer Handover) occurred within a cell.
InterCell Number of BHOs (Bearer Handover) occurred among cells.
InterCHO Number of CHOs (Connection Handover) occurred among DECT
gateways.
IA-IR CHO Number of CHOs (Connection Handover) occurred among the cells of a
DECT gateway.
IA-IA CHO Number of CHOs (Connection Handover) occurred within a cell of a
DECT gateway.
{Handover} Load (%) Proportion (%) of wireless handovers (within a cell or among cells) to all
wireless connections.
Total (%) Sum of the handover load values.
(In the table above, BHO is the abbreviation of Bearer HandOver, and means a type of handover occurred in MAC layer. CHO is the abbreviation of Connection HandOver, and mean a type of handover occurred in DLC (Data Link Control) layer that is above MAC layer.)

IPECS Network Management System Issue 1
102
7.5.2.6 DECT G/W Station Statistics
‘DECT G/W Station Statistics’ table is displayed by clicking ‘Station’ radio-button in ‘DECT G/W Statistics Type’, and provides the information for normal & abnormal end of calls and the last cell where a DECT station has been most recently located.
This table shows statistics data for ‘Last Cell’, ‘Normal Call’, ‘Abnormal Call’ and ‘No Response’ for each station. The meanings of the table fields are as follows. (The table fields can have values between 0~999999, and if the value exceeds the maximum value, FFFFFF will be displayed to indicate overflow.)
Field Name Description
Last Cell The last cell where a DECT station was most recently located
Normal Call Number of calls that were released normally
Abnormal Call Number of calls that were released abnormally
No Response Number of call releases caused by no signaling response from DECT
station.
Sum Sum of the column values over all the DECT stations in the table

IPECS Network Management System Issue 1
103
8. Network Traffic Monitoring ‘Network Traffic Monitoring’ provides the means to monitor the network traffic and the connection status of a network device. For general network devices, Ping test, Traceroute test, and network traffic monitoring features are implemented, and for iPECS devices, Ping test and traffic monitoring features are provided. The pages for these features can be entered by clicking [Network Traffic] tab on the top level menu. 8.1 Ping Test ‘Ping Test’ provides functions to check the connection status and the packet delay time between iPECS-NMS and a general network device, and can be entered by clicking [Ping] tab menu.
Before performing Ping test, the IP address of the target network device, and the interval & count for Ping packet transmission should be configured in ‘Ping Configuration & Operation’. For ‘Interval’ field, one of 5, 10, 20, 30 second options can be selected using the combo-box, and ‘Count’ field can have a value between 1~65535. ‘Estimated Time’ field displays an estimated completion time calculated from the values of ‘Interval’ and ‘Count’ fields, and is a read-only field that does not require input from user.
After the configuration is completed, Ping test can be started by clicking [Start] button. If it is
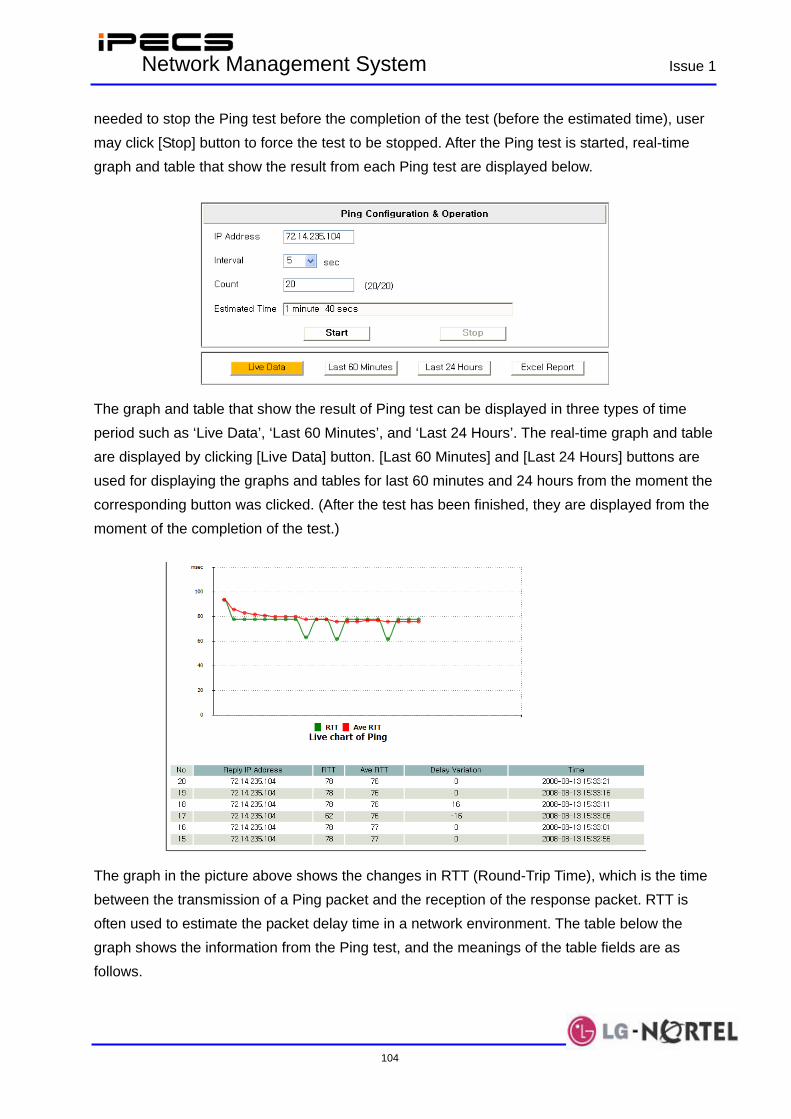
IPECS Network Management System Issue 1
104
needed to stop the Ping test before the completion of the test (before the estimated time), user may click [Stop] button to force the test to be stopped. After the Ping test is started, real-time graph and table that show the result from each Ping test are displayed below.
The graph and table that show the result of Ping test can be displayed in three types of time period such as ‘Live Data’, ‘Last 60 Minutes’, and ‘Last 24 Hours’. The real-time graph and table are displayed by clicking [Live Data] button. [Last 60 Minutes] and [Last 24 Hours] buttons are used for displaying the graphs and tables for last 60 minutes and 24 hours from the moment the corresponding button was clicked. (After the test has been finished, they are displayed from the moment of the completion of the test.)
The graph in the picture above shows the changes in RTT (Round-Trip Time), which is the time between the transmission of a Ping packet and the reception of the response packet. RTT is often used to estimate the packet delay time in a network environment. The table below the graph shows the information from the Ping test, and the meanings of the table fields are as follows.
IPECS Network Management System Issue 1
105
Table Name Field Name Description
Reply IP Address
The IP address of the device that responded to the Ping packet sent
by iPECS-NMS. Normally, this is to be the same IP address as the
target ‘IP Address’ configured in ‘Ping Configuration & Operation’.
RTT
Abbreviation of Round-Trip Time. This is the elapsed time until the
reception of the response packet to a Ping packet sent by iPECS-
NMS.
Average RTT The overall average of the RTT values from all the Ping tests
calculated since the beginning of the Ping test.
Delay Variation The difference in value between the RTT values of the previous row
and the current row of the table.
Live Data
Time
The time when the Ping packet was actually transmitted to the target
device. The ‘Time’ interval may not be exactly same as the ‘Interval’
value configured in ‘Ping Configuration & Operation’ depending on
the operational or processing load on the NMS server.
Reply IP Address
The IP address of the device that responded to the Ping packet sent
by iPECS-NMS. Normally, this is to be the same IP address as the
target ‘IP Address’ configured in ‘Ping Configuration & Operation’.
RTT
This is the average of the RTT values from the Ping tests for last 1
minute (actually, the time between the previous row and the current
row in the table).
Average RTT The overall average of the RTT values from all the Ping tests
calculated since the beginning of the Ping test.
Delay Variation The difference in value between the RTT values of the previous row
and the current row of the table.
Last 60 Minutes
Time
The time when the Ping packet was actually transmitted to the target
device. The ‘Time’ interval may not be exactly same as the ‘Interval’
value configured in ‘Ping Configuration & Operation’ depending on
the operational or processing load on the NMS server.
Reply IP Address
The IP address of the device that responded to the Ping packet sent
by iPECS-NMS. Normally, this is to be the same IP address as the
target ‘IP Address’ configured in ‘Ping Configuration & Operation’.
RTT
This is the average of the RTT values from the Ping tests for last 1
hour (actually, the time between the previous row and the current
row in the table).
Last 24 Hours
Average RTT The overall average of the RTT values from all the Ping tests
calculated since the beginning of the Ping test.

IPECS Network Management System Issue 1
106
Table Name Field Name Description
Delay Variation The difference in value between the RTT values of the previous row
and the current row of the table.
Time
The time when the Ping packet was actually transmitted to the target
device. The ‘Time’ interval may not be exactly same as the ‘Interval’
value configured in ‘Ping Configuration & Operation’ depending on
the operational or processing load on the NMS server.
After the Ping operation is finished, the operation result data can be downloaded and saved as
an Excel format file by clicking on the [Excel Report] button.
The picture above shows an example of a downloaded Excel report file. The Excel sheets for Live Data, Last 60 Minutes and Last 24 Hours are shown by clicking corresponding tabs at the bottom of Excel program. 8.2 Traceroute Test ‘Traceroute Test’ provides functions to check the packet delivery path and packet delay time for each hop to the destination between iPECS-NMS and a general network device, utilizing ‘ICMP’ message and the TTL field in IP packet header. The page for this feature can be entered by clicking [Traceroute] tab menu.

IPECS Network Management System Issue 1
107
Before performing Traceroute test, the IP address of the target network device and the interval for Traceroute packet transmission should be configured in ‘Traceroute Configuration & Operation’. For ‘Interval’ field, one of 3, 4, 5 second options can be selected using the combo-box.
After the configuration is completed, Traceroute test can be started by clicking [Start] button. If it is needed to stop the Traceroute test before the completion of the test (before the destination device has been reached), user may click on the [Stop] button to force the test to be stopped. After a Traceroute test is started, real-time graph and table that show the Traceroute result for each hop to the destination are displayed below.
The graph of Traceroute test shows the changes in RTT (Round-Trip Time) for each hop to the destination, in real-time. RTT is the time between the transmission of a Traceroute packet and the reception of the response packet, and is often used to designate the packet delay time in a network environment. The table below the graph shows the hops on the path to the destination in sequence, and the RTT from the three trials to the same hop and their average value are displayed together with the ‘Reply IP Address’ information. The meanings of the table fields are as follows.
Field Name Description
Reply IP Address
The IP address of the device that responded with ‘ICMP Time Exceeded’ message to the
Traceroute packet sent by iPECS-NMS. Normally, this is the IP address of a router on
the path to the destination or of the target device itself.
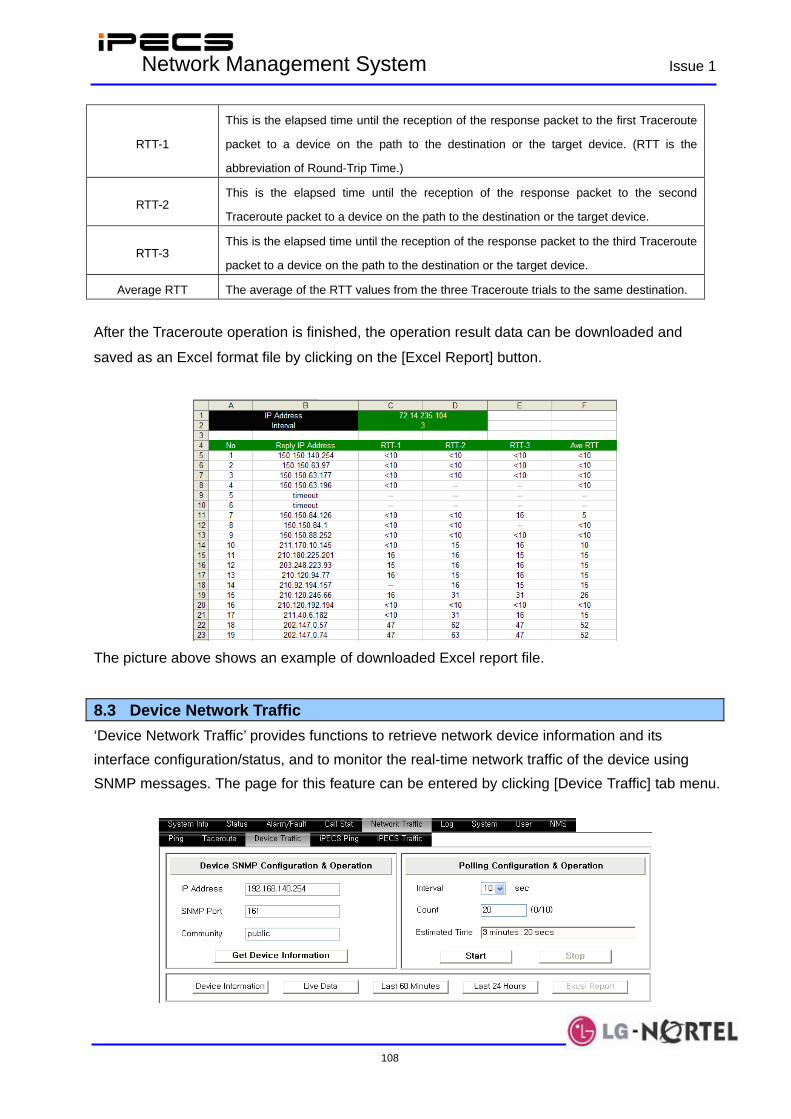
IPECS Network Management System Issue 1
108
RTT-1
This is the elapsed time until the reception of the response packet to the first Traceroute
packet to a device on the path to the destination or the target device. (RTT is the
abbreviation of Round-Trip Time.)
RTT-2 This is the elapsed time until the reception of the response packet to the second
Traceroute packet to a device on the path to the destination or the target device.
RTT-3 This is the elapsed time until the reception of the response packet to the third Traceroute
packet to a device on the path to the destination or the target device.
Average RTT The average of the RTT values from the three Traceroute trials to the same destination.
After the Traceroute operation is finished, the operation result data can be downloaded and
saved as an Excel format file by clicking on the [Excel Report] button.
The picture above shows an example of downloaded Excel report file.
8.3 Device Network Traffic ‘Device Network Traffic’ provides functions to retrieve network device information and its interface configuration/status, and to monitor the real-time network traffic of the device using SNMP messages. The page for this feature can be entered by clicking [Device Traffic] tab menu.
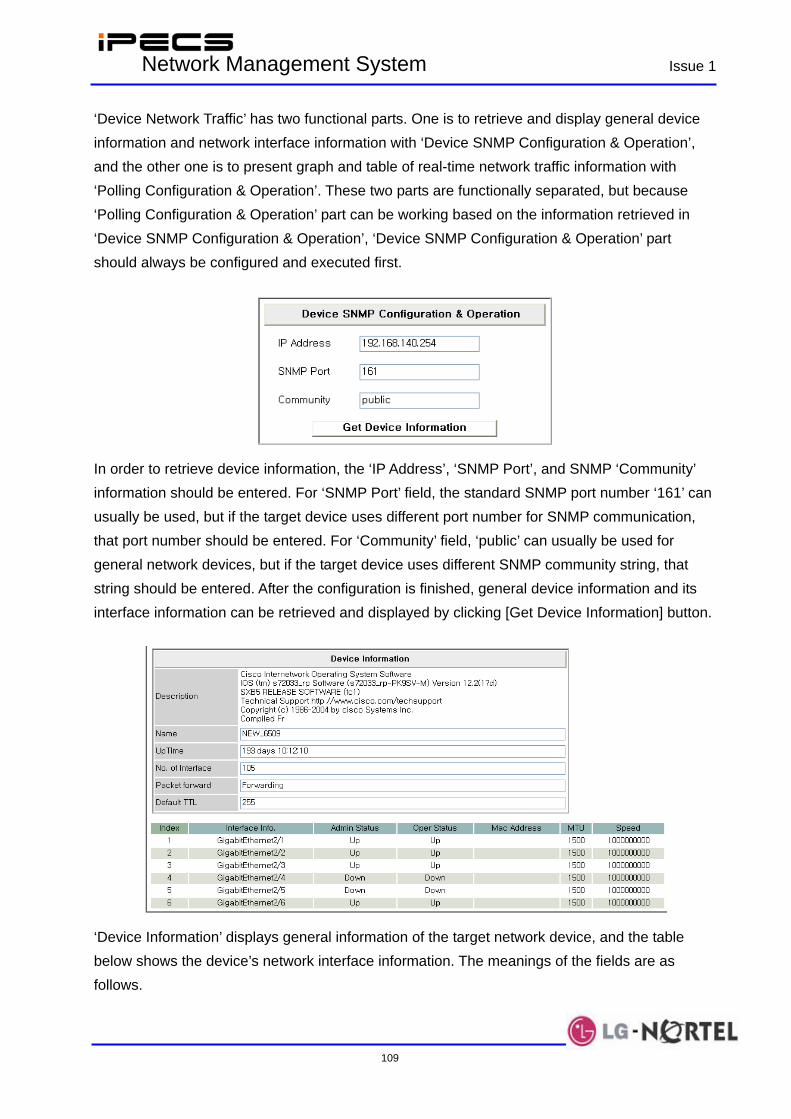
IPECS Network Management System Issue 1
109
‘Device Network Traffic’ has two functional parts. One is to retrieve and display general device information and network interface information with ‘Device SNMP Configuration & Operation’, and the other one is to present graph and table of real-time network traffic information with ‘Polling Configuration & Operation’. These two parts are functionally separated, but because ‘Polling Configuration & Operation’ part can be working based on the information retrieved in ‘Device SNMP Configuration & Operation’, ‘Device SNMP Configuration & Operation’ part should always be configured and executed first.
In order to retrieve device information, the ‘IP Address’, ‘SNMP Port’, and SNMP ‘Community’ information should be entered. For ‘SNMP Port’ field, the standard SNMP port number ‘161’ can usually be used, but if the target device uses different port number for SNMP communication, that port number should be entered. For ‘Community’ field, ‘public’ can usually be used for general network devices, but if the target device uses different SNMP community string, that string should be entered. After the configuration is finished, general device information and its interface information can be retrieved and displayed by clicking [Get Device Information] button.
‘Device Information’ displays general information of the target network device, and the table below shows the device’s network interface information. The meanings of the fields are as follows.
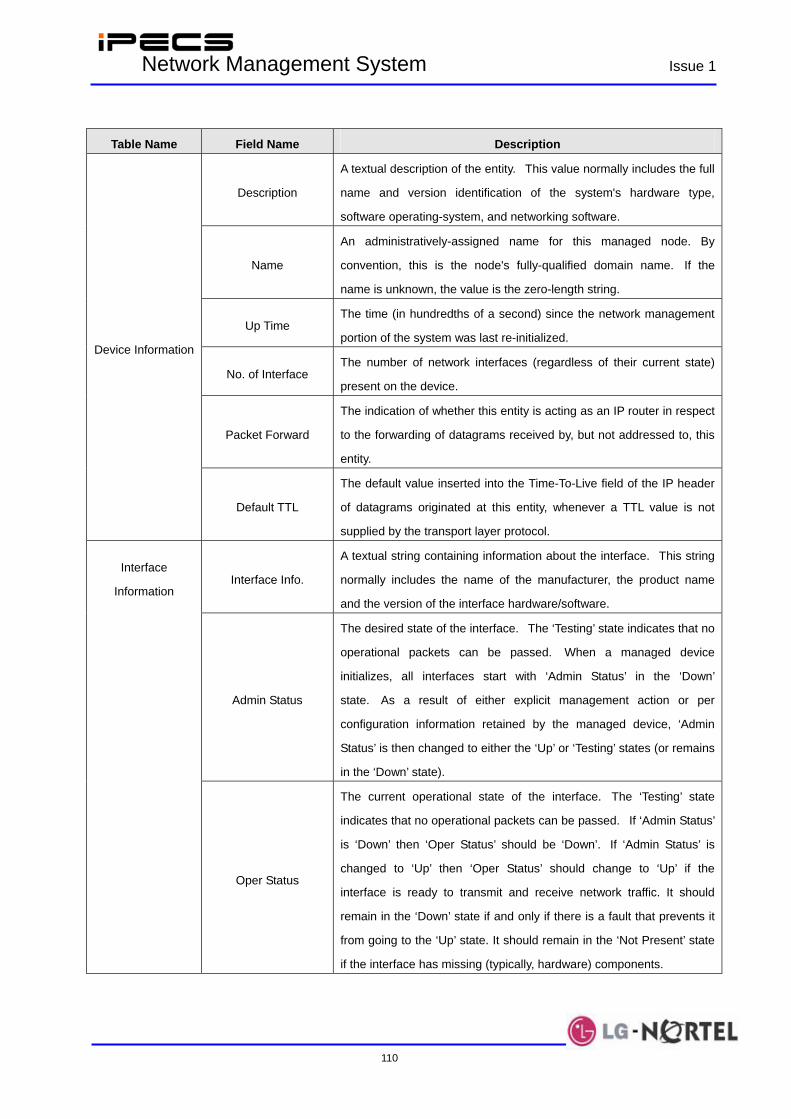
IPECS Network Management System Issue 1
110
Table Name Field Name Description
Description
A textual description of the entity. This value normally includes the full
name and version identification of the system's hardware type,
software operating-system, and networking software.
Name
An administratively-assigned name for this managed node. By
convention, this is the node's fully-qualified domain name. If the
name is unknown, the value is the zero-length string.
Up Time The time (in hundredths of a second) since the network management
portion of the system was last re-initialized.
No. of Interface The number of network interfaces (regardless of their current state)
present on the device.
Packet Forward
The indication of whether this entity is acting as an IP router in respect
to the forwarding of datagrams received by, but not addressed to, this
entity.
Device Information
Default TTL
The default value inserted into the Time-To-Live field of the IP header
of datagrams originated at this entity, whenever a TTL value is not
supplied by the transport layer protocol.
Interface Info.
A textual string containing information about the interface. This string
normally includes the name of the manufacturer, the product name
and the version of the interface hardware/software.
Admin Status
The desired state of the interface. The ‘Testing’ state indicates that no
operational packets can be passed. When a managed device
initializes, all interfaces start with ‘Admin Status’ in the ‘Down’
state. As a result of either explicit management action or per
configuration information retained by the managed device, ‘Admin
Status’ is then changed to either the ‘Up’ or ‘Testing’ states (or remains
in the ‘Down’ state).
Interface
Information
Oper Status
The current operational state of the interface. The ‘Testing’ state
indicates that no operational packets can be passed. If ‘Admin Status’
is ‘Down’ then ‘Oper Status’ should be ‘Down’. If ‘Admin Status’ is
changed to ‘Up’ then ‘Oper Status’ should change to ‘Up’ if the
interface is ready to transmit and receive network traffic. It should
remain in the ‘Down’ state if and only if there is a fault that prevents it
from going to the ‘Up’ state. It should remain in the ‘Not Present’ state
if the interface has missing (typically, hardware) components.
IPECS Network Management System Issue 1
111
Table Name Field Name Description
MAC Address
The interface's address at its protocol sub-layer. For example, for an
802.x interface, this object normally contains a MAC address. For
interfaces which do not have such an address (e.g., a serial line), this
object should contain an octet string of zero length.
MTU
The size of the largest packet which can be sent/received on the
interface, specified in octets. For interfaces that are used for
transmitting network datagrams, this is the size of the largest network
datagram that can be sent on the interface.
Speed
An estimate of the interface's current bandwidth in bits per
second. For interfaces which do not vary in bandwidth or for those
where no accurate estimation can be made, this object should contain
the nominal bandwidth. For a sub-layer which has no concept of
bandwidth, this object should be zero.
In order to monitor real-time network traffic of the target device, the interval and count for polling network traffic data should be configured in ‘Polling Configuration & Operation’. For ‘Interval’ field, one of 10, 20, 30 second options can be selected using the combo-box, and ‘Count’ field can have a value between 1~65535. ‘Estimated Time’ field displays an estimated completion time calculated from the values of ‘Interval’ and ‘Count’ fields, and is a read-only field that does not require input from user. After the configuration is completed, network traffic monitoring can be started by clicking [Start] button. If it is needed to stop the traffic monitoring before the traffic polling is finished (before the estimated time), user may click [Stop] button to force the traffic polling to be stopped. After traffic monitoring is started, real-time graph and table that show the result from each traffic polling are displayed below.
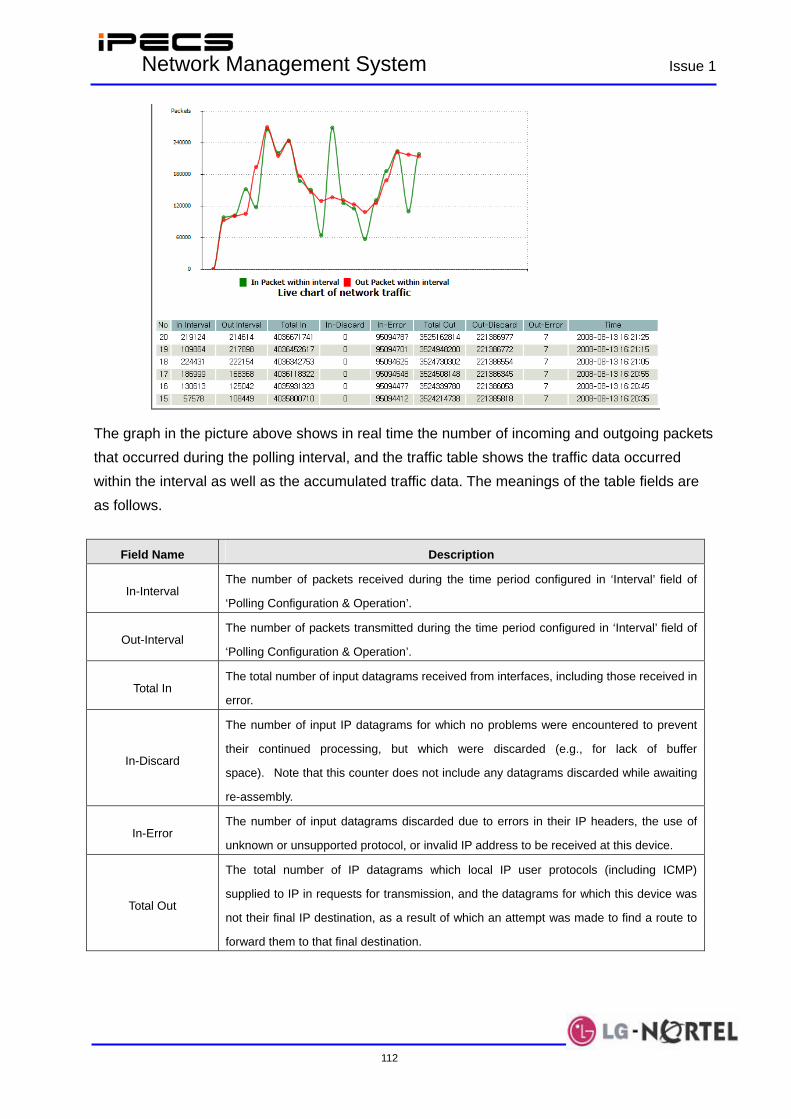
IPECS Network Management System Issue 1
112
The graph in the picture above shows in real time the number of incoming and outgoing packets that occurred during the polling interval, and the traffic table shows the traffic data occurred within the interval as well as the accumulated traffic data. The meanings of the table fields are as follows.
Field Name Description
In-Interval The number of packets received during the time period configured in ‘Interval’ field of
‘Polling Configuration & Operation’.
Out-Interval The number of packets transmitted during the time period configured in ‘Interval’ field of
‘Polling Configuration & Operation’.
Total In The total number of input datagrams received from interfaces, including those received in
error.
In-Discard
The number of input IP datagrams for which no problems were encountered to prevent
their continued processing, but which were discarded (e.g., for lack of buffer
space). Note that this counter does not include any datagrams discarded while awaiting
re-assembly.
In-Error The number of input datagrams discarded due to errors in their IP headers, the use of
unknown or unsupported protocol, or invalid IP address to be received at this device.
Total Out
The total number of IP datagrams which local IP user protocols (including ICMP)
supplied to IP in requests for transmission, and the datagrams for which this device was
not their final IP destination, as a result of which an attempt was made to find a route to
forward them to that final destination.

IPECS Network Management System Issue 1
113
Field Name Description
Out-Discard
The number of output IP datagrams for which no problem was encountered to prevent
their transmission to their destination, but which were discarded (e.g., for lack of buffer
space).
Out-Error
The number of IP datagrams discarded because no route could be found to transmit
them to their destination. Note that this includes any datagrams which the device cannot
route because all of its default routers are down.
Time
The time when iPECS-NMS retrieved traffic information from the target device. The
‘Time’ interval may not be exactly same as the ‘Interval’ value configured in ‘Polling
Configuration & Operation’ depending on the operational or processing load on the NMS
server.
The graph and table that show the result of network traffic polling can be displayed in three types of time period such as ‘Live Data’, ‘Last 60 Minutes’, and ‘Last 24 Hours’. The real-time graph and table are displayed by clicking [Live Data] button. [Last 60 Minutes] and [Last 24 Hours] buttons are used for displaying the graphs and tables for last 60 minutes and 24 hours from the moment the corresponding button was clicked. (After the polling has been finished, they are displayed from the moment of the completion of the polling operation.) And, the interface information that was initially retrieved from the target device by clicking [Get Device Information] button can be retrieved from NMS local database by clicking [Device Information] button. After the Device Traffic operation is finished, the operation result data can be downloaded and
saved as an Excel format file by clicking on the [Excel Report] button.
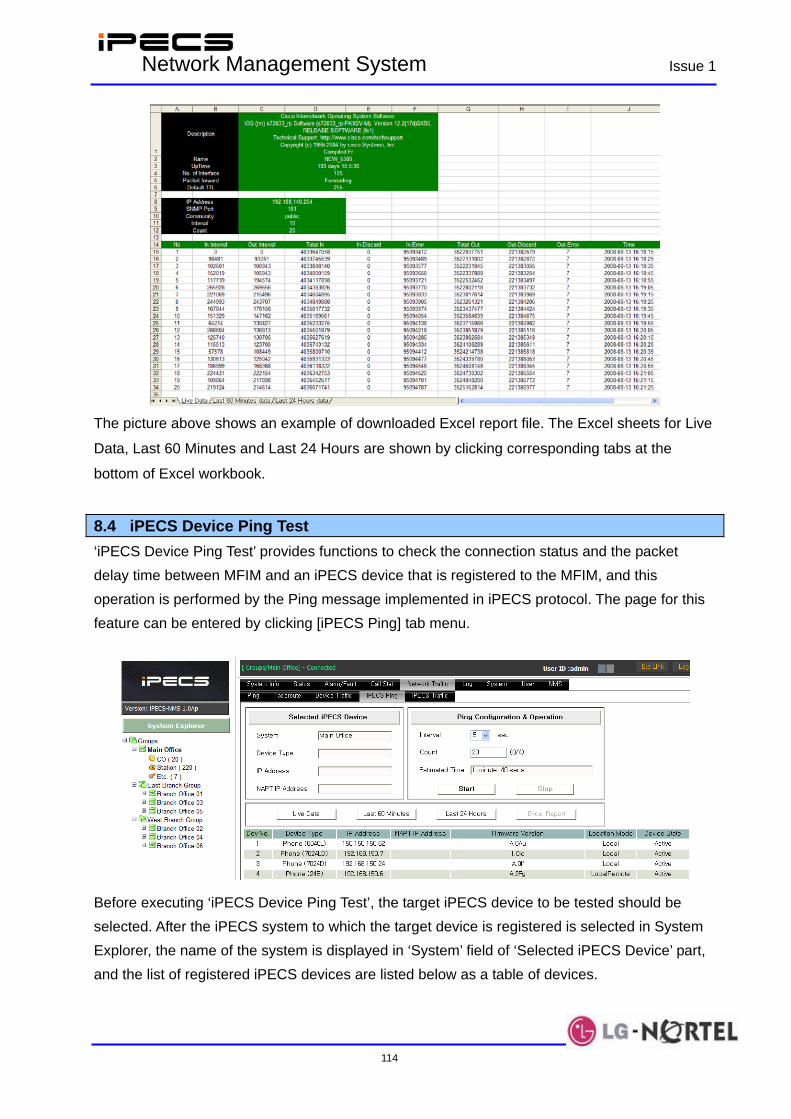
IPECS Network Management System Issue 1
114
The picture above shows an example of downloaded Excel report file. The Excel sheets for Live
Data, Last 60 Minutes and Last 24 Hours are shown by clicking corresponding tabs at the
bottom of Excel workbook.
8.4 iPECS Device Ping Test ‘iPECS Device Ping Test’ provides functions to check the connection status and the packet delay time between MFIM and an iPECS device that is registered to the MFIM, and this operation is performed by the Ping message implemented in iPECS protocol. The page for this feature can be entered by clicking [iPECS Ping] tab menu.
Before executing ‘iPECS Device Ping Test’, the target iPECS device to be tested should be selected. After the iPECS system to which the target device is registered is selected in System Explorer, the name of the system is displayed in ‘System’ field of ‘Selected iPECS Device’ part, and the list of registered iPECS devices are listed below as a table of devices.

IPECS Network Management System Issue 1
115
The target device can be selected in the device table by clicking on the device item, and after the selection is made, the ‘Device Type’ and ‘IP Address’ information is displayed in the corresponding fields of ‘Selected iPECS Device’ part. (If the target device is located behind an NAPT router, ‘NAPT IP Address’ value will also be displayed.)
Before performing Ping test for the selected device, the interval and count for Ping packet transmission should be configured in ‘Ping Configuration & Operation’. For ‘Interval’ field, one of 5, 10, 20, 30 second options can be selected using the combo-box, and ‘Count’ field can have a value between 1~65535. ‘Estimated Time’ field displays an estimated completion time calculated from the values of ‘Interval’ and ‘Count’ fields, and is a read-only field that does not require input from user. iPECS Device Ping Test is different from the Ping test for general network device (11.1 Ping Test) in that the Ping packet is sent from MFIM to the target device (rather than sent from iPECS-NMS), and so ‘iPECS Device Ping Test’ can be used to check the network connection and packet delay time between MFIM and the target iPECS device. After the configuration is completed, Ping test can be started by clicking [Start] button. If it is needed to stop the Ping test before the completion of the test (before the estimated time), user may click [Stop] button to force the test to be stopped. After the Ping test is started, real-time graph and table that show the result from each Ping test will be displayed below.

IPECS Network Management System Issue 1
116
The graph and table that show the result of Ping test can be displayed in three types of time period such as ‘Live Data’, ‘Last 60 Minutes’, and ‘Last 24 Hours’. The real-time graph and table are displayed by clicking [Live Data] button. [Last 60 Minutes] and [Last 24 Hours] buttons are used for displaying the graphs and tables for last 60 minutes and 24 hours from the moment the corresponding button was clicked. (After the test has been finished, they are displayed from the moment of the completion of the test.)
The graph in the picture above shows the changes in RTT (Round-Trip Time), which is the time between the transmission of a Ping packet and the reception of the response packet, and can be used to estimate the packet delay time between MFIM and the selected iPECS device. The table below the graph shows the information from the Ping test, and the meanings of the table fields are as follows.
Table Name Field Name Description
Live Data Reply IP Address
The IP address of the device that responded to the Ping packet sent
by MFIM. Normally, this is to be the same IP address as the target
‘IP Address’ configured in ‘Selected iPECS Device’.
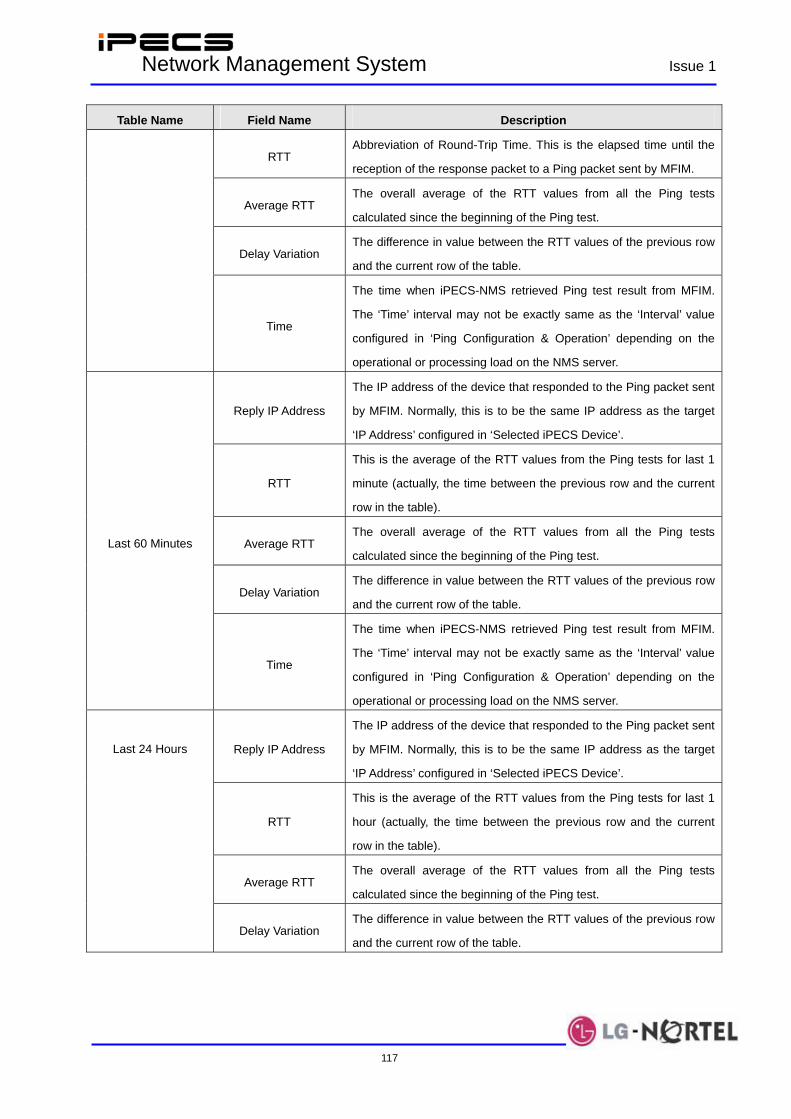
IPECS Network Management System Issue 1
117
Table Name Field Name Description
RTT Abbreviation of Round-Trip Time. This is the elapsed time until the
reception of the response packet to a Ping packet sent by MFIM.
Average RTT The overall average of the RTT values from all the Ping tests
calculated since the beginning of the Ping test.
Delay Variation The difference in value between the RTT values of the previous row
and the current row of the table.
Time
The time when iPECS-NMS retrieved Ping test result from MFIM.
The ‘Time’ interval may not be exactly same as the ‘Interval’ value
configured in ‘Ping Configuration & Operation’ depending on the
operational or processing load on the NMS server.
Reply IP Address
The IP address of the device that responded to the Ping packet sent
by MFIM. Normally, this is to be the same IP address as the target
‘IP Address’ configured in ‘Selected iPECS Device’.
RTT
This is the average of the RTT values from the Ping tests for last 1
minute (actually, the time between the previous row and the current
row in the table).
Average RTT The overall average of the RTT values from all the Ping tests
calculated since the beginning of the Ping test.
Delay Variation The difference in value between the RTT values of the previous row
and the current row of the table.
Last 60 Minutes
Time
The time when iPECS-NMS retrieved Ping test result from MFIM.
The ‘Time’ interval may not be exactly same as the ‘Interval’ value
configured in ‘Ping Configuration & Operation’ depending on the
operational or processing load on the NMS server.
Reply IP Address
The IP address of the device that responded to the Ping packet sent
by MFIM. Normally, this is to be the same IP address as the target
‘IP Address’ configured in ‘Selected iPECS Device’.
RTT
This is the average of the RTT values from the Ping tests for last 1
hour (actually, the time between the previous row and the current
row in the table).
Average RTT The overall average of the RTT values from all the Ping tests
calculated since the beginning of the Ping test.
Last 24 Hours
Delay Variation The difference in value between the RTT values of the previous row
and the current row of the table.
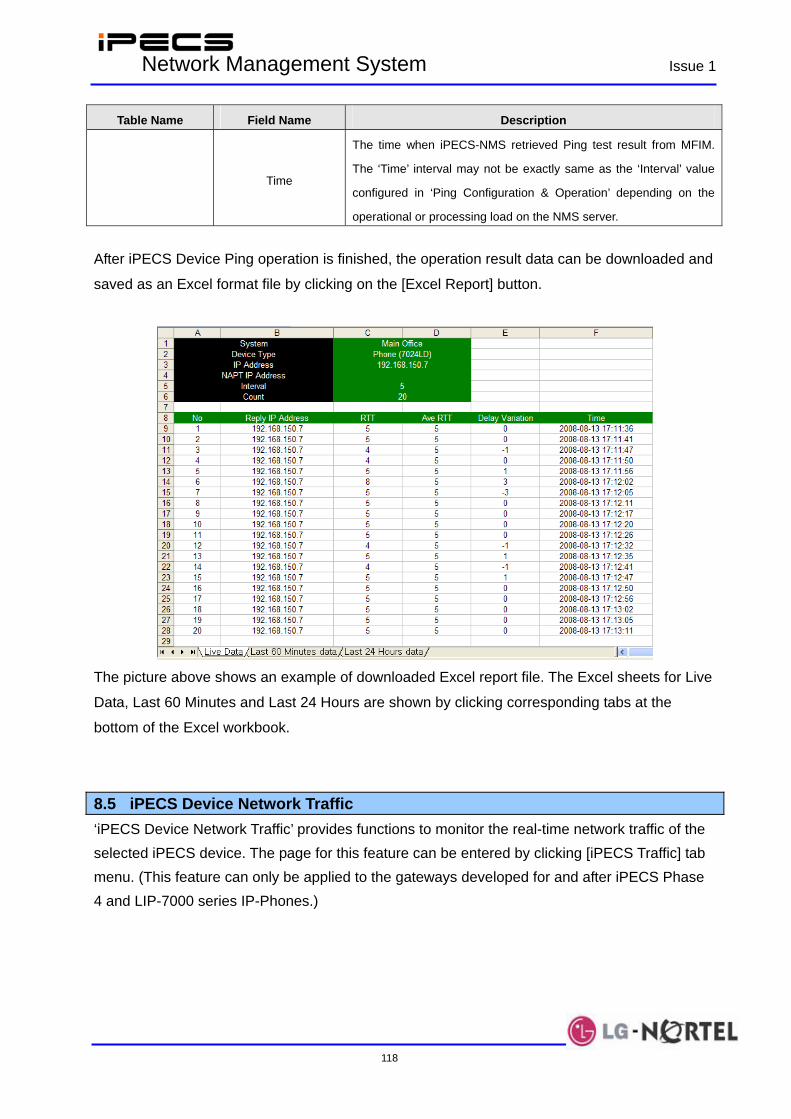
IPECS Network Management System Issue 1
118
Table Name Field Name Description
Time
The time when iPECS-NMS retrieved Ping test result from MFIM.
The ‘Time’ interval may not be exactly same as the ‘Interval’ value
configured in ‘Ping Configuration & Operation’ depending on the
operational or processing load on the NMS server.
After iPECS Device Ping operation is finished, the operation result data can be downloaded and
saved as an Excel format file by clicking on the [Excel Report] button.
The picture above shows an example of downloaded Excel report file. The Excel sheets for Live
Data, Last 60 Minutes and Last 24 Hours are shown by clicking corresponding tabs at the
bottom of the Excel workbook.
8.5 iPECS Device Network Traffic ‘iPECS Device Network Traffic’ provides functions to monitor the real-time network traffic of the selected iPECS device. The page for this feature can be entered by clicking [iPECS Traffic] tab menu. (This feature can only be applied to the gateways developed for and after iPECS Phase 4 and LIP-7000 series IP-Phones.)
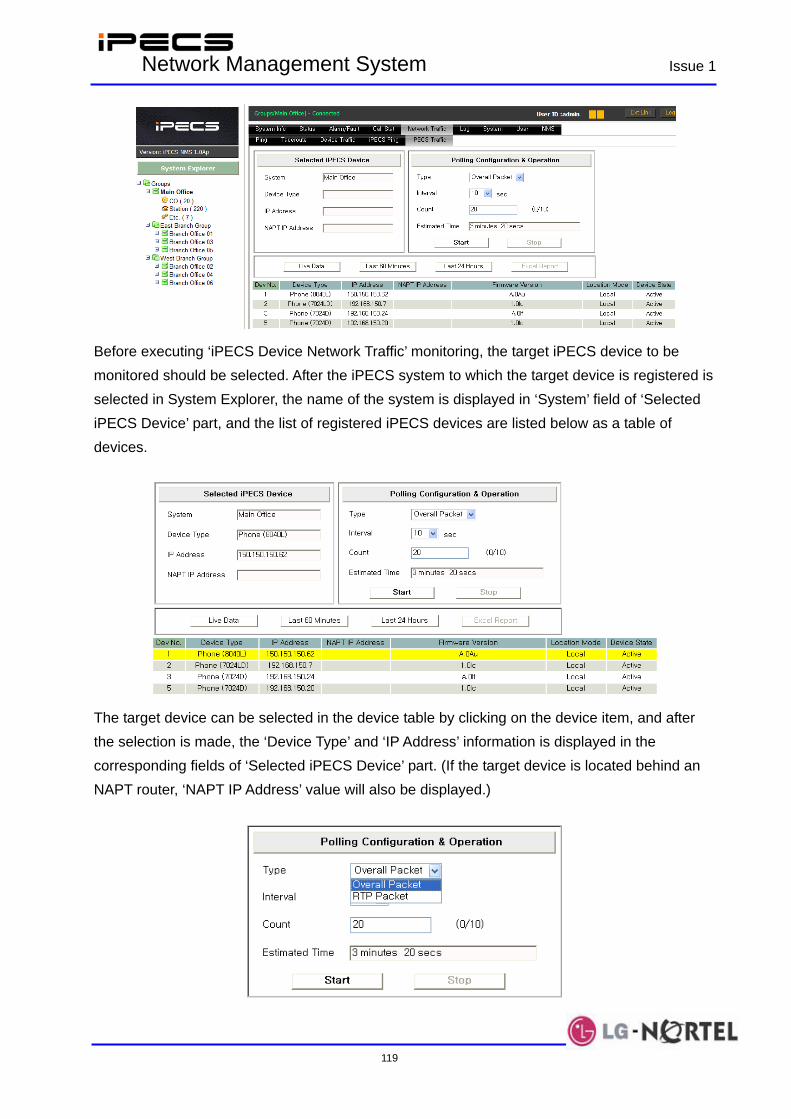
IPECS Network Management System Issue 1
119
Before executing ‘iPECS Device Network Traffic’ monitoring, the target iPECS device to be monitored should be selected. After the iPECS system to which the target device is registered is selected in System Explorer, the name of the system is displayed in ‘System’ field of ‘Selected iPECS Device’ part, and the list of registered iPECS devices are listed below as a table of devices.
The target device can be selected in the device table by clicking on the device item, and after the selection is made, the ‘Device Type’ and ‘IP Address’ information is displayed in the corresponding fields of ‘Selected iPECS Device’ part. (If the target device is located behind an NAPT router, ‘NAPT IP Address’ value will also be displayed.)

IPECS Network Management System Issue 1
120
In order to monitor real-time network traffic of the target device, the interval and count for polling network traffic data should be configured in ‘Polling Configuration & Operation’. For ‘Interval’ field, one of 10, 20, 30 second options can be selected using the combo-box, and ‘Count’ field can have a value between 1~65535. ‘Estimated Time’ field displays an estimated completion time calculated from the values of ‘Interval’ and ‘Count’ fields, and is a read-only field that does not require input from user. For ‘Type’ field, either of ‘Overall Packet’ or ‘RTP Packet’ can be selected. ‘Overall Packet’ means all type of transmitted or received packets, and ‘RTP Packet’ means media packets such as voice or video packets delivered using RTP. After the configuration is completed, network traffic monitoring can be started by clicking [Start] button. If it is needed to stop the traffic monitoring before the traffic polling is finished (before the estimated time), user may click [Stop] button to force the traffic polling to be stopped. After traffic monitoring is started, real-time graph and table that show the result from each traffic polling are displayed below.
The graph in the picture above shows in real time the number of incoming and outgoing packets that occurred during the polling interval, and the traffic table shows the traffic data occurred within the interval as well as the accumulated traffic data. The meanings of the table fields are as follows.
Table Name Field Name Description
In-Interval The number of overall packets received during the time period
configured in ‘Interval’ field of ‘Polling Configuration & Operation’. Overall Packet
Out-Interval The number of overall packets transmitted during the time period
configured in ‘Interval’ field of ‘Polling Configuration & Operation’.
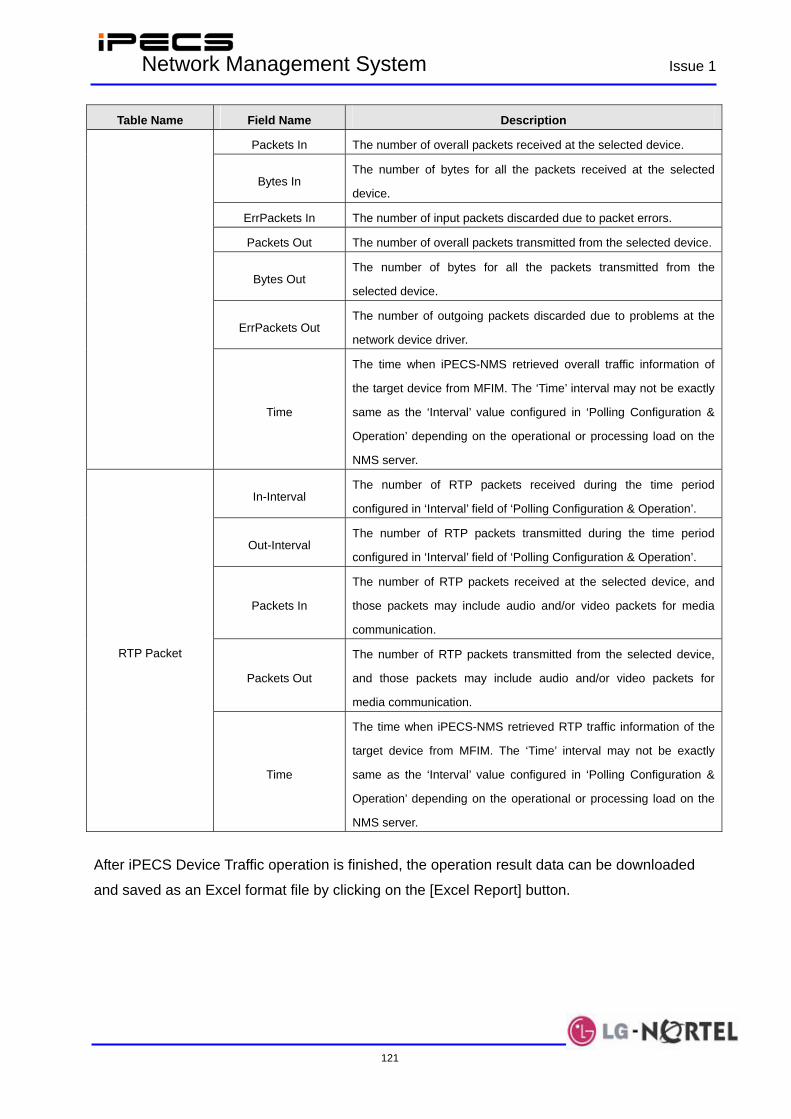
IPECS Network Management System Issue 1
121
Table Name Field Name Description
Packets In The number of overall packets received at the selected device.
Bytes In The number of bytes for all the packets received at the selected
device.
ErrPackets In The number of input packets discarded due to packet errors.
Packets Out The number of overall packets transmitted from the selected device.
Bytes Out The number of bytes for all the packets transmitted from the
selected device.
ErrPackets Out The number of outgoing packets discarded due to problems at the
network device driver.
Time
The time when iPECS-NMS retrieved overall traffic information of
the target device from MFIM. The ‘Time’ interval may not be exactly
same as the ‘Interval’ value configured in ‘Polling Configuration &
Operation’ depending on the operational or processing load on the
NMS server.
In-Interval The number of RTP packets received during the time period
configured in ‘Interval’ field of ‘Polling Configuration & Operation’.
Out-Interval The number of RTP packets transmitted during the time period
configured in ‘Interval’ field of ‘Polling Configuration & Operation’.
Packets In
The number of RTP packets received at the selected device, and
those packets may include audio and/or video packets for media
communication.
Packets Out
The number of RTP packets transmitted from the selected device,
and those packets may include audio and/or video packets for
media communication.
RTP Packet
Time
The time when iPECS-NMS retrieved RTP traffic information of the
target device from MFIM. The ‘Time’ interval may not be exactly
same as the ‘Interval’ value configured in ‘Polling Configuration &
Operation’ depending on the operational or processing load on the
NMS server.
After iPECS Device Traffic operation is finished, the operation result data can be downloaded
and saved as an Excel format file by clicking on the [Excel Report] button.
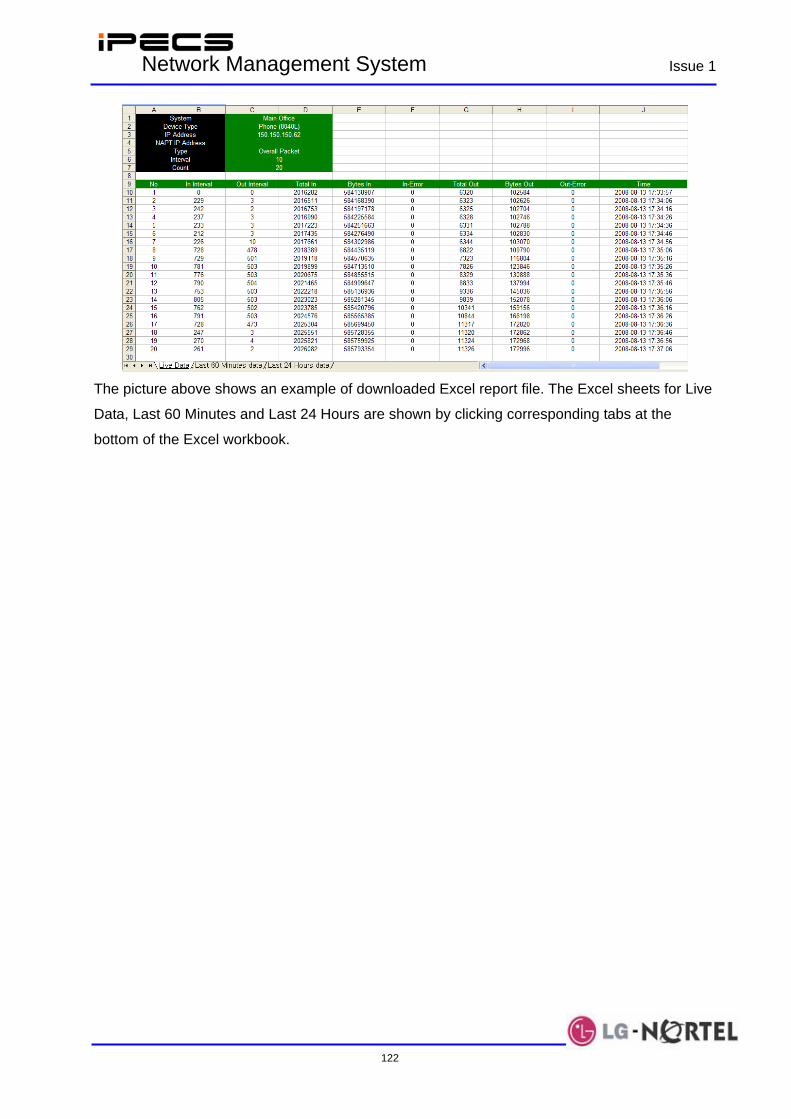
IPECS Network Management System Issue 1
122
The picture above shows an example of downloaded Excel report file. The Excel sheets for Live
Data, Last 60 Minutes and Last 24 Hours are shown by clicking corresponding tabs at the
bottom of the Excel workbook.
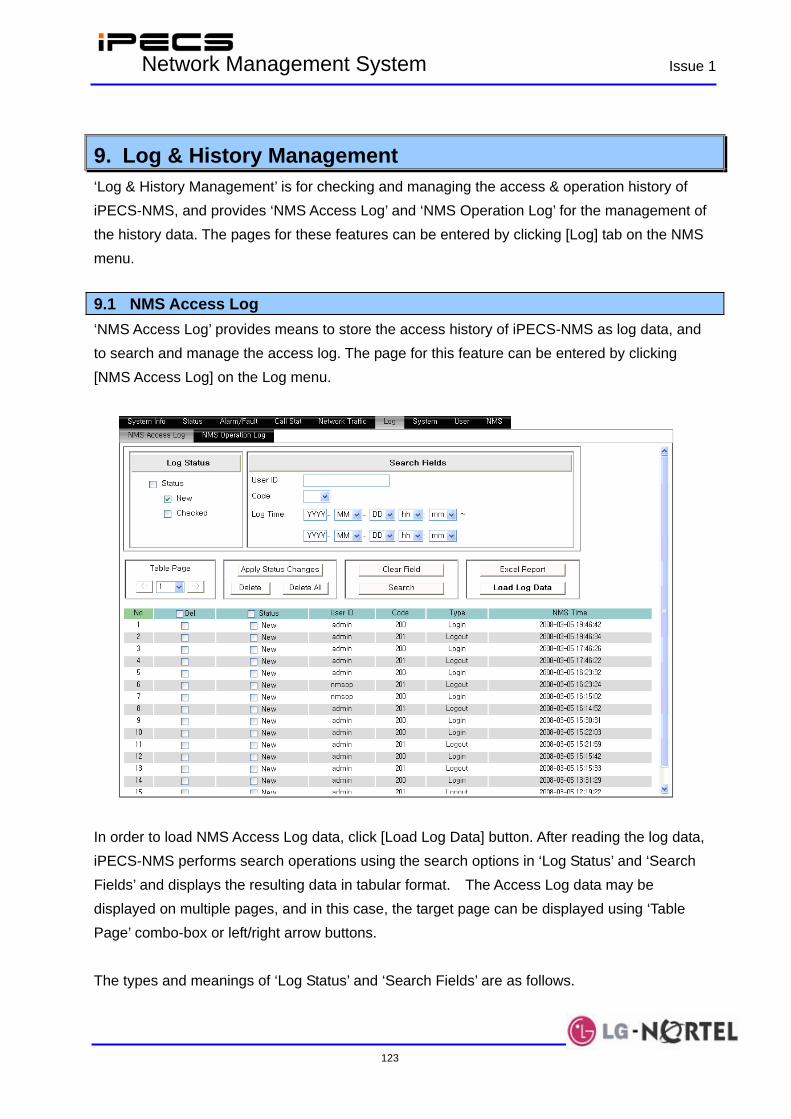
IPECS Network Management System Issue 1
123
9. Log & History Management ‘Log & History Management’ is for checking and managing the access & operation history of iPECS-NMS, and provides ‘NMS Access Log’ and ‘NMS Operation Log’ for the management of the history data. The pages for these features can be entered by clicking [Log] tab on the NMS menu. 9.1 NMS Access Log ‘NMS Access Log’ provides means to store the access history of iPECS-NMS as log data, and to search and manage the access log. The page for this feature can be entered by clicking [NMS Access Log] on the Log menu.
In order to load NMS Access Log data, click [Load Log Data] button. After reading the log data, iPECS-NMS performs search operations using the search options in ‘Log Status’ and ‘Search Fields’ and displays the resulting data in tabular format. The Access Log data may be displayed on multiple pages, and in this case, the target page can be displayed using ‘Table Page’ combo-box or left/right arrow buttons. The types and meanings of ‘Log Status’ and ‘Search Fields’ are as follows.

IPECS Network Management System Issue 1
124
Table Name Field Description
New
‘New’ indicates the log record has not been checked by the administrator. When login or logout event happens on iPECS-NMS, a new log record is generated and stored with ‘New’ status. If this check-box is set for searching, the items with ‘New’ status will be searched.
Log Status
Checked
‘Checked’ indicates the log record has been checked by the administrator. After a new item is checked, the status of the record is changed to the ‘Checked’ status and saved. If this check-box is set for searching, the items with ‘Checked’ status will be searched.
User ID This field is for entering target User ID to be used for searching. If this field has no value (blank), iPECS-NMS ignores this field and searches for all User IDs.
Code
This field is for entering the code number of target log type as follows. - 200 (Login) : User logged in to iPECS-NMS - 201 (Logout) : User logged out from iPECS-NMS If this field has no value (blank), iPECS-NMS ignores this field and searches for all code types.
Search Fields
Log Time This field is for entering the time or time range when the login/logout events occurred. If this field has no value (remains as blank), iPECS-NMS ignores this field and searches for all time periods.
After modifying the field values of ‘Log Status’ and ‘Search Fields’, a new search can be performed by clicking [Search], and the search results display in the log table. For ‘Log Time’ field, all date/time fields can be entered. However, the user may skip entering the fields from the rightmost fields. In other words, date/time fields may be entered from the left and stopped leaving right side fields blanks. The example above shows the configuration and its search result for the log data of all status (both ‘New’ & ‘Checked’) that happened between March 1, 2008 – March 5, 2008 where user ID is ‘nmsop’ and the code number is ‘200’ (Login).

IPECS Network Management System Issue 1
125
In order to change the status of a log item to ‘Checked’, click the check-box in ‘Status’ field of the target record, and click [Apply Status Changes] to save and apply the change of status. If ‘New’ check-box is clicked, the status is changed to ‘Checked’, and if clicked again, it will be changed back to ‘New’.
In order to delete a target log item, select the item by clicking the check-box in ‘Del’ field, and then click [Delete Selected Events]. Or, if all the searched data is to be deleted, click [Delete All] button.
The log data currently listed in the log table can be downloaded and saved as Excel formatted file by clicking [Excel Report].
The above is an example of downloaded Excel report file.
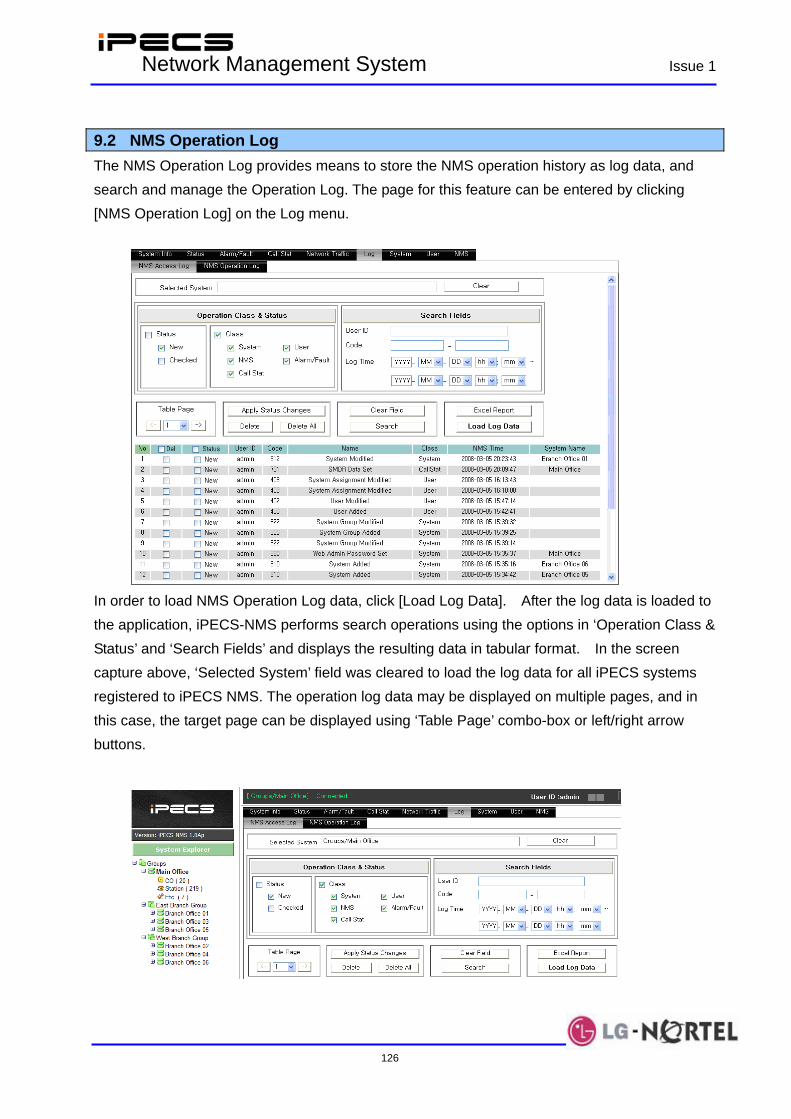
IPECS Network Management System Issue 1
126
9.2 NMS Operation Log The NMS Operation Log provides means to store the NMS operation history as log data, and search and manage the Operation Log. The page for this feature can be entered by clicking [NMS Operation Log] on the Log menu.
In order to load NMS Operation Log data, click [Load Log Data]. After the log data is loaded to the application, iPECS-NMS performs search operations using the options in ‘Operation Class & Status’ and ‘Search Fields’ and displays the resulting data in tabular format. In the screen capture above, ‘Selected System’ field was cleared to load the log data for all iPECS systems registered to iPECS NMS. The operation log data may be displayed on multiple pages, and in this case, the target page can be displayed using ‘Table Page’ combo-box or left/right arrow buttons.
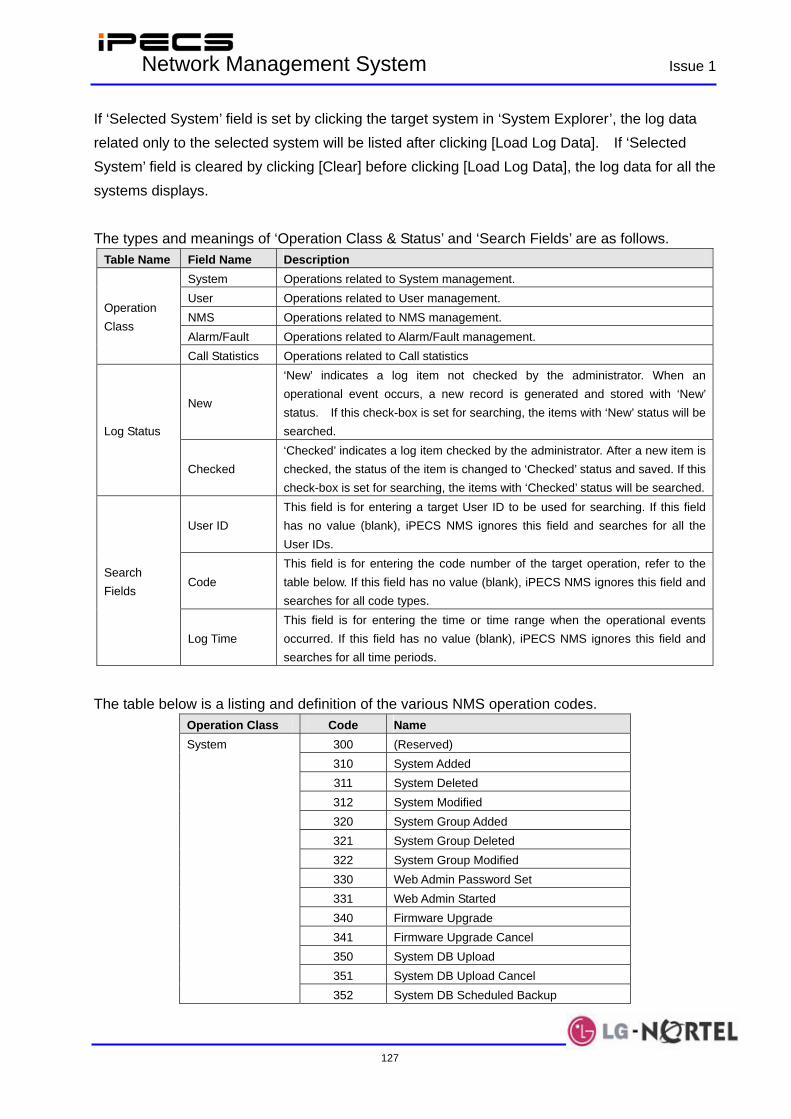
IPECS Network Management System Issue 1
127
If ‘Selected System’ field is set by clicking the target system in ‘System Explorer’, the log data related only to the selected system will be listed after clicking [Load Log Data]. If ‘Selected System’ field is cleared by clicking [Clear] before clicking [Load Log Data], the log data for all the systems displays. The types and meanings of ‘Operation Class & Status’ and ‘Search Fields’ are as follows.
Table Name Field Name Description System Operations related to System management. User Operations related to User management. NMS Operations related to NMS management. Alarm/Fault Operations related to Alarm/Fault management.
Operation Class
Call Statistics Operations related to Call statistics
New
‘New’ indicates a log item not checked by the administrator. When an operational event occurs, a new record is generated and stored with ‘New’ status. If this check-box is set for searching, the items with ‘New’ status will be searched. Log Status
Checked ‘Checked’ indicates a log item checked by the administrator. After a new item is checked, the status of the item is changed to ‘Checked’ status and saved. If this check-box is set for searching, the items with ‘Checked’ status will be searched.
User ID This field is for entering a target User ID to be used for searching. If this field has no value (blank), iPECS NMS ignores this field and searches for all the User IDs.
Code This field is for entering the code number of the target operation, refer to the table below. If this field has no value (blank), iPECS NMS ignores this field and searches for all code types.
Search Fields
Log Time This field is for entering the time or time range when the operational events occurred. If this field has no value (blank), iPECS NMS ignores this field and searches for all time periods.
The table below is a listing and definition of the various NMS operation codes.
Operation Class Code Name 300 (Reserved) 310 System Added 311 System Deleted 312 System Modified 320 System Group Added 321 System Group Deleted 322 System Group Modified 330 Web Admin Password Set 331 Web Admin Started 340 Firmware Upgrade 341 Firmware Upgrade Cancel 350 System DB Upload 351 System DB Upload Cancel
System
352 System DB Scheduled Backup
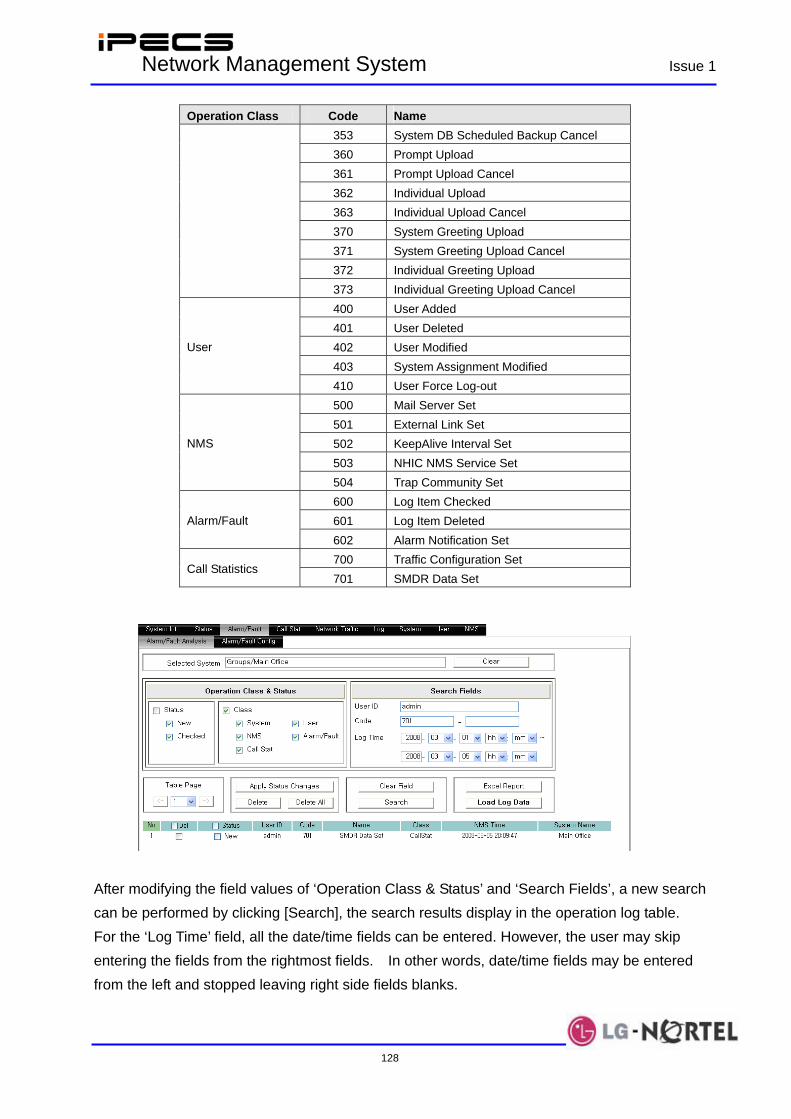
IPECS Network Management System Issue 1
128
Operation Class Code Name 353 System DB Scheduled Backup Cancel 360 Prompt Upload 361 Prompt Upload Cancel 362 Individual Upload 363 Individual Upload Cancel 370 System Greeting Upload 371 System Greeting Upload Cancel 372 Individual Greeting Upload 373 Individual Greeting Upload Cancel 400 User Added 401 User Deleted 402 User Modified 403 System Assignment Modified
User
410 User Force Log-out 500 Mail Server Set 501 External Link Set 502 KeepAlive Interval Set 503 NHIC NMS Service Set
NMS
504 Trap Community Set 600 Log Item Checked 601 Log Item Deleted Alarm/Fault 602 Alarm Notification Set 700 Traffic Configuration Set
Call Statistics 701 SMDR Data Set
After modifying the field values of ‘Operation Class & Status’ and ‘Search Fields’, a new search can be performed by clicking [Search], the search results display in the operation log table. For the ‘Log Time’ field, all the date/time fields can be entered. However, the user may skip entering the fields from the rightmost fields. In other words, date/time fields may be entered from the left and stopped leaving right side fields blanks.

IPECS Network Management System Issue 1
129
The example above shows the configuration and results for the Main Office’s log data for any status and all operation classes between March 1, 2008 – March 5, 2008 where user ID is ‘admin’ and the code number is ‘701’ (SMDR Data Set).
In order to change the status of a log item to ‘New’, click on the check-box in ‘Status’ field of the target record, and then click [Apply Status Changes] to save and apply the change of status. If ‘New’ check-box is clicked, the status is changed to ‘Checked’, and if clicked again, it will be changed back to ‘New’ status.
In order to delete a target log item, select the item by clicking the check-box in ‘Del’ field, and then click [Delete Selected Events] button to delete the selected item. Or, if all search data is to be deleted, click [Delete All] button.
The log data currently listed on the log table can be downloaded and saved as Excel formatted file by clicking [Excel Report] button.
The picture above shows an example of downloaded Excel report file.
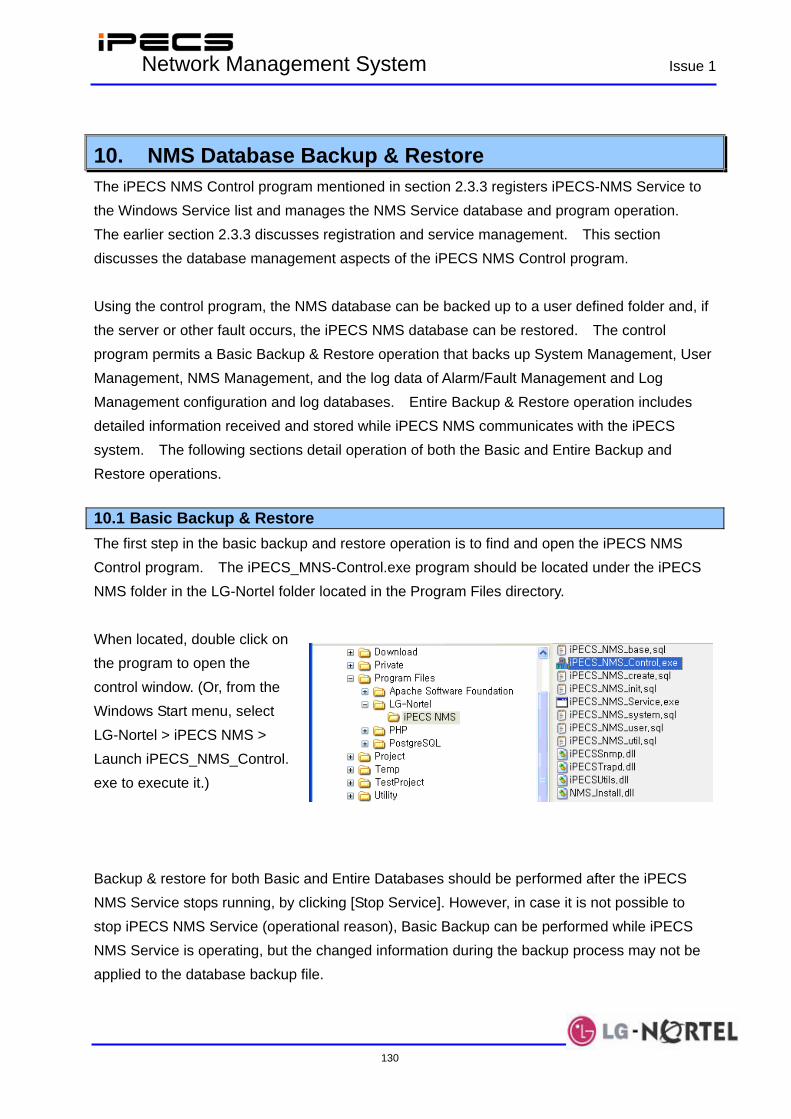
IPECS Network Management System Issue 1
130
10. NMS Database Backup & Restore The iPECS NMS Control program mentioned in section 2.3.3 registers iPECS-NMS Service to the Windows Service list and manages the NMS Service database and program operation. The earlier section 2.3.3 discusses registration and service management. This section discusses the database management aspects of the iPECS NMS Control program. Using the control program, the NMS database can be backed up to a user defined folder and, if the server or other fault occurs, the iPECS NMS database can be restored. The control program permits a Basic Backup & Restore operation that backs up System Management, User Management, NMS Management, and the log data of Alarm/Fault Management and Log Management configuration and log databases. Entire Backup & Restore operation includes detailed information received and stored while iPECS NMS communicates with the iPECS system. The following sections detail operation of both the Basic and Entire Backup and Restore operations. 10.1 Basic Backup & Restore The first step in the basic backup and restore operation is to find and open the iPECS NMS Control program. The iPECS_MNS-Control.exe program should be located under the iPECS NMS folder in the LG-Nortel folder located in the Program Files directory. When located, double click on the program to open the control window. (Or, from the Windows Start menu, select LG-Nortel > iPECS NMS > Launch iPECS_NMS_Control. exe to execute it.) Backup & restore for both Basic and Entire Databases should be performed after the iPECS NMS Service stops running, by clicking [Stop Service]. However, in case it is not possible to stop iPECS NMS Service (operational reason), Basic Backup can be performed while iPECS NMS Service is operating, but the changed information during the backup process may not be applied to the database backup file.

IPECS Network Management System Issue 1
131
10.1.1 Basic Backup Operation
After starting the iPECS NMS Control program and stopping the iPECS NMS Service, a backup may be created. To create the backup, browse to the desired backup location and enter the file name to use for the backup file, and click [Backup]. A DOS command prompt may appear during the creation of the backup file.
After complete, check the target folder and assure a backup copy was made. Then, restart the iPECS NMS Service by clicking [Start Service] on the control program, and end the iPECS NMS Control program by selecting [Close]. 10.1.2 Basic Restore Operation
As with the Basic backup operation, the iPECS NMS Control program must be started (refer to Section 9.1). In addition, it is necessary to create an empty database by first unloading the service and deleting the existing NMS basic database. Then the empty database is created and the service is loaded, which allows the database backup file to be restored. This is required in case the existing database is corrupted and assures the corruption will not affect the restored database.

IPECS Network Management System Issue 1
132
First open the iPECS NMS Control program window, locate the control .exe file in the LG-Nortel folder in the Program Files directory and double click on the file. This will open the control window. Once the window opens, click [Unload Service] to stop and unregister the service with Windows Service list. After the service is unregistered, the [Delete Database] control activates, click the [Delete Database] control, which removes the existing database. Once the database is deleted, create a new empty database by clicking the [Create Database] control. Now the database backup file can be restored safely to iPECS NMS. Browse to the location and select the backup file, then click [Open]. Click the now active [Start Service & Restore] control, which will load the backup database and restart the iPECS NMS Service program.

IPECS Network Management System Issue 1
133
Before restoration begins, you will be asked to enter the PostgreSQL password entered when the program was first loaded, refer to section 2.2.2.1. Enter the password to complete the restoration process. The database is restored to match the Backup database and iPECS NMS Service is loaded and restarted. Click [Close] to close the iPECS NMS Control program. 10.2 Entire Backup & Restore The first step in entire database backup and restore operation is to open the iPECS NMS Control program and stop and unregister the service program with the Windows Service list. The iPECS_MNS_Control.exe program should be located under the iPECS NMS folder in the LG-Nortel folder located in the Program Files directory. When located, double click on the program to open the control window. (Or, from the Windows Start menu, select LG-Nortel > iPECS NMS > Launch iPECS_NMS_Control.exe to execute it.) In the control window, select [Unload Service], which will stop and unregister the iPECS NMS Service program.
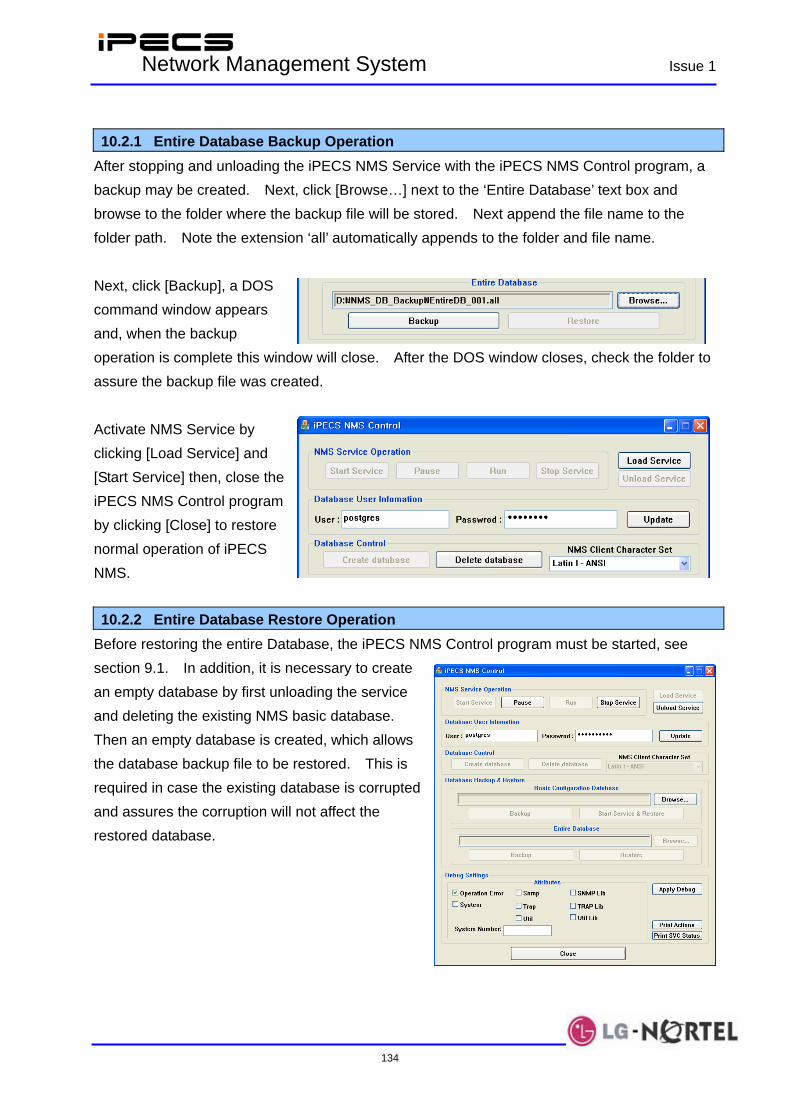
IPECS Network Management System Issue 1
134
10.2.1 Entire Database Backup Operation
After stopping and unloading the iPECS NMS Service with the iPECS NMS Control program, a backup may be created. Next, click [Browse…] next to the ‘Entire Database’ text box and browse to the folder where the backup file will be stored. Next append the file name to the folder path. Note the extension ‘all’ automatically appends to the folder and file name. Next, click [Backup], a DOS command window appears and, when the backup operation is complete this window will close. After the DOS window closes, check the folder to assure the backup file was created. Activate NMS Service by clicking [Load Service] and [Start Service] then, close the iPECS NMS Control program by clicking [Close] to restore normal operation of iPECS NMS. 10.2.2 Entire Database Restore Operation
Before restoring the entire Database, the iPECS NMS Control program must be started, see section 9.1. In addition, it is necessary to create an empty database by first unloading the service and deleting the existing NMS basic database. Then an empty database is created, which allows the database backup file to be restored. This is required in case the existing database is corrupted and assures the corruption will not affect the restored database.

IPECS Network Management System Issue 1
135
To open the control program, locate iPECS NMS Control program in the LG-Nortel folder of the Program files directory and double click the file. (Or, from the Windows Start menu, select LG-Nortel > iPECS NMS > Launch iPECS_NMS_Control.exe to execute it.) Once the window opens, click [Unload Service] to stop and unregister the service with Windows Service list. After the service is unloaded, the [Delete Database] control activates, click the [Delete Database] control, which removes the existing database. Once the database is deleted, create a new empty database by clicking the [Create Database] control.

IPECS Network Management System Issue 1
136
Now the Entire Database backup file can be restored safely to iPECS NMS. Browse to or enter the location and name of the backup file. Click the now active [Restore] control, which will load the backup database. Before restoration begins, you will be asked to enter the PostgreSQL password that was entered when the program was first loaded, refer to section 2.2.2.1. Enter the password to complete the restoration process. The database is restored to match the Backup database. Click [Load Service] and [Start Service] to activate iPECS NMS Service. Click [Close] to close the iPECS NMS Control program.

IPECS NMS Feature Description & Operation Issue 1
A-1-1
Appendix 1 iPECS System Set-up for NMS Before registering iPECS systems in iPECS-NMS, the iPECS system should be configured for NMS operation. Login to iPECS Web Admin, refer to the iPECS Administration & Maintenance Manual. Select SNMP Attribute (PGM 196) from System Data group to enter the NMS Configuration screen.
SNMP Attributes, as shown on the screen, are divided into three categories: SNMP Agent, SNMP Security, and SNMP Trap. The SNMP Agent field, SNMP Service enables the SNMP agent running in the iPECS Call Server. The SNMP port field defines the udp port used for communications from the iPECS system for SNMP messages. This port should not be changed.
In SNMP Security are the Read Only and Read Write SNMP Community fields, 4 to 16 characters. The SNMP community designates an SNMP communication group to which an SNMP message belongs, and is also a logical relationship between the SNMP agent (iPECS
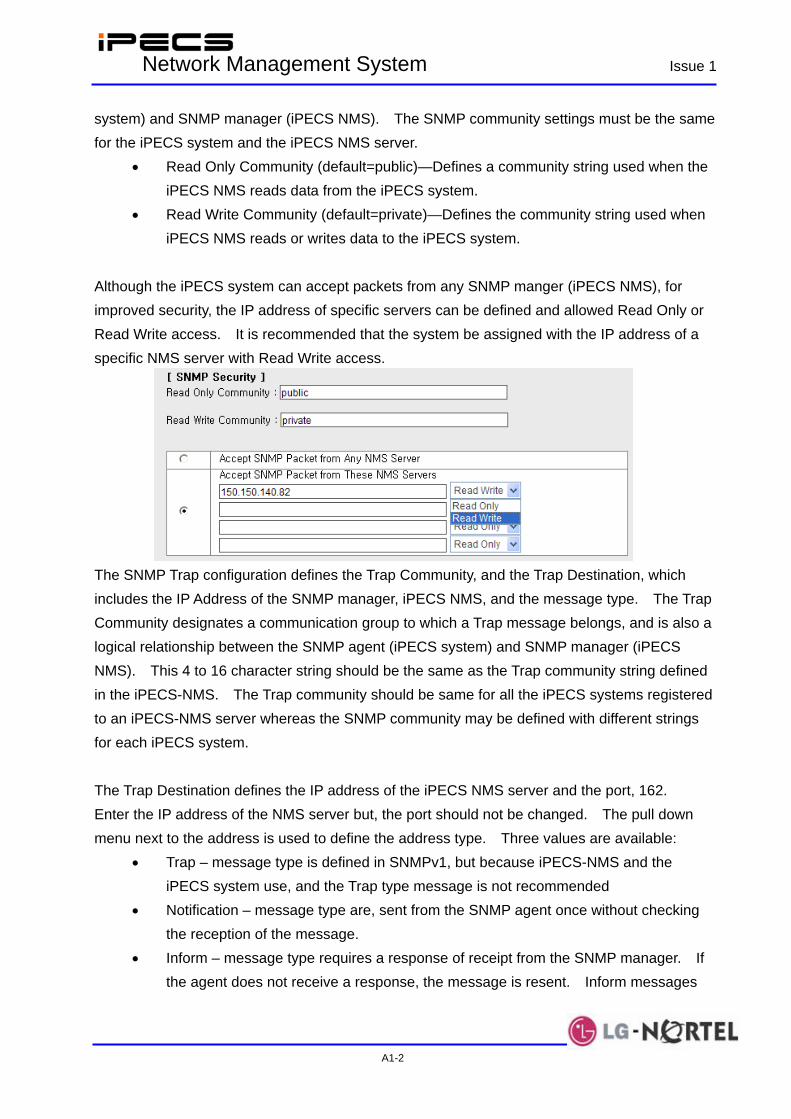
IPECS Network Management System Issue 1
A1-2
system) and SNMP manager (iPECS NMS). The SNMP community settings must be the same for the iPECS system and the iPECS NMS server.
• Read Only Community (default=public)—Defines a community string used when the iPECS NMS reads data from the iPECS system.
• Read Write Community (default=private)—Defines the community string used when iPECS NMS reads or writes data to the iPECS system.
Although the iPECS system can accept packets from any SNMP manger (iPECS NMS), for improved security, the IP address of specific servers can be defined and allowed Read Only or Read Write access. It is recommended that the system be assigned with the IP address of a specific NMS server with Read Write access.
The SNMP Trap configuration defines the Trap Community, and the Trap Destination, which includes the IP Address of the SNMP manager, iPECS NMS, and the message type. The Trap Community designates a communication group to which a Trap message belongs, and is also a logical relationship between the SNMP agent (iPECS system) and SNMP manager (iPECS NMS). This 4 to 16 character string should be the same as the Trap community string defined in the iPECS-NMS. The Trap community should be same for all the iPECS systems registered to an iPECS-NMS server whereas the SNMP community may be defined with different strings for each iPECS system. The Trap Destination defines the IP address of the iPECS NMS server and the port, 162. Enter the IP address of the NMS server but, the port should not be changed. The pull down menu next to the address is used to define the address type. Three values are available:
• Trap – message type is defined in SNMPv1, but because iPECS-NMS and the iPECS system use, and the Trap type message is not recommended
• Notification – message type are, sent from the SNMP agent once without checking the reception of the message.
• Inform – message type requires a response of receipt from the SNMP manager. If the agent does not receive a response, the message is resent. Inform messages
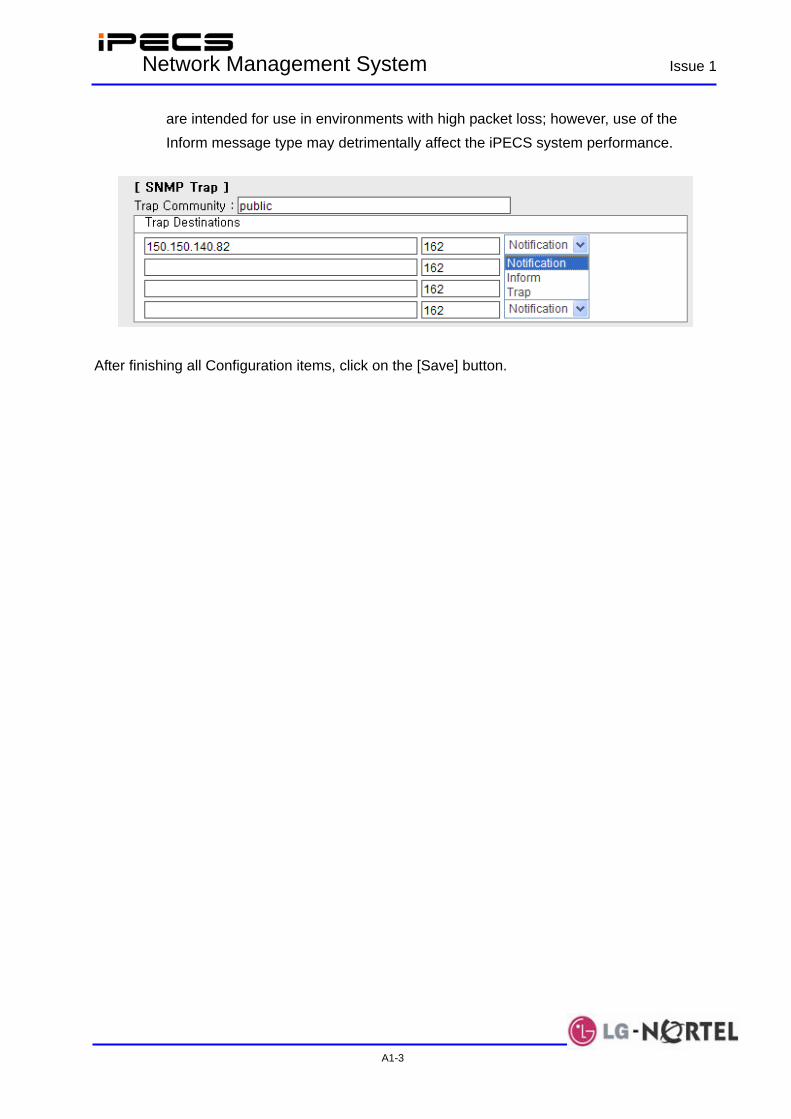
IPECS Network Management System Issue 1
A1-3
are intended for use in environments with high packet loss; however, use of the Inform message type may detrimentally affect the iPECS system performance.
After finishing all Configuration items, click on the [Save] button.

IPECS NMS Feature Description & Operation Issue 1
A2-1
Appendix 2 iPECS System Information View iPECS NMS logs three types of events, Alarm, Fault and System. Each event is classified as critical, major or minor and is referenced with a code. Events logged in iPECS NMS are listed below. Alarm events, Codes 100 ~ 399 Code Name Type Level Location State Description
ON
< CPU Overload Occurred >
Occurred when CPU usage rate becomes
higher than 80%.
* Detailed Information : CPU performance
availability
- “CPU Idle 15%” 101 CPU Overload Alarm MAJ MFIM
OFF
< CPU Overload Cleared >
Occurred when CPU usage rate becomes less
than 80%.
* Detailed Information : CPU performance
availability
- “CPU Idle 25%”
ON
< Interface Link Down >
Occurred when the status of the network
interface (e.g. eth0, eth1, wan0) of MFIM
becomes Down.
* Detailed Information : Network interface name
- “eth0” 103 Link Up/Down Alarm CRI I/F(#)
OFF
< Interface Link Up >
Occurred when the status of the network
interface (e.g. eth0, eth1, wan0) of MFIM
becomes Up.
* Detailed Information : Network interface name
- “eth0”
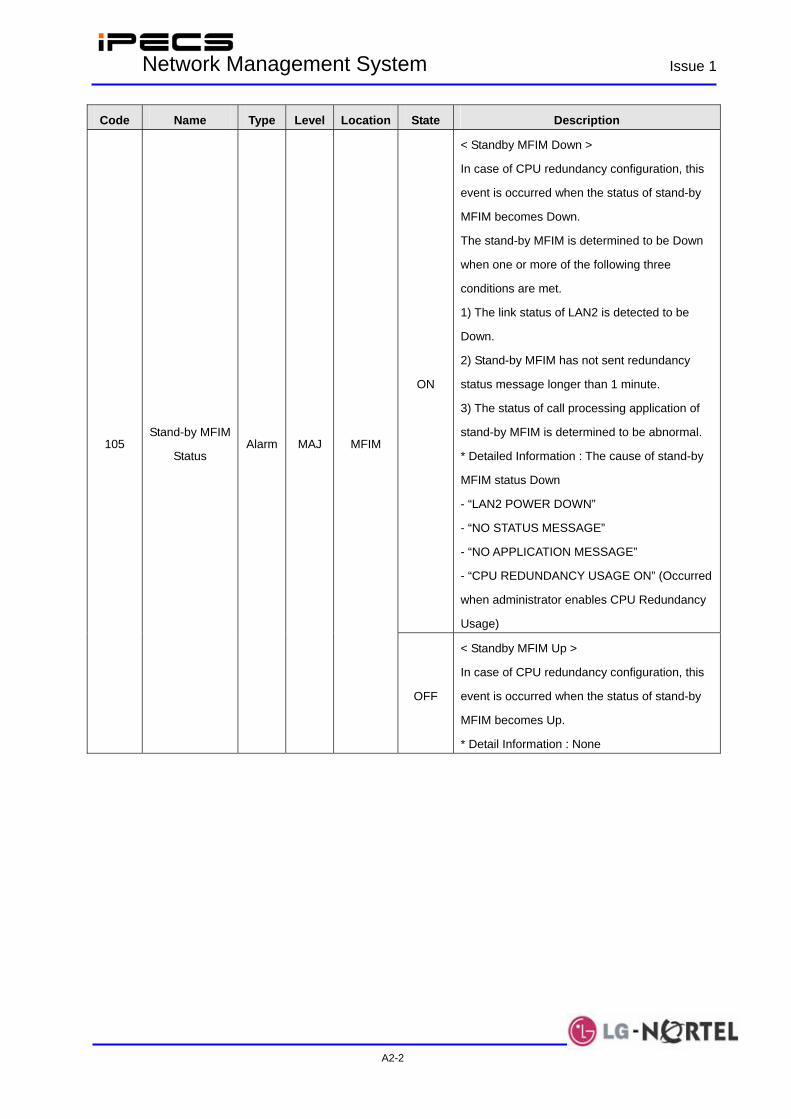
IPECS Network Management System Issue 1
A2-2
Code Name Type Level Location State Description
ON
< Standby MFIM Down >
In case of CPU redundancy configuration, this
event is occurred when the status of stand-by
MFIM becomes Down.
The stand-by MFIM is determined to be Down
when one or more of the following three
conditions are met.
1) The link status of LAN2 is detected to be
Down.
2) Stand-by MFIM has not sent redundancy
status message longer than 1 minute.
3) The status of call processing application of
stand-by MFIM is determined to be abnormal.
* Detailed Information : The cause of stand-by
MFIM status Down
- “LAN2 POWER DOWN”
- “NO STATUS MESSAGE”
- “NO APPLICATION MESSAGE”
- “CPU REDUNDANCY USAGE ON” (Occurred
when administrator enables CPU Redundancy
Usage)
105 Stand-by MFIM
Status Alarm MAJ MFIM
OFF
< Standby MFIM Up >
In case of CPU redundancy configuration, this
event is occurred when the status of stand-by
MFIM becomes Up.
* Detail Information : None

IPECS Network Management System Issue 1
A2-3
Code Name Type Level Location State Description
ON
< Device Down >
Occurred when a device becomes
disconnected from MFIM.
This event may occur when
- the device is powered off,
- the device is restarted (reset),
- the network connection between the device
and MFIM is abnormal or not stable,
- MFIM does not properly communicate with
the device.
* Detailed Information : None
201 Device
Up/Down Alarm CRI DEV(#)
OFF
< Device Up >
Occurred when a device becomes connected
to MFIM.
* Detailed Information : None
ON
< Station Locked up >
Occurred when a station has gone off-hook
under none-conversation state until howler tone
is received.
* Detailed Information : None 205 Station
Lock/Unlock Alarm MIN STA(#)
OFF
< Station Unlocked >
Occurred when the locked station becomes on-
hook.
* Detailed Information : None
211
SMDR
Memory
Capacity
Alarm MAJ MFIM ON
< SMDR Memory Full Occurred >
Occurred when the memory space for SMDR
data becomes full.
(SMDR Memory Capacity Full is the state that
the memory space remains available for less
than 50 SMDR records.)
* Detailed Information : None
* Related Attendant Alarm : SMDR BUFFER
FULL
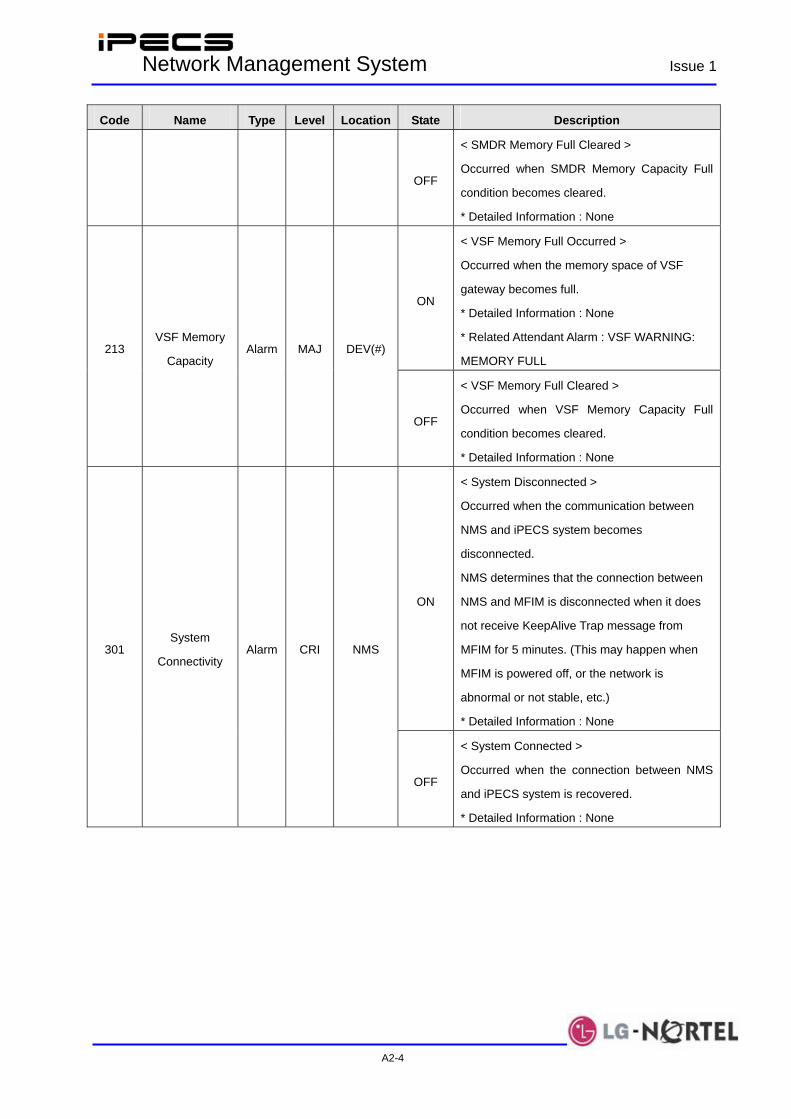
IPECS Network Management System Issue 1
A2-4
Code Name Type Level Location State Description
OFF
< SMDR Memory Full Cleared >
Occurred when SMDR Memory Capacity Full
condition becomes cleared.
* Detailed Information : None
ON
< VSF Memory Full Occurred >
Occurred when the memory space of VSF
gateway becomes full.
* Detailed Information : None
* Related Attendant Alarm : VSF WARNING:
MEMORY FULL 213
VSF Memory
Capacity Alarm MAJ DEV(#)
OFF
< VSF Memory Full Cleared >
Occurred when VSF Memory Capacity Full
condition becomes cleared.
* Detailed Information : None
ON
< System Disconnected >
Occurred when the communication between
NMS and iPECS system becomes
disconnected.
NMS determines that the connection between
NMS and MFIM is disconnected when it does
not receive KeepAlive Trap message from
MFIM for 5 minutes. (This may happen when
MFIM is powered off, or the network is
abnormal or not stable, etc.)
* Detailed Information : None
301 System
Connectivity Alarm CRI NMS
OFF
< System Connected >
Occurred when the connection between NMS
and iPECS system is recovered.
* Detailed Information : None
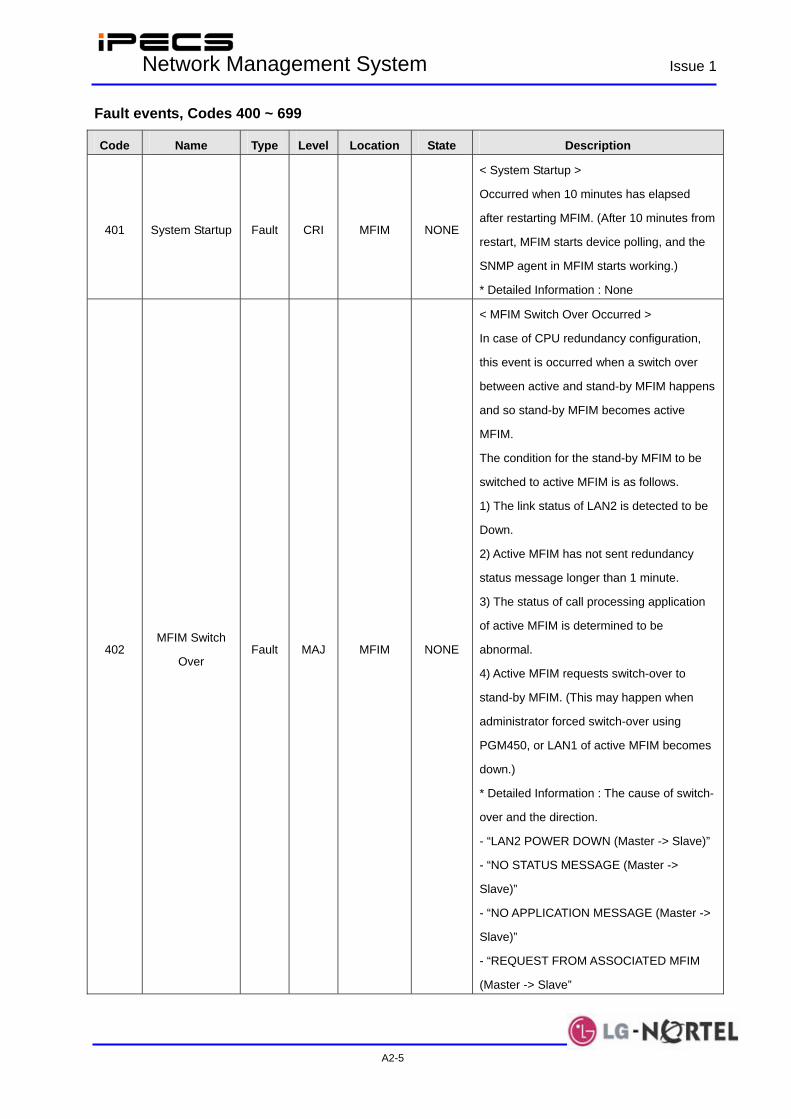
IPECS Network Management System Issue 1
A2-5
Fault events, Codes 400 ~ 699
Code Name Type Level Location State Description
401 System Startup Fault CRI MFIM NONE
< System Startup >
Occurred when 10 minutes has elapsed
after restarting MFIM. (After 10 minutes from
restart, MFIM starts device polling, and the
SNMP agent in MFIM starts working.)
* Detailed Information : None
402 MFIM Switch
Over Fault MAJ MFIM NONE
< MFIM Switch Over Occurred >
In case of CPU redundancy configuration,
this event is occurred when a switch over
between active and stand-by MFIM happens
and so stand-by MFIM becomes active
MFIM.
The condition for the stand-by MFIM to be
switched to active MFIM is as follows.
1) The link status of LAN2 is detected to be
Down.
2) Active MFIM has not sent redundancy
status message longer than 1 minute.
3) The status of call processing application
of active MFIM is determined to be
abnormal.
4) Active MFIM requests switch-over to
stand-by MFIM. (This may happen when
administrator forced switch-over using
PGM450, or LAN1 of active MFIM becomes
down.)
* Detailed Information : The cause of switch-
over and the direction.
- “LAN2 POWER DOWN (Master -> Slave)”
- “NO STATUS MESSAGE (Master ->
Slave)”
- “NO APPLICATION MESSAGE (Master ->
Slave)”
- “REQUEST FROM ASSOCIATED MFIM
(Master -> Slave”

IPECS Network Management System Issue 1
A2-6
Code Name Type Level Location State Description
< SNMP Auth Failure >
Occurred when the community string of
received SNMP message is different from
the one configured in MFIM.
* Detailed Information : The IP address of
the host that sent the SNMP message with
invalid community string.
< HTTP Auth Failure >
Occurred when Web Admin is accessed
using invalid password.
* Detailed Information : The IP address of
the host that accessed Web Admin using
invalid password.
< Remote Auth Failure >
Occurred when a remote Telnet connection
is tried using invalid password.
* Detailed Information : The IP address of
the host that tried remote connection using
invalid password.
< Terminal Auth Failure >
Occurred when serial terminal login (via RS-
232 serial connection or Telnet connection
after remote login) is tried using invalid
password.
* Detailed Information : The IP address of
the host that used invalid password, or
COM1(Serial).
403 Authentication
Failure Fault MIN MFIM NONE
< Keyset Auth Failure >
Occurred when Keyset Admin is accessed
using invalid password.
* Detailed Information : The station number
of the station used to access Keyset Admin
using invalid password.
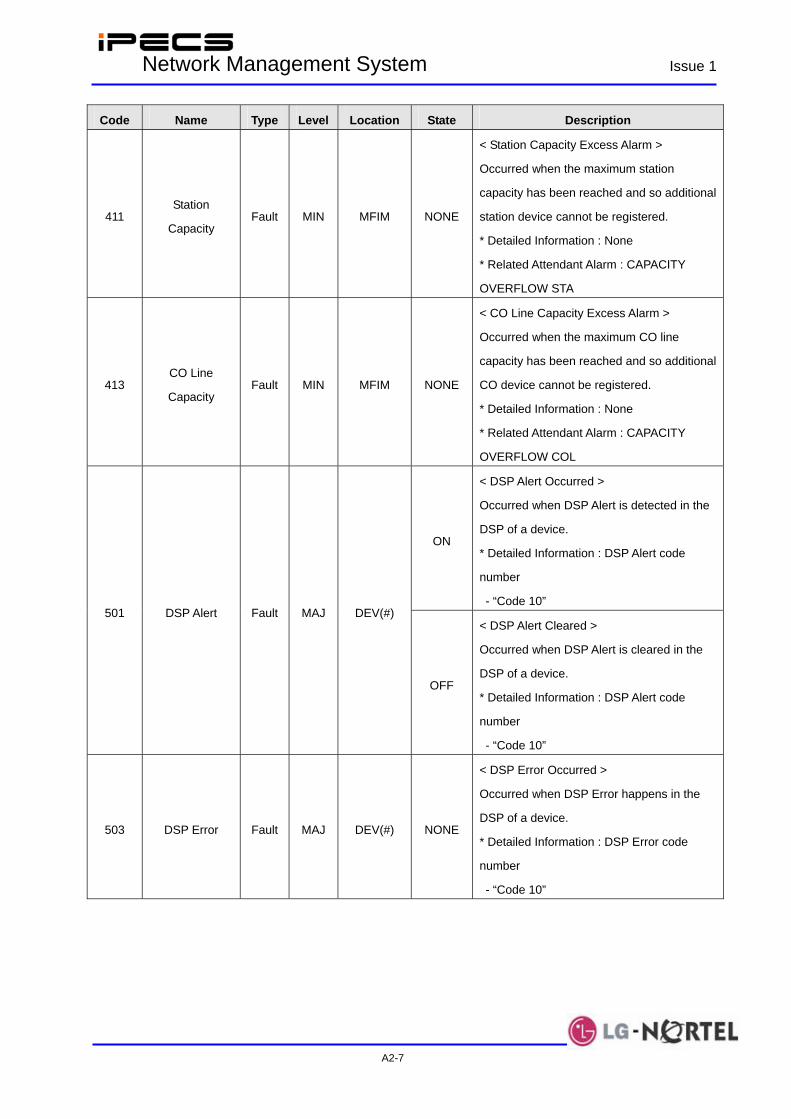
IPECS Network Management System Issue 1
A2-7
Code Name Type Level Location State Description
411 Station
Capacity Fault MIN MFIM NONE
< Station Capacity Excess Alarm >
Occurred when the maximum station
capacity has been reached and so additional
station device cannot be registered.
* Detailed Information : None
* Related Attendant Alarm : CAPACITY
OVERFLOW STA
413 CO Line
Capacity Fault MIN MFIM NONE
< CO Line Capacity Excess Alarm >
Occurred when the maximum CO line
capacity has been reached and so additional
CO device cannot be registered.
* Detailed Information : None
* Related Attendant Alarm : CAPACITY
OVERFLOW COL
ON
< DSP Alert Occurred >
Occurred when DSP Alert is detected in the
DSP of a device.
* Detailed Information : DSP Alert code
number
- “Code 10” 501 DSP Alert Fault MAJ DEV(#)
OFF
< DSP Alert Cleared >
Occurred when DSP Alert is cleared in the
DSP of a device.
* Detailed Information : DSP Alert code
number
- “Code 10”
503 DSP Error Fault MAJ DEV(#) NONE
< DSP Error Occurred >
Occurred when DSP Error happens in the
DSP of a device.
* Detailed Information : DSP Error code
number
- “Code 10”
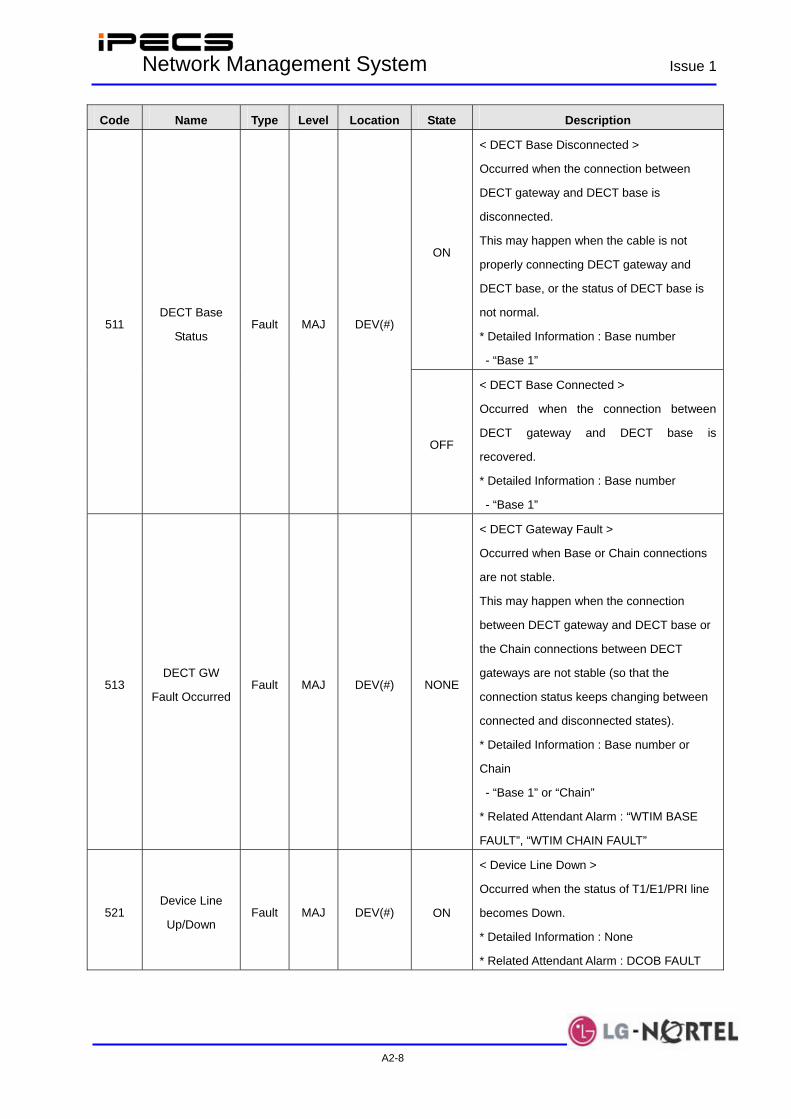
IPECS Network Management System Issue 1
A2-8
Code Name Type Level Location State Description
ON
< DECT Base Disconnected >
Occurred when the connection between
DECT gateway and DECT base is
disconnected.
This may happen when the cable is not
properly connecting DECT gateway and
DECT base, or the status of DECT base is
not normal.
* Detailed Information : Base number
- “Base 1”
511 DECT Base
Status Fault MAJ DEV(#)
OFF
< DECT Base Connected >
Occurred when the connection between
DECT gateway and DECT base is
recovered.
* Detailed Information : Base number
- “Base 1”
513 DECT GW
Fault Occurred Fault MAJ DEV(#) NONE
< DECT Gateway Fault >
Occurred when Base or Chain connections
are not stable.
This may happen when the connection
between DECT gateway and DECT base or
the Chain connections between DECT
gateways are not stable (so that the
connection status keeps changing between
connected and disconnected states).
* Detailed Information : Base number or
Chain
- “Base 1” or “Chain”
* Related Attendant Alarm : “WTIM BASE
FAULT”, “WTIM CHAIN FAULT”
521 Device Line
Up/Down Fault MAJ DEV(#) ON
< Device Line Down >
Occurred when the status of T1/E1/PRI line
becomes Down.
* Detailed Information : None
* Related Attendant Alarm : DCOB FAULT
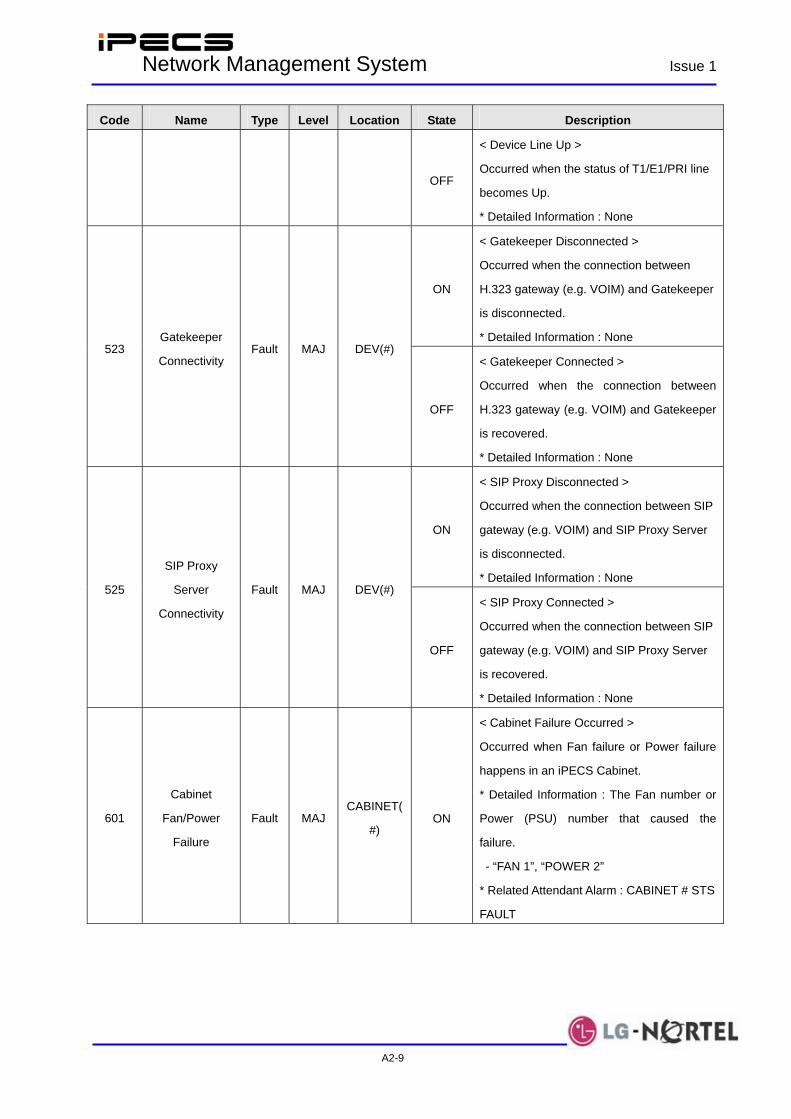
IPECS Network Management System Issue 1
A2-9
Code Name Type Level Location State Description
OFF
< Device Line Up >
Occurred when the status of T1/E1/PRI line
becomes Up.
* Detailed Information : None
ON
< Gatekeeper Disconnected >
Occurred when the connection between
H.323 gateway (e.g. VOIM) and Gatekeeper
is disconnected.
* Detailed Information : None 523
Gatekeeper
Connectivity Fault MAJ DEV(#)
OFF
< Gatekeeper Connected >
Occurred when the connection between
H.323 gateway (e.g. VOIM) and Gatekeeper
is recovered.
* Detailed Information : None
ON
< SIP Proxy Disconnected >
Occurred when the connection between SIP
gateway (e.g. VOIM) and SIP Proxy Server
is disconnected.
* Detailed Information : None 525
SIP Proxy
Server
Connectivity
Fault MAJ DEV(#)
OFF
< SIP Proxy Connected >
Occurred when the connection between SIP
gateway (e.g. VOIM) and SIP Proxy Server
is recovered.
* Detailed Information : None
601
Cabinet
Fan/Power
Failure
Fault MAJ CABINET(
#) ON
< Cabinet Failure Occurred >
Occurred when Fan failure or Power failure
happens in an iPECS Cabinet.
* Detailed Information : The Fan number or
Power (PSU) number that caused the
failure.
- “FAN 1”, “POWER 2”
* Related Attendant Alarm : CABINET # STS
FAULT

IPECS Network Management System Issue 1
A2-10
Code Name Type Level Location State Description
OFF
< Cabinet Failure Cleared >
Occurred when the Fan failure or Power
failure condition is cleared.
* Detailed Information : The Fan number or
Power (PSU) number that was recovered
from failure.
- “FAN 1”, “POWER 2”
System events, Codes 700 ~ 999
Code Name Type Level Location State Description
701 System Reset by
Admin System CRI MFIM NONE
< System Reset by Admin >
Occurred when iPECS system is
restarted manually by administrator using
Web Admin, Keyset Admin, or Terminal
Maintenance. (This event is not caused
by MFIM power off or reset button on the
front panel of MFIM.)
* Detailed Information : The cause of the
restart (reset)
- Keyset Admin
- Web Admin (Reset System)
- Web Admin (Delete Device)
- Web Admin (System ID Information
Changed)
- Web Admin (System IP Information
Changed)
- Web Admin (CO Gateway Sequence
Number Changed)
- Maintenance Command
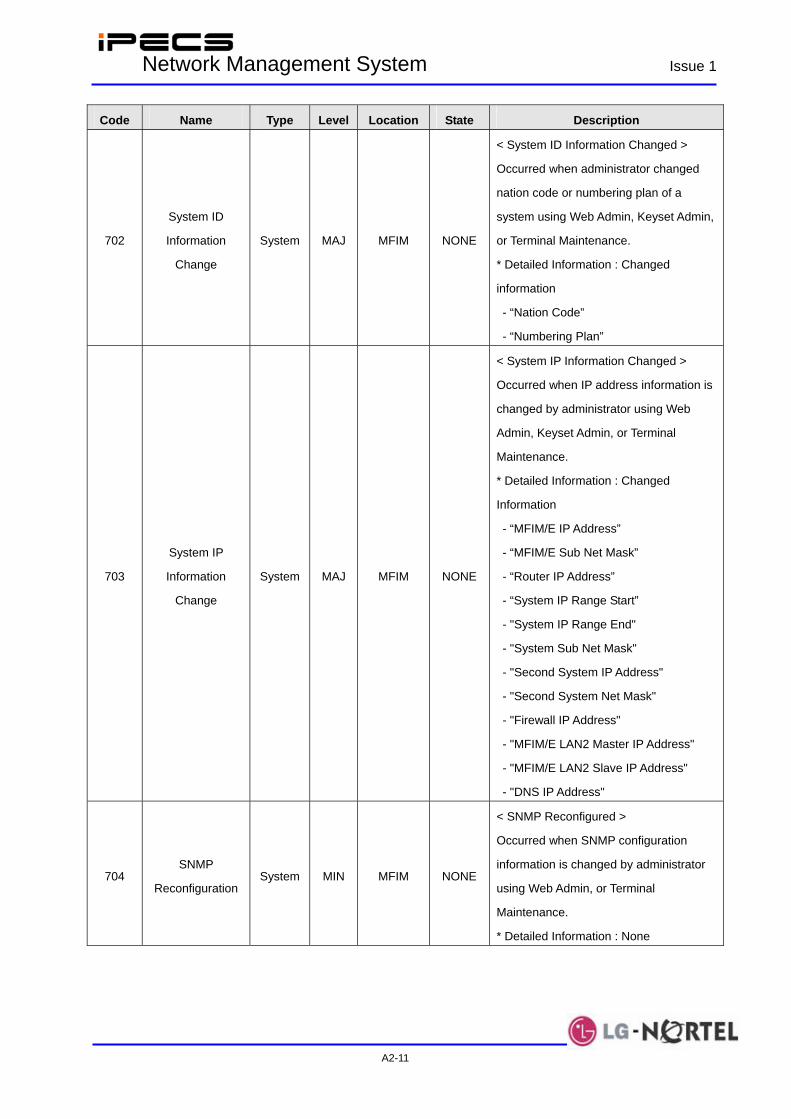
IPECS Network Management System Issue 1
A2-11
Code Name Type Level Location State Description
702
System ID
Information
Change
System MAJ MFIM NONE
< System ID Information Changed >
Occurred when administrator changed
nation code or numbering plan of a
system using Web Admin, Keyset Admin,
or Terminal Maintenance.
* Detailed Information : Changed
information
- “Nation Code”
- “Numbering Plan”
703
System IP
Information
Change
System MAJ MFIM NONE
< System IP Information Changed >
Occurred when IP address information is
changed by administrator using Web
Admin, Keyset Admin, or Terminal
Maintenance.
* Detailed Information : Changed
Information
- “MFIM/E IP Address”
- “MFIM/E Sub Net Mask”
- “Router IP Address”
- “System IP Range Start”
- "System IP Range End"
- "System Sub Net Mask"
- "Second System IP Address"
- "Second System Net Mask"
- "Firewall IP Address"
- "MFIM/E LAN2 Master IP Address"
- "MFIM/E LAN2 Slave IP Address"
- "DNS IP Address"
704 SNMP
ReconfigurationSystem MIN MFIM NONE
< SNMP Reconfigured >
Occurred when SNMP configuration
information is changed by administrator
using Web Admin, or Terminal
Maintenance.
* Detailed Information : None
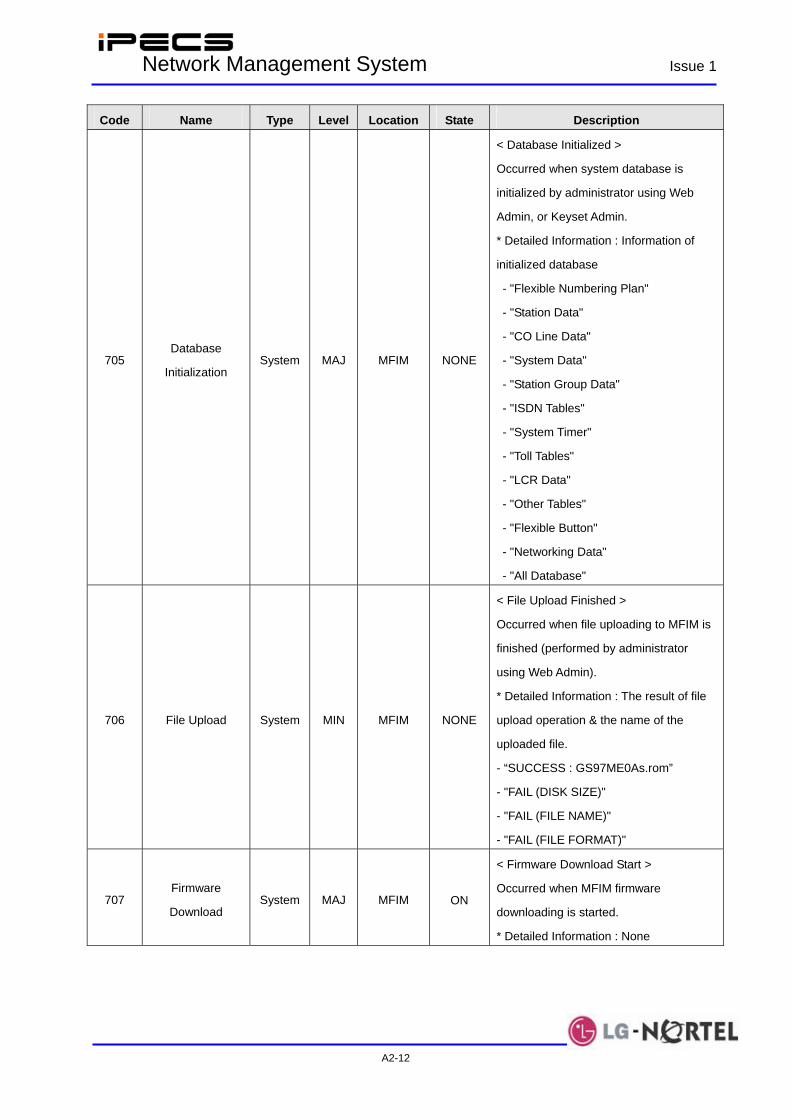
IPECS Network Management System Issue 1
A2-12
Code Name Type Level Location State Description
705 Database
Initialization System MAJ MFIM NONE
< Database Initialized >
Occurred when system database is
initialized by administrator using Web
Admin, or Keyset Admin.
* Detailed Information : Information of
initialized database
- "Flexible Numbering Plan"
- "Station Data"
- "CO Line Data"
- "System Data"
- "Station Group Data"
- "ISDN Tables"
- "System Timer"
- "Toll Tables"
- "LCR Data"
- "Other Tables"
- "Flexible Button"
- "Networking Data"
- "All Database"
706 File Upload System MIN MFIM NONE
< File Upload Finished >
Occurred when file uploading to MFIM is
finished (performed by administrator
using Web Admin).
* Detailed Information : The result of file
upload operation & the name of the
uploaded file.
- “SUCCESS : GS97ME0As.rom”
- "FAIL (DISK SIZE)"
- "FAIL (FILE NAME)"
- "FAIL (FILE FORMAT)"
707 Firmware
Download System MAJ MFIM ON
< Firmware Download Start >
Occurred when MFIM firmware
downloading is started.
* Detailed Information : None

IPECS Network Management System Issue 1
A2-13
Code Name Type Level Location State Description
OFF
< Firmware Download End >
Occurred when MFIM firmware
downloading is finished.
* Detailed Information : The result of
firmware download operation
- “SUCCESS” or “FAIL”
ON
< Device Registered >
Occurred when a device is newly
registered, or Hot Desk user logs in.
* Detailed Information : None
801
Device
Registration /
Deletion
System MAJ DEV(#)
OFF
< Device Unregistered >
Occurred when a device is deleted using
Device Delete Feature of Web Admin, or
Hot Desk user logs out.
* Detailed Information : None
ON
< Admin Set Device Out-of-Service >
Occurred when administrator makes a
device into Out-of-Service state using
Web Admin.
* Detailed Information : None 803
Device Service
Status System MIN DEV(#)
OFF
< Admin Set Device I-Service >
Occurred when administrator recovers a
device from Out-of-Service state using
Web Admin.
* Detailed Information : None
805 Device Service
Switch Status System MAJ DEV(#) ON
< Device Switch Service Mode >
Occurred when the Normal/Service
switch on the front panel of gateway
device is moved to Service position. (If a
device is in Service mode, no additional
calls can be made.)
* Detailed Information : None
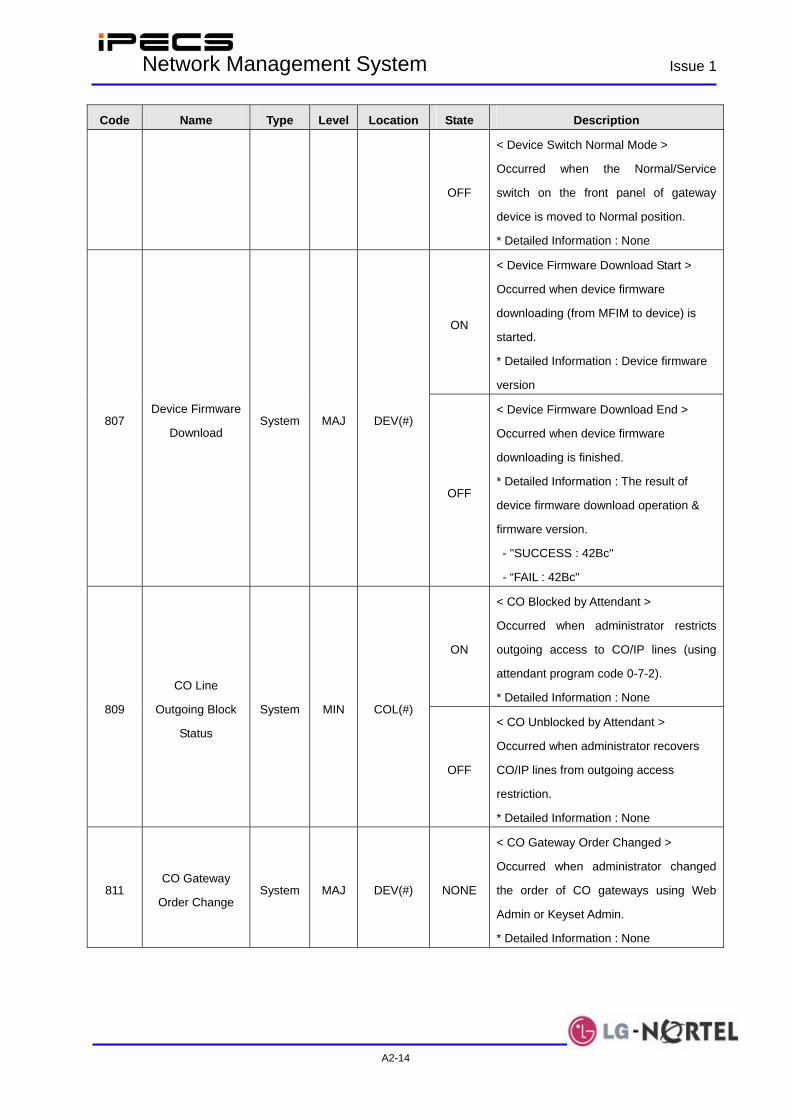
IPECS Network Management System Issue 1
A2-14
Code Name Type Level Location State Description
OFF
< Device Switch Normal Mode >
Occurred when the Normal/Service
switch on the front panel of gateway
device is moved to Normal position.
* Detailed Information : None
ON
< Device Firmware Download Start >
Occurred when device firmware
downloading (from MFIM to device) is
started.
* Detailed Information : Device firmware
version
807 Device Firmware
Download System MAJ DEV(#)
OFF
< Device Firmware Download End >
Occurred when device firmware
downloading is finished.
* Detailed Information : The result of
device firmware download operation &
firmware version.
- "SUCCESS : 42Bc"
- “FAIL : 42Bc"
ON
< CO Blocked by Attendant >
Occurred when administrator restricts
outgoing access to CO/IP lines (using
attendant program code 0-7-2).
* Detailed Information : None 809
CO Line
Outgoing Block
Status
System MIN COL(#)
OFF
< CO Unblocked by Attendant >
Occurred when administrator recovers
CO/IP lines from outgoing access
restriction.
* Detailed Information : None
811 CO Gateway
Order Change System MAJ DEV(#) NONE
< CO Gateway Order Changed >
Occurred when administrator changed
the order of CO gateways using Web
Admin or Keyset Admin.
* Detailed Information : None
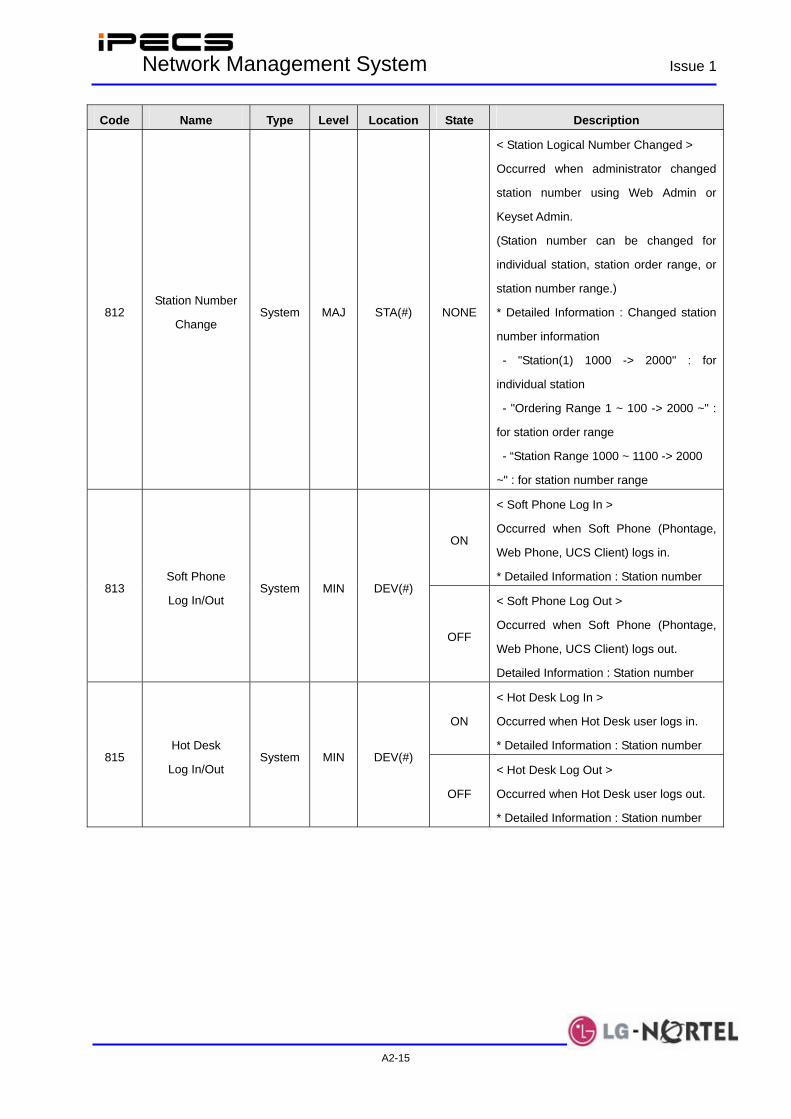
IPECS Network Management System Issue 1
A2-15
Code Name Type Level Location State Description
812 Station Number
Change System MAJ STA(#) NONE
< Station Logical Number Changed >
Occurred when administrator changed
station number using Web Admin or
Keyset Admin.
(Station number can be changed for
individual station, station order range, or
station number range.)
* Detailed Information : Changed station
number information
- "Station(1) 1000 -> 2000" : for
individual station
- "Ordering Range 1 ~ 100 -> 2000 ~" :
for station order range
- “Station Range 1000 ~ 1100 -> 2000
~" : for station number range
ON
< Soft Phone Log In >
Occurred when Soft Phone (Phontage,
Web Phone, UCS Client) logs in.
* Detailed Information : Station number 813
Soft Phone
Log In/Out System MIN DEV(#)
OFF
< Soft Phone Log Out >
Occurred when Soft Phone (Phontage,
Web Phone, UCS Client) logs out.
Detailed Information : Station number
ON
< Hot Desk Log In >
Occurred when Hot Desk user logs in.
* Detailed Information : Station number 815
Hot Desk
Log In/Out System MIN DEV(#)
OFF
< Hot Desk Log Out >
Occurred when Hot Desk user logs out.
* Detailed Information : Station number