installation and setup guide for the subrecipient management tool · rdt rapid diagnostic malaria...
TRANSCRIPT

Installation and Setup Guide for the Subrecipient Management Tool Version 2.0—August 15, 2017
Management tools for the whole-of-country approach
CCM Summary Regional Dashboard Principal Recipient Management Dashboard Subrecipient Management Tool

Installation and Setup Guide for the SR Management Tool—Version 2.0 August 15, 2017
2
This publication is made possible by the support of the American People through the U.S. Agency for International
Development and the U.S. President’s Emergency Plan for AIDS Relief. GMS is funded by the U.S. President’s
Emergency Plan for AIDS Relief and the U.S. Agency for International Development under contract No. AID-OAA-C-12-
00040. The contents of this report are the sole responsibility of Grant Management Solutions, and do not necessarily
reflect the views of the U.S. Agency for International Development, the U.S. government, or the Global Fund to Fight
AIDS, Tuberculosis and Malaria. GMS is a U.S. Government–funded partnership consisting of Management Sciences for
Health, Abt Associates, International HIV/AIDS Alliance, Pact, Palladium, Realizing Global Health, Training Resources
Group, and committed to strengthening the performance of Global Fund grants.

Installation and Setup Guide for the SR Management Tool—Version 2.0 August 15, 2017
3
CONTENTS
Abbreviations and acronyms ............................................................................................... 7
1. Introduction .................................................................................................... 8
1.1. Purpose and organization of the installation and setup guide ...................... 8
1.2. What is the SRMT and who uses it? ............................................................... 8
1.3. What are the expected outcomes of using the SRMT? ................................... 9
1.4. How the SRMT was developed ..................................................................... 10 1.5. How the SRMT fits into the whole-of-country approach and the suite of
management tools .......................................................................................... 11
2. Deciding which tools from the dashboard suite are appropriate for a given
country context ............................................................................................. 14
3. Key steps for setup and requirements for proper installation ..................... 16
3.1. Key steps for setup ........................................................................................ 16
3.2. Requirements for proper installation: technical requirements ................... 16
IT environment ............................................................................................. 16 3.2.1.
Files needed to produce the SRMT............................................................... 16 3.2.2.
Equipment requirements .............................................................................. 17 3.2.3.
System requirements .................................................................................... 17 3.2.4.
Connectivity .................................................................................................. 18 3.2.5.
3.3. Requirements for proper installation: staffing requirements ..................... 18
PR staffing requirements .............................................................................. 18 3.3.1.
SR staffing requirements .............................................................................. 19 3.3.2.

Installation and Setup Guide for the SR Management Tool—Version 2.0 August 15, 2017
4
4. SRMT configuration and setup: The SRMT’s major components and the
steps required to configure and set it up ..................................................... 20
4.1. Preparing to configure the SRMT ................................................................ 20
4.2. Navigating the SRMT’s worksheets .............................................................. 22
4.3. Beginning tool configuration and setup ....................................................... 22
5. Initial Setup: introduction, steps 1-8 and steps 9-13 ................................... 24
5.1. Introduction .................................................................................................. 24
5.2. Step 1: Input general data ............................................................................. 25
5.3. Step 2: Choose objectives or modules based on the grant performance
framework ..................................................................................................... 27
5.4. Step 3: Insert the SR data-entry sheet ..........................................................28
5.5. Step 4: Define additional programmatic indicators .................................... 31
5.6. Step 5: Associate indicators with objectives or modules and indicator type32
5.7. Step 6: Enter annual planning data section of the SRMT ............................ 36
How the annual planning worksheet is organized ....................................... 36 5.7.1.
Filling out the annual planning worksheet .................................................. 39 5.7.2.
5.8. Step 7: Define performance thresholds ........................................................ 49
5.9. Step 8: Link theSMRT to the PR Management Dashboard ......................... 51
5.10. Steps 9-13: Avanced setup ............................................................................ 52
Why are there advanced setup steps?........................................................... 52 5.10.1.
Step 9: Changing the names of buttons for the implementation period and 5.10.2.
the annexes ................................................................................................... 53

Installation and Setup Guide for the SR Management Tool—Version 2.0 August 15, 2017
5
Step 10: Assign months for each quarter ..................................................... 59 5.10.3.
Step 11: Define the initial period in the PR Management Dashboard ......... 62 5.10.4.
Step 12: Change the setup password ............................................................ 63 5.10.5.
Step 13: Customize colors for indicators, activities and months ................. 65 5.10.6.
6. SR use of the SRMT: Handover of the configured SRMT to SRs, data
entry, recommended use, and transferring data to PR Management
Dashboard ..................................................................................................... 67
6.1. Handover of the configured SRMT to SRs ................................................... 67
Orienting SRs to the SRMT .......................................................................... 67 6.1.1.
Confirming how SRs will implement and use the SRMT for monitoring .... 67 6.1.2.
SR’s transfer of the SRMT to the PR ............................................................ 67 6.1.3.
Archiving each SRMT .................................................................................. 68 6.1.4.
6.2. Monthly data entry ....................................................................................... 69
Completing the header information and results sections ............................ 70 6.2.1.
The effectiveness score ................................................................................. 74 6.2.2.
Indicators that will be transferred to the PR Management Dashboard ...... 75 6.2.3.
Adding narrative comments on performance to the SRMT ......................... 76 6.2.4.
SR data validation by the PR ........................................................................ 77 6.2.5.
Saving monthly versions of the SRMT ........................................................ 80 6.2.6.
6.3. Recommended use of the PR Management Dashboard with the SRMT ..... 81
6.4. Transferring data to the PR Management Dashboard .................................83

Installation and Setup Guide for the SR Management Tool—Version 2.0 August 15, 2017
6
7. Using the SRMT to monitor and improve grant performance ................... 84
7.2. Data visualization using charts .................................................................... 84
Accessing data visualization charts ............................................................. 84 7.2.1.
Programmatic and financial results by indicator ......................................... 85 7.2.2.
Programmatic results and expenditures compared ................................... 86 7.2.3.
Overview of financial performance .............................................................. 87 7.2.4.
Financial ratios ............................................................................................ 88 7.2.5.
Programmatic results and expenditures compared ; budget and 7.2.6.
expenditure compared ................................................................................. 93
Cumulative budget and expenditure ............................................................ 95 7.2.7.
7.3. Data visualization in tables ........................................................................... 97
Where to see data in tables ........................................................................... 97 7.3.1.
Programmatic and financial tables ............................................................... 97 7.3.2.
Budget and expenditure tables ................................................................... 102 7.3.3.
8. SRMT action plan ....................................................................................... 106
9. Troubleshooting: Frequently asked questions (FAQs) and the Help Desk 110
9.1. Frequently asked questions (FAQS) ........................................................... 110
9.2. Help Desk .....................................................................................................112
Annex 1. Liquidation of SSR advances .............................................................................114
Annex 2. Annual planning exercise ................................................................................. 116
Installation and Setup Guide for the SR Management Tool—Version 2.0 August 15, 2017
7
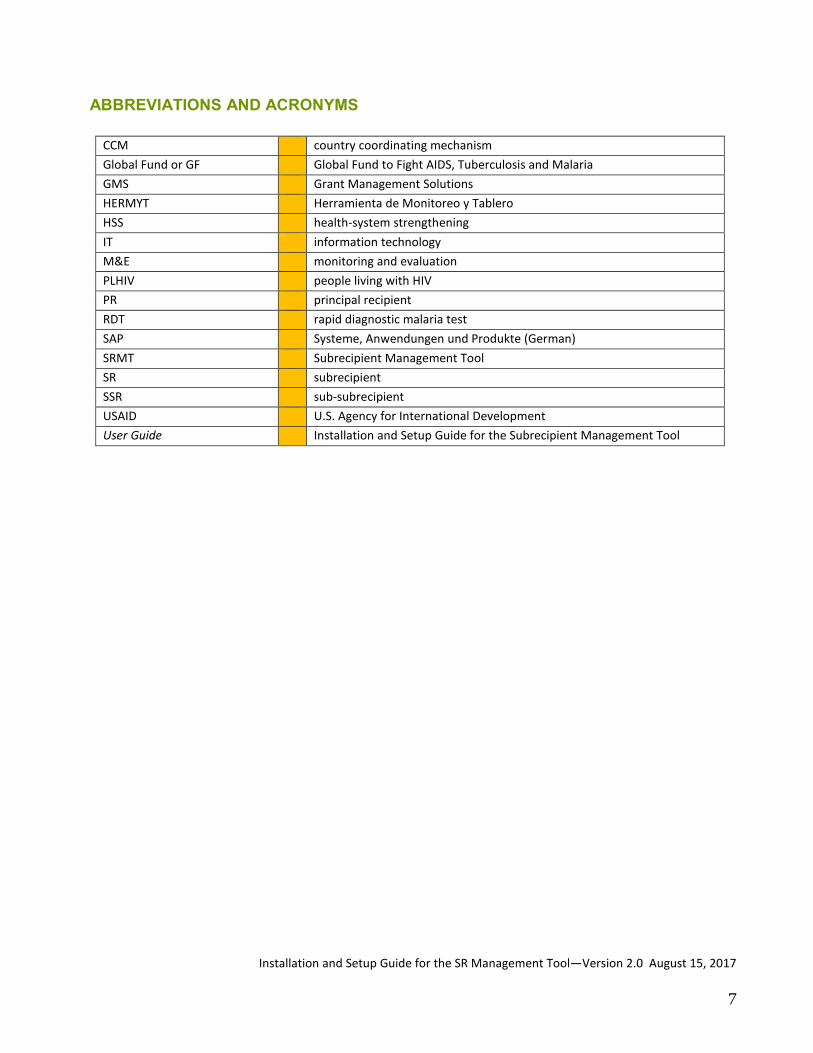
ABBREVIATIONS AND ACRONYMS
CCM country coordinating mechanism
Global Fund or GF Global Fund to Fight AIDS, Tuberculosis and Malaria
GMS Grant Management Solutions
HERMYT Herramienta de Monitoreo y Tablero
HSS health-system strengthening
IT information technology
M&E monitoring and evaluation
PLHIV people living with HIV
PR principal recipient
RDT rapid diagnostic malaria test
SAP Systeme, Anwendungen und Produkte (German)
SRMT Subrecipient Management Tool
SR subrecipient
SSR sub-subrecipient
USAID U.S. Agency for International Development
User Guide Installation and Setup Guide for the Subrecipient Management Tool

Installation and Setup Guide for the SR Management Tool—Version 2.0 August 15, 2017
8
1. INTRODUCTION
1.1. PURPOSE AND ORGANIZATION OF THE INSTALLATION AND SETUP GUIDE
The purpose of this Installation and Setup Guide (User Guide) is to help principal recipients
(PRs) and subrecipients (SRs) of funds from the Global Fund to Fight AIDS, Tuberculosis
and Malaria (Global Fund) install and use the SR Management Tool (SRMT) designed by
Grant Management Solutions (GMS). The SRMT is intended to enable SRs and PRs to
improve their monthly, quarterly, and annual management and monitoring of the
programmatic and financial indicators included in their annual work plan and to contribute
to the global performance of grants that are being implemented in their country.
This User Guide describes the prerequisites for using the SRMT, the installation and setup
steps and the tool’s layout and use.
The User Guide is structured as follows:
Section 2 describes a foundational step for using the SRMT– the annual planning
exercise – during which the PR and SR collaborate closely to agree on the programmatic
indicators and targets, as well as budget to be entered into the tool.
Sections 3, 4 and 5 provide take users through the steps of setting up the SRMT
Section 6 explains how the tool should be used on a monthly basis by SRs to record their
data and also explains the visualizations produced when data are entered
Section 7 provides an overview of visualizations the SRMT produces of data in summary
form (in charts) and in detailed form (in tables)
Section 8 describes the use of the “Action Plan” section of the SRMT to record follow-up
and performance-improvement actions
Section 9, on troubleshooting, contains frequently asked questions, or FAQs and
information about the Global Fund’s help desk
Annex 1 in this User Guide describes how the Liquidation of SSR advances template
provided in an annex in the SRMT may be used
Annex 2 in this User Guide shows how to do an annual planning exercise
1.2. WHAT IS THE SRMT AND WHO USES IT?
The SRMT is an Excel-based tool that standardizes the format SRs use to track
programmatic and financial data for a grant, thereby facilitating monthly and quarterly
review. The SRMT also facilitates SR production of data needed by PRs to produce the PR
Management Dashboard, as the SRMT automatically pulls data from its various sections to
produce the SR data sheets routinely sent to PRs for PR Management Dashboard

Installation and Setup Guide for the SR Management Tool—Version 2.0 August 15, 2017
9
production. The SRMT also helps SRs produce certain data needed by the PR for reporting
to the Global Fund.
The SRMT is a single Excel file that is configured for the use of one SR. If, for example, the
PR has five SRs and would like them to all use the SRMT, then five SRMTs need to be
configured. The configuration process of a single SRMT, detailed in this User Guide,
involves importing SRs’ SR data-entry sheets (which were produced during the
configuration of the PR Management Dashboard). In turn, once the SRMT is configured
and regularly used, the same inserted SR data-entry sheet is populated automatically
and is then used to populate and produce the PR Management Dashboard. This means that
the SRMT will need to be downloaded by each SR and configured for each SR with the
agreed annual work plan, SR specific targets and SR information. Each SR will need an
SRMT administrator.
SRs are the primary beneficiaries of the SRMT as they are responsible for supervising
the implementers of their grants in their use of resources and in production of results.
Although the key users of the SRMT are SRs, each SR must collaborate with its PR to set up
initial programmatic and financial data in the SRMT. The decision about which initial
programmatic and financial data to configure into the SRMT is made through an annual
planning exercise, which is described in detail in annex 2 to this User Guide.
The PR is the secondary beneficiary of the tool. Once the SRMT is being used
consistently, it provides the PR with the quarterly information it needs to update the PR
Management Dashboard, which the PR uses for monitoring progress of the overall grant, as
well as to compare performance of its various SRs. Depending on the extent to which each
SR discusses implementation issues that are identified during SR monthly review of data,
the SRMT can give a PR early alerts about impediments to progress on grant activities. Last,
data generated by the SRMT, such as those provided on liquidation of advances, help PRs
obtain data from SRs that PRs are required to report to the Global Fund.
1.3. WHAT ARE THE EXPECTED OUTCOMES OF USING THE SRMT?
When used consistently, the SRMT can contribute to the following outcomes:
Early identification of failure to meet performance targets – Because data in the
SRMT are updated monthly, SRs have the opportunity to identify slow startup of activities
as well as failure to progress in the work plan. Early identification of poor performance
prompts SRs to react before chronic poor performance sets in and to reach out to their PRs
for help in resolving obstacles to good performance.
Installation and Setup Guide for the SR Management Tool—Version 2.0 August 15, 2017
10
Risk mitigation — Monthly review allows SRs to foresee potential obstacles to grant
implementation. For example, if success of an SR’s planned activities depends on external
factors and it appears that those external factors may not materialize in the near future, the
SR can take direct action to mitigate risk, or can ask for the PR’s assistance to influence
those external factors.
Improved SR performance —The color-coded alerts in the tables of the SRMT and the
various graphs in the tool facilitate performance review. Armed with these data, SRs can
conduct the analyses necessary to pinpoint root causes of performance problems. If SRs
subsequently take timely actions to address performance issues, use of the SRMT can help
them improve grant performance. If SR performance is already adequate, use of the SRMT
can help SRs maintain performance levels.
Improved communication between SRs and the PRs on grant performance —
The tool helps SRs analyze their data and monitor Global Fund grants they help implement
by automating data consolidation, generating graphs and creating color-coded alerts.
Because the consolidated data, graphs and alerts comprise both data and qualitative
interpretation of the data, these elements also enhance reports SRs submit to PRs and
thereby facilitate communication on grant performance between SRs and PRs.
1.4. HOW THE SRMT WAS DEVELOPED
The SRMT had its genesis in the Dominican Republic in 2014 during the piloting of the PR
Management Dashboard with CONAVIHSIDA, the Dominican Republic’s multisectoral
mechanism for the fight against HIV/AIDS. One of features of the PR Management
Dashboard is a drill down layer that displays SR financial and programmatic performance
data. Use of a consistent reporting format among SRs for a given grant facilitates obtaining
SR-level data for the PR Management Dashboard.
At CONAVIHSIDA’s-request, the GMS team piloting the PR Management Dashboard in the
Dominican Republic developed a standard format for use by its 27 SRs to monitor their
subgrants. These SRs had been using 24 different reporting formats; a single, standard
format was needed so that all SRs could easily transmit their data to the PR for production
of the progress updates and PR Management Dashboards. Christened the Herramienta de
Monitoreo y Tablero (HERMYT), this tool was rapidly adopted by CONAVIHSIDA and its
SRs, who continued to use it for monthly monitoring of SR activities and early identification
of bottlenecks to programmatic implementation at the time of publication of this User
Guide.

Installation and Setup Guide for the SR Management Tool—Version 2.0 August 15, 2017
11
Subsequent to the creation of the HERMYT, GMS received requests from at least two other
countries for help with standardizing the format used by SRs to report to the PR and
adaptations were made to the HERMYT to meet this demand. This demand coincided with
an increased attention at the Global Fund Secretariat on the problem of low funds
absorption among Global Fund grantees in specific regions and that on poor SR
performance was often a cause of low absorption. Better tracking of SR performance was
needed. In 2016, the US government provided approval to GMS to provide with
development of a generic tool version of the HERMYT that could be used by SRs working in
a range of country contexts.
The current version of the SRMT was developed following consultations with staff at the
Global Fund and using extensive input from PRs, SRs and individual technical support
providers in six countries. Beta testing of the tool was conducted in 6 countries
(Bangladesh, India, Dominican Republic, Senegal and Uganda and Nicaragua), and
feedback from field testing was incorporated into the tool and this User Guide. The User
Guide is available in English, French, and Spanish.
1.5. HOW THE SRMT FITS INTO THE WHOLE-OF-COUNTRY APPROACH AND THE
SUITE OF MANAGEMENT TOOLS
The SRMT is one of a suite of four management tools created to help Global Fund countries
monitor and improve their grant performance. The full suite consists of the following tools
in order of creation:
1. PR Management Dashboard, developed by GMS, the Global Fund Secretariat and SAP
SE in 2013
2. CCM Summary, developed by GMS
3. Regional Dashboard, developed by GMS
4. SRMT, developed by GMS
The Global Fund has adopted the PR Management Dashboard and the CCM Summary;
these tools are progressively being made available on the Global Fund’s website at
www.theglobalfund.org/en/funding-model/technical-cooperation/management-tools/.
The four tools and their main characteristics are shown in the table on the following page,
where the arrows in the left column indicate the flow of data between tools.

Installation and Setup Guide for the SR Management Tool—Version 2.0 August 15, 2017
12
Management tool Main characteristics Data input
CCM Summary
Primary users: country coordinating
mechanisms (CCMs)
Uses an Excel-based application for data
entry and an SAP Crystal Dashboard Design
2011 application for visualization
Shows quarterly results by summing PR grant
data
Presents indicator data for up to three years
Performance data are organized by
component (HIV/AIDS, TB, malaria, HSS) and
by PR within each component
Contains section for recording
recommendations by CCM oversight body,
decisions by CCM and status of
implementation of recommended actions
Configuration is done
by the CCM; PR data
are imported from
the PR Management
Dashboard
Regional Dashboard
Primary users: PRs with regional grants
that have complex implementation
arrangements
Uses an Excel-based application for data
entry and an SAP Crystal Dashboard Design
2011 application for visualization
Shows quarterly results by summing SR grant
data
Presents indicators data for up to three years
Presents information aggregated by country
Has a map of countries involved
Data imported from
the PR Management
Dashboard Excel-
based Data Master
PR Management Dashboard
Primary users: PRs with traditional
grants; PRs with regional grants that have
simple implementation arrangements
Uses two applications - an Excel-based data-
entry component and a visualization
application that uses SAP Crystal Dashboard
Design 2011
Displays overall grant data on one page
Drill down layer displays quarterly and
cumulative life of grant results by SR
Presents indicators data for three years
PR data entered
directly by PR; SR
data imported by
uploading SR data-
entry sheets for each
SR
SR Management Tool
Primary user: SR
Consists of a single, Excel-based application
Configuration is led by the PR in close
collaboration with SRs
Displays quarterly and annual cumulative
data for one year
Includes summary of SR performance using
both tables and charts
Following
configuration by PR,
data entry is done by
SRs

Installation and Setup Guide for the SR Management Tool—Version 2.0 August 15, 2017
13
The PR Management Dashboard, CCM Summary and SRMT are interlinked: the SRMT
produces sheets that feed into production of the PR Management Dashboard, and the PR
Management Dashboard in turn produces files that are used to create the CCM Summary.
Two versions of the regional dashboard exist. One is a version of the PR Management
Dashboard configured (and possibly modified slightly in design) for regional grants with
simple implementation arrangements. The second version is designed for regional grants
with more complex implementation arrangements and uses multiple applications– the
Excel-based PR Data Master, the Excel-based Regional Data Master and an SAP-based
visualization application – to produce the actual dashboard.

Installation and Setup Guide for the SR Management Tool—Version 2.0 August 15, 2017
14
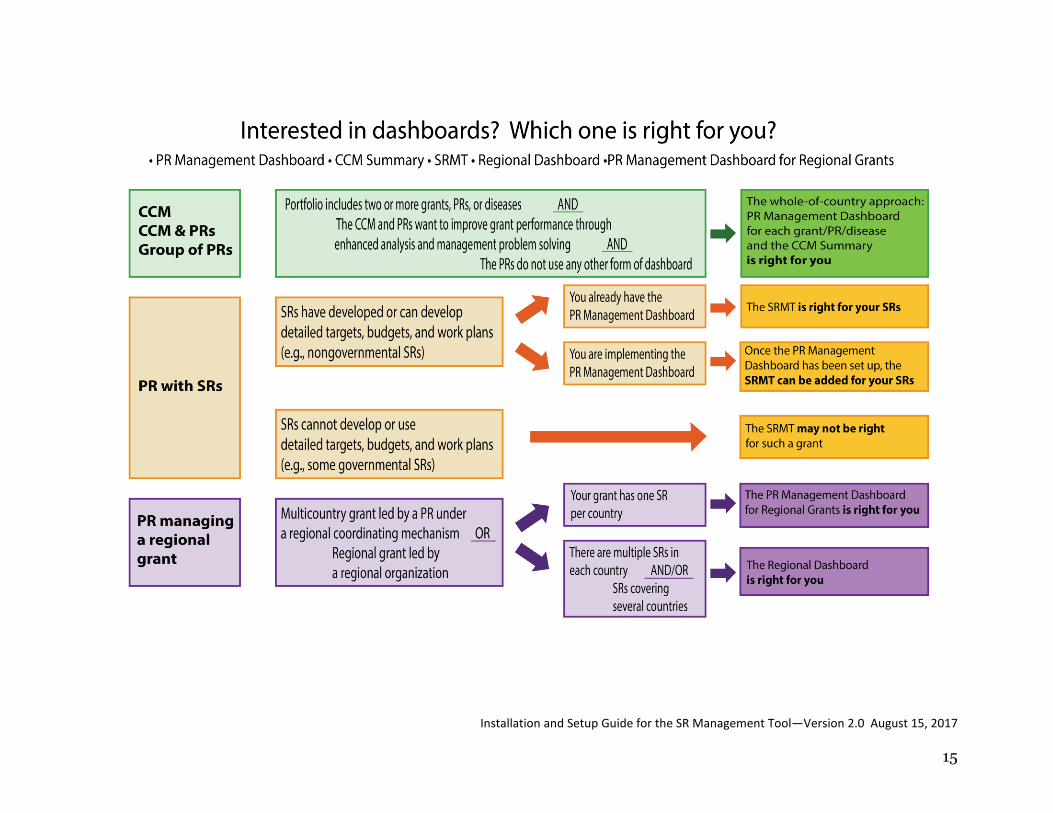
2. DECIDING WHICH TOOLS FROM THE DASHBOARD SUITE ARE
APPROPRIATE FOR A GIVEN COUNTRY CONTEXT
This section guides potential users and technical-support providers in deciding when it
would be appropriate to use which tools from the dashboard suite for a given country
context.
Installation and Setup Guide for the SR Management Tool—Version 2.0 August 15, 2017
15

Installation and Setup Guide for the SR Management Tool—Version 2.0 August 15, 2017
16
3. KEY STEPS FOR SETUP AND REQUIREMENTS FOR PROPER INSTALLATION
3.1. KEY STEPS FOR SETUP
The initial setup of the tool should be done at a joint session between the PR and each SR,
after the SR annual planning exercise is conducted, based on the contract and
determination of goals and budget (details on the annual planning exercise are in annex 2).
SRs must check that the SRMT complies with the requirements in section 3.2; then it will
execute the steps in the Initial Setup (shown in section 4.3)
3.2. REQUIREMENTS FOR PROPER INSTALLATION: TECHNICAL REQUIREMENTS
IT ENVIRONMENT 3.2.1.
The SRMT is designed to be usable in both high information technology (IT) and low IT
environments. 1 The following paragraphs in section 3.2 describes the files and equipment
required and system requirements that should be in place and available for effective
installation and use of the SRMT.
FILES NEEDED TO PRODUCE THE SRMT 3.2.2.
Setting up the SRMT requires two files:
1. The SRMT Excel file
2. The SR data-entry sheet from the PR Management Dashboard (if the PR is using the PR
Management Dashboard)
Also, some documents will be necessary to set up the SRMT: subagreement between the PR
and SR and the SR annual plan.
1. Low IT capability refers to countries characterized by: poor availability of computers at most levels of their health systems, problems with internet connectivity and bandwidth, as well as weak human and infrastructure capabilities to support using computer technology for data collection, transfer and processing. High IT capability countries have ready availability of computers at most levels of the health system, good internet connectivity and speed. Additionally, high IT capability countries have an adequate supply of human resources capable of using computer technology for data collection, transfer and processing.

Installation and Setup Guide for the SR Management Tool—Version 2.0 August 15, 2017
17
EQUIPMENT REQUIREMENTS 3.2.3.
To properly use the tool, the SR’s administrator for the SRMT will need the following
equipment:
Laptop or desktop computer2
Internet connection to send the files to the PR
Storage capability for periodic storage of data files (hard disk, USB/flash drive, other
storage device)
Color printer for printing visual alerts graphs
SYSTEM REQUIREMENTS 3.2.4.
To use the SRMT, the administrator will need administrator rights to enable the use of
macros in Excel for the computer in which the tool is installed. Administrator rights are also
needed in case the administrator has to reinstall Microsoft Office to select the version that
is compatible with the SRMT (32-bit versions are needed).
SRs must have the following software versions (any one from the list for each product)
already installed on their computer(s), to install and run the SRMT.
Microsoft Windows
Windows XP Professional SP2 and SP3
Windows Server 2003 standard edition SP1 and SP2
Windows Server 2003 Enterprise Edition SP1 and SP2
Windows Vista SP1 and SP2
Windows 7
Windows 8
Windows 10
Windows Embedded Compact 2013
Microsoft Excel
Excel 2010 32-bit version
Excel 2013 32-bit version
Excel 2016 32-bit version
2. Unlike the PR Management Dashboard, the SRMT uses only Excel; it does not need a dedicated computer for generation.

Installation and Setup Guide for the SR Management Tool—Version 2.0 August 15, 2017
18
Antivirus
Updated antivirus software
CONNECTIVITY 3.2.5.
It is assumed that the computers that the PR would use for purposes of the SRMT have
access to a functional internet connection. In cases where the internet connection is not
reliable, however, files can be transferred using USB flash drives or CD-ROMs. It is
desirable that SRs also have access to a functional internet connection.
3.3. REQUIREMENTS FOR PROPER INSTALLATION: STAFFING REQUIREMENTS
PR STAFFING REQUIREMENTS 3.3.1.
The table below describes the key PR actors and related knowledge and skills that should be
in place and available for effective installation and use of the SRMT (see the following
table).
It is recommended that the PR coordinate and implement the process of generating the
SRMT and submitting the quarterly reports it creates to the PR Management Dashboard
administrator.
Actor Key responsibilities for SRMT setup and use Skills and knowledge required
PR’s program
manager
Perform SR annual programmatic planning
under the contract.
Visits to SRs to validate programmatic
information related to the tool.
Conduct meetings with SRs to discuss grant
performance.
Provide explanations on feedback from
meetings with SRs.
Track action plan.
Experience in M&E.
Understanding of how to interpret SRMT indicators.
Capacity to maintain good relations and effective
communications the PR.
Willingness to discuss and consider implementation
issues that may arise and find relevant solutions to
recommend to SRs.
PR's financial
officer
Perform annual budget planning under SR
contract.
Visits to SRs to validate financial information
related to the tool.
Conduct meetings with SRs to discuss grant
budget performance.
Provide explanations on feedback from
meetings with SRs.
Tracking action plan and financial agreements.
Financial experience and budget management.
Understanding of the interpretation of grant
financial indicators.
Capacity to maintain good relations and effective
communications with SRs.
Willingness to discuss and consider implementation
issues that may arise and find relevant solutions to
recommend to SRs.

Installation and Setup Guide for the SR Management Tool—Version 2.0 August 15, 2017
19
Actor Key responsibilities for SRMT setup and use Skills and knowledge required
PR’s configurator/
SRMT
administrator
Integrate SRMT files into the PR Management
Dashboard.
Perform regular backups of the data in each
SRMT submitted by SRs.
Support programmatic and financial managers
setting up the SRMT.
Ensure proper archiving of SRMT files by PR
and by SRs.
Competence and appropriate level of knowledge in
the use of computers.
Skill in Excel, file backup, internet use.
Thorough familiarity with grant activities.
Experience creating PowerPoint presentations.
Ability to facilitate and structure Analysis meetings.
PR’s SR technical
coordinator
Provide document feedback and
recommendations to SRs based on monthly
performance.
Update and tracking action plan.
Ensure proper SRMT files custody and ensure
the files submittal to the PR.
Conduct the analysis, review and update of
action plans and related feedback.
Demonstrated understanding of the oversight
process and capability to convene meetings to
further discuss internal affairs with SRs.
Understanding of the interpretation of grants
programmatic and financial indicators.
Willingness to discuss and consider implementation
issues that may arise and seek appropriate solutions
to recommend to SRs.
SR STAFFING REQUIREMENTS 3.3.2.
The table below describes the key SR actors and related knowledge and skills that should be
in place and available for effective installation and use of the SRMT.
Actor Key responsibilities for SRMT setup and use Skills and knowledge required
SR’s program
manager
Provide technical input required for PR,
during annual planning exercise.
Provide key technical and financial
information to the PR during data-validation
activities.
Conduct meetings with the PR to discuss
grant performance.
Make decisions on actions to take based on
feedback from the PR.
Track action plan.
Experience in M&E.
Understanding of how to interpret SRMT indicators.
Capacity to maintain good relationships and
effective communications with the PR..
Willingness to discuss and consider implementation
issues that may arise and find relevant solutions to
recommend to SR.
Open-mindedness.
Experience with managing complex health
programs.
SR’s SRMT
Administrator
Complete relevant sections of the SRMT
each month.
Perform regular backups of the SRMT.
Coordinate with PR’s configurator/SRMT
administrator to set up the SRMT.
Support each SR’s program manager during
review and analysis of SRMT program data.
Ensure PR and SR properly archive SRMT
Competence and appropriate level of knowledge in
the use of computers.
Skill in Excel, file backup, internet use.
Thorough familiarity with grant activities.
Experience creating PowerPoint presentations.
Ability to facilitate and structure analysis meetings.
Installation and Setup Guide for the SR Management Tool—Version 2.0 August 15, 2017
20
Actor Key responsibilities for SRMT setup and use Skills and knowledge required
files.
4. SRMT CONFIGURATION AND SETUP: THE SRMT’S MAJOR COMPONENTS
AND THE STEPS REQUIRED TO CONFIGURE AND SET IT UP
4.1. PREPARING TO CONFIGURE THE SRMT
A separate SRMT file must be created and configured for each SR. The entire SRMT is
contained within one Excel-based workbook, or file, containing multiple worksheets. The
file name is SR Management Tool ver 2.0. This file will be available on the Global
Fund’s website. It is a good practice to have only one copy of this file open at a time, and to
work through the SRMT file for each SR sequentially. Furthermore, it is good practice for
the PR to follow a naming convention for the SRMT files it creates for each SR; the PR
could in fact follow the guidance on file architecture suggested in paragraph 6.1.4 for SRs
when it sets up its initial SRMT files for SRs. For example, the PR could immediately save
the file for a given SR with the suggested file name in paragraph 6.1.4 B; this way, the PR
would create a separate SRMT file for each of its SRs.
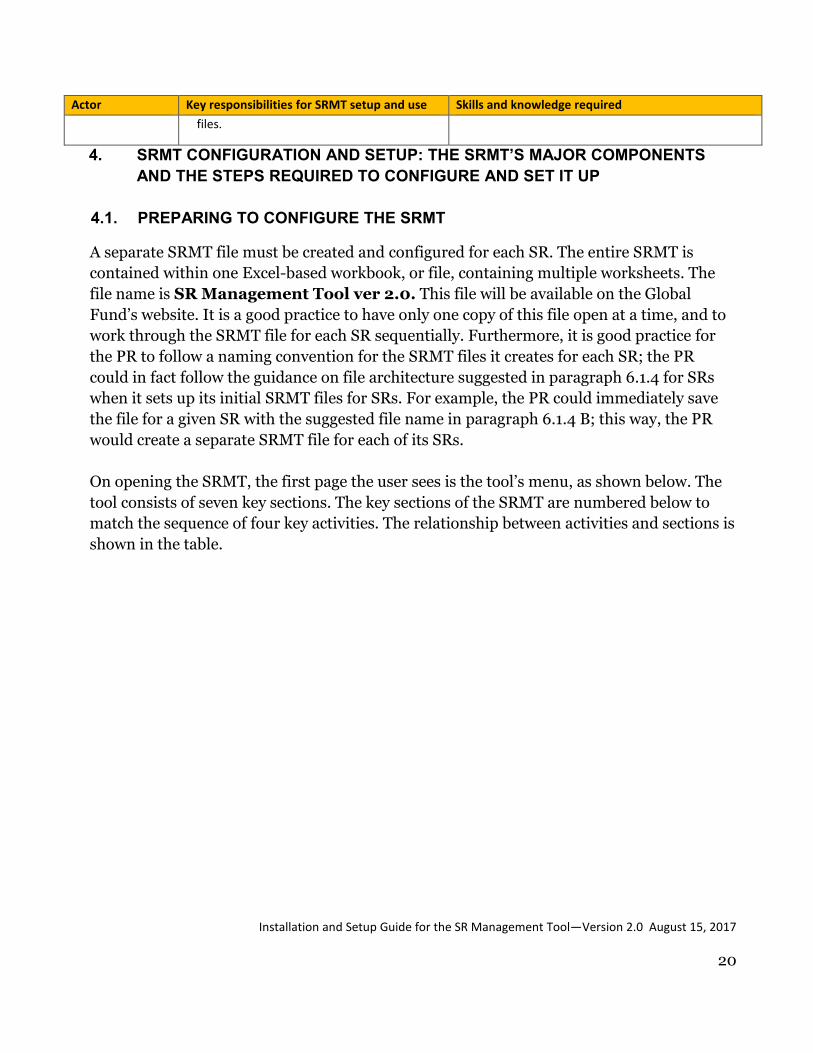
On opening the SRMT, the first page the user sees is the tool’s menu, as shown below. The
tool consists of seven key sections. The key sections of the SRMT are numbered below to
match the sequence of four key activities. The relationship between activities and sections is
shown in the table.

Installation and Setup Guide for the SR Management Tool—Version 2.0 August 15, 2017
21
As the <Menu> screen appears, the following message also appears across the top of this
page, telling the user to enable content. The user cannot proceed to using the SRMT
without enabling macros.
Every page of the SRMT displays an arrow at the top left of the page ; clicking on the
arrow returns users to the <Menu> screen.
Full use of the SRMT involves five key activities, which occur sequentially: configuration
and setup; data entry; analysis of summary data; management actions and follow-up; and
sending SRMT to PR. The table below shows how each of these key activities corresponds
to the various sections of the SRMT and identifies who has primary responsibility for
conducting each key activity.
The user must enable macros, before starting to work. To do this, press the “enable content” button appearing in the top part of the screen.
2. Monthly reports
3. Annex reports
4. PR Dashboard comments
5. Summary Information
6. Performance
7. Action Plan
1. Initial sSetup

Installation and Setup Guide for the SR Management Tool—Version 2.0 August 15, 2017
22
Key activity Corresponding
sections of the SRMT Who carries out this activity?
1. Configuration and
setup
1. Setup PR
2. Data entry 2. Monthly follow-
up reports
3. Annex reports
4. Comments
SRs
3. Analysis of summary
data
5. Summary
information
Performance
SRs are primarily responsible for this
activity. However, SRs collaborate
closely with the PR on review and
analysis of performance data.
4. Management actions
and follow-up
6. Action Plan SRs are primarily responsible for this.
However, SRs may choose to discuss
the follow-up actions they intend to
take to address implementation
obstacles with the PR.
5. Sending SRMT to PR Not applicable SRs
4.2. NAVIGATING THE SRMT’S WORKSHEETS
Multiple worksheets comprise the SRMT. Throughout the tool, various icons appear to help
users navigate around the tool. The table below shows each icon and explains its function.
Icon Function
Enables the user to go to the Main Menu without hiding the current
sheet
Enables the user to hide the current sheet and then go back to the
Main Menu
Enables the user to go to the top of page
Enables the user to go to the setup function shown, depending on the
step
4.3. BEGINNING TOOL CONFIGURATION AND SETUP
Installation and Setup Guide for the SR Management Tool—Version 2.0 August 15, 2017
23
To begin configuration and setup of the tool, the user clicks on the
<Initial setup> button located on the top left side of the Main
Menu.
The user will be taken to the Initial Setup worksheet, which
contains a box listing all the steps to be followed to set up and
configure the SRMT. Each step is described in section 5 of this User
Guide.
Installation and Setup Guide for the SR Management Tool—Version 2.0 August 15, 2017
24
5. INITIAL SETUP: INTRODUCTION, STEPS 1-8 AND STEPS 9-13
5.1. INTRODUCTION
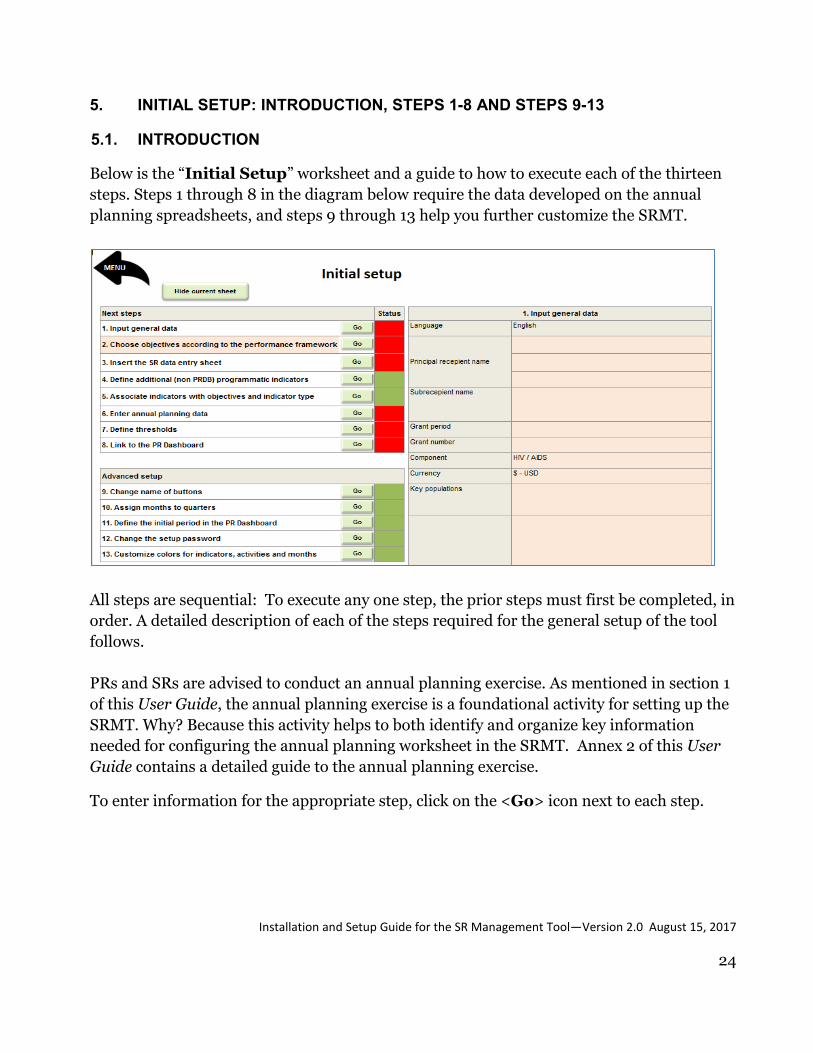
Below is the “Initial Setup” worksheet and a guide to how to execute each of the thirteen
steps. Steps 1 through 8 in the diagram below require the data developed on the annual
planning spreadsheets, and steps 9 through 13 help you further customize the SRMT.
All steps are sequential: To execute any one step, the prior steps must first be completed, in
order. A detailed description of each of the steps required for the general setup of the tool
follows.
PRs and SRs are advised to conduct an annual planning exercise. As mentioned in section 1
of this User Guide, the annual planning exercise is a foundational activity for setting up the
SRMT. Why? Because this activity helps to both identify and organize key information
needed for configuring the annual planning worksheet in the SRMT. Annex 2 of this User
Guide contains a detailed guide to the annual planning exercise.
To enter information for the appropriate step, click on the <Go> icon next to each step.
Installation and Setup Guide for the SR Management Tool—Version 2.0 August 15, 2017
25
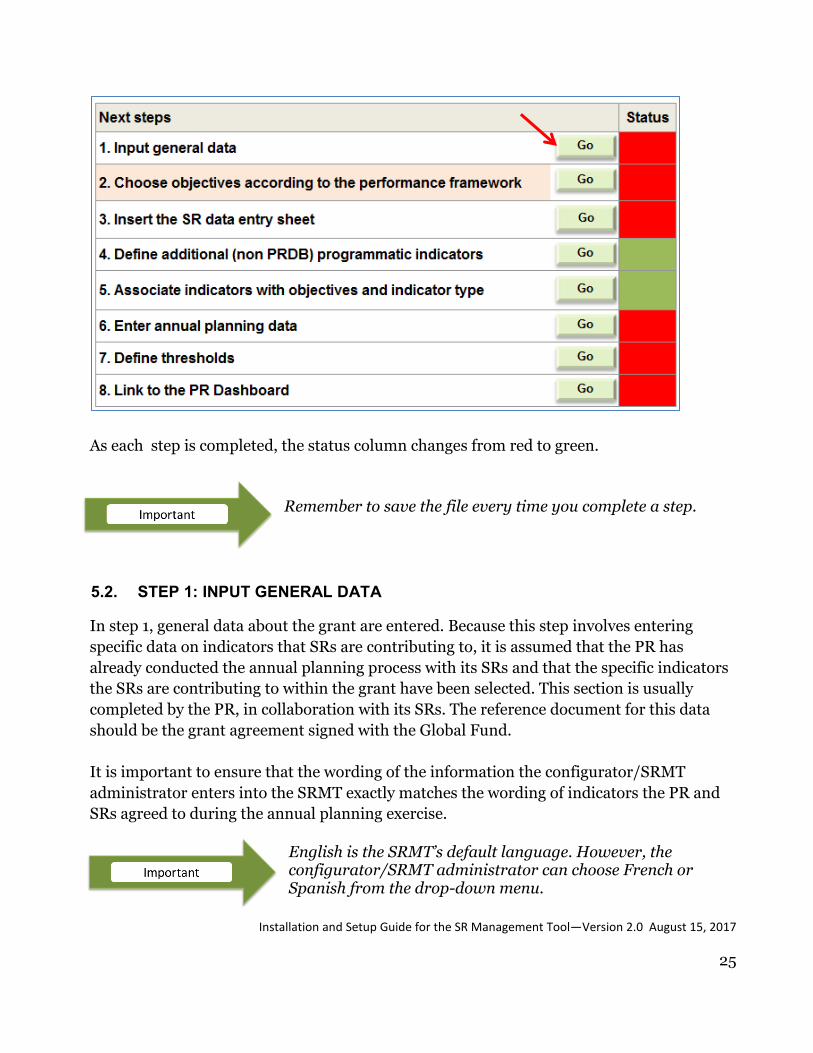
As each step is completed, the status column changes from red to green.
5.2. STEP 1: INPUT GENERAL DATA
In step 1, general data about the grant are entered. Because this step involves entering
specific data on indicators that SRs are contributing to, it is assumed that the PR has
already conducted the annual planning process with its SRs and that the specific indicators
the SRs are contributing to within the grant have been selected. This section is usually
completed by the PR, in collaboration with its SRs. The reference document for this data
should be the grant agreement signed with the Global Fund.
It is important to ensure that the wording of the information the configurator/SRMT
administrator enters into the SRMT exactly matches the wording of indicators the PR and
SRs agreed to during the annual planning exercise.
Remember to save the file every time you complete a step.
English is the SRMT’s default language. However, the configurator/SRMT administrator can choose French or Spanish from the drop-down menu.

Installation and Setup Guide for the SR Management Tool—Version 2.0 August 15, 2017
26
The screenshot below is an example of how to fill out the table with general grant
information.
Light pink or light orange boxes are enabled for user input data. Some boxes show default dropdown lists for easy filling.
Free text
Free text
This box consists of free text, so type or copy and paste them in here. If the box does not apply to the grant, then write “N/A” for “not applicable.”
Drop- down menu
Remember to save your work!!
Installation and Setup Guide for the SR Management Tool—Version 2.0 August 15, 2017
27
5.3. STEP 2: CHOOSE OBJECTIVES OR MODULES BASED ON THE GRANT
PERFORMANCE FRAMEWORK
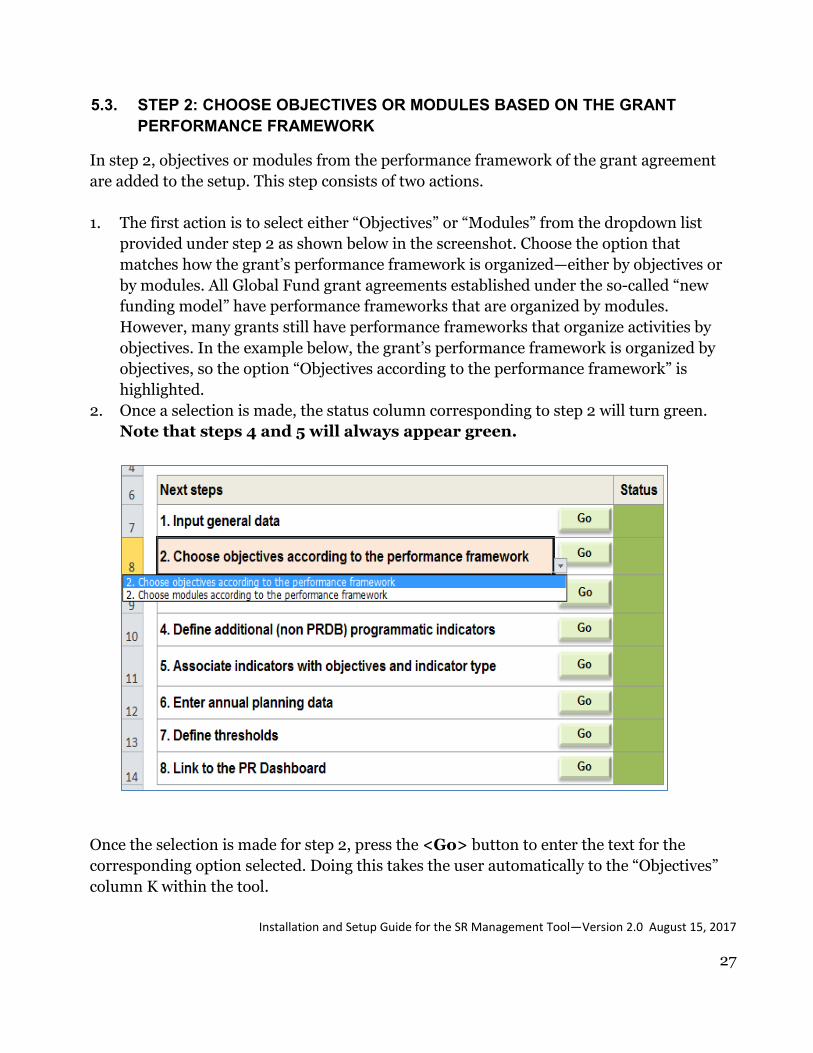
In step 2, objectives or modules from the performance framework of the grant agreement
are added to the setup. This step consists of two actions.
1. The first action is to select either “Objectives” or “Modules” from the dropdown list
provided under step 2 as shown below in the screenshot. Choose the option that
matches how the grant’s performance framework is organized—either by objectives or
by modules. All Global Fund grant agreements established under the so-called “new
funding model” have performance frameworks that are organized by modules.
However, many grants still have performance frameworks that organize activities by
objectives. In the example below, the grant’s performance framework is organized by
objectives, so the option “Objectives according to the performance framework” is
highlighted.
2. Once a selection is made, the status column corresponding to step 2 will turn green.
Note that steps 4 and 5 will always appear green.
Once the selection is made for step 2, press the <Go> button to enter the text for the
corresponding option selected. Doing this takes the user automatically to the “Objectives”
column K within the tool.
Installation and Setup Guide for the SR Management Tool—Version 2.0 August 15, 2017
28
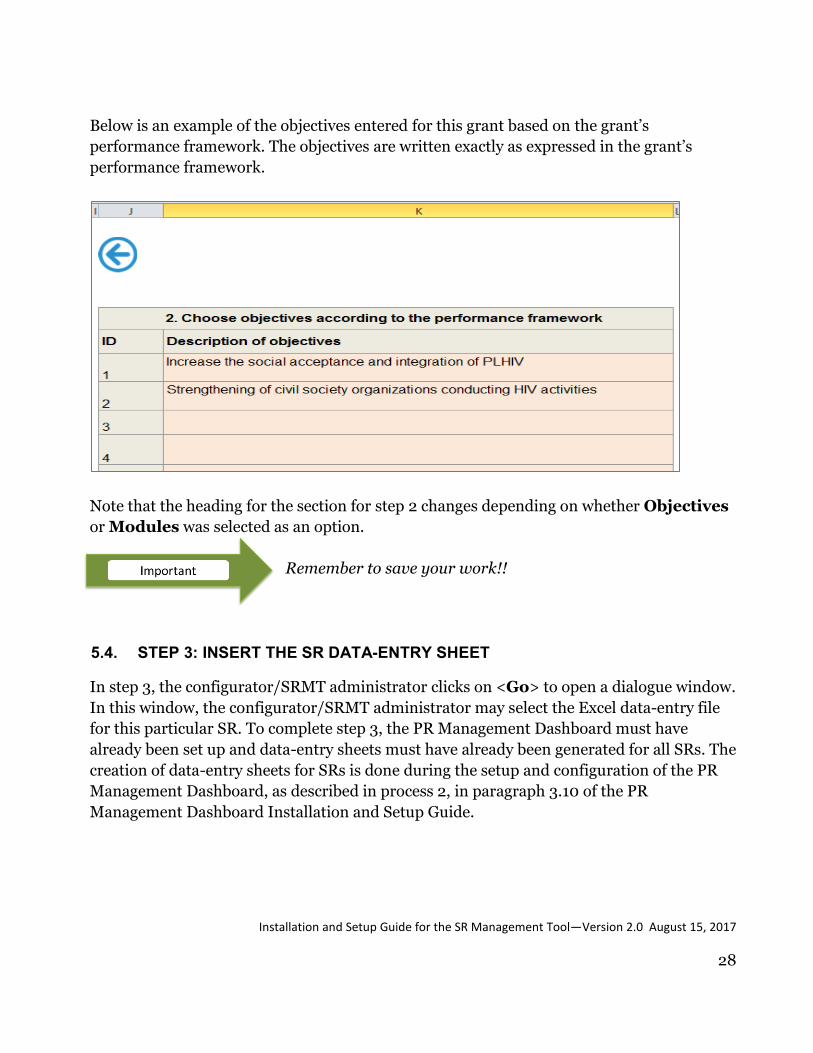
Below is an example of the objectives entered for this grant based on the grant’s
performance framework. The objectives are written exactly as expressed in the grant’s
performance framework.
Note that the heading for the section for step 2 changes depending on whether Objectives
or Modules was selected as an option.
5.4. STEP 3: INSERT THE SR DATA-ENTRY SHEET
In step 3, the configurator/SRMT administrator clicks on <Go> to open a dialogue window.
In this window, the configurator/SRMT administrator may select the Excel data-entry file
for this particular SR. To complete step 3, the PR Management Dashboard must have
already been set up and data-entry sheets must have already been generated for all SRs. The
creation of data-entry sheets for SRs is done during the setup and configuration of the PR
Management Dashboard, as described in process 2, in paragraph 3.10 of the PR
Management Dashboard Installation and Setup Guide.
Remember to save your work!!
Installation and Setup Guide for the SR Management Tool—Version 2.0 August 15, 2017
29
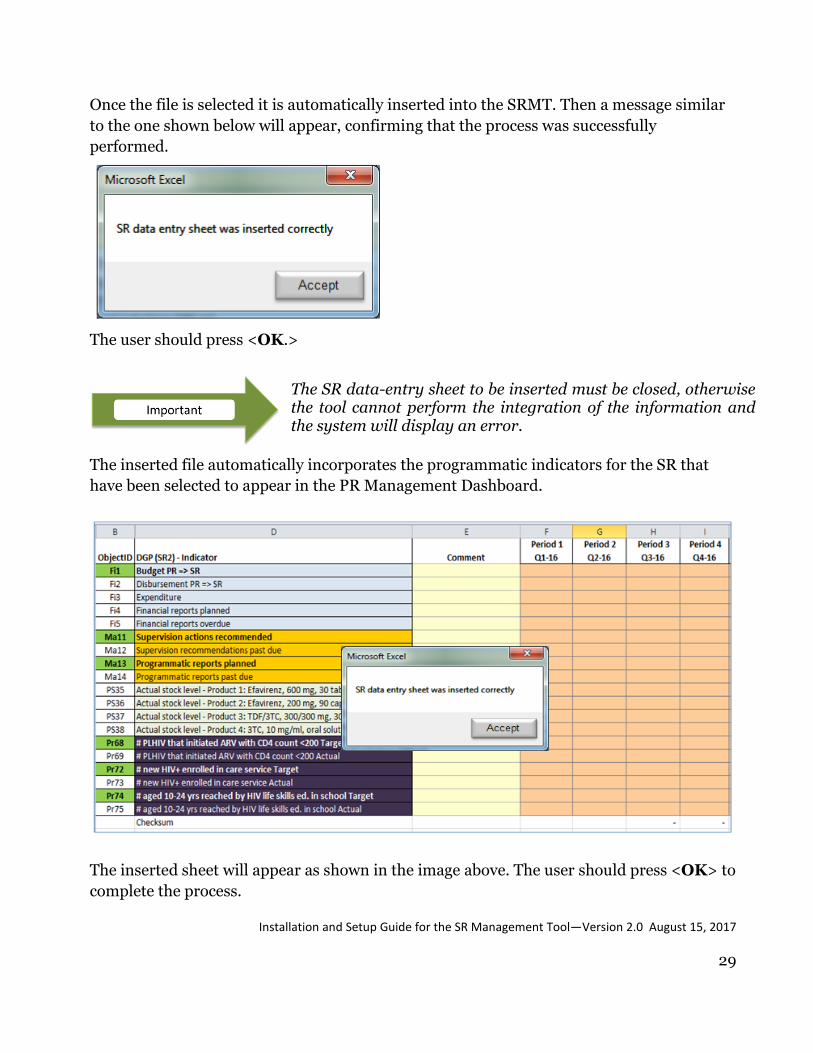
Once the file is selected it is automatically inserted into the SRMT. Then a message similar
to the one shown below will appear, confirming that the process was successfully
performed.
The user should press <OK.>
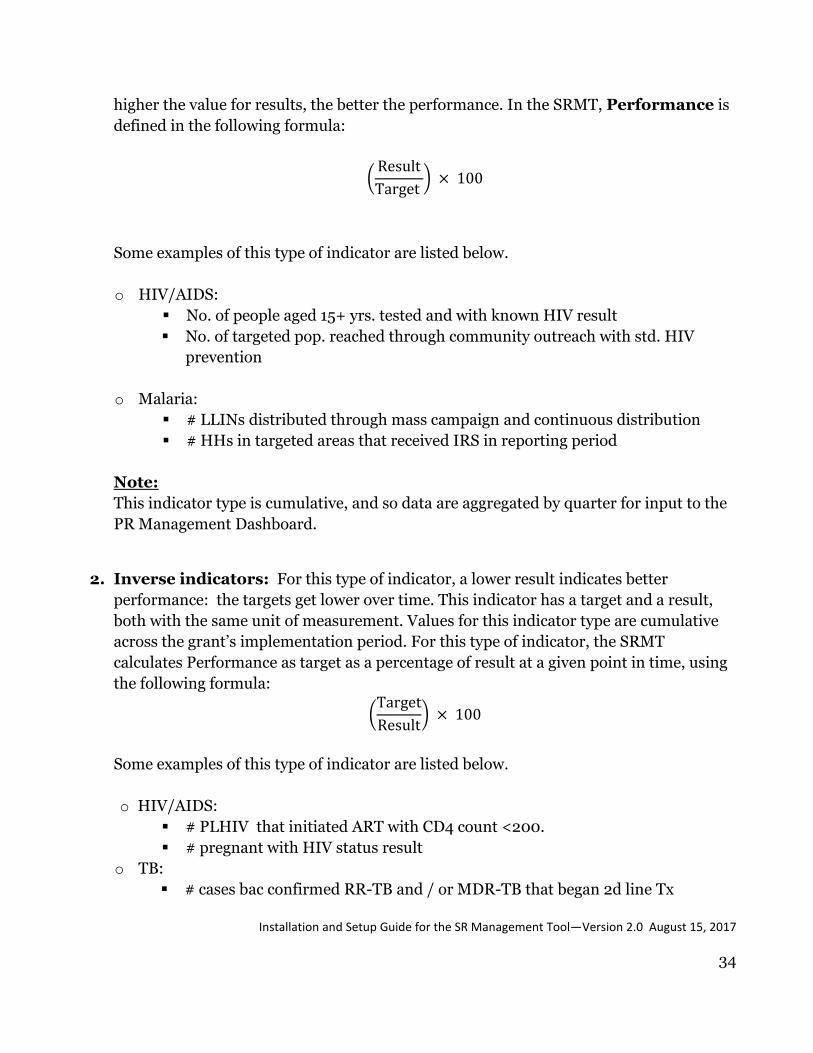
The inserted file automatically incorporates the programmatic indicators for the SR that
have been selected to appear in the PR Management Dashboard.
The inserted sheet will appear as shown in the image above. The user should press <OK> to
complete the process.
The SR data-entry sheet to be inserted must be closed, otherwise the tool cannot perform the integration of the information and the system will display an error.

Installation and Setup Guide for the SR Management Tool—Version 2.0 August 15, 2017
30
At this point, the user should verify three items:
1. Verify that the following message has appeared.
2. An additional sheet showing the SR’s name should have appeared at the bottom of
the screen of the Excel workbook. Verify that the correct SR’s name appears in the
Excel sheet tabs bar. If a different name appears, the wrong SR worksheet was
inserted. If the wrong sheet is accidentally inserted into the tool, delete the inserted
sheet (right click on the tab and select delete) and then repeat step 3.
3. Verify that the indicators that appear in the inserted SR data-entry sheet correspond
to those that the SR using the SRMT contributes to. This can be verified by scrolling
right in the setup worksheet all the way to column S.
Confirm that the correct sheet has been inserted before proceeding to the next step. Changing the sheet later will be difficult because the SR data-entry sheet will need to be removed and reinserted.

Installation and Setup Guide for the SR Management Tool—Version 2.0 August 15, 2017
31
5.5. STEP 4: DEFINE ADDITIONAL PROGRAMMATIC INDICATORS
Step 4 is executed if the SR is tracking indicators additional to those in the PR Management
Dashboard. Otherwise, skip step 4.
Examples of indicators additional to those in the PR Management Dashboard could include
work plan tracking measures from the grant agreement or indicators that apply solely to
SRs to measure operational progress of the grant.
To add these indicators, click on the button <Go> next to step 4; this will direct you to the
figure below. (Information under columns P and Q will be entered in step 5.)

Installation and Setup Guide for the SR Management Tool—Version 2.0 August 15, 2017
32
To complete step 4, verify that the information entered in the table shown exactly matches
what is written in the grant agreement between the PR and the Global Fund.
5.6. STEP 5: ASSOCIATE INDICATORS WITH OBJECTIVES OR MODULES AND
INDICATOR TYPE
In step 5, the indicators that were entered in steps 3 and 4 must be linked to objectives or
modules entered in step 2. It is recommended that the person configuring the SRMT have
the grant agreement on hand as a reference to complete this step.
To carry out this step, the user should press the <Go> button next to step 5. Doing so will
take the user to column U titled “Associated Objective” or “Associated Module,”
where a drop-down menu allows for selection of the appropriate indicator. The user should
select the objective or module associated with each indicator to which the SR contributes
(remember that each objective or module may have more than one indicator).
After selecting the objective or module with which the indicator is associated, the user
selects the indicator type from the dropdown menu under the column <Indicator type> :
there are three options available. Later in this subsection, an explanation of each indicator
type is provided. The screenshot below shows the indicator types to select from. Before
selecting an indicator type, users should refer to the section below in to correctly classify
indicators.
If the step is performed correctly, the setup menu column next to the finished step should be green.
Remember to save your work!!

Installation and Setup Guide for the SR Management Tool—Version 2.0 August 15, 2017
33
The same action should be completed for the indicators that were added in step 4. The user
will need to scroll over to column Q to do so.
The three indicator types are described below.
1. Standard indicators: This indicator is also commonly called a “simple indicator.”
This indicator has a result and a target, both with the same unit of measurement. Values
for this indicator type are cumulative over the grant’s implementation period. The
Remember to save your work!!
Installation and Setup Guide for the SR Management Tool—Version 2.0 August 15, 2017
34
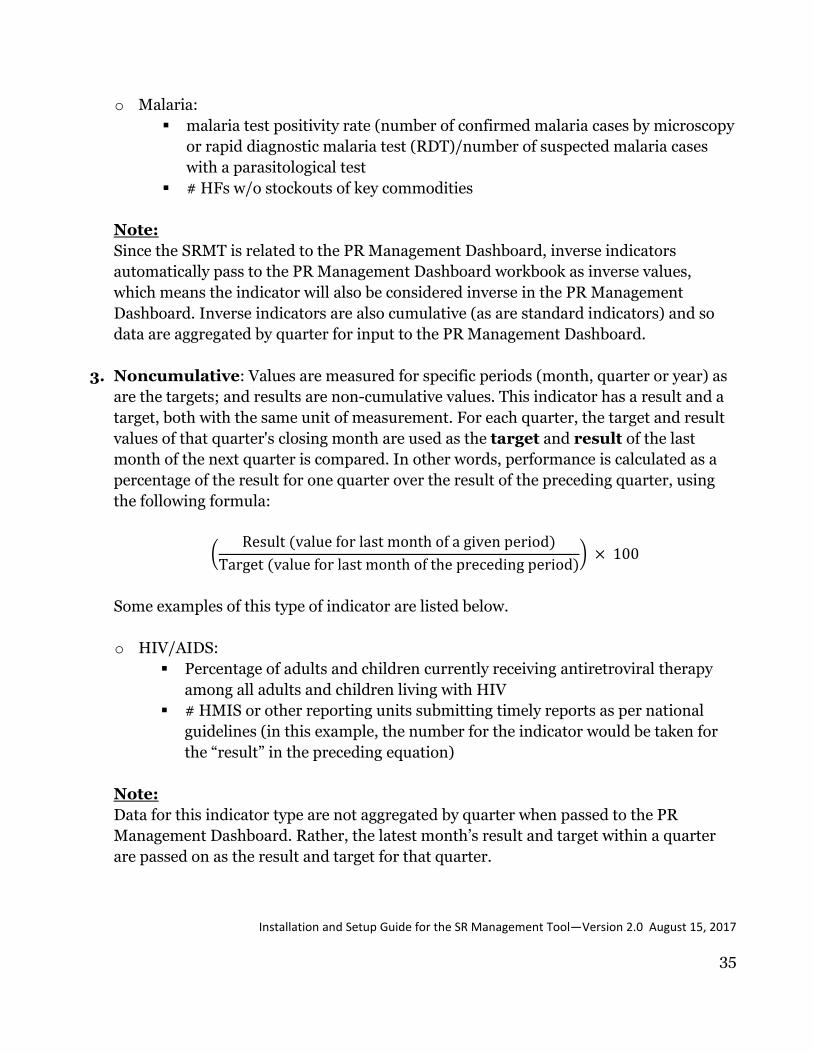
higher the value for results, the better the performance. In the SRMT, Performance is
defined in the following formula:
(Result
Target ) × 100
Some examples of this type of indicator are listed below.
o HIV/AIDS:
No. of people aged 15+ yrs. tested and with known HIV result
No. of targeted pop. reached through community outreach with std. HIV
prevention
o Malaria:
# LLINs distributed through mass campaign and continuous distribution
# HHs in targeted areas that received IRS in reporting period
Note:
This indicator type is cumulative, and so data are aggregated by quarter for input to the
PR Management Dashboard.
2. Inverse indicators: For this type of indicator, a lower result indicates better
performance: the targets get lower over time. This indicator has a target and a result,
both with the same unit of measurement. Values for this indicator type are cumulative
across the grant’s implementation period. For this type of indicator, the SRMT
calculates Performance as target as a percentage of result at a given point in time, using
the following formula:
(Target
Result) × 100
Some examples of this type of indicator are listed below.
o HIV/AIDS:
# PLHIV that initiated ART with CD4 count <200.
# pregnant with HIV status result
o TB:
# cases bac confirmed RR-TB and / or MDR-TB that began 2d line Tx
Installation and Setup Guide for the SR Management Tool—Version 2.0 August 15, 2017
35
o Malaria:
malaria test positivity rate (number of confirmed malaria cases by microscopy
or rapid diagnostic malaria test (RDT)/number of suspected malaria cases
with a parasitological test
# HFs w/o stockouts of key commodities
Note:
Since the SRMT is related to the PR Management Dashboard, inverse indicators
automatically pass to the PR Management Dashboard workbook as inverse values,
which means the indicator will also be considered inverse in the PR Management
Dashboard. Inverse indicators are also cumulative (as are standard indicators) and so
data are aggregated by quarter for input to the PR Management Dashboard.
3. Noncumulative: Values are measured for specific periods (month, quarter or year) as
are the targets; and results are non-cumulative values. This indicator has a result and a
target, both with the same unit of measurement. For each quarter, the target and result
values of that quarter's closing month are used as the target and result of the last
month of the next quarter is compared. In other words, performance is calculated as a
percentage of the result for one quarter over the result of the preceding quarter, using
the following formula:
(Result (value for last month of a given period)
Target (value for last month of the preceding period)) × 100
Some examples of this type of indicator are listed below.
o HIV/AIDS:
Percentage of adults and children currently receiving antiretroviral therapy
among all adults and children living with HIV
# HMIS or other reporting units submitting timely reports as per national
guidelines (in this example, the number for the indicator would be taken for
the “result” in the preceding equation)
Note:
Data for this indicator type are not aggregated by quarter when passed to the PR
Management Dashboard. Rather, the latest month’s result and target within a quarter
are passed on as the result and target for that quarter.
Installation and Setup Guide for the SR Management Tool—Version 2.0 August 15, 2017
36
5.7. STEP 6: ENTER ANNUAL PLANNING DATA SECTION OF THE SRMT
HOW THE ANNUAL PLANNING WORKSHEET IS ORGANIZED 5.7.1.
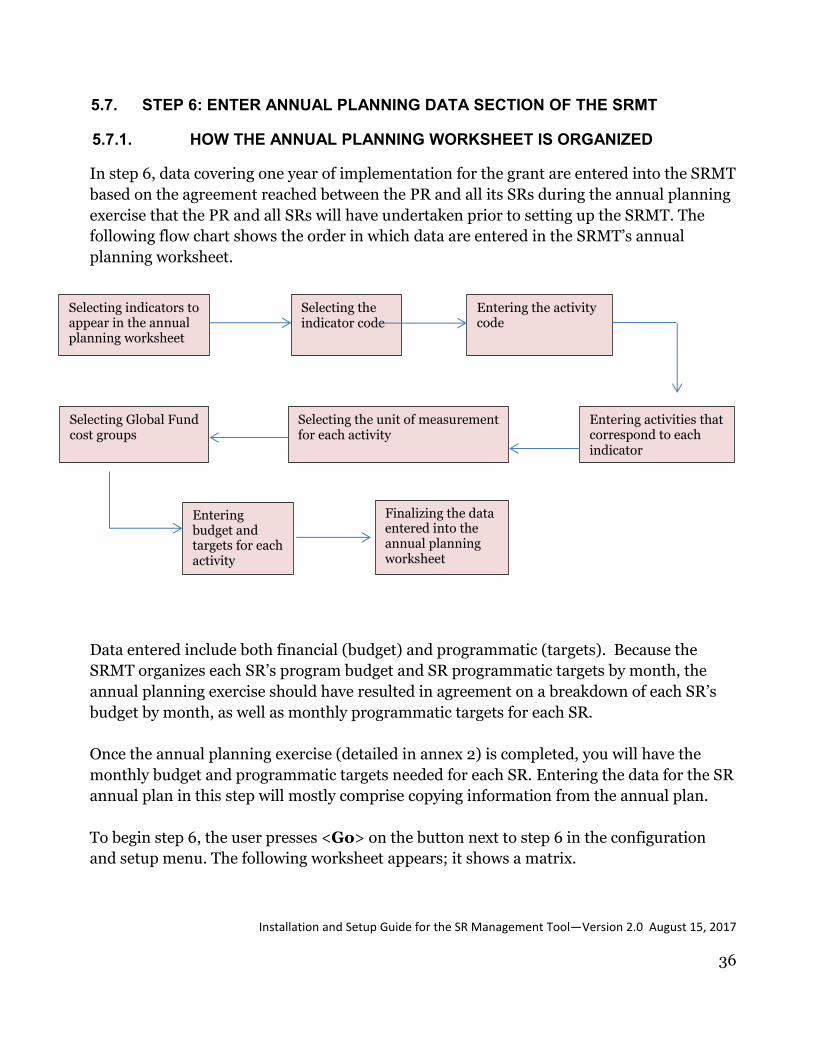
In step 6, data covering one year of implementation for the grant are entered into the SRMT
based on the agreement reached between the PR and all its SRs during the annual planning
exercise that the PR and all SRs will have undertaken prior to setting up the SRMT. The
following flow chart shows the order in which data are entered in the SRMT’s annual
planning worksheet.
Data entered include both financial (budget) and programmatic (targets). Because the
SRMT organizes each SR’s program budget and SR programmatic targets by month, the
annual planning exercise should have resulted in agreement on a breakdown of each SR’s
budget by month, as well as monthly programmatic targets for each SR.
Once the annual planning exercise (detailed in annex 2) is completed, you will have the
monthly budget and programmatic targets needed for each SR. Entering the data for the SR
annual plan in this step will mostly comprise copying information from the annual plan.
To begin step 6, the user presses <Go> on the button next to step 6 in the configuration
and setup menu. The following worksheet appears; it shows a matrix.
Selecting indicators to appear in the annual planning worksheet
Finalizing the data entered into the annual planning worksheet
Entering the activity code
Entering activities that correspond to each indicator
Selecting Global Fund cost groups
Selecting the unit of measurement for each activity
Selecting the indicator code
Entering budget and targets for each activity

Installation and Setup Guide for the SR Management Tool—Version 2.0 August 15, 2017
37
The user can scroll right across the bottom of the worksheet to view its remaining columns
as shown below.

Installation and Setup Guide for the SR Management Tool—Version 2.0 August 15, 2017
38
The matrix of the annual plan contains nine variables, for which data must be entered.
The following table defines the variables.
Column and Label Description
Column A
“Item”
Internal unique identifier code for each indicator or activity in the annual plan (automatically
assigned by the tool).
Column B
“Item type”
Each item has three possible types. A drop-down menu allows the configurator/SRMT
administrator to indicate the type of the selected item. This is done on every line item of the
annual plan. These are the three item types:
1. “Indicator”: To enter indicators
2. “Contributing activity”: These are activities for which the programmatic targets and budget
aggregated to the total targets and budget for the indicator. These activities contribute
directly to the measurement of the indicator.
3. “Non-contributing Activity”: These are activities that consume financial resources, but do
not contribute directly to the measurement of an indicator. For these activities, budget
information is aggregated for inclusion into the total budget for the activity. However,
programmatic targets are set for these indicators for operational tracking purposes, but
the monthly results are not aggregated to contribute to overall result for the indicator.
When “Indicator” is selected as the “Item type,” an indicator is added to the annual planning
worksheet. This will cause the indicator’s name to automatically populate in the
“Indicator/Activity” cell.
Column C
“Indicator code group”
Each indicator has a unique indicator identifier (called “indicator code” or “ID”). The indicator is
in a row colored light blue.
This column associates each indicator to a group of activities, which appear in rows colored
white or light yellow.
For each activity added to the annual planning sheet, this unique indicator identifier must be
entered (into the “Indicator code group” column) to show which activities go with which
indicator and to group these activities with indicators.
To do this, the user selects the unique indicator identifier in the “Indicator code group” column.
Column D
“Activity code”
In this column, the configurator/SRMT administrator enters the PR/SR defined codes (ideally
corresponding to the accounting system) to identify activities and sub-activities carried out by
the grant.
Column E
“Indicator / Activity”
This cell displays the indicator or activity. For indicators, the text description of the indicator is
automatically displayed. For activities, however, the text must be typed in by the user.
Column F
“Unit of measurement (target)”
This cell of free text allows the user to specify what unit is being measured for each
programmatic target. Examples would be patients, visits, reports, etc.
Installation and Setup Guide for the SR Management Tool—Version 2.0 August 15, 2017
39
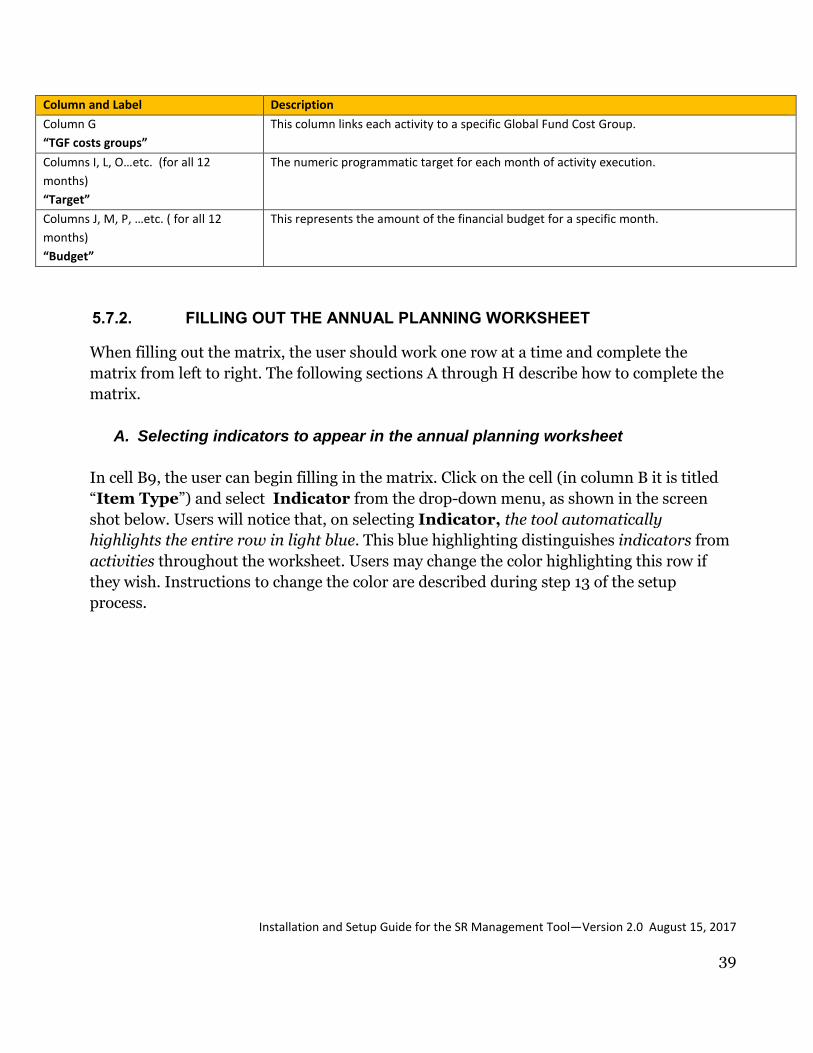
Column and Label Description
Column G
“TGF costs groups”
This column links each activity to a specific Global Fund Cost Group.
Columns I, L, O…etc. (for all 12
months)
“Target”
The numeric programmatic target for each month of activity execution.
Columns J, M, P, …etc. ( for all 12
months)
“Budget”
This represents the amount of the financial budget for a specific month.
FILLING OUT THE ANNUAL PLANNING WORKSHEET 5.7.2.
When filling out the matrix, the user should work one row at a time and complete the
matrix from left to right. The following sections A through H describe how to complete the
matrix.
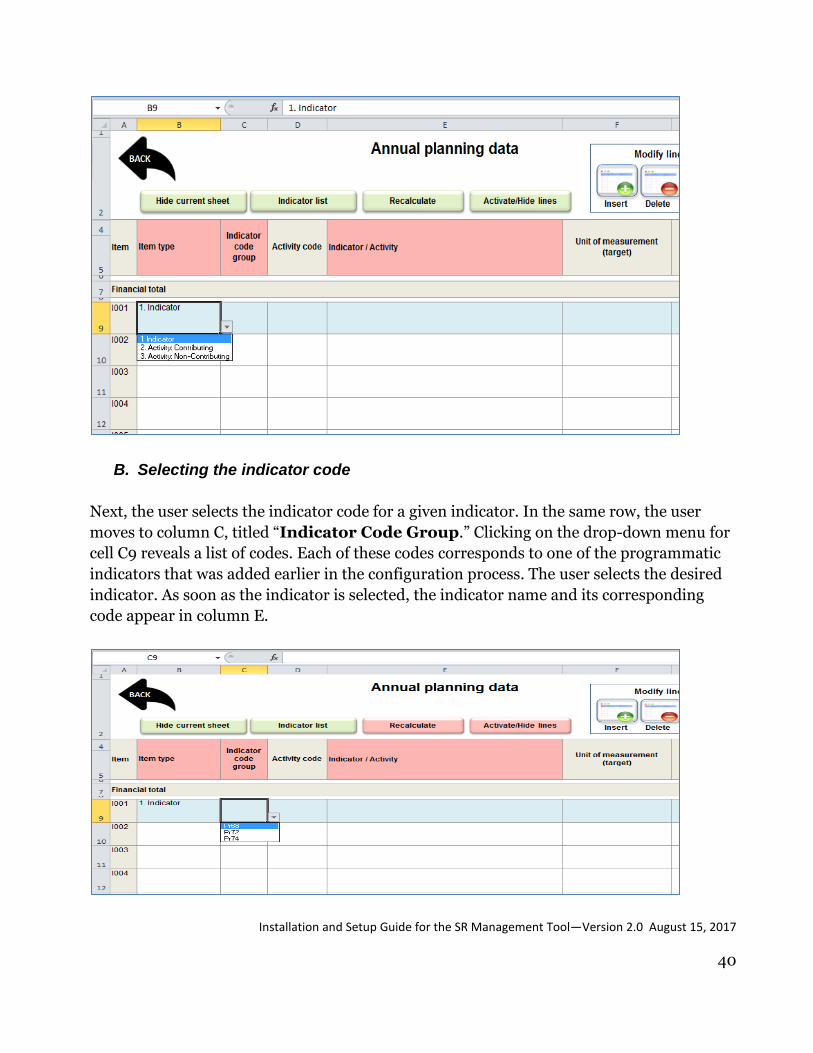
A. Selecting indicators to appear in the annual planning worksheet
In cell B9, the user can begin filling in the matrix. Click on the cell (in column B it is titled
“Item Type”) and select Indicator from the drop-down menu, as shown in the screen
shot below. Users will notice that, on selecting Indicator, the tool automatically
highlights the entire row in light blue. This blue highlighting distinguishes indicators from
activities throughout the worksheet. Users may change the color highlighting this row if
they wish. Instructions to change the color are described during step 13 of the setup
process.
Installation and Setup Guide for the SR Management Tool—Version 2.0 August 15, 2017
40
B. Selecting the indicator code
Next, the user selects the indicator code for a given indicator. In the same row, the user
moves to column C, titled “Indicator Code Group.” Clicking on the drop-down menu for
cell C9 reveals a list of codes. Each of these codes corresponds to one of the programmatic
indicators that was added earlier in the configuration process. The user selects the desired
indicator. As soon as the indicator is selected, the indicator name and its corresponding
code appear in column E.

Installation and Setup Guide for the SR Management Tool—Version 2.0 August 15, 2017
41
As soon as the indicator code is selected, the indicator name automatically appears.
A user may not know which code corresponds to which indicator. In this case the user can
click on the light green button <Indicator list> at the top of the page to see a description
of the indicator.
When the <Indicator List> button is pressed, the following window appears:

Installation and Setup Guide for the SR Management Tool—Version 2.0 August 15, 2017
42
Note:
The code in the brackets [ ] of the pop-up window (where a red arrow is pointing in the
screenshot above) should be selected from the “Indicator code group” column.
Once the indicator code has been selected, the user can then enter the activity code.
C. Entering the activity code
By the time the SRMT is being configured, it is expected that the PR will already have
assigned accounting codes to all activities and subactivities in the grant (as described in the
table in section 5.7.1 regarding column D) and will have shared the codes with the relevant
SRs during the annual planning process. The activity codes and sub-codes will be been
assigned using a sequential numbering system. For example, a main activity would have a
code of 3, and its three subactivities will have the codes 3.1, 3.2 and 3.3.
Using the list of activity codes shared during the annual planning process, the user types in
the assigned codes into column D as shown in the screenshot below. The cells in Column D
allow the user to enter free text.

Installation and Setup Guide for the SR Management Tool—Version 2.0 August 15, 2017
43
Notice that the cell showing the indicator name contains three pieces of information: the
indicator code, followed by the actual indicator name followed by the indicator type. The
indicator type is selected by default, but can be changed in one of the subsequent steps of
configuration.
D. Entering activities that correspond to each indicator
This next step involves entering specific activities in the SRs’ work plans that contribute to
each indicator.
The worksheet allows for two types of work plan activities – “contributing activities” and
“noncontributing activities.”
“Contributing activities” are activities whose targets and results will be aggregated for the
indicator corresponding to the activity. The total targets and results for contributing
activities are those that will be reported by SRs to the PR for the purposes of appearing in
the PR Management Dashboard.
“Non-contributing activities” are activities whose targets and results, though important to
track for operational purposes to ensure progression of the activity, will not be counted
toward the targets and results for their indicator.
“Contributing” and “non-contributing” activities should already have been defined and
coded during the annual work planning process. The user should therefore use the

Installation and Setup Guide for the SR Management Tool—Version 2.0 August 15, 2017
44
document finalized during the annual work planning process to enter contributing and non-
contributing activities as well as their corresponding codes.
It is recommended that the user select all contributing activities for each indicator first,
followed by any non-contributing activity. “Contributing” and “Non-contributing” activities
are selected from the “Item Type” column – column C. Each contributing activity will
automatically be highlighted in light yellow. Each non-contributing activity will have a
white background. This color coding helps users easily distinguish which rows comprise
indicators, contributing activities and non-contributing activities.
E. Selecting the unit of measurement for each activity
Each activity must have a unit of measurement associated with it so that both PR and SR
are clear about what is being counted when targets are being set and measured for each
contributing and non-contributing activity. The user should only enter the unit of
measurement in the rows for activities, not in the rows for indicators, as shown in the
example below. The unit of measurement is entered in column F, which is a column that
allows for free text. In addition to the unit of measurement, some users may also choose to
enter unit costs for reference purposes.
Installation and Setup Guide for the SR Management Tool—Version 2.0 August 15, 2017
45
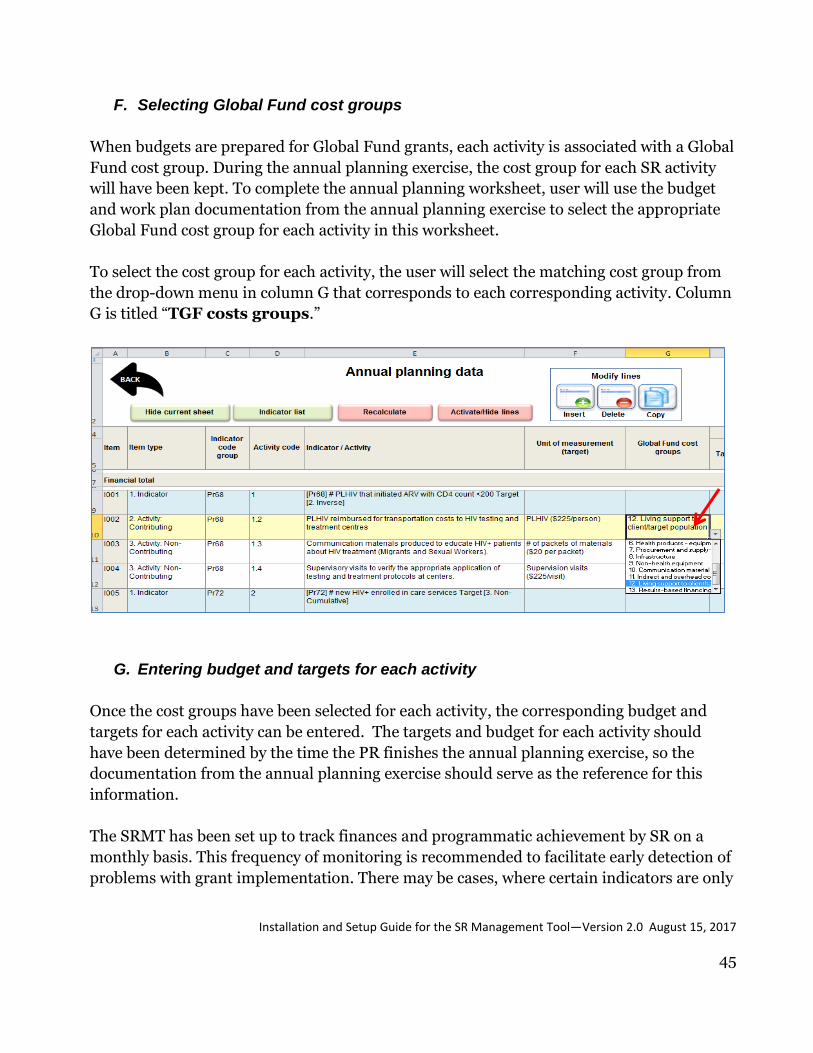
F. Selecting Global Fund cost groups
When budgets are prepared for Global Fund grants, each activity is associated with a Global
Fund cost group. During the annual planning exercise, the cost group for each SR activity
will have been kept. To complete the annual planning worksheet, user will use the budget
and work plan documentation from the annual planning exercise to select the appropriate
Global Fund cost group for each activity in this worksheet.
To select the cost group for each activity, the user will select the matching cost group from
the drop-down menu in column G that corresponds to each corresponding activity. Column
G is titled “TGF costs groups.”
G. Entering budget and targets for each activity
Once the cost groups have been selected for each activity, the corresponding budget and
targets for each activity can be entered. The targets and budget for each activity should
have been determined by the time the PR finishes the annual planning exercise, so the
documentation from the annual planning exercise should serve as the reference for this
information.
The SRMT has been set up to track finances and programmatic achievement by SR on a
monthly basis. This frequency of monitoring is recommended to facilitate early detection of
problems with grant implementation. There may be cases, where certain indicators are only

Installation and Setup Guide for the SR Management Tool—Version 2.0 August 15, 2017
46
to be measured semiannually or annually, in which case programmatic targets and
achievements will only be entered into cells that correspond to the respective monitoring
frequency. All other cells should be left blank.
Note that nothing is entered for budget or targets on the indicator (light blue) line, because
the numbers in the activity cells are automatically added up and the totals appear on the
indicator line (light blue row).
Enter the targets corresponding to each activity (light yellow row and white rows only) in
column I titled “Target,” using whole numbers.
Enter the budget corresponding to each activity (light yellow row and white rows only) in
column J titled “Budget” for each activity.
It is important to note the differences in how budget and target data entered into annual
planning worksheet are aggregated:
1. Target data: Only the target data entered on the light yellow line corresponding to
contributing activities are aggregated up to the corresponding total target on the light
blue indicator line. Target data for non-contributing activities are not aggregated.
Installation and Setup Guide for the SR Management Tool—Version 2.0 August 15, 2017
47
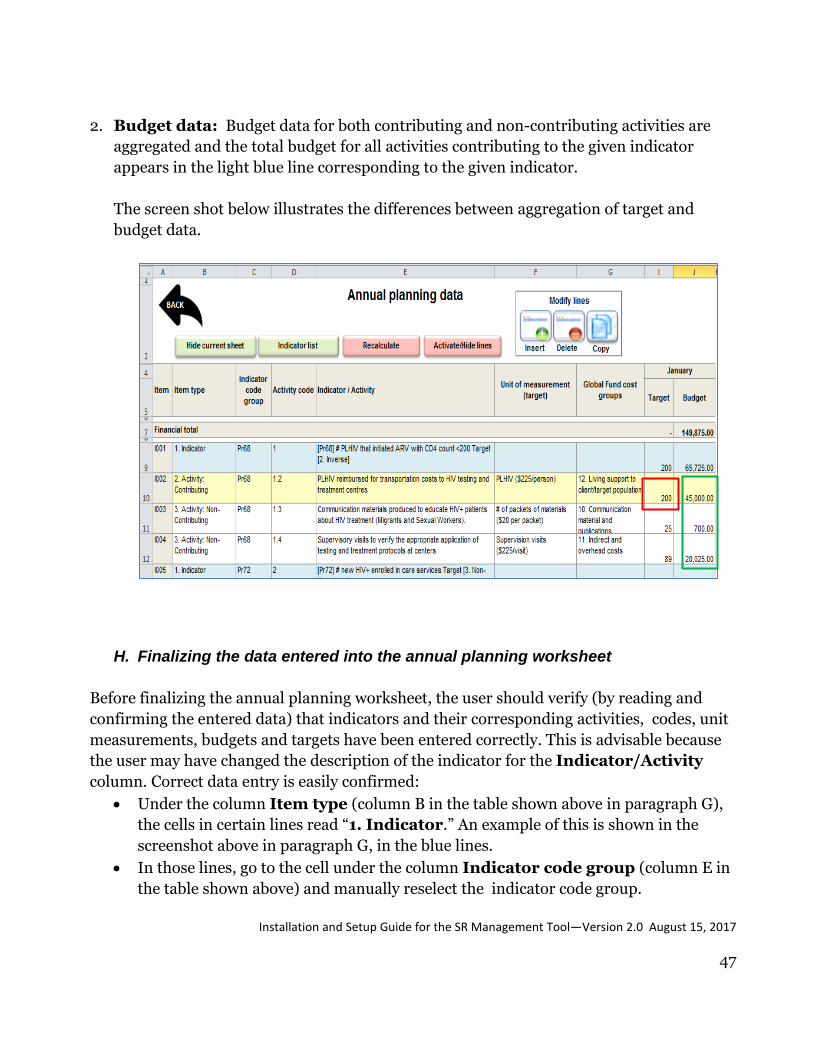
2. Budget data: Budget data for both contributing and non-contributing activities are
aggregated and the total budget for all activities contributing to the given indicator
appears in the light blue line corresponding to the given indicator.
The screen shot below illustrates the differences between aggregation of target and
budget data.
H. Finalizing the data entered into the annual planning worksheet
Before finalizing the annual planning worksheet, the user should verify (by reading and
confirming the entered data) that indicators and their corresponding activities, codes, unit
measurements, budgets and targets have been entered correctly. This is advisable because
the user may have changed the description of the indicator for the Indicator/Activity
column. Correct data entry is easily confirmed:
Under the column Item type (column B in the table shown above in paragraph G),
the cells in certain lines read “1. Indicator.” An example of this is shown in the
screenshot above in paragraph G, in the blue lines.
In those lines, go to the cell under the column Indicator code group (column E in
the table shown above) and manually reselect the indicator code group.

Installation and Setup Guide for the SR Management Tool—Version 2.0 August 15, 2017
48
Reselecting the cells for the indicator code group will cause the content of the cell in
the column Indicator/Activity (column E) to refresh.
If a change was made to the description of the indicator associated with the indicator
code group (column B), then the contents of the cell under Indicator/Activity will
refresh, or repopulate, accordingly.
The refreshed cell will read as it does in the PR Management Dashboard, which has a
limited number of characters. However, to help improve communication between
the PR and SRs, which is one of the expected outcomes of using the SRMT (see
paragraph 1.3 of this User Guide), users may wish to expand this text to be more
readily understood by SRs and PRs. The SRMT does not have the character
limitations the PR Management Dashboard has.
Once all the required data have been entered into the worksheet, the user must execute the
<Recalculate> and <Activate/Hide Lines> functionalities to ensure that the SRMT
functions correctly thereafter.
The user first clicks the <Recalculate> button. This action
starts the recalculation process, during which all indicators
and activities are correctly referenced, formulas are correctly
calculated, cell security is verified and colors for corresponding lines are verified.
Immediately after the button is pressed the following progress bar appears to demonstrate
that the recalculation process in underway:
The final step for setting up the annual planning worksheet is
to press the <Activate/Hide Lines> button. Doing so starts the
internal process of adjusting the lines in all sheets and activating or hiding lines (rows)
depending on the total number of lines used in the worksheet.
Remember to save your work!!

Installation and Setup Guide for the SR Management Tool—Version 2.0 August 15, 2017
49
Note:
The tool allows the configurator/SRMT administrator to insert, delete or copy individual
line items in the annual plan. These actions can be carried out by selecting the appropriate
button within the Modify Lines box in the top right part of the screen (see red arrow
below). After modifying the annual plan by inserting, deleting or copying a line, the
configurator/SRMT administrator must press the Recalculate and Activate/Hide Lines
buttons to complete the action of inserting, deleting or copying. Otherwise, no lines will be
inserted, deleted or copied.
5.8. STEP 7: DEFINE PERFORMANCE THRESHOLDS
Step 7 establishes the thresholds to be used by the SRMT to display color-coded visual
alerts in the monthly follow-up reports and the summary result sheets. Thresholds are
entered by the user.
To begin this step, the user presses the <Back> button to return to the initial setup menu
and presses the <Go> button next to step 7 in the menu. The user will be taken to the
section of the setup worksheet shown in the screenshot below.

Installation and Setup Guide for the SR Management Tool—Version 2.0 August 15, 2017
50
PRs configuring the SRMT are strongly encouraged to use the same thresholds as those that
are used in the PR Management Dashboard. PR Management Dashboard thresholds are
usually based on thresholds used by the Global Fund to measure grant performance. The
numbers corresponding to thresholds are entered in the four light pink or orange boxes
shown below.
Monthly or quarterly results that are lower than the value of the threshold displayed in the
column “Red (<)” indicate extremely inadequate performance. Results that are greater
than or equal to the value specified in the column “Green (>=)” indicate achievement of
desired progress. Values that fall between the red and green limits indicate inadequate or
unsatisfactory progress and appear as yellow in the SRMT dashboard display.
The screenshot below uses Global Fund thresholds. However, PRs may at their discretion
adjust the thresholds to match those selected for the PR Management Dashboard. If some
other values are chosen, clear documentation should be kept and the alternative thresholds
explained to the SRs. All SRs should have the same thresholds.
Remember to save your work!!

Installation and Setup Guide for the SR Management Tool—Version 2.0 August 15, 2017
51
5.9. STEP 8: LINK THE SMRT TO THE PR MANAGEMENT DASHBOARD
Step 8 creates the link between the SRMT and the PR Management Dashboard. Through
implementation of this step, key configuration decisions made for the SRMT will be
correctly transferred to the PR Management Dashboard. For example, values for
programmatic indicators that were configured as “inverse” indicators will be transferred to
the PR Management Dashboard as such.3 For more information about the selection of
indicator types, go to section 5.5 of this User Guide.
The PR should have inserted the SR data-entry worksheet for this SR into the tool during
step 3 of the setup process.
To establish the link, the user must first return to the initial setup menu and click on the
button <Go> next to step 8. Doing so will cause the following (pop-up) confirmation
window to display.
The user should click <Yes> to continue.
Next, a new pop-up window will confirm that this process has been successfully completed.
The user should click the button <OK> to complete step 8.
3. What this means on a practical level is that data that were configured as targets in the SRMT will be transferred to the results cells in the PR Management Dashboard. Data that were entered at results in the SRMT will be transferred into the corresponding “target” cells for the PR Management Dashboard.
Installation and Setup Guide for the SR Management Tool—Version 2.0 August 15, 2017
52
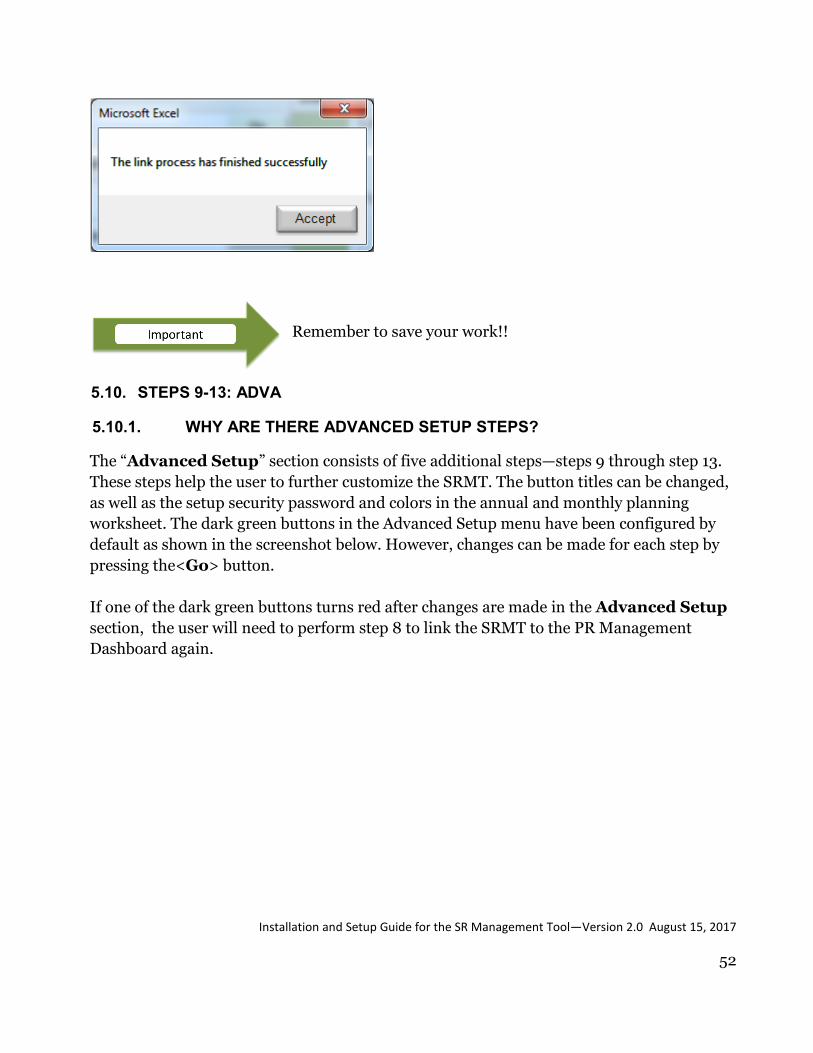
5.10. STEPS 9-13: ADVANCED SETUP
WHY ARE THERE ADVANCED SETUP STEPS? 5.10.1.
The “Advanced Setup” section consists of five additional steps—steps 9 through step 13.
These steps help the user to further customize the SRMT. The button titles can be changed,
as well as the setup security password and colors in the annual and monthly planning
worksheet. The dark green buttons in the Advanced Setup menu have been configured by
default as shown in the screenshot below. However, changes can be made for each step by
pressing the<Go> button.
If one of the dark green buttons turns red after changes are made in the Advanced Setup
section, the user will need to perform step 8 to link the SRMT to the PR Management
Dashboard again.
Remember to save your work!!

Installation and Setup Guide for the SR Management Tool—Version 2.0 August 15, 2017
53
STEP 9: CHANGING THE NAMES OF BUTTONS FOR THE 5.10.2.
IMPLEMENTATION PERIOD AND THE ANNEXES
Customizing the implementation period
The user may wish to customize the implementation period by determining which month
the first implementation period starts with and manually selecting the subsequent months.
The user begins this customization step by clicking the <Go> button next to step 9 in the
Advanced Setup menu. Doing so takes the user directly to Column AB, where twelve
rows appear – each allowing the selection of one month per row using a drop-down menu.
By default, the implementation calendar year is January through December, as seen in the
example below. However, the implementation period for another grant could, for example,
start in June (month 1) and end in May a year later (month 12), if that is the grant’s
implementation period. In this example, the user can change the default months by
manually selecting June from the drop-down menu, then manually selecting the
appropriate months for the 11 subsequent rows. Note that a selection MUST be made for all
12 months.

Installation and Setup Guide for the SR Management Tool—Version 2.0 August 15, 2017
54
Customizing the annexes
The SRMT contains three annexes. GMS recommends using these three annexes, although
each one is optional and may be used at the PR’s discretion.
Remember to save your work!!
Installation and Setup Guide for the SR Management Tool—Version 2.0 August 15, 2017
55
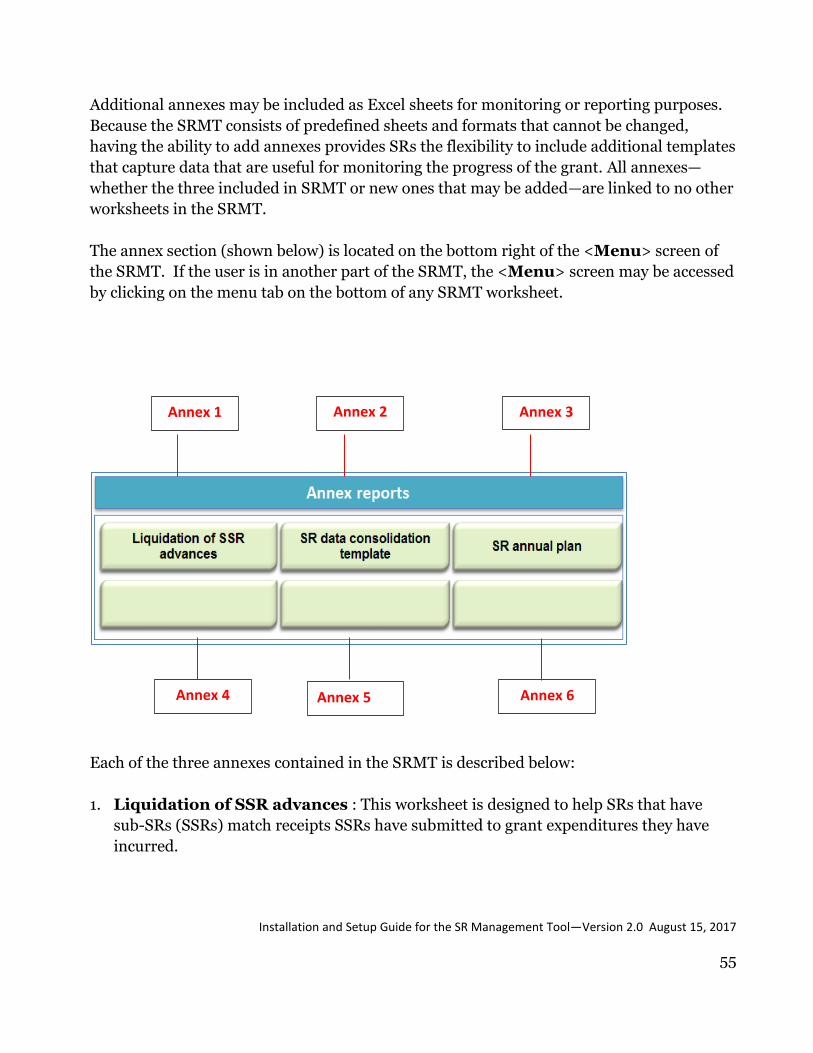
Additional annexes may be included as Excel sheets for monitoring or reporting purposes.
Because the SRMT consists of predefined sheets and formats that cannot be changed,
having the ability to add annexes provides SRs the flexibility to include additional templates
that capture data that are useful for monitoring the progress of the grant. All annexes—
whether the three included in SRMT or new ones that may be added—are linked to no other
worksheets in the SRMT.
The annex section (shown below) is located on the bottom right of the <Menu> screen of
the SRMT. If the user is in another part of the SRMT, the <Menu> screen may be accessed
by clicking on the menu tab on the bottom of any SRMT worksheet.
2
Each of the three annexes contained in the SRMT is described below:
1. Liquidation of SSR advances : This worksheet is designed to help SRs that have
sub-SRs (SSRs) match receipts SSRs have submitted to grant expenditures they have
incurred.
Annex 1 Annex 2 Annex 3
Annex 4 Annex 5 Annex 6

Installation and Setup Guide for the SR Management Tool—Version 2.0 August 15, 2017
56
Some SRs using the SRMT may already have an adequate accounting tool for tracking
liquidation of advances SRs have made to SSRs and expenses they have incurred; these
SRs should continue using their existing system.
2. SR data consolidation template (see annual planning exercise in annex 2 to this
User Guide).
3. SR annual plan, which may be used for the annual planning exercise described in
annex 2 to this User Guide.
The PR may also choose to replace any or all of the three annexes provided in the SRMT
with one or more other annexes, and the PR and an SR may decide to add more information
to the SRMT by adding more annexes. The SRMT can accommodate up to six annexes.
Therefore, the configurator/SRMT administrator may add up to six annexes by entering the
name for each annex in the appropriate cell in column AE (as shown in the screenshot
below).
When the name of an annex button is pressed on the <Menu> screen, a corresponding
numbered “annex” tab appears on the worksheet tab bar.
It is recommended that users add annexes in consecutive order, leaving no blank lines
between annex names. In the example below, a fourth annex has been created, named SR
tracker for ARV stocks.

Installation and Setup Guide for the SR Management Tool—Version 2.0 August 15, 2017
57
Once the name of the new annex has been entered, the configurator/SRMT administrator
should then press the menu tab at the bottom of the page (circled in red above), which will
take the user to the main menu of the SRMT.
The user will notice that the new annex page appears on the <Menu> screen of the SRMT
and that a worksheet tab for a new annex appears on the worksheet tab bar. The two
following screenshots show the change to the <Menu> screen and an example of a
worksheet tab bar for a SRMT with six annexes. The user can press on the button with the

Installation and Setup Guide for the SR Management Tool—Version 2.0 August 15, 2017
58
new annex to access the Excel tab with the corresponding annex number; once this tab is
opened, the new annex can be created in the blank worksheet.
Remember to save your work!!
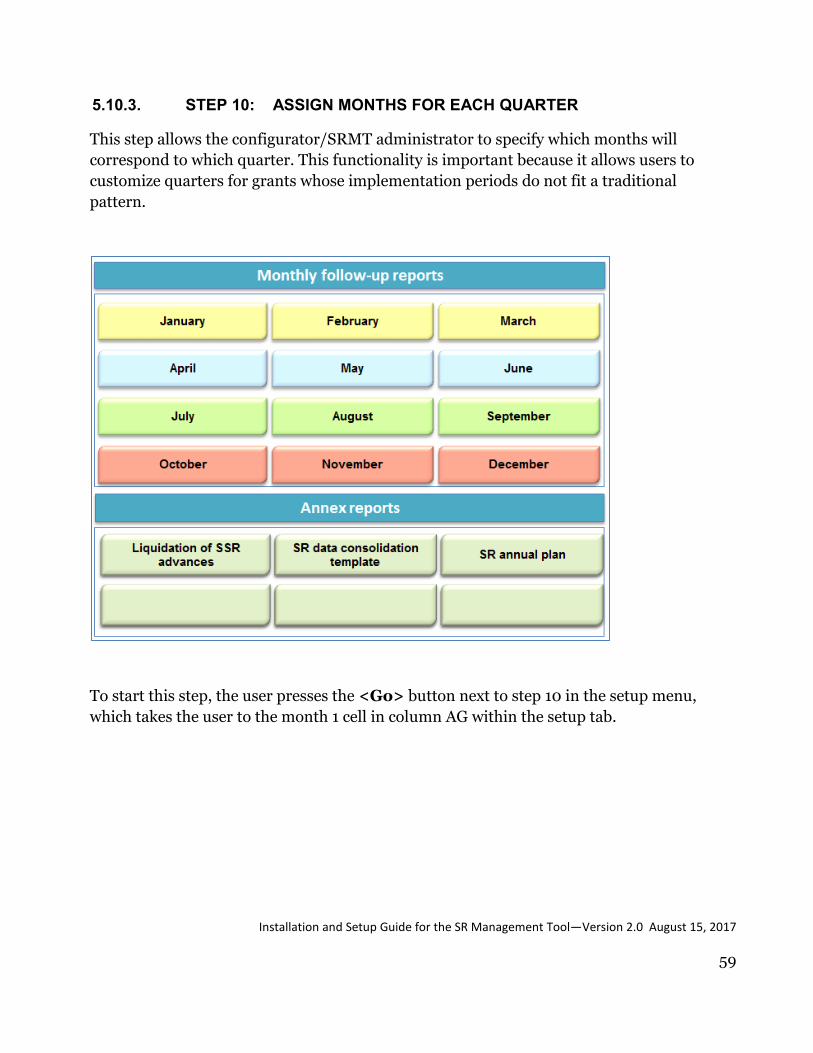
Installation and Setup Guide for the SR Management Tool—Version 2.0 August 15, 2017
59
STEP 10: ASSIGN MONTHS FOR EACH QUARTER 5.10.3.
This step allows the configurator/SRMT administrator to specify which months will
correspond to which quarter. This functionality is important because it allows users to
customize quarters for grants whose implementation periods do not fit a traditional
pattern.
To start this step, the user presses the <Go> button next to step 10 in the setup menu,
which takes the user to the month 1 cell in column AG within the setup tab.

Installation and Setup Guide for the SR Management Tool—Version 2.0 August 15, 2017
60
By default, month 1 corresponds to quarter 1 for the grant, and quarter 1 will correspond to
months 1, 2 and 3 of the grant; quarter 2 will correspond to months 4, 5 and 6 of the grant.
For many grants it will not be necessary to make any changes for step 10 of the setup.
However, for situations where quarters do not follow this normal pattern, the PR can
configure the SRMT accordingly. For example, a grant that had been granted a seven-
month extension at the end of its 3-year life could assign 4 months to quarter 1 and 3
months to quarter 2. In this situation, a maximum of six months can be assigned to a given
quarter. Using the drop-down menu shown below, for each quarter the configurator/SRMT
administrator can assign specific months to each quarter.

Installation and Setup Guide for the SR Management Tool—Version 2.0 August 15, 2017
61
Once SRs begin using the SRMT to enter data on a quarterly basis (rather than configuring
it), they will use the <Update quarterly data> button to update or refresh data entered
into the tool. The <Update quarterly data> button is highlighted in the screenshot
above.
As a part of step 10, it is also possible to change the default colors for the quarter buttons
(all the months in a given quarter will have the color selected for that quarter) appearing on
the <Menu> screen of the SRMT. This is done by clicking on the respective “color palette”
icon under each quarter and selecting the desired color from the color palette dialogue box
that appears.
Color palette dialogue box
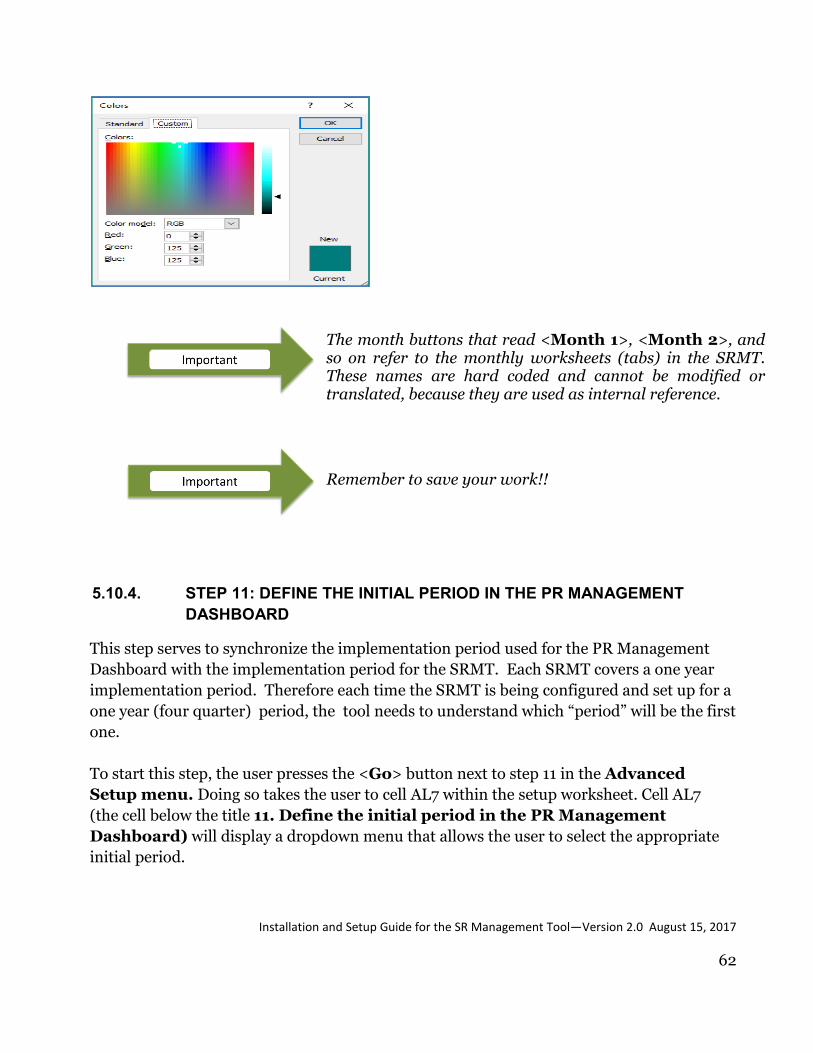
Installation and Setup Guide for the SR Management Tool—Version 2.0 August 15, 2017
62
STEP 11: DEFINE THE INITIAL PERIOD IN THE PR MANAGEMENT 5.10.4.
DASHBOARD
This step serves to synchronize the implementation period used for the PR Management
Dashboard with the implementation period for the SRMT. Each SRMT covers a one year
implementation period. Therefore each time the SRMT is being configured and set up for a
one year (four quarter) period, the tool needs to understand which “period” will be the first
one.
To start this step, the user presses the <Go> button next to step 11 in the Advanced
Setup menu. Doing so takes the user to cell AL7 within the setup worksheet. Cell AL7
(the cell below the title 11. Define the initial period in the PR Management
Dashboard) will display a dropdown menu that allows the user to select the appropriate
initial period.
The month buttons that read <Month 1>, <Month 2>, and so on refer to the monthly worksheets (tabs) in the SRMT. These names are hard coded and cannot be modified or translated, because they are used as internal reference.
Remember to save your work!!

Installation and Setup Guide for the SR Management Tool—Version 2.0 August 15, 2017
63
Selecting “Period 1” from the dropdown list instructs the SRMT to transfer values from
quarter 1 of its first period to quarter 1 and period one for the PR Management Dashboard.
Selecting “Period 5” from the drop-down menu would transfer values for the SRMT’s first
quarter into period 5 for the PR Management Dashboard (year 2). This situation could
occur if an SR was added during the second year of the grant, with its first quarter
corresponding to the PR Management Dashboard’s second implementation year.
STEP 12: CHANGE THE SETUP PASSWORD 5.10.5.
It is strongly recommended that the PR establish a password to control who is able to
change the setup of the SRMT once the configuration process is completed. This password
will be the “New password” in the following screenshot. (The field “Current password”
remains empty, because initially the file has no password.) Imposing a password prevents
SRs from accidentally making changes to the configuration parameters in any part of the
Remember to save your work!!

Installation and Setup Guide for the SR Management Tool—Version 2.0 August 15, 2017
64
SRMT. This functionality is particularly important for preserving the parameters
configured in the annual planning worksheet.
To initiate the step of creating a password for the first time, the user presses the <Go>
button next to step 12 in the Advanced Setup menu, which causes the following dialogue
box to pop up.
In this dialogue box, the PR’s configurator/SR administrator should enter a password in the
box labeled “New password.” Then the PR’s configurator/SR administrator would enter
the same password in the box labeled “Repeat new password.” The PR’s
configurator/SR administrator must then press the <Accept> button to complete the
process and save the new password. If the PR subsequently decides to change the password,
the existing password should be entered into the box labeled “Current Password.” The
PR should then enter the new password into the “New password” box and “Repeat new
password” box, as it did when it created the original password.
It is strongly recommended that the password consist of a combination of letters and
numbers to make it a strong password. Note that the application has a ten-character limit
for passwords.

Installation and Setup Guide for the SR Management Tool—Version 2.0 August 15, 2017
65
STEP 13: CUSTOMIZE COLORS FOR INDICATORS, ACTIVITIES AND 5.10.6.
MONTHS
This step allows the PR to change the colors appearing in the indicator and activity rows in
the annual planning worksheet. It also allows the PR to customize the colors appearing on
the months on the <Menu> screen of the tool. PRs who are satsified with the default colors
can skip this step.
To make changes to colors for any of these sections click the <Go> button next to step 13.
Doing so takes the user to cell BP6 within the Setup worsheet where the four columns
below are displayed. Pressing on any one of the color palette icons will cause a color palette
dialogue box to appear. The user can then select whatever color is desired for indicators,
contributing activities and noncontributing activities.
If the password is lost or forgotten, it can only be retrieved by the Help Desk. But retrieving the password may take some time. Therefore, it is recommended that the PR record the password, and relay the password and this guidance to SRs. Passwords should not be kept on a computer, but should be recorded and kept in a secure location known to anyone who will need them.
Remember to save your work!!

Installation and Setup Guide for the SR Management Tool—Version 2.0 August 15, 2017
66
Note: Once step 13 is complete, the user may hide all the setup sheets by pressing the
“Hide current sheet” button and proceed to using the tool for monthly data entry and
analysis.
Remember to save your work!!

Installation and Setup Guide for the SR Management Tool—Version 2.0 August 15, 2017
67
6. SR USE OF THE SRMT: HANDOVER OF THE CONFIGURED SRMT TO SRS,
DATA ENTRY, RECOMMENDED USE, AND TRANSFERRING DATA TO PR
MANAGEMENT DASHBOARD
6.1. HANDOVER OF THE CONFIGURED SRMT TO SRS
ORIENTING SRS TO THE SRMT 6.1.1.
Once the installation, configuration and setup are complete, the PR should transfer the
SRMT to SRs for use. Then the PR should orient SRs to the various sections of the tool.
Because it is assumed that the PR has conducted the annual planning exercise described in
annex 2 of the User Guide with its SRs, each SR should already have an understanding of its
monthly and total budgets for the year, as well as the monthly targets for programmatic
indicators. SRs should also have a good understanding of the overall grant and how its
grant activities, targets and budget correspond to the overall grant.
CONFIRMING HOW SRS WILL IMPLEMENT AND USE THE SRMT FOR 6.1.2.
MONITORING
The PR must confirm its expectations regarding how SRs will implement the SRMT and
use SRMT data for programmatic monitoring. The PR may recommend that SRs take
primary responsibility for monitoring their own data and take full responsibility for making
management decisions based on review of SRMT data. On the other hand, the PR might
decide to conduct a joint review of SRMT data with each SR or with groups of SRs, to lead
decision-making on corrective actions needed to improve performance and to closely
monitor SR implementation of these corrective actions.
Depending on the capacity level of an SR, it would be useful for the PR to review with SRs
how to interpret the financial and programmatic indicators in the SRMT. If the PR has few
SRs, it may choose to do this exercise individually with each SR; on the other hand, the PR
may elect to hold a workshop for all its SRs that covers both orientation to and use of the
SRMT. The PR may choose to seek technical support or coaching to organize such a
workshop for its SRs.
SR’S TRANSFER OF THE SRMT TO THE PR 6.1.3.
The PR should review the content to be entered into the tool and how frequently SRs will
enter data and send the SRMT to the PR. A protocol needs to be established for how SRs
will transmit the SRMT to the PR (electronically, by USB, or otherwise).
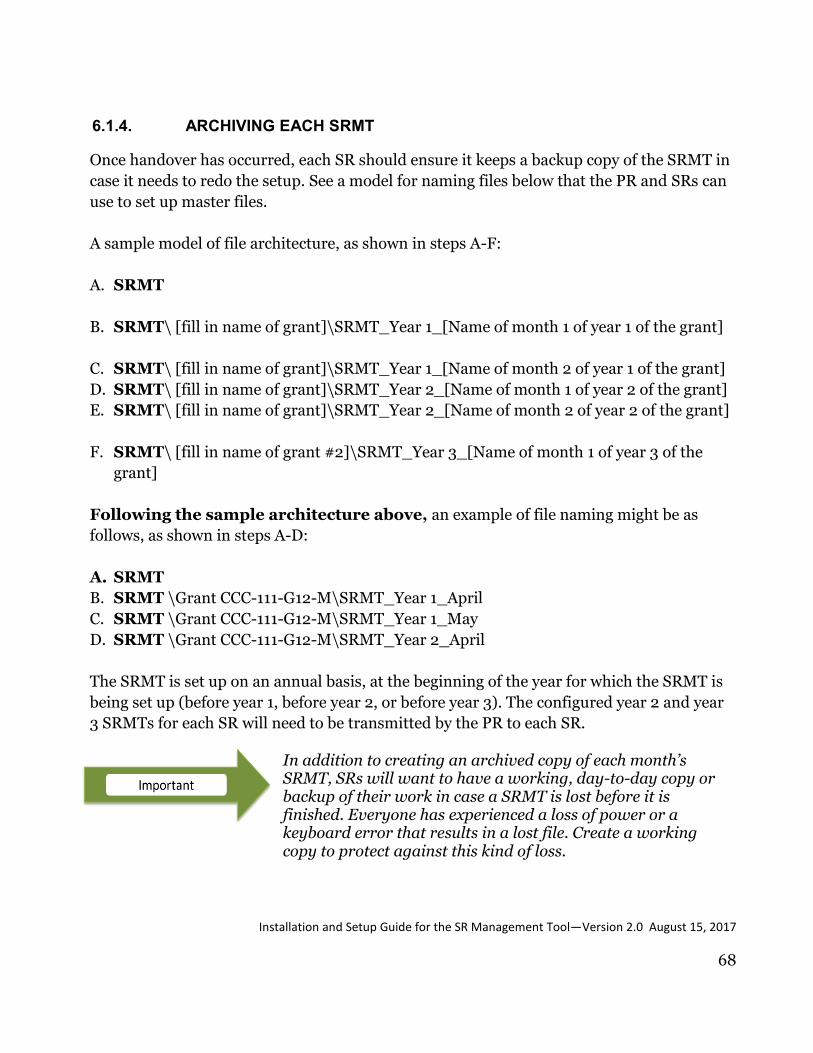
Installation and Setup Guide for the SR Management Tool—Version 2.0 August 15, 2017
68
ARCHIVING EACH SRMT 6.1.4.
Once handover has occurred, each SR should ensure it keeps a backup copy of the SRMT in
case it needs to redo the setup. See a model for naming files below that the PR and SRs can
use to set up master files.
A sample model of file architecture, as shown in steps A-F:
A. SRMT
B. SRMT\ [fill in name of grant]\SRMT_Year 1_[Name of month 1 of year 1 of the grant]
C. SRMT\ [fill in name of grant]\SRMT_Year 1_[Name of month 2 of year 1 of the grant]
D. SRMT\ [fill in name of grant]\SRMT_Year 2_[Name of month 1 of year 2 of the grant]
E. SRMT\ [fill in name of grant]\SRMT_Year 2_[Name of month 2 of year 2 of the grant]
F. SRMT\ [fill in name of grant #2]\SRMT_Year 3_[Name of month 1 of year 3 of the
grant]
Following the sample architecture above, an example of file naming might be as
follows, as shown in steps A-D:
A. SRMT
B. SRMT \Grant CCC-111-G12-M\SRMT_Year 1_April
C. SRMT \Grant CCC-111-G12-M\SRMT_Year 1_May
D. SRMT \Grant CCC-111-G12-M\SRMT_Year 2_April
The SRMT is set up on an annual basis, at the beginning of the year for which the SRMT is
being set up (before year 1, before year 2, or before year 3). The configured year 2 and year
3 SRMTs for each SR will need to be transmitted by the PR to each SR.
In addition to creating an archived copy of each month’s SRMT, SRs will want to have a working, day-to-day copy or backup of their work in case a SRMT is lost before it is finished. Everyone has experienced a loss of power or a keyboard error that results in a lost file. Create a working copy to protect against this kind of loss.
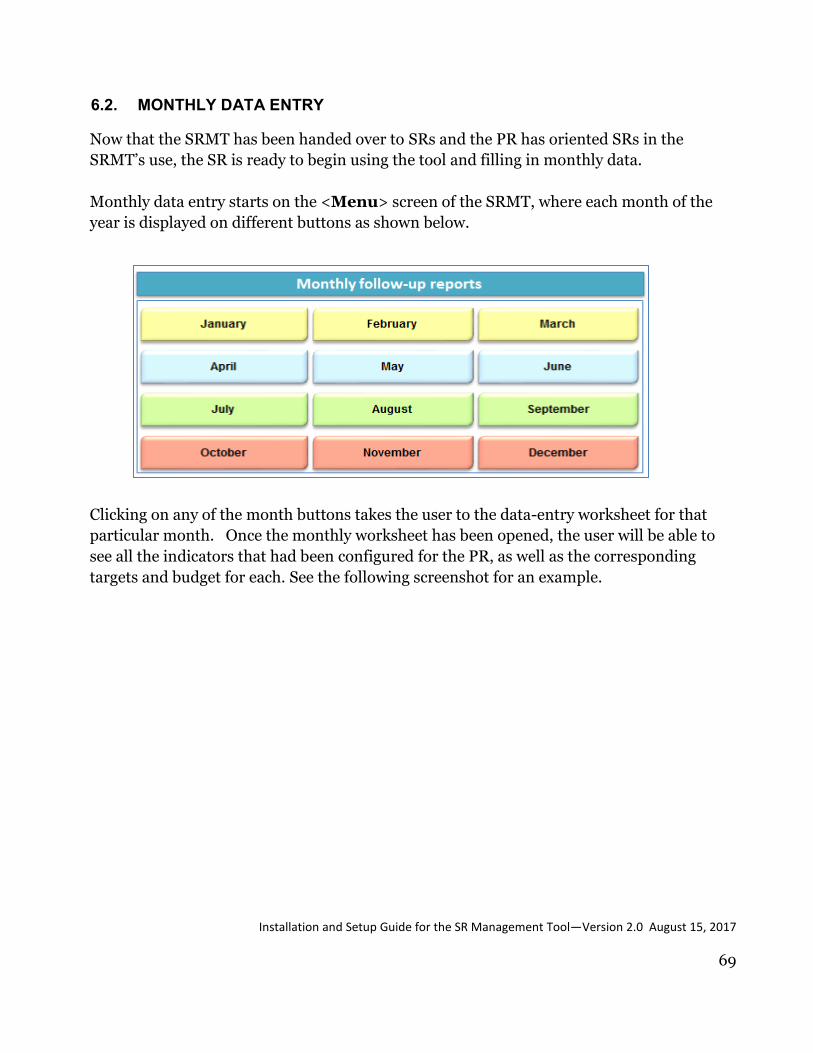
Installation and Setup Guide for the SR Management Tool—Version 2.0 August 15, 2017
69
6.2. MONTHLY DATA ENTRY
Now that the SRMT has been handed over to SRs and the PR has oriented SRs in the
SRMT’s use, the SR is ready to begin using the tool and filling in monthly data.
Monthly data entry starts on the <Menu> screen of the SRMT, where each month of the
year is displayed on different buttons as shown below.
Clicking on any of the month buttons takes the user to the data-entry worksheet for that
particular month. Once the monthly worksheet has been opened, the user will be able to
see all the indicators that had been configured for the PR, as well as the corresponding
targets and budget for each. See the following screenshot for an example.

Installation and Setup Guide for the SR Management Tool—Version 2.0 August 15, 2017
70
COMPLETING THE HEADER INFORMATION AND RESULTS SECTIONS 6.2.1.
Starting from the top, of the worksheet, each SR fills in all the cells appearing in light pink
or orange cells in the following screenshot. These cells include the following, and comments
may be written in the white boxes below them:
Report Date: specify the date the SR entered the data
Name of the person drafting the report (Reported by)
Date of verification (programmatic and financial)
Amount of money that was delivered by the PR to perform activities (Disbursement) in
that month. This value must be in the currency used in step 1 (setup process).

Installation and Setup Guide for the SR Management Tool—Version 2.0 August 15, 2017
71
Next, the SR enters its programmatic results and the expenditures for that month into the
light pink cells corresponding to the “Results” and “Monthly expenditure” columns
shown by the red arrows in the screen shot below.
As soon as data are entered into the “Results” and “Monthly expenditure” columns (as
shown by the arrows in the following screenshot), the cells in the “Result %” columns will
change color automatically to either red, yellow or green (as shown in the outlined boxes in
the following screenshot). These colors will depend on the thresholds for programmatic
indicators and financial expenditures that were established in step 7 of the initial setup
process. Remember that the percentage (%) presented in the “Result %” column is a
measure of performance and is calculated based on one of the following three types of
indicators: standard, inverse or noncumulative.

Installation and Setup Guide for the SR Management Tool—Version 2.0 August 15, 2017
72
The following are examples of how the SRMT calculates indicator results:
Standard indicator
[Pr74] # aged 10-24 yrs. reached by HIV life skills ed. in school [1. Standard]
The target for the month is 250. The result for the month is 170. The performance for this
indicator is calculated by dividing the result by the target and multiplying the product by
100 as follows:
170
250 x 100 = 68.00%
The color that appears in the results column for this indicator in this month is yellow,
indicating inadequate or unsatisfactory progress (see the following screenshot). This is
because the threshold that had been set for programmatic indicators indicates that results
lower than 90 and greater than 60% would turn yellow.
The corresponding financial result for this indicator is stronger. The budget for the month
was $ 56,250 and the amount expended was $50,000. Thus the result divided by the target
expenditure, multiplied by 100, is 88.89%.
50,000
56,250x 100 = 88.89%
Because the green threshold set for financial expenditures was set for results greater than or
equal to 90% and the red threshold was set at 60%, the calculation produced a color coding
of yellow (see the following screenshot), indicating that the achievement fell somewhat
short of expectations (or inadequate or unsatisfactory progress) and the SR needs to pay
attention and potentially take action to get the activity back on track.

Installation and Setup Guide for the SR Management Tool—Version 2.0 August 15, 2017
73
Example of a result for an inverse indicator
[Pr68] # PLHIV that initiated ARV with CD4 count <200 Target [2. Inverse]
The goal for most HIV/AIDS programs these days is to start patients on ART as soon as
possible after diagnosis, before their immune systems become severely compromised. For
this reason, the program would strive to have the fewest patients possible starting ART
when they are severely immunocompromised (i.e., CD count <200). This is why this
indicator would be considered to be an inverse indicator: a low result indicates better
performance.
In the program, the target for this month is to have no more than 200 patients starting
treatment at such a low CD4 count level. The performance for the month is 198, which can
be considered to be a better performance than the target. The result for this indicator is
calculated by dividing the target by the result and multiplying by 100 as follows.
200
198 x 100 = 101.01%
This calculation shows the threshold color as green, as a result of good programmatic
performance, as shown in the following screenshot.
Results for the financial indicators are all calculated the same way, regardless of the type of
programmatic indicators. This inverse indicator’s corresponding financial indicator was
therefore calculated as follows. The budget for the month (financial performance target)
was $ 65,725. The expenditures corresponding to the indicator equaled $64,150. The
calculation is shown below.
64,150
65,725 x 100 = 97.60%
Because the financial threshold had been set up such that any result over 90% would turn
green, the cell containing the financial result for this indicator shows green (see the
following screenshot). This calculation shows the threshold color as green, as a result of
financial performance.

Installation and Setup Guide for the SR Management Tool—Version 2.0 August 15, 2017
74
Noncumulative indicator
Indicators that are noncumulative (as explained in step 5 of the setup) are calculated by
dividing the result by the target (as is the case for standard indicators) in the monthly
follow-up sheets.
For any given month, an SR may not attain the planned target or budget for a given
indicator. If this is the case, the tool automatically carries the unattained values over to the
next month and the carried over amount appears in the column Balance from previous
period. Having the amounts for the unused budget and unattained targets carried over
into the Balance from previous period column prompts the SR to integrate both these
elements into activities for the subsequent period.
THE EFFECTIVENESS SCORE 6.2.2.
The effectiveness score appears the top right side of each monthly worksheet. At best, the
effectiveness score is a simple measure that can be used by SRs as an indicator of overall
monthly performance.
Remember to save your work!!

Installation and Setup Guide for the SR Management Tool—Version 2.0 August 15, 2017
75
The effectiveness score is an average of all programmatic results and is calculated by adding
all percentages for programmatic results and dividing these by the number of indicators.
Therefore, the effectiveness score can only be calculated once all results data have been
entered for programmatic indicators.
INDICATORS THAT WILL BE TRANSFERRED TO THE PR 6.2.3.
MANAGEMENT DASHBOARD
During the configuration and setup process, the data-entry sheets that will pull data from
various parts of the SRMT to produce the SR data-entry sheet for the PR Management
Dashboard will have been inserted into the SRMT.
It is possible, however, that the PR Management Dashboard may require SRs to contribute
data to additional compliance or procurement and supply management (PSM) indicators to
be monitored on a quarterly basis. For this reason, the SRMT also provides a location for
entering data within the monthly SRMT worksheet. This location can be found immediately
below the section where the programmatic and financial results were entered for the grant.
This section of the worksheet appears as follows:

Installation and Setup Guide for the SR Management Tool—Version 2.0 August 15, 2017
76
Note that for this grant, the SR also manages stock for a limited list of antiretroviral drugs.
The totals entered in the light-pink column for each item refer to the months of stock that
the SR has in its central warehouse. These data will be aggregated with other data for the
same products in the PR Management Dashboard.
ADDING NARRATIVE COMMENTS ON PERFORMANCE TO THE SRMT 6.2.4.
Once SRs have finished entering numeric data in the monthly worksheet, they may wish to
provide a narrative explanation on the performance. SRs can access the narrative
comments section by scrolling down the page using the tool bar on the far right of the page
to reach the <Narrative comments from results>box shown in the screenshot below.
Note that it is not possible to perform any special formatting when entering text into this
section (e.g., using bullets, bolding letters or changing the font).
Remember to save your work!!

Installation and Setup Guide for the SR Management Tool—Version 2.0 August 15, 2017
77
Entering the narrative comments completes the data entry for the month.
If the SRMT is used collaboratively between the PR and an SR to improve grant
performance, the SR should proceed to section 6.2.5 to learn about how to complete the
data validation section.
SR DATA VALIDATION BY THE PR 6.2.5.
The SRMT has space on each of the monthly data sheets for comments and feedback from
the PR and SRs. On a monthly basis, SRs may wish to insert comments from their own
data-validation process for their own follow-up and to share with the PR. Although the use
of this space is optional, completing these cells is strongly encouraged as doing so provides
continuous documentation of feedback provided and fosters better communication between
the PR and SRs. At least quarterly, SRs can send the SRMT file to the PR to verify the data
and to provide input for the PR Management Dashboard. The feedback comments from the
PR may be obtained after routine site visits by the PR to SRs or during other data-validation
activities. It is advisable that in most cases such visits would take place quarterly.
The PR may organize field visits to validate the information and quality of the data
submitted by SRs. These visits can be done before or following the receipt of the SRMT file.
For this validation and visits to SRs, it is recommended that the PR programmatic and
financial area staff go jointly. This will allow for a more comprehensive analysis of the
information. If site visits are impractical for a particular month, these discussions can also
occur remotely (by Skype or phone, for example), with SRs following up by sending
appropriate documentation to the PR.
Remember to save your work!!

Installation and Setup Guide for the SR Management Tool—Version 2.0 August 15, 2017
78
There are two sections in the monthly sheets, which are intended to capture comments
from PR programmatic and financial staff. These sections contain the following:
Name of the person conducting the validation.
Current context of the situation in the month(s) when ongoing activities present
relevant factors that may positively or negatively affect any results.
Identification of any problem found or opportunities for improvement to promote better
performance of SR results in the month(s) reviewed.
Recommendations or actions to be taken based on the findings and analysis with SRs
during the visit, as well as changes made to the data.

Installation and Setup Guide for the SR Management Tool—Version 2.0 August 15, 2017
79
Similar cells can be completed for the financial section.
Once the field visits to validate SR data are completed, any corrections to the data should be
made in the monthly worksheets.

Installation and Setup Guide for the SR Management Tool—Version 2.0 August 15, 2017
80
Note: The “Job title” column refers to the role or function for the specific person inside
the institution who participates in validating the data. For accountability purposes, it is
recommended that the persons who carried out the data validation print and sign these
forms.
Last, SRs should save the final version of the file that will be sent to the PR for integration
into the PR Management Dashboard.
SAVING MONTHLY VERSIONS OF THE SRMT 6.2.6.
Archiving monthly versions of the SRMT is an important safety measure and a good
practice for preserving data and records. Monthly archiving offers SRs the security of
knowing that if it loses a monthly SRMT or the PR to whom it has sent the SRMT loses it,
the file can be retrieved from the archive. Archived files should be located in a folder or
drive that is not used on a regular basis, but only for long-term safekeeping of the monthly
files.
A sample archiving architecture is described above in section 6.1.4 of this User Guide. In
practice, each month’s file can be created as follows after month 1:
Each month, SRs can make a copy of the prior month’s SRMT and rename it for the
next month.
Once the new month’s SRMT is complete, this file can be saved in the archive.
Remember to save your work!!

Installation and Setup Guide for the SR Management Tool—Version 2.0 August 15, 2017
81
6.3. RECOMMENDED USE OF THE PR MANAGEMENT DASHBOARD WITH THE
SRMT
PRs using the PR Management Dashboard are advised to produce dashboards on a
quarterly basis at minimum. Most of the numerical SR data that are sent to the PR using
the SR data-entry sheets are automatically transferred from various parts of the SRMT into
the SR data-entry sheet. However, narrative comments that relate to each performance
period have to be entered separately. To save time, it is strongly recommended that the PR
and SR agree on which narrative comments to add prior to entering them as this will reduce
the need to update the comments after each PR Management Dashboard is produced. In
the absence of prior agreement on comments, SRs can enter comments directly, but may
have to adjust the comments following discussions with the PR.
To enter the narrative comments, SRs should do the following: Go to the <Menu> screen
of the SRMT and click the <PR Dashboard comments> button as shown below.
Clicking the <PR Dashboard comments> button will take the user to a worksheet that
allows entry of narrative comments for various indicators as shown below. Note that
the length of each comment cannot exceed 500 characters.

Installation and Setup Guide for the SR Management Tool—Version 2.0 August 15, 2017
82
Note that the SR data-entry sheet must always be the first sheet inside of the SRMT, and the tab name (or sheet name), which usually contains the abbreviated name of the SR, cannot be changed. Attempting to change the name of this tab will create problems when uploading the SR data-entry sheet to the PR Management Dashboard.
Once the comments have been entered, they will automatically be pulled into the SR data-
entry sheet. Recall that the SR data-entry sheet is accessed by clicking on the SR data-entry
sheet tab as shown below:
Below is an example of the SR data-entry sheet that can include comments that have been
pulled in from the PR Dashboard comments sheet described earlier in this section.

Installation and Setup Guide for the SR Management Tool—Version 2.0 August 15, 2017
83
6.4. TRANSFERRING DATA TO THE PR MANAGEMENT DASHBOARD
The last month of every quarter, the validated version of the SRMT should be sent by each
SR to the PR Management Dashboard administrator. The PR Management Dashboard
administrator will use the SRMT to produce the corresponding PR Management
Dashboard. Once the PR receives the final version for the SRMT from each SR, the PR
should make one last revision for confirmation purpose. The PR imports each SR’s SRMT
file into the PR Management Dashboard Data Master as usual (see section 3.12 of the PR
Management Dashboard Installation and Setup Guide).
Remember to save your work!!
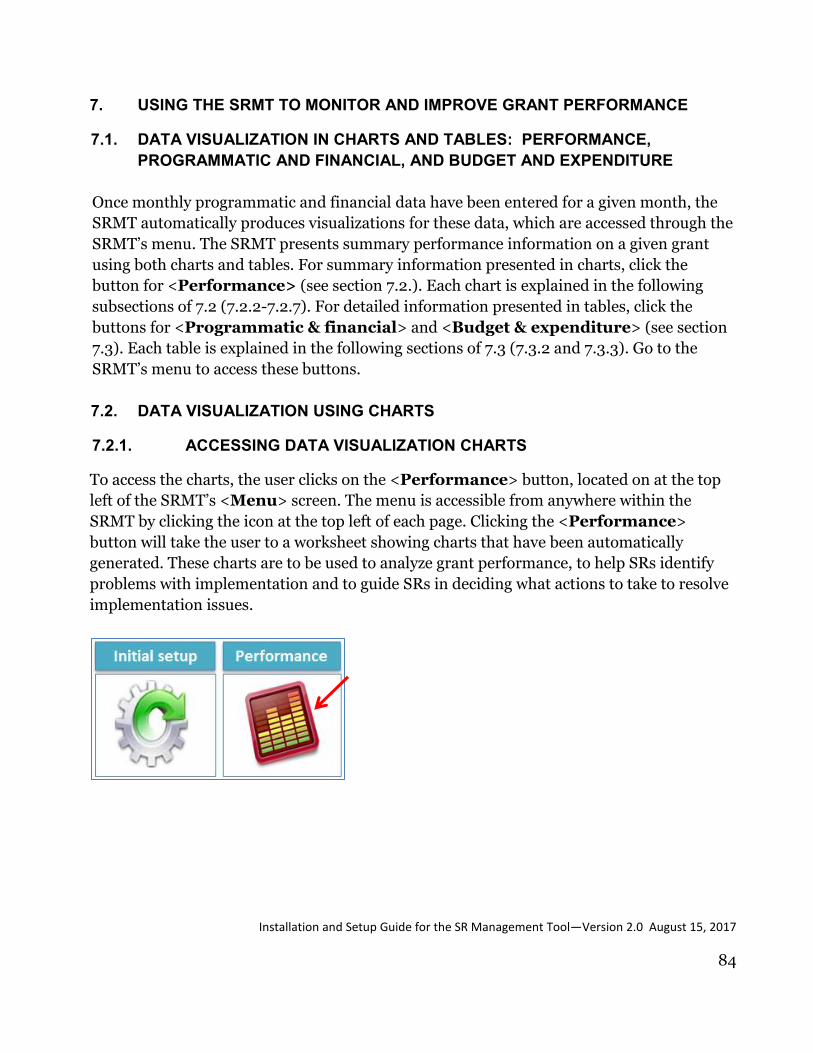
Installation and Setup Guide for the SR Management Tool—Version 2.0 August 15, 2017
84
7. USING THE SRMT TO MONITOR AND IMPROVE GRANT PERFORMANCE
7.1. DATA VISUALIZATION IN CHARTS AND TABLES: PERFORMANCE,
PROGRAMMATIC AND FINANCIAL, AND BUDGET AND EXPENDITURE
Once monthly programmatic and financial data have been entered for a given month, the
SRMT automatically produces visualizations for these data, which are accessed through the
SRMT’s menu. The SRMT presents summary performance information on a given grant
using both charts and tables. For summary information presented in charts, click the
button for <Performance> (see section 7.2.). Each chart is explained in the following
subsections of 7.2 (7.2.2-7.2.7). For detailed information presented in tables, click the
buttons for <Programmatic & financial> and <Budget & expenditure> (see section
7.3). Each table is explained in the following sections of 7.3 (7.3.2 and 7.3.3). Go to the
SRMT’s menu to access these buttons.
7.2. DATA VISUALIZATION USING CHARTS
ACCESSING DATA VISUALIZATION CHARTS 7.2.1.
To access the charts, the user clicks on the <Performance> button, located on at the top
left of the SRMT’s <Menu> screen. The menu is accessible from anywhere within the
SRMT by clicking the icon at the top left of each page. Clicking the <Performance>
button will take the user to a worksheet showing charts that have been automatically
generated. These charts are to be used to analyze grant performance, to help SRs identify
problems with implementation and to guide SRs in deciding what actions to take to resolve
implementation issues.
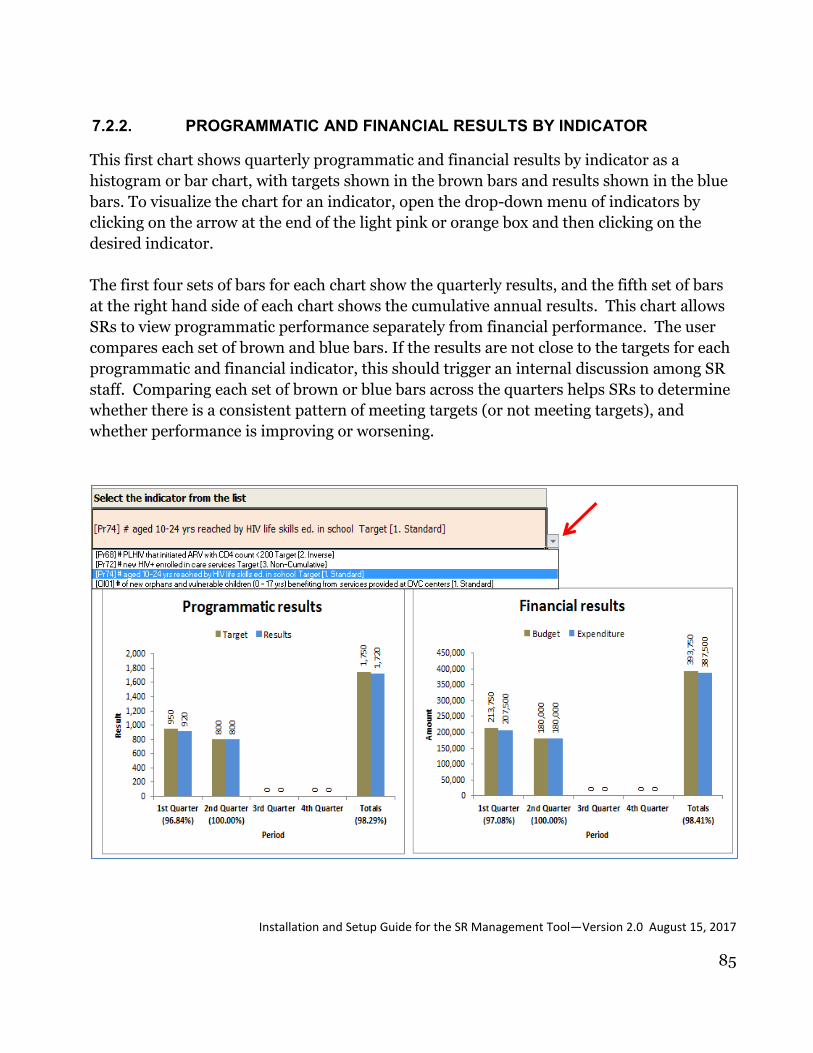
Installation and Setup Guide for the SR Management Tool—Version 2.0 August 15, 2017
85
PROGRAMMATIC AND FINANCIAL RESULTS BY INDICATOR 7.2.2.
This first chart shows quarterly programmatic and financial results by indicator as a
histogram or bar chart, with targets shown in the brown bars and results shown in the blue
bars. To visualize the chart for an indicator, open the drop-down menu of indicators by
clicking on the arrow at the end of the light pink or orange box and then clicking on the
desired indicator.
The first four sets of bars for each chart show the quarterly results, and the fifth set of bars
at the right hand side of each chart shows the cumulative annual results. This chart allows
SRs to view programmatic performance separately from financial performance. The user
compares each set of brown and blue bars. If the results are not close to the targets for each
programmatic and financial indicator, this should trigger an internal discussion among SR
staff. Comparing each set of brown or blue bars across the quarters helps SRs to determine
whether there is a consistent pattern of meeting targets (or not meeting targets), and
whether performance is improving or worsening.

Installation and Setup Guide for the SR Management Tool—Version 2.0 August 15, 2017
86
PROGRAMMATIC RESULTS AND EXPENDITURES COMPARED 7.2.3.
The chart shown below compares programmatic results with burn rates (described in
section 7.2.5) in another bar chart. Such a comparison provides a simple way to measure
the efficiency of a program by answering the question: are you achieving programmatic
results at the same rate as you are spending resources? There are two major reasons why
this is a simple measurement. One is that the relationship between financial expenditures
and programmatic outputs is rarely linear – rarely is it possible to conclude that “x”
expenditure level will always yield “y” level of programmatic achievement. The second
reason is that timing of expenditures does not always coincide with the timing of
programmatic achievements. For example, expenditures made on training of health
workers on the use of RDTs in Q2 will contribute to an output indicator such as # of
trainings conducted in the same quarter, but may not contribute to a coverage indicator
such as # of malaria cases diagnosed using RDTs until Q3 if the roll out of the use of RDTs
in a country is not scheduled to occur until then.
For these two reasons, the results observed in the chart below should serve only as a
starting point for SRs to determine whether there are operational issues such as
implementation delays or poor sequencing of activities that are interfering with progress in
the program.
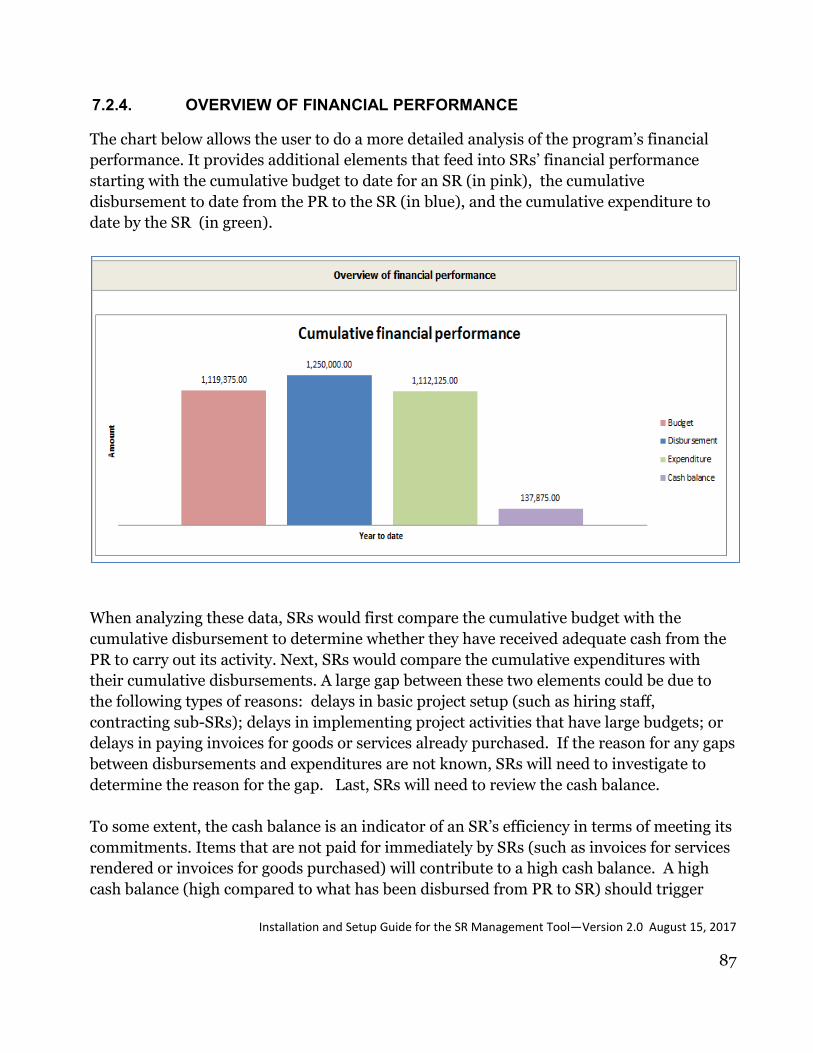
Installation and Setup Guide for the SR Management Tool—Version 2.0 August 15, 2017
87
OVERVIEW OF FINANCIAL PERFORMANCE 7.2.4.
The chart below allows the user to do a more detailed analysis of the program’s financial
performance. It provides additional elements that feed into SRs’ financial performance
starting with the cumulative budget to date for an SR (in pink), the cumulative
disbursement to date from the PR to the SR (in blue), and the cumulative expenditure to
date by the SR (in green).
When analyzing these data, SRs would first compare the cumulative budget with the
cumulative disbursement to determine whether they have received adequate cash from the
PR to carry out its activity. Next, SRs would compare the cumulative expenditures with
their cumulative disbursements. A large gap between these two elements could be due to
the following types of reasons: delays in basic project setup (such as hiring staff,
contracting sub-SRs); delays in implementing project activities that have large budgets; or
delays in paying invoices for goods or services already purchased. If the reason for any gaps
between disbursements and expenditures are not known, SRs will need to investigate to
determine the reason for the gap. Last, SRs will need to review the cash balance.
To some extent, the cash balance is an indicator of an SR’s efficiency in terms of meeting its
commitments. Items that are not paid for immediately by SRs (such as invoices for services
rendered or invoices for goods purchased) will contribute to a high cash balance. A high
cash balance (high compared to what has been disbursed from PR to SR) should trigger
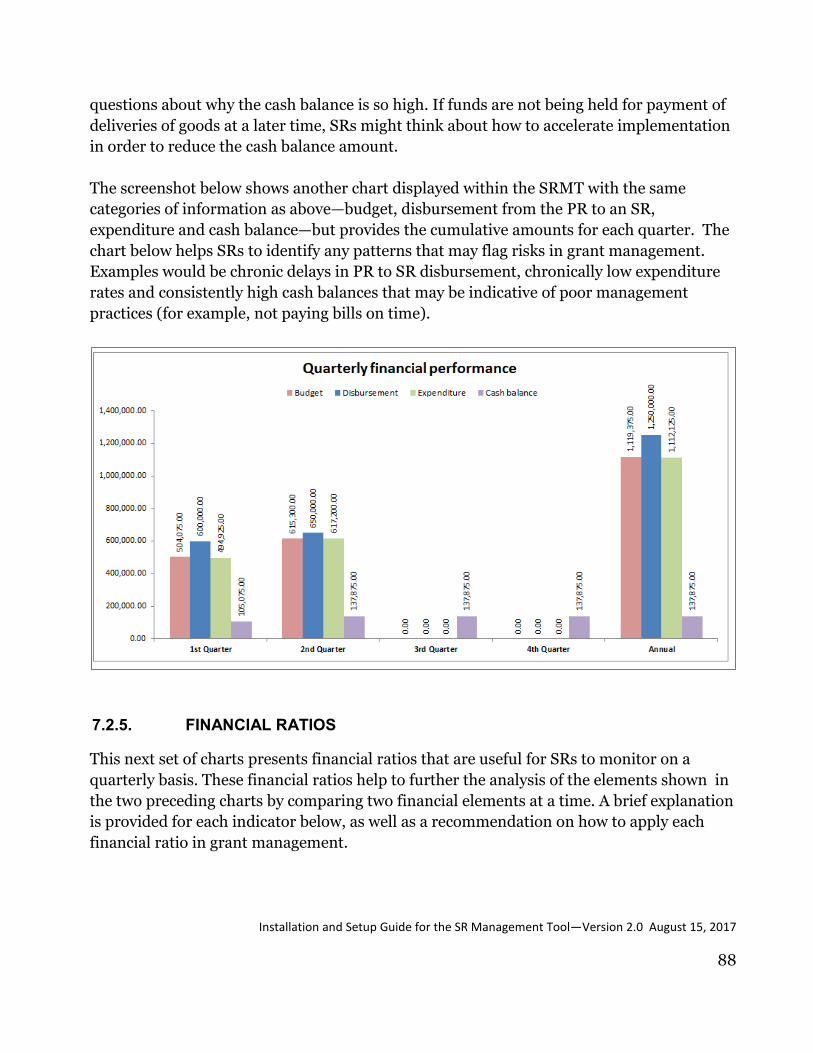
Installation and Setup Guide for the SR Management Tool—Version 2.0 August 15, 2017
88
questions about why the cash balance is so high. If funds are not being held for payment of
deliveries of goods at a later time, SRs might think about how to accelerate implementation
in order to reduce the cash balance amount.
The screenshot below shows another chart displayed within the SRMT with the same
categories of information as above—budget, disbursement from the PR to an SR,
expenditure and cash balance—but provides the cumulative amounts for each quarter. The
chart below helps SRs to identify any patterns that may flag risks in grant management.
Examples would be chronic delays in PR to SR disbursement, chronically low expenditure
rates and consistently high cash balances that may be indicative of poor management
practices (for example, not paying bills on time).
FINANCIAL RATIOS 7.2.5.
This next set of charts presents financial ratios that are useful for SRs to monitor on a
quarterly basis. These financial ratios help to further the analysis of the elements shown in
the two preceding charts by comparing two financial elements at a time. A brief explanation
is provided for each indicator below, as well as a recommendation on how to apply each
financial ratio in grant management.

Installation and Setup Guide for the SR Management Tool—Version 2.0 August 15, 2017
89
These four financial ratios, discussed below, are grouped together and displayed by quarter
in the next charts below.
Expenditure vs. budget ratio (Burn rate) (%)
The pink bars on this chart (above, top left) show the result of dividing the actual paid
expenditure (numerator) by the total approved budget (denominator) and expressing the
product as a percentage (%). (Note that this ratio does not take commitments into
account.) This ratio provides an indication of whether planned activities for a given period
are proceeding on schedule, given that most activities planned for each period will have a
budget associated with them. A ratio of less than 60% should prompt SRs to determine
whether grant activities have fallen behind (assuming the threshold for inadequate progress

Installation and Setup Guide for the SR Management Tool—Version 2.0 August 15, 2017
90
was set for results less than 60%). In some instances, a low expenditure ratio is more of an
indication of delays in payment rather than delays in activities. Because the ratio does not
account for commitments, SRs should determine whether they have commitments (such as
unpaid invoices and contracts) that will soon be paid and therefore will bring expected
expenditures into line with the budget for that period. There could be positive reasons for a
low ratio – for example, unit costs (e.g., cost of medicines) may have decreased significantly
since the initial grant budget was created, thereby creating savings. Whatever the case may
be, SRs should seek to understand the reason for the low ratio and take corrective actions to
get the ratio back up between 60 and 90%.
Reasons for a low burn rate could include:
1. Poor sequencing of activities
2. Poor timing of procurement of inputs needed to carry out activities or delayed deliveries
and payment
3. Poor prepared budget (costs were overestimated)
4. Significant decrease in unit costs since the signature of the grant
5. Budget redundancy - some activities in the grant’s work plan are being paid for by other
donors
Expenditure vs. disbursement (%)
The green bars in the chart above (top right) compare the expenditures made by an
SR to the disbursements it received. The numerator of this ratio is the actual sum of
expenditures paid out by the SR and the denominator is the total disbursements received
by the SR from the PR and/or the total advances made by the PR to the SR.
This ratio gives an indication of the utilization of cash by the SR. It should be well
aligned with the cash balance. In general, low rates of cash utilization by SRs will coincide
with low levels of programmatic activity. The reasons for low cash utilization could include
the following:
Slow implementation due to poor planning or insufficient resources (human resources,
equipment, health products)
SRs not having received sufficient documentation from SSRs to justify making
additional disbursements to SSRs
Installation and Setup Guide for the SR Management Tool—Version 2.0 August 15, 2017
91
SRs being short on funds to carry out their own activities (due to poor initial budget or
overspending in prior reporting periods) and therefore failing to disburse additional
funds to SSRs
SRs choosing to leave disbursed funds in interest bearing accounts rather than making
expenditures during the planned period (the Global Fund frowns on this practice!)
Once an SR has identified or confirmed the reason for low cash utilization, its staff should
take appropriate action to ensure that implementation does not fall behind or to ensure that
the SR catches up on implementing activities in subsequent periods.
Disbursement vs. budget (%)
The chart with the blue bars (above, middle left) examines the disbursement by the PR
to an SR. The numerator for this ratio is the amount of funding disbursed by the PR to an
SR and the denominator is the amount budgeted for the SR for the same period.
Most SRs will not be able to implement activities without receiving periodic disbursements
from the PR. A low PR-to-SR disbursement rate at the beginning of a grant signals a risk
that activities will start late. Persistently low disbursement rates from one reporting period
to the next indicate a risk that the SR may never catch up on activities before the end of the
grant’s three-year life cycle.
Here are examples of reasons for low PR-to SR-disbursement ratios:
Poor planning by the PR
The PR has not received adequate documentation from the SR to justify advances or
disbursements made in earlier periods
The SR has neglected to make a disbursement request on time
The SR has not hired staff to start planned activities
The PR does not have sufficient cash (due to poor budgeting, overspending, or diversion
of funds) for its own activities and has redeployed the SR budget for its own use
The PR prefers to keep funds in interest bearing accounts as long as possible before
disbursing to SRs
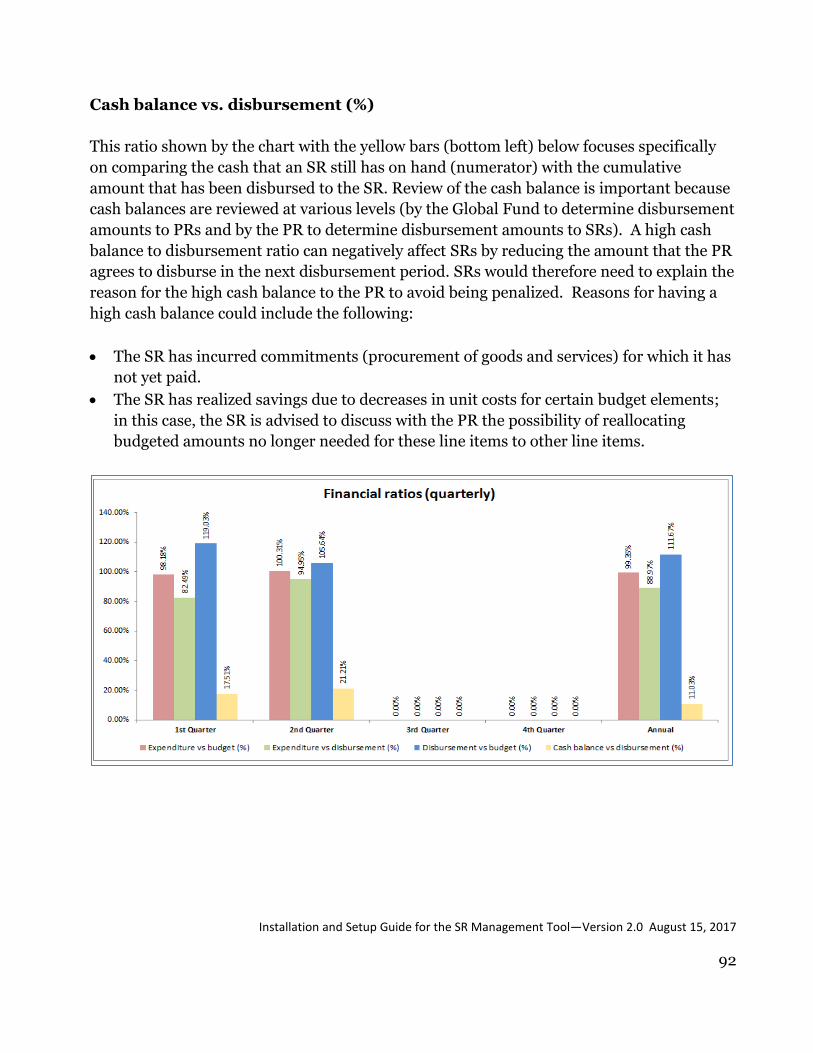
Installation and Setup Guide for the SR Management Tool—Version 2.0 August 15, 2017
92
Cash balance vs. disbursement (%)
This ratio shown by the chart with the yellow bars (bottom left) below focuses specifically
on comparing the cash that an SR still has on hand (numerator) with the cumulative
amount that has been disbursed to the SR. Review of the cash balance is important because
cash balances are reviewed at various levels (by the Global Fund to determine disbursement
amounts to PRs and by the PR to determine disbursement amounts to SRs). A high cash
balance to disbursement ratio can negatively affect SRs by reducing the amount that the PR
agrees to disburse in the next disbursement period. SRs would therefore need to explain the
reason for the high cash balance to the PR to avoid being penalized. Reasons for having a
high cash balance could include the following:
The SR has incurred commitments (procurement of goods and services) for which it has
not yet paid.
The SR has realized savings due to decreases in unit costs for certain budget elements;
in this case, the SR is advised to discuss with the PR the possibility of reallocating
budgeted amounts no longer needed for these line items to other line items.

Installation and Setup Guide for the SR Management Tool—Version 2.0 August 15, 2017
93
PROGRAMMATIC RESULTS AND EXPENDITURES COMPARED ; 7.2.6.
BUDGET AND EXPENDITURE COMPARED
The chart below (on the left) showing blue and brown bars allows SRs to compare the
programmatic performance (blue bar) and the expenditure (brown bar) associated with
each activity.
In section 7.2.3, users were cautioned about comparing programmatic and financial targets
because the relationship between the two is often not linear, and because the timing of
expenditure and the timing of acheivement of targets do not always coincide. There are
situations, however, when such a comparison is meaningful, and that is when comparing
the budget of an activity with an operational indicator such as an output indicator. The SR
should therefore only focus its analysis on the output indicators.
The second chart below on the right side (showing pink and brown bars) allows SRs to
analyze its budget execution (as measured by the expenditures divided by the budget) by
Global Fund cost groups.

Installation and Setup Guide for the SR Management Tool—Version 2.0 August 15, 2017
94
The indicators in the two charts above are identified by the codes that appear in the far left
column. The activity list below provides the data description matching the codes. The user
can see the list and the indicators associated with them, by clicking on the <Activity List>
button. Doing so will open a pop-up window like the one below, linking the indicator codes
(numbers) with its an indicator.

Installation and Setup Guide for the SR Management Tool—Version 2.0 August 15, 2017
95
CUMULATIVE BUDGET AND EXPENDITURE 7.2.7.
The Cumulative budget and expenditure chart shown below displays the cumulative
amount of spending per “objective” or “module.” Whether the chart displays the data per
objective or module will depend on the grant’s performance framework; the appropriate
choice (objective or module) is made during step 2 (see section 5.2) of the configuration of
the SRMT.

Installation and Setup Guide for the SR Management Tool—Version 2.0 August 15, 2017
96
To see the list of objectives or modules, click on the <Objective List> or <Module List>
button, and a pop-up window will appear presenting the detail:

Installation and Setup Guide for the SR Management Tool—Version 2.0 August 15, 2017
97
7.3. DATA VISUALIZATION IN TABLES
WHERE TO SEE DATA IN TABLES 7.3.1.
If users would like to see data in detail, they can do so in six tables. To view these tables, the
user clicks one of the two buttons appearing under the “Summary information” section
of the <Menu> screen. All data entered in the monthly sheets are consolidated
automatically by the SRMT into these tables. The buttons read <Programmatic &
financial> and <Budget & expenditure>.
PROGRAMMATIC AND FINANCIAL TABLES 7.3.2.
Clicking the <Programmatic & financial> button takes the user to a large worksheet
titled Programmatic and Financial Summary Data, which includes several tables. To
view all the tables and all its sections, the user can move within the worksheet using the
vertical and horizontal scrollbars.
Table 1. Programmatic summary by year and by quarter
The first table in the worksheet is the Programmatic summary by year and by
quarter. This table shows summary programmatic results annually (year to date) and by
quarter. The structure of this table mirrors the structure of the annual planning worksheet
and shows results are shown for each indicator and activity listed in the annual planning
worksheet. The results shown are cumulative. Just as with the monthly worksheets, here
SRs record their data, with thresholds programmed into the worksheet resulting in
different colors being displayed in the “Results%” column to alert SRs as to whether
implementation is on track. Green signifies that achievements are close to targets, yellow
alerts SRs that implementation progress is inadequate, and red signifies that the results are
far below the intended targets.

Installation and Setup Guide for the SR Management Tool—Version 2.0 August 15, 2017
98
Table 2. Financial summary by year and by quarter
The second table in the worksheet, Financial summary by year and by quarter,
summarizes the financial performance of the grant annually and by quarter. As with the
Programmatic summary by period, the structure of this table mirrors the structure of the
annual planning worksheet and shows results for each indicator and activity listed in the
annual planning worksheet. The data being compared to determine financial performance
are the cumulative expenditures compared to cumulative budgets. Color-coded alerts are
applied in the same way as they are for the programmatic performance in Table I.
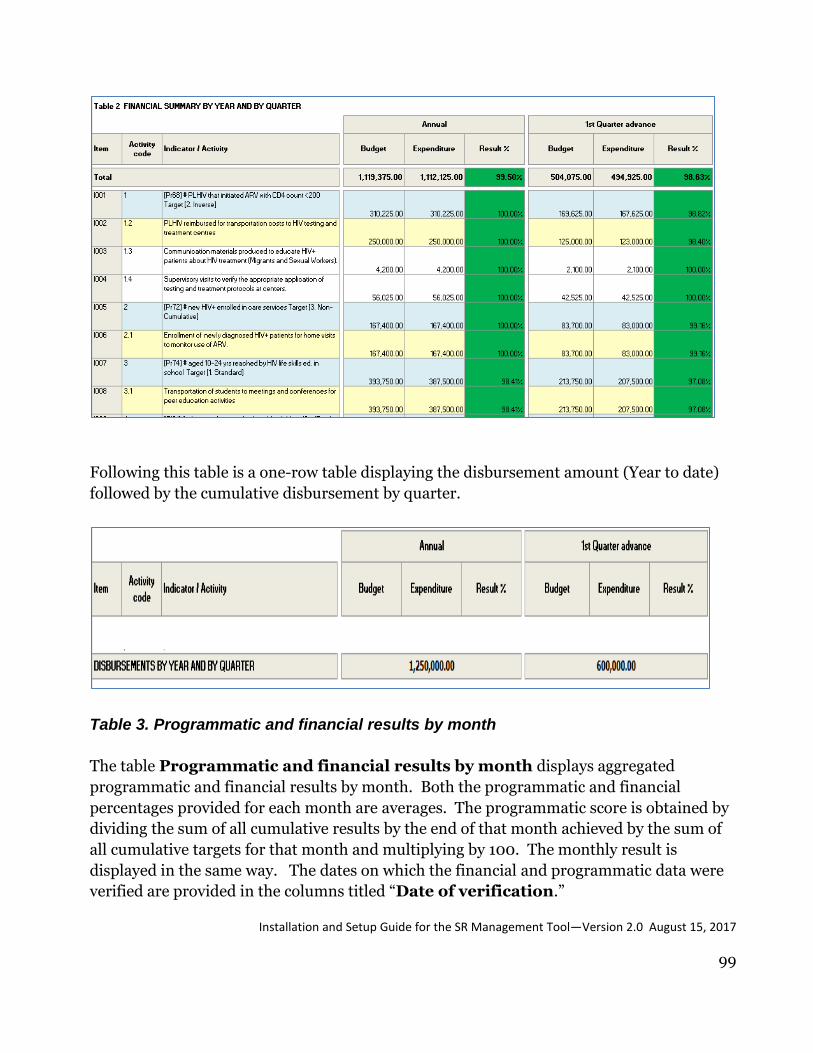
Installation and Setup Guide for the SR Management Tool—Version 2.0 August 15, 2017
99
Following this table is a one-row table displaying the disbursement amount (Year to date)
followed by the cumulative disbursement by quarter.
Table 3. Programmatic and financial results by month
The table Programmatic and financial results by month displays aggregated
programmatic and financial results by month. Both the programmatic and financial
percentages provided for each month are averages. The programmatic score is obtained by
dividing the sum of all cumulative results by the end of that month achieved by the sum of
all cumulative targets for that month and multiplying by 100. The monthly result is
displayed in the same way. The dates on which the financial and programmatic data were
verified are provided in the columns titled “Date of verification.”

Installation and Setup Guide for the SR Management Tool—Version 2.0 August 15, 2017
100
Table 4. PR Management Dashboard indicators
The data displayed in the table below, PR Dashboard Indicators, are the additional data
that are exported by SRs to the PR to complement SRs’ results reported on programmatic
indicators that appear in the PR Management Dashboard. Note that only the annual results
are cumulative results – the quarterly results display only the results for a specific quarter.

Installation and Setup Guide for the SR Management Tool—Version 2.0 August 15, 2017
101
Table 5. Overview of financial performance
The following table, Overview of financial performance, summarizes monthly
financial performance by comparing the following five elements of financial data provided
for each month: Budget; Disbursement; Balance from previous period; Expenditure and;
Cash balance. Information is also presented cumulatively by year to date (“Annual”) and by
quarter. The same information is presented in the Cumulative financial performance
chart that can be viewed by pressing the <Performance> button on the <Menu> screen
of the SRMT.
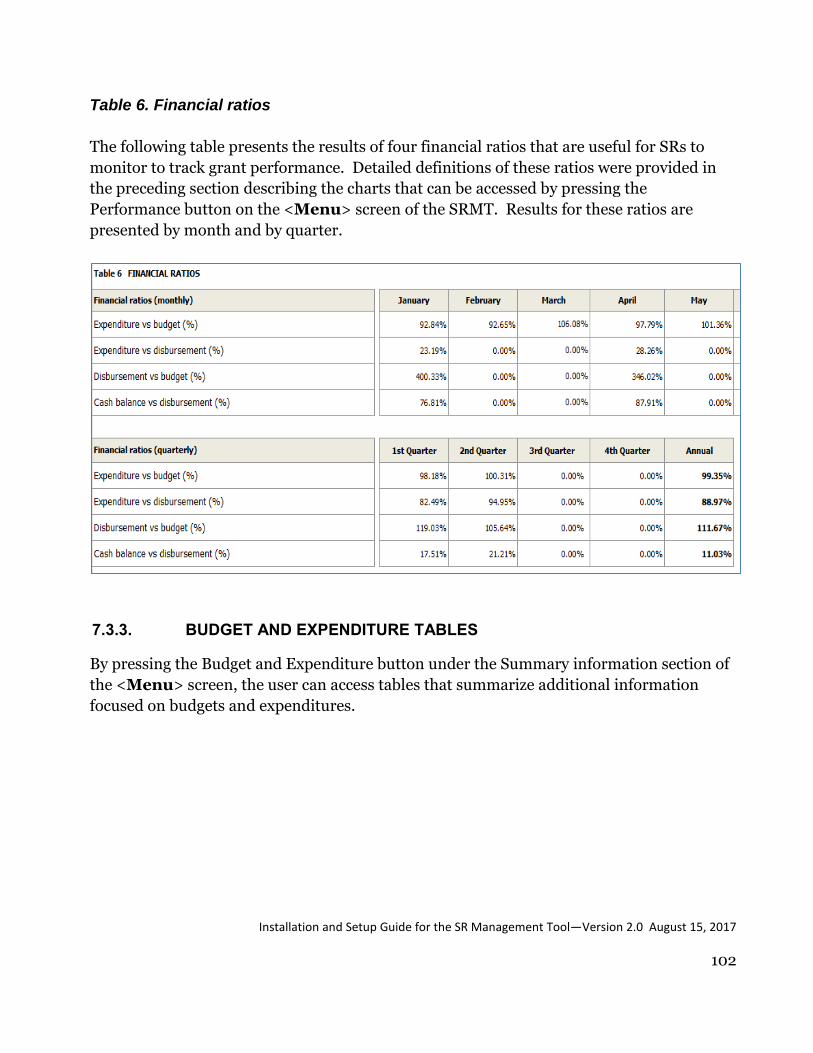
Installation and Setup Guide for the SR Management Tool—Version 2.0 August 15, 2017
102
Table 6. Financial ratios
The following table presents the results of four financial ratios that are useful for SRs to
monitor to track grant performance. Detailed definitions of these ratios were provided in
the preceding section describing the charts that can be accessed by pressing the
Performance button on the <Menu> screen of the SRMT. Results for these ratios are
presented by month and by quarter.
BUDGET AND EXPENDITURE TABLES 7.3.3.
By pressing the Budget and Expenditure button under the Summary information section of
the <Menu> screen, the user can access tables that summarize additional information
focused on budgets and expenditures.
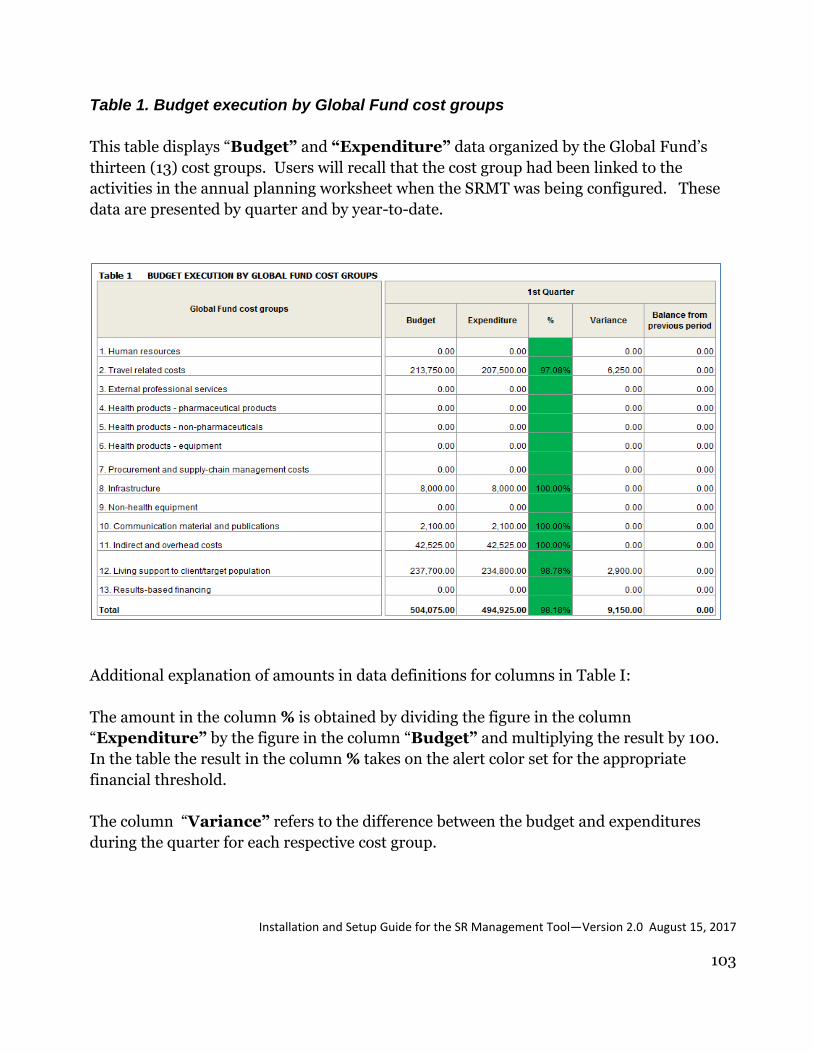
Installation and Setup Guide for the SR Management Tool—Version 2.0 August 15, 2017
103
Table 1. Budget execution by Global Fund cost groups
This table displays “Budget” and “Expenditure” data organized by the Global Fund’s
thirteen (13) cost groups. Users will recall that the cost group had been linked to the
activities in the annual planning worksheet when the SRMT was being configured. These
data are presented by quarter and by year-to-date.
Additional explanation of amounts in data definitions for columns in Table I:
The amount in the column % is obtained by dividing the figure in the column
“Expenditure” by the figure in the column “Budget” and multiplying the result by 100.
In the table the result in the column % takes on the alert color set for the appropriate
financial threshold.
The column “Variance” refers to the difference between the budget and expenditures
during the quarter for each respective cost group.
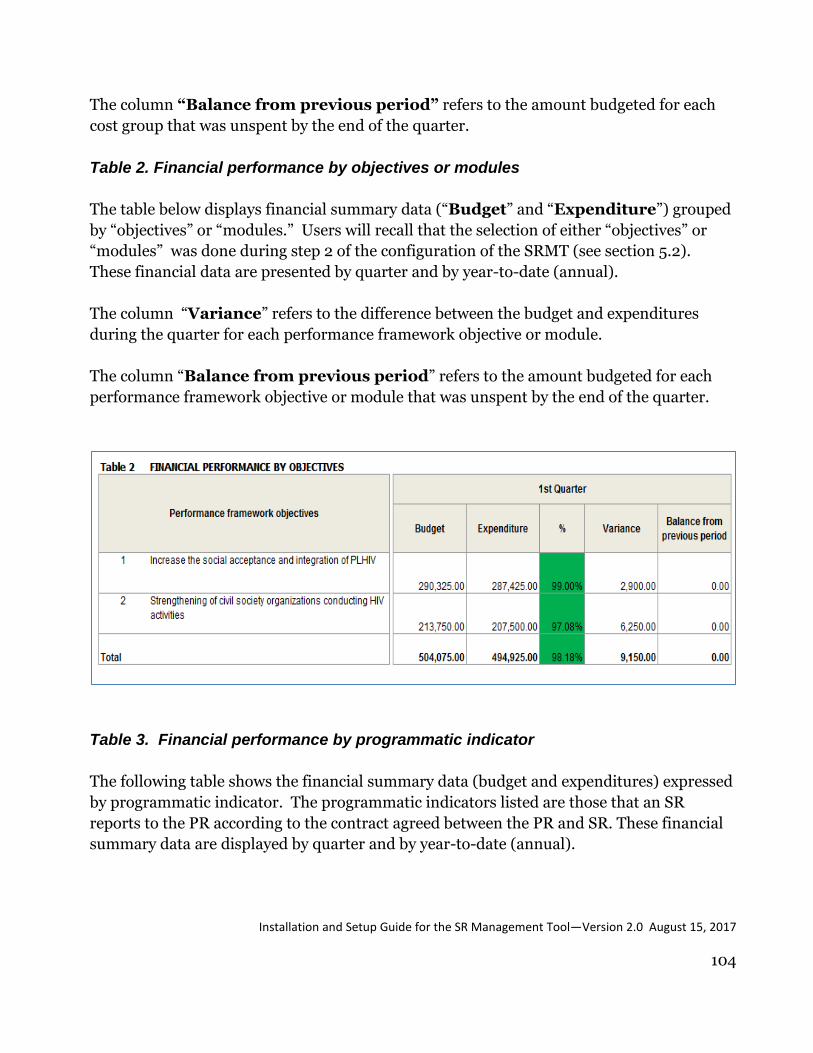
Installation and Setup Guide for the SR Management Tool—Version 2.0 August 15, 2017
104
The column “Balance from previous period” refers to the amount budgeted for each
cost group that was unspent by the end of the quarter.
Table 2. Financial performance by objectives or modules
The table below displays financial summary data (“Budget” and “Expenditure”) grouped
by “objectives” or “modules.” Users will recall that the selection of either “objectives” or
“modules” was done during step 2 of the configuration of the SRMT (see section 5.2).
These financial data are presented by quarter and by year-to-date (annual).
The column “Variance” refers to the difference between the budget and expenditures
during the quarter for each performance framework objective or module.
The column “Balance from previous period” refers to the amount budgeted for each
performance framework objective or module that was unspent by the end of the quarter.
Table 3. Financial performance by programmatic indicator
The following table shows the financial summary data (budget and expenditures) expressed
by programmatic indicator. The programmatic indicators listed are those that an SR
reports to the PR according to the contract agreed between the PR and SR. These financial
summary data are displayed by quarter and by year-to-date (annual).
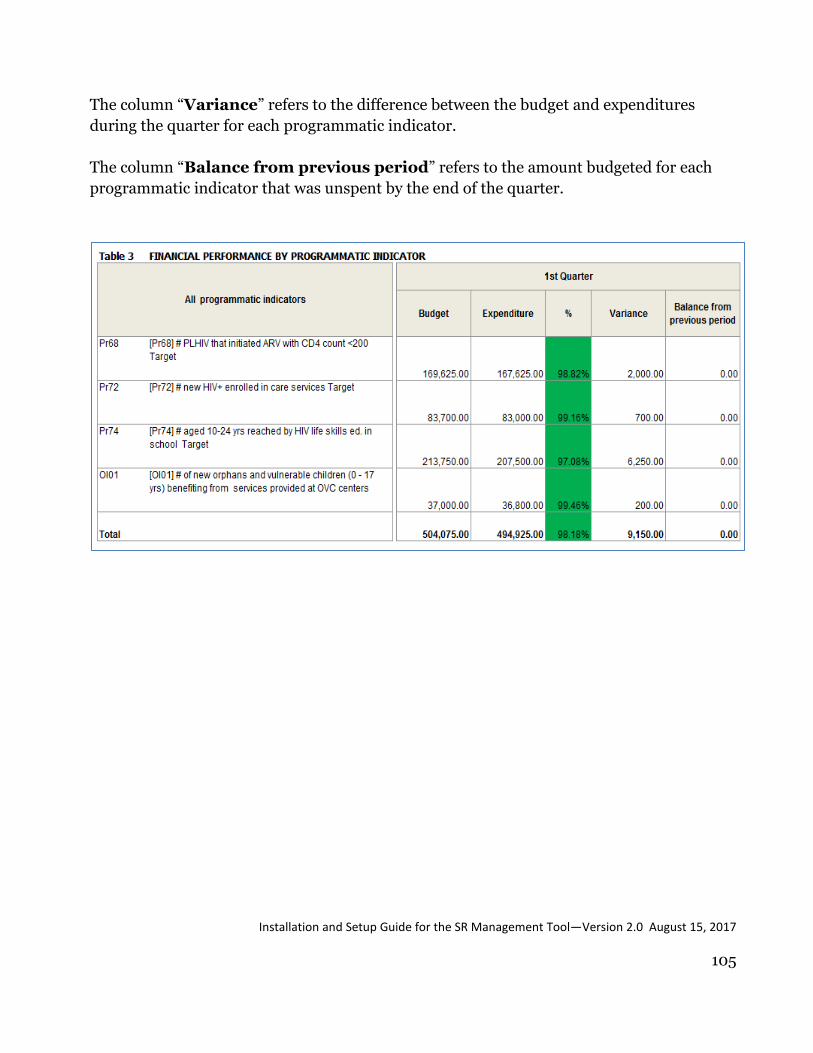
Installation and Setup Guide for the SR Management Tool—Version 2.0 August 15, 2017
105
The column “Variance” refers to the difference between the budget and expenditures
during the quarter for each programmatic indicator.
The column “Balance from previous period” refers to the amount budgeted for each
programmatic indicator that was unspent by the end of the quarter.
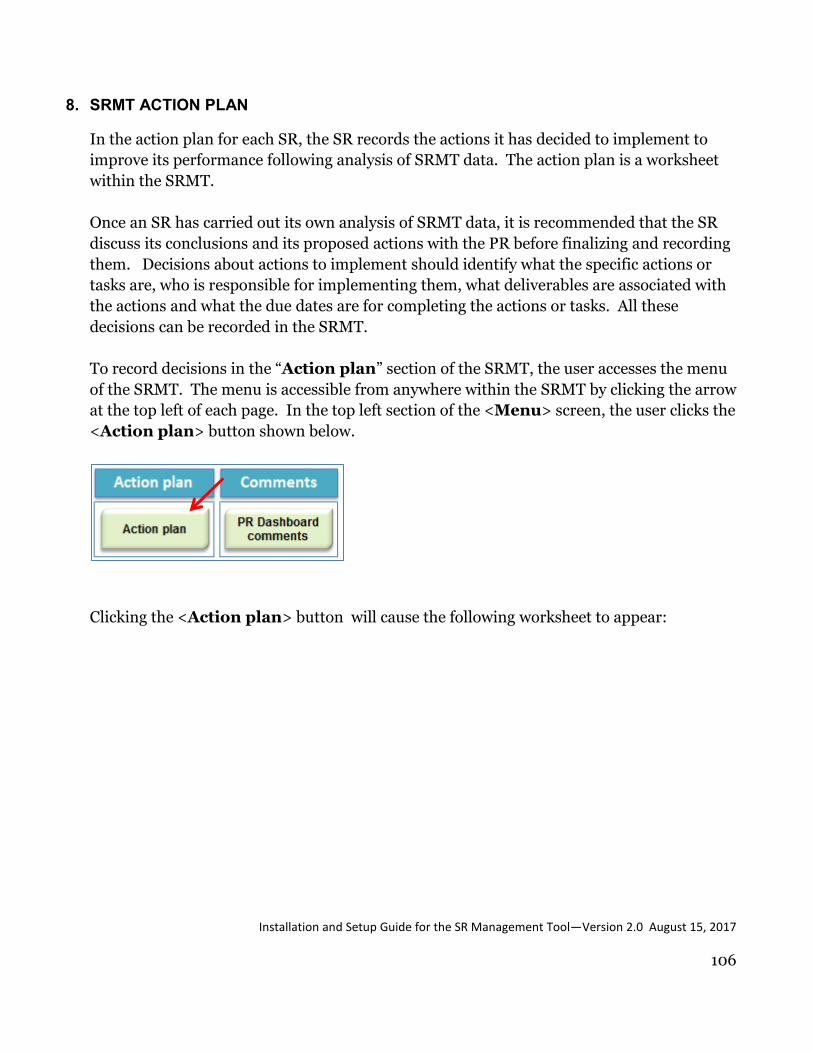
Installation and Setup Guide for the SR Management Tool—Version 2.0 August 15, 2017
106
8. SRMT ACTION PLAN
In the action plan for each SR, the SR records the actions it has decided to implement to
improve its performance following analysis of SRMT data. The action plan is a worksheet
within the SRMT.
Once an SR has carried out its own analysis of SRMT data, it is recommended that the SR
discuss its conclusions and its proposed actions with the PR before finalizing and recording
them. Decisions about actions to implement should identify what the specific actions or
tasks are, who is responsible for implementing them, what deliverables are associated with
the actions and what the due dates are for completing the actions or tasks. All these
decisions can be recorded in the SRMT.
To record decisions in the “Action plan” section of the SRMT, the user accesses the menu
of the SRMT. The menu is accessible from anywhere within the SRMT by clicking the arrow
at the top left of each page. In the top left section of the <Menu> screen, the user clicks the
<Action plan> button shown below.
Clicking the <Action plan> button will cause the following worksheet to appear:

Installation and Setup Guide for the SR Management Tool—Version 2.0 August 15, 2017
107
Although this sheet has a default format, it can be changed or adjusted depending on the
user preferences, meaning that rows or columns can be added or deleted. The default
action plan template consists of two main sections : “Improvement actions” and the
“Implementation plan.”
Improvement actions
In this section, the PR lists the specific improvement actions that need to be taken and
associated details such as the start and end dates for actions, necessary resources for
implementing actions, specific deliverables and the persons responsible for ensuring that
the actions are completed.
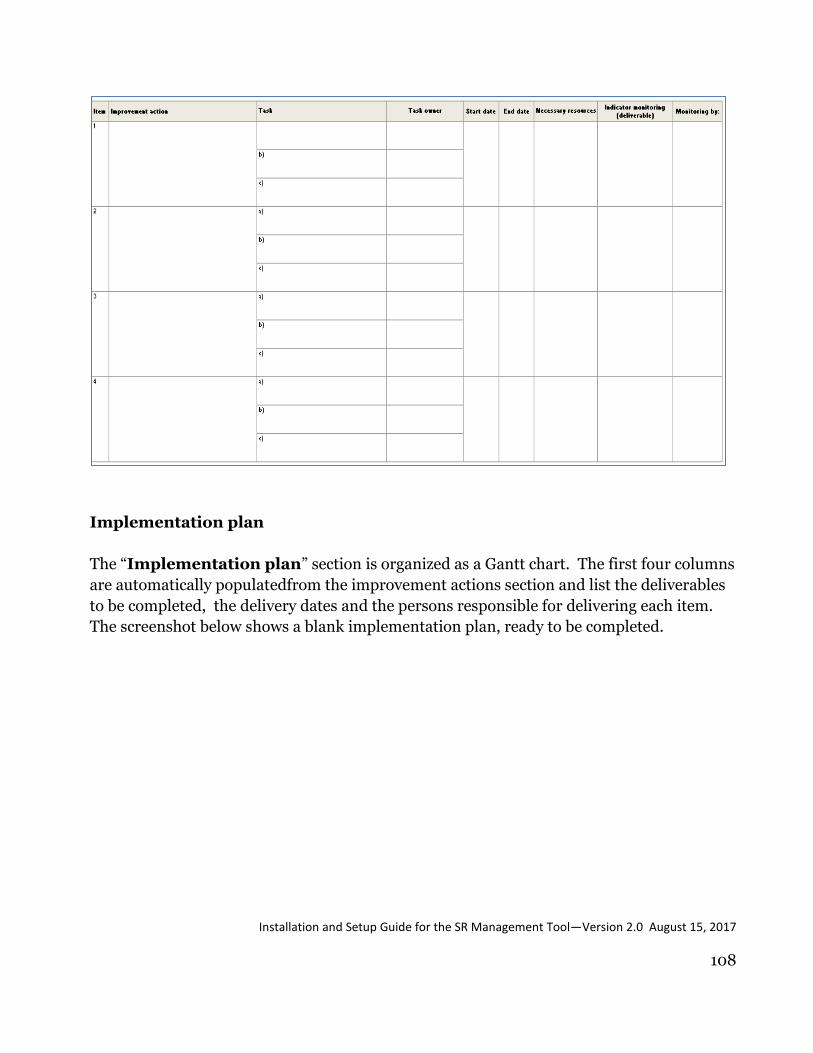
Installation and Setup Guide for the SR Management Tool—Version 2.0 August 15, 2017
108
Implementation plan
The “Implementation plan” section is organized as a Gantt chart. The first four columns
are automatically populatedfrom the improvement actions section and list the deliverables
to be completed, the delivery dates and the persons responsible for delivering each item.
The screenshot below shows a blank implementation plan, ready to be completed.
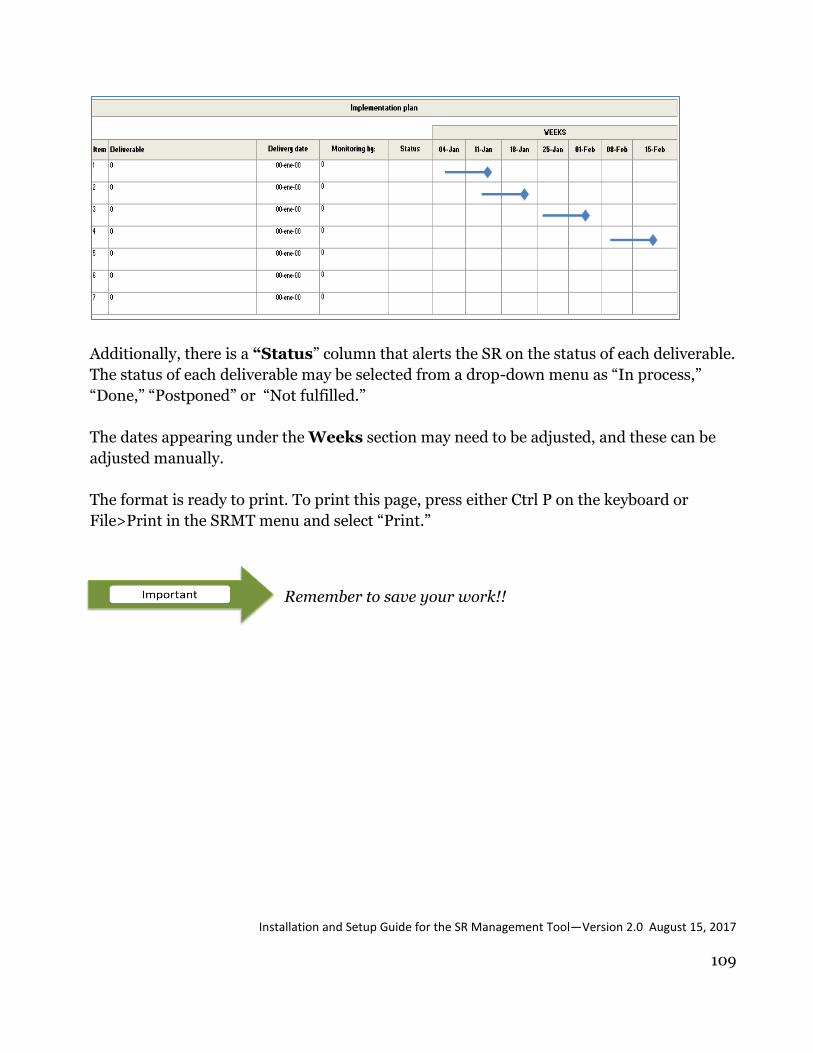
Installation and Setup Guide for the SR Management Tool—Version 2.0 August 15, 2017
109
Remember to save your work!!
Additionally, there is a “Status” column that alerts the SR on the status of each deliverable.
The status of each deliverable may be selected from a drop-down menu as “In process,”
“Done,” “Postponed” or “Not fulfilled.”
The dates appearing under the Weeks section may need to be adjusted, and these can be
adjusted manually.
The format is ready to print. To print this page, press either Ctrl P on the keyboard or
File>Print in the SRMT menu and select “Print.”
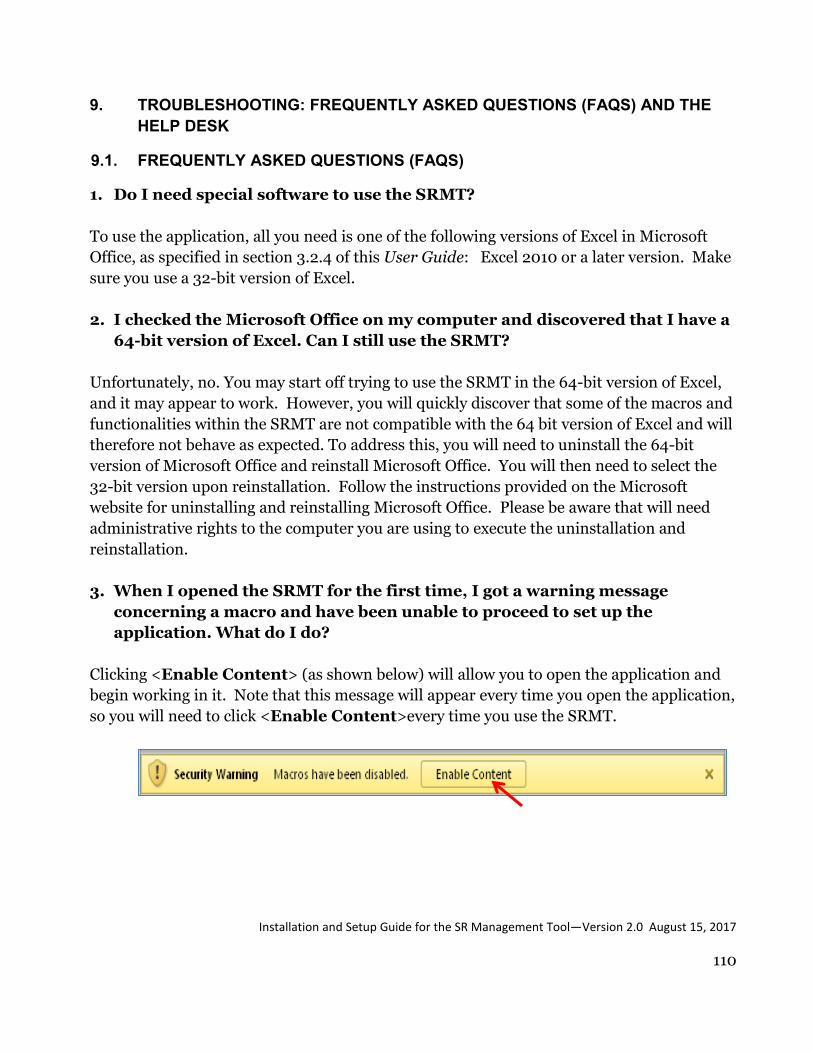
Installation and Setup Guide for the SR Management Tool—Version 2.0 August 15, 2017
110
9. TROUBLESHOOTING: FREQUENTLY ASKED QUESTIONS (FAQS) AND THE
HELP DESK
9.1. FREQUENTLY ASKED QUESTIONS (FAQS)
1. Do I need special software to use the SRMT?
To use the application, all you need is one of the following versions of Excel in Microsoft
Office, as specified in section 3.2.4 of this User Guide: Excel 2010 or a later version. Make
sure you use a 32-bit version of Excel.
2. I checked the Microsoft Office on my computer and discovered that I have a
64-bit version of Excel. Can I still use the SRMT?
Unfortunately, no. You may start off trying to use the SRMT in the 64-bit version of Excel,
and it may appear to work. However, you will quickly discover that some of the macros and
functionalities within the SRMT are not compatible with the 64 bit version of Excel and will
therefore not behave as expected. To address this, you will need to uninstall the 64-bit
version of Microsoft Office and reinstall Microsoft Office. You will then need to select the
32-bit version upon reinstallation. Follow the instructions provided on the Microsoft
website for uninstalling and reinstalling Microsoft Office. Please be aware that will need
administrative rights to the computer you are using to execute the uninstallation and
reinstallation.
3. When I opened the SRMT for the first time, I got a warning message
concerning a macro and have been unable to proceed to set up the
application. What do I do?
Clicking <Enable Content> (as shown below) will allow you to open the application and
begin working in it. Note that this message will appear every time you open the application,
so you will need to click <Enable Content>every time you use the SRMT.

Installation and Setup Guide for the SR Management Tool—Version 2.0 August 15, 2017
111
4. Some formulas in the SRMT do not calculate automatically. What should I
do to correct this?
In some cases this can be solved by clicking Calculate Now using the Formulas menu or
F9 on the keyboard for a manual one-off calculation of formulas. Alternatively, formulas
can be set to automatically calculate by selecting “Automatic” under the Formulas menu,
as shown in the screenshot below.
If the problem persists, contact GMS or Global Fund Help Desk as applicable. Instructions
for accessing the Help Desk are found in section 9.2.
5. When I exit the SRMT the following window appears. What do I do?
Every once in a while, Excel may display this dialogue box. To make the dialogue box
disappear, press the <Cancel> button several times until it closes. No additional action is
needed.

Installation and Setup Guide for the SR Management Tool—Version 2.0 August 15, 2017
112
6. What do I do with unused budget?
There may be instances where unused budget may trigger a decision by an SR to reprogram
funds. An example of such a scenario would be where an activity was completed and funds
were remaining due to savings realized from lower unit costs of inputs used. In such
situations, it is recommended that the SR follow the procedures agreed upon with the PR
for reprogramming funds. If the decision is to reprogram funds to a different budget line
item, and the decision is to make that adjustment within the work plan year, the SR will
need to make the adjustment to the budget by going to the “Annual Planning” worksheet
and reducing the budget for the line item where the savings were achieved and increasing
the budget for the line item to which the savings are being transferred.
9.2. HELP DESK
The Global Fund has established a Help Desk to ensure that both simple and complex
problems that may arise with use of the SRMT application are addressed promptly and
effectively. Technical assistance provider GMS also has a Help Desk for its technical-
support teams and organizations they serve.
The Help Desk operates on the assumption that most problems arising with use of the
SRMT can be addressed by referring to this User Guide or any technical assistance team
that is assisting the PR and SRs with the SRMT introduction and use. Should problems
arise that require more advanced technical help, however, additional assistance is provided
through the Help Desk to rapidly resolve any issue; a response to this kind of request will be
given within 48 hours .
The following table summarizes the approach to troubleshooting and resolution of
problems with the SRMT use.
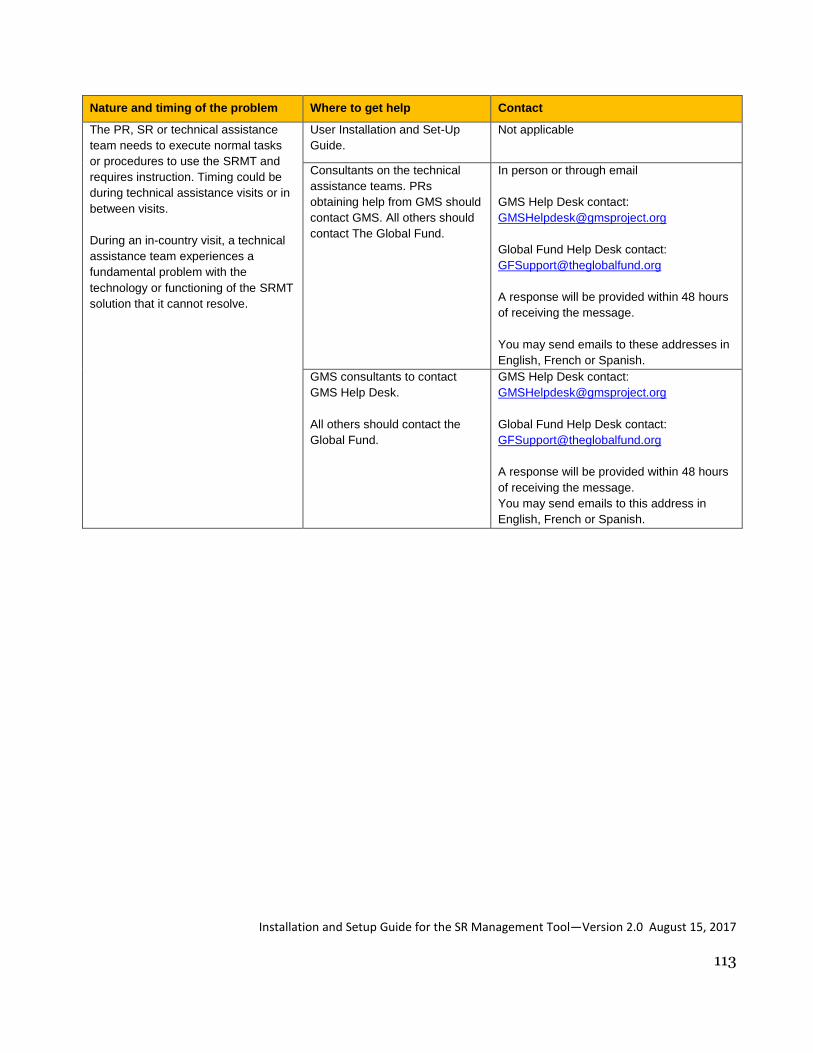
Installation and Setup Guide for the SR Management Tool—Version 2.0 August 15, 2017
113
Nature and timing of the problem Where to get help Contact
The PR, SR or technical assistance
team needs to execute normal tasks
or procedures to use the SRMT and
requires instruction. Timing could be
during technical assistance visits or in
between visits.
During an in-country visit, a technical
assistance team experiences a
fundamental problem with the
technology or functioning of the SRMT
solution that it cannot resolve.
User Installation and Set-Up
Guide.
Not applicable
Consultants on the technical
assistance teams. PRs
obtaining help from GMS should
contact GMS. All others should
contact The Global Fund.
In person or through email
GMS Help Desk contact:
Global Fund Help Desk contact:
A response will be provided within 48 hours
of receiving the message.
You may send emails to these addresses in
English, French or Spanish.
GMS consultants to contact
GMS Help Desk.
All others should contact the
Global Fund.
GMS Help Desk contact:
Global Fund Help Desk contact:
A response will be provided within 48 hours
of receiving the message.
You may send emails to this address in
English, French or Spanish.

Installation and Setup Guide for the SR Management Tool—Version 2.0 August 15, 2017
114
ANNEX 1. LIQUIDATION OF SSR ADVANCES
This annex is used to record the status of justifying expenditures made by SSRs based on
the disbursements they have received from SRs. The template is organized to facilitate the
review of the liquidation of expenses by an SR to its SSRs on a monthly basis.
Tracking the liquidation of expenses is an important aspect of risk management in the
context of managing grants and sub-grants. By ensuring that SSRs provide adequate and
valid documentation for expenses made, the SR is carrying out its due diligence to ensure
that fraud and waste is minimized at the SSR level. SR disbursements to SSRs should
reflect whether past disbursements or advances to SSRs have been properly documented.
PRs in turn will base their disbursements to SRs in part on whether or not adequate
documentation has been submitted by SRs for expenses paid; PRs are required to report to
the Global Fund on the percentage of SR level expenditures which are adequately
documented. Therefore having a system for tracking the justification of expenses paid by
SSRs will help the SR with its risk management as well as with reporting to the PR.
The annex consists of two tables. The first table summarizes the overall status of the
liquidation of expenses for all SSRs by month. This first section is populated automatically
from the data entered into the second section. The second table shows the detail of the
liquidation of expenses for each SSR and should be completed first.
The following are the definitions for each row in the table titled: Summary: Liquidation
of SSR advances
“Disbursement”: Total disbursements made to all SSRs for the month
“Executed”: Total expenditures reported by each SSR for the month
“Justified”: Total expenditures for which SSRs have provided appropriate documentation
to justify the expenditures
“Not Justified”: Total expenditures for which SSRs have not yet provided appropriated
documentation to justify expenditures. This is calculated automatically by subtracting the
“Justified” expenses from the “Executed” expenses
“Balance”: “Disbursement” – (“Justified” + “Not Justified”)
Note that that this worksheet is not password protected.

Installation and Setup Guide for the SR Management Tool—Version 2.0 August 15, 2017
115
Installation and Setup Guide for the SR Management Tool—Version 2.0 August 15, 2017
116
ANNEX 2. ANNUAL PLANNING EXERCISE
1. PURPOSE OF THE ANNUAL PLANNING EXERCISE
This annex 2 of the User Guide advises PRs, SRs and technical-support providers on
conducting an annual planning exercise. As mentioned in section 1 of this manual, the
annual planning exercise is a foundational activity for setting up the SRMT because it helps
to identify, organize and complete key information needed to configure the annual planning
worksheet in the SRMT.
The annual planning exercise has two objectives:
1. It lays the foundation for rapid and efficient grant startup and
implementation by ensuring that the PR and its SRs have a common
understanding of how the grant is to be implemented, which activities each SR will
carry out and when, what resources are allocated for implementation and what the
performance objectives are for each implementation period. When conducted after
the first year of grant implementation, the annual planning exercise helps PRs and
SRs to determine whether to reprogram savings or refocus and reschedule activities
and resources.
2. It helps the PR and its SRs to make decisions and develop plans that
provide key grant implementation data that will be monitored using the
SRMT during the next implementation year.
1.1. DATA NEEDED TO CONFIGURE THE SRMT
This subsection describes the data and data sources needed to conduct the annual planning
exercise.
In this annex, GMS outlines one way to create a monthly work plan for each SR. Some of these planning steps may have already been carried out during grant making or during grant startup. Each PR should review this annex to be sure it has all the information required for each SR, and complete only those planning steps needed to fill gaps in information.

Installation and Setup Guide for the SR Management Tool—Version 2.0 August 15, 2017
117
The PR is encouraged to use these two pages to record what detailed information the PR has for each SR. This can be done by making as many copies of these two pages as there are SRs, labeling the pages with the relevant SR’s name, and then checking columns for which the PR already has detailed information for the relevant SR. A summary page like the one shown below can be made from the individual SR pages that resemble the ones shown below.
As explained in section 1 of the User Guide, the SRMT is linked to the PR Management
Dashboard. The SRMT provides data for the indicators selected for the PR Management
Dashboard. Data exported from the SRMT to the PR Management Dashboard are viewable
in the drill-down pages of the PR Management Dashboard.
Therefore, the PR Management Dashboard must always be configured before
setup of the SRMT. This is because the selection of indicators, the mapping of SRs to
indicators and the decisions about how programmatic targets are allocated among SRs for
each indicator must be carried out before the PR Management Dashboard is configured.
This is usually done during an indicator-mapping workshop that involves both the PR and
its SRs. Please see section 3.8 of the PR Management Dashboard Installation and Setup
Guide for more information.4
Once targets are set for each SR, the configuration of the PR Management Dashboard
produces SR data-entry sheets. SRs will use these sheets to report quarterly to the PR.
These sheets will also be used to configure the SRMT for each SR. Configuration of the
SRMT can only proceed once the SR data-entry sheets have been generated from the PR
Management Dashboard. There is therefore some obligatory overlap between the data
needed to configure the PR Management Dashboard and the data needed to configure the
SRMT. The data needed to configure each tool are summarized in the two tables on the
following pages.
The tables on the following pages are samples of tables summarizing which information is
needed to configure the PR Management Dashboard and the SRMT.
4. Please note that references to “HPM” or “health products management” in this User Guide are written and understood in the PR Management Dashboard Installation and Setup Guide as references to “PSM” or “procurement and supply management.”

Installation and Setup Guide for the SR Management Tool—Version 2.0 August 15, 2017
118
Table 1. Information needed to configure both the PR Management Dashboard and the SRMT 5
1 2 3 4 5 6 7 8
Objective/
Module of
the grant
Indicators for
the
objective/
module
Targets for
that indicator
per period
SRs mapped to
indicators
Targets per
SR per
indicator &
period
Disbursements
per SR (total)
Budget by SR per
period
Expenditures reported by
SR per period
1
A
B
C
#
#
#
SR 1, SR 2
SR 2, SR 4
SR 1,SR 2, SR 3,
SR 4
#
#
#
SR 1 = $
SR 2 = $
SR 3 = $
SR 4 = $
SR 5 = $
SR 6 = $
SR 7 = $
SR 8 = $
SR 1 = $, SR 2 = $
SR 2 = $, SR 4 = $
Etc.
SR 1 = $, SR 2 = $
SR 2 = $, SR 4 = $
Etc.
2 D
E
#
#
SR 5, SR 6, SR 7
SR 5, SR 6, SR 8
#
#
Etc. Etc.
3
F
G
H
#
#
#
SR 1 – SR 8
SR 1 – SR 8
SR 2, SR 4,
SR 6, SR 7
#
#
#
Etc. Etc.
Check off if PR has
this information
For which SRs is
information missing?
5. The terms “objectives” and “modules” are both used in the programmatic section of the Global Fund’s performance framework. They are not interchangeable. Objectives are linked to impact indicators; modules are linked to coverage indicators See section 5.3 of this User Guide regarding selection of objectives and modules.

Installation and Setup Guide for the SR Management Tool—Version 2.0 August 15, 2017
119
Table 2. Additional grant information needed to configure the SRMT 1 2 3 4 5 6 7 8 9
Objective/
Module of
the grant
Indicators
for the
objective/
module
Activities
by
indicator
SRs
mapped
to
activities
Budget per SR per
activity per
quarter
Budget per SR
per activity per
month
Target per
SR per
activity
per
quarter
Target per
SR per
activity per
month
Unit of
measurement
per activity
Description Indicator 1 1.1 1.2
SR 1 SR 2, SR 4
SR 1 = $ SR 2 = $ SR 4 = $
SR 1 = $ SR 2 = $ SR 4 = $
SR 1 = # SR 2 = # SR 4 = #
SR 1 = # SR 2 = # SR 4 = #
1.1 Output
measure 1.2 Output
measure
Indicator 2 2.1 2.2
SR 1, SR 2 SR 3
SR 1 = $ SR 2 = $ SR 3 = $
SR 1 = $ SR 2 = $ SR 3 = $
SR 1 = # SR 2 = # SR 3 = #
SR 1 = # SR 2 = # SR 3 = #
2.1 Output
measure 2.2 Output
measure
Description Indicator 3 3.1
3.2 3.3
SR 5, SR 6,
SR 7 SR 5, SR 6 SR 8
SR 5 = $, SR 6 = $,
SR 7 = $
SR 5 = $, SR 6 = $ SR 8 = $
SR5 = $, SR6 =
$, SR7 = $ SR5 = $, SR6 =
$ SR8 = $
SR 5 = #
SR 6 = #
SR 7 = # SR 5 = %
SR 6 = % SR 8 = %
SR 5 = #
SR 6 = #
SR 7 = # SR 5 = %
SR 6 = % SR 8 = %
3.1 Output
measure 3.2 Milestones 3.2 Milestones
Check off if PR has
this information
For which SRs is
information
missing?

In addition to the information listed above, the following documents are needed to obtain
the data needed for configuring the SRMT:
The approved grant work plan and budget in the Global Fund Excel template
The approved grant performance framework
Subagreements signed between the PR and SRs, with their accompanying work plans
and budgets (if they exist)
Sub-subagreement budgets and work plans agreed between SRs and SSRs (if they
exist)
The Global Fund requires that the PR sign subagreements with its SRs to formalize
implementation arrangements and ensure that both parties clearly understand
performance expectations. These subagreements usually include budgets, work plans and
performance frameworks and are grounded in the PR’s signed grant agreement with the
Global Fund. In some grants, the PR-SR subagreements will show the planned activities
and budgets for the entire two- or three-year grant period. In other grants, PRs review and
sign SR work plans and budgets each year, giving them the opportunity to renegotiate
targets and budgets depending on recent performance. This annual review may even result
in dropping or adding SRs to the implementation group.
Each PR and its SRs will need to check their documents to be sure they have enough detail
to configure and establish the baselines in the PR Management Dashboard and SRMT
spreadsheets. In an ideal situation, these subagreements should provide a good starting
point for extracting the data needed to conduct the annual planning exercise. However, the
reality is that for many grants, SR work plans and budgets are not sufficient detailed.
Furthermore, it is possible that at the time the grant is signed SRs may not have been
selected. Therefore, if the PR lacks these pieces of information, to conduct the annual
planning exercise the PR will have to rely on two documents that are part of its grant
documents: the PR’s grant performance framework and the PR’s detailed budget.
The grant performance framework summarizes the performance that the PR is
expected to attain for a specific grant using the resources provided by the Global Fund: It
describes the modules that apply to the grant, the indicators associated with each module
and the corresponding baseline values and targets for each indicator by quarter and year.
The approved grant work plan and budget describes the interventions by
objective/module, by activity, by intervention and by SR. This information is broken down
for each quarter of the grant. The “Detailed budget” and “Budget summary” tabs will
probably be most useful for the annual planning exercise.

Installation and Setup Guide for the SR Management Tool— Version 2.0 August 15, 2017
121
The annual planning exercise culminates with extracting the data needed to
configure the SRMT. It is a challenge to obtain these data because the SRMT tracks data
on a monthly basis and the frequency of SR information in grant subagreements is
quarterly at most. The SRMT also links indicators to activities and budgets, depending on
how data are organized in the grant agreement. The gaps in mapping SRs to indicators and
in defining targets for SRs will be addressed during the indicator-mapping workshops
conducted to set up the PR Management Dashboard. Other gaps in SR information are
filled through decisions made while conducting the annual planning exercise.
1.2. ORGANIZING THE ANNUAL PLANNING EXERCISE
The annual planning exercise should be done by the PR prior to the configuration of the
SRMT. It may be carried out as part of proposal development or during grant making,
during the first quarter of grant startup or in month 12 of each grant year. Because it is a
lengthy process, the SRMT technical support consultants will not have time to assist the PR
with this exercise: if technical support is needed, the PR should mobilize it separately from
the SRMT support.
The PR will want to carry out annual planning with at least one representative of each SR.
The PR will need to involve its technical managers, its budget manager or a staffer adept at
manipulating the Global Fund budget templates, and the monitoring and evaluation (M&E)
officer. Each SR will need to involve one or more of the following: the SR’s program
manager, finance manager, M&E officer, other staff. If a single meeting of all implementers
is impossible, the exercise might be done in smaller groups, one-on-one between the PR
and certain SRs, or as an add-on to some other meeting or work event involving the same
institutions. To cover related expenses, the PR may want to seek approval from its Global
Fund country team to use grant funds for this event, as part of efficient grant management.
The end product of this exercise is a detailed work plan and budget for each SR
with targets or with a separate performance framework for each SR. These
documents will become annexes to the PR-SR subagreement. These work plans, budgets
and performance frameworks should be in Excel workbooks, either adapted from the Global
Fund template or in a simpler format. The grant work plan numbering system for the
modules, objectives, indicators and activities should be common to all SR plans, so that
implementers have common references for navigating and communicating about their
plans. The sum of the budgets plus the PR budget must match the complete
grant budget. The sum of the individual SR targets plus the PR targets must
match the complete grant performance framework.

Installation and Setup Guide for the SR Management Tool— Version 2.0 August 15, 2017
122
1.3. STEPS FOR DEVELOPING THE ANNUAL PLANNING EXERCISE
PREPARING TO CARRY OUT THE ANNUAL PLANNING EXERCISE 1.3.1.
The annual planning exercise comprises several steps. Depending on the specific situation
of a grant and the availability of data, some steps will require action by the PR, some by the
SRs and some by both.
The following table shows the four key steps of the annual planning exercise.
Step 1 Step 2 Step 3 Step 4
Identify data from grant
documents to be transferred to
the annual plan
Consolidate annual
planning data
SRs Prepare the SR annual
plan
Check the alignment of
each SR’s annual plan with
the full grant work plan
and budget
STEP 1: IDENTIFY DATA FROM GRANT DOCUMENTS TO BE 1.3.2.
TRANSFERRED TO THE ANNUAL PLAN
Step 1 of the annual planning exercise requires two files:
1. The approved grant budget and work plan in the PR’s Global Fund Excel template2. The
Performance framework spreadsheet
1: The grant work plan and budget – “Detailed Budget” tab
The Excel workbook, or file, named for the country/disease/PR and date contains several
worksheets, or tabs, showing different views of the grant work plan and budget. One tab is
called “Detailed Budget” as shown by the red arrow in the following screenshot. Column
H, “Activity Description” on the tab, lists all the budgeted activities. These activities are
associated with several other columns:
Column C shows the corresponding grant module
Column E shows the overarching intervention with which a given activity is
associated
Column M shows the recipient (which may be the PR or an SR) responsible for the
activity.
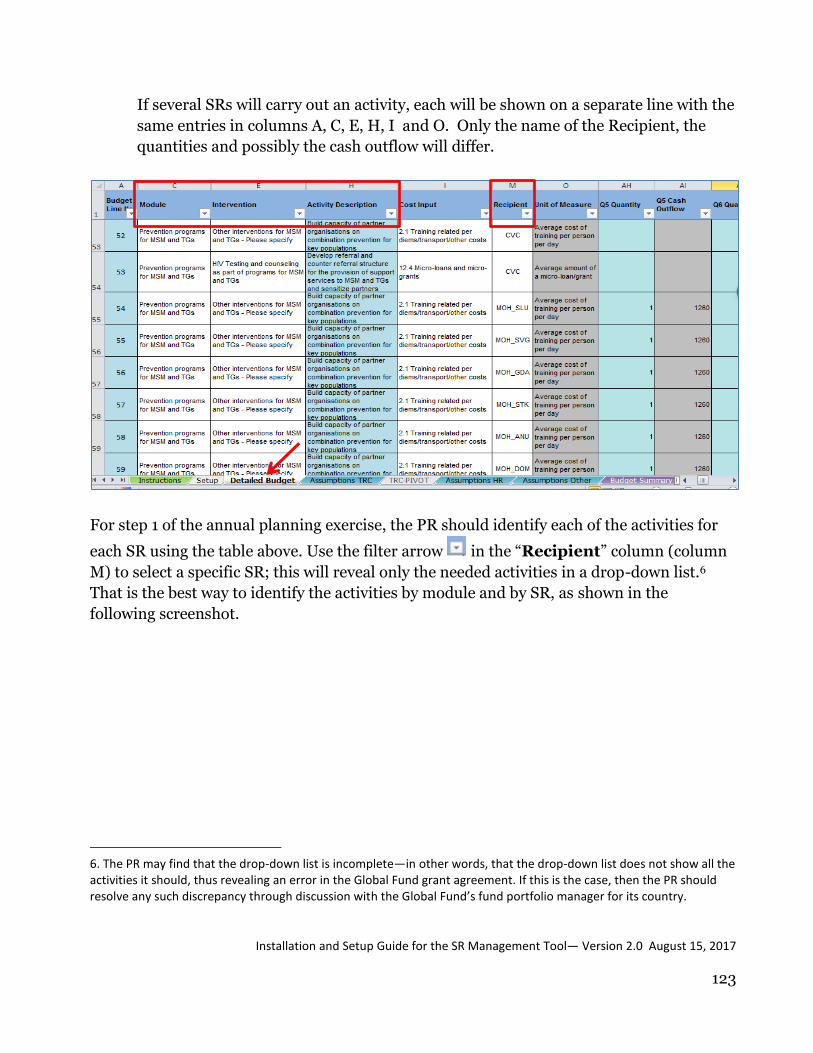
Installation and Setup Guide for the SR Management Tool— Version 2.0 August 15, 2017
123
If several SRs will carry out an activity, each will be shown on a separate line with the
same entries in columns A, C, E, H, I and O. Only the name of the Recipient, the
quantities and possibly the cash outflow will differ.
For step 1 of the annual planning exercise, the PR should identify each of the activities for
each SR using the table above. Use the filter arrow in the “Recipient” column (column
M) to select a specific SR; this will reveal only the needed activities in a drop-down list.6
That is the best way to identify the activities by module and by SR, as shown in the
following screenshot.
6. The PR may find that the drop-down list is incomplete—in other words, that the drop-down list does not show all the activities it should, thus revealing an error in the Global Fund grant agreement. If this is the case, then the PR should resolve any such discrepancy through discussion with the Global Fund’s fund portfolio manager for its country.
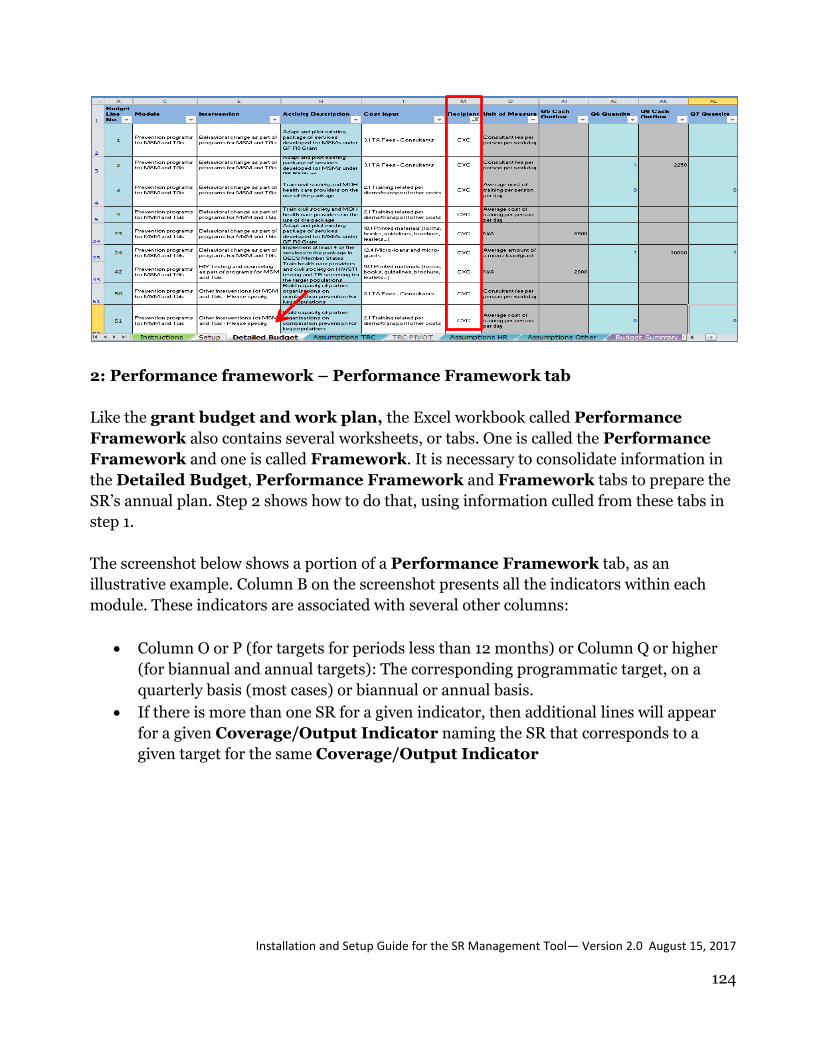
Installation and Setup Guide for the SR Management Tool— Version 2.0 August 15, 2017
124
2: Performance framework – Performance Framework tab
Like the grant budget and work plan, the Excel workbook called Performance
Framework also contains several worksheets, or tabs. One is called the Performance
Framework and one is called Framework. It is necessary to consolidate information in
the Detailed Budget, Performance Framework and Framework tabs to prepare the
SR’s annual plan. Step 2 shows how to do that, using information culled from these tabs in
step 1.
The screenshot below shows a portion of a Performance Framework tab, as an
illustrative example. Column B on the screenshot presents all the indicators within each
module. These indicators are associated with several other columns:
Column O or P (for targets for periods less than 12 months) or Column Q or higher
(for biannual and annual targets): The corresponding programmatic target, on a
quarterly basis (most cases) or biannual or annual basis.
If there is more than one SR for a given indicator, then additional lines will appear
for a given Coverage/Output Indicator naming the SR that corresponds to a
given target for the same Coverage/Output Indicator

Installation and Setup Guide for the SR Management Tool— Version 2.0 August 15, 2017
125
3. Performance framework – Framework tab
The screenshot below shows a portion of the Framework tab (in the Performance
Framework worksheet). Column H on the screenshot shows the interventions associated
with each module. These interventions are associated with several other columns that
contain information not found in the Performance Framework worksheet:
Column F: The corresponding module name (also shown in Column H of the
Performance Framework worksheet)
Columns A, B, D: These columns show indicators, respectively the Impact
Indicator, Outcome Indicator and Coverage/Output Indicator that
corresponds to a given module
The process of consolidating the information in the three tabs above will be described in
step 2.

Installation and Setup Guide for the SR Management Tool— Version 2.0 August 15, 2017
126
STEP 2: CONSOLIDATE ANNUAL PLANNING DATA 1.3.3.
Once the data have been identified in step 1, in step 2 the PR will consolidate information
found in the three tabs discussed in step 1 into a new separate file. This file will serve as the
data source for configuring the SRMT.
GMS proposes the following format be used for each SR to consolidate the information
found in the three tabs—programmatic indicators, activities, targets and corresponding
budget. To aid in this consolidation, this template is provided in the SRMT workbook as an
annex called SR data consolidation template.
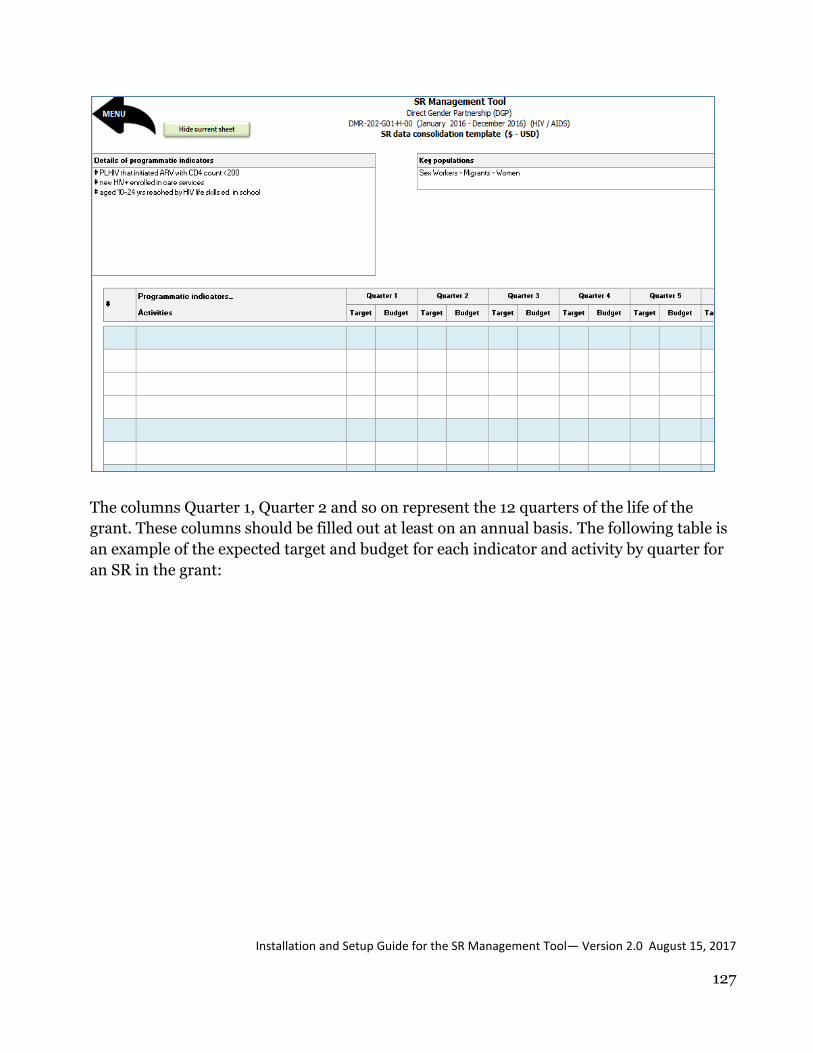
Installation and Setup Guide for the SR Management Tool— Version 2.0 August 15, 2017
127
The columns Quarter 1, Quarter 2 and so on represent the 12 quarters of the life of the
grant. These columns should be filled out at least on an annual basis. The following table is
an example of the expected target and budget for each indicator and activity by quarter for
an SR in the grant:
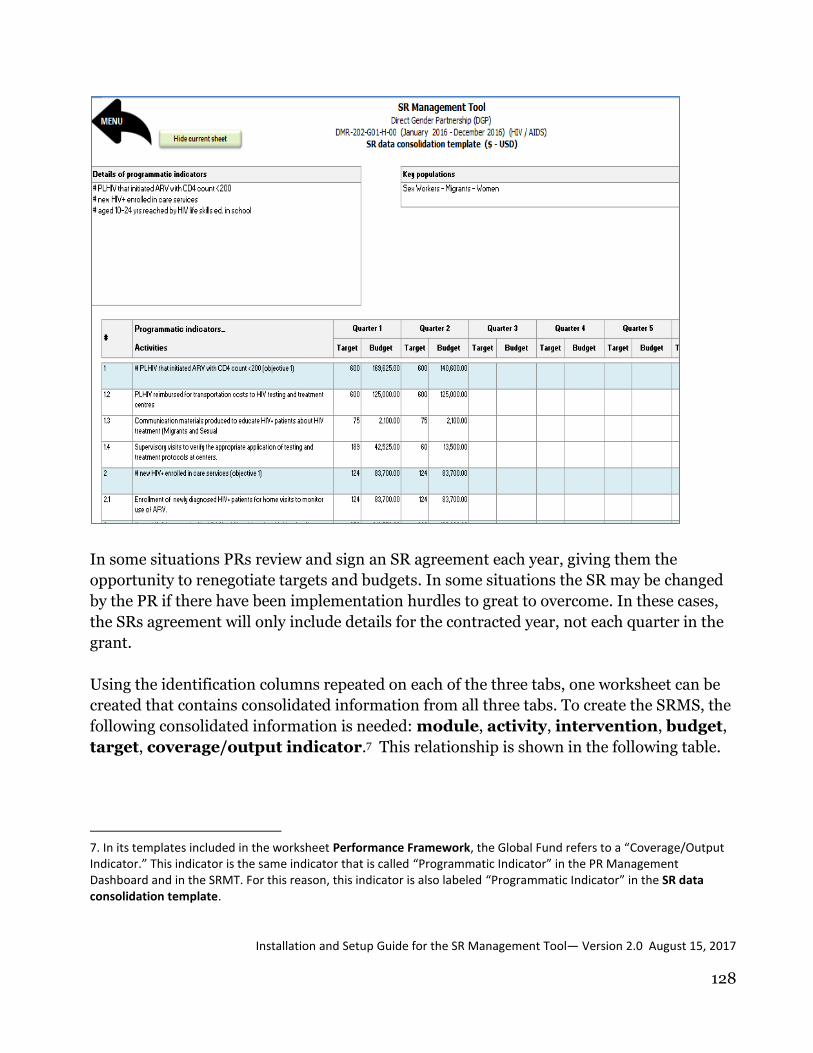
Installation and Setup Guide for the SR Management Tool— Version 2.0 August 15, 2017
128
In some situations PRs review and sign an SR agreement each year, giving them the
opportunity to renegotiate targets and budgets. In some situations the SR may be changed
by the PR if there have been implementation hurdles to great to overcome. In these cases,
the SRs agreement will only include details for the contracted year, not each quarter in the
grant.
Using the identification columns repeated on each of the three tabs, one worksheet can be
created that contains consolidated information from all three tabs. To create the SRMS, the
following consolidated information is needed: module, activity, intervention, budget,
target, coverage/output indicator.7 This relationship is shown in the following table.
7. In its templates included in the worksheet Performance Framework, the Global Fund refers to a “Coverage/Output Indicator.” This indicator is the same indicator that is called “Programmatic Indicator” in the PR Management Dashboard and in the SRMT. For this reason, this indicator is also labeled “Programmatic Indicator” in the SR data consolidation template.

Installation and Setup Guide for the SR Management Tool— Version 2.0 August 15, 2017
129
Tab Module Activity Intervention Budget Target Coverage/output indicator
PERFORMANCE
FRAMEWORK/Performance
Framework
Y Y Y
PERFORMANCE FRAMEWORK
/Framework
Y Y Y
BUDGET ALIGNED/Detailed Budget Y Y Y Y
Information collectively found among the three tabs can thus be easily consolidated into
one file to facilitate creation of the SR’s annual plan, which the SR will use to populate the
SRMT. Using the blank SR data consolidation template shown below—a sample
completed template is also shown—create a customized SR data consolidation
template organized by Programmatic Indicator for each SR as follows:
The two tabs in the Performance Framework file—the tab Performance Framework
and the tab Framework—can be matched by the columns “Module” and
“Coverage/Output Indicators” as follows:
o The column heading “Module” appears in both tabs.
o The column heading “Coverage/Output Indicators” appears in both tabs
and is interchangeable with the column heading “Programmatic
Indicators” in the SR data consolidation template.
o Therefore, by matching the columns “Module” and “Coverage/Output
Indicators” in these two tabs, the SR data consolidation template can
be populated with information for “Programmatic Indicators,”
“Intervention” (from the Framework tab) and “Target” (from the
Performance Framework tab).
“Programmatic Indicators” should be entered in the blue lines in the
template.
Then the SR data consolidation template, now partially completed, can be
matched with the Detailed Budget tab by “Module” and “Programmatic
Indicator.”
o The “Activity” column can now be completed. Activities should be listed in
the blank lines following the blue lines for “Programmatic Indicators.”

Installation and Setup Guide for the SR Management Tool— Version 2.0 August 15, 2017
130
Additional lines can be inserted in the file as needed to accommodate all the
activities.
o The “Target” and “Budget” columns can be completed.
This process should be verified by the PR finance manager and M&E officer. This format
should be part of the PR-SR grant agreement and must be prepared for each SR.
STEP 3: SRS PREPARE THE SR ANNUAL PLAN 1.3.4.
The SR annual plan is derived from the PR’s SR data consolidation template. The
difference between the SR data consolidation template and the SR annual plan is
twofold: (1) the SR data consolidation template presents information quarterly and
may be done for a period of 4 to 12 quarters; (2) the SR’s annual plan presents information
monthly and is only done for four quarters at a time and is repeated for each year of the
grant.
The PR must approve the SR’s annual plan. Examples of an SR annual plan appear in the
two screenshots below—one is a blank template for an annual plan and one is a completed
annual plan.
Having completed the SR data consolidation template (or similar) in the previous step,
in most of the cases the SR and PR will be able to divide quarterly targets and budgets into
months, giving the opportunity to have “rapid alert diagnosis” for indicators where results
that may be getting behind targets.
GMS has provided the template SR annual plan in an annex to the SRMT. Once this
template is completed, the SR and PR have discussed it, and the PR has approved it, it will
serve as the data source for “Enter the annual planning data” (step 6, in section 5.7 of the
User Guide) during the SRMT setup process.
Remember that a separate SRMT must be prepared for each SR!

Installation and Setup Guide for the SR Management Tool— Version 2.0 August 15, 2017
131
SR Annual Plan
Setting monthly targets for activities
Monthly targets are required for the SRMT, but they are not included in the SR data
consolidation template. Therefore, it may be necessary to open the three Assumptions
tabs in the grant work plan and budget Excel template and closely examine the definitions
of the activities, in order to set monthly targets for these activities. For example, an activity
may be defined as “Train 50 CHWs in TB case finding,” but the assumptions page shows
that each training session is planned for 25 CHWs. This might mean that different SRs will
each carry out 1 session, or that 1 SR will carry out two sessions in different months. Some
detective work may be needed to clarify what the original planners intended
for each activity!
Another common situation for public sector grants is that counties or districts act as
pseudo-SRs. Targets may not have been set at their level. In this case, the PR or the MOH
M&E officers will need to break down the targets by smaller geographic units. This may be
done using population census data or through census data modified by known incidence or
prevalence data for different parts of the country (such as high and low endemic zones).

Installation and Setup Guide for the SR Management Tool— Version 2.0 August 15, 2017
132
These targets will need to be calculated on a separate spread sheet and the documentation
kept carefully as a supplement to the grant performance framework. The PR would then
communicate the targets to the counties or districts.
It may also be necessary to modify the timing of targets to better fit the more detailed
implementation schedule. For example, if the various inputs for opening voluntary
counseling-and-testing sites are not complete until quarter 4, the new site targets for
quarters 2 and 3 should be shifted and the timing of these results should be redefined.
Some openings might even have to be shifted to later months. Similarly, it may be that new
staff cannot really be hired until month 3 instead of month 1. These changes have
consequences for the timing of results, but also change the timing of expenditures: some
changes (like 10 months of salary rather than 12 months) may create savings that can be
reprogrammed.
Calculating the monthly budget per SR per Activity
The detailed grant budget will give the budget for each activity, with detailed cost
assumptions and cost category coding. If SR sub-agreements have already been made, the
activity budget will have been divided between the SRs implementing the activity; quarterly
activity budgets will have been set.
These quarterly activity budgets will need to be checked against the monthly scheduling and
the monthly targets. Not all expenditures match the timing of the activity:
100% of funds needed for procurement, especially a tender or international
procurement, usually must be available to the PR or SR before the tender or
procurement action can be launched. Disbursements must be linked to the timing of
tenders. Expenditures, on the other hand, usually take place when deliveries are
received: a single tender may result in multiple deliveries over a 1-2 year period.
100% of funds for storage and distribution of health products needs to be available
on an annual basis. However, the use of funds for storage and distribution will not
begin until the products arrive in country. Distribution may have a seasonal or
periodic schedule.
Recurrent monthly expenditures for salaries, payments to CHWs, overhead costs
and the like must be planned into periodic disbursements to avoid cash flow crises
or delays in payments.
Periodic disbursements to SSRs may also affect cash flow needs of the SRs.
Other funds for activities usually need to be available before work begins or in
tranches during the work.
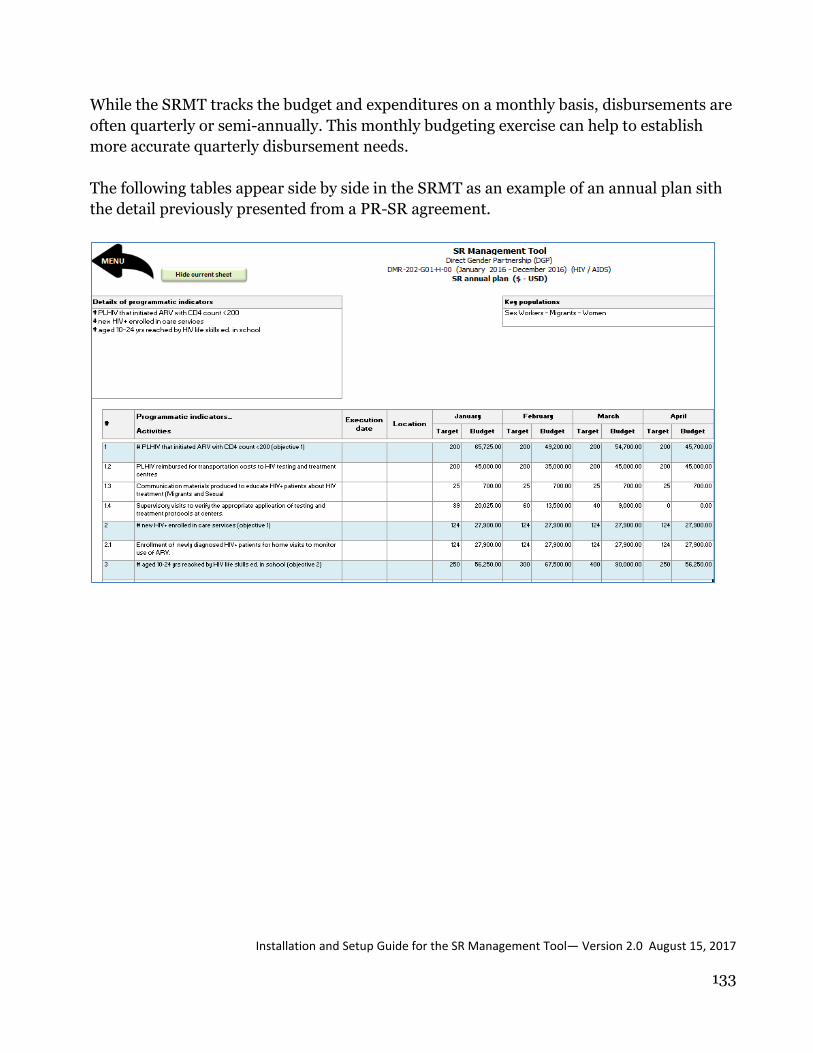
Installation and Setup Guide for the SR Management Tool— Version 2.0 August 15, 2017
133
While the SRMT tracks the budget and expenditures on a monthly basis, disbursements are
often quarterly or semi-annually. This monthly budgeting exercise can help to establish
more accurate quarterly disbursement needs.
The following tables appear side by side in the SRMT as an example of an annual plan sith
the detail previously presented from a PR-SR agreement.

Installation and Setup Guide for the SR Management Tool— Version 2.0 August 15, 2017
134
The monthly distribution process in some cases will only be useful for performance advance
purpose, because most indicators are to be collected quarterly, biannually or annually.
Based on a grant’s approved grant performance framework and the relevant signed
memorandum of understanding between the PR and each of its SRs, the PR prepares a
document detailing the agreement between the PR and the SR regarding programmatic
indicators and activities for each SR. These agreements state the quarterly programmatic
targets for the indicators and activities, as well as the financial budget for these activities.
STEP 4: CHECK THE ALIGNMENT OF EACH SR’S ANNUAL PLAN 1.3.5.
WITH THE FULL GRANT WORK PLAN AND BUDGET
The final step in annual planning is to verify that combining SR budgets with the PR
budget adds up to the approval annual budget defined in the grant agreement. If the SR
budgets have been constructed by carefully adjusting a copy of the detailed grant work plan
and budget, this verification is straightforward. The totals by SR and by module should be
the same. Using the Budget Summary tab in the grant work plan and budget file,
shown below the budget totals can easily be checked by “Module,” “Q” and “Year”;
totals by “Recipients” by “Q” and “Year” can also be checked.
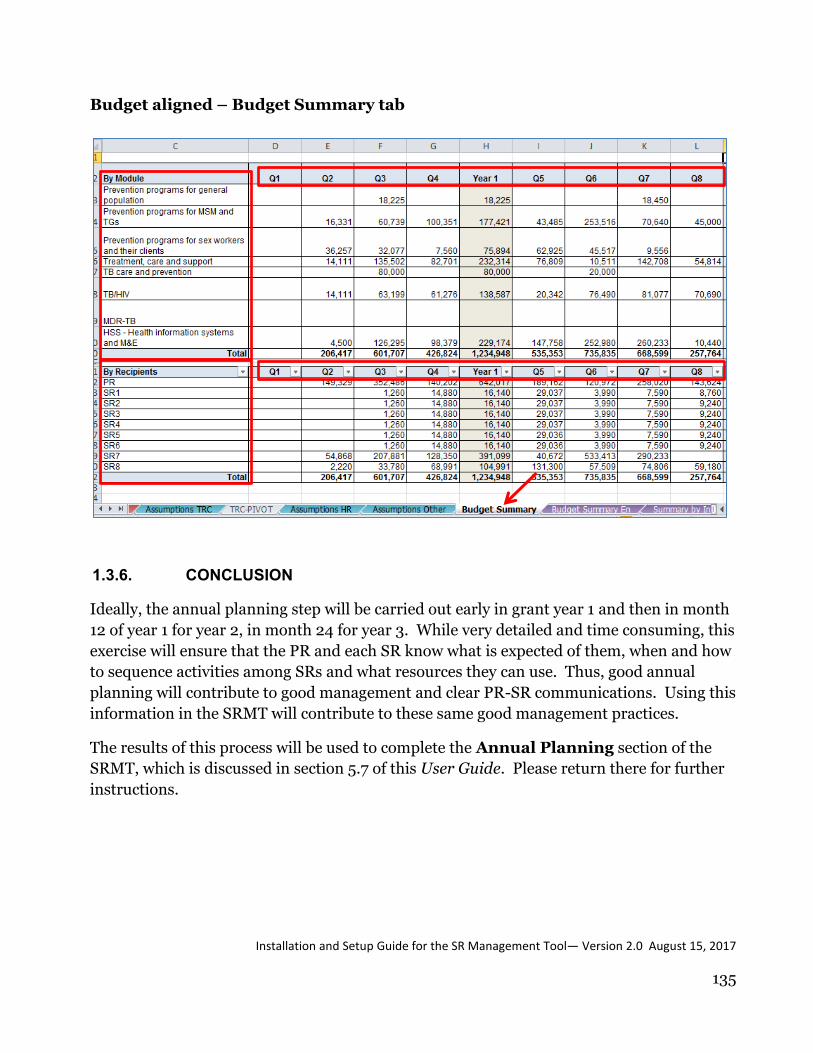
Installation and Setup Guide for the SR Management Tool— Version 2.0 August 15, 2017
135
Budget aligned – Budget Summary tab
CONCLUSION 1.3.6.
Ideally, the annual planning step will be carried out early in grant year 1 and then in month
12 of year 1 for year 2, in month 24 for year 3. While very detailed and time consuming, this
exercise will ensure that the PR and each SR know what is expected of them, when and how
to sequence activities among SRs and what resources they can use. Thus, good annual
planning will contribute to good management and clear PR-SR communications. Using this
information in the SRMT will contribute to these same good management practices.
The results of this process will be used to complete the Annual Planning section of the
SRMT, which is discussed in section 5.7 of this User Guide. Please return there for further
instructions.