installation and pump-testing of test wells and
TRANSCRIPT

s ~ (CQ(oq
ISlet\ V\~ _,
q Lf t DD~I'S

.:1· . . I
I I I I I I I I I I I I· I I I
E-1669 BLAINE -1
Golder Associates Inc. CONSULTING ENGINEERS
INSTALLATION AND PUMP-TESTING OF TEST WELLS AND RECOMMENDATIONS FOR FURTHER GROUND
WATER EXPLORATION
November 16,1990
BLAINE GROUND WATER MANAGEMENT AREA
DRAFT Prepared for the
City of Blaine, Washington
Funded In Part by the Washington State Department of Ecology
Through the Centennial Oean Water Fund
By Golder Associates Inc.
903-1060.303
GOLDER ASSOCIATES INC. • 4104 148TH AVENUE N.E., REDMOND (SEATTLE). WASHINGTON, U.S.A. 98052 • TEL (206) 683-0777 • FACSIMILE (206) 882·5498 • TELEX 5106002944
OFFICES IN UNITED STATES • CANADA • UNITED KINGDOM • SWEDEN • AUSTRALIA

I I I I I I I I I I I I I I I I I I I
November 16 1990
TABLE OF CONTENTS
1. INlRODUCTJON
2. FIELD WORK
2.1 Drilling and Well Installation 2.1.1 Test Well GWMP-1 2.1.2 Test Well GWMP-2 2.1.3 Test Well GWMP-3
2.2 Pump Tests 2.2.1 Test Well GWMP-1 2.2.2 Test Well GWMP-2 2.2.3 Test Well GWMP-3
2.3 Water Quality Sampling
3. RESULTS
3.1 Geology 3.1.1 Overview 3.1.2 Internretal
3.2
··A.N "4J~IIJ.fr!;;l!t41J*i
LIST OF FIGOR..Vi
2-1 Site Location 3-1 Pump-test Analysis: GWMP-2 3-2 Pump-test Analysis: GWMP-3
LIST OF APPENDICES
APPENDIX A APPENDIXB APPENDIX C
Well Logs Pump Test Data Water Quality Data
i
Golder Assoclatoa
903-1060.303
Page No.
1
2
2 2 3 3 4 4 4 4 5
6
6 6 6 7 7 8 8 9
10
11 11 12

II I I I I I· I I I I I I I I I I I I I
November 16 1990 1 903-1060.303
1. INTRODUCTION
This report summarizes the test well drilling and pump testing work COJnplleted to date, as part of the Blaine Ground Water Management Program (GWMP), recommendations to further explore for additional sources of Blame Ground Water Management Area (GWMA). The
within the this report was
Blaine Ground is to
carried out as part of the Data Collection and Analysis Plan Water Management Program. The overall purpose of the better understand the hydrogeology and availability of
The work outlined in the DCAP, includes the
•
•
•
•
•
•
Drilling and completion of three test
Test-pumping of each test well, and amuvs.JS res1wts to determine the hydraulic characteristics
Collection and analysis of · samples from each test well;
Collection and analysis of the GWMA;
on the Boundary Uplands area near the Blaine
incllud1es the drilling and pump-testing of the three test wells, ~ouna·-W<IteJ~·qtlaJJ.ty samples from these wells. Stream gages have
Creek and a stream draining from the Blaine Watershed . . ...... ·· be collected from the gaging stations for analysis. A precipitation
· ·· yet been installed in the Boundary Uplands region, and regional sampling has yet to be conducted.
This report presents an interim evaluation of the hydrogeologic conditions based on the three test wells, and presents recommendations for further hydrogeologic investigations to better define the ground water resources of the GWMA.
1 Blaine Ground Water Management Area- Data Collection and Analysis Plan, Prepared by Golder Associates, dilled November,1990.
' sole:.; Assuclates
\ \

I I I ·I I I ;I
I I I I I I I I I I I I
November 16. 1990 2 903-1060.303
2. FIELD WORK
2.1 Drilling and Well Installation
Three test wells (GWMP-1, GWMP-2, and GWMP-3) were Well Drilling of Bow, Washington under the observation of a hydrogeologist The boreholes were drilled at eight-inch diameftir using drill-drive methods to advance the eight-inch locations are shown on Figure 2-1.
Drill cuttings were collected every five feet, exceot water-bearing zones, where samples were co!leoted visually inspected and described, and then the san1ple
through potential drill cuttings were
arcrmrea for future reference.
Each well was completed with a type well screen, fitted with a mild-steel assembly was lowered into the uu•''"''u pulled back to expose the screen to the grain-size of the aquifer materials. Each ground water from the of 18 feet, and is eo1.riom each well are or1~senb
wire-wound telescoping packer. Each screen
· ••· and then the casing was . ··• · • •· ' ......... ·•··· were chosen based on the
. •· dev~loped by bailing and air lifting " seal of cement-bentonite to a depth
Borehole logs and completion details for
. ii':)i'!'" •• ;, ro:: .... bdw~ A"gm' Zl md Augm• "' tm W •
ground surface (bgs). Fine sand with a trace of silt was urr.ace to a depth of 64 feet Groundwater was encountered at a
60 feet. Air lift water flows were generally less than five gallons . . ... ..... .· .. ·. ...... zone. Silt with a trace of fine sand was encountered between · ··•• ). • was encountered at a depth of between 120 and 150 feet, and
· ·· · · ·fine sand with silt, and silt were encountered between 150 and 161 feet. Fine to coarse with silt and gravel was encountered between 161 and 188 feet Air lift water flows from this zone were estimated at between 10 and 20 gpm. Fine sand was encountered at 188 feet, which graded downward to sandy clay at a depth of 237 feet. Silty clay was encountered from 237 to 278 feet where the borehole was terminated.
The most productive water-bearing zone was encountered at a depth of between 161 and 188 feet bgs. The casing was cut at 195 feet bgs, and the bottom section of the casing was back-filled with bentonite and pea-gravel. Ten feet of 40-slot well screen was then installed at a depth of 176 to 186 feet, and the eight-inch casing was pulled back to expose the screen to the aquifer. The well was developed for approximately two hours, at which time, the water was slightly cloudy. The air lift water flow rate at the end of the two-hour development period was approximately 14 gpm.
r

I I I I I I I I I I I I I I I I
' I I
November 16, 1990 3 903-1060.303
2.1.2 Test Well GWMP-2
Test well GWMP-2 was drilled and completed between September 4 to a total depth of 303 feet bgs. Sand and gravel was em:ountered depth of 17 feel Silty clay and clayey silt were encountered Water-bearing fine to coarse sand and gravel was enc:ountereg lift water flows from this wne were approximately 33 gpm. 90 and 94 feet, and fine sand was encountered between and 101 encountered between 101 and 228 feet; silty fine sand 240 feet; and silty clay was encountered between terminated.
The casing was cut at 92 bentonite and pea feet bgs, and the aquifer. The well ...... . The air lift flow at the .·· ··
~m1Ve\1er, as the borehole was level dropped to water was probably thought to exist at a depth
at a depth of between 70 and 90 promising water-bearing
;.se•cti(m of casing was backfilled with . was installed between 83.5 and 88.5
cas·inv was pulled back to expose the screen to the water was clear by the end of development.
was approximately 60 gpm.
2.1.3
Test ·• y .. · > drilled and completed between September 10 and September 14, 1990 · · feet bgs. Silty clay was encountered from the surface to 23 feet bgs. were encountered between 23 and 35 feet bgs, and sand and gravel was . . ... . ... between 35 and 53 feet bgs. No water was encountered within this zone. Oayey · · · sand was encountered between 53 and 100 feel Water-bearing fine to medium sand was encountered at 100 feet bgs, which graded downward to sand and gravel at a depth of 145 feet. Sand and gravel was encountered between 145 and 161 feet bgs, and graded downward to fine sand with silt at a depth of 220 feel Air lift water flows ranged from 60 gpm to over 200 gpm while drilling through the sand and gravel encountered between 100 and 220 feet. Sandy silt and clayey silt were encountered between 220 and 247 feet bgs, and clay and gravel was encountered between 247 and 255 feet bgs. Waterbearing fine sand was encountered between 255 and 299 feet bgs, where the borehole was terminated. Air lift water flows from this zone were about 30 gpm.
The most productive water-bearing zone was found at a depth of between 143 to 163 feet bgs, although the full thickness of this aquifer extends from 100 feet to 220 feet bgs. A second potentially productive aquifer is also present at this location, extending from 255 feet
· Jolcler Associates

I I I I I i I I I I I I I I I I I I I
November 16. 1990 4 903-1060.303
to at least 299 feet (where the borehole was terminated). To complete the well, the casing was cut at 164 feet bgs and the bottom casing was back-filled with bentonite and pea gravel. Ten feet of 60-slot screen was installed between 148 and 158 feet bgs, and then the eight-inch casing was pulled back to expose the screen to the well developed quickly, and the water from the well was clear by end of air lift flow at the end of development was approximately 200 gpm.
2.2 Pump Tests
Test wells GWMP-2 and GWMP-3 were pump estimate the hydraulic properties of the water--Deiill from October 2 to October 8, 1990, by Hayes Associates hydrogeologist
2.2.1 Test Well GWMP-1
vv~o~~Y·-I was slug-tested to testing was carried out
and observed by a Golder
Test well GWMP-1 was slug tested on ••... U rapidly drawing the water level in the well down by 36 feet using a sulbmers recovery to within 95% of because of the poor air
2.2.2 Test Well
then measuring the water-level GWMP-1 was not pump tested
bb!;e!'lled during well development.
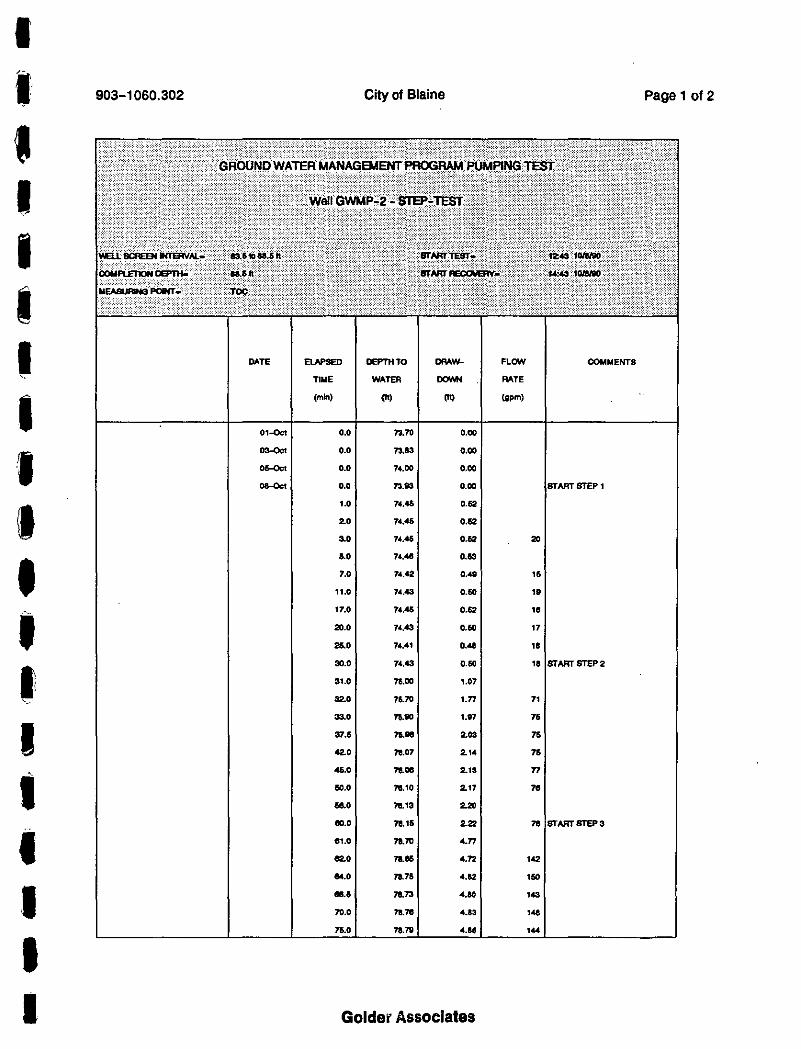
Test well GWMP-2 was ·· on October 8, 1990. The test consisted of four 30-minute steps at PIWJ~S!fi!les of 17 gpm, 75 gpm, 145 gpm, and 205 gpm. The
~~;~~~~:~,~)(~~f and water-level recovery was measured to within 99% of the
A 24-hoilii$£~t~n!nm~'test, at a rate of 149 gpm, was initiated on October 8, 1990. During the test, wat~}~~~ .. ;were also meas~d in a nearby domes~c well and in City of Blaine Well No.7. TRe;;grpund water levels m these wells were not influenced by the pump test. The maximum di'awdown in the pumping well at the end of the test was 6.75 feet
2.2.3 Test Well GWMP-3
Test well GWMP-3 was step-tested on October 4, 1990. The test consisted of five 30-minute steps at pumping rates of approximately 61 gpm, 150 gpm, 250 gpm, 350 gpm, and 375 gpm. The pump was turned off after the fifth step and the water-level recovery was measured to within 96% of the original static water leveL
A 24-hour constant-rate test, at a rate of 490 gpm, was initiated on October 4, 1990. Mter 720 minutes of pumping, the flow rate was cut back to 396 gpm because the water level in
Golder Assvclait.a

I I I I I I I I I I I I I I I I I I I
November 16 1990 5 903-1060.303
the well was approaching the pump intake. The pumping rate was maintained at 396 gpm for the remainder of the test. The drawdown in the well at the end of the test was 44.77 feet.
2.3 Water Quality Sampling
Ground water samples were collected from all test wells for collected and preserved according to the technical Project Plan. The samples were submitted to ""'"'Vl'c
:~:::pie from GWMP-1 was collected foUlowin<' ui } >by pumping the well at a steady rate of about 7 gpm for thirty minutes. · f.. sampling the physical parameters of the water were measured as follows: · · · 54"F, specific conductance 210j.~S/cm, and pH 8.4.
Two ground water samples were after one hour of pumping, and the was submitted for analysis. At the time water from GWMP-2 were and pH 7.65. Ground specific conductance
GWMP-2 and GWMP-3; the first the test. Only the second sample
physical parameters of the ground SO"F, conductance 180 j.~S/cm
''m•easurt~d as follows: temperature 52"F,
Golder Associates

I I I I I I I I I I I I I I I I I I I
November 16. 1990 6 903-1060.303
3. RESULTS
3.1 Geology
3.1.1 Overview
The geology of the GWMA consists of of and Pre-Fraser glacial and non-glacial sediments. about glacial and non-glacial sediments in the vicinity of the ··•··. . Glaciation consisted of the Vashon and Sumas Stades, two major · · •... ···· which were separated by a period of glacial retreat, named the Everson · The Vashon deposits consist of a sand and gravel unit of fluvial origin, named the Sand, and a till unit consisting of unsorted gravel, sand, and clay, .. ......... Drift As the Vashon Stade glaciers retreated, the area .. : · . . . . by the sea, Everson lnterstade sediments were deposited, which consisted of · drift, the Deming sand and the Bellingham glaciomarine drift interbedded fossiliferous stony clays, stony silt, till-like mixtures, and gravel, fluvial and lacustrine clay, silt, sand, gravel, and peat. stages of the last glacial period, a small glacial re-advance outwash in the Sumas region"'.
3.1.2
has refined our understanding of the geology within the in the boreholes differed substantially, indicating the
the GWMA. Identification of the geologic materials has . . preliminary stratigraphic correlations, and to refine our conceptual
···•· GWMA. Geologic cross-sections, and a more detailed discussion of will be presented in the area characterization report.
enC,[)Uiltter•~d fine-grained materials thought to be Bellingham Drift, from of approximately 150 feet. 1his material consisted of fine sand with
occasional gravel, sand with silt, silt, and clayey silt. Fine to coarse sand with gravel, which is thought to be Deming Sand, was encountered between 150 and approximately 190 feet. Fine sand, grading to sandy clay, and silty clay, thought to be Kulshan Drift, was encountered between 190 and 278 feet where the borehole was terminated.
2 Easterbrook, D. J, (1976). Geologic Mllp of Western Whatrom County, USGS Miscellaneous Investigations Series Mllp 1-854-B, Scale 1:62,500.
3 Armstrong, ].F., Crandell, D.R. Easterbrook, D.]., and Noble, J.B., 1965. Late Pleistocene Stratigraphy and Chronology on Southwestern British Columbilz and Northwestern Washington. Geological Society of Ameriaz Bulletin, Volume 76, p. 321-330.
Golder Associates

I I I I I I I I I I I I I I I I I I I
November 16. 1990 7 903-1060.303
Borehole GWMP-2 encountered sandy clay and gravel, and fine to coarse sand, believed to be Recent colluvium and Sumas glacial deposits, from the surface to a depth of 17 feet Silty clay and clayey silt, thought to be Bellingham Drift, was encountered between 17 and 55 feet Sand and gravel, and peat, thought to be Deming Sand encountered between 55 and 100 feet Silty-clay, thought to be Kulshan Drift, from 100 to 303 feet where the borehole was terminated.
Borehole GWMP-3 encountered silty clay, clay and gravel, recent colluvium and Sumas glacial deposits, from the swfac:e fine sand with occasional gravel, thought to be to 100 feet Sand and gravel, thought to be Dellllin and 220 feet Silty sand and clayey silt, thought between 220 and 255 feet Fine sand with fluvial deposits were encountered from 255 to 299
3.2 Hydrogeology
th~•uglil.t to be Oayey
from 53 betv,een 100
One potentially productive aquifer GWMP-2, and two potentially productive aquifers were ............... GWMP-3. The aquifer encountered in GWMP-2 . . of : and occurs at a depth of between 70 and 90 feet The boreho T · was encountered at a depth of between 100 and · with some graveL Test well GWMP-3 was installed within and deeper aquifer was encountered at a depth of between 255 and was terminated), and consists of fine sand. The full thickness of is unknown.
3.2..4li~~~t~~~~~~ysis The"PY!Pihtests w~~yzed using an analytical well hydraulics program. This program is capa~9!wc9!.i\9!'Bting complex aquifer conditions much better than conventional curve-maf.$Q~\$fraight-line pump test interpretation methods. Results of the slug-test conducted in'''ltiiR GWMP-1 were analyzed using the methods of Hvorslev• and Papadapolous ~t al'.
The well hydraulics program is used to simulate the drawdown and recovery of a well based on a set of user specified hydraulic parameters (transmissivity, storativity, well loss coefficient, etc.). The parameters are manually adjusted until the simulated drawdown and recovery closely matches the observed drawdown and recovery data. The well hydraulics
' Hvorslev, M.]., 1951. Time lAg and S011 Permeability in Groundwater Observations. U.S. Army Corps of Engineers Waterways Exp. Sta. Bull. 36, Vickburg, Miss.
5 Papadapolous, 1.5., ].D. Bredehoeft and H.H. Cooper, 1973. On the Analysis of Slug Test Data, Water Resources Res., Vol. 9, PP. 1087-1089.
Golder Associates

I I I I I I I I I I I I I I I I I I I
November 16. 1990 8 903-1060.303
program is capable of incorporating complex aquifer conditions such as boundaries and also well performance parameters (such as well loss constant and borehole skin effects). However, as with conventional analysis methods, storativity cannot determined based only on the drawdown and recovery from the pumping well. storativity values based on our knowledge of the hydrogeologic conditions.
3.2.1.1 GWMP-1
The slug test indicates that the hydraulic conductivity low, between 1.5 and 3.0 ft/day. This translates into ft'/day for the saturated thickness of 40 feet This producing large enough quantities of l!l"CJunidw•atE
3.2.1.2 GWM?-2
relatively i&miissi,nty of 60 and 120
location, is not capable of lw1h1~r investigation.
Analysis of the pump test of test well aquifer is very permeable with an estimated transmissivity of ( > . have that the aquifer is unconfined to slightly confined, · .·· .. · ·· · .·· • : level is below the top of the aquifer. Thus, we assumed a · typical of unconfined to slightly confined aquifers. Our analysis is limited laterally by possibly two low-permeability orientation of these boundaries cannot be determined without that the storativity of the aquifer is 0.01, the boundaries located within 400 feet of the well. This model is consistent deposited within a channel cut into less permeable material. and simulated drawdown and recovery data (based on the is shown in Figure 3-1.
Our analy~ji~M#ffltes that . . .. well is relatively inefficient at the pumping rate of 149 gpm. O.ti~¢!dfl!w(!Qwn in the well of 6.75 feet at the end of the test, only about 2.5 to 3.0 feet 'lfll$i\,i\1e to "ifll~r drawdown. The additional drawdown was the result of well losses due ffi~!,!lent flawi.9J water into the well, and possibly non-laminar flow within the aquife;'~f\~jljateiy\~!Jiside the well screen. The test well is about 40% efficient at the
tested pwii~}:~~~jJP! 149 gpm.
The estimated distance from the test well to the low-permeability boundaries is very sensitive to the value of storativity used in our simulations. Storativity cannot be accurately determined from the drawdown and recovery data from the pumping well alone, and water-level data from additional monitoring wells are required. The boundaries could be as close as 50 to 100 feet from the test well if a lower storativity is assumed.
Although the aquifer is very permeable, the saturated thickness of the aquifer at the time of testing was only about 20 feet. Thus, the available drawdown in the test well or any future wells is limited to 10 feet or less. The limited drawdown correspondingly limits the pumping rate of any future production wells installed in this aquifer. Assumiing a maximum drawdown of 10 feet, we believe that an efficient production well could yield approximately 200 gpm on a short-term basis {i.e., one to three months).
Golder Associates

I I I I I I I I I I I I I I I I I I I
November 16 1990 9 903-1060.303
The potential long-term yield of this aquifer is dependent on the extent of the aquifer and the long-term recharge to the aquifer. The 24-hour test did not show any evidence of recharge from leakage. The aquifer is, however, likely recharged by precipitation in the winter months and possibly leakage from adjacent sediments. A estimate of the potential long-term yield of the aquifer and hence long-term rate from any future production wells would require the following:
• Long-term monitoring of water levels to identify fluctuations. ·
• Installation of an additional monibJrir1g longer pump-test (three to seven
The longer pump test would provide a better estima1 distant low-permeability or recharge boundaries that behavior.
3.2.1.3 GWMP-3
to the test well and a
rativi1tv and could identify more 1ue1~ce long-term aquifer
Analysis of the pump test of GWMP-3 shallow aquifer at this location is moderately permeable, ... estimated ..... . of 4,000 ff/day. We assumed that the aquifer is confined ' '\ the static water level was about 15 feet above the of that during pumping the water-level in the aquifer may not more than 15 feet during the pump test. We assumed a typical of confined to semi-confined aquifers. Our analysis using indicates that the aquifer may be limited laterally by two Based on the assumed storativity value, the boundarie~d!PP!i!flO be 2,000 feet on either side of the well, and are thought,,~R'§§il!iM'!!~I to The exact location and orientation of these boundif~;'how~«fi~annot determined without additional observation wells. A comp~pp,,of the &~irved and simulated drawdown and recovery data (based on the interpret~4,~Wfer~ffllltions) is shown in Figure 3-2.
'·:~%4f~:II~ft~~=tr~ri~JfJr As discussed ihli?il#fion 3~1.2, the estimated distance from the well to the low-permeability boundaries is v~Ff sensitive to the valuE! of storativity used in our simulations. Storativity cannot be accurately determined from the drawdown arid recovery data from the pumping well alone. For example, if this aquifer behaved more as an unconfined aquifer rather than a confined aquifer, with a storativity of O.Dl5, the distance to the low-permeability boundaries, would be reduced to within 250 feet of the well. Accurate determination of storativity and, subsequently, the location of the boundaries is important with regard to the placement of possible future production wells within the aquifer.
Our analysis indicates that the test well is relatively efficient at the tested pumping rate. Of the drawdown in the well of 44 feet at the end of the test, approximately 30 feet appears to be due to aquifer drawdown. The additional drawdown was the combined result of partial penetration of the aquifer by the well and well losses due to turbulent flow of water into
Golder Associates

I I I I I I I I I I I I I I I I I I I
November 16.1990 10 903-1060.303
the well, and possibly non-laminar flow within the aquifer immediately outside the well screen. The test well is estimated to be about 70% efficient at the tested pumping rate ..
Based on our present understanding of this aquifer, the maximum (one to three months), for a 100% efficient well, is expected to assuming an allowable drawdown in the well of 40 feet The
short-term yield 350 to 450 gpm,
1on~~-term yield of leakage from
months. 250gpm.
of recharge.
the aquifer is dependent on the amount of recharge to the adjacent or underlying sediments or from infiltration of We have made a preliminary estimate for long-term However, the actual yield of the aquifer is dejpellideJnj
and hence the potential further ground water level
and a longer pump-test
A better estimate of the potential long-term pumping rate(s) of individual production monitorillg, the installation of an additional mn1nitnl
The pump test is required to determine the presence . . . . . .. . low-permeability or recharge boundaries/leakage, and to a better · ·• aquifer storativity.
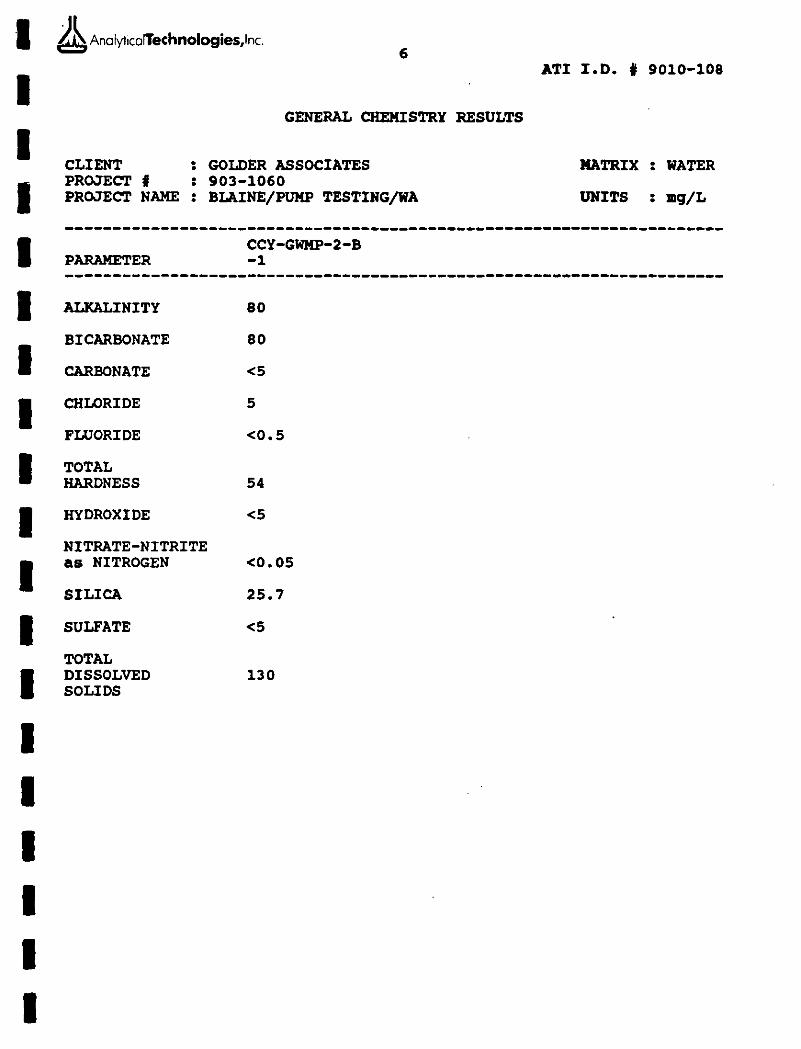
:y:a::rth~u::d .·· •····•·· i ~~:::e test wells indicates that the quality of the ground water is . . > · • •.• meets the primary and secondary drinking water standards for · · · · · except for manganese and iron. Manganese concentrations ' standard of 0.05 mg!L in the samples collected from all three wells in GWMP-1, GWMP-2, and GWMP-3, respectively). Iron the secondary standard of 0.3 mg!L in the sample collected from . . . .... .... (0.48 mg!L). Similar iron and manganese concentJ;ilJ!S;~:!'!!!; present · • ·•• •·•·· •· ground water being pumped from some of the City produ£1:W.ijYwe~!il!tese concentrations have been low enough such that no adverse CO~l§!i$H!hces h'i\t~\f!tsulted. Water quality data are presented in Appmdix C.
v
· . Golder Associates

I I I I I I I I I I I I I I I I I I I
November 16 1990 11
4. SUMMARY AND RECOMMENDATIONS
4.1 SUlJUllaiY
The installation and pump testing of the three test wells has productive aquifers capable of supplying ground water in
903-1060.303
moderately
· · · · ·• ·• • ... for municipal supply purposes. One of the aquifers was encountered in bo1reliole ····· · · the other
two were encountered in borehole GWMP-3.
The aquifer encountered in well GWMP-2 at a sand and gravel. This aquifer is very permeable,
55 and 90 feet consists of ·. · • ··are limited because of the
available drawdown (about 10 feet), and the ·.•··. aquifer. The long-term aquifer extent and
between 100 and 200 gpm aquifer yield is unknown at this time until additional ·. recharge are collected. We estimate that short-term are possible from this aquifer.
The shallow aquifer encountered in consists mostly of sand and gravel. capable of yielding between 350 and 450
of between 100 and 220 feet ·r~tPiv permeable, and appears to be
orclDE:rlv installed well on a short-term basis. The aquifer aoiDears yield of the shallow from either leakage precipitation. The .... estimated at between ·· feet. This estimate underlying sediments.
·!·.· .·.
. • boundaries. The long-term deJ'entdei · · the extent of the aquifer and recharge
surrounding the aquifer, or from infiltration of of an efficient production well is presently
on a maximum allowable drawdown of 65 amllif•.r is not receiving leakage from overlying or would be possible if recharge occurs.
The in well GWMP-3 at a depth of between 255 and at least 299 feet The thickness of this aquifer is unknown because the borehole
~enetr<ltin,g the full thickness of the aquifer. This aquifer has not re~•re!;ents a promising prospect for future ground water
aquifer is somewhat finer grained than the overlying shallow capable of yielding several hundred gallons a minute of groundwater
to a properly insltallc~d well. The greater depth of the aquifer offers the advantage of a potentially greater available drawdown for pumping. In addition, the aquifer may have a greater lateral extent than the overlying aquifer, and may be receiving recharge from adjacent aquifers, which would reduce the long-term drawdown and increase long-term yield.
The estimated aquifer parameters determined from the pump tests of test wells GWMP-2 and GWMP-3 are based on the analysis of a single pumping well without benefit of adjacent observation wells. Thus, the storativity of the aquifers is uncertain. The extent of the aquifers is also uncertain because no observation wells were available during the tests. Aquifer extent controls the amount of recharge which is able to enter the aquifer (i.e., potential long-term yield), and also governs the location(s) of additional production wells.

I I I I I I I I I I I I I I I I I I I
November 16 1990 12 903-1060.303
4.2 Recommendations
Based on the work carried out to date, we have developed the (in order of priority) to pursue further evaluation of the ground vicinity of the Blaine Watershed.
·sources in the
1) Objective: Evaluate Ground Water Supply Potential at
2)
3)
GWMP-3 Site
Approach: A test/production well should be deep aquifer adjacent to well GWMP-3. The well . : •. , • .. , . for a period of between three and seven days to · •••• •• · ·· · properties of the aquifer and to identify potential ········. We recommend that this well should be completed as , . . . diameter casing should be installed using ,.·... · · ··········,depth of between 300 and 400 feet. The well L : .··· and completed with eight-inch diameter ·.······•.··.··.······ .··.. . well screen of appropriate ·.·•• ..... · .. ·.· < < diameter piezometer should then be installed · .. ·········' .. ··· .· ·aquifer, to allow for additional
'····· •••. within this aquifer.
Objective: stiltllo·w Aquifer at GWMP-3 Site
Approach: be pump tested for three to seven days, while respmCISe in both the well and in the piezometer installed
.. ····· . . of the proposed new well. Monitoring of ... sH!iFDJ)le re<om,.· < in the piezometer will permit a better
Q¥41~~Ef.~Erf~tf -~~W?Ji~i~IW'.
Objectivei''"Evaluate the Ground Water Supply Potential East of the Blaine Watershed.
Approach: Two or three additional exploratory wells should be drilled at the locations shown on Figure 2-1. Following drilling, each well should be pump tested to determine whether the water-bearing materials are suitable for development as a municipal supply. We estimate that each well could be between 300 and 400 feet deep.
We recommend exploring the area east of the Blaine Watershed, because this is an area where few deep wells have previously been drilled, and where we believe there is a good possibility of
. .; . ,._. · Golder AsQoclates

I I I I I I I I I I I I I I I I I I I
November 16, 1990 13 903-1060.303
encountering similar sediments to those encountered by the Watershed wells and by the GWMP-3 test well. The southwestern comer of the Blaine Watershed may also offer a promising location for exploration, if the deep aquifer in the of GWMP-3 appears to be extensive and worth municipal purposes.
Goli.;er A;,;:sl.'Ciates

I I I I I ~
t::
I Cil "'
I I I I I I I I I I I I I

I I I I I FIGURES
I I I I I I I I I I I I I I Golder Ass>~clatas

I I I I I I ,
,
I , .
'· ·'·
I · . . ·: ·. ·-:
._:_.MU:~/
-.- --..... /
\
I I I I I I I I 18
,
I I I PROJECT NO 903·1060-303 DWG NO 23555 DATE 11/2/90 DRAWN HP
5 '·,·
;!122 8 ~~13 -------- ----o ------
·-----.~58
. ·-. ·r. •
, D I •
Blame· :cern
I
:....._..·
~.d.=o=: .. ;-~
I -~-
'··
; 1--
i " , I '---1
'
I
_ --~-=-• _'!f?AD ~: BN 454-~ ·'
Explanation:
GWMP-1 $ $
0
/
2
_ _j __ J..
Location of newly instaDed test weDs
Possible location of additional test weDs
1/2
Miles
I I
1 /
I ~ ,,
I /o
' J
' ·, --
( '
' ;:' ~
~---
I -~----,..----
.. L~-
FIGURE 2-1 SITE LOCATION
BLAINE/GWMP /WA
Golder Associates

-------------------
0
-1
g -2
c -3 3::: 0 'C -4 ~ .... c -5
-6
-7 1
• 1103-1080
T- 14,000ftA2/d s- 0.01
Wei Ellldency Conltant • 1.4 X 10 A ... 11/gpm A 2 Porallat mflow boundaries loca1od
400 111rom pumping wan
10 100 Elapsed Time (min)
1000
+ Observed Data - WHIP Simulation
10000
AGURE 3•1 PUMP-TEST ANALYSIS: GWMP-2
BIAINEIGEOPHYS REPORTIWA
Golder Associates

-------------------
or----------------------;~~~~ No Boundory _.,.; t
-10-
E' - -20-c
~ -30·
~ c
-50·
T- 4,000 II A 2/d S = 2.0x 10"'~
Wei Elllcleney Constslt = 5.5 X I OA -5 11/gpm .. 2 Parallel noftow boundartetllocaled
2,000 II lrom pumping -
! 'IWII Boundarlal
-60~-+1--"T-" ,..,,,.,...,,rn.rr.T1f ._.-0-..,,,-,--,-r.r •• rr.
1T ••
0 ... 0--.--.~ .T.-,T"T'"M'irro..-
0-0-.--....-.... ......... , 1M0~000
Elapsed Time (min)
+ Observed Data - WHIP Simulation
PROJECT NO. 103-1080..303 DRAWING NO. 2017 DAlE tt/13180 DRA'NNBV C9
RGURE 3-2 PUMP-TEST ANALYSIS: GWMP-3
BLAINEJGEOPHYS REPORTIWA
Golder Associates

I I I I I I I I I I I I I I I I I I I

l .· r
·' l . ·' . ! .I APPENDIX A
WELL LOGS
]
·a
I I I I I I I I I I I I Golder Assocla1~Js

1, I I I I I I I I I I I -~
I I I I I I I
0
10 -
20 -
--
.... "'
30 -"' -u_
.!: --.s:: .....
0- -"' 0 40 -
----
50 -----
60 --
STRATIGRAPHY
Sond end grovel fill
5.0 Dark ,-.Jicwiah-brown, fiM SAND. trace 8ftt. trace gravel
Woter encountered •omewhere between 45 end 60 feet
~ .. ·.y .=:'':: "'
::•:
"'
"'
' '
~.:.::· :: :: "' "'
.::··.:· "'
<10 160
-roli;_g;;y:SILT, .;;ce fl,_;-110-;:;d - - ---
70 -WEU. COMPLEllON LEGEND: Dato' 1/TI fe0-8~1/eO
~ Ground Devotion: -
Bentonite Crout 0 r Steel Coaing T.O.C. Dwation:-Drlll Rig' Spood star
mi Bentonite Chip• Drill WethDd: J1k ~
r!!i!!J I 8-in., telescopic
Peo Gravel .toinlea .t.el wellscreen
2 Woter Level NOT TO SCAlE
;>rWJECT NO 803-1060.303 DWG NO 3434J DATE 1 1/1/90 DRAWN JSS APPROVED _
WELL COMPLETION
+J.O-
18.0-
Locking .. n cap
r- 12-ln.
-·~
FIGUREA-1 SHEET 1 OF 4
GWMP-1 RECORD OF
BOREHOLE BLAINE/GWMP /WA

I STRATIGRAPHY WELL COMPLETION
~~ b I l h I
70
I 80
I oleel
I 90
I I ~ 100 ., .,
u...
I .£ .t= ..... a. .,
I 0 110
I 120 ---------
I olive-groy, fine SAND, troce fine
I 130.6 130 sz
10/2/90
I I 140
I FIGUREA-1
I SHEET 2 OF 4
GWMP-1 RECORD OF
I L,. BOREHOLE BLAINE/GWMP /WA
PROJECl ;;::: 9CJ-1060.303 OWG NO 34344 OAT< 11/1/90 DRAWN JSS APPROVED _
I

I I I I I I I I I I I I I I I I I I I
~
Q) Q)
u... .!::;
.s:: ~
0. Q)
0
140
150
160
170
180
190
200
STRATIGRAPHY
•ill
145: Crodee to ltttie alit
....,........~j;;"-9~:- - - -------1 SilT, 80rM fine ~~and
1 ss, Cradu to CLAYEY SILT, ITaco fino to coo,.. .and
Grod" to troce silt
Qrodes to gravelly fine to coarn -and
Grades coor.er
195: 6-ln. layer Df grovel/y .and
210 210' Clay content ln.,.._
PROJECT NO 903-·101m:Jo:. OWG NO .)4345 OATE 11/1/90 DRAWN JSS APPROVED -
WELL COMPLETION
176'.2-
186'.5-188.0-
111ao-
1!15.0-
B-In . .tul casing
B-In. t•l .. coplc 40-alot l'toinlen l'teel well .cr.en
FIGURE A-1 SHEET 3 OF 4
GWMP-1 RECORD OF
BOREHOLE BLAINE/GWMP /WA

I I I I I I I I I I I I I I I I I I I
..., Q) Q)
u... £ ~ ..., a. Q)
0
220
230
240
250
260
270
280
STRATIGRAPHY
'""'"
-----------Olive-gray, SILTY CLAY, rttt!e fine to coarse sand, little 9rovel
PROJECT NO 903-1060.303 DWC NO 3-43.~-:;. DATE 11/1/90 DRAWN JSS APPROVED _
WELL COMPLETION
278.0-
FIGUREA-1 SHEET 4 OF 4
GWMP-1 RECORD OF
BOREHOLE BLAINE/GWMP /WA

I I I I I I I I I I I I I I I I I I I
.... "' "' f.._
.f
.r::: .... c. "' 0
YraL
~ liD ITB :sz.
STRATIGRAPHY
0
------ ------!:>'"! )'ellowl.t~-btown, f"me to coo,... SAND. grovel, trace ailt 10
20 trace eand ond
30
40
50
60
70
COt.tPL£110N LEGEND: Date' 1/4/80-1/10/WO Ground D....ation: -
Bentonite Grout 0 rr Slool Ccoln• T.O.C. Elevation: -Drill Rlg' Speed Star
Bentonite Chips Drm Welhod' Nt mary I 8-ln., telescopic Peo Gravel stainle11 etul
wellscroen
Water Level NOT TO SCALE
PROJECT NO 90.3-1050.30.3 OWG NO l4333 DATE 11/1/90 r>~~W~~ .ISS APPftOVEO _
WELL COMPLETION
18.0-
Locking .. u cop
12-ln. ftMI casing
8-ln. stHI caaing
FIGUREA-2 SHEET 1 OF 5
GWMP-2 RECORD OF
BOREHOLE BL'.INE/GWMP /WA

I I I I I I I I I I I I I I I I I I I
STRATIGRAPHY
120
130
140
PROJECT NO POJ-1060.303 OWG NO 343J.4. DATE 11/1/IKI DAAWN .J.:;S ""t"~~··.:O -
WELL COllPLETION
FIGURE A-2 SHEET 2 OF 5
GWMP-2 RECORD OF
BOREHOLE BLAINE/GWMP /WA

1. I I I I I I I I I I I I I I I I I I
STRATIGRAPHY
140 Orwe-;roy, finn, SILTY' CLAY
"
.
150 -.
160 -. .
~ 170 Q) -Q)
L...
.!:':
.I::; .... 0. Q)
0 180 -
190 -
200 -
210 - • •
PROJECT NO 903-1060.303 OWG NO 34335 DAlE 11/1/90 DAAWN JSS APPROVED -
WELL COMPLETION
~~~ Po~~
~~~ •.til "'6~cl ~~· ~~ ~~ ~;,~ "'6~;< ~~· •.q ~~c o.q ~~~~ )~0 ,_. oO. ~~~ ~foe •.til "'6~cl qf6• ··~ .til~· ~'[6 ~~~ ~.<6 ~~~ •.til .<6 ~cl ~~· .~~ ~'[6 ·~~ ~~~ .<6~~ ~fo· ·~ ~~ .. ~~· ~~ ~~·
- B-In. S'\eel eosin;
FIGURE A-2 SHEET 3 OF 5
GWMP-2 RECORD OF
BOREHOLE BLAINE/GWMP /WA

I I I I I I I I I I I I I I I I I I I
.£
.r; ~
0. .,
220
2JO
240
0 250
260
270
280
STRATIGRAPHY
ro,~;~..;;;;,.:-~ th;" SN.o - - - - -
272 to 274: UtUe gravel
PROJECT NO 903-1060.303 DWG NO 34336 lli.TE 11/1/90 DRAWN JSS APPROVED --
WELL COMPLETION
r:: d><. ··..-- S-in. .t .. r eating
FIGURE A-2 SHEET 4 OF 5
GWMP-2 RECORD OF
BOREHOLE BLAINE/GWMP /WA

I I I I I I I I .I I I I I I I I I I I
STRATIGRAPHY
300
..- 310 Q) Q)
L....
£ .r: ..-c. Q)
0 320
330
340
350
PROJE:CT NO 903-1060.303 DWG NO 3-4337 DATE 10/29/90 DRAWN JSS APPROVED _
WELL COMPLETION
JOO.O-
JO.J.O-
FIGURE A-2 SHEET 5 OF 5
GWMP-2 RECORD OF
BOREHOLE BLAINE/GWMP /WA

I I I I I I I I I I I I I I I I I I I
..... Cl> Cl> u...
0
10
20
30
STRATIGRAPHY
t-11>. G_, loyw 10: Cruda to SILTY CLAY, ltttte fine to C:OorM .and. tnlce f'tM grovel
E .c .....
----------,--.. _cc:;: fine GRAVEL. trace coo'" grovel,
c. Cl>
Cl 40
50
60
70
ailt ond cloy
l\£LL COMPLETION lEGEND:
~ a.ntonft. Grout 0 8" stool Came II Bentonite Chip•
~ P.a Grovel ~ 8-ln., t.Jucopic
stainlen ateel wallscre•n
.2 Wator Lovol NOT TO 5CAI..E
Dot., 1/10/10-e/14/10 Ground e.vot~on: -T.O.C. Elewoation: -Orlll Rig' Spood Star Drill Nelhod' Nr mary
PROJECT NO 903-1080.303 DWQ NO 3<1338 DAn: 11/1/10 DRAWN JSS APPROVED -
WELL COMPLETION
+J.T-
18.0-
l.ocldn; well ccp
12-ln. bcnholo
8-ln . .teel ~lng
FIGUREA-3 SHEET 1 OF 5
GWMP-3 RECORD OF
BOREHOLE BLAINE/GWMP /WA

I I I I I I I I I I I I I I I I I I I
STRATIGRAPHY
70 Olive-grey, clayey, fine SAND, acme fme
- grovel, trace m.dium to coorae aond
--
80 80.0 onve-var. clayey, fine SAND, .orne fiM to coorae grovel. trace medium to coarn eand
---
90 --
~-
r2. ~ ~:~·
~ 1 ~ ~-:~ -~ ~' - ~( • - ·:ti:
-.... 100 - rolive-~y:fln';""t~;d"iu;-SAND,-;,;;;; -Q) Q) - coarse SAND, rrtue grovel, troce ailt
L.... (woter-betOring)
~-li .. .. .. .. .. ..
£ - .. .. .. -.s:; .. .... .. ' -a. .. Q)
Cl 110 -..
....... : .. .. ' - ..
- .. ,. .. - .. eo 200
-~r~u"to fin.to Coo;;. grovelly:fin;to-coarse SAND
120 -~-·
~::-:! ~ .. -.. }1:ic -
-9:.:
~~ '."9: - ."0'.:
- :qj
130 - ·-~ :.1>-' - '6:·
:._:
- • . ..
----::.-----------Dark yellowi•h-brown, ~d .. finer to - fine to medium SAND, '- coo,... .and,
lltUe grovel, trace ant
·::"!. .... ·.} _::·
140 - • •
PROJECT NO 903-1060.303 DWG NO 34339 DATE 11/1/80 DRAWN JSS APPROVED _
WEU. COMPLETION
84.95 sz
10/4/90
•
'-- 8-in. .teel eating
FIGURE A-3 SHEET 2 OF 5
GWMP-3 RECORD OF
BOREHOLE BLAINE/GWMP /WA

.,
' I I I I I I I I I I I I I I I I
STRATIGRAPHY
140
145: Crodu coor.r to S\ND ~ GRAVEl.
' .
150
110
160
-----------Olive-groy, fin. to medium SAND • .ome coors• •and, aome fine vrovet
- 170 Cl> Cl> u..
£ .<: -0.
Cl> 0 180
m;diu;;;-sANo:-~ ~.;; ;;"ncr:-silt
----------to fine to m.clium SAND, ailt
190
200
210
PROJECT NO 1103-1060.303 OWG NO 34340 Dlo.TE 11/1/110 DRAWN JSS APPROVED -
WELL COMPLETION
1<18.0-
158.2-
16/.J-
16-1.0-
169.0-
171.0-
8-ln. 8\MI cooing
-·1(' pocbr
e-ln. Wucoplc 80-slot l'taiNta ---TaD plpo
Cut Cat:ing
a ln . .t..r coalnv
FIGUREA-3 SHEET 3 OF 5
GWMP-3 RECORD OF
BOREHOLE BLAINE/GWMP /WA

I I I I I I I I I I I I I I 1 II
' I
' i I \
I
..., Q) Q)
l.L.
.s
.s:: ..., a. Q)
0
220
230
240
250
260
270
280
STRATIGRAPHY
... .. .
... .. .
.. ------------Grades to fine, sondy SILT
------------Grades to ClAYEY SILT, trace fine sond
240.0 Olive-gray, ClAYEY SILT. trace fine sand
-----------Olive-gray, ClAY and fine GRAVEL
Olive-gray:-ClAY------
Olive-gray :fin;-SANO,Iittl~ailt (wote;=-~ng)
-----------Grades to fine SAND, tnlce ant
.::'';; ... .. .
... .. . ....... :
·.·· ...
... ...
PROJECT NO 903-1060.303 OWG NO J-4341 DATE 11/1/90 DRAWN JSS APPROVED _
WELL COMPLETION
8-in. steel casing
FIGURE A-3 SHEET 4 OF 5
GWMP-3 RECORD OF
BOREHOLE BLAINE/GWMP /WA

I I I I I I I I I I I I I I I I I I
'
STRATIGRAPHY
290
300
...., 310
"' "' LL
.!:
..c ...., Q_
"' 0 320
330
340
350
~ROJ~::l NO 90~-1060 . .30:3 OWG NO 34342 ~tt 11/1/80 DRAWN JSS APPROVED -
WELL COMPLETION
28!J.o-
fiGURE A-3 SHEET 5 Of 5
GWMP-3 RECORD OF
BOREHOLE BlAINE/GWMP /WA

I I I I I I I I I I I I I I I I I I I
I I t I I APPENDIXB
I I I
' I ' I I I t I t I I Goloer Associates

I I I li I I
_, ,, I I I t ·I I· I I I
' t I
903-1 060.302
DATE
02-<lct
City of Blaine Page 1 of 1
ELAPSED DEPTH TO DRAW- COMMENTS
nME WATER """"' (min) (It) (It)
<0.0 133.!0 0.00 LEVEL
0.0 11!18.87 38.07
1.0 185.60 31.80
2.0 102.20 28.00
3.0 f&lUO ... ., 6.0 154.00 20.40
o.o 148.10 16.!0
10.0 146.00 12.00
16.0 140.60 e.oo 20.0 137.80 •. oo
26.0 135.00 .... 30.0 130.20 1.00
Golder Associates
I
t I I I I I I I
' ' I .. _.·
I I I I I I
903-1060.302
DATE
01-<>ct
03-0c1
05-0c1
O&-Oc1
City of Blaine Page 1 of 2
E1.APSEO DEPTH TO DAAW- FLOW COMMENTS
TIME WATER """"' RATE
(min) (II) (II) (gpm)
0.0 73.70 0.00
0.0 73.83 0.00
0.0 74.00 0.00
0.0 73.03 0.00
1.0 74.45 o ...
2.0 74.45 o ... 3.0 74.45 o ... "" a.o 74.48 0.63
7.0 74.42 o .... 15
11.0 74.43 0.50 18
17.0 74.45 o ... 10
20.0 74.43 0.50 17
2S.O 74.41 o ... 10
30.0 74.43 .... 18
31.0 70.00 1.07
32.0 7a.70 1.n 71
33.0 TUO 1.17 75
37.5 , .... 2.03 T5
42.0 7e.G7 2.14 T5
... o ..... 2.1. TT
50.0 70.10 2.17 TO
50.0 70.13 2.20
00.0 70.15 2.22 TO
81.0 71.70 •-n 02.0 ..... 4.72 142
... o 71.75 .... 150 .... 71.73 . ... 143
70.0 71.70 U3 1 ..
75.0 71.711 1 ..
Golder Associates

I I ·I I I I I I I I I I I I I ·t· I I. I
903-1060.302
DATE
City of Blaine
ElAPSED DEPTH TO DRAW-
TIME WATER llC>IM<
(min) (11) (11)
80.0 78.83 4.00
06.0 78.83 4.00
00.0 71.11 4 ...
01.0 02.1. .... 02.0 81.80 7.07
03.0 81.80 7.87
00.0 81.88 7.00
00.0 auo 7.07
100.0 81.80 7.07
106.0 8UI6 1.02
110.5 . ,.. .... 115.0 82.01 .... 120.0 ..... 8.11
121.0 7 ... 83 0.70
122.0 74.40 0.47
123.0 74.35 0.42
128.0 74.30 0.37
133.15 7427 0.34
136.0 7427 0.34
144.0 74.18 0.25
162.0 74.17 0.24
107.0 74.08 0.18
102.0 74.08 0.13
187.0 74.03 0.10
73.00
Golder Associates
Page 2 of 2
FLOW COMMENTS
MTE
(gpm)
145
1 ..
143 STEP4
211
= ... ... 204 .. . 204 ...

I
I
I
I I I I .I ,,
I I I ·I I I I
903-1060.302
DATE
08-0o!
City of Blaine Page 1 of 3
ELAPSED DEPTH TO DRAW- FlOW COMMENTS
TIME WATER DOWN RATE
(min) (It) (1t) (gpm)
0.0 73.03 0 START TEST
1.0 71.81 .... 140
2.0 70.17 .... 147
3.0 70.&3 .... 160
6.0 7U3 6.10 160
7.0 70.08 6.15 140
10.0 7'11.10 .. , 160
16.0 711.15 .... 161
20.0 7SI.18 .... 160
26.0 711.21 .... 160
30.0 70 ... 5.31 160
46.0 70.20 .... 140 C•UKl,s/cm T•10•C
OC>.O 70.34 U1 160 C·200¢J/cm Too10•C
00.0 70.38 .... 160
120.0 711 ... .... 140 C-200 ,stem T .,o•c 0
150.0 , ... , .... 140
110.0 70.61 .... 140
210.0 ..... 6.01 140
-~ 70.03 .. ,. 160 C-200,s/cm T-1oec
270.0 ..... .. ,. 140
300.0 70.70 0.17 140
330.0 70.70 .... 140
300.0 711.711 .... 140 ..... 711.78 .... 140
420.0 711.02 .... 140 C·200pS/cm Too10•c
460.0 711.03 .... 140
400.0 711" ... , 140
110.0 711 ... 6.07 140
670.0 78.87 .... 160
000.0 .... .... 140 r .. ,o•c
Golder Associates

I I 903-1060.302 City of Blaine Page 2 of3
I I ,,
I I I
""TE ElAPSED DEPTH TO DRAW- FLOW COMMENTS
TIME WATER DOWN RATE
(min) (ft) (II) (gpm)
I OOM 10.11 .. 10 c-200 pS/cm T .,o•c
OOM 00-00 .. 13
I 7!i0.0 OOJ!O .. 27
,..,_., 00,22 0.20 C.200¢Jicm T•to•c
"""" 00~ 1<31 C·200pS/om T .. tOOC
I 870.0 OOJM U1
OOM 00 ... U6
030.0 00-30 1<37
I 1100.0 00,34 8.41 C·200,s/cm r.to•c
OOM 00,30 .... 1026.0 OOA:I .... 1060.0 00.62 0,60
I toao.o 00,64 U1 C..t80JB/cm T•tO*C
1110.0 00,67 .... 1140.0 00,00 U7
I 1170.0 ouo 0-03
1200.0 00.02 .... c-tso 113/om T -to•c 1230.0 00,02 ....
I 1280.0 00.03 uo 1280.0 00,04 1<71
1320.0 00,06 0-72 C. teo ,8/cm T -to•c
I 1350.0 00,06 0.72
1380.0 00,00 1<73
1410.0 00,07 0.74
I 1.WO.O 00.00 .. 7. 140 START RECOVERY
1441.0 7U4 2.31
1442-0 78.17 ._..
I 1443-0 ..... :L16
1446-0 7U4 :L01
1448.0 7U6 :L02
I ·,-•
I Golder Associates

I
•• I I I I I I
I I I I I I I I I I I
903-1060.302
MTE
City of Blaine Page 3 of 3
ElAPSED DEPTH TO DRAW- FLOW COMMENTS
TIME WATER """"" RATE
(min) (ft) (II) (D>m)
1460.0 7&.06 2.02
1466.0 76.00 1.07
1480.0 76.86 1.02
1406.0 711.03 1.00
1470.0 7&.70 1.00
1486.0 7&.75 1.82
1500.0 76.02 1.00
1630.0 7&.00 U7
1687.0 75.36 1.42
1002.0 76.25 1.32
1707.0 76.22 1.211
1833.0 7&. 13 1.20
2207.0 74.84 O.t1
2430.0 74.81 o ...
2530.0 74.78 0.05
2503.0 74.78 0.15
..... o 74.76 0.12 ...... 74.74 0.81
2747.0 74.71 0.71
2716.0 74.88 0.70
2544.0 74.18 0.75
2e10.0 74.85 0.72
Golder Associates

I I 903-1060.302 City of Blaine Page 1 of 3
I I I I I
DATE ELAPSED DEPTH TO DRAW- FLOW CC)MMENTS
TIME WATER """"' RATE
(min) (It) (It) (gpm)
I 02-0ct 0.0 ..... 0.00
03-0ct 0.0 ..... 0.00
04-0ct 0.0 ..... 0.00 STEP1
I 1.0 00.36 2.30 01
2.0 00.40 2.41 01
3.0 00.67 .... 01
I 6.0 oo.es .... 01
7.0 00.07 .... 01
10.0 00.07 .... 01
I 1~0 00.70 .... 01
20.0 80.76 2.70 01
26.0 80.76 2.70 01
I .... 00.77 2.72 STEP2
31.0 ouo .... 160
:!3.6 ..... .... 160
I 36.0 04.67 .... 160
37.0 04.70 .... 160 .... 04.70 . ... 160
I .... 04.&6 .. .. 160
51.0 ..... e.oo 160 .... ..... . ... 160
I eo.o ..... 7.00 6TEP3
81.6 101.10 13.06 260 .... 101.33 13.20 260
I .... 101.40 13.36 260 .... 100.S7 12.02 260
07.0 101.10 13.05 260
I 70.0 101.26 13.20 260
76.0 101.40 13.36 260
00.0 10UO 13.66 260
I I Golder Associates

I I 903-1060.302 City of Blaine Page 2 of 3
I I I I I
DATE ElAPSED DEPTH TO DRAW- FLOW COIIUIENTS
TIME WATER DOWN AATE
(min) (11) (11) (Qpm)
I 16.0 101.72 13.87 ... 00.0 101.72 13.57 STARTSTEP4
I 81.0 104.116 HUIO ... 02.0 106.14 17.68 ... 03.0 108.06 11.00 ...
I 16.0 108.42 14.37 ... 01.0 toe. eo 18.56 ...
100.0 100.71 11.73 ... I
106.0 107.03 1UII ... 110.0 107.11 Hl.13 ... 115.0 107.28 18.23 ...
I 120.0 107.40 18.36 STEP6
121.0 toe.ae 21.81 375
122.0 110.14 22.00 ..,.
I 123.5 110.37 22.32 ..,. 125.0 110.47 22.42 ..,. 127.0 110.8115 22.01 ..,.
I 130.0 110.10 22.76 ••• 1360 111.00 ..... ... 140.0 111.20 ..... ..,.
I 146.0 ••• 150.0 111.43 ..... 161.0 ..... .... 162.0 ..... ....
I 153.0 11.70 .... 154.0 01.40 .... 166.0 ..... 3.10
I 167~ 00.06 2.00
teo.o oo.eo .... 1155.0 00.26 2.20
I I Golder Associates

I I 903-1 060.302 City of Blaine Page 3 of 3
I I I I I
DATE ELAPSED DEPTH TO DRAW- FLOW CONMENTS
TIME WATER """" RI\TE
(min) (11) (11) (gpm)
I 170.0 ..... '·"' 175.0 ..... 1.76
I 180.0 ... ,., .... ..... .. ... uo 213.0 18.21 1.18
I 273.0 aa.oo oa ..... aa.oo 0.85 ..... 18.17 0.82
I 306.0 ..... 0.78
I I I I I I I I Golder Associates

I I I I I I I I I I I I I I I I I I I
903-1060.302
DATE
04-0ot
City of Blaine
E1.APSEI> DEPTH TO DRAW..
TIME WATER """"' (""") (II) (II)
0.0 ..... 0
1.0 123.26 36.20
2.5 12 ... 0 ..... 0.0 127.00 ..... 6.6 128.26 40.20
7.6 128.80 40.76
10.0 121.48 41.43
16.0 130.22 42.17
20.0 130.76 42.70
26.0 131.20 43.16
30.0 13UO ..... 36.0 131.76 43.70
40.0 132.10 44.06
45.0 132.30 44.26
60.0 132.60 44.45
&6.0 132.80 44.03
00.0 132.e& 44.00
70.0 133.20 45.16
00.0 133.70 ...... 100.0 133.00 ..... 110.0 134.15 48.10
120.0 t3C.40 ..... 150.0 1SUIO ..... 180.0 136.30 47.31
210.0 136.n 47.72
.... o 138.15 48.10
270.0 138.48 ..... 300.0 138.77 ... 72
330.0 137.02 ... ., 300.0 137.30 .....
Golder Associates
Page 1 of 4
FLOW COMMENTS
RATE
(gpm)
610
604 ... --407 ... ... 407
... --481
401
C-230pS/cm T.to•c ... T·11•C

I I I I 'I I I I I I I I I ,J
I I I I I
903-1060.302
DATE
06-0o1
City of Blaine
ElAPSED DEPTH TO DAAW-
TIME WATER DOWN
(min) (It) (It)
000.0 137.58 4t.51
420.0 137.88 ..... .... o 138.10 50.05
480.0 138.46 ..... 610.0 1311.72 60.07
048.0 138.04 ..... 070.0 138.14 51.08
eoo.o 138.60 ., ... 030.0 138.80 61.56
003.0 13lil.ll 51.&3
ooo.o 140.08 152.03
7:!0.0 140.23 ... ,. -m.o 130.70 ..... 750.0 130.88 .... , 700.0 130.78 42.71
810.0 130.81 42.70
040.0 130.81 42.70
870.0 130.87 ..... 004.0 131.14 ..... .... 0 131.25 ...... 000.0 131.35 ..... 000.0 131.30 ......
1030.0 131M ... ., 1060.0 13UM ..... 1080.0 131.70 ..... 1110.0 131.84 ... ,. 1140.0 131.87 ..... 1170.0 , ..... ..... 1200.0 132.12 44.07
1230.0
Golder Associates
Page 2 of4
FlOW COMMENTS
RATE
(gpm)
.. , ... C.1SIO~cm T.11•C ... ... C.tSIOioiS/cm r.to•c ... ... C·2001AJ/cm r .. to•c .... C-200,stcm r ... to•c ... ... Coo2001S/cm T-to•c ...
487 FLOW RATE BECAUS ... PUMP ... ... Ca200JB1cm T-to•c ... ... ... C-200JIS/cm r-to•c ... C.200JAJ/cm r.to•c ... ... c-200,&6/cm r-to•c ... c-200J,S/cm r.to•c ... ... ... ... ... c-210 J,S/cm T-to•c
...

I I I I I I I I I I I I I I I I I I I
903-1060.302
DATE
City of Blaine
El»SED DEPTH TO DRAW-
TIME WATER """"' (min) (II) (II)
121!10.0 132.33 ...... 1280.0 132.38 ...... 1320.0 132.45 40.40
1448.0 1D1.2a 13.18
1447.0 too.se 12.51
1448.0 100.26 12.20
1450.0 ..... 11.76
14li2.0 ..... 11.33
1 ...... 18.10 11.05
1480.0 10.72 10.87
1415.0 .... 10.80
1470.0 08.37 10.32
1481).0 07.03 .... 1605.0 07.00 .... 1635.0 07.20 1.21
1 ..... ... .. 1.87
1505.0 ... ,. .... 1056.0 ..... . ... 1716.0 ..... 7 ...
1&38.0 ..... 7.40
1046.0 ..... .. .. ...... 03.71 .. ,. ...... ... .. 8.17
2727.0 03.45 1.40
2831.0 03.20 .. ,.
Golder Associates
Page 3 of4
FLOW COMMENTS
AATE
(gpm)
... ... ... C•210ISJcm Too11•C
C•210,stcm T·n•c

I I I I I I I I I I I I I I I I I I I
903-1 060.302
DATE
City of Blaine
EI.AP9Eil DEI'THTO CRAW-
TIME WATER """"' (min) (11) (11)
4024.0 ..... . ... ...... ... , . . ... ...... 81.87 U2
7185.0 ..... .. .. ...... ..... 2.76
Golder Associates
Page 4 of 4
FLOW OOMMEHTS
RATE
(gpm)

I I I I I I I I I I I I I I I I I I I

I I I I I APPENDIXC
I I I I I I I I I I I I I I Golder Assoclaies

J· A AnolyticoiTechnologies,lnc. 1
I I I I I I I I I I I I I I I I I I
CLIENT PROJECT # PROJECT NAME
SAMPLE CROSS REFERENCE SHEET
: GOLDER ASSOCIATES : 903 1060.900
CITY OF BLAINE, WA.
ATI I.D. f 9010-092
---------------------------------------------------------------------ATI j CLIENT DESCRIPTION DATE SAMPLED MATRIX
---------------------------------------------------------------------9010-092-1 9010-092-2 9010-092-3
GOLDER/CCY-GWMP-1-A GOLDER/CCY-GWMP-3-A GOLDER/CCY-GWMP-3-B
10/02/90 10/04/90 10/05/90
WATER WATER WATER
===========================================-===================-===== ----- TOTALS ----~
MATRIX II SAMPLES
WATER 3
ATI STANDARD DISPOSAL PRACTICE ------------------------------The samples from this project will be disposed of in thirty (30) days
from the date of this report. If an extended storage period is required, please contact our sample control department before the schP.duled disposal date.

I A AnalyticoiTechnologies,lnc. 2
I ATI I.D. t 9010-092
I ANALYTICAL SCHEDULE
CLIENT : GOLDER ASSOCIATES
I PROJECT # • 903 1060.900 • PROJECT NAME • CITY OF BLAINE, WA. •
I ---------------------------------------------------------------------ANALYSIS TECHNIQUE REFERENCE LAB
-------~-------------------------------------------------------------
I ARSENIC AA/GF EPA 7060 R
BARIUM AA/F EPA 7080 R
I CADMIUM AA/GF EPA 7131 R
I CALCIUM AA/F EPA 7140 R
CHROMIUM AA/F EPA 7190 R
I COPPER AA/F EPA 7210 R
IRON AA/F EPA 7380 R
I LEAD AA/GF EPA 7421 R
I MAGNESIUM AA/F EPA 7450 R
MANGANESE AA/F EPA 7460 R
I MERCURY AA/COLD VAPOR EPA 7470 R
POTASSIUM AA/F EPA 7610 R
I SELENIUM AA/GF EPA 7740 R
I SILVER AA/F EPA 7760 R
SODIUM AA/F EPA 7770 R
I ZINC AA/F EPA 7950 R
ALKALINITY TITRIMETRIC EPA 310.1 R
I BICARBONATE TITRIMETRIC EPA 310.1 R
CARBONATE TITRIMETRIC EPA 310.1 R
I CATION/ANION BALANCE CALCULATION SM 104C R
I I
CONTINUED NEXT PAGE

I A AnolyticoiTechnologies,lnc. 3
I I I I I I I I I I I I I I I I I I
CLIENT PROJECT f PROJECT NAME
ANALYTICAL SCHEDULE CONTINUED
: GOLDER ASSOCIATES : 903 1060.900 : CITY OF BLAINE, WA.
ATI I.D. t 9010-092
---------------------------------------------------------------------ANALYSIS TECHNIQUE REFERENCE LAB
---------------------------------------------------------------------CHLORIDE
COLOR
CONDUCTIVITY
FLUORIDE
TOTAL HARDNESS
HYDROXIDE
NITRATE-NITRITE AS NITROGEN
SILICA
SULFATE
TOTAL DISSOLVED SOLIDS
TURBIDITY
R = ATI - Renton SO = ATI - San Diego T ~ ATI - Tempe PNR = ATI - Pensacola FC = ATI - Fort Collins SUB = Subcontract
TITRIMETRIC
COLORIMETRIC
ELECTRODE
ELECTRODE
CALCULATION
TITRIMETRIC
COLORIMETRIC
COLORIMETRIC
TURBIMETRIC
GRAVIMETRIC
NEPHELOMETRIC
EPA 325.3 R
EPA 110.2 so
EPA 9050 R
EPA 340.2 so
SM 314A R
EPA 310.1 R
EPA 353.1 so
EPA 370.1 so
EPA 375.4 R
EPA 160.1 R
EPA 180.1 R

I A AnolyticoiTechnologies,lnc. 4
I I I I I I I I I I I I I I I I I I
CLIENT PROJECT I PROJECT NAME
METALS RESULTS
GOLDER ASSOCIATES : 903 1060.900 : CITY OF BlAINE, WA.
ATI I.D.t 9010-092
MATRIX : WATER
UNITS : mg/L
---------------------------------------------------------------------PARAMETER
GOLDER/CCY-GWMP-1-A -1
GOLDER/CCY-GWMP-3-B -3
---------------------------------------------------------------------ARSENIC <0.005 0.008
BARIUM <0.06 <0.06
CADMIUM <0.0003 <0.0003
CALCIUM 16 14
CHROMIUM <0.03 <0.03
COPPER <0.02 <0.02
IRON 0.48 <0.03
LEAD <0.005 <0.005
MAGNESIUM 7.6 6.2
MANGANESE 0.05 o.os MERCURY <0.0005 <0.0005
POTASSIUM 3.3 3.0
SELENIUM <0.005 <0.005
SILVER <0.02 <0.02
SODIUM 8.2 8.7
ZINC 0.22 0.02

I.
I I I I I I I I I I I I-
I I I I I I
A AnolyticoiTechnologies,lnc. 5
ATI I.D. f 9010-092
METALS QUALITY CONTROL
CLIENT PROJECT f PROJECT NAME
: GOLDER ASSOCIATES : 903 1060.900
MATRIX : WATER
UNITS : mg/L : CITY OF BLAINE, WA.
---------------------------------------------------------------------SAMPLE DUP SPIKED SPIKE % PARAMETER ATI I.D. RESULT RESULT RPD SAMPLE CONC REC
---------------------------------------------------------------------ARSENIC
BARIUM
CADMIUM
CALCIUM
9010-088-4
9010-088-4
9010-088-4
9010-088-4
CHROMIUM 90~0-088-4
COPPER 9010-088-4
IRON 9010-088-4
LEAD 9010-088-4
MAGNESIUM 9010-088-4
MANGANESE 9010-088-4
MERCURY 9010-108-1
POTASSIUM 9010-088-4
SELENIUM 9010-088-4
<0.005 <0.005 0
<0.06 <0.06 0
<0.0003 <0.0003 0
31 32 3
<0.02 <0.02 0
<0.02 <0.02 0
0.39 0.39 0
<0.005 <0.005 0
29 29 0
0.69 0.68 l
<0.0005 <0.0005 0
8.9 8.9 0
<0.005 <0.005 0
0.044 0.050 88
20.1 20.0 101
0.0023 0.0020 115
51 20 100
2.04 2.00 102
0.95 1.00 95
2.35 2.00 98
0.058 o.oso. 116
48 20 95
2.48 2.00 90
0.0019 0.0020 95
21.5
0.038
12.0
0.050
105
76
SILVER 9010-088-4 <0.02 <0.02 0 0.94 1.00 94
SODIUM 9010-088-4 44 44.
SODIUM BLANK SPIKE N/A N/A
ZINC 9010-088-4 <0.01 <0.01
0 N/A
N/A 21.9
0 0.48
N/A
20.0
o.so
% Recovery = (Spike Sample Result - Sample Result) ------------------------------------- X 100 Spike Concentration
RPD (Relative % Difference) = (Sample Result - Duplicate Result)
--------------------------------- X Average Result
N/A
110
96
100

t· I I I I I I I I I I I I I I I I I I
A AnalyticaiTechnologies,lnc. 6
ATI I.D. f 9010-092
GENERAL CHEMISTRY RESULTS
: GOLDER ASSOCIATES : 903 1060.900
CLIENT PROJECT t PROJECT NAME : CITY OF BlAINE, WA.
MATRIX : WATER
UNITS : mg/L
---------------------------------------------------------------------PARAMETER
GOLDER/CCY-GWMP-1-A -1
GOLDER/CCY-GWMP-3-B -3
---------------------------------------------------------------------ALKALINITY 52 84
BICARBONATE 52 84
CARBONATE <5 <5
CHLORIDE <5 6
FLUORIDE <0.5 <0.5
TOTAL HARDNESS 71 60
HYDROXIDE <5 <5
NITRATE-NITRITE as NITROGEN <0.05 <0.05
SILICA 22.2 25.3
SULFATE 6 <5
TOTAL DISSOLVED 130 130 SOLIDS

I· A AnolyticoiTechnologies,lnc. 7
I I I I I I I I I I I I I I I I I I
CLIENT PROJECT # PROJECT NAME
ATI I.D. # 9010-092
GENERAL CHEMISTRY QUALITY CONTROL
: GOLDER ASSOCIATES : 903 1060.900 : CITY OF BLAINE, WA.
MATRIX : WATER
UNITS : mq/L
------------------------------------------------------------------------PARAMETER
ALKALINITY
CHLORIDE
FLUORIDE
TOTAL HARDNESS
ATI I.D.
9010-092-3
9010-108-1
9010-092-3
9010-088-4
NITRATE-NITRITE as NITROGEN 01016601
SILICA 01016601
SULFATE 9010-108-1
TOTAL DISSOLVED 9010-092-3 SOLIDS
SAMPLE DUP SPIKED SPIKE t RESULT RESULT RPD RESULT ADDED REC
84 88 5 276 200 96
5 5 0 212 200 104
<0.5 <0.5 0 4.97 5.00 99
196 199 2 N/A N/A N/A
<0.05 <0.05 0 1.9 2.0 95
25.7 26.6 3 68.0 40.0 105
<5 <5 0 9.7 10 97
130 120 8 N/A N/A N/A
t Recovery = (Spike Sample Result - sample Result) ------------------------------------- X 100 Spike concentration
RPD (Relative t Difference) = (Sample Result - Duplicate Result) --------------------------------- X 100 Average Result

•• I I I I I I I I I I I I I I I I I I
A AnolyticoiTechnologies,lnc. 8
ATI I.D. f 9010-092
GENERAL CHEMISTRY RESULTS
CLIENT PROJECT f PROJECT NAME
: GOLDER ASSOCIATES : 903 1060.900 : CITY OF BLAINE, WA.
MATRIX : WATER
UNITS : -
---------------------------------------------------------------------PARAMETER
GOLDER/CCY-GWKP-1-A -1
GOLDER/CCY-GWMP-3-B -3
---------------------------------------------------------------------COLOR
CATION/ANION BALANCE
<5
1.21
<5
0.76

I I I I I I I I I I I I I I I I I I I
A AnolyticoiTechnologies,lnc. 9
CLIENT PROJECT II PROJECT NAME
ATI I.D. # 9010-092
GENERAL CHEMISTRY QUALITY CONTROL
: GOLDER ASSOCIATES : 903 1060.900 : CITY OF BLAINE, WA.
MATRIX : WATER
UNITS : -
------------------------------------------------------------------------PARAMETER
COLOR
ATI I.D.
9010-092-3
SAMPLE DUP SPIKED SPIKE t RESULT RESULT RPD RESULT ADDED REC
<5 <5 0 N/A N/A N/A
t Recovery = (Spike Sample Result - Sample Result) ------------------------------------- X 100 Spike concentration
RPD (Relative % Difference) = (Sample Result - Duplicate Result) --------------------------------- X 100 Average Result

I A AnalyticaiTechnologies,lnc. 10
I I I I I I I· I I I I I I I I I I I
CLIENT PROJECT I PROJECT NAME
GENERAL CHEMISTRY RESULTS
: GOLDER ASSOCIATES : 903 1060.900 : CITY OF BLAINE, WA.
ATI I.D. f 9010-092
MATRIX : WATER
UNITS : Ulllhosfcm
---------------------------------------------------------------------PARAMETER
GOLDER/CCY-GWHP-1-A -1
GOLDER/CCY-GWMP-3-B -3
---------------------------------------------------------------------CONDUCTIVITY 200 160

I I I I I I I I, I ,_
I I I I I I I I I I
A AnolyticoiTechnologies,lnc. 11
ATI I.D. f 9010-092
GENERAL CHEMISTRY QUALITY CONTROL
: GOLDER ASSOCIATES : 903 1060.900
CLIENT PROJECT f PROJECT NAME :
MATRIX : WATER
CITY OF BlAINE, WA. UNITS : umhosjcm
-----------------------------------------------------------------------PARAMETER
ATI I.D.
SAMPLE DUP SPIKED SPIKE t RESULT RESULT RPD RESULT ADDED REC
------------------------------------------------------------------------CONDUCTIVITY 9010-108-1 130 150 14 N/A N/A N/A
t Recovery = (Spike Sample Result - Sample Result) ------------------------------------- X 100 Spike Concentration
RPD (Relative t Difference) = (Sample Result - Duplicate Result) --------------------------------- X 100 Average Result

I A AnolyticoiTechnologies,lnc. 12
I I I I I I I I I I I I I ·I I, I I I
CLIENT PROJECT f PROJECT NAME
GENERAL CHEMISTRY RESULTS
: GOLDER ASSOCIATES : 903 1060.900 : CITY OF BLAINE, WA.
ATI I.D. t 9010-092
MATRIX : WATER
UNITS : NTU
---------------------------------------------------------------------PARAMETER
GOLDER/CCY-GWMP-1-A -l
GOLDER/CCY-GWMP-3-B -3
---------------------------------------------------------------------TURBIDITY 18 <0.5

I AAnalyticaiTechnologies,lnc. 13
I I I I I I I I I I I I I I I I I I
CLIENT PROJECT # PROJECT NAME
ATI I.D. t 9010-092
GENERAL CHEMISTRY QUALITY CONTROL
: GOLDER ASSOCIATES : 903 1060.900 : CITY OF BLAINE, WA.
MATRIX : WATER
UNITS : NTU
------------------------------------------------------------------------PARAMETER
ATI I.D.
SAMPLE DUP SPIKED SPIKE % RESULT RESULT RPD RESULT ADDED REC
------------------------------------------------------------------------TURBIDITY 9010-108-1 <0.5 <0.5 0 N/A N/A N/A
% Recovery = (Spike Sample Result - Sample Result) ------------------------------------- X 100 Spike concentration
RPD (Relative % Difference) = (Sample Result - Duplicate Result) --------------------------------- X 100
Average Result

.1 A AnolyticoiTechnologies,lnc. 1
I I I I I I I I I I I I I I I I I I
CLIENT PROJECT f PROJECT NAME
SAMPLE CROSS REFERENCE SHEET
: GOLDER ASSOCIATES : 903-1060 : BLAINE/PUMP TESTING/WA
ATI I.D. f 9010-108
---------------------------------------------------------------------ATI f CLIENT DESCRIPTION DATE SAMPLED MATRIX ---------------------------------------------------------------------9010-108-1 CCY-GWMP-2-B 10/09/90 WATER
===================================================================== ----- TOTALS -----
MATRIX I SAMPLES
WATER 1
ATI STANDARD DISPOSAL PRACTICE
The samples from this project will be disposed of in thirty (30) days from the date of this report. If an extended ~torage period is required, please contact our sample control department before the scheduled disposal date.

I A Anoly1ico1Technologies,lnc. 2
I ATI :I.D. f 9010-108
ANALYTICAL SCHEDULE
I CLIENT • GOLDER ASSOCIATES •
I PROJECT f • 903-1060 • PROJECT NAME . BLAINE/PUMP TESTING/WA . ---------------------------------------------------------------------I ANALYSIS TECHNIQUE REFERENCE LAB ---------------------------------------------------------------------
I ARSENIC AA/GF EPA 7060 R
BARIUM AA/F EPA 7080 R
I CADMIUM AA/GF EPA 7131 R
CALCIUM AA/F EPA 7140 R
I CHROMIUM AA/F EPA 7190 R
I COPPER AA/F EPA 7210 R
IRON AA/F EPA 7380 R
I LEAD AA/GF EPA 7421 R
MAGNESIUM AA/F EPA 7450 R
I MANGANESE AA/F EPA 7460 R
I MERCURY AA/COLD VAPOR EPA 7470 R
POTASSIUM AA/F EPA 7610 R
I SELENIUM AA/GF EPA 7740 R
SILVER AA/F EPA 7760 R
I SODIUM AA/F EPA 7770 R
I ZINC AA/F EPA 7950 R
ALKALINITY TITRIMETRIC EPA 310.1 R
I BICARBONATE TITRIMETRIC EPA 310.1 R
CARBONATE TITRIMETRIC EPA 310.1 R
I CATION/ANION BALANCE CALCULATION SM 104C R
I CONTINUED NEXT PAGE
I

I A AnolyticoiTechnologies,lnc. 3
I I I I I I I I I I I I I I I I I I
CLIENT PROJECT f PROJECT NAME
ANALYTICAL SCHEDULE CONTINUED
: GOLDER ASSOCIATES : 903-1060 : BLAINE/PUMP TESTING/WA
ATI I.D. f 9010-108
---------------------------------------------------------------------ANALYSIS TECHNIQUE REFERENCE LAB ---------------------------------------------------------------------CHLORIDE
COLOR
CONDUCTIVITY
FLUORIDE
HARDNESS
HYDROXIDE
NITRATE -NITRITE AS NITROGEN
SILICA
SULFATE
TOTAL DISSOLVED SOLIDS
TURBIDITY
R = ATI - Renton SD = ATI - San Diego T = ATI - Tempe PNR = ATI - Pensacola FC = ATI - Fort Collins SUB = Subcontract
TITRIMETRIC
COLORIMETRIC
ELECTRODE
ELECTRODE
CALCULATION
TITRIMETRIC
COLORIMETRIC
COLORIMETRIC
TURBIMETRIC
GRAVIMETRIC
NEPHELOMETRIC
EPA 325.3 R
EPA 110.2 so
EPA 9050 R
EPA 340.2 so
SM 314A R
EPA 310.1 R
EPA 353.1 so EPA 370.1 so
EPA 375.4 R
EPA 160.1 R
EPA 180.1 R

I A AnolyticoiTechnologies,lnc. 4
I I I I I I I I I I I I I I I I I I
CLIENT PROJECT I PROJECT NAME
METALS RESULTS
: GOLDER ASSOCIATES : 903-1060 : BLAINE/PUMP TESTING/WA
ATI I.D.t 9010-108
MATRIX : WATER
UNITS : mqjL
---------------------------------------------------------------------PARAMETER
CCY-GWMP-2-B -1
---------------------------------------------------------------------ARSENIC <0.005
BARIUM <0.06
CADMIUM <0,0003
CALCIUM 13
CHROMIUM <0.02
COPPER <0.02
IRON 0.11
LEAD <0.005
MAGNESIUM 5.3
MANGANESE 0.10
MERCURY <0.0005
POTASSIUM 2.2
SELENIUM <0.005
SILVER <0.02
SODIUM 9.5
ZINC 0.04

I A Anoly!icoiTechnologies,lnc. 5
I I I I I I I I I I I I I I I I I I
ATI I.D. t 9010-108
METAlS QUALITY CONTROL
CLIENT PROJECT f PROJECT NAME
: GOLDER ASSOCIATES : 903-1060
MATRIX : WATER
: BLAINE/PUMP TESTING/WA UNITS : mq/L
---------------------------------------------------------------------SAMPLE DUP SPIKED SPIKE \ PARAMETER ATI I.D. RESULT RESULT RPD SAMPLE CONC REC
---------------------------------------------------------------------ARSENIC
BARIUM
CADMIUM
9010-088-4
9010-088-4
9010-088-4
CALCIUM 9010-088-4
CHROMIUM 9010-088-4
COPPER 9010-088-4
IRON 9010-088-4
LEAD 9010-088-4
MAGNESIUM 9010-088-4
MANGANESE 9010-088-4
<0.005 <0.005 0
<0.06 <0.06 0
<0.0003 <0.0003 0
31 32 3
<0.02 <0.02 0
<0.02 <0.02 0
0.39 0.39 0
<0.005 <0.005 0
29 29 0
0.69 0.68 1
0.044 0.050 88
20.1 20.0 101
0.0023 0.0020 115
51
2.04
0.95
2.35
0.058
48
2.48
20 100
2.00 102
1.00 95
2.00 98
0.050 116
20 95
2.00 90
MERCURY 9010-108-1 <0.0005 <0.0005 0 0.0019 0.0020 95
POTASSIUM 9010-088-4 8.9 8.9 0 21.5 12.0 105
SELENIUM 9010-088-4 <0.005 <0.005 0 0.038 0.050 76
SILVER 9010-088-4 <0.02 <0.02 0 0.94 1.00 94
SODIUM 9010-088-4 44 44 0 N/A N/A N/A
SODIUM BLANK SPIKE N/A N/A N/A 21.9 20.0 110
ZINC 9010-088-4 <0.01 <0.01 0 0.48 0.50 96
\ Recovery = (Spike Sample Result - Sample Result) ------------------------------------- X 100 Spike Concentration
RPD (Relative \ Difference) = (Sample Result - Duplicate Result) --------------------------------- X 100 Averaqe Result
I A AnolyticoiTechnologies,lnc. 6
I I I I I I I I I I I I I I I I I I
CLIENT PROJECT I PROJECT NAME
GENERAL CHEMISTRY RESULTS
: GOLDER ASSOCIATES : 903-1060 : BLAINE/PUMP TESTING/WA
ATI I.D. f 9010-108
MATRIX : WATER
UNITS : mq/L
---------------------------------------------------------------------PARAMETER
CCY-GWMP-2-B -1
---------------------------------------------------------------------ALKALINITY 80
BICARBONATE 80
CARBONATE <5
CHLORIDE 5
FWORIDE <0.5
TOTAL HARDNESS 54
HYDROXIDE <5
NITRATE-NITRITE as NITROGEN <0.05
SILICA 25.7
SULFATE <5
TOTAL DISSOLVED 130 SOLIDS

I I I I I I I I I I I I I I I I I I I
A AnolyticoiTechnologies,lnc. 7
CLIENT PROJECT t PROJECT NAME
ATI I.D. t 9010-108
GENERAL CHEMISTRY QUALITY CONTROL
: GOLDER ASSOCIATES : 903-1060 : BLAINE/PUMP TESTING/WA
MATRIX : WATER
UNITS : mq/L
------------------------------------------------------------------------PARAMETER
ATI I.D.
SAMPLE DUP SPIKED SPIKE % RESULT RESULT RPD RESULT ADDED REC
------------------------------------------------------------------------ALKALINITY 9010-092-3 84 88 5 276 200 96
CHLORIDE 9010-108-1 5 5 0 212 200 104
FLUORIDE 01016003 0.6 0.6 0 5.17 5.00 103
TOTAL HARDNESS 9010-088-4 196 199 2 N/A N/A N/A
NITRATE-NITRITE as NITROGEN 9010-108-1 <0.05 <0.05 0 1.9 2.0 95
SILICA 9010-108-1 25.7 26.6 3 68.0 40.0 105
SULFATE 9010-108-1 <5 <5 0 9.7 10 97
TOTAL DISSOLVED 9010-108-1 130 150 14 N/A N/A N/A SOLIDS
% Recovery = (Spike Sample Result - Sample Result) ------------------------------------- X 100 Spike concentration
RPD (Relative % Difference) = (Sample Result - Duplicate Result) --------------------------------- X 100 Averaqe Result

I A AnolyticoiTechnologies,lnc. 8
I I I I I I I I I I I I I I I I I I
GENERAL CHEMISTRY RESULTS
CLIENT : GOLDER ASSOCIATES PROJECT f : 903-1060 PROJECT NAME : BLAINE/PUMP TESTING/WA
ATI I.D. f 9010-108
MATRIX : WATER
UNITS : -
---------------------------------------------------------------------PARAMETER
CCY-GWMP-2-B -1
---------------------------------------------------------------------COLOR
CATION/ANION BALANCE
<5
0.74

I A Anolytico!Technologies,lnc. 9
I I I I I I I I I I I I I I I I I I
CLIENT PROJECT f PROJECT NAME
ATI I.D. t 9010-108
GENERAL CHEMISTRY QUALITY CONTROL
: GOLDER ASSOCIATES MATRIX : WATER : 903-1060 : BLAINE/PUMP TESTINGfWA UNITS : -
------------------------------------------------------------------------PARAMETER
ATI I.D.
SAMPLE DUP SPIKED SPIKE % RESULT RESULT RPD RESULT ADDED REC
------------------------------------------------------------------------COLOR 01016502 <5 <5 0 N/A N/A N/A
% Recovery = {Spike Sample Result - Sample Result) ------------------------------------- X 100 Spike Concentration
RPD (Relative % Difference) = (Sample Result - Duplicate Result) --------------------------------- X 100 Average Result

I A AnolyticoiTechnologies,lnc. 10
I I I I I I I I I I I I I I I I I I
CLIENT PROJECT I PROJECT NAME
GENERAL CHEMISTRY RESULTS
: GOLDER ASSOCIATES : 903-1060 : BLAINE/PUMP TESTING/WA
ATI I.D. I 9010-108
MATRIX : WATER
UNITS : umhosjcm
---------------------------------------------------------------------PARAMETER
CCY-GWMP-2-B -1
---------------------------------------------------------------------CONDUCTIVITY 130

I A AnolyficoiTechnologies,lnc. 11
I I I I I I I I I I I I I I I I I I
CLIENT PROJECT I PROJECT NAME
ATI I.D. I 9010-108
GENERAL CHEMISTRY QUALITY CONTROL
: GOLDER ASSOCIATES : 903-1060 : BLAINE/PUMP TESTING/WA
MATRIX : WATER
UNITS : Ulllhosjcm
------------------------------------------------------------------------PARAMETER
ATI I.D.
CONDUCTIVITY 9010-108-1
SAMPLE DUP SPIKED SPIKE t RESULT RESULT RPD RESULT ADDED REC
130 150 14 N/A N/A N/A
t Recovery = (Spike Sample Result - Sample Result) ------------------------------------- X 100 Spike Concentration
RPD (Relative % Difference) = (Sample Result - Duplicate Result) --------------------------------- X 100
Average Result

I A AnolyticoiTechnologies,lnc. 12
I I I I I I I I I I I I I I I I I I
CLIENT PROJECT # PROJECT NAME
GENERAL CHEMISTRY RESULTS
: GOLDER ASSOCIATES : 903-1060 : BLAINE/PUMP TESTING/WA
ATI I.D. f 9010-108
MATRIX : WATER
UNITS : NTU
---------------------------------------------------------------------PARAMETER
CCY-GWMP-2-B -1
---------------------------------------------------------------------TURBIDITY <0.5

I I I I I I I I I I I I I I I I I I I
A Anoly!icoiTechnologles,lnc. 13
CLIENT PROJECT f PROJECT NAME
ATI I.D. f 9010-108
GENERAL CHEMISTRY QUALITY CONTROL
: GOLDER ASSOCIATES : 903-1060 : BLAINE/PUMP TESTING/WA
MATRIX : WATER
UNITS : NTU
------------------------------------------------------------------------PARAMETER
ATI I.D.
SAMPLE DUP SPIKED SPIKE ' RESULT RESULT RPD RESULT ADDED REC
------------------------------------------------------------------------TURBIDITY 9010-108-1 <0.5 <0.5 0 N/A N/A N/A
' Recovery = (Spike Sample Result - Sample Result) ------------------------------------- X 100 Spike Concentration
RPD (Relative ' Difference) = (Sample Result - Duplicate Result) --------------------------------- X 100 Average Result