installation and evaluation of the waterloo … · installation and monitoring of a waterloo...
TRANSCRIPT

INSTALLATION AND MONITORING OF A WATERLOO EMITTER™ SYSTEM
Douglas A. Sweeney, M.Sc. P.Eng. and Ian Young, C.Tech.
SEACOR Environmental Inc. INTRODUCTION Microbes found naturally in soil and groundwater degrades subsurface hydrocarbon impacts from releases of petroleum products. Several studies have identified natural redox processes responsible for hydrocarbon degradation. Injection of air or oxygen into hydrocarbon-impacted aquifers has been demonstrated to increase the rate of hydrocarbon degradation (Nyer and Duffin 1997). The evaluation of the Waterloo Emitter™ technology, which utilizes a patent protected diffusive device (silicon tubing) for delivery of high concentrations of dissolved oxygen to the groundwater, was conducted for a former retail service station located in a small town in northeast Alberta in the summer of 2004. The results of this evaluation were presented in 2004 at Remtech (Sweeney and Mitchell, 2004). Based on the site characterization data and preliminary analyses the Waterloo Emitter™ technology was determined to be a potentially effective method for the delivery of high concentrations of dissolved oxygen into the subsurface, thereby increasing aerobic bioremediation of dissolved hydrocarbons. Key conclusions from the Emitter evaluation study included: • Biodegradation of hydrocarbons at the site appears to be most closely approximated by first
order degradation rates. Modeling indicates that the dissolved plume is likely already at steady-state conditions (not expanding);
• Any reductions in hydrocarbon concentrations in down gradient compliance points will likely begin to occur between 0.5 and 1.5 years after oxygen delivery is initiated;
• Based on current plume conditions, regulatory compliance occurs approximately 40 meters (m) down gradient from the site. If dissolved oxygen levels of approximately 25 to 30 mg/L can be generated by a Waterloo Emitter™ “fence”, modeling indicates regulatory compliance for hydrocarbon parameters could occur in approximately 10 years.
Based on the results of the 2004 evaluation, the installation of a pilot Waterloo Emitter TM Remediation System (WERS) was completed in October 2004. The purpose of this paper is to present the installation details of the pilot WERS and the first year of monitoring results conducted in 2005.
PILOT WERS INSTALLATION
Borehole Drilling and Monitor Well Installation The field installation of the emitter “fence” consisted of two rows of five emitter wells spaced on 3 m centers. The second row of Emitters was off set 1.5 m, providing an effective spacing

between emitters of 1.5 m. The 10 wells were drilled and installed in the northeast corner of the former service station property at the down gradient toe of the hydrocarbon plume as shown in Figure 1 and Figure 2. The Waterloo Emitter™ installation program was completed between October 20-22, 2004, using a truck mounted drill rig equipped with hollow stem augers. The Waterloo Emitter™ wells were constructed of 150 mm diameter schedule 40 polyvinyl chloride (PVC) pipe with threaded joints. The screen section was composed of a wire wrapped on plastic pipe (W.O.P.). The 150 mm diameter schedule 40 PVC screen was manufactured by drilling holes in the circumference of the pipe and then wrapping and solvent welding tapered PVC wire around the outside diameter of the pipe. The screened section had a slot width of 0.01 of an inch. The annulus of the borehole surrounding the screen was comprised of 10 – 20 frac sand. A hydrated bentonite chip seal was placed around the annulus of the solid section of pipe above the screened section to within approximately 0.5 m of ground surface. All 10 wells were completed approximately one meter above ground surface. No protective covers were used since all 10 emitter wells were inside a locked fence compound. Photos of the Emitter well installation program are provided in Photo Nos. 1 to 5.
Waterloo Emitter™ and Connection Details The Waterloo Emitter™ specifications were as follows:
• Total Length: 1.3 m (1.2 m of functional emitter length) including central core pipe;
• Frame material: PVC;
• Silicone Diffusive Tubing: ¼" diameter, approximately 26 m length (Maximum operating pressure of 25 pounds per square inch (psi));
• End Fittings: 4 X ¼" compression fittings and 3/16” brass barb (Silicone); and
• Central Core Pipe: NPT threaded.
The Waterloo Emitters™ were comprised of a rigid PVC frame with silicone diffusive tubing and are equipped with four brass compression type fittings for connection to oxygen injection lines as shown in Photo Nos. 6 to 11. Each emitter is suspended within a well below the water table.
A 6,900 L extra-dry oxygen tank was used for delivery of oxygen to the Waterloo Emitters™. Extra-dry oxygen was selected due to the guaranteed low limits of moisture impurities (less than 10 ppm). The pressure regulator on the oxygen tank was set to 14 psi. At this pressure with 10 Waterloo Emitters™ operating 100 percent (%) of the time the oxygen tank life expectancy was calculated to be 220 days. Each Waterloo Emitter™ had two Low Density Polyethylene Tubing (LDPE) lines. One LDPE line was connected to a manifold system, which was connected to the oxygen tank. The purpose of this LDPE line was to provide oxygen to the Waterloo Emitter™. The second LDPE line, connected at the top of the Waterloo Emitter™, was an outlet line connected to a needle valve.

The purpose of the second LDPE line and needle valve was to remove any moisture build-up if required. A 2 m x 2 m x 1.5 m Rubbermaid™ shed with a double door and a peaked roof enclosed the oxygen tank and manifold system. The locked shed provided security and protection from the weather (Photo Nos. 6 to 11).
PILOT WERS PERFORMACE MONITORING PROGRAM
The pilot WERS performance monitoring consisted of the following: • Maintenance and monitoring of oxygen delivery system,
• Groundwater monitoring,
• Collection of field parameters, and
• Groundwater sampling and laboratory testing program.
In general, WERS performance monitoring was conducted in December 2004 and January, April and July of 2005. Limited testing was conducted in October 2004 after the emitter wells were installed. Initial base line data was collected in July 2004 (Sweeney and Mitchell, 2004) prior to the field installation of the emitter “fence”. The selected wells for collection of performance monitoring data was based on wells selected for the July 2004 baseline data and supplemental monitor wells installed after the WERS installation in October of 2004. Thus, some performance monitor wells installed in October 2004 did not have initial baseline data from July 2004. In addition, the performance-monitoring program was not conducted on every site visit in entirety. The detailed program for each of the monitoring parameters is provided below.
Maintenance and Monitoring of Oxygen Delivery System SEACOR Environmental Inc. (SEACOR) or a local subcontractor conducted weekly routine maintenance on the WERS system. The routine maintenance consisted of:
• Monitor the rate of oxygen consumption by recording pressure gauge readings located at the oxygen tank, and
• Open each individual needle valve to allow any moisture build-up to be removed.
• In addition, SEACOR personnel replaced the oxygen tank and faulty equipment when necessary.
Groundwater Monitoring Groundwater monitoring was conducted during every site visit from December 2004 to July 2005. Groundwater monitoring included the collection of standpipe vapours and depth to groundwater measurements. Standpipe vapour monitoring was conducted using an Eagle RKI hydrocarbon vapour analyzer calibrated to hexane and utilizing methane elimination. Depth to

groundwater and apparent light non-aqueous phase liquid (LNAPL) thickness were measured using an ORS or Heron interface probe. Collection of Field Parameters The collection of field parameters was conducted in December 2004, January, April and July of 2005 on select monitor wells. Groundwater field parameters consisted of dissolved oxygen (DO), conductivity, pH and temperature from emitter wells and monitor wells up gradient, down gradient and cross gradient of the emitter fence. During the December 2004 monitoring field parameters were measured using an OSAR 112 Multi 350i meter. Water samples were collected from each monitor well using a disposable bailer after removing a minimum of three well volumes. During the January 2005, April 2005 and July 2005 monitoring programs field parameters were collected from select monitor wells using an OSAR 112 Multi 350i meter. Water samples were collected from each monitor well using a peristaltic pump and a flow through cell. Recording of the field parameter was made after the particular parameter reached a stable value.
Geochemical Parameters Collection of groundwater samples for geochemical parameters was completed in January, April and July of 2005. Groundwater samples were submitted from monitor wells up gradient, down gradient and cross gradient of the emitter fence. The geochemical parameters included dissolved nitrate, ferrous iron and sulfate. All groundwater samples for geochemical characterization were collected using a peristaltic pump. Prior to the collection of the groundwater sample, the field parameters for DO, pH, conductivity and temperature were measured. The groundwater samples for the geochemical characterization were collected once the field parameters had stabilized.
Hydrocarbon Parameters The collection of hydrocarbon parameters was conducted in October 2004, January, April and July of 2005 on select monitor wells. Groundwater samples tested for hydrocarbons parameters included Benzene, Toluene, Ethylbenzene and Xylenes (BTEX) and hydrocarbon fractions F1 and F2. The October 2004 and January 2005 groundwater samples were collected using a purge pump to bail a minimum of three well volumes prior to sampling. Water samples were collected from the monitor well using a dedicated disposable bailer. The April 2005 and July 2005 groundwater samples were collected using a peristaltic pump. Prior to the collection of the groundwater sample, the field parameters for DO, pH, conductivity and temperature were measured. The groundwater samples for the hydrocarbon characterization were collected once the field parameters had stabilized.

PERFORMANCE MONITORING RESULTS
Oxygen Delivery System The Waterloo Emitters™ were connected to a medical oxygen tank during the October 2004 installation program. Initial follow up monitoring conducted on December 6, 2004 identified the oxygen tank was empty. It was determined that the empty tank was a result of a leaking regulator. Attempts to seal the regulator leak with liquid Teflon were unsuccessful and the regulator was replaced. Prior to field installation of the new regulator, both the regulator and the pressure gauges were leak tested. The new regulator and oxygen tank was installed on December 14, 2004. Ice buildup was identified in the LDPE lines during the December 14, 2004 site visit. The ice build up was assumed to be a result of condensation build-up inside the LDPE lines. To resolve the moisture buildup issue the following steps were implemented:
• Each Waterloo Emitter™ had a dedicated inlet LDPE line attached to a manifold system inside the Rubbermaid™ shed. Initially all the emitter wells were connected with one line in series from the oxygen tank. Connecting each emitter well with a separate line minimized the low spots in the LDPE line between emitters where moisture had collected and prevented complete shut down of oxygen release if one emitter line were to freeze,
• Each Waterloo Emitter™ had a dedicated outlet LDPE line with a brass needle valve attached to the end of the line. These separate lines created the ability to clear moisture build-up in individual emitter wells,
• Implemented the use of an extra-dry oxygen source to replace the medical grade oxygen. The extra-dry oxygen contained less than 10 ppm of moisture impurities resulting in less moisture build up, and
• A local subcontractor was hired to conduct weekly site visits to conduct pressure gauge readings on the oxygen tank and to clear moisture from the outlet LDPE lines.
During the January 2005 site visit, ice build up issues were not observed; however, it was identified that the oxygen tank was empty as a result of a faulty pressure relief valve. The pressure relief valve was replaced and a new oxygen tank was installed on January 19, 2005. Since January 19, 2005 no major oxygen delivery issues have been identified. The amount of oxygen that has been delivered to the WERS between October 2004 and January 2005 cannot be determined accurately due to the above noted maintenance issues. Since January 2005 continuous delivery of oxygen has occurred at a rate of approximately 30 L per day with the exception of approximately a 10-day period between May 13, 2005 and May 19, 2005 when a hole in the oxygen transfer line occurred during a gauge reading event and required repair.

Groundwater Monitoring Based on July 2004 to July 2005 groundwater-monitoring results, a seasonal water table fluctuation of approximately 0.2 m occurs. The groundwater highs occurred in July 2004 and July 2005 while the groundwater lows occurred in January and April of 2005. The shallow water table ranged from approximately 2.3 m to 2.5 m bgs over the one-year groundwater-monitoring period (July 2004 to July 2005). The groundwater elevation data from the 2005 monitoring events indicated groundwater flow was in a northeast direction at a hydraulic gradient of approximately 0.003 m/m, consistent with the July 2004 data.
Dissolved Oxygen Concentrations The equipment used for DO measurements collected in July 2004 as part of the baseline data were not consistent with the equipment used in December 2004, January, April and July 2005. In July 2004 DO measurements were collected using a down hole meter positioned at the center of the monitor well screens, while the performance monitoring DO measurements were collected using a peristaltic pump and flow through cell. All DO measurements were corrected to a constant temperature of 7ºC and are presented in Table 1. Background and/or upgradient DO levels (represented by BH107, south of site) measured between July 2004 and July 2005 ranged from 0.3 mg/L to 2.1 mg/L. Directly upgradient of the emitter fence (represented by BH202) DO levels ranged from 0.3 mg/L to 6.0 mg/L. Within the emitter wells (represented by BH301, BH304 and BH308) the DO levels ranged from 11.0 mg/L to 55.8 mg/L between December 2004 and July 2005. The lower DO levels measured in January and April 2005 are likely a result of emitter delivery issues associated with ice build up and equipment malfunctions. Down gradient of the emitter fence (represented by BH216 and BH104) DO levels ranged from 0.3 mg/L to 5.2 mg/L. The DO levels measured down gradient of the emitter fence were similar to the background or up gradient DO levels suggesting DO from the emitters has not significantly migrated down gradient as of July 2005.
Geochemical Parameters The results of the Geochemical testing is provided in Table 2. Dissolved nitrate concentrations measured in groundwater samples collected between July 2004 and July 2005 indicated concentrations were relatively unchanged and near non-detectable levels immediately up gradient of the emitter fence (BH202) and down gradient of the emitter fence (BH216 and BH104). Background levels of dissolved nitrate have fluctuated between 0.02 mg/L and 2.2 mg/L. Dissolved ferrous iron concentrations in the background monitor well were relatively low (less than 1 mg/L) between July 2004 and July 2005. Immediately up gradient of the emitter fence in BH202 the dissolved ferrous iron concentration has increased from near non-detectable levels in

January 2005 to 13.3 mg/L in July 2005. Dissolved ferrous iron concentrations within an emitter well (BH304) increased from 0.1 mg/L in January to 5.7 mg/L in July 2005. Down gradient of the emitter fence (BH216 and BH104) significant increases in ferrous iron concentrations have been measured since January 2005. In January the ferrous iron concentrations were less than 1 mg/L but have now increased to approximately 28 mg/L. Dissolved sulphate concentrations were relatively consistent in the background monitor well (BH107) with the exception of the April 2005 concentration. Generally, background sulphate concentrations ranged between 30 mg/L and 40 mg/L, however a sulphate concentration of 99 mg/L was measured in April of 2005. Immediately up gradient of the emitter fence sulphate concentrations were stable between 26 mg/L and 27 mg/L (BH202). Down gradient of the emitter fence (BH216 and BH104) sulphate concentrations were relatively consistent in April and July of 2005 at approximately 10 mg/L. Sulphate concentrations prior to April 2005 in BH216 and BH104 fluctuated between a low of 7 mg/L in BH104 in January of 2005 and a high of 38 mg/L in BH216 in January 2005.
Hydrocarbon Parameters Results of the hydrocarbon testing are provided in Table 3. Monitor well BH202 and BH9 completed within the dissolved phase plume up gradient of the emitter wells indicated total BTEX concentrations ranging from 14 mg/L to less than 1 mg/L. The variability of the up gradient concentrations is partly related to location of the up gradient wells in relation to the dissolved phase plume and seasonal fluctuations. Limited data were collected from the emitters wells with one sample collected in July 2005 in BH304. The total BTEX concentration was 1.9 mg/L. Downgradient of the emitter fence in BH216 total BTEX concentrations have ranged from 11.1 mg/L to 17.0 mg/L between July 2004 and July 2005, with the highest concentration measured in July 2005. Further down gradient of the emitter fence in BH104 total BTEX concentrations have ranged from 15.3 mg/L to 55.9 mg/L. The highest total BTEX concentration in BH104 was measured in April 2005 with the July 2005 total BTEX concentration measured at 52.6 mg/L. F1 and F2 concentrations have remained relatively consistent in the wells samples, regardless of location.
Additional Results Samples of the orange coloured material that surrounded the Waterloo Emitters™ from BH302, BH306, BH307 and BH308 were submitted to DBI in January 2005 for microbiological evaluation. In general, DBI indicated that anaerobic heterotrophic and iron bacteria were detected in samples collected from two of the four emitter wells, sulphate reducing bacteria in three of the four

samples, and algae (Gloeocystis confluens) at a low level was identified in one of the four samples. The bacteria population activity levels were characterized as low to moderate.
DISCUSSION OF PERFORMANCE MONITORING RESULTS
Based on the performance monitoring data collected to July 2005 the emitter fence is capable of maintaining DO concentrations in groundwater of approximately 30 mg/L. The lower DO concentrations measured in the emitter wells were during site visits where equipment malfunctions were noted and continuous oxygen delivery was likely suspended. Dissolved oxygen levels measured in the emitter wells in December of 2004 ranging between 50 mg/L and 57 mg/L were considered accurate given the saturated DO concentration of water by pure oxygen at a temperature of 5ºC is 65 mg/L. Based on the DO measurements down gradient of the emitter fence, it is apparent that dissolved oxygen from the emitters has not significantly migrated from the “fence”. These results are consisted with the BIOSCREEN modeling conducted for the site in 2004, which indicated increased DO levels would likely not be evident for 0.5 to 1.5 years. Continues delivery of oxygen has been maintained since January 2005 providing only six months of continuous delivery. It is anticipated that dissolved oxygen levels may begin to increase over the next year. Monitoring in 2006 will confirm these assumptions. The only significant pattern evident in geochemical parameter concentrations is the increase in ferrous iron in the monitor wells down gradient of the emitter fence. However, the ferrous iron concentrations upgradient of the emitter fence has also been observed. It is uncertain if the ferrous iron increases are a result of seasonal chemistry fluctuations or continued iron reduction of the BTEX plume. Additional monitoring and testing in 2006 will assist in determining the geo-chemical processes occurring at the site. Although no appreciable changes in total BTEX have been observed, these results would be considered consistent with the BIOSCREEN modeling conducted for the site in 2004 which indicated reduced BTEX levels would not be evident for 0.5 to 1.5 years.
SUMMARY Since the installation of the pilot WERS, the following observations can be made:
• Although considered a simple maintenance free system, operation of an emitter well system in cold climates requires a moisture free oxygen source and periodic line flushing to avoid ice build up. Separate lines to each emitter avoid a total system shut down in the event that ice build up does occur;
• Elevated dissolved oxygen measurements in the emitter wells (approximately 30 mg/L) relative to surrounding monitor wells indicate oxygen delivery by diffusion through the silicon tubing into the formation is successful;
• Dissolved oxygen levels in monitor wells within the dissolved phase plume and downgradient of the emitter wells has not significantly increased;

• BTEX, F1 and F2 concentrations within the dissolved phase plume have not significantly decreased to suggest a long term trend has been established;
• A minimal amount of biomass accumulation of anaerobic, sulfate reducing and iron related bacteria were identified on the Waterloo Emitters™. Semi annual cleaning of the emitters with a weak acid solution is required; and
• Additional monitoring data in 2006 will be conducted to determine if the WERS is enhancing biodegradation and long-term reduction of the dissolved phase plume concentrations.
Authors: Douglas Sweeney, M.Sc., P.Eng. Mr. Sweeney is a senior engineer with over 18 years of experience in the environmental and geo-environmental consulting industry. His areas of expertise include soil and water contaminant assessments and investigations, site remediation evaluation, design and implementation, groundwater and contaminant transport modeling, geotechnical and hydrogeological investigations, risk assessments, and unsaturated soil mechanics. Mr. Sweeney is SEACOR’s Prairie Region Manager. Ian Young, C. Tech., Project Technician Mr. Young is the SEACOR project manager of the site and has worked in various capacities at the site since the environmental assessment period in 2004. He has been directly involved with the historical review, drilling investigations, and the collection of field data for the evaluation of the effectiveness of the Waterloo Emitter System. He field supervised the installation of the Emitter wells, and completed the installation of the equipment and infrastructure at the site. Mr. Young has been responsible for the continued operations and maintenance of the equipment as well as the monitoring programs for determining the remediation progress. REFERENCES Nyer E.K., M. E. Duffin. 1997. The State of the Art of Bioremediation. Groundwater Monitoring and Remediation, v 27, no. 2 (Spring, 1997), p.64-69. Sweeney D.S., Mitchell I. 2004. In-situ Bioremediation Evaluation Using the Waterloo EmitterTM, proceeding of 2004 Remediation Technologies Symposium, Banff, Alberta. Wiedemeier, T.H., J.T. Wilson, D.H.Kampbell, R.N. Miller, and J.E. Hanson. 1995. Technical protocol for implementing intrinsic remediation with long-term monitoring for natural attenuation of fuel contamination dissolved in groundwater. San Antonio, Texas: U.S. Air Force Center for Environmental Excellence. Waterloo Emitter™ web page 2004. http://www.waterlooemitter.com

BH107 July 19, 2004 0.3December 21, 2004 2.1January 21, 2005 1.9April 18, 2005 0.3July 19, 2005 0.5
BH202 July 23, 2004 0.6December 21, 2004 6.0January 21, 2005 2.1April 18, 2005 0.4July 19, 2005 0.3
BH301 December 21, 2004 50.7January 21, 2005 27.8April 18, 2005 22.8July 19, 2005 34.9
BH304 December 21, 2004 55.8January 21, 2005 11.0January 21, 2005 30.1April 18, 2005 23.3July 19, 2005 37.6
BH308 December 21, 2004 48.8January 21, 2005 23.2April 18, 2005 21.8July 19, 2005 34.9
BH104 July 23, 2004 0.3December 21, 2004 2.3January 21, 2005 1.8April 18, 2005 0.4July 19, 2005 0.3
BH216 December 21, 2004 5.2January 21, 2005 1.0April 18, 2005 0.3July 19, 2005 0.3
Notes:* Dissolved Oxygen has been corrected to 7 degrees Celcius.
TABLE 1: SUMMARY OF GROUNDWATER FIELD PARAMETERS
Sample ID Date *Dissolved Oxygen (mg/ L)
Background
Dissolved Phase Plume - Upgradient
Waterloo Emitter Wells
Dissolved Phase Plume - Downgradient

Sample ID Date Dissolved Ferrous Iron Dissolved Nitrate Dissolved Sulfate
BH107 July 19, 2004 0.02 0.02 30January 18, 2005 <0.01 0.41 41
April 18, 2005 0.68 2.2 99July 20, 2005 0.26 0.8 33.5
BH202 July 22, 2004 3.31 < 0.005 27January 18, 2005 0.03 0.06 26
April 18, 2005 12.7 0.04 26.1July 20, 2005 13.3 < 0.2 27.3
BH304 January 18, 2005 0.11 0.04 78July 20, 2005 5.67 < 0.2 23.4
BH104 July 19, 2004 4.2 0.022 8January 18, 2005 0.58 0.66 7
April 18, 2005 23.8 0.24 19.0July 20, 2005 27.7 < 0.2 10.4
BH216 January 19, 2005 0.62 0.03 38April 18, 2005 24.2 0.62 10.2
Dissolve Phase Plume - Downgradient
Table 2: SUMMARY OF GROUNDWATER ANALYTICAL RESULTS - GEOCHEMICAL PARAMETERS (mg/L) (July 2004 - July 2005)
Background
Dissolved Phase Plume - Upgradient
Waterloo Emitter Wells
Monitor Well Date Sampled
Standpipe Vapour
Concentration*
(ppm)
Benzene (mg/L)
Toluene (mg/L)
Ethyl-benzene (mg/L)
Xylenes (mg/L) Total BTEX
F1-BTEX(C6-C10)
F2(>C10-C16)
BH107 July 20, 2005 225 < 0.0005 0.0027 0.0007 0.003 0.01 < 0.1 < 0.1April 18, 2005 160 0.0544 0.191 0.0152 0.0999 0.4 < 0.1 < 0.1
January 18, 2005 270 < 0.0005 < 0.0005 < 0.0005 < 0.0005 < 0.0005 < 0.1 < 0.1December 22, 2004 100 0.002 0.0025 0.0014 0.002 0.01 < 0.1 < 0.1
July 23, 2004 110 < 0.0005 < 0.0005 < 0.0005 < 0.0005 < 0.0005 < 0.1 < 0.1
BH9July 23, 2004 100 6.05 5.3 0.429 2.63 14.4 10.5 1.6
October 21, 2004 140 1.05 1.55 0.262 1.27 4.1 1.5 0.4July 20, 2005 210 2.27 5.03 0.46 2.44 10.2 < 0.1 0.8
BH202 July 23, 2004 2,450 0.278 0.707 0.113 0.521 1.6 1.9 0.8October 21, 2004 100 0.144 0.234 0.0328 0.081 0.5 < 0.1 < 0.1
July 20, 2005 140 0.0261 0.0821 0.0147 0.0497 0.2 < 0.1 < 0.1
BH304 July 20, 2005 160 0.511 0.74 0.0626 0.546 1.9 < 0.1 0.2
BH104July 24, 2004 >10,000 8.28 19.1 1.01 6.52 34.9 < 0.1 1.9
October 21, 2004 >10,000 14 27.4 1.62 8.81 51.8 < 0.1 2.1January 18, 2005 >10,000 3.72 7.75 0.554 3.28 15.3 < 0.1 1
April 18, 2005 >10,000 15.7 29.5 1.45 9.29 55.9 < 0.1 2.6July 20, 2005 >10,000 14 27.1 1.56 9.93 52.6 < 0.1 2.5
BH216 October 21, 2004 660 5.38 1.98 0.809 2.92 11.1 1.2 0.8January 19, 2005 180 6.19 2.66 0.918 2.3 12.1 < 0.1 0.7
April 18, 2005 5 5.43 7.18 0.647 3 16.3 < 0.1 0.4July 20, 2005 160 6.52 6.69 0.604 3.23 17.0 < 0.1 0.8
Dissolve Phase Plume - Downgradient
TABLE 3: SUMMARY OF GROUNDWATER ANALYTICAL RESULTS - HYDROCARBONS
Background
Dissolved Phase Plume - Upgradient
Waterloo Emitter Wells


SITE PHOTOGRAPHS
Photo 1: Drilling of the Waterloo Emitters using hollow stem auger in October 2004.
Photo 5: Photo of seven completed Waterloo Emitter™ Monitor Wells.
Photo 2: The 150 mm screen portion of the monitor well. Schedule 40 PVC screen was manufactured by drilling holes on the circumference of the pipe and then wrapping the solvent welding tapered PVC wire around the outside diameter of the pipe.
Photo 4: Installation of the Waterloo Emitter™ Well. Due to the weight of the PVC casing a hoist plug
Photo 3: Photo of the Waterloo Emitter™ Monitor Well. Note the 2’ section of solid PVC with a bottom cap to be used as a sump if needed.
was utilized to install the monitor well safely.
SITE PHOTOGRAPHS
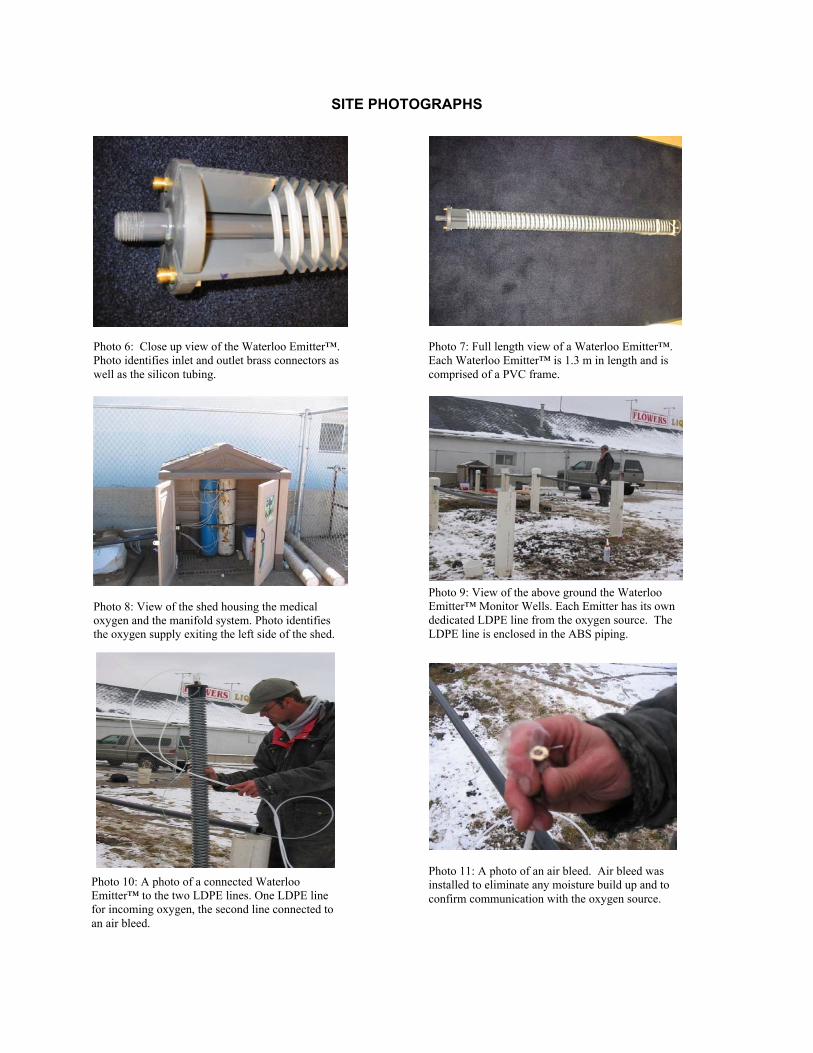
Photo 6: Close up view of the Waterloo Emitter™. Photo identifies inlet and outlet brass connectors as well as the silicon tubing.
Photo 10: A photo of a connected Waterloo
Emitter™ to the two LDPE lines. One LDPE line for incoming oxygen, the second line connected to an air bleed.
Photo 7: Full length view of a Waterloo Emitter™. Each Waterloo Emitter™ is 1.3 m in length and is comprised of a PVC frame.
Photo 9: View of the above ground the Waterloo Emitter™ Monitor Wells. Each Emitter has its own dedicated LDPE line from the oxygen source. The LDPE line is enclosed in the ABS piping.
Photo 8: View of the shed housing the medical oxygen and the manifold system. Photo identifies the oxygen supply exiting the left side of the shed.
Photo 11: A photo of an air bleed. Air bleed was installed to eliminate any moisture build up and to confirm communication with the oxygen source.