instacart by tharun kanamneni g01235383
TRANSCRIPT
G01235383 THARUN KANAMNENI
AIT 580 BIG DATA ANALYTICS PROJECT
FINAL PROJECT REPORT ON
INSTACART
BY THARUN KANAMNENI
G01235383
Page of 1 21
G01235383 THARUN KANAMNENI
The dataset I have selected is Instacart which is about 800mb of data which includes data of
aisles, departments, orders and products. Some of the data types are strings and integer values.
ABOUT: Instacart is US Software firm which delivers groceries which are ordered online and
values at $8 billion and operates as same-day grocery delivery and pickup service in the U.S and
Canada.[3] [4]
NEED: The data was collected to understand and analyze which products the consumers will
purchase again based on past orders, what are some of the most reordered items and some more
interesting findings about the orders and the products.[4]
PRIVACY :All the customer data is anonymized for privacy, and as it is posted by Instacart
itself, it doesn’t have any privacy issues and ethical issues.[4]
A structured collection of data representing customer orders over time is the dataset and it was
posted by the Instacart as open source of 3 million grocery orders from more than 200,000
orders.[3][4] It also includes the data of the week and hour of the day order was placed.
TYPES OF DATATYPES :There are various attributes present in the dataset, they are order
hour of the day, order day of the week, eval_set, days since prior order, product_id,
product_type, reordered.
order_id, product_id, order_day_of_week, days_since_prior_order :Numeric
product_name, department_name : Nominal
eval_set :Categorical
The dataset of orders has about 3.4 million rows, and order_products has about 30 million rows.
Page of 2 21
G01235383 THARUN KANAMNENI
Some of the questions i got to solve are :
1) what are the products that are sold the most?
2) what are the most reordered items?
3) How many orders are placed in the morning around 10am to 12pm?
Some of the software resources needed to study this data are :
- R analytics for data exploration and visualization
- Python analytics for data exploration
- SQL Work Bench
The Hardware I am using :
Processor: 2.6 GHz 6-Core Intel Core i7, 9th Gen
Memory : 16 GB 2400 MHz DDR4
I have previously used ggplot2, SQL, R and Python in my assignments and did various
visualizations, so in order to improve more and work with more large data, I take this as an
opportunity to learn more and improve my skills.
Page of 3 21
G01235383 THARUN KANAMNENI
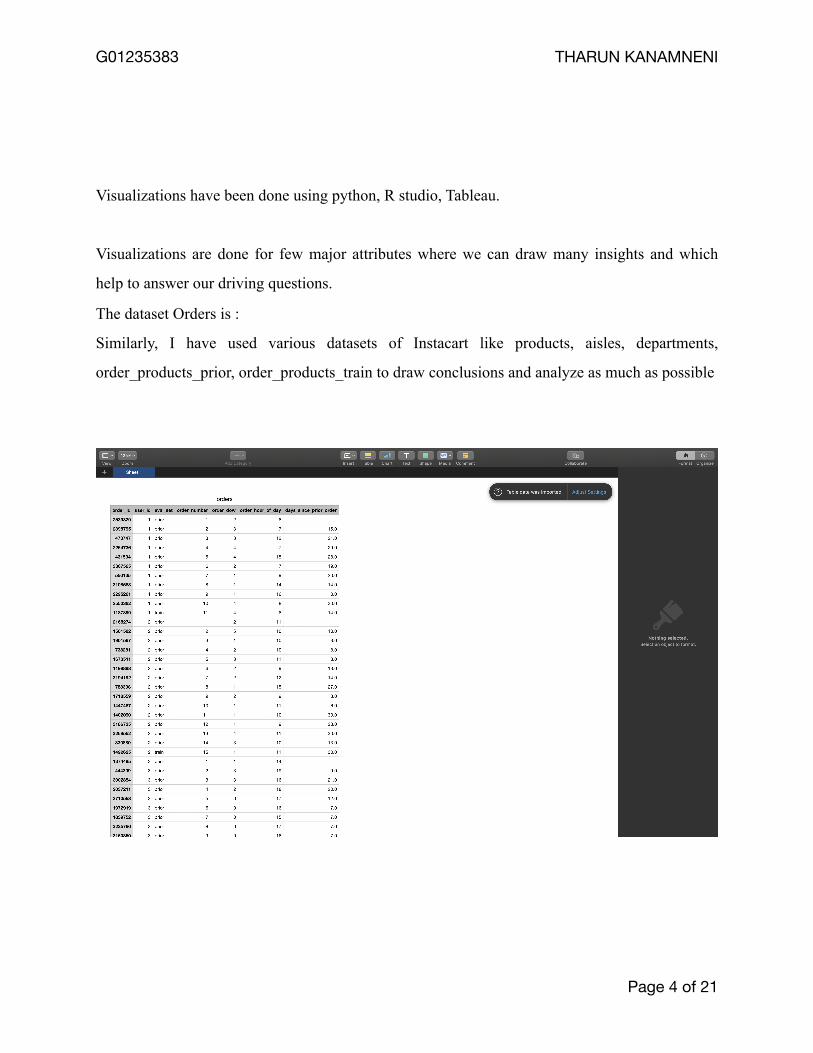
Visualizations have been done using python, R studio, Tableau.
Visualizations are done for few major attributes where we can draw many insights and which
help to answer our driving questions.
The dataset Orders is :
Similarly, I have used various datasets of Instacart like products, aisles, departments,
order_products_prior, order_products_train to draw conclusions and analyze as much as possible
Page of 4 21
G01235383 THARUN KANAMNENI
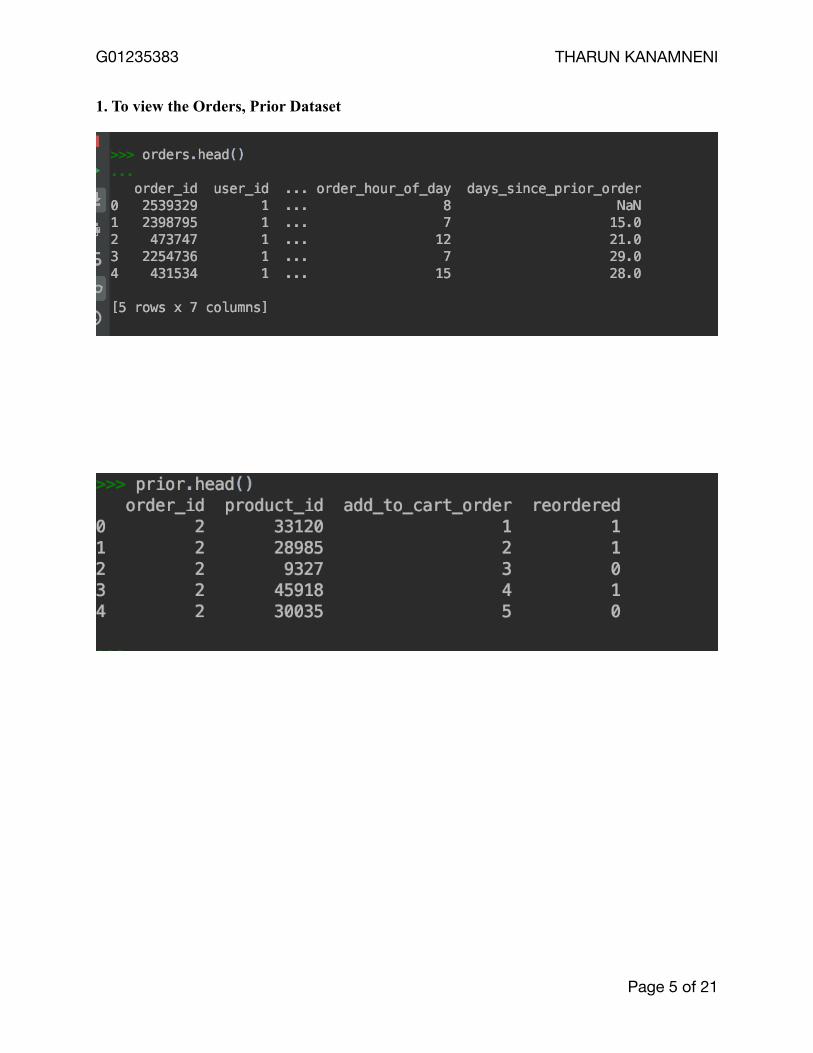
1. To view the Orders, Prior Dataset
Page of 5 21
G01235383 THARUN KANAMNENI
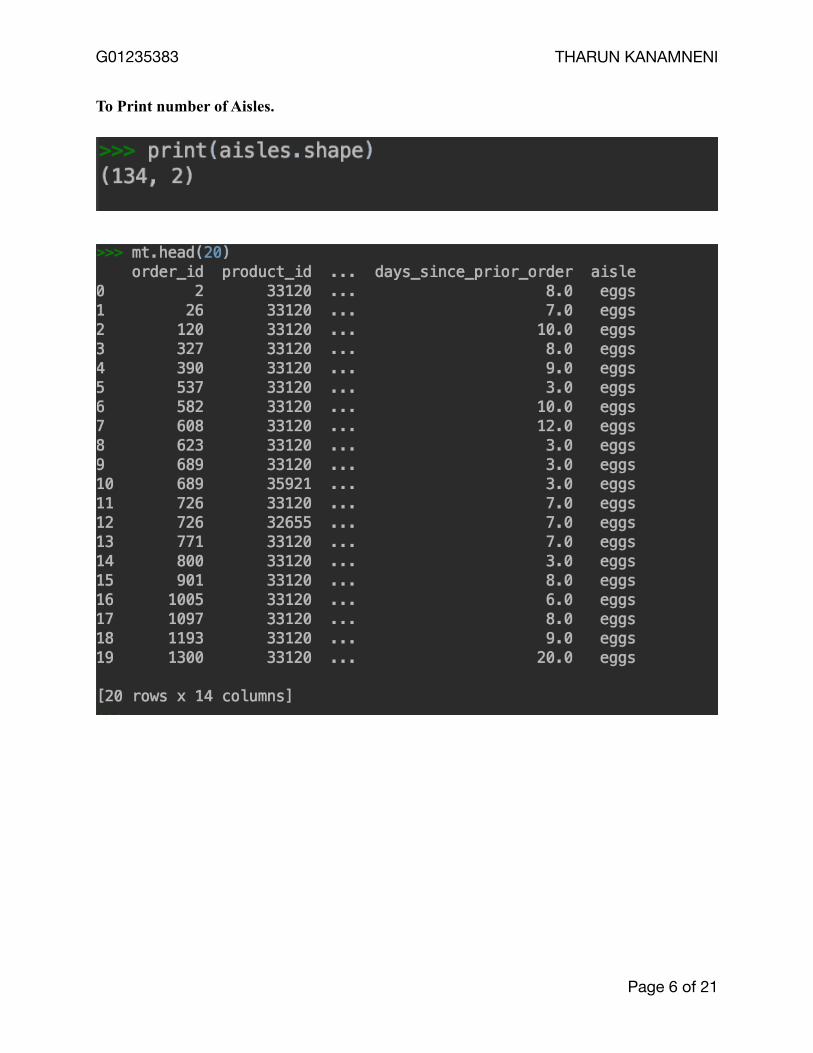
To Print number of Aisles.
Page of 6 21
G01235383 THARUN KANAMNENI
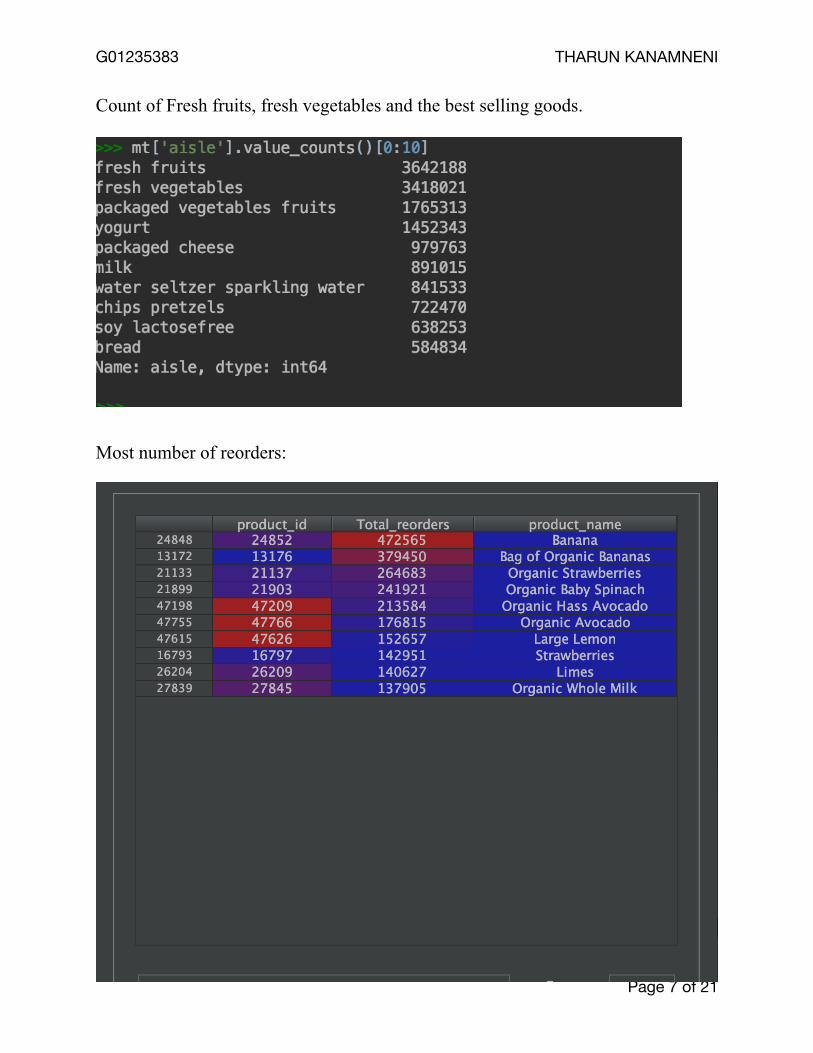
Count of Fresh fruits, fresh vegetables and the best selling goods.
Most number of reorders:
Page of 7 21
G01235383 THARUN KANAMNENI
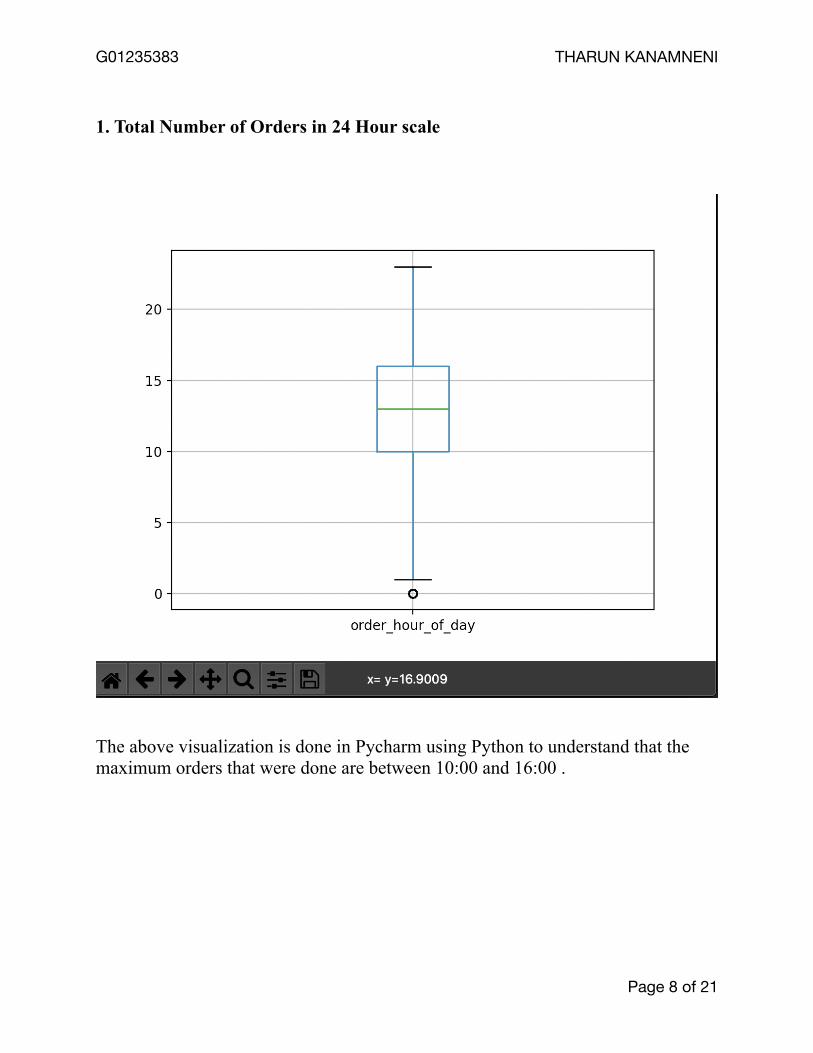
1. Total Number of Orders in 24 Hour scale
The above visualization is done in Pycharm using Python to understand that the maximum orders that were done are between 10:00 and 16:00 .
Page of 8 21
G01235383 THARUN KANAMNENI
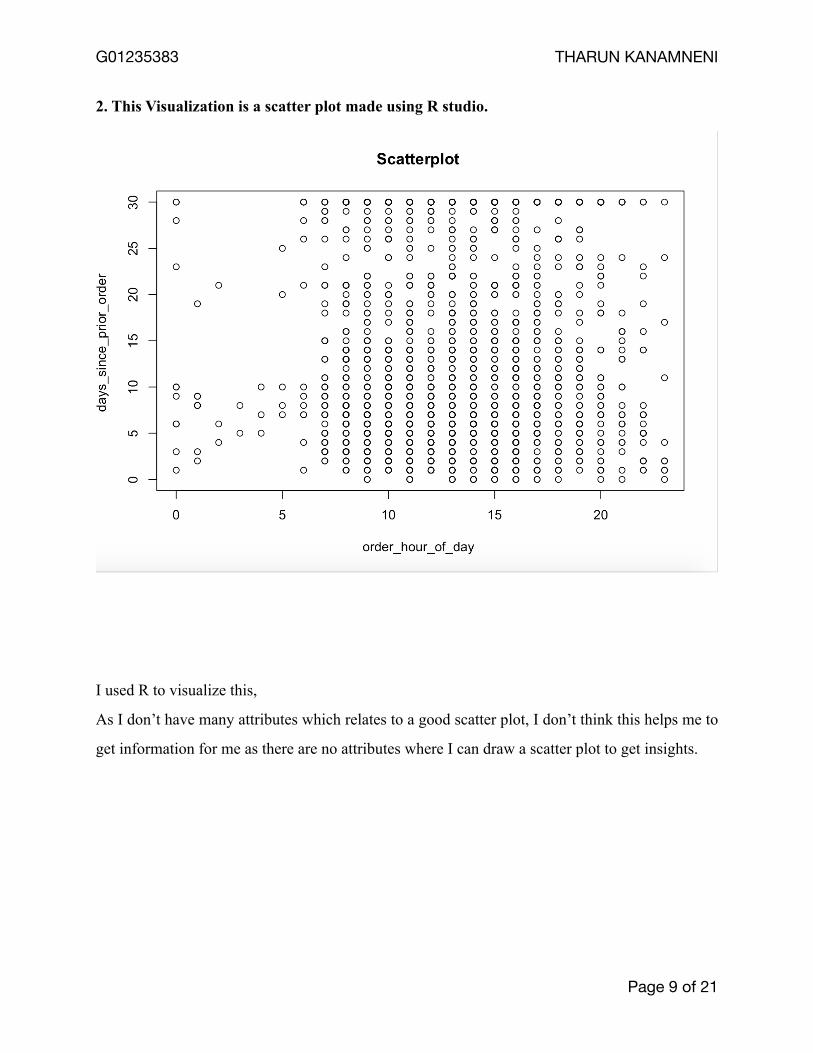
2. This Visualization is a scatter plot made using R studio.
I used R to visualize this,
As I don’t have many attributes which relates to a good scatter plot, I don’t think this helps me to
get information for me as there are no attributes where I can draw a scatter plot to get insights.
Page of 9 21
G01235383 THARUN KANAMNENI
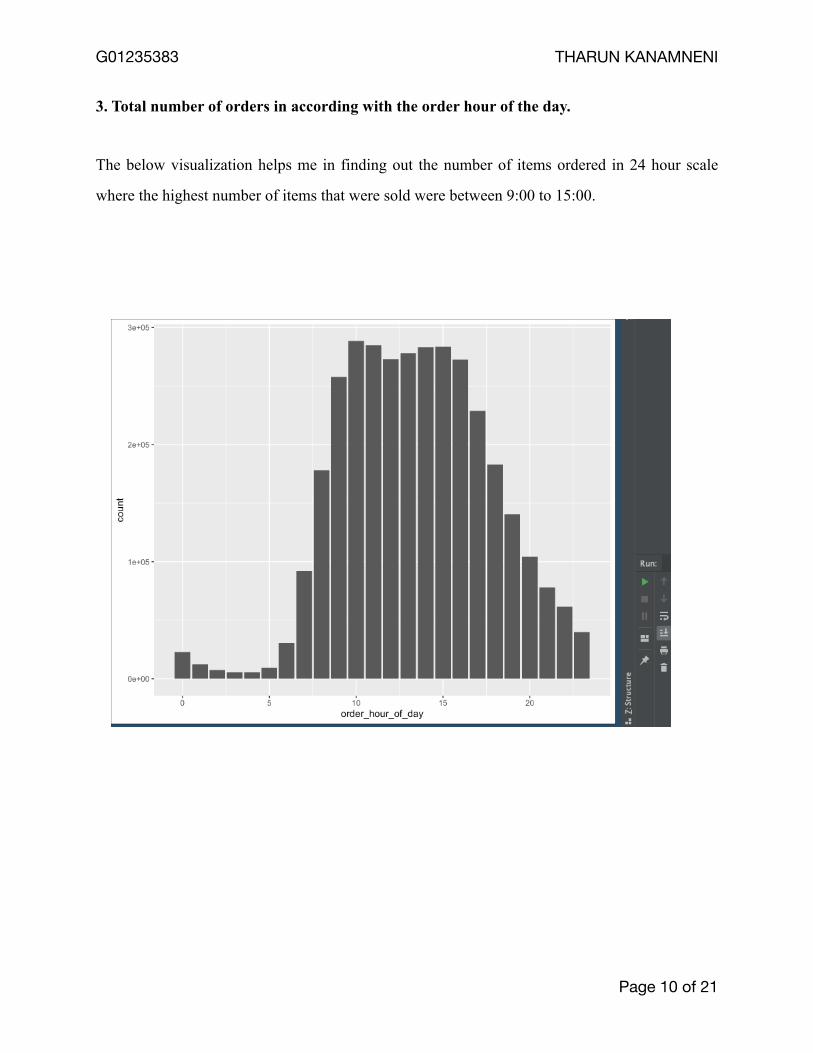
3. Total number of orders in according with the order hour of the day.
The below visualization helps me in finding out the number of items ordered in 24 hour scale
where the highest number of items that were sold were between 9:00 to 15:00.
Page of 10 21
G01235383 THARUN KANAMNENI
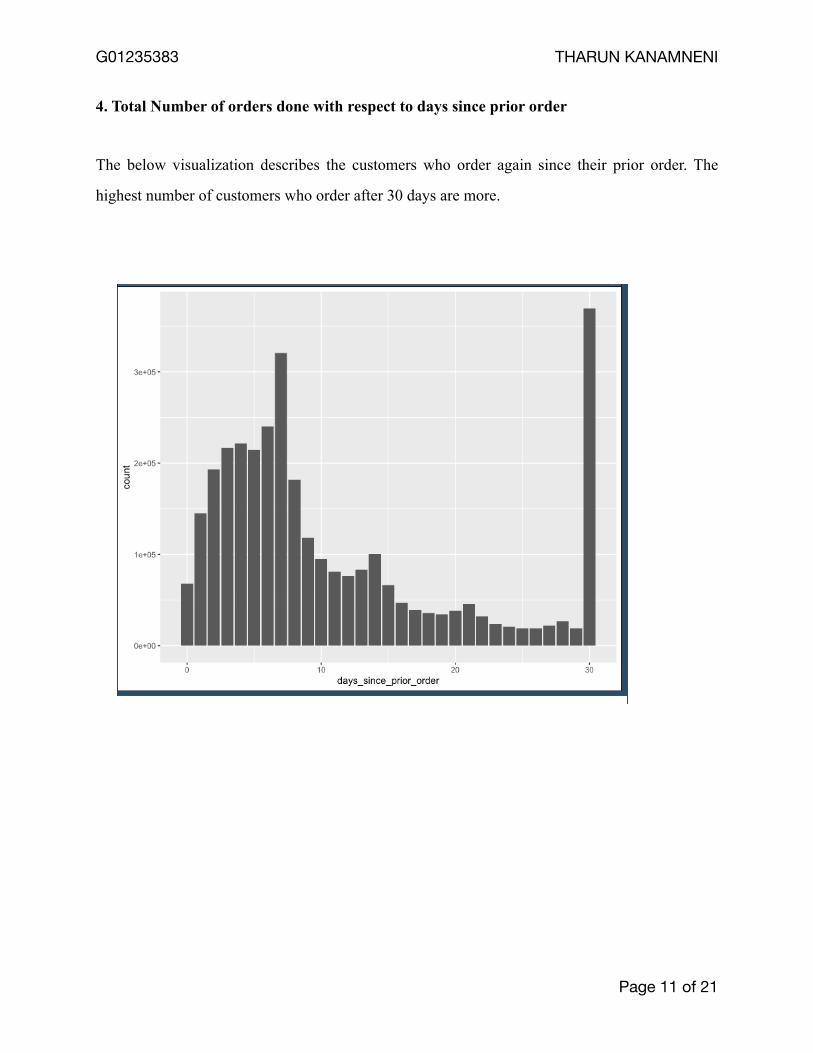
4. Total Number of orders done with respect to days since prior order
The below visualization describes the customers who order again since their prior order. The
highest number of customers who order after 30 days are more.
Page of 11 21
G01235383 THARUN KANAMNENI
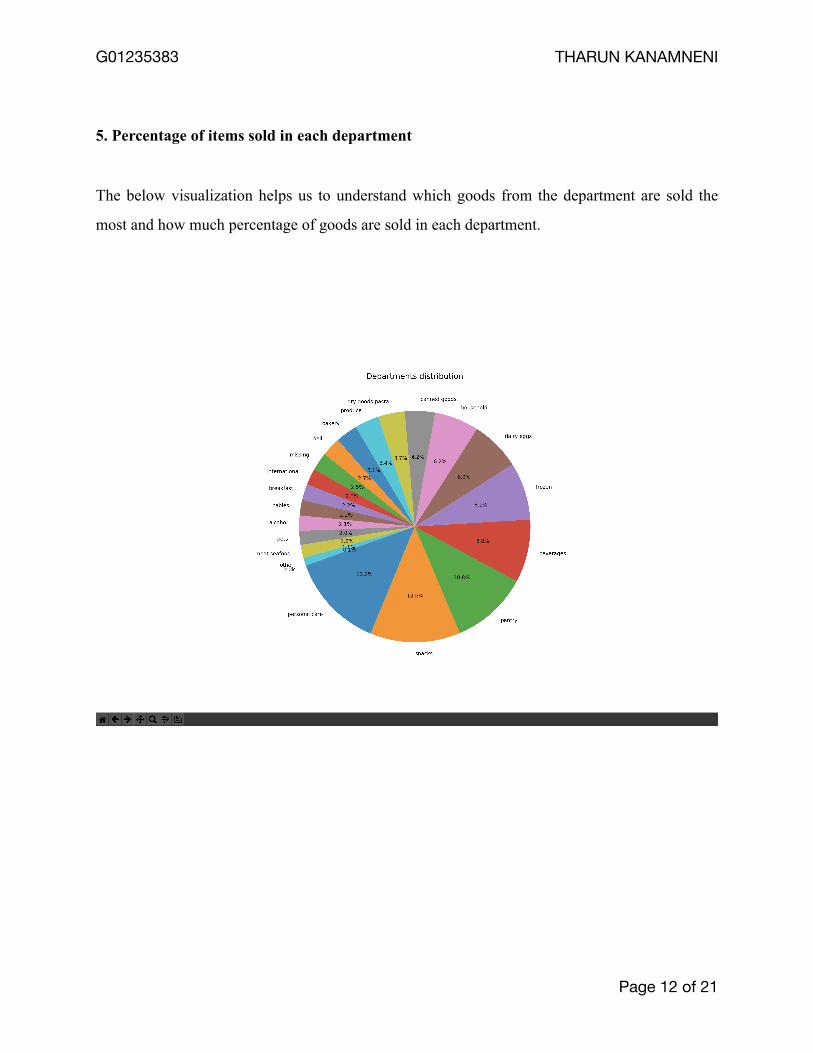
5. Percentage of items sold in each department
The below visualization helps us to understand which goods from the department are sold the
most and how much percentage of goods are sold in each department.
Page of 12 21
G01235383 THARUN KANAMNENI
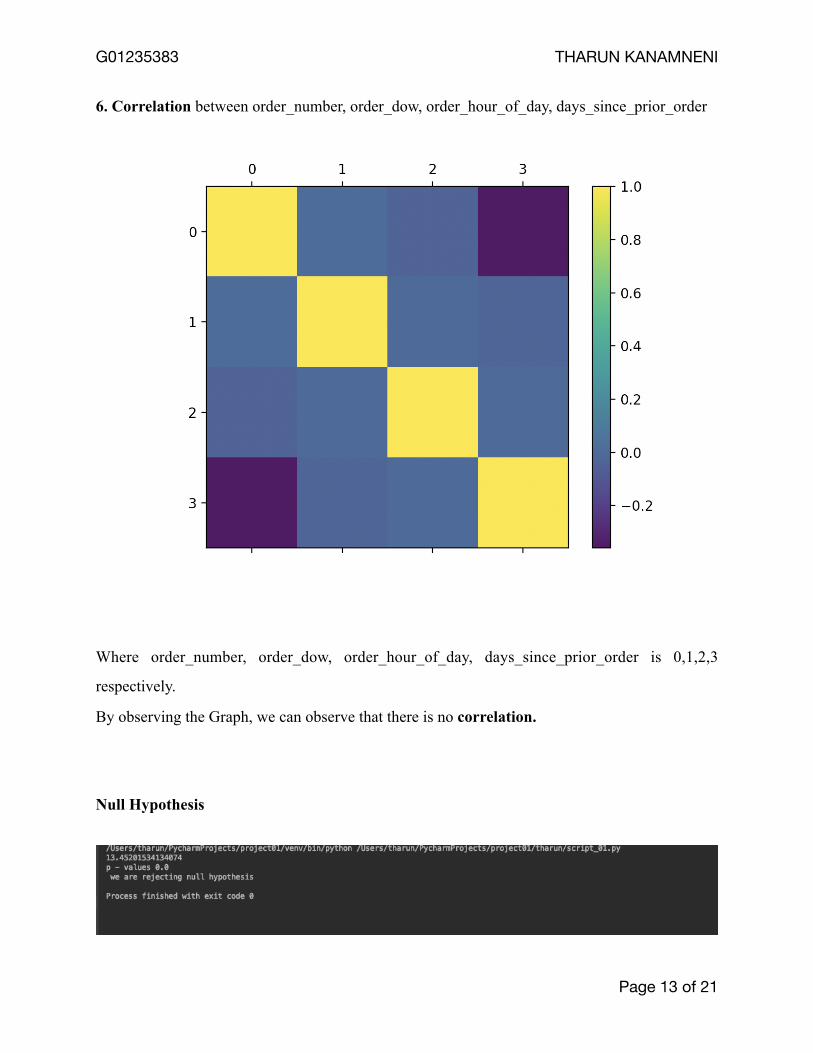
6. Correlation between order_number, order_dow, order_hour_of_day, days_since_prior_order
Where order_number, order_dow, order_hour_of_day, days_since_prior_order is 0,1,2,3
respectively.
By observing the Graph, we can observe that there is no correlation.
Null Hypothesis
Page of 13 21
G01235383 THARUN KANAMNENI
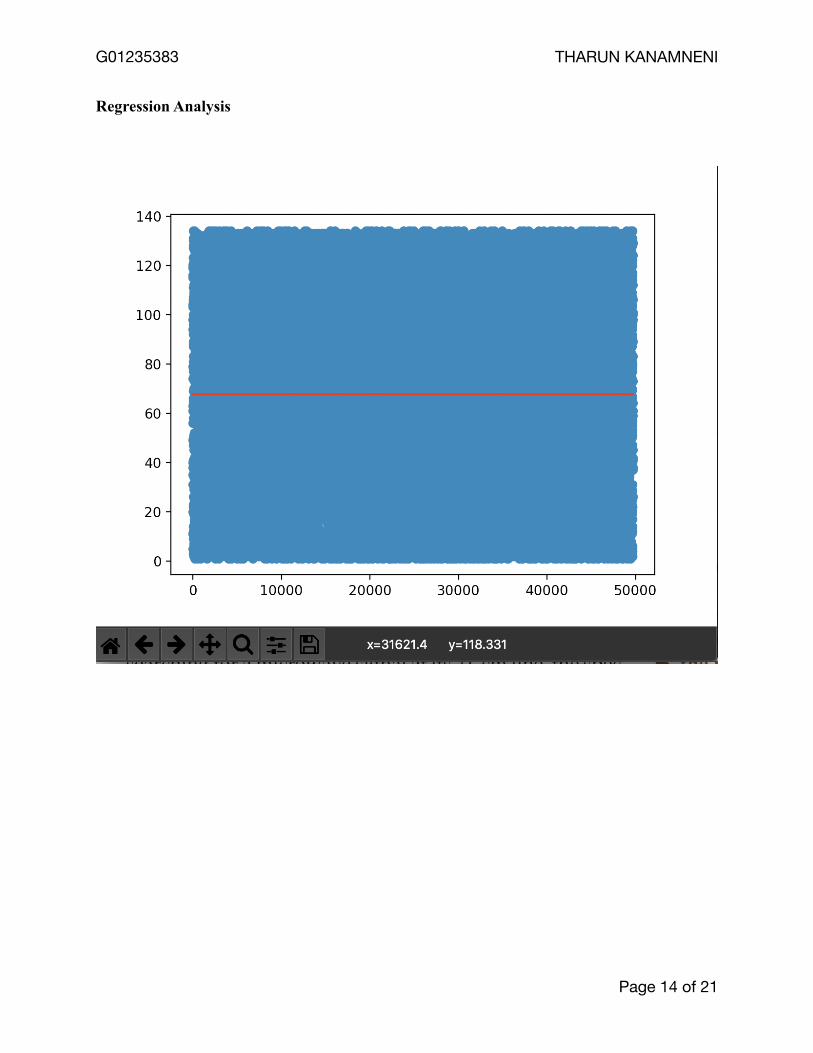
Regression Analysis
Page of 14 21
G01235383 THARUN KANAMNENI
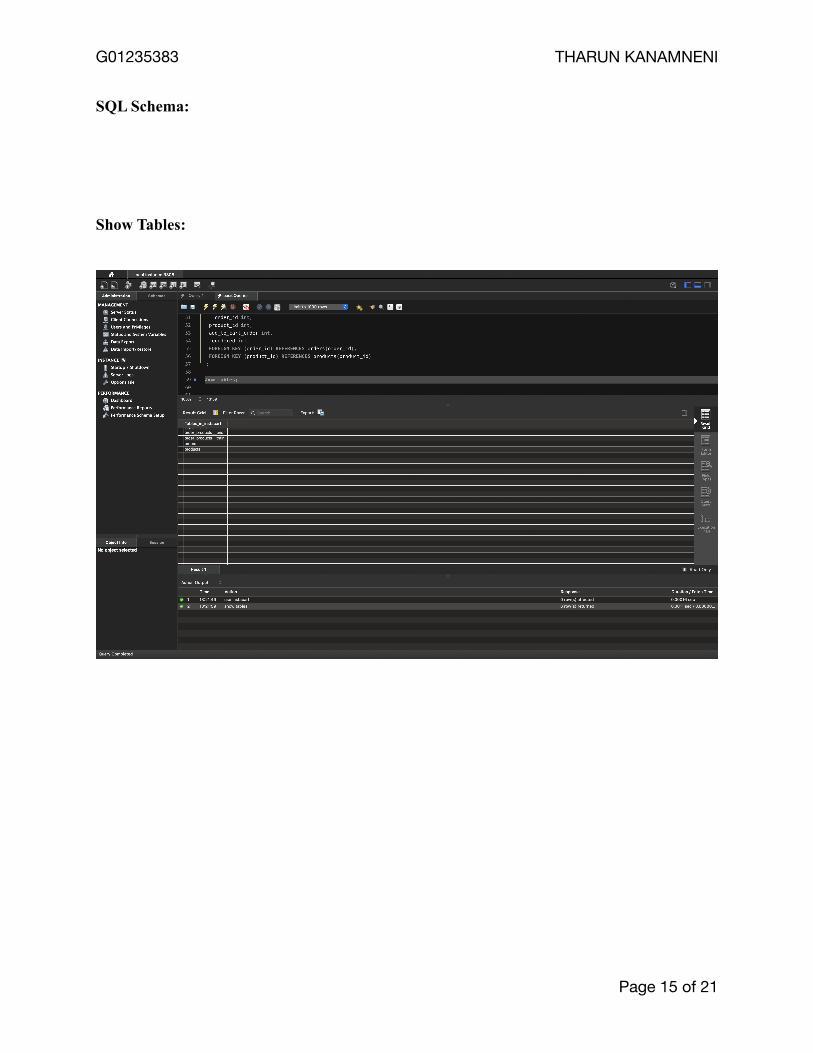
SQL Schema:
Show Tables:
Page of 15 21
G01235383 THARUN KANAMNENI
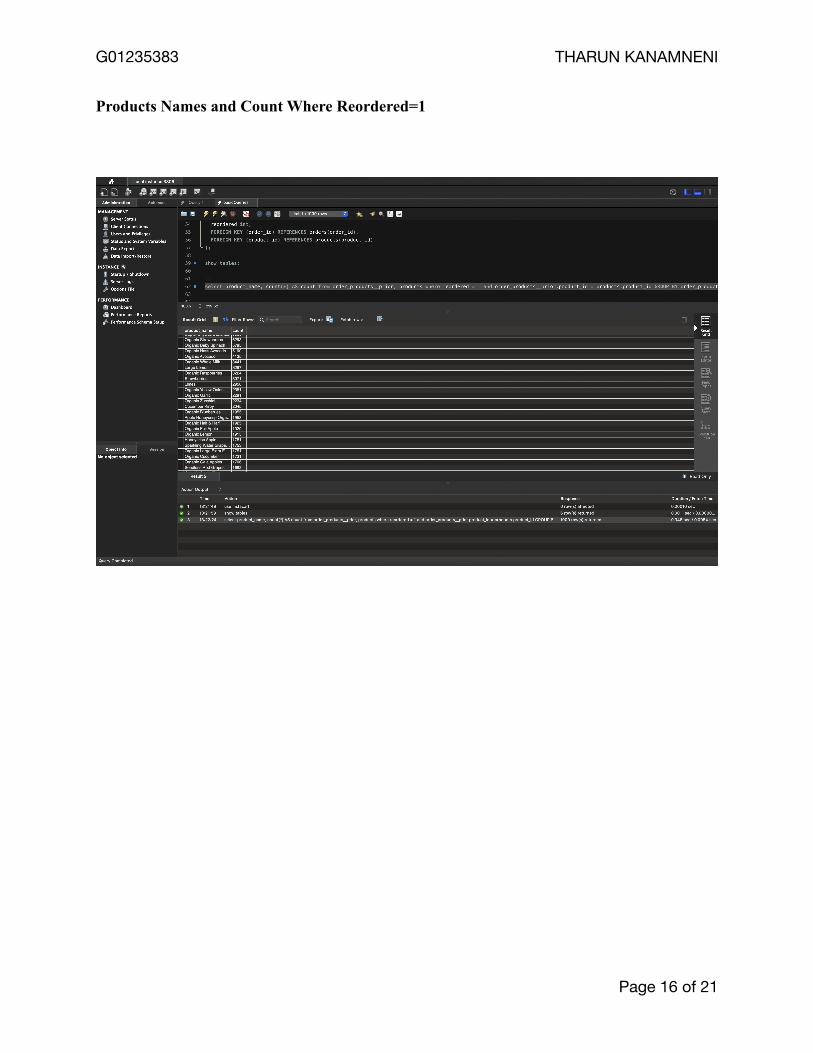
Products Names and Count Where Reordered=1
Page of 16 21
G01235383 THARUN KANAMNENI
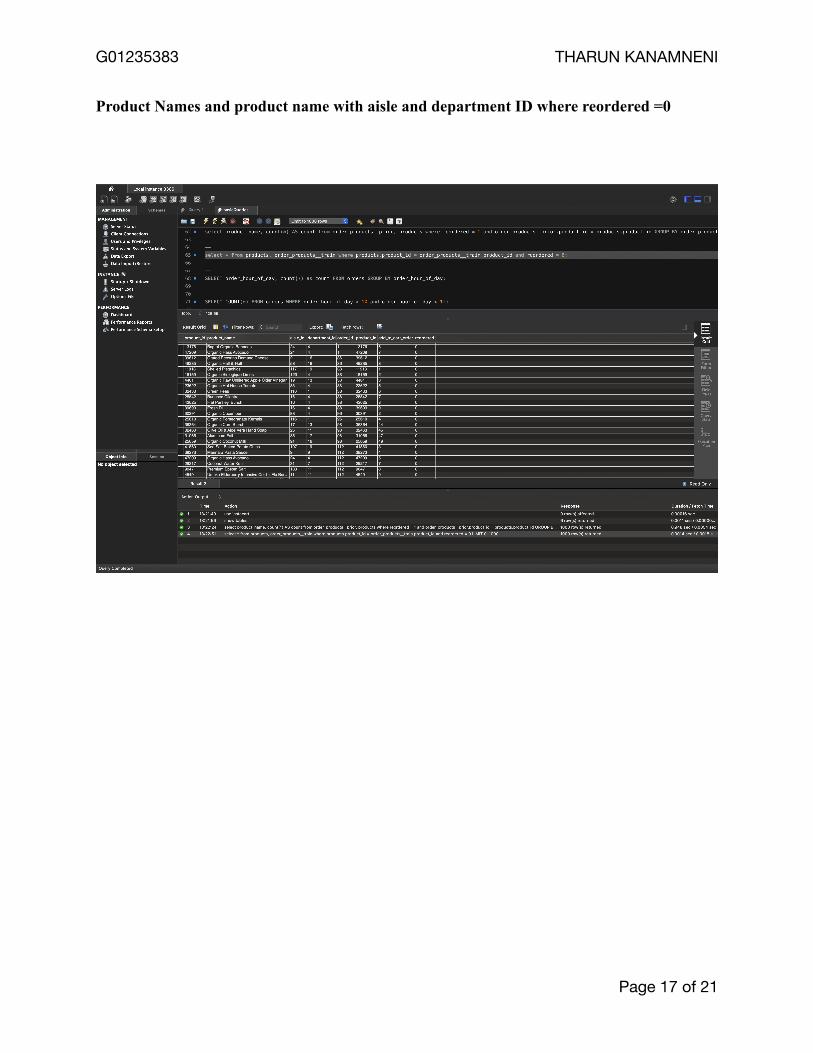
Product Names and product name with aisle and department ID where reordered =0
Page of 17 21
G01235383 THARUN KANAMNENI
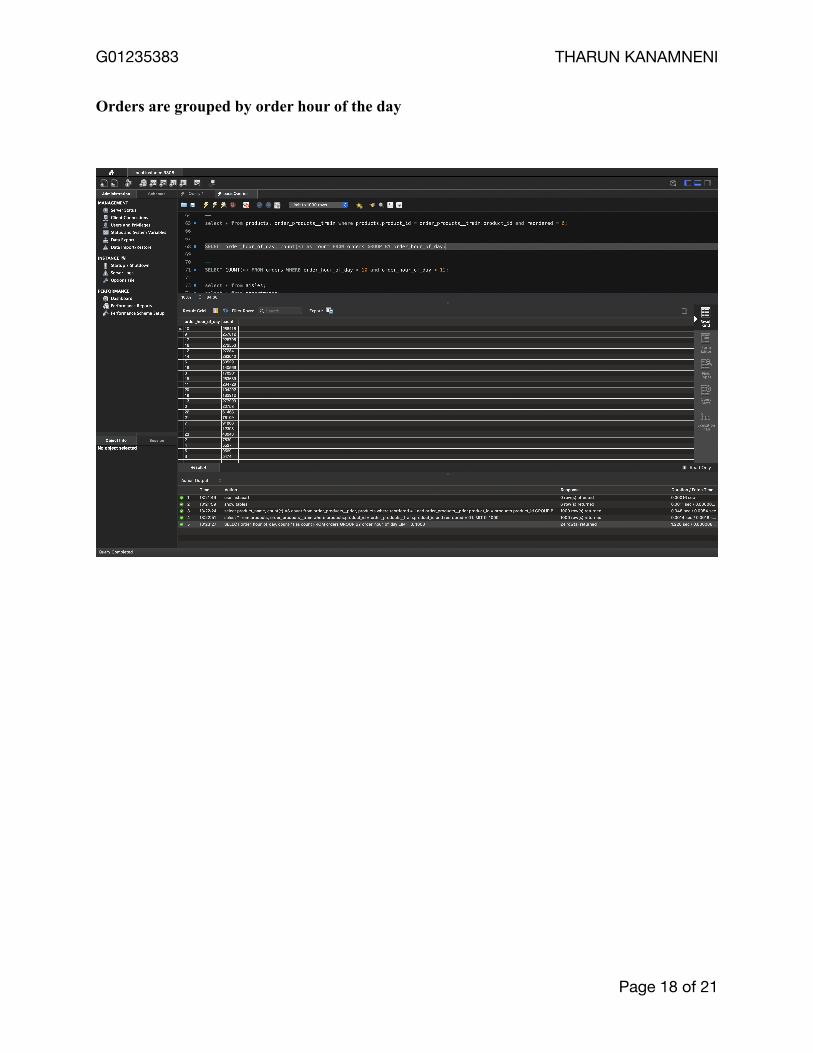
Orders are grouped by order hour of the day
Page of 18 21
G01235383 THARUN KANAMNENI
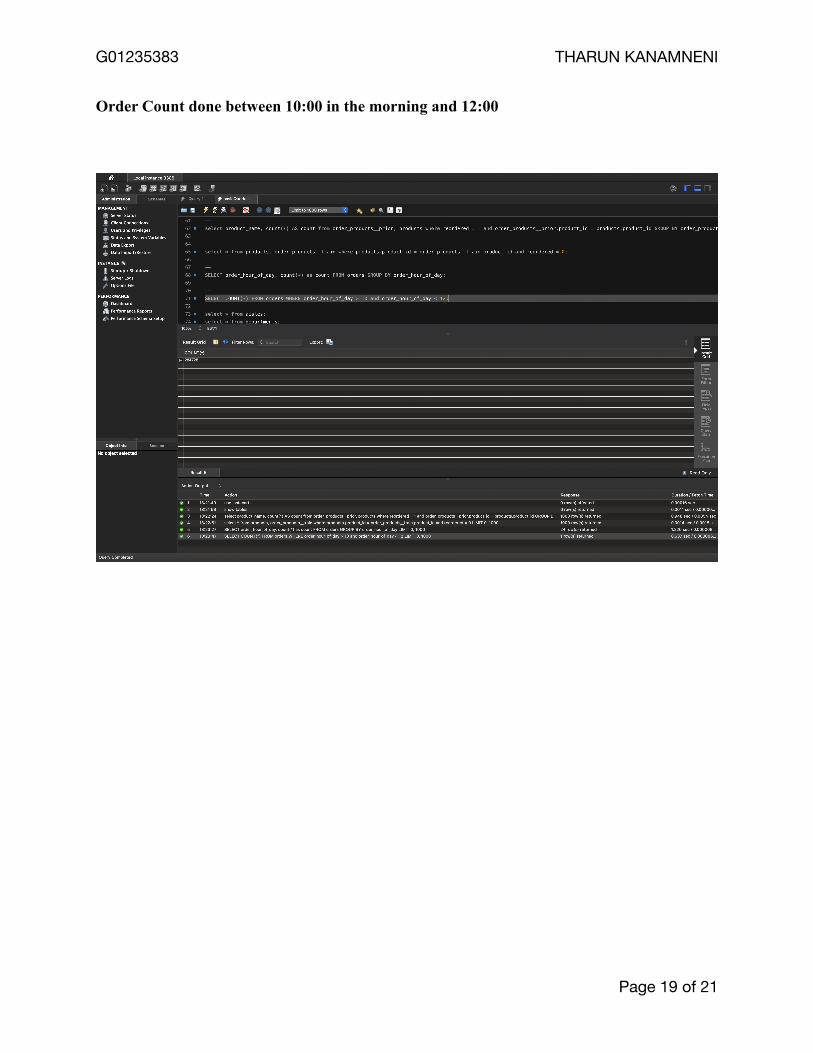
Order Count done between 10:00 in the morning and 12:00
Page of 19 21
G01235383 THARUN KANAMNENI
CONCLUSION:
From above visualizations, we can observe that the most products sold, and interesting insights,
which are drawn from graphs. It is good to understand which are the products the customer need
more, and what times do the customers order more so that more employees can be employed in
that stipulated time. It also shows how many customers reordered the items at least once and how
many customer didn’t reorder.
Page of 20 21
G01235383 THARUN KANAMNENI
REFERENCES:
References:
[1] “The Instacart Online Grocery Shopping Dataset 2017”, Accessed from https://
www.instacart.com/datasets/grocery-shopping-2017 [Accessed: 21-Nov-2019]
[2] “Instacart Market Basket Analysis.” [Online]. Available: https://kaggle.com/c/instacart-
market-basket-analysis. [Accessed: 21-Nov-2019]
[3] “What Is Instacart? A Guide on How to Use the Grocery Delivery App,” Digital Trends, 19-Sep-2018. [Online]. Available: https://www.digitaltrends.com/home/what-is-instacart/. [Accessed: 21-Nov-2019]
[4] J. Stanley, “3 Million Instacart Orders, Open Sourced,” Medium, 04-May-2017. [Online]. Available: https://tech.instacart.com/3-million-instacart-orders-open-sourced-d40d29ead6f2. [Accessed: 21-Nov-2019]
Page of 21 21