inspire: raltegravir (isentress) pilot study in relapsing ms · ross ca et al., bmj, 1965. mumps...
TRANSCRIPT

INSPIRE Raltegravir (Isentress) Pilot Study in Relapsing MS
Dr Jean-Martin Charcot
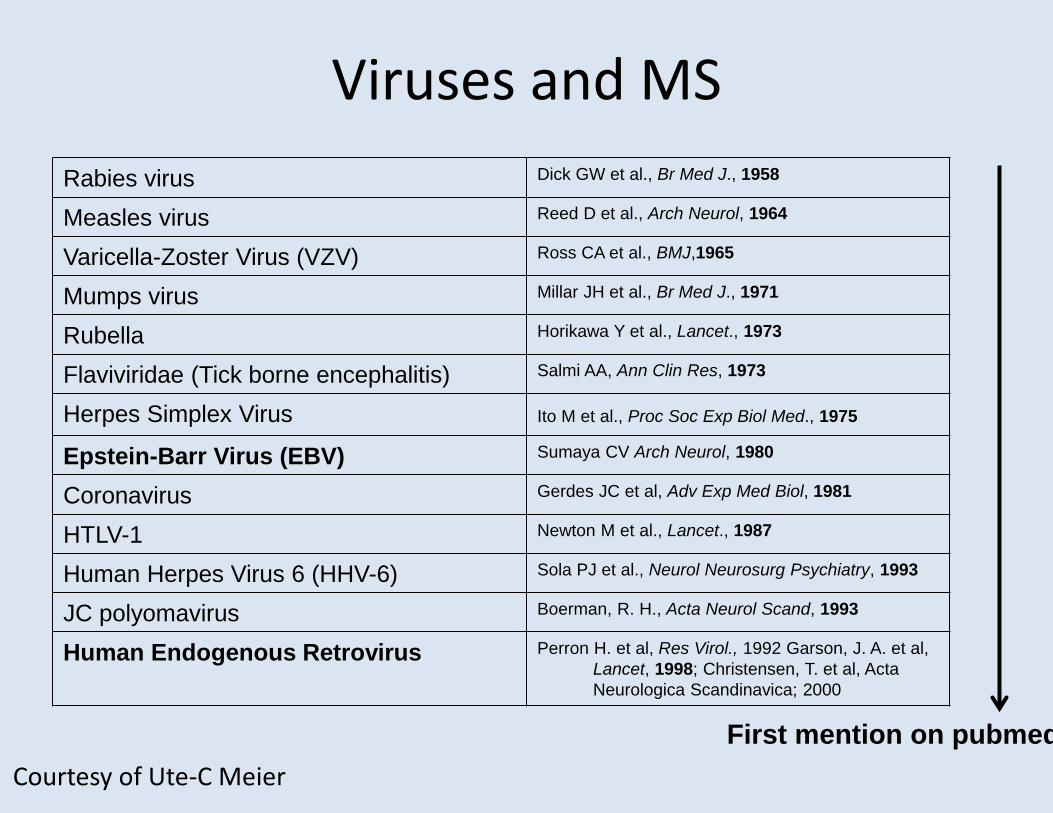
Viruses and MSRabies virus Dick GW et al Br Med J 1958
Measles virus Reed D et al Arch Neurol 1964
Varicella-Zoster Virus (VZV) Ross CA et al BMJ1965
Mumps virus Millar JH et al Br Med J 1971
Rubella Horikawa Y et al Lancet 1973
Flaviviridae (Tick borne encephalitis) Salmi AA Ann Clin Res 1973
Herpes Simplex Virus Ito M et al Proc Soc Exp Biol Med 1975
Epstein-Barr Virus (EBV) Sumaya CV Arch Neurol 1980
Coronavirus Gerdes JC et al Adv Exp Med Biol 1981
HTLV-1 Newton M et al Lancet 1987
Human Herpes Virus 6 (HHV-6) Sola PJ et al Neurol Neurosurg Psychiatry 1993
JC polyomavirus Boerman R H Acta Neurol Scand 1993
Human Endogenous Retrovirus Perron H et al Res Virol 1992 Garson J A et al Lancet 1998 Christensen T et al Acta Neurologica Scandinavica 2000
First mention on pubmedCourtesy of Ute-C Meier
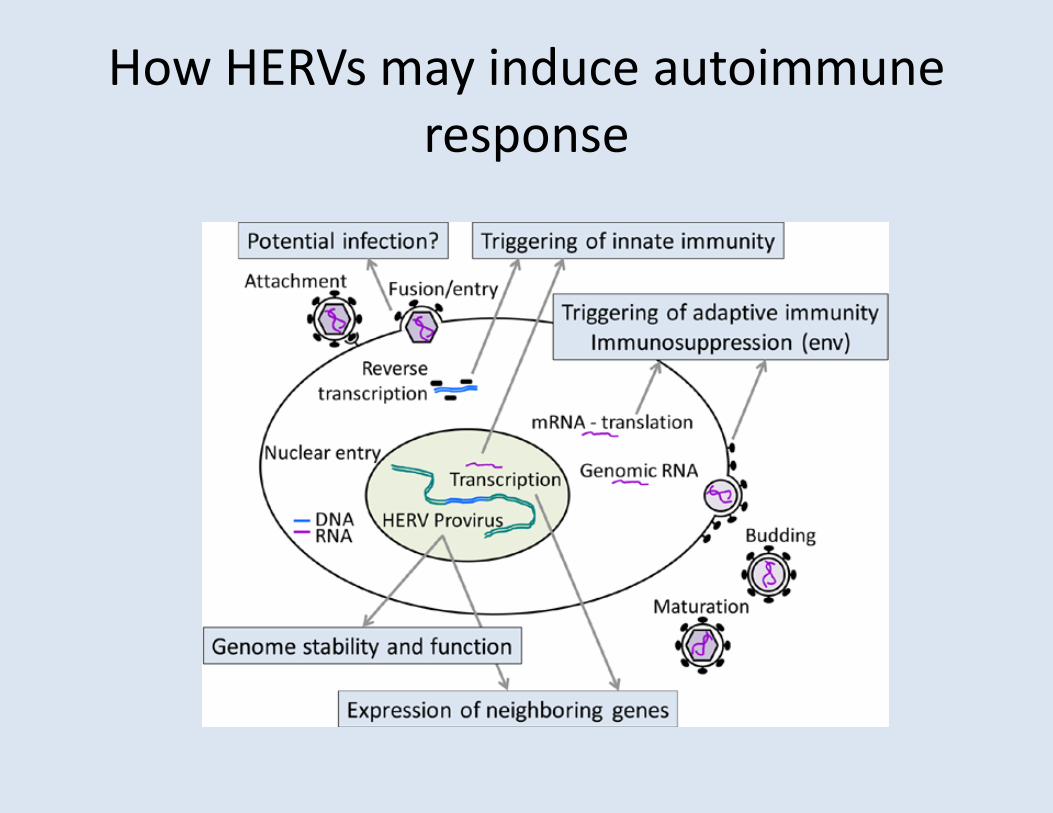
Are human endogenous retroviruses pathogenic An approach to testing the hypothesis
BioEssaysVolume 35 Issue 9 pages 794-803 17 JUL 2013 DOI 101002bies201300049httponlinelibrarywileycomdoi101002bies201300049fullbies201300049-fig-0001
How HERVs may induce autoimmune response
People living with MS (Total)
People living with
HIV(Total)
MS PrevalencePer 100000
HIV Prevalence
Per 100000
USA 400000 1200000 135 508
Canada 65000 60000 240 222
France 80000 130000 80 263
Germany 122000 49000 149 69
Netherlands 16000 18000 100 127
UK 85000 75000 110 137
Denmark 7500 6000 122 125
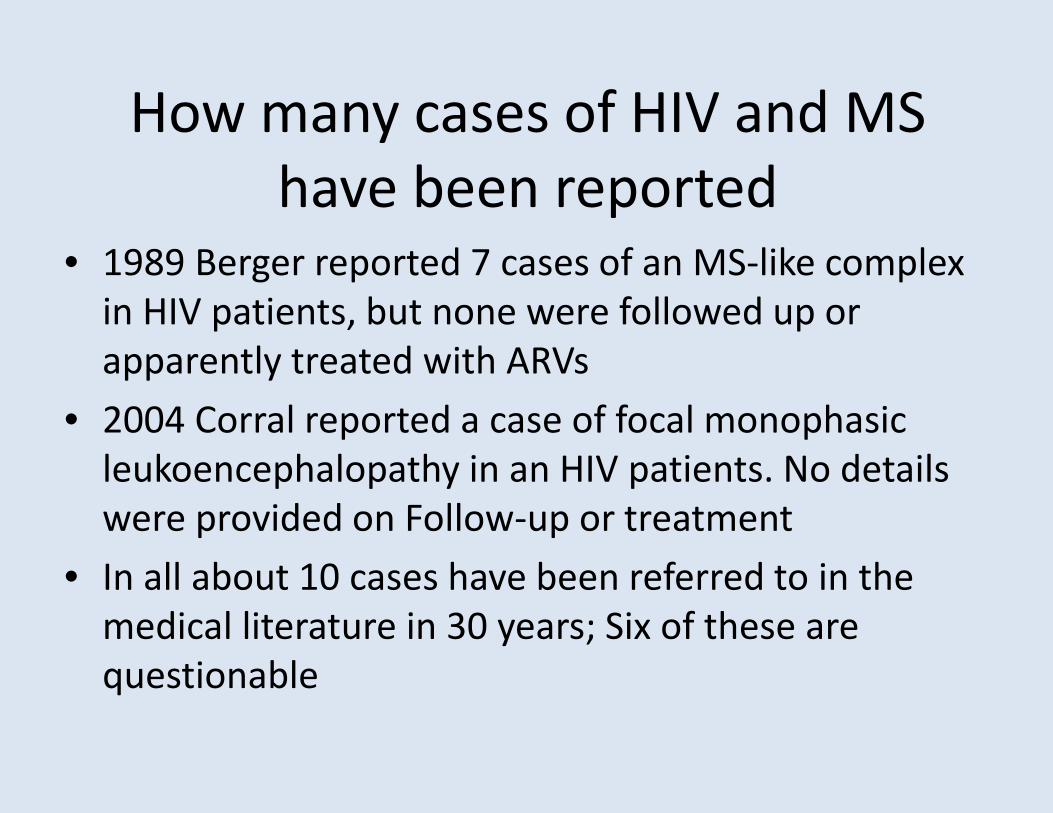
How many cases of HIV and MS have been reported
bull 1989 Berger reported 7 cases of an MS-like complex in HIV patients but none were followed up or apparently treated with ARVs
bull 2004 Corral reported a case of focal monophasic leukoencephalopathy in an HIV patients No details were provided on Follow-up or treatment
bull In all about 10 cases have been referred to in the medical literature in 30 years Six of these are questionable
What do cohort studies show
bull A single study in Danish National Registry of Patients (Nexo Pederson Sorensen and Koch-Henriksen Epidem 2013242 332-333) Cohort from 1994-2011
bull 5018 first time HIV diagnosis followed for 31875 person yearsbull 50194 controls matched for age and sex followed for 393871
person yearsbull One person with HIV developed MS which was a non-
significant relative risk of around 03 (95CI 004-22)
bull Interesting but not convincing
What is the Risk of Developing Multiple Sclerosis if you have HIV and are on HIV Anti-retroviral
therapybull They affect similar demographic populations in western
countriesbull Literature consists of 950000 peer reviewed publications on
HIVAIDS and gt270000 peer reviewed papers on MS They are two of the most studied and documented conditions in medical science
bull Only one case of a patient with both MS and HIV documented as treated with anti-retroviral therapy (Eur J Neurol 201118110-111)
bull Unable to find HIV patients who have MS in major HIV clinics in Europe US and Australia
bull Unusual to find no documentation or company advice for treating HIV patients who have MS with DMT especially interferon
Methodsbull Hospital Episode Statistics of all 55 million people in
the UK from 1999 to 2011bull Any contact with healthcare system including
admissions day cases and deaths Multiple contacts are linked to individual record
bull Database analyzed at Unit of Health-care Epidemiology Oxford University
bull Exposed (HIV) and unexposed matched on week of first contact age area of residence and socio-economic status
bull Relative risk calculated using MS as outcome (OHIVEHIV)(OCCECC)
Age distribution of people entering the HIV cohort the percentage female and the number of people entering the reference cohort1
Age (yrs) N entering HIV cohort
( of total) female N entering the
reference cohort 0-4
139 (07) 446 137461
5-9
168 (08) 452 172624 10-14
138 (07) 572 138003
15-19
173 (08) 590 216875 20-24
653 (31) 444 267177
25-29
2136 (101) 439 340834 30-34
4066 (192) 369 459410
35-39
4792 (226) 296 541994 40-44
3701 (175) 249 496704
45-49
2228 (105) 206 433194 50-54
1293 (61) 186 446510
55-59
776 (37) 174 482105 60-64
480 (23) 163 506958
65-69
274 (13) 212 503916 70-74
98 (05) 214 508750
75-79
37 (02) 270 485042 80-84
22 (01) 227 353716
85+
33 (02) 455 252837
All ages 21207 (100) 302 6744110
Following 21207 patients with HIV for 152618 person years and 6744301 controls for 42148179person years to see who would develop MS On average the follow-up was 7 years
exposure outcome MS in HIVMS in
Controls
rate ratio(Relative
Risk)Protective
Effect low CI upr CI chi-sq p-value
HIVmultiple sclerosis 7 183 038 gt62 015 079 639 0011
NHS Data on UK Healthcare events 1999-2011

Dr Jean-Martin Charcot
Viruses and MSRabies virus Dick GW et al Br Med J 1958
Measles virus Reed D et al Arch Neurol 1964
Varicella-Zoster Virus (VZV) Ross CA et al BMJ1965
Mumps virus Millar JH et al Br Med J 1971
Rubella Horikawa Y et al Lancet 1973
Flaviviridae (Tick borne encephalitis) Salmi AA Ann Clin Res 1973
Herpes Simplex Virus Ito M et al Proc Soc Exp Biol Med 1975
Epstein-Barr Virus (EBV) Sumaya CV Arch Neurol 1980
Coronavirus Gerdes JC et al Adv Exp Med Biol 1981
HTLV-1 Newton M et al Lancet 1987
Human Herpes Virus 6 (HHV-6) Sola PJ et al Neurol Neurosurg Psychiatry 1993
JC polyomavirus Boerman R H Acta Neurol Scand 1993
Human Endogenous Retrovirus Perron H et al Res Virol 1992 Garson J A et al Lancet 1998 Christensen T et al Acta Neurologica Scandinavica 2000
First mention on pubmedCourtesy of Ute-C Meier
Are human endogenous retroviruses pathogenic An approach to testing the hypothesis
BioEssaysVolume 35 Issue 9 pages 794-803 17 JUL 2013 DOI 101002bies201300049httponlinelibrarywileycomdoi101002bies201300049fullbies201300049-fig-0001
How HERVs may induce autoimmune response
People living with MS (Total)
People living with
HIV(Total)
MS PrevalencePer 100000
HIV Prevalence
Per 100000
USA 400000 1200000 135 508
Canada 65000 60000 240 222
France 80000 130000 80 263
Germany 122000 49000 149 69
Netherlands 16000 18000 100 127
UK 85000 75000 110 137
Denmark 7500 6000 122 125
How many cases of HIV and MS have been reported
bull 1989 Berger reported 7 cases of an MS-like complex in HIV patients but none were followed up or apparently treated with ARVs
bull 2004 Corral reported a case of focal monophasic leukoencephalopathy in an HIV patients No details were provided on Follow-up or treatment
bull In all about 10 cases have been referred to in the medical literature in 30 years Six of these are questionable
What do cohort studies show
bull A single study in Danish National Registry of Patients (Nexo Pederson Sorensen and Koch-Henriksen Epidem 2013242 332-333) Cohort from 1994-2011
bull 5018 first time HIV diagnosis followed for 31875 person yearsbull 50194 controls matched for age and sex followed for 393871
person yearsbull One person with HIV developed MS which was a non-
significant relative risk of around 03 (95CI 004-22)
bull Interesting but not convincing
What is the Risk of Developing Multiple Sclerosis if you have HIV and are on HIV Anti-retroviral
therapybull They affect similar demographic populations in western
countriesbull Literature consists of 950000 peer reviewed publications on
HIVAIDS and gt270000 peer reviewed papers on MS They are two of the most studied and documented conditions in medical science
bull Only one case of a patient with both MS and HIV documented as treated with anti-retroviral therapy (Eur J Neurol 201118110-111)
bull Unable to find HIV patients who have MS in major HIV clinics in Europe US and Australia
bull Unusual to find no documentation or company advice for treating HIV patients who have MS with DMT especially interferon
Methodsbull Hospital Episode Statistics of all 55 million people in
the UK from 1999 to 2011bull Any contact with healthcare system including
admissions day cases and deaths Multiple contacts are linked to individual record
bull Database analyzed at Unit of Health-care Epidemiology Oxford University
bull Exposed (HIV) and unexposed matched on week of first contact age area of residence and socio-economic status
bull Relative risk calculated using MS as outcome (OHIVEHIV)(OCCECC)
Age distribution of people entering the HIV cohort the percentage female and the number of people entering the reference cohort1
Age (yrs) N entering HIV cohort
( of total) female N entering the
reference cohort 0-4
139 (07) 446 137461
5-9
168 (08) 452 172624 10-14
138 (07) 572 138003
15-19
173 (08) 590 216875 20-24
653 (31) 444 267177
25-29
2136 (101) 439 340834 30-34
4066 (192) 369 459410
35-39
4792 (226) 296 541994 40-44
3701 (175) 249 496704
45-49
2228 (105) 206 433194 50-54
1293 (61) 186 446510
55-59
776 (37) 174 482105 60-64
480 (23) 163 506958
65-69
274 (13) 212 503916 70-74
98 (05) 214 508750
75-79
37 (02) 270 485042 80-84
22 (01) 227 353716
85+
33 (02) 455 252837
All ages 21207 (100) 302 6744110
Following 21207 patients with HIV for 152618 person years and 6744301 controls for 42148179person years to see who would develop MS On average the follow-up was 7 years
exposure outcome MS in HIVMS in
Controls
rate ratio(Relative
Risk)Protective
Effect low CI upr CI chi-sq p-value
HIVmultiple sclerosis 7 183 038 gt62 015 079 639 0011
NHS Data on UK Healthcare events 1999-2011

exposure outcome MS in HIVMS in
Controls
rate ratio(Relative
Risk)Protective
Effect low CI upr CI chi-sq p-value
HIVmultiple sclerosis 7 183 038 gt62 015 079 639 0011
NHS Data on UK Healthcare events 1999-2011
NHS Cohort gt One year after Exposure (HIV) Contact
Exposure OutcomeMS in
exposedMS in
Controls
Rate ratio (Relative
Risk)Protective
Effect Low CIHigh
CI Chi-sqP
value
HIVMultiple Sclerosis 4 158 022 80 007 065 81 0004
Assuming that HIV diagnosis was made on first contact assessmentof cohort after one year would probably account for effect of HIVtherapy on all exposed If no effect of HIV treatment then expect noreduction in Relative Risk
Cohort of HIV and Autoimmune Diseases-all casesexposure outcome obs in ref cohort obs exp rate ratio low CI upr CI chi-sq p-valueHIV Addisons disease 1868 35 35 1008 7 1408 27231 0HIV Ankylosing spondylitis 4569 3 119 025 005 073 596 00147HIV Autoimmune haemolytic anaemia 1688 12 19 622 321 1089 4713 0HIV Chronic active hepatitis 625 10 1 1031 492 191 7386 0HIV Coeliac disease 8127 7 156 045 018 092 423 00396HIV Crohns disease 12300 31 349 089 06 126 034 05606HIV ITP 4694 43 78 552 399 745 15331 0HIV Myxoedema 181453 85 1577 054 043 067 331 0HIV Pernicious anaemia 17160 4 88 046 012 117 208 01492HIV Polymyositis 631 10 15 691 33 1279 4409 0HIV Primary biliary cirrhosis 1917 2 2 099 012 357 011 07381HIV Psoriasis 18690 65 473 137 106 175 624 00125
HIV Rheumatoid arthritis 53793 39 59 066 047 09 643 00113HIV Scleroderma 1930 1 25 04 001 221 042 05189HIV Sjogrens syndrome 4101 2 42 047 006 17 072 0396HIV Systematic lupus erythematosus 3668 10 98 102 049 188 001 09218HIV Thyrotoxicosis 25869 32 334 096 066 135 002 0879HIV Ulcerative colitis 19771 62 564 11 084 141 047 04929

all
aged 0-14
15-34
35-54
55-64
65+
interval lt1yr
1-4
5+
1+
males
females
The CHARCOT PROJECTINSPIRE
Isentress (Raltegravir)Pilot Study in Relapsing MS
bull Aims to investigate the concept of HERV+-EBV or herpes viruses as an etiology or trigger for MS
bull Disease controlling rather than disease modifying therapy
INSPIRE Design
bull Pilot study enrolling patients with active RRMS as defined by +ve Gd-enhanced MRI or documented relapse in previous 12 months
bull Baseline (3 months) followed by treatment (3 months)
bull Open label treatment phase with Raltegravir 400mg twice a day
INSPIRE Design 2bull 1deg Outcome number and rate of development
of Gd-enhanced lesionsbull 2deg outcomes are disability and quality-of-lifeStatistical considerations19 subjects need to complete trial to achieve 95 significance with 80 power for a 40 reduction in MS lesions compared with baseline (according to Sormani et al)
Trial design
change in gradient
change(in means)
V1 V2(screening before
visit)
V3 V4 V5 V6 V7 V8after
Raltegravirdispensed
A statistically significantchange in means is not inthis situation consistent
with a reduction inoutcome values due tointervention
3
Trial design
QOL QOL QOL QOL QOL QOL QOL
MSFC MSFC MSFC MSFC MSFC MSFC MSFCEDSS EDSS EDSS EDSS EDSS
blood blood blood blood blood blood blood blood
MRI MRI MRI MRI MRI MRI MRI
V1 V2 V3 V4 V5 V6 V7 V8(screening before after
visit)
bull Exploratory studybull Danger of Type II error of missing a real association arguably greater than
danger of Type I error of highlighting a spurious association
4
DATA
bull Patient socio-demographic and baseline
bull MRI
bull Viral and biomarkers
bull Disability
bull Quality of life
bull Laboratory safety tests
2
Patient socio-demographic and baseline
N mean min maxITTAge at baselineyrs 20 4073 3115 5299Height cm 18 16904 15600 18300Weight kg 18 7873 5190 10970Baseline EDSS 20 240 000 400Number of relapses in past year 20 150 100 300
PPAge at baselineyrs 16 4162 3115 5299Height cm 14 16891 15600 18000Weight kg 14 7790 5190 10830Baseline EDSS 16 225 000 350Number of relapses in past year 16 144 100 300
6
Patient adherenceITT PP
Visit mean
6 Number of tablets dispensed 60 60Number of tablets returned 235 269Adherence percentagea 9608 9552
7 Number of tablets dispensed 63 6375Number of tablets returned 72 675Adherence percentagea 88 8875
8 Number of tablets dispensed 597 5963Number of tablets returned 81 863Adherence percentagea 824 805
Over all three visits Number of tablets dispensed 609 6113Number of tablets returned 588 602Adherence percentagea 8883 8826
a100(tablets dispensed - tablets returned)tablets dispensed
7
MRI Total T1 Gd-enhancing lesionsTotal T1 (Gad enhanced) lesion rates
Before (visits 34 and 5) After (visits 67 and 8) Within-patient changea
Mean monthly Mean monthly Change Weightedrate rate in rate rate ratiob
ITT (n=20) 289 302 012 103PP (n=16) 251 233 -018 092
aChanges calculated after-before or afterbeforebRatios averaged on log scale before back-transforming substituting 01 for zero rates Weighted ratios pooled byweighting for total subject counts
Poisson regression analysis after vs before
ITT rate ratio after vs before as 104(95 CI 85 129) P=0681PP rate ratio after vs before as093(95 CI 072 120) P=0577
Poisson regression analysis gradient after vs gradient beforeITT test of difference in gradients P=0659PP test of difference in gradients P=0463
8
MRI New T1 Gd-enhancing lesionsNew T1 (Gad enhanced) lesion rates
Before (visits 34 and 5) After (visits 67 and 8) Within-patient changea
Mean monthly Mean monthly Changerate rate in rate
ITT (n=20) 143 167 023PP (n=16) 098 115 017
aChanges calculated after-before or afterbefore
Poisson regression analysis after vs beforeITT rate ratio after vs before as 116(95 CI 087 155) P=0314PP rate ratio after vs before as 116 (95 CI079 172) P=0456
Poisson regression analysis gradient after vs gradient beforeITT test of difference in gradients P=0562PP test of difference in gradients P=0137
9
MRI T1 Gd lesions
ITT Patients in order of difference in rate
010008010019010015010001010016010009010028010027010003010005010007010010010011010013010014010017010023
010012010020010024
-4 -2 0 2difference in rate lesions per month
Difference after - before
4
13
MRI lesions summary
Lesion outcomes provide no statistical evidence consistent with aneffect of raltegravir
14
Viral and biomarker data Before vs AfterBaselines (visit 2) Before (345) After (678)
Variable N mean sd N mean sd mean sd
MSRV A CtGAPDH Ct(dim-less) 20 094 01 20 093 007 20 092 007MSRV M CtGAPDH Ct(dim-less) 20 133 006 20 133 006 20 132 007TB HE23 CtGAPDH Ct(dim-less) 20 127 014 20 124 013 20 124 013HERV-W A CtGAPDH Ct(dim-less) 20 116 016 20 118 01 20 118 009HERV-W M CtGAPDH Ct(dim-less) 20 147 021 20 144 015 20 145 013TB HE1113 CtGAPDH Ct(dim-less) 20 127 01 20 128 006 20 129 006IL-8 pgmL 20 2805 8683 20 852 232 20 934 286HERV-WMSRV Gag Flix B cells (d-less) 13 118 011 19 119 01 18 115 006HERV-HF Gag Flix B cells (d-less) 12 114 01 17 108 007 20 112 011HERV-HF Env (H1) Flix B cells (d-less) 11 112 007 18 106 005 17 11 008HERV-HF Env (H3) Flix B cells (d-less) 19 156 024 20 147 015 20 152 016HERV-HF Env (W1) Flix B cells (d-less) 18 131 013 20 123 01 20 123 01HERV-HF Env (W3) Flix B cells (d-less) 17 125 015 20 122 009 20 124 017prop of B cells in sample () 19 914 38 20 859 306 20 905 379prop of monocytes in sample () 19 1533 92 20 1808 641 20 1609 623
HERV-WMSRV Gag Flix monocytes (d-less) 11 114 009 16 116 005 15 115 007MSRV F Gag Flix monocytes (d-less) 13 116 01 17 111 005 16 122 019Env (H1) Flix monocytes (d-less) 15 115 012 18 112 008 17 115 006Env (H3) Flix monocytes (d-less) 19 159 018 20 155 019 20 157 02Env (W1) Flix monocytes (d-less) 15 115 01 19 111 007 19 108 005Env (W3) Flix monocytes (d-less) 13 116 008 19 112 007 18 116 009HCRP ngmL 20 178383 21238 20 189945 176902 20 243527 224115CD163 ngmL 20 45667 15463 20 4239 10536 20 44257 12468EBV Copiesmicrolitre 16 21371 79687 16 238 6672 15 668 21274
Viral and biomarker data Before vs AfterHERV-WMSRV Gag Flix B cellsSignificant drop in means in ITT and PPNo significant change in gradient but steeper gradient before
HERV-WMSRV Gag Flix B cellsPP Individual subjects and fitted line
Significant overall drop notattributable to intervention
Similar story for
Env (W1) Flix monocytes
2 3 4 5 6 7 8monthly visits
Solid line fitted by modelA significant drop in means cannot be explained by intervention since decline is steeper before
17
MRI PP Persisting T1 Gd-enhancing lesionsBefore After Within-patient changea
Mean rate Mean rate Change in ratePP (n=16) 153 119 -034
80 of total reductionoccurs before theintervention
attributing the overallreduction to the interventioneven if reduction weresignificant would not be
-013 (P=0469)
P=0762-003 (P=0835)
credible
11
MRI T2 lesions
T2 lesion counts Observed at visits 5 (before) and 8 (after)
Before After Within-patient changea
Mean count Mean count Mean count changeP=0472
weighted ratiob
ITT 445PP 313
465 020P=0462331 019
105107
aChanges calculated after-before or afterbeforebWithin-patient ratios averaged on log scale before back transforming substituting 01 for zero counts Weighted meanratios pooled on log scale by weighting for lesion counts
12
Viral and biomarker data change vs T1 Gd lesion changePositive correlation
HERV-WMSRV Gag Flix B cells r=046 P=0057 ITT r=048 P=0086 PP
9
10
Additional analysis
A higher T1 Gd lesioncount at any visit isassociated with higher714
1619
28 27
20
1712
values of HERV-WMSRVGag Flix B cells at that visitP=0029 (ITT)
15
8 1
-3 -2 -1 0 1 2change in T1 lesion rate
Suggestion of decrease in HERV-WMSRV Gag Flix B cells associated with decrease in Gd-enhanced lesion rate PP r=-048 P=0086
23
Patients with a decrease in lesion count (eg patient 8) tend to have a decrease or a greater decrease in the biomarker than patients with an increase in lesion count (eg patient 20)
Viral and biomarker data summary
Some statistically significant changes in gradient before vs after wereobserved However whether these are consistent with an effect ofraltegravir depends partly on biological plausibility
A very small number of statistically significant correlations wereobserved between changes in these measures and changes in T1 Gdlesion counts their interpretation is again heavily dependent onbiological plausibility
Because of the number of measurestests any significant resultsshould be treated with caution Since results are singled out on thebasis of statistical significance rather than prior hypothesis Type Ierror is likely
25
Viral and biomarker data Before vs AfterHCRP ngmLSignificant increase in means in ITT and PPNo significant change in (positive) gradient similar slightly steeper gradient after
ITT------------------------------------------------------------------------------
| gradient SE z P-value [95 Conf Interval]-------------+----------------------------------------------------------------
before | 1221482 1495142 082 0414 -1708943 4151908after | 1406076 1495142 094 0347 -1524349 4336501
------------------------------------------------------------------------------
Significant overall increase not credibly attributable to intervention since the gradientbefore though non-significant is too similar to the gradient after intervention
18
Quality of life data summary
A number of measures showed statistically significant improvementsin well-being or a slowing of deterioration in the period aftercompared to before intervention
Although consistent with an effect of raltegravir this is most crediblyattributable to the placebo effect of patients receiving an unblindedintervention rather than to any action of the drug
The study design of not having a control group or a cross-over designmitigated against determining the possible effect of the interventionon Q0L
31
Viral and biomarker data Before vs AfterEnv (W3) Flix monocytesNon-significant decline before becomes borderline significant increase afterand significant change in gradient
Env (W3) Flix monocytesITT Individual subjects and fitted line
-002 P=0200
As before biologicalplausibility important bothfor change displayed andfor negative correlation
with Gd T1 lesions
+002 P=0055
P=0047
2 3 4 5 6 7 8monthly visits
Significant change in gradient in ITT (P=0047) and borderline in PP (P=0089)Change in means after - before negatively correlated withchange in rate of Gd enhancing T1 lesions r=-054 P=0015
21
Disability data
Summary of changes after-before
N mean sdEDSS 20 014 045 Neither change nor gradient change significant
MSFC 20 023 028 [Both change and change in gradient significant]9HPT peg speed 20 0003 0003 Highly significant improvementWalk speed (fs) 20 -004 047 Neither change nor gradient change significantPASAT score 20 466 521 Highly significant improvement
PASAT------------------------------------------------------------------------------
| gradient SE z P-value [95 Conf Interval]-------------+----------------------------------------------------------------
before | 2478954 4594816 540 0000 1578387 3379522after | 6377749 4534625 141 0160 -2509954 1526545
------------------------------------------------------------------------------
bull There is a significant gradient changebull But rate of improvement substantially greater before than after intervention
27
Quality of life data
Summary of changes after-before
change inITT n means
PQ - SF36 - Physical Functional Score (PF) 20 -092
PQ - SF36 - Role-Physical Scale (RP) 20 -948PQ - SF36 - Bodily Pain Scale (BP) 20 -542
PQ - SF36 - General Health Scale (GH) 20 -467
PQ - SF36 - Vitality Scale (VT) 20 506 PQ - SF36 - Social Functioning Scale (SF) 20 245 PQ - SF36 - Role Emotional Scale (RE) 20 -862 no statistically significant changes
PQ - SF36 - Mental Health Scale (MH) 20 572 PQ - PFA - Patient Fatigue Assessment 20 -151PQ - PPA - Patient Pain Assessment 19 407PQ - MSIS - Total Score 20 -210 no statistically significant changes
PQ - MSWS-12 - MSWS Total Score 20 -035
30
Quality of life dataSummary of changes after-before
change inITT n means
PQ - SF36 - Physical Functional Score (PF) 20 -092PQ - SF36 - Role-Physical Scale (RP) 20 -948PQ - SF36 - Bodily Pain Scale (BP) 20 -542PQ - SF36 - General Health Scale (GH) 20 -467PQ - SF36 - Vitality Scale (VT) 20 506
+ = improvement
PQ - SF36 - Social Functioning Scale (SF) 20 245PQ - SF36 - Role Emotional Scale (RE) 20 -862PQ - SF36 - Mental Health Scale (MH) 20 572PQ - PFA - Patient Fatigue Assessment 20 -151PQ - PPA - Patient Pain Assessment 19 407 - = improvementPQ - MSIS - Total Score 20 -210PQ - MSWS-12 - MSWS Total Score 20 -035
29
Disability data
Summary of changes after-before
N mean sdEDSS 20 014 045 Neither change nor gradient change significant
MSFC 20 023 028 [Both change and change in gradient significant]9HPT peg speed 20 0003 0003 Highly significant improvementWalk speed (fs) 20 -004 047 Neither change nor gradient change significantPASAT score 20 466 521
9HPT peg speed------------------------------------------------------------------------------
ITT | gradient SE z P-value [95 Conf Interval]-------------+----------------------------------------------------------------
before | 0009916 0002372 418 0000 0005267 0014565after | 000545 0002363 231 0021 0000818 0010082
------------------------------------------------------------------------------
bull No significant gradient changebull But rate of improvement substantially greater before than after intervention
26
Acknowledgementsbull Unit for Healthcare Epidemiology Oxford
ndash Raph Goldacrendash Michael Goldacrendash David Yeates
bull QMULbull Gavin Giovannoni
bull The Albion Centrebull Hubert Maruszak
bull UCLbull Robin Weiss
Laboratory safety tests
32
Laboratory safety tests significant changes
ITT change gradient gradient change inbefore after gradient
ADJUSTED CALCIUM SERUM +002 -000003 +0008 P=0406 increase could bep=0025 pgt09 p=0149 due intervention
CHLORIDE SERUM -075 +014 -031 p=0194 decrease could bep=0055 p=0503 p=0103 due to intervention
CHOLESTEROL SERUM +028 +008 +003 p=0437 increase notp=0004 p=0059 p=0521 plausibly duehellip
GLUCOSE PLASMA -018 +008 -015 p=0072 gradient changep=0196 p=0284 p=0037 could be duehellip
LDL CHOLESTEROL SERUM +017 +006 +0004 p=0432 increase notp=0018 p=0162 pgt09 plausibly duehellip
PLATELET COUNT +686 -027 +259 p=0352 increase could bep=0040 p=0880 p=0129 duehellip
WHITE BLOOD COUNT PP +022 +006 +010 p=0827 increase notp=0049 p=0579 p=0331 plausibly due
33
- Diapositive numeacutero 1
- Diapositive numeacutero 2
- Dr Jean-Martin Charcot
- Diapositive numeacutero 4
- Diapositive numeacutero 5
- Diapositive numeacutero 6
- Viruses and MS
- Are human endogenous retroviruses pathogenic An approach to testing the hypothesis
- How HERVs may induce autoimmune response
- Diapositive numeacutero 10
- Diapositive numeacutero 11
- Diapositive numeacutero 12
- Diapositive numeacutero 13
- How many cases of HIV and MS have been reported
- What do cohort studies show
- What is the Risk of Developing Multiple Sclerosis if you have HIV and are on HIV Anti-retroviral therapy
- Methods
- Diapositive numeacutero 18
- Diapositive numeacutero 19
- NHS Data on UK Healthcare events 1999-2011
- NHS Cohort gt One year after Exposure (HIV) Contact
- Diapositive numeacutero 22
- The CHARCOT PROJECTINSPIRE Isentress (Raltegravir)Pilot Study in Relapsing MS
- INSPIRE Design
- INSPIRE Design 2
- Diapositive numeacutero 26
- Diapositive numeacutero 27
- Diapositive numeacutero 28
- Diapositive numeacutero 29
- Diapositive numeacutero 30
- Diapositive numeacutero 31
- Diapositive numeacutero 32
- Diapositive numeacutero 34
- Diapositive numeacutero 35
- Diapositive numeacutero 36
- Diapositive numeacutero 37
- Diapositive numeacutero 38
- Diapositive numeacutero 39
- Diapositive numeacutero 40
- Diapositive numeacutero 41
- Diapositive numeacutero 42
- Diapositive numeacutero 43
- Diapositive numeacutero 44
- Diapositive numeacutero 45
- Diapositive numeacutero 47
- Diapositive numeacutero 48
- Diapositive numeacutero 49
- Diapositive numeacutero 50
- Acknowledgements
- Diapositive numeacutero 52
- Diapositive numeacutero 53
- Diapositive numeacutero 54
-
| HIV b4 autos | |||||||||||||||||||
| exposure | outcome | obs in ref cohort | obs | exp | rate ratio | low CI | upr CI | chi-sq | p-value | ||||||||||
| HIV | Addisons disease | 1107 | 13 | 15 | 881 | 468 | 1513 | 814 | 0 | ||||||||||
| HIV | Ankylosing spondylitis | 1686 | 0 | 22 | 0 | 0 | 164 | 136 | 02435 | ||||||||||
| HIV | Autoimmune haemolytic anaemia | 911 | 3 | 05 | 638 | 131 | 187 | 873 | 00031 | ||||||||||
| HIV | Chronic active hepatitis | 435 | 3 | 03 | 915 | 188 | 2693 | 143 | 00002 | ||||||||||
| HIV | Coeliac disease | 4991 | 3 | 76 | 04 | 008 | 116 | 218 | 01395 | ||||||||||
| HIV | Crohns disease | 6362 | 4 | 119 | 034 | 009 | 086 | 457 | 00325 | ||||||||||
| HIV | ITP | 2504 | 11 | 27 | 411 | 205 | 737 | 2278 | 0 | ||||||||||
| HIV | Myxoedema | 142597 | 33 | 977 | 034 | 023 | 047 | 4221 | 0 | ||||||||||
| HIV | Pernicious anaemia | 11732 | 2 | 49 | 04 | 005 | 146 | 121 | 02717 | ||||||||||
| HIV | Polymyositis | 395 | 3 | 05 | 622 | 128 | 183 | 837 | 00038 | ||||||||||
| HIV | Primary biliary cirrhosis | 1605 | 1 | 12 | 086 | 002 | 482 | 01 | 07507 | ||||||||||
| HIV | Psoriasis | 9262 | 7 | 129 | 054 | 022 | 111 | 229 | 01305 | ||||||||||
| HIV | Rheumatoid arthritis | 37706 | 11 | 28 | 039 | 02 | 07 | 969 | 00018 | ||||||||||
| HIV | Scleroderma | 1581 | 1 | 15 | 066 | 002 | 369 | 0 | 09916 | ||||||||||
| HIV | Sjogrens syndrome | 3640 | 0 | 31 | 0 | 0 | 12 | 215 | 01424 | ||||||||||
| HIV | Systematic lupus erythematosus | 3109 | 9 | 73 | 123 | 056 | 233 | 019 | 06667 | ||||||||||
| HIV | Thyrotoxicosis | 20268 | 16 | 193 | 083 | 047 | 135 | 04 | 05258 | ||||||||||
| HIV | Ulcerative colitis | 9235 | 5 | 155 | 032 | 01 | 075 | 65 | 00108 |
| HIV b4 autos | |||||||||||||||||||
| exposure | outcome | obs in ref cohort | obs | exp | rate ratio | low CI | upr CI | chi-sq | p-value | ||||||||||
| HIV | Addisons disease | 761 | 22 | 2 | 1108 | 69 | 169 | 18634 | 0 | ||||||||||
| HIV | Ankylosing spondylitis | 2883 | 3 | 97 | 031 | 006 | 091 | 395 | 0047 | ||||||||||
| HIV | Autoimmune haemolytic anaemia | 777 | 9 | 15 | 619 | 282 | 118 | 3371 | 0 | ||||||||||
| HIV | Chronic active hepatitis | 190 | 7 | 07 | 1106 | 439 | 2324 | 5245 | 0 | ||||||||||
| HIV | Coeliac disease | 3136 | 4 | 81 | 05 | 013 | 127 | 158 | 02085 | ||||||||||
| HIV | Crohns disease | 5938 | 27 | 231 | 117 | 077 | 171 | 051 | 04754 | ||||||||||
| HIV | ITP | 2190 | 32 | 52 | 628 | 428 | 889 | 13471 | 0 | ||||||||||
| HIV | Myxoedema | 38856 | 52 | 60 | 087 | 065 | 114 | 095 | 0331 | ||||||||||
| HIV | Pernicious anaemia | 5428 | 2 | 38 | 052 | 006 | 189 | 046 | 04974 | ||||||||||
| HIV | Polymyositis | 236 | 7 | 1 | 732 | 291 | 1531 | 3116 | 0 | ||||||||||
| HIV | Primary biliary cirrhosis | 312 | 1 | 09 | 115 | 003 | 648 | 016 | 06935 | ||||||||||
| HIV | Psoriasis | 9428 | 58 | 344 | 169 | 128 | 219 | 1556 | 00001 | ||||||||||
| HIV | Rheumatoid arthritis | 16087 | 28 | 31 | 09 | 06 | 131 | 02 | 06538 | ||||||||||
| HIV | Scleroderma | 349 | 0 | 1 | 0 | 0 | 366 | 026 | 06107 | ||||||||||
| HIV | Sjogrens syndrome | 461 | 2 | 12 | 17 | 02 | 617 | 009 | 07682 | ||||||||||
| HIV | Systematic lupus erythematosus | 559 | 1 | 25 | 04 | 001 | 226 | 038 | 05355 | ||||||||||
| HIV | Thyrotoxicosis | 5601 | 16 | 141 | 114 | 065 | 185 | 014 | 07078 | ||||||||||
| HIV | Ulcerative colitis | 10536 | 57 | 408 | 14 | 106 | 181 | 605 | 00139 |
| HIV b4 autos | |||||||||||||||||||
| exposure | outcome | obs in ref cohort | obs | exp | rate ratio | low CI | upr CI | chi-sq | p-value | ||||||||||
| HIV | Addisons disease | 1516 | 18 | 26 | 69 | 408 | 1094 | 8394 | 0 | ||||||||||
| HIV | Ankylosing spondylitis | 3802 | 2 | 108 | 019 | 002 | 067 | 638 | 00116 | ||||||||||
| HIV | Autoimmune haemolytic anaemia | 1382 | 5 | 15 | 325 | 105 | 761 | 568 | 00171 | ||||||||||
| HIV | Chronic active hepatitis | 507 | 4 | 08 | 517 | 14 | 1332 | 953 | 0002 | ||||||||||
| HIV | Coeliac disease | 6921 | 7 | 14 | 05 | 02 | 103 | 302 | 00822 | ||||||||||
| HIV | Crohns disease | 10404 | 16 | 299 | 053 | 031 | 087 | 603 | 00141 | ||||||||||
| HIV | ITP | 3966 | 21 | 57 | 368 | 227 | 563 | 3813 | 0 | ||||||||||
| HIV | Myxoedema | 153406 | 72 | 1414 | 051 | 04 | 064 | 3362 | 0 | ||||||||||
| HIV | Pernicious anaemia | 14387 | 3 | 78 | 038 | 008 | 112 | 24 | 01217 | ||||||||||
| HIV | Polymyositis | 518 | 9 | 13 | 682 | 31 | 1305 | 3841 | 0 | ||||||||||
| HIV | Primary biliary cirrhosis | 1609 | 1 | 19 | 053 | 001 | 298 | 007 | 0787 | ||||||||||
| HIV | Psoriasis | 15618 | 43 | 412 | 104 | 075 | 141 | 004 | 08421 | ||||||||||
| HIV | Rheumatoid arthritis | 44692 | 28 | 521 | 054 | 036 | 078 | 1067 | 00011 | ||||||||||
| HIV | Scleroderma | 1636 | 1 | 22 | 046 | 001 | 254 | 022 | 06394 | ||||||||||
| HIV | Sjogrens syndrome | 3536 | 0 | 38 | 0 | 0 | 097 | 286 | 0091 | ||||||||||
| HIV | Systematic lupus erythematosus | 3060 | 9 | 86 | 105 | 048 | 199 | 0 | 09745 | ||||||||||
| HIV | Thyrotoxicosis | 21626 | 27 | 291 | 093 | 061 | 135 | 009 | 07631 | ||||||||||
| HIV | Ulcerative colitis | 16648 | 45 | 489 | 092 | 067 | 123 | 024 | 06256 |
| HIV b4 autos | |||||||||||||||||||
| exposure | outcome | obs in ref cohort | obs | exp | rate ratio | low CI | upr CI | chi-sq | p-value | ||||||||||
| HIV | Addisons disease | 686 | 3 | 11 | 271 | 056 | 796 | 175 | 01859 | ||||||||||
| HIV | Ankylosing spondylitis | 1807 | 0 | 52 | 0 | 0 | 071 | 421 | 00401 | ||||||||||
| HIV | Autoimmune haemolytic anaemia | 586 | 1 | 06 | 169 | 004 | 943 | 001 | 09035 | ||||||||||
| HIV | Chronic active hepatitis | 167 | 1 | 02 | 466 | 012 | 2633 | 038 | 05397 | ||||||||||
| HIV | Coeliac disease | 3282 | 1 | 61 | 016 | 0 | 091 | 346 | 00628 | ||||||||||
| HIV | Crohns disease | 4709 | 3 | 132 | 023 | 005 | 066 | 717 | 00074 | ||||||||||
| HIV | ITP | 1824 | 6 | 25 | 236 | 087 | 515 | 344 | 00636 | ||||||||||
| HIV | Myxoedema | 75495 | 29 | 716 | 04 | 027 | 058 | 2479 | 0 | ||||||||||
| HIV | Pernicious anaemia | 6772 | 0 | 42 | 0 | 0 | 089 | 322 | 00729 | ||||||||||
| HIV | Polymyositis | 216 | 1 | 05 | 188 | 005 | 1057 | 0 | 09632 | ||||||||||
| HIV | Primary biliary cirrhosis | 690 | 1 | 07 | 142 | 004 | 794 | 006 | 08079 | ||||||||||
| HIV | Psoriasis | 7528 | 16 | 196 | 082 | 047 | 133 | 048 | 0489 | ||||||||||
| HIV | Rheumatoid arthritis | 20701 | 11 | 254 | 043 | 022 | 077 | 763 | 00058 | ||||||||||
| HIV | Scleroderma | 725 | 0 | 1 | 0 | 0 | 362 | 026 | 0607 | ||||||||||
| HIV | Sjogrens syndrome | 1700 | 0 | 17 | 0 | 0 | 218 | 084 | 03586 | ||||||||||
| HIV | Systematic lupus erythematosus | 1357 | 3 | 36 | 083 | 017 | 243 | 0 | 09495 | ||||||||||
| HIV | Thyrotoxicosis | 10097 | 13 | 136 | 095 | 051 | 163 | 0 | 09755 | ||||||||||
| HIV | Ulcerative colitis | 7325 | 15 | 207 | 072 | 04 | 119 | 131 | 02521 |
| HIV b4 autos | |||||||||||||||||||
| exposure | outcome | obs in ref cohort | obs | exp | rate ratio | low CI | upr CI | chi-sq | p-value | ||||||||||
| HIV | Addisons disease | 830 | 15 | 15 | 998 | 556 | 1655 | 11032 | 0 | ||||||||||
| HIV | Ankylosing spondylitis | 1995 | 2 | 56 | 035 | 004 | 128 | 174 | 01866 | ||||||||||
| HIV | Autoimmune haemolytic anaemia | 796 | 4 | 09 | 423 | 115 | 1088 | 687 | 00088 | ||||||||||
| HIV | Chronic active hepatitis | 340 | 3 | 06 | 537 | 11 | 1582 | 668 | 00098 | ||||||||||
| HIV | Coeliac disease | 3639 | 6 | 79 | 076 | 028 | 165 | 025 | 0616 | ||||||||||
| HIV | Crohns disease | 5695 | 13 | 167 | 078 | 041 | 133 | 061 | 04355 | ||||||||||
| HIV | ITP | 2142 | 15 | 32 | 473 | 265 | 783 | 4024 | 0 | ||||||||||
| HIV | Myxoedema | 77911 | 43 | 698 | 062 | 045 | 083 | 992 | 00016 | ||||||||||
| HIV | Pernicious anaemia | 7615 | 3 | 37 | 082 | 017 | 239 | 001 | 09271 | ||||||||||
| HIV | Polymyositis | 302 | 8 | 08 | 1018 | 435 | 2031 | 5584 | 0 | ||||||||||
| HIV | Primary biliary cirrhosis | 919 | 0 | 12 | 0 | 0 | 317 | 038 | 05375 | ||||||||||
| HIV | Psoriasis | 8090 | 27 | 217 | 125 | 082 | 182 | 108 | 02985 | ||||||||||
| HIV | Rheumatoid arthritis | 23991 | 17 | 266 | 064 | 037 | 102 | 314 | 00763 | ||||||||||
| HIV | Scleroderma | 911 | 1 | 12 | 085 | 002 | 475 | 009 | 07639 | ||||||||||
| HIV | Sjogrens syndrome | 1836 | 0 | 21 | 0 | 0 | 176 | 121 | 02704 | ||||||||||
| HIV | Systematic lupus erythematosus | 1703 | 6 | 5 | 121 | 044 | 263 | 006 | 0813 | ||||||||||
| HIV | Thyrotoxicosis | 11529 | 14 | 155 | 09 | 049 | 151 | 007 | 0797 | ||||||||||
| HIV | Ulcerative colitis | 9323 | 30 | 282 | 106 | 072 | 152 | 006 | 08069 |
| HIV b4 autos | |||||||||||||||||||
| exposure | outcome | obs in ref cohort | obs | exp | rate ratio | low CI | upr CI | chi-sq | p-value | ||||||||||
| HIV | Addisons disease | 352 | 17 | 09 | 1992 | 1147 | 3236 | 27362 | 0 | ||||||||||
| HIV | Ankylosing spondylitis | 767 | 1 | 11 | 088 | 002 | 493 | 012 | 07296 | ||||||||||
| HIV | Autoimmune haemolytic anaemia | 306 | 7 | 04 | 1792 | 714 | 3736 | 9338 | 0 | ||||||||||
| HIV | Chronic active hepatitis | 118 | 6 | 02 | 3067 | 1103 | 6878 | 13684 | 0 | ||||||||||
| HIV | Coeliac disease | 1206 | 0 | 16 | 0 | 0 | 226 | 079 | 03752 | ||||||||||
| HIV | Crohns disease | 1896 | 15 | 5 | 3 | 167 | 496 | 1787 | 0 | ||||||||||
| HIV | ITP | 728 | 22 | 21 | 1068 | 665 | 1629 | 17803 | 0 | ||||||||||
| HIV | Myxoedema | 28047 | 13 | 163 | 08 | 042 | 136 | 048 | 04889 | ||||||||||
| HIV | Pernicious anaemia | 2773 | 1 | 09 | 106 | 003 | 593 | 021 | 06495 | ||||||||||
| HIV | Polymyositis | 113 | 1 | 01 | 785 | 02 | 4461 | 108 | 02995 | ||||||||||
| HIV | Primary biliary cirrhosis | 308 | 1 | 02 | 646 | 016 | 3624 | 077 | 03817 | ||||||||||
| HIV | Psoriasis | 3072 | 22 | 61 | 361 | 226 | 548 | 3875 | 0 | ||||||||||
| HIV | Rheumatoid arthritis | 9101 | 11 | 69 | 16 | 08 | 286 | 189 | 01697 | ||||||||||
| HIV | Scleroderma | 294 | 0 | 03 | 0 | 0 | 1121 | 009 | 07682 | ||||||||||
| HIV | Sjogrens syndrome | 565 | 2 | 05 | 436 | 053 | 1581 | 235 | 01253 | ||||||||||
| HIV | Systematic lupus erythematosus | 608 | 1 | 12 | 082 | 002 | 461 | 007 | 07944 | ||||||||||
| HIV | Thyrotoxicosis | 4243 | 5 | 43 | 118 | 038 | 275 | 001 | 09048 | ||||||||||
| HIV | Ulcerative colitis | 3123 | 17 | 75 | 229 | 133 | 367 | 1101 | 00009 |
| HIV b4 autos | |||||||||||||||||||
| exposure | outcome | obs in ref cohort | obs | exp | rate ratio | low CI | upr CI | chi-sq | p-value | ||||||||||
| HIV | Addisons disease | 821 | 1 | 01 | 78 | 02 | 4358 | 108 | 02995 | ||||||||||
| HIV | Ankylosing spondylitis | 1672 | 0 | 04 | 0 | 0 | 887 | 002 | 08966 | ||||||||||
| HIV | Autoimmune haemolytic anaemia | 1142 | 1 | 02 | 418 | 011 | 2333 | 028 | 05943 | ||||||||||
| HIV | Chronic active hepatitis | 300 | 1 | 01 | 1674 | 042 | 9401 | 323 | 00721 | ||||||||||
| HIV | Coeliac disease | 3003 | 0 | 04 | 0 | 0 | 836 | 001 | 09297 | ||||||||||
| HIV | Crohns disease | 4249 | 1 | 07 | 14 | 004 | 779 | 006 | 07988 | ||||||||||
| HIV | ITP | 2750 | 4 | 05 | 823 | 224 | 2109 | 1866 | 0 | ||||||||||
| HIV | Myxoedema | 111802 | 12 | 124 | 097 | 05 | 169 | 0 | 09748 | ||||||||||
| HIV | Pernicious anaemia | 13040 | 0 | 15 | 0 | 0 | 253 | 063 | 04283 | ||||||||||
| HIV | Polymyositis | 333 | 2 | 0 | 4371 | 527 | 15913 | 4594 | 0 | ||||||||||
| HIV | Primary biliary cirrhosis | 1120 | 0 | 01 | 0 | 0 | 3586 | 153 | 02162 | ||||||||||
| HIV | Psoriasis | 6100 | 2 | 15 | 131 | 016 | 472 | 0 | 09797 | ||||||||||
| HIV | Rheumatoid arthritis | 30228 | 7 | 41 | 172 | 069 | 355 | 146 | 02269 | ||||||||||
| HIV | Scleroderma | 909 | 0 | 01 | 0 | 0 | 3312 | 135 | 02449 | ||||||||||
| HIV | Sjogrens syndrome | 1883 | 0 | 02 | 0 | 0 | 1969 | 052 | 04704 | ||||||||||
| HIV | Systematic lupus erythematosus | 1056 | 0 | 02 | 0 | 0 | 1993 | 053 | 04648 | ||||||||||
| HIV | Thyrotoxicosis | 15247 | 4 | 19 | 21 | 057 | 538 | 134 | 0247 | ||||||||||
| HIV | Ulcerative colitis | 7697 | 5 | 16 | 317 | 103 | 74 | 541 | 002 |
| HIV b4 autos | |||||||||||||||||||
| exposure | outcome | obs in ref cohort | obs | exp | rate ratio | low CI | upr CI | chi-sq | p-value | ||||||||||
| HIV | Addisons disease | 326 | 3 | 03 | 893 | 183 | 2632 | 138 | 00002 | ||||||||||
| HIV | Ankylosing spondylitis | 971 | 0 | 14 | 0 | 0 | 272 | 054 | 04621 | ||||||||||
| HIV | Autoimmune haemolytic anaemia | 261 | 0 | 03 | 0 | 0 | 1419 | 022 | 06407 | ||||||||||
| HIV | Chronic active hepatitis | 143 | 1 | 01 | 733 | 018 | 415 | 096 | 03272 | ||||||||||
| HIV | Coeliac disease | 1492 | 0 | 11 | 0 | 0 | 331 | 034 | 05598 | ||||||||||
| HIV | Crohns disease | 1923 | 1 | 24 | 042 | 001 | 234 | 032 | 05686 | ||||||||||
| HIV | ITP | 712 | 3 | 09 | 329 | 068 | 964 | 274 | 00976 | ||||||||||
| HIV | Myxoedema | 30859 | 11 | 201 | 055 | 027 | 098 | 368 | 00552 | ||||||||||
| HIV | Pernicious anaemia | 1970 | 1 | 13 | 078 | 002 | 437 | 004 | 0844 | ||||||||||
| HIV | Polymyositis | 135 | 2 | 01 | 1436 | 172 | 5288 | 1309 | 00003 | ||||||||||
| HIV | Primary biliary cirrhosis | 377 | 1 | 02 | 575 | 015 | 3225 | 061 | 0435 | ||||||||||
| HIV | Psoriasis | 3545 | 5 | 48 | 104 | 034 | 244 | 002 | 08955 | ||||||||||
| HIV | Rheumatoid arthritis | 10250 | 4 | 88 | 045 | 012 | 116 | 214 | 01439 | ||||||||||
| HIV | Scleroderma | 463 | 0 | 03 | 0 | 0 | 1449 | 023 | 06285 | ||||||||||
| HIV | Sjogrens syndrome | 1053 | 1 | 05 | 2 | 005 | 1119 | 0 | 09991 | ||||||||||
| HIV | Systematic lupus erythematosus | 715 | 0 | 06 | 0 | 0 | 606 | 002 | 0888 | ||||||||||
| HIV | Thyrotoxicosis | 4076 | 4 | 35 | 115 | 031 | 295 | 0 | 0988 | ||||||||||
| HIV | Ulcerative colitis | 3588 | 8 | 49 | 164 | 071 | 324 | 141 | 02348 |
| HIV b4 autos | |||||||||||||||||||
| exposure | outcome | obs in ref cohort | obs | exp | rate ratio | low CI | upr CI | chi-sq | p-value | ||||||||||
| HIV | Addisons disease | 458 | 20 | 2 | 1017 | 615 | 1589 | 14969 | 0 | ||||||||||
| HIV | Ankylosing spondylitis | 1430 | 1 | 74 | 013 | 0 | 075 | 476 | 00291 | ||||||||||
| HIV | Autoimmune haemolytic anaemia | 195 | 9 | 11 | 854 | 385 | 1655 | 5027 | 0 | ||||||||||
| HIV | Chronic active hepatitis | 126 | 6 | 06 | 1068 | 385 | 2391 | 4141 | 0 | ||||||||||
| HIV | Coeliac disease | 2230 | 5 | 96 | 052 | 017 | 122 | 173 | 01884 | ||||||||||
| HIV | Crohns disease | 3262 | 22 | 203 | 108 | 068 | 164 | 007 | 07958 | ||||||||||
| HIV | ITP | 694 | 23 | 44 | 533 | 335 | 806 | 7409 | 0 | ||||||||||
| HIV | Myxoedema | 30770 | 47 | 922 | 051 | 037 | 068 | 2172 | 0 | ||||||||||
| HIV | Pernicious anaemia | 1664 | 3 | 43 | 07 | 014 | 204 | 015 | 07013 | ||||||||||
| HIV | Polymyositis | 127 | 3 | 1 | 316 | 064 | 945 | 246 | 01165 | ||||||||||
| HIV | Primary biliary cirrhosis | 359 | 1 | 14 | 07 | 002 | 393 | 0 | 09501 | ||||||||||
| HIV | Psoriasis | 6137 | 35 | 30 | 117 | 081 | 162 | 067 | 04141 | ||||||||||
| HIV | Rheumatoid arthritis | 10968 | 21 | 365 | 057 | 036 | 088 | 617 | 0013 | ||||||||||
| HIV | Scleroderma | 455 | 1 | 17 | 059 | 001 | 331 | 002 | 08849 | ||||||||||
| HIV | Sjogrens syndrome | 995 | 1 | 29 | 034 | 001 | 192 | 068 | 04097 | ||||||||||
| HIV | Systematic lupus erythematosus | 1279 | 7 | 63 | 112 | 045 | 231 | 001 | 09219 | ||||||||||
| HIV | Thyrotoxicosis | 4589 | 18 | 191 | 094 | 056 | 149 | 002 | 08979 | ||||||||||
| HIV | Ulcerative colitis | 5315 | 34 | 346 | 098 | 068 | 138 | 0 | 09893 |
| HIV b4 autos | |||||||||||||||||||
| exposure | outcome | obs in ref cohort | obs | exp | rate ratio | low CI | upr CI | chi-sq | p-value | ||||||||||
| HIV | Addisons disease | 213 | 11 | 1 | 1186 | 583 | 2166 | 9395 | 0 | ||||||||||
| HIV | Ankylosing spondylitis | 486 | 2 | 27 | 074 | 009 | 269 | 002 | 09025 | ||||||||||
| HIV | Autoimmune haemolytic anaemia | 66 | 2 | 03 | 627 | 074 | 2356 | 422 | 00398 | ||||||||||
| HIV | Chronic active hepatitis | 39 | 2 | 02 | 1257 | 147 | 4856 | 1072 | 00011 | ||||||||||
| HIV | Coeliac disease | 909 | 2 | 42 | 047 | 006 | 171 | 071 | 03994 | ||||||||||
| HIV | Crohns disease | 2215 | 7 | 111 | 063 | 025 | 13 | 118 | 02778 | ||||||||||
| HIV | ITP | 331 | 11 | 19 | 606 | 3 | 1098 | 4019 | 0 | ||||||||||
| HIV | Myxoedema | 7241 | 15 | 325 | 046 | 026 | 076 | 896 | 00028 | ||||||||||
| HIV | Pernicious anaemia | 472 | 0 | 17 | 0 | 0 | 212 | 089 | 03468 | ||||||||||
| HIV | Polymyositis | 32 | 3 | 03 | 1034 | 203 | 3306 | 1533 | 00001 | ||||||||||
| HIV | Primary biliary cirrhosis | 59 | 0 | 03 | 0 | 0 | 1176 | 01 | 07528 | ||||||||||
| HIV | Psoriasis | 2551 | 23 | 109 | 213 | 135 | 32 | 1253 | 00004 | ||||||||||
| HIV | Rheumatoid arthritis | 2238 | 7 | 95 | 073 | 03 | 152 | 043 | 05128 | ||||||||||
| HIV | Scleroderma | 89 | 0 | 05 | 0 | 0 | 805 | 0 | 09596 | ||||||||||
| HIV | Sjogrens syndrome | 160 | 0 | 07 | 0 | 0 | 564 | 004 | 08448 | ||||||||||
| HIV | Systematic lupus erythematosus | 554 | 3 | 27 | 111 | 023 | 326 | 002 | 0899 | ||||||||||
| HIV | Thyrotoxicosis | 1784 | 6 | 88 | 068 | 025 | 148 | 062 | 04293 | ||||||||||
| HIV | Ulcerative colitis | 2667 | 15 | 151 | 1 | 056 | 165 | 001 | 09074 |
| HIV b4 autos | |||||||||||||||||||
| exposure | outcome | obs in ref cohort | obs | exp | rate ratio | low CI | upr CI | chi-sq | p-value | ||||||||||
| HIV | Addisons disease | 50 | 0 | 0 | 0 | 0 | 8184 | 44 | 00359 | ||||||||||
| HIV | Ankylosing spondylitis | 10 | 0 | 0 | 0 | 0 | 71245 | 3898 | 0 | ||||||||||
| HIV | Autoimmune haemolytic anaemia | 24 | 0 | 0 | 0 | 0 | 24127 | 1416 | 00002 | ||||||||||
| HIV | Chronic active hepatitis | 17 | 0 | 0 | 0 | 0 | 12064 | 638 | 00115 | ||||||||||
| HIV | Coeliac disease | 493 | 0 | 03 | 0 | 0 | 1306 | 017 | 06837 | ||||||||||
| HIV | Crohns disease | 651 | 0 | 04 | 0 | 0 | 933 | 003 | 08691 | ||||||||||
| HIV | ITP | 207 | 2 | 01 | 139 | 167 | 5086 | 1266 | 00004 | ||||||||||
| HIV | Myxoedema | 781 | 0 | 05 | 0 | 0 | 704 | 0 | 09722 | ||||||||||
| HIV | Pernicious anaemia | 14 | 0 | 0 | 0 | 0 | 84591 | 4915 | 0 | ||||||||||
| HIV | Polymyositis | 4 | 0 | 0 | 0 | 0 | 6051 | 24878 | 0 | ||||||||||
| HIV | Primary biliary cirrhosis | 2 | 0 | 0 | 0 | 0 | 0 | 0 | 0 | ||||||||||
| HIV | Psoriasis | 357 | 0 | 01 | 0 | 0 | 2873 | 107 | 03016 | ||||||||||
| HIV | Rheumatoid arthritis | 109 | 0 | 0 | 0 | 0 | 7558 | 409 | 00431 | ||||||||||
| HIV | Scleroderma | 14 | 0 | 0 | 0 | 0 | 107299 | 626 | 0 | ||||||||||
| HIV | Sjogrens syndrome | 10 | 0 | 0 | 0 | 0 | 396158 | 22105 | 0 | ||||||||||
| HIV | Systematic lupus erythematosus | 64 | 0 | 0 | 0 | 0 | 7928 | 427 | 00387 | ||||||||||
| HIV | Thyrotoxicosis | 173 | 0 | 01 | 0 | 0 | 3713 | 159 | 0207 | ||||||||||
| HIV | Ulcerative colitis | 504 | 0 | 03 | 0 | 0 | 1346 | 018 | 06677 |
| Cohort of HIV and Autoimmune Diseases-all cases | |||||||||||||||||||
| exposure | outcome | obs in ref cohort | obs | exp | rate ratio | low CI | upr CI | chi-sq | p-value | ||||||||||
| HIV | Addisons disease | 1868 | 35 | 35 | 1008 | 7 | 1408 | 27231 | 0 | ||||||||||
| HIV | Ankylosing spondylitis | 4569 | 3 | 119 | 025 | 005 | 073 | 596 | 00147 | ||||||||||
| HIV | Autoimmune haemolytic anaemia | 1688 | 12 | 19 | 622 | 321 | 1089 | 4713 | 0 | ||||||||||
| HIV | Chronic active hepatitis | 625 | 10 | 1 | 1031 | 492 | 191 | 7386 | 0 | ||||||||||
| HIV | Coeliac disease | 8127 | 7 | 156 | 045 | 018 | 092 | 423 | 00396 | ||||||||||
| HIV | Crohns disease | 12300 | 31 | 349 | 089 | 06 | 126 | 034 | 05606 | ||||||||||
| HIV | ITP | 4694 | 43 | 78 | 552 | 399 | 745 | 15331 | 0 | ||||||||||
| HIV | Myxoedema | 181453 | 85 | 1577 | 054 | 043 | 067 | 331 | 0 | ||||||||||
| HIV | Pernicious anaemia | 17160 | 4 | 88 | 046 | 012 | 117 | 208 | 01492 | ||||||||||
| HIV | Polymyositis | 631 | 10 | 15 | 691 | 33 | 1279 | 4409 | 0 | ||||||||||
| HIV | Primary biliary cirrhosis | 1917 | 2 | 2 | 099 | 012 | 357 | 011 | 07381 | ||||||||||
| HIV | Psoriasis | 18690 | 65 | 473 | 137 | 106 | 175 | 624 | 00125 | ||||||||||
| HIV | Rheumatoid arthritis | 53793 | 39 | 59 | 066 | 047 | 09 | 643 | 00113 | ||||||||||
| HIV | Scleroderma | 1930 | 1 | 25 | 04 | 001 | 221 | 042 | 05189 | ||||||||||
| HIV | Sjogrens syndrome | 4101 | 2 | 42 | 047 | 006 | 17 | 072 | 0396 | ||||||||||
| HIV | Systematic lupus erythematosus | 3668 | 10 | 98 | 102 | 049 | 188 | 001 | 09218 | ||||||||||
| HIV | Thyrotoxicosis | 25869 | 32 | 334 | 096 | 066 | 135 | 002 | 0879 | ||||||||||
| HIV | Ulcerative colitis | 19771 | 62 | 564 | 11 | 084 | 141 | 047 | 04929 |

aged 0-14
15-34
35-54
55-64
65+
interval lt1yr
1-4
5+
1+
males
females
The CHARCOT PROJECTINSPIRE
Isentress (Raltegravir)Pilot Study in Relapsing MS
bull Aims to investigate the concept of HERV+-EBV or herpes viruses as an etiology or trigger for MS
bull Disease controlling rather than disease modifying therapy
INSPIRE Design
bull Pilot study enrolling patients with active RRMS as defined by +ve Gd-enhanced MRI or documented relapse in previous 12 months
bull Baseline (3 months) followed by treatment (3 months)
bull Open label treatment phase with Raltegravir 400mg twice a day
INSPIRE Design 2bull 1deg Outcome number and rate of development
of Gd-enhanced lesionsbull 2deg outcomes are disability and quality-of-lifeStatistical considerations19 subjects need to complete trial to achieve 95 significance with 80 power for a 40 reduction in MS lesions compared with baseline (according to Sormani et al)
Trial design
change in gradient
change(in means)
V1 V2(screening before
visit)
V3 V4 V5 V6 V7 V8after
Raltegravirdispensed
A statistically significantchange in means is not inthis situation consistent
with a reduction inoutcome values due tointervention
3
Trial design
QOL QOL QOL QOL QOL QOL QOL
MSFC MSFC MSFC MSFC MSFC MSFC MSFCEDSS EDSS EDSS EDSS EDSS
blood blood blood blood blood blood blood blood
MRI MRI MRI MRI MRI MRI MRI
V1 V2 V3 V4 V5 V6 V7 V8(screening before after
visit)
bull Exploratory studybull Danger of Type II error of missing a real association arguably greater than
danger of Type I error of highlighting a spurious association
4
DATA
bull Patient socio-demographic and baseline
bull MRI
bull Viral and biomarkers
bull Disability
bull Quality of life
bull Laboratory safety tests
2
Patient socio-demographic and baseline
N mean min maxITTAge at baselineyrs 20 4073 3115 5299Height cm 18 16904 15600 18300Weight kg 18 7873 5190 10970Baseline EDSS 20 240 000 400Number of relapses in past year 20 150 100 300
PPAge at baselineyrs 16 4162 3115 5299Height cm 14 16891 15600 18000Weight kg 14 7790 5190 10830Baseline EDSS 16 225 000 350Number of relapses in past year 16 144 100 300
6
Patient adherenceITT PP
Visit mean
6 Number of tablets dispensed 60 60Number of tablets returned 235 269Adherence percentagea 9608 9552
7 Number of tablets dispensed 63 6375Number of tablets returned 72 675Adherence percentagea 88 8875
8 Number of tablets dispensed 597 5963Number of tablets returned 81 863Adherence percentagea 824 805
Over all three visits Number of tablets dispensed 609 6113Number of tablets returned 588 602Adherence percentagea 8883 8826
a100(tablets dispensed - tablets returned)tablets dispensed
7
MRI Total T1 Gd-enhancing lesionsTotal T1 (Gad enhanced) lesion rates
Before (visits 34 and 5) After (visits 67 and 8) Within-patient changea
Mean monthly Mean monthly Change Weightedrate rate in rate rate ratiob
ITT (n=20) 289 302 012 103PP (n=16) 251 233 -018 092
aChanges calculated after-before or afterbeforebRatios averaged on log scale before back-transforming substituting 01 for zero rates Weighted ratios pooled byweighting for total subject counts
Poisson regression analysis after vs before
ITT rate ratio after vs before as 104(95 CI 85 129) P=0681PP rate ratio after vs before as093(95 CI 072 120) P=0577
Poisson regression analysis gradient after vs gradient beforeITT test of difference in gradients P=0659PP test of difference in gradients P=0463
8
MRI New T1 Gd-enhancing lesionsNew T1 (Gad enhanced) lesion rates
Before (visits 34 and 5) After (visits 67 and 8) Within-patient changea
Mean monthly Mean monthly Changerate rate in rate
ITT (n=20) 143 167 023PP (n=16) 098 115 017
aChanges calculated after-before or afterbefore
Poisson regression analysis after vs beforeITT rate ratio after vs before as 116(95 CI 087 155) P=0314PP rate ratio after vs before as 116 (95 CI079 172) P=0456
Poisson regression analysis gradient after vs gradient beforeITT test of difference in gradients P=0562PP test of difference in gradients P=0137
9
MRI T1 Gd lesions
ITT Patients in order of difference in rate
010008010019010015010001010016010009010028010027010003010005010007010010010011010013010014010017010023
010012010020010024
-4 -2 0 2difference in rate lesions per month
Difference after - before
4
13
MRI lesions summary
Lesion outcomes provide no statistical evidence consistent with aneffect of raltegravir
14
Viral and biomarker data Before vs AfterBaselines (visit 2) Before (345) After (678)
Variable N mean sd N mean sd mean sd
MSRV A CtGAPDH Ct(dim-less) 20 094 01 20 093 007 20 092 007MSRV M CtGAPDH Ct(dim-less) 20 133 006 20 133 006 20 132 007TB HE23 CtGAPDH Ct(dim-less) 20 127 014 20 124 013 20 124 013HERV-W A CtGAPDH Ct(dim-less) 20 116 016 20 118 01 20 118 009HERV-W M CtGAPDH Ct(dim-less) 20 147 021 20 144 015 20 145 013TB HE1113 CtGAPDH Ct(dim-less) 20 127 01 20 128 006 20 129 006IL-8 pgmL 20 2805 8683 20 852 232 20 934 286HERV-WMSRV Gag Flix B cells (d-less) 13 118 011 19 119 01 18 115 006HERV-HF Gag Flix B cells (d-less) 12 114 01 17 108 007 20 112 011HERV-HF Env (H1) Flix B cells (d-less) 11 112 007 18 106 005 17 11 008HERV-HF Env (H3) Flix B cells (d-less) 19 156 024 20 147 015 20 152 016HERV-HF Env (W1) Flix B cells (d-less) 18 131 013 20 123 01 20 123 01HERV-HF Env (W3) Flix B cells (d-less) 17 125 015 20 122 009 20 124 017prop of B cells in sample () 19 914 38 20 859 306 20 905 379prop of monocytes in sample () 19 1533 92 20 1808 641 20 1609 623
HERV-WMSRV Gag Flix monocytes (d-less) 11 114 009 16 116 005 15 115 007MSRV F Gag Flix monocytes (d-less) 13 116 01 17 111 005 16 122 019Env (H1) Flix monocytes (d-less) 15 115 012 18 112 008 17 115 006Env (H3) Flix monocytes (d-less) 19 159 018 20 155 019 20 157 02Env (W1) Flix monocytes (d-less) 15 115 01 19 111 007 19 108 005Env (W3) Flix monocytes (d-less) 13 116 008 19 112 007 18 116 009HCRP ngmL 20 178383 21238 20 189945 176902 20 243527 224115CD163 ngmL 20 45667 15463 20 4239 10536 20 44257 12468EBV Copiesmicrolitre 16 21371 79687 16 238 6672 15 668 21274
Viral and biomarker data Before vs AfterHERV-WMSRV Gag Flix B cellsSignificant drop in means in ITT and PPNo significant change in gradient but steeper gradient before
HERV-WMSRV Gag Flix B cellsPP Individual subjects and fitted line
Significant overall drop notattributable to intervention
Similar story for
Env (W1) Flix monocytes
2 3 4 5 6 7 8monthly visits
Solid line fitted by modelA significant drop in means cannot be explained by intervention since decline is steeper before
17
MRI PP Persisting T1 Gd-enhancing lesionsBefore After Within-patient changea
Mean rate Mean rate Change in ratePP (n=16) 153 119 -034
80 of total reductionoccurs before theintervention
attributing the overallreduction to the interventioneven if reduction weresignificant would not be
-013 (P=0469)
P=0762-003 (P=0835)
credible
11
MRI T2 lesions
T2 lesion counts Observed at visits 5 (before) and 8 (after)
Before After Within-patient changea
Mean count Mean count Mean count changeP=0472
weighted ratiob
ITT 445PP 313
465 020P=0462331 019
105107
aChanges calculated after-before or afterbeforebWithin-patient ratios averaged on log scale before back transforming substituting 01 for zero counts Weighted meanratios pooled on log scale by weighting for lesion counts
12
Viral and biomarker data change vs T1 Gd lesion changePositive correlation
HERV-WMSRV Gag Flix B cells r=046 P=0057 ITT r=048 P=0086 PP
9
10
Additional analysis
A higher T1 Gd lesioncount at any visit isassociated with higher714
1619
28 27
20
1712
values of HERV-WMSRVGag Flix B cells at that visitP=0029 (ITT)
15
8 1
-3 -2 -1 0 1 2change in T1 lesion rate
Suggestion of decrease in HERV-WMSRV Gag Flix B cells associated with decrease in Gd-enhanced lesion rate PP r=-048 P=0086
23
Patients with a decrease in lesion count (eg patient 8) tend to have a decrease or a greater decrease in the biomarker than patients with an increase in lesion count (eg patient 20)
Viral and biomarker data summary
Some statistically significant changes in gradient before vs after wereobserved However whether these are consistent with an effect ofraltegravir depends partly on biological plausibility
A very small number of statistically significant correlations wereobserved between changes in these measures and changes in T1 Gdlesion counts their interpretation is again heavily dependent onbiological plausibility
Because of the number of measurestests any significant resultsshould be treated with caution Since results are singled out on thebasis of statistical significance rather than prior hypothesis Type Ierror is likely
25
Viral and biomarker data Before vs AfterHCRP ngmLSignificant increase in means in ITT and PPNo significant change in (positive) gradient similar slightly steeper gradient after
ITT------------------------------------------------------------------------------
| gradient SE z P-value [95 Conf Interval]-------------+----------------------------------------------------------------
before | 1221482 1495142 082 0414 -1708943 4151908after | 1406076 1495142 094 0347 -1524349 4336501
------------------------------------------------------------------------------
Significant overall increase not credibly attributable to intervention since the gradientbefore though non-significant is too similar to the gradient after intervention
18
Quality of life data summary
A number of measures showed statistically significant improvementsin well-being or a slowing of deterioration in the period aftercompared to before intervention
Although consistent with an effect of raltegravir this is most crediblyattributable to the placebo effect of patients receiving an unblindedintervention rather than to any action of the drug
The study design of not having a control group or a cross-over designmitigated against determining the possible effect of the interventionon Q0L
31
Viral and biomarker data Before vs AfterEnv (W3) Flix monocytesNon-significant decline before becomes borderline significant increase afterand significant change in gradient
Env (W3) Flix monocytesITT Individual subjects and fitted line
-002 P=0200
As before biologicalplausibility important bothfor change displayed andfor negative correlation
with Gd T1 lesions
+002 P=0055
P=0047
2 3 4 5 6 7 8monthly visits
Significant change in gradient in ITT (P=0047) and borderline in PP (P=0089)Change in means after - before negatively correlated withchange in rate of Gd enhancing T1 lesions r=-054 P=0015
21
Disability data
Summary of changes after-before
N mean sdEDSS 20 014 045 Neither change nor gradient change significant
MSFC 20 023 028 [Both change and change in gradient significant]9HPT peg speed 20 0003 0003 Highly significant improvementWalk speed (fs) 20 -004 047 Neither change nor gradient change significantPASAT score 20 466 521 Highly significant improvement
PASAT------------------------------------------------------------------------------
| gradient SE z P-value [95 Conf Interval]-------------+----------------------------------------------------------------
before | 2478954 4594816 540 0000 1578387 3379522after | 6377749 4534625 141 0160 -2509954 1526545
------------------------------------------------------------------------------
bull There is a significant gradient changebull But rate of improvement substantially greater before than after intervention
27
Quality of life data
Summary of changes after-before
change inITT n means
PQ - SF36 - Physical Functional Score (PF) 20 -092
PQ - SF36 - Role-Physical Scale (RP) 20 -948PQ - SF36 - Bodily Pain Scale (BP) 20 -542
PQ - SF36 - General Health Scale (GH) 20 -467
PQ - SF36 - Vitality Scale (VT) 20 506 PQ - SF36 - Social Functioning Scale (SF) 20 245 PQ - SF36 - Role Emotional Scale (RE) 20 -862 no statistically significant changes
PQ - SF36 - Mental Health Scale (MH) 20 572 PQ - PFA - Patient Fatigue Assessment 20 -151PQ - PPA - Patient Pain Assessment 19 407PQ - MSIS - Total Score 20 -210 no statistically significant changes
PQ - MSWS-12 - MSWS Total Score 20 -035
30
Quality of life dataSummary of changes after-before
change inITT n means
PQ - SF36 - Physical Functional Score (PF) 20 -092PQ - SF36 - Role-Physical Scale (RP) 20 -948PQ - SF36 - Bodily Pain Scale (BP) 20 -542PQ - SF36 - General Health Scale (GH) 20 -467PQ - SF36 - Vitality Scale (VT) 20 506
+ = improvement
PQ - SF36 - Social Functioning Scale (SF) 20 245PQ - SF36 - Role Emotional Scale (RE) 20 -862PQ - SF36 - Mental Health Scale (MH) 20 572PQ - PFA - Patient Fatigue Assessment 20 -151PQ - PPA - Patient Pain Assessment 19 407 - = improvementPQ - MSIS - Total Score 20 -210PQ - MSWS-12 - MSWS Total Score 20 -035
29
Disability data
Summary of changes after-before
N mean sdEDSS 20 014 045 Neither change nor gradient change significant
MSFC 20 023 028 [Both change and change in gradient significant]9HPT peg speed 20 0003 0003 Highly significant improvementWalk speed (fs) 20 -004 047 Neither change nor gradient change significantPASAT score 20 466 521
9HPT peg speed------------------------------------------------------------------------------
ITT | gradient SE z P-value [95 Conf Interval]-------------+----------------------------------------------------------------
before | 0009916 0002372 418 0000 0005267 0014565after | 000545 0002363 231 0021 0000818 0010082
------------------------------------------------------------------------------
bull No significant gradient changebull But rate of improvement substantially greater before than after intervention
26
Acknowledgementsbull Unit for Healthcare Epidemiology Oxford
ndash Raph Goldacrendash Michael Goldacrendash David Yeates
bull QMULbull Gavin Giovannoni
bull The Albion Centrebull Hubert Maruszak
bull UCLbull Robin Weiss
Laboratory safety tests
32
Laboratory safety tests significant changes
ITT change gradient gradient change inbefore after gradient
ADJUSTED CALCIUM SERUM +002 -000003 +0008 P=0406 increase could bep=0025 pgt09 p=0149 due intervention
CHLORIDE SERUM -075 +014 -031 p=0194 decrease could bep=0055 p=0503 p=0103 due to intervention
CHOLESTEROL SERUM +028 +008 +003 p=0437 increase notp=0004 p=0059 p=0521 plausibly duehellip
GLUCOSE PLASMA -018 +008 -015 p=0072 gradient changep=0196 p=0284 p=0037 could be duehellip
LDL CHOLESTEROL SERUM +017 +006 +0004 p=0432 increase notp=0018 p=0162 pgt09 plausibly duehellip
PLATELET COUNT +686 -027 +259 p=0352 increase could bep=0040 p=0880 p=0129 duehellip
WHITE BLOOD COUNT PP +022 +006 +010 p=0827 increase notp=0049 p=0579 p=0331 plausibly due
33
- Diapositive numeacutero 1
- Diapositive numeacutero 2
- Dr Jean-Martin Charcot
- Diapositive numeacutero 4
- Diapositive numeacutero 5
- Diapositive numeacutero 6
- Viruses and MS
- Are human endogenous retroviruses pathogenic An approach to testing the hypothesis
- How HERVs may induce autoimmune response
- Diapositive numeacutero 10
- Diapositive numeacutero 11
- Diapositive numeacutero 12
- Diapositive numeacutero 13
- How many cases of HIV and MS have been reported
- What do cohort studies show
- What is the Risk of Developing Multiple Sclerosis if you have HIV and are on HIV Anti-retroviral therapy
- Methods
- Diapositive numeacutero 18
- Diapositive numeacutero 19
- NHS Data on UK Healthcare events 1999-2011
- NHS Cohort gt One year after Exposure (HIV) Contact
- Diapositive numeacutero 22
- The CHARCOT PROJECTINSPIRE Isentress (Raltegravir)Pilot Study in Relapsing MS
- INSPIRE Design
- INSPIRE Design 2
- Diapositive numeacutero 26
- Diapositive numeacutero 27
- Diapositive numeacutero 28
- Diapositive numeacutero 29
- Diapositive numeacutero 30
- Diapositive numeacutero 31
- Diapositive numeacutero 32
- Diapositive numeacutero 34
- Diapositive numeacutero 35
- Diapositive numeacutero 36
- Diapositive numeacutero 37
- Diapositive numeacutero 38
- Diapositive numeacutero 39
- Diapositive numeacutero 40
- Diapositive numeacutero 41
- Diapositive numeacutero 42
- Diapositive numeacutero 43
- Diapositive numeacutero 44
- Diapositive numeacutero 45
- Diapositive numeacutero 47
- Diapositive numeacutero 48
- Diapositive numeacutero 49
- Diapositive numeacutero 50
- Acknowledgements
- Diapositive numeacutero 52
- Diapositive numeacutero 53
- Diapositive numeacutero 54
-
| HIV b4 autos | |||||||||||||||||||
| exposure | outcome | obs in ref cohort | obs | exp | rate ratio | low CI | upr CI | chi-sq | p-value | ||||||||||
| HIV | Addisons disease | 1107 | 13 | 15 | 881 | 468 | 1513 | 814 | 0 | ||||||||||
| HIV | Ankylosing spondylitis | 1686 | 0 | 22 | 0 | 0 | 164 | 136 | 02435 | ||||||||||
| HIV | Autoimmune haemolytic anaemia | 911 | 3 | 05 | 638 | 131 | 187 | 873 | 00031 | ||||||||||
| HIV | Chronic active hepatitis | 435 | 3 | 03 | 915 | 188 | 2693 | 143 | 00002 | ||||||||||
| HIV | Coeliac disease | 4991 | 3 | 76 | 04 | 008 | 116 | 218 | 01395 | ||||||||||
| HIV | Crohns disease | 6362 | 4 | 119 | 034 | 009 | 086 | 457 | 00325 | ||||||||||
| HIV | ITP | 2504 | 11 | 27 | 411 | 205 | 737 | 2278 | 0 | ||||||||||
| HIV | Myxoedema | 142597 | 33 | 977 | 034 | 023 | 047 | 4221 | 0 | ||||||||||
| HIV | Pernicious anaemia | 11732 | 2 | 49 | 04 | 005 | 146 | 121 | 02717 | ||||||||||
| HIV | Polymyositis | 395 | 3 | 05 | 622 | 128 | 183 | 837 | 00038 | ||||||||||
| HIV | Primary biliary cirrhosis | 1605 | 1 | 12 | 086 | 002 | 482 | 01 | 07507 | ||||||||||
| HIV | Psoriasis | 9262 | 7 | 129 | 054 | 022 | 111 | 229 | 01305 | ||||||||||
| HIV | Rheumatoid arthritis | 37706 | 11 | 28 | 039 | 02 | 07 | 969 | 00018 | ||||||||||
| HIV | Scleroderma | 1581 | 1 | 15 | 066 | 002 | 369 | 0 | 09916 | ||||||||||
| HIV | Sjogrens syndrome | 3640 | 0 | 31 | 0 | 0 | 12 | 215 | 01424 | ||||||||||
| HIV | Systematic lupus erythematosus | 3109 | 9 | 73 | 123 | 056 | 233 | 019 | 06667 | ||||||||||
| HIV | Thyrotoxicosis | 20268 | 16 | 193 | 083 | 047 | 135 | 04 | 05258 | ||||||||||
| HIV | Ulcerative colitis | 9235 | 5 | 155 | 032 | 01 | 075 | 65 | 00108 |
| HIV b4 autos | |||||||||||||||||||
| exposure | outcome | obs in ref cohort | obs | exp | rate ratio | low CI | upr CI | chi-sq | p-value | ||||||||||
| HIV | Addisons disease | 761 | 22 | 2 | 1108 | 69 | 169 | 18634 | 0 | ||||||||||
| HIV | Ankylosing spondylitis | 2883 | 3 | 97 | 031 | 006 | 091 | 395 | 0047 | ||||||||||
| HIV | Autoimmune haemolytic anaemia | 777 | 9 | 15 | 619 | 282 | 118 | 3371 | 0 | ||||||||||
| HIV | Chronic active hepatitis | 190 | 7 | 07 | 1106 | 439 | 2324 | 5245 | 0 | ||||||||||
| HIV | Coeliac disease | 3136 | 4 | 81 | 05 | 013 | 127 | 158 | 02085 | ||||||||||
| HIV | Crohns disease | 5938 | 27 | 231 | 117 | 077 | 171 | 051 | 04754 | ||||||||||
| HIV | ITP | 2190 | 32 | 52 | 628 | 428 | 889 | 13471 | 0 | ||||||||||
| HIV | Myxoedema | 38856 | 52 | 60 | 087 | 065 | 114 | 095 | 0331 | ||||||||||
| HIV | Pernicious anaemia | 5428 | 2 | 38 | 052 | 006 | 189 | 046 | 04974 | ||||||||||
| HIV | Polymyositis | 236 | 7 | 1 | 732 | 291 | 1531 | 3116 | 0 | ||||||||||
| HIV | Primary biliary cirrhosis | 312 | 1 | 09 | 115 | 003 | 648 | 016 | 06935 | ||||||||||
| HIV | Psoriasis | 9428 | 58 | 344 | 169 | 128 | 219 | 1556 | 00001 | ||||||||||
| HIV | Rheumatoid arthritis | 16087 | 28 | 31 | 09 | 06 | 131 | 02 | 06538 | ||||||||||
| HIV | Scleroderma | 349 | 0 | 1 | 0 | 0 | 366 | 026 | 06107 | ||||||||||
| HIV | Sjogrens syndrome | 461 | 2 | 12 | 17 | 02 | 617 | 009 | 07682 | ||||||||||
| HIV | Systematic lupus erythematosus | 559 | 1 | 25 | 04 | 001 | 226 | 038 | 05355 | ||||||||||
| HIV | Thyrotoxicosis | 5601 | 16 | 141 | 114 | 065 | 185 | 014 | 07078 | ||||||||||
| HIV | Ulcerative colitis | 10536 | 57 | 408 | 14 | 106 | 181 | 605 | 00139 |
| HIV b4 autos | |||||||||||||||||||
| exposure | outcome | obs in ref cohort | obs | exp | rate ratio | low CI | upr CI | chi-sq | p-value | ||||||||||
| HIV | Addisons disease | 1516 | 18 | 26 | 69 | 408 | 1094 | 8394 | 0 | ||||||||||
| HIV | Ankylosing spondylitis | 3802 | 2 | 108 | 019 | 002 | 067 | 638 | 00116 | ||||||||||
| HIV | Autoimmune haemolytic anaemia | 1382 | 5 | 15 | 325 | 105 | 761 | 568 | 00171 | ||||||||||
| HIV | Chronic active hepatitis | 507 | 4 | 08 | 517 | 14 | 1332 | 953 | 0002 | ||||||||||
| HIV | Coeliac disease | 6921 | 7 | 14 | 05 | 02 | 103 | 302 | 00822 | ||||||||||
| HIV | Crohns disease | 10404 | 16 | 299 | 053 | 031 | 087 | 603 | 00141 | ||||||||||
| HIV | ITP | 3966 | 21 | 57 | 368 | 227 | 563 | 3813 | 0 | ||||||||||
| HIV | Myxoedema | 153406 | 72 | 1414 | 051 | 04 | 064 | 3362 | 0 | ||||||||||
| HIV | Pernicious anaemia | 14387 | 3 | 78 | 038 | 008 | 112 | 24 | 01217 | ||||||||||
| HIV | Polymyositis | 518 | 9 | 13 | 682 | 31 | 1305 | 3841 | 0 | ||||||||||
| HIV | Primary biliary cirrhosis | 1609 | 1 | 19 | 053 | 001 | 298 | 007 | 0787 | ||||||||||
| HIV | Psoriasis | 15618 | 43 | 412 | 104 | 075 | 141 | 004 | 08421 | ||||||||||
| HIV | Rheumatoid arthritis | 44692 | 28 | 521 | 054 | 036 | 078 | 1067 | 00011 | ||||||||||
| HIV | Scleroderma | 1636 | 1 | 22 | 046 | 001 | 254 | 022 | 06394 | ||||||||||
| HIV | Sjogrens syndrome | 3536 | 0 | 38 | 0 | 0 | 097 | 286 | 0091 | ||||||||||
| HIV | Systematic lupus erythematosus | 3060 | 9 | 86 | 105 | 048 | 199 | 0 | 09745 | ||||||||||
| HIV | Thyrotoxicosis | 21626 | 27 | 291 | 093 | 061 | 135 | 009 | 07631 | ||||||||||
| HIV | Ulcerative colitis | 16648 | 45 | 489 | 092 | 067 | 123 | 024 | 06256 |
| HIV b4 autos | |||||||||||||||||||
| exposure | outcome | obs in ref cohort | obs | exp | rate ratio | low CI | upr CI | chi-sq | p-value | ||||||||||
| HIV | Addisons disease | 686 | 3 | 11 | 271 | 056 | 796 | 175 | 01859 | ||||||||||
| HIV | Ankylosing spondylitis | 1807 | 0 | 52 | 0 | 0 | 071 | 421 | 00401 | ||||||||||
| HIV | Autoimmune haemolytic anaemia | 586 | 1 | 06 | 169 | 004 | 943 | 001 | 09035 | ||||||||||
| HIV | Chronic active hepatitis | 167 | 1 | 02 | 466 | 012 | 2633 | 038 | 05397 | ||||||||||
| HIV | Coeliac disease | 3282 | 1 | 61 | 016 | 0 | 091 | 346 | 00628 | ||||||||||
| HIV | Crohns disease | 4709 | 3 | 132 | 023 | 005 | 066 | 717 | 00074 | ||||||||||
| HIV | ITP | 1824 | 6 | 25 | 236 | 087 | 515 | 344 | 00636 | ||||||||||
| HIV | Myxoedema | 75495 | 29 | 716 | 04 | 027 | 058 | 2479 | 0 | ||||||||||
| HIV | Pernicious anaemia | 6772 | 0 | 42 | 0 | 0 | 089 | 322 | 00729 | ||||||||||
| HIV | Polymyositis | 216 | 1 | 05 | 188 | 005 | 1057 | 0 | 09632 | ||||||||||
| HIV | Primary biliary cirrhosis | 690 | 1 | 07 | 142 | 004 | 794 | 006 | 08079 | ||||||||||
| HIV | Psoriasis | 7528 | 16 | 196 | 082 | 047 | 133 | 048 | 0489 | ||||||||||
| HIV | Rheumatoid arthritis | 20701 | 11 | 254 | 043 | 022 | 077 | 763 | 00058 | ||||||||||
| HIV | Scleroderma | 725 | 0 | 1 | 0 | 0 | 362 | 026 | 0607 | ||||||||||
| HIV | Sjogrens syndrome | 1700 | 0 | 17 | 0 | 0 | 218 | 084 | 03586 | ||||||||||
| HIV | Systematic lupus erythematosus | 1357 | 3 | 36 | 083 | 017 | 243 | 0 | 09495 | ||||||||||
| HIV | Thyrotoxicosis | 10097 | 13 | 136 | 095 | 051 | 163 | 0 | 09755 | ||||||||||
| HIV | Ulcerative colitis | 7325 | 15 | 207 | 072 | 04 | 119 | 131 | 02521 |
| HIV b4 autos | |||||||||||||||||||
| exposure | outcome | obs in ref cohort | obs | exp | rate ratio | low CI | upr CI | chi-sq | p-value | ||||||||||
| HIV | Addisons disease | 830 | 15 | 15 | 998 | 556 | 1655 | 11032 | 0 | ||||||||||
| HIV | Ankylosing spondylitis | 1995 | 2 | 56 | 035 | 004 | 128 | 174 | 01866 | ||||||||||
| HIV | Autoimmune haemolytic anaemia | 796 | 4 | 09 | 423 | 115 | 1088 | 687 | 00088 | ||||||||||
| HIV | Chronic active hepatitis | 340 | 3 | 06 | 537 | 11 | 1582 | 668 | 00098 | ||||||||||
| HIV | Coeliac disease | 3639 | 6 | 79 | 076 | 028 | 165 | 025 | 0616 | ||||||||||
| HIV | Crohns disease | 5695 | 13 | 167 | 078 | 041 | 133 | 061 | 04355 | ||||||||||
| HIV | ITP | 2142 | 15 | 32 | 473 | 265 | 783 | 4024 | 0 | ||||||||||
| HIV | Myxoedema | 77911 | 43 | 698 | 062 | 045 | 083 | 992 | 00016 | ||||||||||
| HIV | Pernicious anaemia | 7615 | 3 | 37 | 082 | 017 | 239 | 001 | 09271 | ||||||||||
| HIV | Polymyositis | 302 | 8 | 08 | 1018 | 435 | 2031 | 5584 | 0 | ||||||||||
| HIV | Primary biliary cirrhosis | 919 | 0 | 12 | 0 | 0 | 317 | 038 | 05375 | ||||||||||
| HIV | Psoriasis | 8090 | 27 | 217 | 125 | 082 | 182 | 108 | 02985 | ||||||||||
| HIV | Rheumatoid arthritis | 23991 | 17 | 266 | 064 | 037 | 102 | 314 | 00763 | ||||||||||
| HIV | Scleroderma | 911 | 1 | 12 | 085 | 002 | 475 | 009 | 07639 | ||||||||||
| HIV | Sjogrens syndrome | 1836 | 0 | 21 | 0 | 0 | 176 | 121 | 02704 | ||||||||||
| HIV | Systematic lupus erythematosus | 1703 | 6 | 5 | 121 | 044 | 263 | 006 | 0813 | ||||||||||
| HIV | Thyrotoxicosis | 11529 | 14 | 155 | 09 | 049 | 151 | 007 | 0797 | ||||||||||
| HIV | Ulcerative colitis | 9323 | 30 | 282 | 106 | 072 | 152 | 006 | 08069 |
| HIV b4 autos | |||||||||||||||||||
| exposure | outcome | obs in ref cohort | obs | exp | rate ratio | low CI | upr CI | chi-sq | p-value | ||||||||||
| HIV | Addisons disease | 352 | 17 | 09 | 1992 | 1147 | 3236 | 27362 | 0 | ||||||||||
| HIV | Ankylosing spondylitis | 767 | 1 | 11 | 088 | 002 | 493 | 012 | 07296 | ||||||||||
| HIV | Autoimmune haemolytic anaemia | 306 | 7 | 04 | 1792 | 714 | 3736 | 9338 | 0 | ||||||||||
| HIV | Chronic active hepatitis | 118 | 6 | 02 | 3067 | 1103 | 6878 | 13684 | 0 | ||||||||||
| HIV | Coeliac disease | 1206 | 0 | 16 | 0 | 0 | 226 | 079 | 03752 | ||||||||||
| HIV | Crohns disease | 1896 | 15 | 5 | 3 | 167 | 496 | 1787 | 0 | ||||||||||
| HIV | ITP | 728 | 22 | 21 | 1068 | 665 | 1629 | 17803 | 0 | ||||||||||
| HIV | Myxoedema | 28047 | 13 | 163 | 08 | 042 | 136 | 048 | 04889 | ||||||||||
| HIV | Pernicious anaemia | 2773 | 1 | 09 | 106 | 003 | 593 | 021 | 06495 | ||||||||||
| HIV | Polymyositis | 113 | 1 | 01 | 785 | 02 | 4461 | 108 | 02995 | ||||||||||
| HIV | Primary biliary cirrhosis | 308 | 1 | 02 | 646 | 016 | 3624 | 077 | 03817 | ||||||||||
| HIV | Psoriasis | 3072 | 22 | 61 | 361 | 226 | 548 | 3875 | 0 | ||||||||||
| HIV | Rheumatoid arthritis | 9101 | 11 | 69 | 16 | 08 | 286 | 189 | 01697 | ||||||||||
| HIV | Scleroderma | 294 | 0 | 03 | 0 | 0 | 1121 | 009 | 07682 | ||||||||||
| HIV | Sjogrens syndrome | 565 | 2 | 05 | 436 | 053 | 1581 | 235 | 01253 | ||||||||||
| HIV | Systematic lupus erythematosus | 608 | 1 | 12 | 082 | 002 | 461 | 007 | 07944 | ||||||||||
| HIV | Thyrotoxicosis | 4243 | 5 | 43 | 118 | 038 | 275 | 001 | 09048 | ||||||||||
| HIV | Ulcerative colitis | 3123 | 17 | 75 | 229 | 133 | 367 | 1101 | 00009 |
| HIV b4 autos | |||||||||||||||||||
| exposure | outcome | obs in ref cohort | obs | exp | rate ratio | low CI | upr CI | chi-sq | p-value | ||||||||||
| HIV | Addisons disease | 821 | 1 | 01 | 78 | 02 | 4358 | 108 | 02995 | ||||||||||
| HIV | Ankylosing spondylitis | 1672 | 0 | 04 | 0 | 0 | 887 | 002 | 08966 | ||||||||||
| HIV | Autoimmune haemolytic anaemia | 1142 | 1 | 02 | 418 | 011 | 2333 | 028 | 05943 | ||||||||||
| HIV | Chronic active hepatitis | 300 | 1 | 01 | 1674 | 042 | 9401 | 323 | 00721 | ||||||||||
| HIV | Coeliac disease | 3003 | 0 | 04 | 0 | 0 | 836 | 001 | 09297 | ||||||||||
| HIV | Crohns disease | 4249 | 1 | 07 | 14 | 004 | 779 | 006 | 07988 | ||||||||||
| HIV | ITP | 2750 | 4 | 05 | 823 | 224 | 2109 | 1866 | 0 | ||||||||||
| HIV | Myxoedema | 111802 | 12 | 124 | 097 | 05 | 169 | 0 | 09748 | ||||||||||
| HIV | Pernicious anaemia | 13040 | 0 | 15 | 0 | 0 | 253 | 063 | 04283 | ||||||||||
| HIV | Polymyositis | 333 | 2 | 0 | 4371 | 527 | 15913 | 4594 | 0 | ||||||||||
| HIV | Primary biliary cirrhosis | 1120 | 0 | 01 | 0 | 0 | 3586 | 153 | 02162 | ||||||||||
| HIV | Psoriasis | 6100 | 2 | 15 | 131 | 016 | 472 | 0 | 09797 | ||||||||||
| HIV | Rheumatoid arthritis | 30228 | 7 | 41 | 172 | 069 | 355 | 146 | 02269 | ||||||||||
| HIV | Scleroderma | 909 | 0 | 01 | 0 | 0 | 3312 | 135 | 02449 | ||||||||||
| HIV | Sjogrens syndrome | 1883 | 0 | 02 | 0 | 0 | 1969 | 052 | 04704 | ||||||||||
| HIV | Systematic lupus erythematosus | 1056 | 0 | 02 | 0 | 0 | 1993 | 053 | 04648 | ||||||||||
| HIV | Thyrotoxicosis | 15247 | 4 | 19 | 21 | 057 | 538 | 134 | 0247 | ||||||||||
| HIV | Ulcerative colitis | 7697 | 5 | 16 | 317 | 103 | 74 | 541 | 002 |
| HIV b4 autos | |||||||||||||||||||
| exposure | outcome | obs in ref cohort | obs | exp | rate ratio | low CI | upr CI | chi-sq | p-value | ||||||||||
| HIV | Addisons disease | 326 | 3 | 03 | 893 | 183 | 2632 | 138 | 00002 | ||||||||||
| HIV | Ankylosing spondylitis | 971 | 0 | 14 | 0 | 0 | 272 | 054 | 04621 | ||||||||||
| HIV | Autoimmune haemolytic anaemia | 261 | 0 | 03 | 0 | 0 | 1419 | 022 | 06407 | ||||||||||
| HIV | Chronic active hepatitis | 143 | 1 | 01 | 733 | 018 | 415 | 096 | 03272 | ||||||||||
| HIV | Coeliac disease | 1492 | 0 | 11 | 0 | 0 | 331 | 034 | 05598 | ||||||||||
| HIV | Crohns disease | 1923 | 1 | 24 | 042 | 001 | 234 | 032 | 05686 | ||||||||||
| HIV | ITP | 712 | 3 | 09 | 329 | 068 | 964 | 274 | 00976 | ||||||||||
| HIV | Myxoedema | 30859 | 11 | 201 | 055 | 027 | 098 | 368 | 00552 | ||||||||||
| HIV | Pernicious anaemia | 1970 | 1 | 13 | 078 | 002 | 437 | 004 | 0844 | ||||||||||
| HIV | Polymyositis | 135 | 2 | 01 | 1436 | 172 | 5288 | 1309 | 00003 | ||||||||||
| HIV | Primary biliary cirrhosis | 377 | 1 | 02 | 575 | 015 | 3225 | 061 | 0435 | ||||||||||
| HIV | Psoriasis | 3545 | 5 | 48 | 104 | 034 | 244 | 002 | 08955 | ||||||||||
| HIV | Rheumatoid arthritis | 10250 | 4 | 88 | 045 | 012 | 116 | 214 | 01439 | ||||||||||
| HIV | Scleroderma | 463 | 0 | 03 | 0 | 0 | 1449 | 023 | 06285 | ||||||||||
| HIV | Sjogrens syndrome | 1053 | 1 | 05 | 2 | 005 | 1119 | 0 | 09991 | ||||||||||
| HIV | Systematic lupus erythematosus | 715 | 0 | 06 | 0 | 0 | 606 | 002 | 0888 | ||||||||||
| HIV | Thyrotoxicosis | 4076 | 4 | 35 | 115 | 031 | 295 | 0 | 0988 | ||||||||||
| HIV | Ulcerative colitis | 3588 | 8 | 49 | 164 | 071 | 324 | 141 | 02348 |
| HIV b4 autos | |||||||||||||||||||
| exposure | outcome | obs in ref cohort | obs | exp | rate ratio | low CI | upr CI | chi-sq | p-value | ||||||||||
| HIV | Addisons disease | 458 | 20 | 2 | 1017 | 615 | 1589 | 14969 | 0 | ||||||||||
| HIV | Ankylosing spondylitis | 1430 | 1 | 74 | 013 | 0 | 075 | 476 | 00291 | ||||||||||
| HIV | Autoimmune haemolytic anaemia | 195 | 9 | 11 | 854 | 385 | 1655 | 5027 | 0 | ||||||||||
| HIV | Chronic active hepatitis | 126 | 6 | 06 | 1068 | 385 | 2391 | 4141 | 0 | ||||||||||
| HIV | Coeliac disease | 2230 | 5 | 96 | 052 | 017 | 122 | 173 | 01884 | ||||||||||
| HIV | Crohns disease | 3262 | 22 | 203 | 108 | 068 | 164 | 007 | 07958 | ||||||||||
| HIV | ITP | 694 | 23 | 44 | 533 | 335 | 806 | 7409 | 0 | ||||||||||
| HIV | Myxoedema | 30770 | 47 | 922 | 051 | 037 | 068 | 2172 | 0 | ||||||||||
| HIV | Pernicious anaemia | 1664 | 3 | 43 | 07 | 014 | 204 | 015 | 07013 | ||||||||||
| HIV | Polymyositis | 127 | 3 | 1 | 316 | 064 | 945 | 246 | 01165 | ||||||||||
| HIV | Primary biliary cirrhosis | 359 | 1 | 14 | 07 | 002 | 393 | 0 | 09501 | ||||||||||
| HIV | Psoriasis | 6137 | 35 | 30 | 117 | 081 | 162 | 067 | 04141 | ||||||||||
| HIV | Rheumatoid arthritis | 10968 | 21 | 365 | 057 | 036 | 088 | 617 | 0013 | ||||||||||
| HIV | Scleroderma | 455 | 1 | 17 | 059 | 001 | 331 | 002 | 08849 | ||||||||||
| HIV | Sjogrens syndrome | 995 | 1 | 29 | 034 | 001 | 192 | 068 | 04097 | ||||||||||
| HIV | Systematic lupus erythematosus | 1279 | 7 | 63 | 112 | 045 | 231 | 001 | 09219 | ||||||||||
| HIV | Thyrotoxicosis | 4589 | 18 | 191 | 094 | 056 | 149 | 002 | 08979 | ||||||||||
| HIV | Ulcerative colitis | 5315 | 34 | 346 | 098 | 068 | 138 | 0 | 09893 |
| HIV b4 autos | |||||||||||||||||||
| exposure | outcome | obs in ref cohort | obs | exp | rate ratio | low CI | upr CI | chi-sq | p-value | ||||||||||
| HIV | Addisons disease | 213 | 11 | 1 | 1186 | 583 | 2166 | 9395 | 0 | ||||||||||
| HIV | Ankylosing spondylitis | 486 | 2 | 27 | 074 | 009 | 269 | 002 | 09025 | ||||||||||
| HIV | Autoimmune haemolytic anaemia | 66 | 2 | 03 | 627 | 074 | 2356 | 422 | 00398 | ||||||||||
| HIV | Chronic active hepatitis | 39 | 2 | 02 | 1257 | 147 | 4856 | 1072 | 00011 | ||||||||||
| HIV | Coeliac disease | 909 | 2 | 42 | 047 | 006 | 171 | 071 | 03994 | ||||||||||
| HIV | Crohns disease | 2215 | 7 | 111 | 063 | 025 | 13 | 118 | 02778 | ||||||||||
| HIV | ITP | 331 | 11 | 19 | 606 | 3 | 1098 | 4019 | 0 | ||||||||||
| HIV | Myxoedema | 7241 | 15 | 325 | 046 | 026 | 076 | 896 | 00028 | ||||||||||
| HIV | Pernicious anaemia | 472 | 0 | 17 | 0 | 0 | 212 | 089 | 03468 | ||||||||||
| HIV | Polymyositis | 32 | 3 | 03 | 1034 | 203 | 3306 | 1533 | 00001 | ||||||||||
| HIV | Primary biliary cirrhosis | 59 | 0 | 03 | 0 | 0 | 1176 | 01 | 07528 | ||||||||||
| HIV | Psoriasis | 2551 | 23 | 109 | 213 | 135 | 32 | 1253 | 00004 | ||||||||||
| HIV | Rheumatoid arthritis | 2238 | 7 | 95 | 073 | 03 | 152 | 043 | 05128 | ||||||||||
| HIV | Scleroderma | 89 | 0 | 05 | 0 | 0 | 805 | 0 | 09596 | ||||||||||
| HIV | Sjogrens syndrome | 160 | 0 | 07 | 0 | 0 | 564 | 004 | 08448 | ||||||||||
| HIV | Systematic lupus erythematosus | 554 | 3 | 27 | 111 | 023 | 326 | 002 | 0899 | ||||||||||
| HIV | Thyrotoxicosis | 1784 | 6 | 88 | 068 | 025 | 148 | 062 | 04293 | ||||||||||
| HIV | Ulcerative colitis | 2667 | 15 | 151 | 1 | 056 | 165 | 001 | 09074 |
| HIV b4 autos | |||||||||||||||||||
| exposure | outcome | obs in ref cohort | obs | exp | rate ratio | low CI | upr CI | chi-sq | p-value | ||||||||||
| HIV | Addisons disease | 50 | 0 | 0 | 0 | 0 | 8184 | 44 | 00359 | ||||||||||
| HIV | Ankylosing spondylitis | 10 | 0 | 0 | 0 | 0 | 71245 | 3898 | 0 | ||||||||||
| HIV | Autoimmune haemolytic anaemia | 24 | 0 | 0 | 0 | 0 | 24127 | 1416 | 00002 | ||||||||||
| HIV | Chronic active hepatitis | 17 | 0 | 0 | 0 | 0 | 12064 | 638 | 00115 | ||||||||||
| HIV | Coeliac disease | 493 | 0 | 03 | 0 | 0 | 1306 | 017 | 06837 | ||||||||||
| HIV | Crohns disease | 651 | 0 | 04 | 0 | 0 | 933 | 003 | 08691 | ||||||||||
| HIV | ITP | 207 | 2 | 01 | 139 | 167 | 5086 | 1266 | 00004 | ||||||||||
| HIV | Myxoedema | 781 | 0 | 05 | 0 | 0 | 704 | 0 | 09722 | ||||||||||
| HIV | Pernicious anaemia | 14 | 0 | 0 | 0 | 0 | 84591 | 4915 | 0 | ||||||||||
| HIV | Polymyositis | 4 | 0 | 0 | 0 | 0 | 6051 | 24878 | 0 | ||||||||||
| HIV | Primary biliary cirrhosis | 2 | 0 | 0 | 0 | 0 | 0 | 0 | 0 | ||||||||||
| HIV | Psoriasis | 357 | 0 | 01 | 0 | 0 | 2873 | 107 | 03016 | ||||||||||
| HIV | Rheumatoid arthritis | 109 | 0 | 0 | 0 | 0 | 7558 | 409 | 00431 | ||||||||||
| HIV | Scleroderma | 14 | 0 | 0 | 0 | 0 | 107299 | 626 | 0 | ||||||||||
| HIV | Sjogrens syndrome | 10 | 0 | 0 | 0 | 0 | 396158 | 22105 | 0 | ||||||||||
| HIV | Systematic lupus erythematosus | 64 | 0 | 0 | 0 | 0 | 7928 | 427 | 00387 | ||||||||||
| HIV | Thyrotoxicosis | 173 | 0 | 01 | 0 | 0 | 3713 | 159 | 0207 | ||||||||||
| HIV | Ulcerative colitis | 504 | 0 | 03 | 0 | 0 | 1346 | 018 | 06677 |
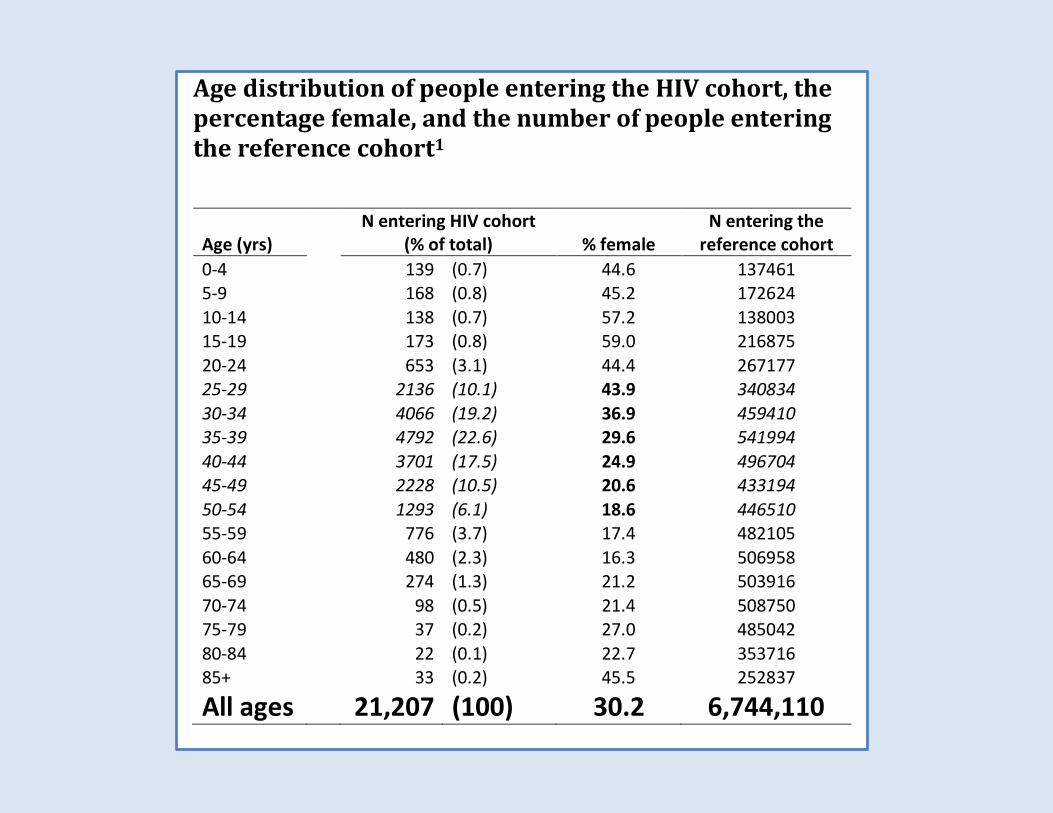
15-34
35-54
55-64
65+
interval lt1yr
1-4
5+
1+
males
females
The CHARCOT PROJECTINSPIRE
Isentress (Raltegravir)Pilot Study in Relapsing MS
bull Aims to investigate the concept of HERV+-EBV or herpes viruses as an etiology or trigger for MS
bull Disease controlling rather than disease modifying therapy
INSPIRE Design
bull Pilot study enrolling patients with active RRMS as defined by +ve Gd-enhanced MRI or documented relapse in previous 12 months
bull Baseline (3 months) followed by treatment (3 months)
bull Open label treatment phase with Raltegravir 400mg twice a day
INSPIRE Design 2bull 1deg Outcome number and rate of development
of Gd-enhanced lesionsbull 2deg outcomes are disability and quality-of-lifeStatistical considerations19 subjects need to complete trial to achieve 95 significance with 80 power for a 40 reduction in MS lesions compared with baseline (according to Sormani et al)
Trial design
change in gradient
change(in means)
V1 V2(screening before
visit)
V3 V4 V5 V6 V7 V8after
Raltegravirdispensed
A statistically significantchange in means is not inthis situation consistent
with a reduction inoutcome values due tointervention
3
Trial design
QOL QOL QOL QOL QOL QOL QOL
MSFC MSFC MSFC MSFC MSFC MSFC MSFCEDSS EDSS EDSS EDSS EDSS
blood blood blood blood blood blood blood blood
MRI MRI MRI MRI MRI MRI MRI
V1 V2 V3 V4 V5 V6 V7 V8(screening before after
visit)
bull Exploratory studybull Danger of Type II error of missing a real association arguably greater than
danger of Type I error of highlighting a spurious association
4
DATA
bull Patient socio-demographic and baseline
bull MRI
bull Viral and biomarkers
bull Disability
bull Quality of life
bull Laboratory safety tests
2
Patient socio-demographic and baseline
N mean min maxITTAge at baselineyrs 20 4073 3115 5299Height cm 18 16904 15600 18300Weight kg 18 7873 5190 10970Baseline EDSS 20 240 000 400Number of relapses in past year 20 150 100 300
PPAge at baselineyrs 16 4162 3115 5299Height cm 14 16891 15600 18000Weight kg 14 7790 5190 10830Baseline EDSS 16 225 000 350Number of relapses in past year 16 144 100 300
6
Patient adherenceITT PP
Visit mean
6 Number of tablets dispensed 60 60Number of tablets returned 235 269Adherence percentagea 9608 9552
7 Number of tablets dispensed 63 6375Number of tablets returned 72 675Adherence percentagea 88 8875
8 Number of tablets dispensed 597 5963Number of tablets returned 81 863Adherence percentagea 824 805
Over all three visits Number of tablets dispensed 609 6113Number of tablets returned 588 602Adherence percentagea 8883 8826
a100(tablets dispensed - tablets returned)tablets dispensed
7
MRI Total T1 Gd-enhancing lesionsTotal T1 (Gad enhanced) lesion rates
Before (visits 34 and 5) After (visits 67 and 8) Within-patient changea
Mean monthly Mean monthly Change Weightedrate rate in rate rate ratiob
ITT (n=20) 289 302 012 103PP (n=16) 251 233 -018 092
aChanges calculated after-before or afterbeforebRatios averaged on log scale before back-transforming substituting 01 for zero rates Weighted ratios pooled byweighting for total subject counts
Poisson regression analysis after vs before
ITT rate ratio after vs before as 104(95 CI 85 129) P=0681PP rate ratio after vs before as093(95 CI 072 120) P=0577
Poisson regression analysis gradient after vs gradient beforeITT test of difference in gradients P=0659PP test of difference in gradients P=0463
8
MRI New T1 Gd-enhancing lesionsNew T1 (Gad enhanced) lesion rates
Before (visits 34 and 5) After (visits 67 and 8) Within-patient changea
Mean monthly Mean monthly Changerate rate in rate
ITT (n=20) 143 167 023PP (n=16) 098 115 017
aChanges calculated after-before or afterbefore
Poisson regression analysis after vs beforeITT rate ratio after vs before as 116(95 CI 087 155) P=0314PP rate ratio after vs before as 116 (95 CI079 172) P=0456
Poisson regression analysis gradient after vs gradient beforeITT test of difference in gradients P=0562PP test of difference in gradients P=0137
9
MRI T1 Gd lesions
ITT Patients in order of difference in rate
010008010019010015010001010016010009010028010027010003010005010007010010010011010013010014010017010023
010012010020010024
-4 -2 0 2difference in rate lesions per month
Difference after - before
4
13
MRI lesions summary
Lesion outcomes provide no statistical evidence consistent with aneffect of raltegravir
14
Viral and biomarker data Before vs AfterBaselines (visit 2) Before (345) After (678)
Variable N mean sd N mean sd mean sd
MSRV A CtGAPDH Ct(dim-less) 20 094 01 20 093 007 20 092 007MSRV M CtGAPDH Ct(dim-less) 20 133 006 20 133 006 20 132 007TB HE23 CtGAPDH Ct(dim-less) 20 127 014 20 124 013 20 124 013HERV-W A CtGAPDH Ct(dim-less) 20 116 016 20 118 01 20 118 009HERV-W M CtGAPDH Ct(dim-less) 20 147 021 20 144 015 20 145 013TB HE1113 CtGAPDH Ct(dim-less) 20 127 01 20 128 006 20 129 006IL-8 pgmL 20 2805 8683 20 852 232 20 934 286HERV-WMSRV Gag Flix B cells (d-less) 13 118 011 19 119 01 18 115 006HERV-HF Gag Flix B cells (d-less) 12 114 01 17 108 007 20 112 011HERV-HF Env (H1) Flix B cells (d-less) 11 112 007 18 106 005 17 11 008HERV-HF Env (H3) Flix B cells (d-less) 19 156 024 20 147 015 20 152 016HERV-HF Env (W1) Flix B cells (d-less) 18 131 013 20 123 01 20 123 01HERV-HF Env (W3) Flix B cells (d-less) 17 125 015 20 122 009 20 124 017prop of B cells in sample () 19 914 38 20 859 306 20 905 379prop of monocytes in sample () 19 1533 92 20 1808 641 20 1609 623
HERV-WMSRV Gag Flix monocytes (d-less) 11 114 009 16 116 005 15 115 007MSRV F Gag Flix monocytes (d-less) 13 116 01 17 111 005 16 122 019Env (H1) Flix monocytes (d-less) 15 115 012 18 112 008 17 115 006Env (H3) Flix monocytes (d-less) 19 159 018 20 155 019 20 157 02Env (W1) Flix monocytes (d-less) 15 115 01 19 111 007 19 108 005Env (W3) Flix monocytes (d-less) 13 116 008 19 112 007 18 116 009HCRP ngmL 20 178383 21238 20 189945 176902 20 243527 224115CD163 ngmL 20 45667 15463 20 4239 10536 20 44257 12468EBV Copiesmicrolitre 16 21371 79687 16 238 6672 15 668 21274
Viral and biomarker data Before vs AfterHERV-WMSRV Gag Flix B cellsSignificant drop in means in ITT and PPNo significant change in gradient but steeper gradient before
HERV-WMSRV Gag Flix B cellsPP Individual subjects and fitted line
Significant overall drop notattributable to intervention
Similar story for
Env (W1) Flix monocytes
2 3 4 5 6 7 8monthly visits
Solid line fitted by modelA significant drop in means cannot be explained by intervention since decline is steeper before
17
MRI PP Persisting T1 Gd-enhancing lesionsBefore After Within-patient changea
Mean rate Mean rate Change in ratePP (n=16) 153 119 -034
80 of total reductionoccurs before theintervention
attributing the overallreduction to the interventioneven if reduction weresignificant would not be
-013 (P=0469)
P=0762-003 (P=0835)
credible
11
MRI T2 lesions
T2 lesion counts Observed at visits 5 (before) and 8 (after)
Before After Within-patient changea
Mean count Mean count Mean count changeP=0472
weighted ratiob
ITT 445PP 313
465 020P=0462331 019
105107
aChanges calculated after-before or afterbeforebWithin-patient ratios averaged on log scale before back transforming substituting 01 for zero counts Weighted meanratios pooled on log scale by weighting for lesion counts
12
Viral and biomarker data change vs T1 Gd lesion changePositive correlation
HERV-WMSRV Gag Flix B cells r=046 P=0057 ITT r=048 P=0086 PP
9
10
Additional analysis
A higher T1 Gd lesioncount at any visit isassociated with higher714
1619
28 27
20
1712
values of HERV-WMSRVGag Flix B cells at that visitP=0029 (ITT)
15
8 1
-3 -2 -1 0 1 2change in T1 lesion rate
Suggestion of decrease in HERV-WMSRV Gag Flix B cells associated with decrease in Gd-enhanced lesion rate PP r=-048 P=0086
23
Patients with a decrease in lesion count (eg patient 8) tend to have a decrease or a greater decrease in the biomarker than patients with an increase in lesion count (eg patient 20)
Viral and biomarker data summary
Some statistically significant changes in gradient before vs after wereobserved However whether these are consistent with an effect ofraltegravir depends partly on biological plausibility
A very small number of statistically significant correlations wereobserved between changes in these measures and changes in T1 Gdlesion counts their interpretation is again heavily dependent onbiological plausibility
Because of the number of measurestests any significant resultsshould be treated with caution Since results are singled out on thebasis of statistical significance rather than prior hypothesis Type Ierror is likely
25
Viral and biomarker data Before vs AfterHCRP ngmLSignificant increase in means in ITT and PPNo significant change in (positive) gradient similar slightly steeper gradient after
ITT------------------------------------------------------------------------------
| gradient SE z P-value [95 Conf Interval]-------------+----------------------------------------------------------------
before | 1221482 1495142 082 0414 -1708943 4151908after | 1406076 1495142 094 0347 -1524349 4336501
------------------------------------------------------------------------------
Significant overall increase not credibly attributable to intervention since the gradientbefore though non-significant is too similar to the gradient after intervention
18
Quality of life data summary
A number of measures showed statistically significant improvementsin well-being or a slowing of deterioration in the period aftercompared to before intervention
Although consistent with an effect of raltegravir this is most crediblyattributable to the placebo effect of patients receiving an unblindedintervention rather than to any action of the drug
The study design of not having a control group or a cross-over designmitigated against determining the possible effect of the interventionon Q0L
31
Viral and biomarker data Before vs AfterEnv (W3) Flix monocytesNon-significant decline before becomes borderline significant increase afterand significant change in gradient
Env (W3) Flix monocytesITT Individual subjects and fitted line
-002 P=0200
As before biologicalplausibility important bothfor change displayed andfor negative correlation
with Gd T1 lesions
+002 P=0055
P=0047
2 3 4 5 6 7 8monthly visits
Significant change in gradient in ITT (P=0047) and borderline in PP (P=0089)Change in means after - before negatively correlated withchange in rate of Gd enhancing T1 lesions r=-054 P=0015
21
Disability data
Summary of changes after-before
N mean sdEDSS 20 014 045 Neither change nor gradient change significant
MSFC 20 023 028 [Both change and change in gradient significant]9HPT peg speed 20 0003 0003 Highly significant improvementWalk speed (fs) 20 -004 047 Neither change nor gradient change significantPASAT score 20 466 521 Highly significant improvement
PASAT------------------------------------------------------------------------------
| gradient SE z P-value [95 Conf Interval]-------------+----------------------------------------------------------------
before | 2478954 4594816 540 0000 1578387 3379522after | 6377749 4534625 141 0160 -2509954 1526545
------------------------------------------------------------------------------
bull There is a significant gradient changebull But rate of improvement substantially greater before than after intervention
27
Quality of life data
Summary of changes after-before
change inITT n means
PQ - SF36 - Physical Functional Score (PF) 20 -092
PQ - SF36 - Role-Physical Scale (RP) 20 -948PQ - SF36 - Bodily Pain Scale (BP) 20 -542
PQ - SF36 - General Health Scale (GH) 20 -467
PQ - SF36 - Vitality Scale (VT) 20 506 PQ - SF36 - Social Functioning Scale (SF) 20 245 PQ - SF36 - Role Emotional Scale (RE) 20 -862 no statistically significant changes
PQ - SF36 - Mental Health Scale (MH) 20 572 PQ - PFA - Patient Fatigue Assessment 20 -151PQ - PPA - Patient Pain Assessment 19 407PQ - MSIS - Total Score 20 -210 no statistically significant changes
PQ - MSWS-12 - MSWS Total Score 20 -035
30
Quality of life dataSummary of changes after-before
change inITT n means
PQ - SF36 - Physical Functional Score (PF) 20 -092PQ - SF36 - Role-Physical Scale (RP) 20 -948PQ - SF36 - Bodily Pain Scale (BP) 20 -542PQ - SF36 - General Health Scale (GH) 20 -467PQ - SF36 - Vitality Scale (VT) 20 506
+ = improvement
PQ - SF36 - Social Functioning Scale (SF) 20 245PQ - SF36 - Role Emotional Scale (RE) 20 -862PQ - SF36 - Mental Health Scale (MH) 20 572PQ - PFA - Patient Fatigue Assessment 20 -151PQ - PPA - Patient Pain Assessment 19 407 - = improvementPQ - MSIS - Total Score 20 -210PQ - MSWS-12 - MSWS Total Score 20 -035
29
Disability data
Summary of changes after-before
N mean sdEDSS 20 014 045 Neither change nor gradient change significant
MSFC 20 023 028 [Both change and change in gradient significant]9HPT peg speed 20 0003 0003 Highly significant improvementWalk speed (fs) 20 -004 047 Neither change nor gradient change significantPASAT score 20 466 521
9HPT peg speed------------------------------------------------------------------------------
ITT | gradient SE z P-value [95 Conf Interval]-------------+----------------------------------------------------------------
before | 0009916 0002372 418 0000 0005267 0014565after | 000545 0002363 231 0021 0000818 0010082
------------------------------------------------------------------------------
bull No significant gradient changebull But rate of improvement substantially greater before than after intervention
26
Acknowledgementsbull Unit for Healthcare Epidemiology Oxford
ndash Raph Goldacrendash Michael Goldacrendash David Yeates
bull QMULbull Gavin Giovannoni
bull The Albion Centrebull Hubert Maruszak
bull UCLbull Robin Weiss
Laboratory safety tests
32
Laboratory safety tests significant changes
ITT change gradient gradient change inbefore after gradient
ADJUSTED CALCIUM SERUM +002 -000003 +0008 P=0406 increase could bep=0025 pgt09 p=0149 due intervention
CHLORIDE SERUM -075 +014 -031 p=0194 decrease could bep=0055 p=0503 p=0103 due to intervention
CHOLESTEROL SERUM +028 +008 +003 p=0437 increase notp=0004 p=0059 p=0521 plausibly duehellip
GLUCOSE PLASMA -018 +008 -015 p=0072 gradient changep=0196 p=0284 p=0037 could be duehellip
LDL CHOLESTEROL SERUM +017 +006 +0004 p=0432 increase notp=0018 p=0162 pgt09 plausibly duehellip
PLATELET COUNT +686 -027 +259 p=0352 increase could bep=0040 p=0880 p=0129 duehellip
WHITE BLOOD COUNT PP +022 +006 +010 p=0827 increase notp=0049 p=0579 p=0331 plausibly due
33
- Diapositive numeacutero 1
- Diapositive numeacutero 2
- Dr Jean-Martin Charcot
- Diapositive numeacutero 4
- Diapositive numeacutero 5
- Diapositive numeacutero 6
- Viruses and MS
- Are human endogenous retroviruses pathogenic An approach to testing the hypothesis
- How HERVs may induce autoimmune response
- Diapositive numeacutero 10
- Diapositive numeacutero 11
- Diapositive numeacutero 12
- Diapositive numeacutero 13
- How many cases of HIV and MS have been reported
- What do cohort studies show
- What is the Risk of Developing Multiple Sclerosis if you have HIV and are on HIV Anti-retroviral therapy
- Methods
- Diapositive numeacutero 18
- Diapositive numeacutero 19
- NHS Data on UK Healthcare events 1999-2011
- NHS Cohort gt One year after Exposure (HIV) Contact
- Diapositive numeacutero 22
- The CHARCOT PROJECTINSPIRE Isentress (Raltegravir)Pilot Study in Relapsing MS
- INSPIRE Design
- INSPIRE Design 2
- Diapositive numeacutero 26
- Diapositive numeacutero 27
- Diapositive numeacutero 28
- Diapositive numeacutero 29
- Diapositive numeacutero 30
- Diapositive numeacutero 31
- Diapositive numeacutero 32
- Diapositive numeacutero 34
- Diapositive numeacutero 35
- Diapositive numeacutero 36
- Diapositive numeacutero 37
- Diapositive numeacutero 38
- Diapositive numeacutero 39
- Diapositive numeacutero 40
- Diapositive numeacutero 41
- Diapositive numeacutero 42
- Diapositive numeacutero 43
- Diapositive numeacutero 44
- Diapositive numeacutero 45
- Diapositive numeacutero 47
- Diapositive numeacutero 48
- Diapositive numeacutero 49
- Diapositive numeacutero 50
- Acknowledgements
- Diapositive numeacutero 52
- Diapositive numeacutero 53
- Diapositive numeacutero 54
-
| HIV b4 autos | |||||||||||||||||||
| exposure | outcome | obs in ref cohort | obs | exp | rate ratio | low CI | upr CI | chi-sq | p-value | ||||||||||
| HIV | Addisons disease | 1107 | 13 | 15 | 881 | 468 | 1513 | 814 | 0 | ||||||||||
| HIV | Ankylosing spondylitis | 1686 | 0 | 22 | 0 | 0 | 164 | 136 | 02435 | ||||||||||
| HIV | Autoimmune haemolytic anaemia | 911 | 3 | 05 | 638 | 131 | 187 | 873 | 00031 | ||||||||||
| HIV | Chronic active hepatitis | 435 | 3 | 03 | 915 | 188 | 2693 | 143 | 00002 | ||||||||||
| HIV | Coeliac disease | 4991 | 3 | 76 | 04 | 008 | 116 | 218 | 01395 | ||||||||||
| HIV | Crohns disease | 6362 | 4 | 119 | 034 | 009 | 086 | 457 | 00325 | ||||||||||
| HIV | ITP | 2504 | 11 | 27 | 411 | 205 | 737 | 2278 | 0 | ||||||||||
| HIV | Myxoedema | 142597 | 33 | 977 | 034 | 023 | 047 | 4221 | 0 | ||||||||||
| HIV | Pernicious anaemia | 11732 | 2 | 49 | 04 | 005 | 146 | 121 | 02717 | ||||||||||
| HIV | Polymyositis | 395 | 3 | 05 | 622 | 128 | 183 | 837 | 00038 | ||||||||||
| HIV | Primary biliary cirrhosis | 1605 | 1 | 12 | 086 | 002 | 482 | 01 | 07507 | ||||||||||
| HIV | Psoriasis | 9262 | 7 | 129 | 054 | 022 | 111 | 229 | 01305 | ||||||||||
| HIV | Rheumatoid arthritis | 37706 | 11 | 28 | 039 | 02 | 07 | 969 | 00018 | ||||||||||
| HIV | Scleroderma | 1581 | 1 | 15 | 066 | 002 | 369 | 0 | 09916 | ||||||||||
| HIV | Sjogrens syndrome | 3640 | 0 | 31 | 0 | 0 | 12 | 215 | 01424 | ||||||||||
| HIV | Systematic lupus erythematosus | 3109 | 9 | 73 | 123 | 056 | 233 | 019 | 06667 | ||||||||||
| HIV | Thyrotoxicosis | 20268 | 16 | 193 | 083 | 047 | 135 | 04 | 05258 | ||||||||||
| HIV | Ulcerative colitis | 9235 | 5 | 155 | 032 | 01 | 075 | 65 | 00108 |
| HIV b4 autos | |||||||||||||||||||
| exposure | outcome | obs in ref cohort | obs | exp | rate ratio | low CI | upr CI | chi-sq | p-value | ||||||||||
| HIV | Addisons disease | 761 | 22 | 2 | 1108 | 69 | 169 | 18634 | 0 | ||||||||||
| HIV | Ankylosing spondylitis | 2883 | 3 | 97 | 031 | 006 | 091 | 395 | 0047 | ||||||||||
| HIV | Autoimmune haemolytic anaemia | 777 | 9 | 15 | 619 | 282 | 118 | 3371 | 0 | ||||||||||
| HIV | Chronic active hepatitis | 190 | 7 | 07 | 1106 | 439 | 2324 | 5245 | 0 | ||||||||||
| HIV | Coeliac disease | 3136 | 4 | 81 | 05 | 013 | 127 | 158 | 02085 | ||||||||||
| HIV | Crohns disease | 5938 | 27 | 231 | 117 | 077 | 171 | 051 | 04754 | ||||||||||
| HIV | ITP | 2190 | 32 | 52 | 628 | 428 | 889 | 13471 | 0 | ||||||||||
| HIV | Myxoedema | 38856 | 52 | 60 | 087 | 065 | 114 | 095 | 0331 | ||||||||||
| HIV | Pernicious anaemia | 5428 | 2 | 38 | 052 | 006 | 189 | 046 | 04974 | ||||||||||
| HIV | Polymyositis | 236 | 7 | 1 | 732 | 291 | 1531 | 3116 | 0 | ||||||||||
| HIV | Primary biliary cirrhosis | 312 | 1 | 09 | 115 | 003 | 648 | 016 | 06935 | ||||||||||
| HIV | Psoriasis | 9428 | 58 | 344 | 169 | 128 | 219 | 1556 | 00001 | ||||||||||
| HIV | Rheumatoid arthritis | 16087 | 28 | 31 | 09 | 06 | 131 | 02 | 06538 | ||||||||||
| HIV | Scleroderma | 349 | 0 | 1 | 0 | 0 | 366 | 026 | 06107 | ||||||||||
| HIV | Sjogrens syndrome | 461 | 2 | 12 | 17 | 02 | 617 | 009 | 07682 | ||||||||||
| HIV | Systematic lupus erythematosus | 559 | 1 | 25 | 04 | 001 | 226 | 038 | 05355 | ||||||||||
| HIV | Thyrotoxicosis | 5601 | 16 | 141 | 114 | 065 | 185 | 014 | 07078 | ||||||||||
| HIV | Ulcerative colitis | 10536 | 57 | 408 | 14 | 106 | 181 | 605 | 00139 |
| HIV b4 autos | |||||||||||||||||||
| exposure | outcome | obs in ref cohort | obs | exp | rate ratio | low CI | upr CI | chi-sq | p-value | ||||||||||
| HIV | Addisons disease | 1516 | 18 | 26 | 69 | 408 | 1094 | 8394 | 0 | ||||||||||
| HIV | Ankylosing spondylitis | 3802 | 2 | 108 | 019 | 002 | 067 | 638 | 00116 | ||||||||||
| HIV | Autoimmune haemolytic anaemia | 1382 | 5 | 15 | 325 | 105 | 761 | 568 | 00171 | ||||||||||
| HIV | Chronic active hepatitis | 507 | 4 | 08 | 517 | 14 | 1332 | 953 | 0002 | ||||||||||
| HIV | Coeliac disease | 6921 | 7 | 14 | 05 | 02 | 103 | 302 | 00822 | ||||||||||
| HIV | Crohns disease | 10404 | 16 | 299 | 053 | 031 | 087 | 603 | 00141 | ||||||||||
| HIV | ITP | 3966 | 21 | 57 | 368 | 227 | 563 | 3813 | 0 | ||||||||||
| HIV | Myxoedema | 153406 | 72 | 1414 | 051 | 04 | 064 | 3362 | 0 | ||||||||||
| HIV | Pernicious anaemia | 14387 | 3 | 78 | 038 | 008 | 112 | 24 | 01217 | ||||||||||
| HIV | Polymyositis | 518 | 9 | 13 | 682 | 31 | 1305 | 3841 | 0 | ||||||||||
| HIV | Primary biliary cirrhosis | 1609 | 1 | 19 | 053 | 001 | 298 | 007 | 0787 | ||||||||||
| HIV | Psoriasis | 15618 | 43 | 412 | 104 | 075 | 141 | 004 | 08421 | ||||||||||
| HIV | Rheumatoid arthritis | 44692 | 28 | 521 | 054 | 036 | 078 | 1067 | 00011 | ||||||||||
| HIV | Scleroderma | 1636 | 1 | 22 | 046 | 001 | 254 | 022 | 06394 | ||||||||||
| HIV | Sjogrens syndrome | 3536 | 0 | 38 | 0 | 0 | 097 | 286 | 0091 | ||||||||||
| HIV | Systematic lupus erythematosus | 3060 | 9 | 86 | 105 | 048 | 199 | 0 | 09745 | ||||||||||
| HIV | Thyrotoxicosis | 21626 | 27 | 291 | 093 | 061 | 135 | 009 | 07631 | ||||||||||
| HIV | Ulcerative colitis | 16648 | 45 | 489 | 092 | 067 | 123 | 024 | 06256 |
| HIV b4 autos | |||||||||||||||||||
| exposure | outcome | obs in ref cohort | obs | exp | rate ratio | low CI | upr CI | chi-sq | p-value | ||||||||||
| HIV | Addisons disease | 686 | 3 | 11 | 271 | 056 | 796 | 175 | 01859 | ||||||||||
| HIV | Ankylosing spondylitis | 1807 | 0 | 52 | 0 | 0 | 071 | 421 | 00401 | ||||||||||
| HIV | Autoimmune haemolytic anaemia | 586 | 1 | 06 | 169 | 004 | 943 | 001 | 09035 | ||||||||||
| HIV | Chronic active hepatitis | 167 | 1 | 02 | 466 | 012 | 2633 | 038 | 05397 | ||||||||||
| HIV | Coeliac disease | 3282 | 1 | 61 | 016 | 0 | 091 | 346 | 00628 | ||||||||||
| HIV | Crohns disease | 4709 | 3 | 132 | 023 | 005 | 066 | 717 | 00074 | ||||||||||
| HIV | ITP | 1824 | 6 | 25 | 236 | 087 | 515 | 344 | 00636 | ||||||||||
| HIV | Myxoedema | 75495 | 29 | 716 | 04 | 027 | 058 | 2479 | 0 | ||||||||||
| HIV | Pernicious anaemia | 6772 | 0 | 42 | 0 | 0 | 089 | 322 | 00729 | ||||||||||
| HIV | Polymyositis | 216 | 1 | 05 | 188 | 005 | 1057 | 0 | 09632 | ||||||||||
| HIV | Primary biliary cirrhosis | 690 | 1 | 07 | 142 | 004 | 794 | 006 | 08079 | ||||||||||
| HIV | Psoriasis | 7528 | 16 | 196 | 082 | 047 | 133 | 048 | 0489 | ||||||||||
| HIV | Rheumatoid arthritis | 20701 | 11 | 254 | 043 | 022 | 077 | 763 | 00058 | ||||||||||
| HIV | Scleroderma | 725 | 0 | 1 | 0 | 0 | 362 | 026 | 0607 | ||||||||||
| HIV | Sjogrens syndrome | 1700 | 0 | 17 | 0 | 0 | 218 | 084 | 03586 | ||||||||||
| HIV | Systematic lupus erythematosus | 1357 | 3 | 36 | 083 | 017 | 243 | 0 | 09495 | ||||||||||
| HIV | Thyrotoxicosis | 10097 | 13 | 136 | 095 | 051 | 163 | 0 | 09755 | ||||||||||
| HIV | Ulcerative colitis | 7325 | 15 | 207 | 072 | 04 | 119 | 131 | 02521 |
| HIV b4 autos | |||||||||||||||||||
| exposure | outcome | obs in ref cohort | obs | exp | rate ratio | low CI | upr CI | chi-sq | p-value | ||||||||||
| HIV | Addisons disease | 830 | 15 | 15 | 998 | 556 | 1655 | 11032 | 0 | ||||||||||
| HIV | Ankylosing spondylitis | 1995 | 2 | 56 | 035 | 004 | 128 | 174 | 01866 | ||||||||||
| HIV | Autoimmune haemolytic anaemia | 796 | 4 | 09 | 423 | 115 | 1088 | 687 | 00088 | ||||||||||
| HIV | Chronic active hepatitis | 340 | 3 | 06 | 537 | 11 | 1582 | 668 | 00098 | ||||||||||
| HIV | Coeliac disease | 3639 | 6 | 79 | 076 | 028 | 165 | 025 | 0616 | ||||||||||
| HIV | Crohns disease | 5695 | 13 | 167 | 078 | 041 | 133 | 061 | 04355 | ||||||||||
| HIV | ITP | 2142 | 15 | 32 | 473 | 265 | 783 | 4024 | 0 | ||||||||||
| HIV | Myxoedema | 77911 | 43 | 698 | 062 | 045 | 083 | 992 | 00016 | ||||||||||
| HIV | Pernicious anaemia | 7615 | 3 | 37 | 082 | 017 | 239 | 001 | 09271 | ||||||||||
| HIV | Polymyositis | 302 | 8 | 08 | 1018 | 435 | 2031 | 5584 | 0 | ||||||||||
| HIV | Primary biliary cirrhosis | 919 | 0 | 12 | 0 | 0 | 317 | 038 | 05375 | ||||||||||
| HIV | Psoriasis | 8090 | 27 | 217 | 125 | 082 | 182 | 108 | 02985 | ||||||||||
| HIV | Rheumatoid arthritis | 23991 | 17 | 266 | 064 | 037 | 102 | 314 | 00763 | ||||||||||
| HIV | Scleroderma | 911 | 1 | 12 | 085 | 002 | 475 | 009 | 07639 | ||||||||||
| HIV | Sjogrens syndrome | 1836 | 0 | 21 | 0 | 0 | 176 | 121 | 02704 | ||||||||||
| HIV | Systematic lupus erythematosus | 1703 | 6 | 5 | 121 | 044 | 263 | 006 | 0813 | ||||||||||
| HIV | Thyrotoxicosis | 11529 | 14 | 155 | 09 | 049 | 151 | 007 | 0797 | ||||||||||
| HIV | Ulcerative colitis | 9323 | 30 | 282 | 106 | 072 | 152 | 006 | 08069 |
| HIV b4 autos | |||||||||||||||||||
| exposure | outcome | obs in ref cohort | obs | exp | rate ratio | low CI | upr CI | chi-sq | p-value | ||||||||||
| HIV | Addisons disease | 352 | 17 | 09 | 1992 | 1147 | 3236 | 27362 | 0 | ||||||||||
| HIV | Ankylosing spondylitis | 767 | 1 | 11 | 088 | 002 | 493 | 012 | 07296 | ||||||||||
| HIV | Autoimmune haemolytic anaemia | 306 | 7 | 04 | 1792 | 714 | 3736 | 9338 | 0 | ||||||||||
| HIV | Chronic active hepatitis | 118 | 6 | 02 | 3067 | 1103 | 6878 | 13684 | 0 | ||||||||||
| HIV | Coeliac disease | 1206 | 0 | 16 | 0 | 0 | 226 | 079 | 03752 | ||||||||||
| HIV | Crohns disease | 1896 | 15 | 5 | 3 | 167 | 496 | 1787 | 0 | ||||||||||
| HIV | ITP | 728 | 22 | 21 | 1068 | 665 | 1629 | 17803 | 0 | ||||||||||
| HIV | Myxoedema | 28047 | 13 | 163 | 08 | 042 | 136 | 048 | 04889 | ||||||||||
| HIV | Pernicious anaemia | 2773 | 1 | 09 | 106 | 003 | 593 | 021 | 06495 | ||||||||||
| HIV | Polymyositis | 113 | 1 | 01 | 785 | 02 | 4461 | 108 | 02995 | ||||||||||
| HIV | Primary biliary cirrhosis | 308 | 1 | 02 | 646 | 016 | 3624 | 077 | 03817 | ||||||||||
| HIV | Psoriasis | 3072 | 22 | 61 | 361 | 226 | 548 | 3875 | 0 | ||||||||||
| HIV | Rheumatoid arthritis | 9101 | 11 | 69 | 16 | 08 | 286 | 189 | 01697 | ||||||||||
| HIV | Scleroderma | 294 | 0 | 03 | 0 | 0 | 1121 | 009 | 07682 | ||||||||||
| HIV | Sjogrens syndrome | 565 | 2 | 05 | 436 | 053 | 1581 | 235 | 01253 | ||||||||||
| HIV | Systematic lupus erythematosus | 608 | 1 | 12 | 082 | 002 | 461 | 007 | 07944 | ||||||||||
| HIV | Thyrotoxicosis | 4243 | 5 | 43 | 118 | 038 | 275 | 001 | 09048 | ||||||||||
| HIV | Ulcerative colitis | 3123 | 17 | 75 | 229 | 133 | 367 | 1101 | 00009 |
| HIV b4 autos | |||||||||||||||||||
| exposure | outcome | obs in ref cohort | obs | exp | rate ratio | low CI | upr CI | chi-sq | p-value | ||||||||||
| HIV | Addisons disease | 821 | 1 | 01 | 78 | 02 | 4358 | 108 | 02995 | ||||||||||
| HIV | Ankylosing spondylitis | 1672 | 0 | 04 | 0 | 0 | 887 | 002 | 08966 | ||||||||||
| HIV | Autoimmune haemolytic anaemia | 1142 | 1 | 02 | 418 | 011 | 2333 | 028 | 05943 | ||||||||||
| HIV | Chronic active hepatitis | 300 | 1 | 01 | 1674 | 042 | 9401 | 323 | 00721 | ||||||||||
| HIV | Coeliac disease | 3003 | 0 | 04 | 0 | 0 | 836 | 001 | 09297 | ||||||||||
| HIV | Crohns disease | 4249 | 1 | 07 | 14 | 004 | 779 | 006 | 07988 | ||||||||||
| HIV | ITP | 2750 | 4 | 05 | 823 | 224 | 2109 | 1866 | 0 | ||||||||||
| HIV | Myxoedema | 111802 | 12 | 124 | 097 | 05 | 169 | 0 | 09748 | ||||||||||
| HIV | Pernicious anaemia | 13040 | 0 | 15 | 0 | 0 | 253 | 063 | 04283 | ||||||||||
| HIV | Polymyositis | 333 | 2 | 0 | 4371 | 527 | 15913 | 4594 | 0 | ||||||||||
| HIV | Primary biliary cirrhosis | 1120 | 0 | 01 | 0 | 0 | 3586 | 153 | 02162 | ||||||||||
| HIV | Psoriasis | 6100 | 2 | 15 | 131 | 016 | 472 | 0 | 09797 | ||||||||||
| HIV | Rheumatoid arthritis | 30228 | 7 | 41 | 172 | 069 | 355 | 146 | 02269 | ||||||||||
| HIV | Scleroderma | 909 | 0 | 01 | 0 | 0 | 3312 | 135 | 02449 | ||||||||||
| HIV | Sjogrens syndrome | 1883 | 0 | 02 | 0 | 0 | 1969 | 052 | 04704 | ||||||||||
| HIV | Systematic lupus erythematosus | 1056 | 0 | 02 | 0 | 0 | 1993 | 053 | 04648 | ||||||||||
| HIV | Thyrotoxicosis | 15247 | 4 | 19 | 21 | 057 | 538 | 134 | 0247 | ||||||||||
| HIV | Ulcerative colitis | 7697 | 5 | 16 | 317 | 103 | 74 | 541 | 002 |
| HIV b4 autos | |||||||||||||||||||
| exposure | outcome | obs in ref cohort | obs | exp | rate ratio | low CI | upr CI | chi-sq | p-value | ||||||||||
| HIV | Addisons disease | 326 | 3 | 03 | 893 | 183 | 2632 | 138 | 00002 | ||||||||||
| HIV | Ankylosing spondylitis | 971 | 0 | 14 | 0 | 0 | 272 | 054 | 04621 | ||||||||||
| HIV | Autoimmune haemolytic anaemia | 261 | 0 | 03 | 0 | 0 | 1419 | 022 | 06407 | ||||||||||
| HIV | Chronic active hepatitis | 143 | 1 | 01 | 733 | 018 | 415 | 096 | 03272 | ||||||||||
| HIV | Coeliac disease | 1492 | 0 | 11 | 0 | 0 | 331 | 034 | 05598 | ||||||||||
| HIV | Crohns disease | 1923 | 1 | 24 | 042 | 001 | 234 | 032 | 05686 | ||||||||||
| HIV | ITP | 712 | 3 | 09 | 329 | 068 | 964 | 274 | 00976 | ||||||||||
| HIV | Myxoedema | 30859 | 11 | 201 | 055 | 027 | 098 | 368 | 00552 | ||||||||||
| HIV | Pernicious anaemia | 1970 | 1 | 13 | 078 | 002 | 437 | 004 | 0844 | ||||||||||
| HIV | Polymyositis | 135 | 2 | 01 | 1436 | 172 | 5288 | 1309 | 00003 | ||||||||||
| HIV | Primary biliary cirrhosis | 377 | 1 | 02 | 575 | 015 | 3225 | 061 | 0435 | ||||||||||
| HIV | Psoriasis | 3545 | 5 | 48 | 104 | 034 | 244 | 002 | 08955 | ||||||||||
| HIV | Rheumatoid arthritis | 10250 | 4 | 88 | 045 | 012 | 116 | 214 | 01439 | ||||||||||
| HIV | Scleroderma | 463 | 0 | 03 | 0 | 0 | 1449 | 023 | 06285 | ||||||||||
| HIV | Sjogrens syndrome | 1053 | 1 | 05 | 2 | 005 | 1119 | 0 | 09991 | ||||||||||
| HIV | Systematic lupus erythematosus | 715 | 0 | 06 | 0 | 0 | 606 | 002 | 0888 | ||||||||||
| HIV | Thyrotoxicosis | 4076 | 4 | 35 | 115 | 031 | 295 | 0 | 0988 | ||||||||||
| HIV | Ulcerative colitis | 3588 | 8 | 49 | 164 | 071 | 324 | 141 | 02348 |
| HIV b4 autos | |||||||||||||||||||
| exposure | outcome | obs in ref cohort | obs | exp | rate ratio | low CI | upr CI | chi-sq | p-value | ||||||||||
| HIV | Addisons disease | 458 | 20 | 2 | 1017 | 615 | 1589 | 14969 | 0 | ||||||||||
| HIV | Ankylosing spondylitis | 1430 | 1 | 74 | 013 | 0 | 075 | 476 | 00291 | ||||||||||
| HIV | Autoimmune haemolytic anaemia | 195 | 9 | 11 | 854 | 385 | 1655 | 5027 | 0 | ||||||||||
| HIV | Chronic active hepatitis | 126 | 6 | 06 | 1068 | 385 | 2391 | 4141 | 0 | ||||||||||
| HIV | Coeliac disease | 2230 | 5 | 96 | 052 | 017 | 122 | 173 | 01884 | ||||||||||
| HIV | Crohns disease | 3262 | 22 | 203 | 108 | 068 | 164 | 007 | 07958 | ||||||||||
| HIV | ITP | 694 | 23 | 44 | 533 | 335 | 806 | 7409 | 0 | ||||||||||
| HIV | Myxoedema | 30770 | 47 | 922 | 051 | 037 | 068 | 2172 | 0 | ||||||||||
| HIV | Pernicious anaemia | 1664 | 3 | 43 | 07 | 014 | 204 | 015 | 07013 | ||||||||||
| HIV | Polymyositis | 127 | 3 | 1 | 316 | 064 | 945 | 246 | 01165 | ||||||||||
| HIV | Primary biliary cirrhosis | 359 | 1 | 14 | 07 | 002 | 393 | 0 | 09501 | ||||||||||
| HIV | Psoriasis | 6137 | 35 | 30 | 117 | 081 | 162 | 067 | 04141 | ||||||||||
| HIV | Rheumatoid arthritis | 10968 | 21 | 365 | 057 | 036 | 088 | 617 | 0013 | ||||||||||
| HIV | Scleroderma | 455 | 1 | 17 | 059 | 001 | 331 | 002 | 08849 | ||||||||||
| HIV | Sjogrens syndrome | 995 | 1 | 29 | 034 | 001 | 192 | 068 | 04097 | ||||||||||
| HIV | Systematic lupus erythematosus | 1279 | 7 | 63 | 112 | 045 | 231 | 001 | 09219 | ||||||||||
| HIV | Thyrotoxicosis | 4589 | 18 | 191 | 094 | 056 | 149 | 002 | 08979 | ||||||||||
| HIV | Ulcerative colitis | 5315 | 34 | 346 | 098 | 068 | 138 | 0 | 09893 |
| HIV b4 autos | |||||||||||||||||||
| exposure | outcome | obs in ref cohort | obs | exp | rate ratio | low CI | upr CI | chi-sq | p-value | ||||||||||
| HIV | Addisons disease | 213 | 11 | 1 | 1186 | 583 | 2166 | 9395 | 0 | ||||||||||
| HIV | Ankylosing spondylitis | 486 | 2 | 27 | 074 | 009 | 269 | 002 | 09025 | ||||||||||
| HIV | Autoimmune haemolytic anaemia | 66 | 2 | 03 | 627 | 074 | 2356 | 422 | 00398 | ||||||||||
| HIV | Chronic active hepatitis | 39 | 2 | 02 | 1257 | 147 | 4856 | 1072 | 00011 | ||||||||||
| HIV | Coeliac disease | 909 | 2 | 42 | 047 | 006 | 171 | 071 | 03994 | ||||||||||
| HIV | Crohns disease | 2215 | 7 | 111 | 063 | 025 | 13 | 118 | 02778 | ||||||||||
| HIV | ITP | 331 | 11 | 19 | 606 | 3 | 1098 | 4019 | 0 | ||||||||||
| HIV | Myxoedema | 7241 | 15 | 325 | 046 | 026 | 076 | 896 | 00028 | ||||||||||
| HIV | Pernicious anaemia | 472 | 0 | 17 | 0 | 0 | 212 | 089 | 03468 | ||||||||||
| HIV | Polymyositis | 32 | 3 | 03 | 1034 | 203 | 3306 | 1533 | 00001 | ||||||||||
| HIV | Primary biliary cirrhosis | 59 | 0 | 03 | 0 | 0 | 1176 | 01 | 07528 | ||||||||||
| HIV | Psoriasis | 2551 | 23 | 109 | 213 | 135 | 32 | 1253 | 00004 | ||||||||||
| HIV | Rheumatoid arthritis | 2238 | 7 | 95 | 073 | 03 | 152 | 043 | 05128 | ||||||||||
| HIV | Scleroderma | 89 | 0 | 05 | 0 | 0 | 805 | 0 | 09596 | ||||||||||
| HIV | Sjogrens syndrome | 160 | 0 | 07 | 0 | 0 | 564 | 004 | 08448 | ||||||||||
| HIV | Systematic lupus erythematosus | 554 | 3 | 27 | 111 | 023 | 326 | 002 | 0899 | ||||||||||
| HIV | Thyrotoxicosis | 1784 | 6 | 88 | 068 | 025 | 148 | 062 | 04293 | ||||||||||
| HIV | Ulcerative colitis | 2667 | 15 | 151 | 1 | 056 | 165 | 001 | 09074 |

35-54
55-64
65+
interval lt1yr
1-4
5+
1+
males
females
The CHARCOT PROJECTINSPIRE
Isentress (Raltegravir)Pilot Study in Relapsing MS
bull Aims to investigate the concept of HERV+-EBV or herpes viruses as an etiology or trigger for MS
bull Disease controlling rather than disease modifying therapy
INSPIRE Design
bull Pilot study enrolling patients with active RRMS as defined by +ve Gd-enhanced MRI or documented relapse in previous 12 months
bull Baseline (3 months) followed by treatment (3 months)
bull Open label treatment phase with Raltegravir 400mg twice a day
INSPIRE Design 2bull 1deg Outcome number and rate of development
of Gd-enhanced lesionsbull 2deg outcomes are disability and quality-of-lifeStatistical considerations19 subjects need to complete trial to achieve 95 significance with 80 power for a 40 reduction in MS lesions compared with baseline (according to Sormani et al)
Trial design
change in gradient
change(in means)
V1 V2(screening before
visit)
V3 V4 V5 V6 V7 V8after
Raltegravirdispensed
A statistically significantchange in means is not inthis situation consistent
with a reduction inoutcome values due tointervention
3
Trial design
QOL QOL QOL QOL QOL QOL QOL
MSFC MSFC MSFC MSFC MSFC MSFC MSFCEDSS EDSS EDSS EDSS EDSS
blood blood blood blood blood blood blood blood
MRI MRI MRI MRI MRI MRI MRI
V1 V2 V3 V4 V5 V6 V7 V8(screening before after
visit)
bull Exploratory studybull Danger of Type II error of missing a real association arguably greater than
danger of Type I error of highlighting a spurious association
4
DATA
bull Patient socio-demographic and baseline
bull MRI
bull Viral and biomarkers
bull Disability
bull Quality of life
bull Laboratory safety tests
2
Patient socio-demographic and baseline
N mean min maxITTAge at baselineyrs 20 4073 3115 5299Height cm 18 16904 15600 18300Weight kg 18 7873 5190 10970Baseline EDSS 20 240 000 400Number of relapses in past year 20 150 100 300
PPAge at baselineyrs 16 4162 3115 5299Height cm 14 16891 15600 18000Weight kg 14 7790 5190 10830Baseline EDSS 16 225 000 350Number of relapses in past year 16 144 100 300
6
Patient adherenceITT PP
Visit mean
6 Number of tablets dispensed 60 60Number of tablets returned 235 269Adherence percentagea 9608 9552
7 Number of tablets dispensed 63 6375Number of tablets returned 72 675Adherence percentagea 88 8875
8 Number of tablets dispensed 597 5963Number of tablets returned 81 863Adherence percentagea 824 805
Over all three visits Number of tablets dispensed 609 6113Number of tablets returned 588 602Adherence percentagea 8883 8826
a100(tablets dispensed - tablets returned)tablets dispensed
7
MRI Total T1 Gd-enhancing lesionsTotal T1 (Gad enhanced) lesion rates
Before (visits 34 and 5) After (visits 67 and 8) Within-patient changea
Mean monthly Mean monthly Change Weightedrate rate in rate rate ratiob
ITT (n=20) 289 302 012 103PP (n=16) 251 233 -018 092
aChanges calculated after-before or afterbeforebRatios averaged on log scale before back-transforming substituting 01 for zero rates Weighted ratios pooled byweighting for total subject counts
Poisson regression analysis after vs before
ITT rate ratio after vs before as 104(95 CI 85 129) P=0681PP rate ratio after vs before as093(95 CI 072 120) P=0577
Poisson regression analysis gradient after vs gradient beforeITT test of difference in gradients P=0659PP test of difference in gradients P=0463
8
MRI New T1 Gd-enhancing lesionsNew T1 (Gad enhanced) lesion rates
Before (visits 34 and 5) After (visits 67 and 8) Within-patient changea
Mean monthly Mean monthly Changerate rate in rate
ITT (n=20) 143 167 023PP (n=16) 098 115 017
aChanges calculated after-before or afterbefore
Poisson regression analysis after vs beforeITT rate ratio after vs before as 116(95 CI 087 155) P=0314PP rate ratio after vs before as 116 (95 CI079 172) P=0456
Poisson regression analysis gradient after vs gradient beforeITT test of difference in gradients P=0562PP test of difference in gradients P=0137
9
MRI T1 Gd lesions
ITT Patients in order of difference in rate
010008010019010015010001010016010009010028010027010003010005010007010010010011010013010014010017010023
010012010020010024
-4 -2 0 2difference in rate lesions per month
Difference after - before
4
13
MRI lesions summary
Lesion outcomes provide no statistical evidence consistent with aneffect of raltegravir
14
Viral and biomarker data Before vs AfterBaselines (visit 2) Before (345) After (678)
Variable N mean sd N mean sd mean sd
MSRV A CtGAPDH Ct(dim-less) 20 094 01 20 093 007 20 092 007MSRV M CtGAPDH Ct(dim-less) 20 133 006 20 133 006 20 132 007TB HE23 CtGAPDH Ct(dim-less) 20 127 014 20 124 013 20 124 013HERV-W A CtGAPDH Ct(dim-less) 20 116 016 20 118 01 20 118 009HERV-W M CtGAPDH Ct(dim-less) 20 147 021 20 144 015 20 145 013TB HE1113 CtGAPDH Ct(dim-less) 20 127 01 20 128 006 20 129 006IL-8 pgmL 20 2805 8683 20 852 232 20 934 286HERV-WMSRV Gag Flix B cells (d-less) 13 118 011 19 119 01 18 115 006HERV-HF Gag Flix B cells (d-less) 12 114 01 17 108 007 20 112 011HERV-HF Env (H1) Flix B cells (d-less) 11 112 007 18 106 005 17 11 008HERV-HF Env (H3) Flix B cells (d-less) 19 156 024 20 147 015 20 152 016HERV-HF Env (W1) Flix B cells (d-less) 18 131 013 20 123 01 20 123 01HERV-HF Env (W3) Flix B cells (d-less) 17 125 015 20 122 009 20 124 017prop of B cells in sample () 19 914 38 20 859 306 20 905 379prop of monocytes in sample () 19 1533 92 20 1808 641 20 1609 623
HERV-WMSRV Gag Flix monocytes (d-less) 11 114 009 16 116 005 15 115 007MSRV F Gag Flix monocytes (d-less) 13 116 01 17 111 005 16 122 019Env (H1) Flix monocytes (d-less) 15 115 012 18 112 008 17 115 006Env (H3) Flix monocytes (d-less) 19 159 018 20 155 019 20 157 02Env (W1) Flix monocytes (d-less) 15 115 01 19 111 007 19 108 005Env (W3) Flix monocytes (d-less) 13 116 008 19 112 007 18 116 009HCRP ngmL 20 178383 21238 20 189945 176902 20 243527 224115CD163 ngmL 20 45667 15463 20 4239 10536 20 44257 12468EBV Copiesmicrolitre 16 21371 79687 16 238 6672 15 668 21274
Viral and biomarker data Before vs AfterHERV-WMSRV Gag Flix B cellsSignificant drop in means in ITT and PPNo significant change in gradient but steeper gradient before
HERV-WMSRV Gag Flix B cellsPP Individual subjects and fitted line
Significant overall drop notattributable to intervention
Similar story for
Env (W1) Flix monocytes
2 3 4 5 6 7 8monthly visits
Solid line fitted by modelA significant drop in means cannot be explained by intervention since decline is steeper before
17
MRI PP Persisting T1 Gd-enhancing lesionsBefore After Within-patient changea
Mean rate Mean rate Change in ratePP (n=16) 153 119 -034
80 of total reductionoccurs before theintervention
attributing the overallreduction to the interventioneven if reduction weresignificant would not be
-013 (P=0469)
P=0762-003 (P=0835)
credible
11
MRI T2 lesions
T2 lesion counts Observed at visits 5 (before) and 8 (after)
Before After Within-patient changea
Mean count Mean count Mean count changeP=0472
weighted ratiob
ITT 445PP 313
465 020P=0462331 019
105107
aChanges calculated after-before or afterbeforebWithin-patient ratios averaged on log scale before back transforming substituting 01 for zero counts Weighted meanratios pooled on log scale by weighting for lesion counts
12
Viral and biomarker data change vs T1 Gd lesion changePositive correlation
HERV-WMSRV Gag Flix B cells r=046 P=0057 ITT r=048 P=0086 PP
9
10
Additional analysis
A higher T1 Gd lesioncount at any visit isassociated with higher714
1619
28 27
20
1712
values of HERV-WMSRVGag Flix B cells at that visitP=0029 (ITT)
15
8 1
-3 -2 -1 0 1 2change in T1 lesion rate
Suggestion of decrease in HERV-WMSRV Gag Flix B cells associated with decrease in Gd-enhanced lesion rate PP r=-048 P=0086
23
Patients with a decrease in lesion count (eg patient 8) tend to have a decrease or a greater decrease in the biomarker than patients with an increase in lesion count (eg patient 20)
Viral and biomarker data summary
Some statistically significant changes in gradient before vs after wereobserved However whether these are consistent with an effect ofraltegravir depends partly on biological plausibility
A very small number of statistically significant correlations wereobserved between changes in these measures and changes in T1 Gdlesion counts their interpretation is again heavily dependent onbiological plausibility
Because of the number of measurestests any significant resultsshould be treated with caution Since results are singled out on thebasis of statistical significance rather than prior hypothesis Type Ierror is likely
25
Viral and biomarker data Before vs AfterHCRP ngmLSignificant increase in means in ITT and PPNo significant change in (positive) gradient similar slightly steeper gradient after
ITT------------------------------------------------------------------------------
| gradient SE z P-value [95 Conf Interval]-------------+----------------------------------------------------------------
before | 1221482 1495142 082 0414 -1708943 4151908after | 1406076 1495142 094 0347 -1524349 4336501
------------------------------------------------------------------------------
Significant overall increase not credibly attributable to intervention since the gradientbefore though non-significant is too similar to the gradient after intervention
18
Quality of life data summary
A number of measures showed statistically significant improvementsin well-being or a slowing of deterioration in the period aftercompared to before intervention
Although consistent with an effect of raltegravir this is most crediblyattributable to the placebo effect of patients receiving an unblindedintervention rather than to any action of the drug
The study design of not having a control group or a cross-over designmitigated against determining the possible effect of the interventionon Q0L
31
Viral and biomarker data Before vs AfterEnv (W3) Flix monocytesNon-significant decline before becomes borderline significant increase afterand significant change in gradient
Env (W3) Flix monocytesITT Individual subjects and fitted line
-002 P=0200
As before biologicalplausibility important bothfor change displayed andfor negative correlation
with Gd T1 lesions
+002 P=0055
P=0047
2 3 4 5 6 7 8monthly visits
Significant change in gradient in ITT (P=0047) and borderline in PP (P=0089)Change in means after - before negatively correlated withchange in rate of Gd enhancing T1 lesions r=-054 P=0015
21
Disability data
Summary of changes after-before
N mean sdEDSS 20 014 045 Neither change nor gradient change significant
MSFC 20 023 028 [Both change and change in gradient significant]9HPT peg speed 20 0003 0003 Highly significant improvementWalk speed (fs) 20 -004 047 Neither change nor gradient change significantPASAT score 20 466 521 Highly significant improvement
PASAT------------------------------------------------------------------------------
| gradient SE z P-value [95 Conf Interval]-------------+----------------------------------------------------------------
before | 2478954 4594816 540 0000 1578387 3379522after | 6377749 4534625 141 0160 -2509954 1526545
------------------------------------------------------------------------------
bull There is a significant gradient changebull But rate of improvement substantially greater before than after intervention
27
Quality of life data
Summary of changes after-before
change inITT n means
PQ - SF36 - Physical Functional Score (PF) 20 -092
PQ - SF36 - Role-Physical Scale (RP) 20 -948PQ - SF36 - Bodily Pain Scale (BP) 20 -542
PQ - SF36 - General Health Scale (GH) 20 -467
PQ - SF36 - Vitality Scale (VT) 20 506 PQ - SF36 - Social Functioning Scale (SF) 20 245 PQ - SF36 - Role Emotional Scale (RE) 20 -862 no statistically significant changes
PQ - SF36 - Mental Health Scale (MH) 20 572 PQ - PFA - Patient Fatigue Assessment 20 -151PQ - PPA - Patient Pain Assessment 19 407PQ - MSIS - Total Score 20 -210 no statistically significant changes
PQ - MSWS-12 - MSWS Total Score 20 -035
30
Quality of life dataSummary of changes after-before
change inITT n means
PQ - SF36 - Physical Functional Score (PF) 20 -092PQ - SF36 - Role-Physical Scale (RP) 20 -948PQ - SF36 - Bodily Pain Scale (BP) 20 -542PQ - SF36 - General Health Scale (GH) 20 -467PQ - SF36 - Vitality Scale (VT) 20 506
+ = improvement
PQ - SF36 - Social Functioning Scale (SF) 20 245PQ - SF36 - Role Emotional Scale (RE) 20 -862PQ - SF36 - Mental Health Scale (MH) 20 572PQ - PFA - Patient Fatigue Assessment 20 -151PQ - PPA - Patient Pain Assessment 19 407 - = improvementPQ - MSIS - Total Score 20 -210PQ - MSWS-12 - MSWS Total Score 20 -035
29
Disability data
Summary of changes after-before
N mean sdEDSS 20 014 045 Neither change nor gradient change significant
MSFC 20 023 028 [Both change and change in gradient significant]9HPT peg speed 20 0003 0003 Highly significant improvementWalk speed (fs) 20 -004 047 Neither change nor gradient change significantPASAT score 20 466 521
9HPT peg speed------------------------------------------------------------------------------
ITT | gradient SE z P-value [95 Conf Interval]-------------+----------------------------------------------------------------
before | 0009916 0002372 418 0000 0005267 0014565after | 000545 0002363 231 0021 0000818 0010082
------------------------------------------------------------------------------
bull No significant gradient changebull But rate of improvement substantially greater before than after intervention
26
Acknowledgementsbull Unit for Healthcare Epidemiology Oxford
ndash Raph Goldacrendash Michael Goldacrendash David Yeates
bull QMULbull Gavin Giovannoni
bull The Albion Centrebull Hubert Maruszak
bull UCLbull Robin Weiss
Laboratory safety tests
32
Laboratory safety tests significant changes
ITT change gradient gradient change inbefore after gradient
ADJUSTED CALCIUM SERUM +002 -000003 +0008 P=0406 increase could bep=0025 pgt09 p=0149 due intervention
CHLORIDE SERUM -075 +014 -031 p=0194 decrease could bep=0055 p=0503 p=0103 due to intervention
CHOLESTEROL SERUM +028 +008 +003 p=0437 increase notp=0004 p=0059 p=0521 plausibly duehellip
GLUCOSE PLASMA -018 +008 -015 p=0072 gradient changep=0196 p=0284 p=0037 could be duehellip
LDL CHOLESTEROL SERUM +017 +006 +0004 p=0432 increase notp=0018 p=0162 pgt09 plausibly duehellip
PLATELET COUNT +686 -027 +259 p=0352 increase could bep=0040 p=0880 p=0129 duehellip
WHITE BLOOD COUNT PP +022 +006 +010 p=0827 increase notp=0049 p=0579 p=0331 plausibly due
33
- Diapositive numeacutero 1
- Diapositive numeacutero 2
- Dr Jean-Martin Charcot
- Diapositive numeacutero 4
- Diapositive numeacutero 5
- Diapositive numeacutero 6
- Viruses and MS
- Are human endogenous retroviruses pathogenic An approach to testing the hypothesis
- How HERVs may induce autoimmune response
- Diapositive numeacutero 10
- Diapositive numeacutero 11
- Diapositive numeacutero 12
- Diapositive numeacutero 13
- How many cases of HIV and MS have been reported
- What do cohort studies show
- What is the Risk of Developing Multiple Sclerosis if you have HIV and are on HIV Anti-retroviral therapy
- Methods
- Diapositive numeacutero 18
- Diapositive numeacutero 19
- NHS Data on UK Healthcare events 1999-2011
- NHS Cohort gt One year after Exposure (HIV) Contact
- Diapositive numeacutero 22
- The CHARCOT PROJECTINSPIRE Isentress (Raltegravir)Pilot Study in Relapsing MS
- INSPIRE Design
- INSPIRE Design 2
- Diapositive numeacutero 26
- Diapositive numeacutero 27
- Diapositive numeacutero 28
- Diapositive numeacutero 29
- Diapositive numeacutero 30
- Diapositive numeacutero 31
- Diapositive numeacutero 32
- Diapositive numeacutero 34
- Diapositive numeacutero 35
- Diapositive numeacutero 36
- Diapositive numeacutero 37
- Diapositive numeacutero 38
- Diapositive numeacutero 39
- Diapositive numeacutero 40
- Diapositive numeacutero 41
- Diapositive numeacutero 42
- Diapositive numeacutero 43
- Diapositive numeacutero 44
- Diapositive numeacutero 45
- Diapositive numeacutero 47
- Diapositive numeacutero 48
- Diapositive numeacutero 49
- Diapositive numeacutero 50
- Acknowledgements
- Diapositive numeacutero 52
- Diapositive numeacutero 53
- Diapositive numeacutero 54
-
| HIV b4 autos | |||||||||||||||||||
| exposure | outcome | obs in ref cohort | obs | exp | rate ratio | low CI | upr CI | chi-sq | p-value | ||||||||||
| HIV | Addisons disease | 1107 | 13 | 15 | 881 | 468 | 1513 | 814 | 0 | ||||||||||
| HIV | Ankylosing spondylitis | 1686 | 0 | 22 | 0 | 0 | 164 | 136 | 02435 | ||||||||||
| HIV | Autoimmune haemolytic anaemia | 911 | 3 | 05 | 638 | 131 | 187 | 873 | 00031 | ||||||||||
| HIV | Chronic active hepatitis | 435 | 3 | 03 | 915 | 188 | 2693 | 143 | 00002 | ||||||||||
| HIV | Coeliac disease | 4991 | 3 | 76 | 04 | 008 | 116 | 218 | 01395 | ||||||||||
| HIV | Crohns disease | 6362 | 4 | 119 | 034 | 009 | 086 | 457 | 00325 | ||||||||||
| HIV | ITP | 2504 | 11 | 27 | 411 | 205 | 737 | 2278 | 0 | ||||||||||
| HIV | Myxoedema | 142597 | 33 | 977 | 034 | 023 | 047 | 4221 | 0 | ||||||||||
| HIV | Pernicious anaemia | 11732 | 2 | 49 | 04 | 005 | 146 | 121 | 02717 | ||||||||||
| HIV | Polymyositis | 395 | 3 | 05 | 622 | 128 | 183 | 837 | 00038 | ||||||||||
| HIV | Primary biliary cirrhosis | 1605 | 1 | 12 | 086 | 002 | 482 | 01 | 07507 | ||||||||||
| HIV | Psoriasis | 9262 | 7 | 129 | 054 | 022 | 111 | 229 | 01305 | ||||||||||
| HIV | Rheumatoid arthritis | 37706 | 11 | 28 | 039 | 02 | 07 | 969 | 00018 | ||||||||||
| HIV | Scleroderma | 1581 | 1 | 15 | 066 | 002 | 369 | 0 | 09916 | ||||||||||
| HIV | Sjogrens syndrome | 3640 | 0 | 31 | 0 | 0 | 12 | 215 | 01424 | ||||||||||
| HIV | Systematic lupus erythematosus | 3109 | 9 | 73 | 123 | 056 | 233 | 019 | 06667 | ||||||||||
| HIV | Thyrotoxicosis | 20268 | 16 | 193 | 083 | 047 | 135 | 04 | 05258 | ||||||||||
| HIV | Ulcerative colitis | 9235 | 5 | 155 | 032 | 01 | 075 | 65 | 00108 |
| HIV b4 autos | |||||||||||||||||||
| exposure | outcome | obs in ref cohort | obs | exp | rate ratio | low CI | upr CI | chi-sq | p-value | ||||||||||
| HIV | Addisons disease | 761 | 22 | 2 | 1108 | 69 | 169 | 18634 | 0 | ||||||||||
| HIV | Ankylosing spondylitis | 2883 | 3 | 97 | 031 | 006 | 091 | 395 | 0047 | ||||||||||
| HIV | Autoimmune haemolytic anaemia | 777 | 9 | 15 | 619 | 282 | 118 | 3371 | 0 | ||||||||||
| HIV | Chronic active hepatitis | 190 | 7 | 07 | 1106 | 439 | 2324 | 5245 | 0 | ||||||||||
| HIV | Coeliac disease | 3136 | 4 | 81 | 05 | 013 | 127 | 158 | 02085 | ||||||||||
| HIV | Crohns disease | 5938 | 27 | 231 | 117 | 077 | 171 | 051 | 04754 | ||||||||||
| HIV | ITP | 2190 | 32 | 52 | 628 | 428 | 889 | 13471 | 0 | ||||||||||
| HIV | Myxoedema | 38856 | 52 | 60 | 087 | 065 | 114 | 095 | 0331 | ||||||||||
| HIV | Pernicious anaemia | 5428 | 2 | 38 | 052 | 006 | 189 | 046 | 04974 | ||||||||||
| HIV | Polymyositis | 236 | 7 | 1 | 732 | 291 | 1531 | 3116 | 0 | ||||||||||
| HIV | Primary biliary cirrhosis | 312 | 1 | 09 | 115 | 003 | 648 | 016 | 06935 | ||||||||||
| HIV | Psoriasis | 9428 | 58 | 344 | 169 | 128 | 219 | 1556 | 00001 | ||||||||||
| HIV | Rheumatoid arthritis | 16087 | 28 | 31 | 09 | 06 | 131 | 02 | 06538 | ||||||||||
| HIV | Scleroderma | 349 | 0 | 1 | 0 | 0 | 366 | 026 | 06107 | ||||||||||
| HIV | Sjogrens syndrome | 461 | 2 | 12 | 17 | 02 | 617 | 009 | 07682 | ||||||||||
| HIV | Systematic lupus erythematosus | 559 | 1 | 25 | 04 | 001 | 226 | 038 | 05355 | ||||||||||
| HIV | Thyrotoxicosis | 5601 | 16 | 141 | 114 | 065 | 185 | 014 | 07078 | ||||||||||
| HIV | Ulcerative colitis | 10536 | 57 | 408 | 14 | 106 | 181 | 605 | 00139 |
| HIV b4 autos | |||||||||||||||||||
| exposure | outcome | obs in ref cohort | obs | exp | rate ratio | low CI | upr CI | chi-sq | p-value | ||||||||||
| HIV | Addisons disease | 1516 | 18 | 26 | 69 | 408 | 1094 | 8394 | 0 | ||||||||||
| HIV | Ankylosing spondylitis | 3802 | 2 | 108 | 019 | 002 | 067 | 638 | 00116 | ||||||||||
| HIV | Autoimmune haemolytic anaemia | 1382 | 5 | 15 | 325 | 105 | 761 | 568 | 00171 | ||||||||||
| HIV | Chronic active hepatitis | 507 | 4 | 08 | 517 | 14 | 1332 | 953 | 0002 | ||||||||||
| HIV | Coeliac disease | 6921 | 7 | 14 | 05 | 02 | 103 | 302 | 00822 | ||||||||||
| HIV | Crohns disease | 10404 | 16 | 299 | 053 | 031 | 087 | 603 | 00141 | ||||||||||
| HIV | ITP | 3966 | 21 | 57 | 368 | 227 | 563 | 3813 | 0 | ||||||||||
| HIV | Myxoedema | 153406 | 72 | 1414 | 051 | 04 | 064 | 3362 | 0 | ||||||||||
| HIV | Pernicious anaemia | 14387 | 3 | 78 | 038 | 008 | 112 | 24 | 01217 | ||||||||||
| HIV | Polymyositis | 518 | 9 | 13 | 682 | 31 | 1305 | 3841 | 0 | ||||||||||
| HIV | Primary biliary cirrhosis | 1609 | 1 | 19 | 053 | 001 | 298 | 007 | 0787 | ||||||||||
| HIV | Psoriasis | 15618 | 43 | 412 | 104 | 075 | 141 | 004 | 08421 | ||||||||||
| HIV | Rheumatoid arthritis | 44692 | 28 | 521 | 054 | 036 | 078 | 1067 | 00011 | ||||||||||
| HIV | Scleroderma | 1636 | 1 | 22 | 046 | 001 | 254 | 022 | 06394 | ||||||||||
| HIV | Sjogrens syndrome | 3536 | 0 | 38 | 0 | 0 | 097 | 286 | 0091 | ||||||||||
| HIV | Systematic lupus erythematosus | 3060 | 9 | 86 | 105 | 048 | 199 | 0 | 09745 | ||||||||||
| HIV | Thyrotoxicosis | 21626 | 27 | 291 | 093 | 061 | 135 | 009 | 07631 | ||||||||||
| HIV | Ulcerative colitis | 16648 | 45 | 489 | 092 | 067 | 123 | 024 | 06256 |
| HIV b4 autos | |||||||||||||||||||
| exposure | outcome | obs in ref cohort | obs | exp | rate ratio | low CI | upr CI | chi-sq | p-value | ||||||||||
| HIV | Addisons disease | 686 | 3 | 11 | 271 | 056 | 796 | 175 | 01859 | ||||||||||
| HIV | Ankylosing spondylitis | 1807 | 0 | 52 | 0 | 0 | 071 | 421 | 00401 | ||||||||||
| HIV | Autoimmune haemolytic anaemia | 586 | 1 | 06 | 169 | 004 | 943 | 001 | 09035 | ||||||||||
| HIV | Chronic active hepatitis | 167 | 1 | 02 | 466 | 012 | 2633 | 038 | 05397 | ||||||||||
| HIV | Coeliac disease | 3282 | 1 | 61 | 016 | 0 | 091 | 346 | 00628 | ||||||||||
| HIV | Crohns disease | 4709 | 3 | 132 | 023 | 005 | 066 | 717 | 00074 | ||||||||||
| HIV | ITP | 1824 | 6 | 25 | 236 | 087 | 515 | 344 | 00636 | ||||||||||
| HIV | Myxoedema | 75495 | 29 | 716 | 04 | 027 | 058 | 2479 | 0 | ||||||||||
| HIV | Pernicious anaemia | 6772 | 0 | 42 | 0 | 0 | 089 | 322 | 00729 | ||||||||||
| HIV | Polymyositis | 216 | 1 | 05 | 188 | 005 | 1057 | 0 | 09632 | ||||||||||
| HIV | Primary biliary cirrhosis | 690 | 1 | 07 | 142 | 004 | 794 | 006 | 08079 | ||||||||||
| HIV | Psoriasis | 7528 | 16 | 196 | 082 | 047 | 133 | 048 | 0489 | ||||||||||
| HIV | Rheumatoid arthritis | 20701 | 11 | 254 | 043 | 022 | 077 | 763 | 00058 | ||||||||||
| HIV | Scleroderma | 725 | 0 | 1 | 0 | 0 | 362 | 026 | 0607 | ||||||||||
| HIV | Sjogrens syndrome | 1700 | 0 | 17 | 0 | 0 | 218 | 084 | 03586 | ||||||||||
| HIV | Systematic lupus erythematosus | 1357 | 3 | 36 | 083 | 017 | 243 | 0 | 09495 | ||||||||||
| HIV | Thyrotoxicosis | 10097 | 13 | 136 | 095 | 051 | 163 | 0 | 09755 | ||||||||||
| HIV | Ulcerative colitis | 7325 | 15 | 207 | 072 | 04 | 119 | 131 | 02521 |
| HIV b4 autos | |||||||||||||||||||
| exposure | outcome | obs in ref cohort | obs | exp | rate ratio | low CI | upr CI | chi-sq | p-value | ||||||||||
| HIV | Addisons disease | 830 | 15 | 15 | 998 | 556 | 1655 | 11032 | 0 | ||||||||||
| HIV | Ankylosing spondylitis | 1995 | 2 | 56 | 035 | 004 | 128 | 174 | 01866 | ||||||||||
| HIV | Autoimmune haemolytic anaemia | 796 | 4 | 09 | 423 | 115 | 1088 | 687 | 00088 | ||||||||||
| HIV | Chronic active hepatitis | 340 | 3 | 06 | 537 | 11 | 1582 | 668 | 00098 | ||||||||||
| HIV | Coeliac disease | 3639 | 6 | 79 | 076 | 028 | 165 | 025 | 0616 | ||||||||||
| HIV | Crohns disease | 5695 | 13 | 167 | 078 | 041 | 133 | 061 | 04355 | ||||||||||
| HIV | ITP | 2142 | 15 | 32 | 473 | 265 | 783 | 4024 | 0 | ||||||||||
| HIV | Myxoedema | 77911 | 43 | 698 | 062 | 045 | 083 | 992 | 00016 | ||||||||||
| HIV | Pernicious anaemia | 7615 | 3 | 37 | 082 | 017 | 239 | 001 | 09271 | ||||||||||
| HIV | Polymyositis | 302 | 8 | 08 | 1018 | 435 | 2031 | 5584 | 0 | ||||||||||
| HIV | Primary biliary cirrhosis | 919 | 0 | 12 | 0 | 0 | 317 | 038 | 05375 | ||||||||||
| HIV | Psoriasis | 8090 | 27 | 217 | 125 | 082 | 182 | 108 | 02985 | ||||||||||
| HIV | Rheumatoid arthritis | 23991 | 17 | 266 | 064 | 037 | 102 | 314 | 00763 | ||||||||||
| HIV | Scleroderma | 911 | 1 | 12 | 085 | 002 | 475 | 009 | 07639 | ||||||||||
| HIV | Sjogrens syndrome | 1836 | 0 | 21 | 0 | 0 | 176 | 121 | 02704 | ||||||||||
| HIV | Systematic lupus erythematosus | 1703 | 6 | 5 | 121 | 044 | 263 | 006 | 0813 | ||||||||||
| HIV | Thyrotoxicosis | 11529 | 14 | 155 | 09 | 049 | 151 | 007 | 0797 | ||||||||||
| HIV | Ulcerative colitis | 9323 | 30 | 282 | 106 | 072 | 152 | 006 | 08069 |
| HIV b4 autos | |||||||||||||||||||
| exposure | outcome | obs in ref cohort | obs | exp | rate ratio | low CI | upr CI | chi-sq | p-value | ||||||||||
| HIV | Addisons disease | 352 | 17 | 09 | 1992 | 1147 | 3236 | 27362 | 0 | ||||||||||
| HIV | Ankylosing spondylitis | 767 | 1 | 11 | 088 | 002 | 493 | 012 | 07296 | ||||||||||
| HIV | Autoimmune haemolytic anaemia | 306 | 7 | 04 | 1792 | 714 | 3736 | 9338 | 0 | ||||||||||
| HIV | Chronic active hepatitis | 118 | 6 | 02 | 3067 | 1103 | 6878 | 13684 | 0 | ||||||||||
| HIV | Coeliac disease | 1206 | 0 | 16 | 0 | 0 | 226 | 079 | 03752 | ||||||||||
| HIV | Crohns disease | 1896 | 15 | 5 | 3 | 167 | 496 | 1787 | 0 | ||||||||||
| HIV | ITP | 728 | 22 | 21 | 1068 | 665 | 1629 | 17803 | 0 | ||||||||||
| HIV | Myxoedema | 28047 | 13 | 163 | 08 | 042 | 136 | 048 | 04889 | ||||||||||
| HIV | Pernicious anaemia | 2773 | 1 | 09 | 106 | 003 | 593 | 021 | 06495 | ||||||||||
| HIV | Polymyositis | 113 | 1 | 01 | 785 | 02 | 4461 | 108 | 02995 | ||||||||||
| HIV | Primary biliary cirrhosis | 308 | 1 | 02 | 646 | 016 | 3624 | 077 | 03817 | ||||||||||
| HIV | Psoriasis | 3072 | 22 | 61 | 361 | 226 | 548 | 3875 | 0 | ||||||||||
| HIV | Rheumatoid arthritis | 9101 | 11 | 69 | 16 | 08 | 286 | 189 | 01697 | ||||||||||
| HIV | Scleroderma | 294 | 0 | 03 | 0 | 0 | 1121 | 009 | 07682 | ||||||||||
| HIV | Sjogrens syndrome | 565 | 2 | 05 | 436 | 053 | 1581 | 235 | 01253 | ||||||||||
| HIV | Systematic lupus erythematosus | 608 | 1 | 12 | 082 | 002 | 461 | 007 | 07944 | ||||||||||
| HIV | Thyrotoxicosis | 4243 | 5 | 43 | 118 | 038 | 275 | 001 | 09048 | ||||||||||
| HIV | Ulcerative colitis | 3123 | 17 | 75 | 229 | 133 | 367 | 1101 | 00009 |
| HIV b4 autos | |||||||||||||||||||
| exposure | outcome | obs in ref cohort | obs | exp | rate ratio | low CI | upr CI | chi-sq | p-value | ||||||||||
| HIV | Addisons disease | 821 | 1 | 01 | 78 | 02 | 4358 | 108 | 02995 | ||||||||||
| HIV | Ankylosing spondylitis | 1672 | 0 | 04 | 0 | 0 | 887 | 002 | 08966 | ||||||||||
| HIV | Autoimmune haemolytic anaemia | 1142 | 1 | 02 | 418 | 011 | 2333 | 028 | 05943 | ||||||||||
| HIV | Chronic active hepatitis | 300 | 1 | 01 | 1674 | 042 | 9401 | 323 | 00721 | ||||||||||
| HIV | Coeliac disease | 3003 | 0 | 04 | 0 | 0 | 836 | 001 | 09297 | ||||||||||
| HIV | Crohns disease | 4249 | 1 | 07 | 14 | 004 | 779 | 006 | 07988 | ||||||||||
| HIV | ITP | 2750 | 4 | 05 | 823 | 224 | 2109 | 1866 | 0 | ||||||||||
| HIV | Myxoedema | 111802 | 12 | 124 | 097 | 05 | 169 | 0 | 09748 | ||||||||||
| HIV | Pernicious anaemia | 13040 | 0 | 15 | 0 | 0 | 253 | 063 | 04283 | ||||||||||
| HIV | Polymyositis | 333 | 2 | 0 | 4371 | 527 | 15913 | 4594 | 0 | ||||||||||
| HIV | Primary biliary cirrhosis | 1120 | 0 | 01 | 0 | 0 | 3586 | 153 | 02162 | ||||||||||
| HIV | Psoriasis | 6100 | 2 | 15 | 131 | 016 | 472 | 0 | 09797 | ||||||||||
| HIV | Rheumatoid arthritis | 30228 | 7 | 41 | 172 | 069 | 355 | 146 | 02269 | ||||||||||
| HIV | Scleroderma | 909 | 0 | 01 | 0 | 0 | 3312 | 135 | 02449 | ||||||||||
| HIV | Sjogrens syndrome | 1883 | 0 | 02 | 0 | 0 | 1969 | 052 | 04704 | ||||||||||
| HIV | Systematic lupus erythematosus | 1056 | 0 | 02 | 0 | 0 | 1993 | 053 | 04648 | ||||||||||
| HIV | Thyrotoxicosis | 15247 | 4 | 19 | 21 | 057 | 538 | 134 | 0247 | ||||||||||
| HIV | Ulcerative colitis | 7697 | 5 | 16 | 317 | 103 | 74 | 541 | 002 |
| HIV b4 autos | |||||||||||||||||||
| exposure | outcome | obs in ref cohort | obs | exp | rate ratio | low CI | upr CI | chi-sq | p-value | ||||||||||
| HIV | Addisons disease | 326 | 3 | 03 | 893 | 183 | 2632 | 138 | 00002 | ||||||||||
| HIV | Ankylosing spondylitis | 971 | 0 | 14 | 0 | 0 | 272 | 054 | 04621 | ||||||||||
| HIV | Autoimmune haemolytic anaemia | 261 | 0 | 03 | 0 | 0 | 1419 | 022 | 06407 | ||||||||||
| HIV | Chronic active hepatitis | 143 | 1 | 01 | 733 | 018 | 415 | 096 | 03272 | ||||||||||
| HIV | Coeliac disease | 1492 | 0 | 11 | 0 | 0 | 331 | 034 | 05598 | ||||||||||
| HIV | Crohns disease | 1923 | 1 | 24 | 042 | 001 | 234 | 032 | 05686 | ||||||||||
| HIV | ITP | 712 | 3 | 09 | 329 | 068 | 964 | 274 | 00976 | ||||||||||
| HIV | Myxoedema | 30859 | 11 | 201 | 055 | 027 | 098 | 368 | 00552 | ||||||||||
| HIV | Pernicious anaemia | 1970 | 1 | 13 | 078 | 002 | 437 | 004 | 0844 | ||||||||||
| HIV | Polymyositis | 135 | 2 | 01 | 1436 | 172 | 5288 | 1309 | 00003 | ||||||||||
| HIV | Primary biliary cirrhosis | 377 | 1 | 02 | 575 | 015 | 3225 | 061 | 0435 | ||||||||||
| HIV | Psoriasis | 3545 | 5 | 48 | 104 | 034 | 244 | 002 | 08955 | ||||||||||
| HIV | Rheumatoid arthritis | 10250 | 4 | 88 | 045 | 012 | 116 | 214 | 01439 | ||||||||||
| HIV | Scleroderma | 463 | 0 | 03 | 0 | 0 | 1449 | 023 | 06285 | ||||||||||
| HIV | Sjogrens syndrome | 1053 | 1 | 05 | 2 | 005 | 1119 | 0 | 09991 | ||||||||||
| HIV | Systematic lupus erythematosus | 715 | 0 | 06 | 0 | 0 | 606 | 002 | 0888 | ||||||||||
| HIV | Thyrotoxicosis | 4076 | 4 | 35 | 115 | 031 | 295 | 0 | 0988 | ||||||||||
| HIV | Ulcerative colitis | 3588 | 8 | 49 | 164 | 071 | 324 | 141 | 02348 |
| HIV b4 autos | |||||||||||||||||||
| exposure | outcome | obs in ref cohort | obs | exp | rate ratio | low CI | upr CI | chi-sq | p-value | ||||||||||
| HIV | Addisons disease | 458 | 20 | 2 | 1017 | 615 | 1589 | 14969 | 0 | ||||||||||
| HIV | Ankylosing spondylitis | 1430 | 1 | 74 | 013 | 0 | 075 | 476 | 00291 | ||||||||||
| HIV | Autoimmune haemolytic anaemia | 195 | 9 | 11 | 854 | 385 | 1655 | 5027 | 0 | ||||||||||
| HIV | Chronic active hepatitis | 126 | 6 | 06 | 1068 | 385 | 2391 | 4141 | 0 | ||||||||||
| HIV | Coeliac disease | 2230 | 5 | 96 | 052 | 017 | 122 | 173 | 01884 | ||||||||||
| HIV | Crohns disease | 3262 | 22 | 203 | 108 | 068 | 164 | 007 | 07958 | ||||||||||
| HIV | ITP | 694 | 23 | 44 | 533 | 335 | 806 | 7409 | 0 | ||||||||||
| HIV | Myxoedema | 30770 | 47 | 922 | 051 | 037 | 068 | 2172 | 0 | ||||||||||
| HIV | Pernicious anaemia | 1664 | 3 | 43 | 07 | 014 | 204 | 015 | 07013 | ||||||||||
| HIV | Polymyositis | 127 | 3 | 1 | 316 | 064 | 945 | 246 | 01165 | ||||||||||
| HIV | Primary biliary cirrhosis | 359 | 1 | 14 | 07 | 002 | 393 | 0 | 09501 | ||||||||||
| HIV | Psoriasis | 6137 | 35 | 30 | 117 | 081 | 162 | 067 | 04141 | ||||||||||
| HIV | Rheumatoid arthritis | 10968 | 21 | 365 | 057 | 036 | 088 | 617 | 0013 | ||||||||||
| HIV | Scleroderma | 455 | 1 | 17 | 059 | 001 | 331 | 002 | 08849 | ||||||||||
| HIV | Sjogrens syndrome | 995 | 1 | 29 | 034 | 001 | 192 | 068 | 04097 | ||||||||||
| HIV | Systematic lupus erythematosus | 1279 | 7 | 63 | 112 | 045 | 231 | 001 | 09219 | ||||||||||
| HIV | Thyrotoxicosis | 4589 | 18 | 191 | 094 | 056 | 149 | 002 | 08979 | ||||||||||
| HIV | Ulcerative colitis | 5315 | 34 | 346 | 098 | 068 | 138 | 0 | 09893 |
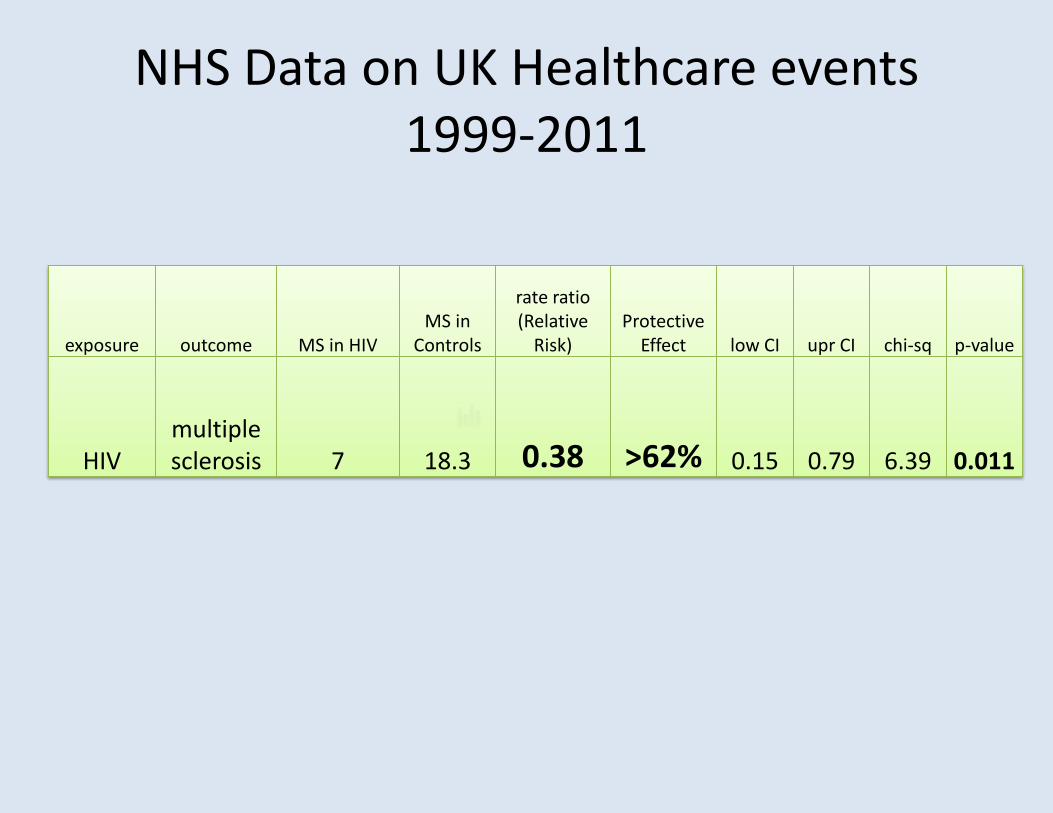
55-64
65+
interval lt1yr
1-4
5+
1+
males
females
The CHARCOT PROJECTINSPIRE
Isentress (Raltegravir)Pilot Study in Relapsing MS
bull Aims to investigate the concept of HERV+-EBV or herpes viruses as an etiology or trigger for MS
bull Disease controlling rather than disease modifying therapy
INSPIRE Design
bull Pilot study enrolling patients with active RRMS as defined by +ve Gd-enhanced MRI or documented relapse in previous 12 months
bull Baseline (3 months) followed by treatment (3 months)
bull Open label treatment phase with Raltegravir 400mg twice a day
INSPIRE Design 2bull 1deg Outcome number and rate of development
of Gd-enhanced lesionsbull 2deg outcomes are disability and quality-of-lifeStatistical considerations19 subjects need to complete trial to achieve 95 significance with 80 power for a 40 reduction in MS lesions compared with baseline (according to Sormani et al)
Trial design
change in gradient
change(in means)
V1 V2(screening before
visit)
V3 V4 V5 V6 V7 V8after
Raltegravirdispensed
A statistically significantchange in means is not inthis situation consistent
with a reduction inoutcome values due tointervention
3
Trial design
QOL QOL QOL QOL QOL QOL QOL
MSFC MSFC MSFC MSFC MSFC MSFC MSFCEDSS EDSS EDSS EDSS EDSS
blood blood blood blood blood blood blood blood
MRI MRI MRI MRI MRI MRI MRI
V1 V2 V3 V4 V5 V6 V7 V8(screening before after
visit)
bull Exploratory studybull Danger of Type II error of missing a real association arguably greater than
danger of Type I error of highlighting a spurious association
4
DATA
bull Patient socio-demographic and baseline
bull MRI
bull Viral and biomarkers
bull Disability
bull Quality of life
bull Laboratory safety tests
2
Patient socio-demographic and baseline
N mean min maxITTAge at baselineyrs 20 4073 3115 5299Height cm 18 16904 15600 18300Weight kg 18 7873 5190 10970Baseline EDSS 20 240 000 400Number of relapses in past year 20 150 100 300
PPAge at baselineyrs 16 4162 3115 5299Height cm 14 16891 15600 18000Weight kg 14 7790 5190 10830Baseline EDSS 16 225 000 350Number of relapses in past year 16 144 100 300
6
Patient adherenceITT PP
Visit mean
6 Number of tablets dispensed 60 60Number of tablets returned 235 269Adherence percentagea 9608 9552
7 Number of tablets dispensed 63 6375Number of tablets returned 72 675Adherence percentagea 88 8875
8 Number of tablets dispensed 597 5963Number of tablets returned 81 863Adherence percentagea 824 805
Over all three visits Number of tablets dispensed 609 6113Number of tablets returned 588 602Adherence percentagea 8883 8826
a100(tablets dispensed - tablets returned)tablets dispensed
7
MRI Total T1 Gd-enhancing lesionsTotal T1 (Gad enhanced) lesion rates
Before (visits 34 and 5) After (visits 67 and 8) Within-patient changea
Mean monthly Mean monthly Change Weightedrate rate in rate rate ratiob
ITT (n=20) 289 302 012 103PP (n=16) 251 233 -018 092
aChanges calculated after-before or afterbeforebRatios averaged on log scale before back-transforming substituting 01 for zero rates Weighted ratios pooled byweighting for total subject counts
Poisson regression analysis after vs before
ITT rate ratio after vs before as 104(95 CI 85 129) P=0681PP rate ratio after vs before as093(95 CI 072 120) P=0577
Poisson regression analysis gradient after vs gradient beforeITT test of difference in gradients P=0659PP test of difference in gradients P=0463
8
MRI New T1 Gd-enhancing lesionsNew T1 (Gad enhanced) lesion rates
Before (visits 34 and 5) After (visits 67 and 8) Within-patient changea
Mean monthly Mean monthly Changerate rate in rate
ITT (n=20) 143 167 023PP (n=16) 098 115 017
aChanges calculated after-before or afterbefore
Poisson regression analysis after vs beforeITT rate ratio after vs before as 116(95 CI 087 155) P=0314PP rate ratio after vs before as 116 (95 CI079 172) P=0456
Poisson regression analysis gradient after vs gradient beforeITT test of difference in gradients P=0562PP test of difference in gradients P=0137
9
MRI T1 Gd lesions
ITT Patients in order of difference in rate
010008010019010015010001010016010009010028010027010003010005010007010010010011010013010014010017010023
010012010020010024
-4 -2 0 2difference in rate lesions per month
Difference after - before
4
13
MRI lesions summary
Lesion outcomes provide no statistical evidence consistent with aneffect of raltegravir
14
Viral and biomarker data Before vs AfterBaselines (visit 2) Before (345) After (678)
Variable N mean sd N mean sd mean sd
MSRV A CtGAPDH Ct(dim-less) 20 094 01 20 093 007 20 092 007MSRV M CtGAPDH Ct(dim-less) 20 133 006 20 133 006 20 132 007TB HE23 CtGAPDH Ct(dim-less) 20 127 014 20 124 013 20 124 013HERV-W A CtGAPDH Ct(dim-less) 20 116 016 20 118 01 20 118 009HERV-W M CtGAPDH Ct(dim-less) 20 147 021 20 144 015 20 145 013TB HE1113 CtGAPDH Ct(dim-less) 20 127 01 20 128 006 20 129 006IL-8 pgmL 20 2805 8683 20 852 232 20 934 286HERV-WMSRV Gag Flix B cells (d-less) 13 118 011 19 119 01 18 115 006HERV-HF Gag Flix B cells (d-less) 12 114 01 17 108 007 20 112 011HERV-HF Env (H1) Flix B cells (d-less) 11 112 007 18 106 005 17 11 008HERV-HF Env (H3) Flix B cells (d-less) 19 156 024 20 147 015 20 152 016HERV-HF Env (W1) Flix B cells (d-less) 18 131 013 20 123 01 20 123 01HERV-HF Env (W3) Flix B cells (d-less) 17 125 015 20 122 009 20 124 017prop of B cells in sample () 19 914 38 20 859 306 20 905 379prop of monocytes in sample () 19 1533 92 20 1808 641 20 1609 623
HERV-WMSRV Gag Flix monocytes (d-less) 11 114 009 16 116 005 15 115 007MSRV F Gag Flix monocytes (d-less) 13 116 01 17 111 005 16 122 019Env (H1) Flix monocytes (d-less) 15 115 012 18 112 008 17 115 006Env (H3) Flix monocytes (d-less) 19 159 018 20 155 019 20 157 02Env (W1) Flix monocytes (d-less) 15 115 01 19 111 007 19 108 005Env (W3) Flix monocytes (d-less) 13 116 008 19 112 007 18 116 009HCRP ngmL 20 178383 21238 20 189945 176902 20 243527 224115CD163 ngmL 20 45667 15463 20 4239 10536 20 44257 12468EBV Copiesmicrolitre 16 21371 79687 16 238 6672 15 668 21274
Viral and biomarker data Before vs AfterHERV-WMSRV Gag Flix B cellsSignificant drop in means in ITT and PPNo significant change in gradient but steeper gradient before
HERV-WMSRV Gag Flix B cellsPP Individual subjects and fitted line
Significant overall drop notattributable to intervention
Similar story for
Env (W1) Flix monocytes
2 3 4 5 6 7 8monthly visits
Solid line fitted by modelA significant drop in means cannot be explained by intervention since decline is steeper before
17
MRI PP Persisting T1 Gd-enhancing lesionsBefore After Within-patient changea
Mean rate Mean rate Change in ratePP (n=16) 153 119 -034
80 of total reductionoccurs before theintervention
attributing the overallreduction to the interventioneven if reduction weresignificant would not be
-013 (P=0469)
P=0762-003 (P=0835)
credible
11
MRI T2 lesions
T2 lesion counts Observed at visits 5 (before) and 8 (after)
Before After Within-patient changea
Mean count Mean count Mean count changeP=0472
weighted ratiob
ITT 445PP 313
465 020P=0462331 019
105107
aChanges calculated after-before or afterbeforebWithin-patient ratios averaged on log scale before back transforming substituting 01 for zero counts Weighted meanratios pooled on log scale by weighting for lesion counts
12
Viral and biomarker data change vs T1 Gd lesion changePositive correlation
HERV-WMSRV Gag Flix B cells r=046 P=0057 ITT r=048 P=0086 PP
9
10
Additional analysis
A higher T1 Gd lesioncount at any visit isassociated with higher714
1619
28 27
20
1712
values of HERV-WMSRVGag Flix B cells at that visitP=0029 (ITT)
15
8 1
-3 -2 -1 0 1 2change in T1 lesion rate
Suggestion of decrease in HERV-WMSRV Gag Flix B cells associated with decrease in Gd-enhanced lesion rate PP r=-048 P=0086
23
Patients with a decrease in lesion count (eg patient 8) tend to have a decrease or a greater decrease in the biomarker than patients with an increase in lesion count (eg patient 20)
Viral and biomarker data summary
Some statistically significant changes in gradient before vs after wereobserved However whether these are consistent with an effect ofraltegravir depends partly on biological plausibility
A very small number of statistically significant correlations wereobserved between changes in these measures and changes in T1 Gdlesion counts their interpretation is again heavily dependent onbiological plausibility
Because of the number of measurestests any significant resultsshould be treated with caution Since results are singled out on thebasis of statistical significance rather than prior hypothesis Type Ierror is likely
25
Viral and biomarker data Before vs AfterHCRP ngmLSignificant increase in means in ITT and PPNo significant change in (positive) gradient similar slightly steeper gradient after
ITT------------------------------------------------------------------------------
| gradient SE z P-value [95 Conf Interval]-------------+----------------------------------------------------------------
before | 1221482 1495142 082 0414 -1708943 4151908after | 1406076 1495142 094 0347 -1524349 4336501
------------------------------------------------------------------------------
Significant overall increase not credibly attributable to intervention since the gradientbefore though non-significant is too similar to the gradient after intervention
18
Quality of life data summary
A number of measures showed statistically significant improvementsin well-being or a slowing of deterioration in the period aftercompared to before intervention
Although consistent with an effect of raltegravir this is most crediblyattributable to the placebo effect of patients receiving an unblindedintervention rather than to any action of the drug
The study design of not having a control group or a cross-over designmitigated against determining the possible effect of the interventionon Q0L
31
Viral and biomarker data Before vs AfterEnv (W3) Flix monocytesNon-significant decline before becomes borderline significant increase afterand significant change in gradient
Env (W3) Flix monocytesITT Individual subjects and fitted line
-002 P=0200
As before biologicalplausibility important bothfor change displayed andfor negative correlation
with Gd T1 lesions
+002 P=0055
P=0047
2 3 4 5 6 7 8monthly visits
Significant change in gradient in ITT (P=0047) and borderline in PP (P=0089)Change in means after - before negatively correlated withchange in rate of Gd enhancing T1 lesions r=-054 P=0015
21
Disability data
Summary of changes after-before
N mean sdEDSS 20 014 045 Neither change nor gradient change significant
MSFC 20 023 028 [Both change and change in gradient significant]9HPT peg speed 20 0003 0003 Highly significant improvementWalk speed (fs) 20 -004 047 Neither change nor gradient change significantPASAT score 20 466 521 Highly significant improvement
PASAT------------------------------------------------------------------------------
| gradient SE z P-value [95 Conf Interval]-------------+----------------------------------------------------------------
before | 2478954 4594816 540 0000 1578387 3379522after | 6377749 4534625 141 0160 -2509954 1526545
------------------------------------------------------------------------------
bull There is a significant gradient changebull But rate of improvement substantially greater before than after intervention
27
Quality of life data
Summary of changes after-before
change inITT n means
PQ - SF36 - Physical Functional Score (PF) 20 -092
PQ - SF36 - Role-Physical Scale (RP) 20 -948PQ - SF36 - Bodily Pain Scale (BP) 20 -542
PQ - SF36 - General Health Scale (GH) 20 -467
PQ - SF36 - Vitality Scale (VT) 20 506 PQ - SF36 - Social Functioning Scale (SF) 20 245 PQ - SF36 - Role Emotional Scale (RE) 20 -862 no statistically significant changes
PQ - SF36 - Mental Health Scale (MH) 20 572 PQ - PFA - Patient Fatigue Assessment 20 -151PQ - PPA - Patient Pain Assessment 19 407PQ - MSIS - Total Score 20 -210 no statistically significant changes
PQ - MSWS-12 - MSWS Total Score 20 -035
30
Quality of life dataSummary of changes after-before
change inITT n means
PQ - SF36 - Physical Functional Score (PF) 20 -092PQ - SF36 - Role-Physical Scale (RP) 20 -948PQ - SF36 - Bodily Pain Scale (BP) 20 -542PQ - SF36 - General Health Scale (GH) 20 -467PQ - SF36 - Vitality Scale (VT) 20 506
+ = improvement
PQ - SF36 - Social Functioning Scale (SF) 20 245PQ - SF36 - Role Emotional Scale (RE) 20 -862PQ - SF36 - Mental Health Scale (MH) 20 572PQ - PFA - Patient Fatigue Assessment 20 -151PQ - PPA - Patient Pain Assessment 19 407 - = improvementPQ - MSIS - Total Score 20 -210PQ - MSWS-12 - MSWS Total Score 20 -035
29
Disability data
Summary of changes after-before
N mean sdEDSS 20 014 045 Neither change nor gradient change significant
MSFC 20 023 028 [Both change and change in gradient significant]9HPT peg speed 20 0003 0003 Highly significant improvementWalk speed (fs) 20 -004 047 Neither change nor gradient change significantPASAT score 20 466 521
9HPT peg speed------------------------------------------------------------------------------
ITT | gradient SE z P-value [95 Conf Interval]-------------+----------------------------------------------------------------
before | 0009916 0002372 418 0000 0005267 0014565after | 000545 0002363 231 0021 0000818 0010082
------------------------------------------------------------------------------
bull No significant gradient changebull But rate of improvement substantially greater before than after intervention
26
Acknowledgementsbull Unit for Healthcare Epidemiology Oxford
ndash Raph Goldacrendash Michael Goldacrendash David Yeates
bull QMULbull Gavin Giovannoni
bull The Albion Centrebull Hubert Maruszak
bull UCLbull Robin Weiss
Laboratory safety tests
32
Laboratory safety tests significant changes
ITT change gradient gradient change inbefore after gradient
ADJUSTED CALCIUM SERUM +002 -000003 +0008 P=0406 increase could bep=0025 pgt09 p=0149 due intervention
CHLORIDE SERUM -075 +014 -031 p=0194 decrease could bep=0055 p=0503 p=0103 due to intervention
CHOLESTEROL SERUM +028 +008 +003 p=0437 increase notp=0004 p=0059 p=0521 plausibly duehellip
GLUCOSE PLASMA -018 +008 -015 p=0072 gradient changep=0196 p=0284 p=0037 could be duehellip
LDL CHOLESTEROL SERUM +017 +006 +0004 p=0432 increase notp=0018 p=0162 pgt09 plausibly duehellip
PLATELET COUNT +686 -027 +259 p=0352 increase could bep=0040 p=0880 p=0129 duehellip
WHITE BLOOD COUNT PP +022 +006 +010 p=0827 increase notp=0049 p=0579 p=0331 plausibly due
33
- Diapositive numeacutero 1
- Diapositive numeacutero 2
- Dr Jean-Martin Charcot
- Diapositive numeacutero 4
- Diapositive numeacutero 5
- Diapositive numeacutero 6
- Viruses and MS
- Are human endogenous retroviruses pathogenic An approach to testing the hypothesis
- How HERVs may induce autoimmune response
- Diapositive numeacutero 10
- Diapositive numeacutero 11
- Diapositive numeacutero 12
- Diapositive numeacutero 13
- How many cases of HIV and MS have been reported
- What do cohort studies show
- What is the Risk of Developing Multiple Sclerosis if you have HIV and are on HIV Anti-retroviral therapy
- Methods
- Diapositive numeacutero 18
- Diapositive numeacutero 19
- NHS Data on UK Healthcare events 1999-2011
- NHS Cohort gt One year after Exposure (HIV) Contact
- Diapositive numeacutero 22
- The CHARCOT PROJECTINSPIRE Isentress (Raltegravir)Pilot Study in Relapsing MS
- INSPIRE Design
- INSPIRE Design 2
- Diapositive numeacutero 26
- Diapositive numeacutero 27
- Diapositive numeacutero 28
- Diapositive numeacutero 29
- Diapositive numeacutero 30
- Diapositive numeacutero 31
- Diapositive numeacutero 32
- Diapositive numeacutero 34
- Diapositive numeacutero 35
- Diapositive numeacutero 36
- Diapositive numeacutero 37
- Diapositive numeacutero 38
- Diapositive numeacutero 39
- Diapositive numeacutero 40
- Diapositive numeacutero 41
- Diapositive numeacutero 42
- Diapositive numeacutero 43
- Diapositive numeacutero 44
- Diapositive numeacutero 45
- Diapositive numeacutero 47
- Diapositive numeacutero 48
- Diapositive numeacutero 49
- Diapositive numeacutero 50
- Acknowledgements
- Diapositive numeacutero 52
- Diapositive numeacutero 53
- Diapositive numeacutero 54
-
| HIV b4 autos | |||||||||||||||||||
| exposure | outcome | obs in ref cohort | obs | exp | rate ratio | low CI | upr CI | chi-sq | p-value | ||||||||||
| HIV | Addisons disease | 1107 | 13 | 15 | 881 | 468 | 1513 | 814 | 0 | ||||||||||
| HIV | Ankylosing spondylitis | 1686 | 0 | 22 | 0 | 0 | 164 | 136 | 02435 | ||||||||||
| HIV | Autoimmune haemolytic anaemia | 911 | 3 | 05 | 638 | 131 | 187 | 873 | 00031 | ||||||||||
| HIV | Chronic active hepatitis | 435 | 3 | 03 | 915 | 188 | 2693 | 143 | 00002 | ||||||||||
| HIV | Coeliac disease | 4991 | 3 | 76 | 04 | 008 | 116 | 218 | 01395 | ||||||||||
| HIV | Crohns disease | 6362 | 4 | 119 | 034 | 009 | 086 | 457 | 00325 | ||||||||||
| HIV | ITP | 2504 | 11 | 27 | 411 | 205 | 737 | 2278 | 0 | ||||||||||
| HIV | Myxoedema | 142597 | 33 | 977 | 034 | 023 | 047 | 4221 | 0 | ||||||||||
| HIV | Pernicious anaemia | 11732 | 2 | 49 | 04 | 005 | 146 | 121 | 02717 | ||||||||||
| HIV | Polymyositis | 395 | 3 | 05 | 622 | 128 | 183 | 837 | 00038 | ||||||||||
| HIV | Primary biliary cirrhosis | 1605 | 1 | 12 | 086 | 002 | 482 | 01 | 07507 | ||||||||||
| HIV | Psoriasis | 9262 | 7 | 129 | 054 | 022 | 111 | 229 | 01305 | ||||||||||
| HIV | Rheumatoid arthritis | 37706 | 11 | 28 | 039 | 02 | 07 | 969 | 00018 | ||||||||||
| HIV | Scleroderma | 1581 | 1 | 15 | 066 | 002 | 369 | 0 | 09916 | ||||||||||
| HIV | Sjogrens syndrome | 3640 | 0 | 31 | 0 | 0 | 12 | 215 | 01424 | ||||||||||
| HIV | Systematic lupus erythematosus | 3109 | 9 | 73 | 123 | 056 | 233 | 019 | 06667 | ||||||||||
| HIV | Thyrotoxicosis | 20268 | 16 | 193 | 083 | 047 | 135 | 04 | 05258 | ||||||||||
| HIV | Ulcerative colitis | 9235 | 5 | 155 | 032 | 01 | 075 | 65 | 00108 |
| HIV b4 autos | |||||||||||||||||||
| exposure | outcome | obs in ref cohort | obs | exp | rate ratio | low CI | upr CI | chi-sq | p-value | ||||||||||
| HIV | Addisons disease | 761 | 22 | 2 | 1108 | 69 | 169 | 18634 | 0 | ||||||||||
| HIV | Ankylosing spondylitis | 2883 | 3 | 97 | 031 | 006 | 091 | 395 | 0047 | ||||||||||
| HIV | Autoimmune haemolytic anaemia | 777 | 9 | 15 | 619 | 282 | 118 | 3371 | 0 | ||||||||||
| HIV | Chronic active hepatitis | 190 | 7 | 07 | 1106 | 439 | 2324 | 5245 | 0 | ||||||||||
| HIV | Coeliac disease | 3136 | 4 | 81 | 05 | 013 | 127 | 158 | 02085 | ||||||||||
| HIV | Crohns disease | 5938 | 27 | 231 | 117 | 077 | 171 | 051 | 04754 | ||||||||||
| HIV | ITP | 2190 | 32 | 52 | 628 | 428 | 889 | 13471 | 0 | ||||||||||
| HIV | Myxoedema | 38856 | 52 | 60 | 087 | 065 | 114 | 095 | 0331 | ||||||||||
| HIV | Pernicious anaemia | 5428 | 2 | 38 | 052 | 006 | 189 | 046 | 04974 | ||||||||||
| HIV | Polymyositis | 236 | 7 | 1 | 732 | 291 | 1531 | 3116 | 0 | ||||||||||
| HIV | Primary biliary cirrhosis | 312 | 1 | 09 | 115 | 003 | 648 | 016 | 06935 | ||||||||||
| HIV | Psoriasis | 9428 | 58 | 344 | 169 | 128 | 219 | 1556 | 00001 | ||||||||||
| HIV | Rheumatoid arthritis | 16087 | 28 | 31 | 09 | 06 | 131 | 02 | 06538 | ||||||||||
| HIV | Scleroderma | 349 | 0 | 1 | 0 | 0 | 366 | 026 | 06107 | ||||||||||
| HIV | Sjogrens syndrome | 461 | 2 | 12 | 17 | 02 | 617 | 009 | 07682 | ||||||||||
| HIV | Systematic lupus erythematosus | 559 | 1 | 25 | 04 | 001 | 226 | 038 | 05355 | ||||||||||
| HIV | Thyrotoxicosis | 5601 | 16 | 141 | 114 | 065 | 185 | 014 | 07078 | ||||||||||
| HIV | Ulcerative colitis | 10536 | 57 | 408 | 14 | 106 | 181 | 605 | 00139 |
| HIV b4 autos | |||||||||||||||||||
| exposure | outcome | obs in ref cohort | obs | exp | rate ratio | low CI | upr CI | chi-sq | p-value | ||||||||||
| HIV | Addisons disease | 1516 | 18 | 26 | 69 | 408 | 1094 | 8394 | 0 | ||||||||||
| HIV | Ankylosing spondylitis | 3802 | 2 | 108 | 019 | 002 | 067 | 638 | 00116 | ||||||||||
| HIV | Autoimmune haemolytic anaemia | 1382 | 5 | 15 | 325 | 105 | 761 | 568 | 00171 | ||||||||||
| HIV | Chronic active hepatitis | 507 | 4 | 08 | 517 | 14 | 1332 | 953 | 0002 | ||||||||||
| HIV | Coeliac disease | 6921 | 7 | 14 | 05 | 02 | 103 | 302 | 00822 | ||||||||||
| HIV | Crohns disease | 10404 | 16 | 299 | 053 | 031 | 087 | 603 | 00141 | ||||||||||
| HIV | ITP | 3966 | 21 | 57 | 368 | 227 | 563 | 3813 | 0 | ||||||||||
| HIV | Myxoedema | 153406 | 72 | 1414 | 051 | 04 | 064 | 3362 | 0 | ||||||||||
| HIV | Pernicious anaemia | 14387 | 3 | 78 | 038 | 008 | 112 | 24 | 01217 | ||||||||||
| HIV | Polymyositis | 518 | 9 | 13 | 682 | 31 | 1305 | 3841 | 0 | ||||||||||
| HIV | Primary biliary cirrhosis | 1609 | 1 | 19 | 053 | 001 | 298 | 007 | 0787 | ||||||||||
| HIV | Psoriasis | 15618 | 43 | 412 | 104 | 075 | 141 | 004 | 08421 | ||||||||||
| HIV | Rheumatoid arthritis | 44692 | 28 | 521 | 054 | 036 | 078 | 1067 | 00011 | ||||||||||
| HIV | Scleroderma | 1636 | 1 | 22 | 046 | 001 | 254 | 022 | 06394 | ||||||||||
| HIV | Sjogrens syndrome | 3536 | 0 | 38 | 0 | 0 | 097 | 286 | 0091 | ||||||||||
| HIV | Systematic lupus erythematosus | 3060 | 9 | 86 | 105 | 048 | 199 | 0 | 09745 | ||||||||||
| HIV | Thyrotoxicosis | 21626 | 27 | 291 | 093 | 061 | 135 | 009 | 07631 | ||||||||||
| HIV | Ulcerative colitis | 16648 | 45 | 489 | 092 | 067 | 123 | 024 | 06256 |
| HIV b4 autos | |||||||||||||||||||
| exposure | outcome | obs in ref cohort | obs | exp | rate ratio | low CI | upr CI | chi-sq | p-value | ||||||||||
| HIV | Addisons disease | 686 | 3 | 11 | 271 | 056 | 796 | 175 | 01859 | ||||||||||
| HIV | Ankylosing spondylitis | 1807 | 0 | 52 | 0 | 0 | 071 | 421 | 00401 | ||||||||||
| HIV | Autoimmune haemolytic anaemia | 586 | 1 | 06 | 169 | 004 | 943 | 001 | 09035 | ||||||||||
| HIV | Chronic active hepatitis | 167 | 1 | 02 | 466 | 012 | 2633 | 038 | 05397 | ||||||||||
| HIV | Coeliac disease | 3282 | 1 | 61 | 016 | 0 | 091 | 346 | 00628 | ||||||||||
| HIV | Crohns disease | 4709 | 3 | 132 | 023 | 005 | 066 | 717 | 00074 | ||||||||||
| HIV | ITP | 1824 | 6 | 25 | 236 | 087 | 515 | 344 | 00636 | ||||||||||
| HIV | Myxoedema | 75495 | 29 | 716 | 04 | 027 | 058 | 2479 | 0 | ||||||||||
| HIV | Pernicious anaemia | 6772 | 0 | 42 | 0 | 0 | 089 | 322 | 00729 | ||||||||||
| HIV | Polymyositis | 216 | 1 | 05 | 188 | 005 | 1057 | 0 | 09632 | ||||||||||
| HIV | Primary biliary cirrhosis | 690 | 1 | 07 | 142 | 004 | 794 | 006 | 08079 | ||||||||||
| HIV | Psoriasis | 7528 | 16 | 196 | 082 | 047 | 133 | 048 | 0489 | ||||||||||
| HIV | Rheumatoid arthritis | 20701 | 11 | 254 | 043 | 022 | 077 | 763 | 00058 | ||||||||||
| HIV | Scleroderma | 725 | 0 | 1 | 0 | 0 | 362 | 026 | 0607 | ||||||||||
| HIV | Sjogrens syndrome | 1700 | 0 | 17 | 0 | 0 | 218 | 084 | 03586 | ||||||||||
| HIV | Systematic lupus erythematosus | 1357 | 3 | 36 | 083 | 017 | 243 | 0 | 09495 | ||||||||||
| HIV | Thyrotoxicosis | 10097 | 13 | 136 | 095 | 051 | 163 | 0 | 09755 | ||||||||||
| HIV | Ulcerative colitis | 7325 | 15 | 207 | 072 | 04 | 119 | 131 | 02521 |
| HIV b4 autos | |||||||||||||||||||
| exposure | outcome | obs in ref cohort | obs | exp | rate ratio | low CI | upr CI | chi-sq | p-value | ||||||||||
| HIV | Addisons disease | 830 | 15 | 15 | 998 | 556 | 1655 | 11032 | 0 | ||||||||||
| HIV | Ankylosing spondylitis | 1995 | 2 | 56 | 035 | 004 | 128 | 174 | 01866 | ||||||||||
| HIV | Autoimmune haemolytic anaemia | 796 | 4 | 09 | 423 | 115 | 1088 | 687 | 00088 | ||||||||||
| HIV | Chronic active hepatitis | 340 | 3 | 06 | 537 | 11 | 1582 | 668 | 00098 | ||||||||||
| HIV | Coeliac disease | 3639 | 6 | 79 | 076 | 028 | 165 | 025 | 0616 | ||||||||||
| HIV | Crohns disease | 5695 | 13 | 167 | 078 | 041 | 133 | 061 | 04355 | ||||||||||
| HIV | ITP | 2142 | 15 | 32 | 473 | 265 | 783 | 4024 | 0 | ||||||||||
| HIV | Myxoedema | 77911 | 43 | 698 | 062 | 045 | 083 | 992 | 00016 | ||||||||||
| HIV | Pernicious anaemia | 7615 | 3 | 37 | 082 | 017 | 239 | 001 | 09271 | ||||||||||
| HIV | Polymyositis | 302 | 8 | 08 | 1018 | 435 | 2031 | 5584 | 0 | ||||||||||
| HIV | Primary biliary cirrhosis | 919 | 0 | 12 | 0 | 0 | 317 | 038 | 05375 | ||||||||||
| HIV | Psoriasis | 8090 | 27 | 217 | 125 | 082 | 182 | 108 | 02985 | ||||||||||
| HIV | Rheumatoid arthritis | 23991 | 17 | 266 | 064 | 037 | 102 | 314 | 00763 | ||||||||||
| HIV | Scleroderma | 911 | 1 | 12 | 085 | 002 | 475 | 009 | 07639 | ||||||||||
| HIV | Sjogrens syndrome | 1836 | 0 | 21 | 0 | 0 | 176 | 121 | 02704 | ||||||||||
| HIV | Systematic lupus erythematosus | 1703 | 6 | 5 | 121 | 044 | 263 | 006 | 0813 | ||||||||||
| HIV | Thyrotoxicosis | 11529 | 14 | 155 | 09 | 049 | 151 | 007 | 0797 | ||||||||||
| HIV | Ulcerative colitis | 9323 | 30 | 282 | 106 | 072 | 152 | 006 | 08069 |
| HIV b4 autos | |||||||||||||||||||
| exposure | outcome | obs in ref cohort | obs | exp | rate ratio | low CI | upr CI | chi-sq | p-value | ||||||||||
| HIV | Addisons disease | 352 | 17 | 09 | 1992 | 1147 | 3236 | 27362 | 0 | ||||||||||
| HIV | Ankylosing spondylitis | 767 | 1 | 11 | 088 | 002 | 493 | 012 | 07296 | ||||||||||
| HIV | Autoimmune haemolytic anaemia | 306 | 7 | 04 | 1792 | 714 | 3736 | 9338 | 0 | ||||||||||
| HIV | Chronic active hepatitis | 118 | 6 | 02 | 3067 | 1103 | 6878 | 13684 | 0 | ||||||||||
| HIV | Coeliac disease | 1206 | 0 | 16 | 0 | 0 | 226 | 079 | 03752 | ||||||||||
| HIV | Crohns disease | 1896 | 15 | 5 | 3 | 167 | 496 | 1787 | 0 | ||||||||||
| HIV | ITP | 728 | 22 | 21 | 1068 | 665 | 1629 | 17803 | 0 | ||||||||||
| HIV | Myxoedema | 28047 | 13 | 163 | 08 | 042 | 136 | 048 | 04889 | ||||||||||
| HIV | Pernicious anaemia | 2773 | 1 | 09 | 106 | 003 | 593 | 021 | 06495 | ||||||||||
| HIV | Polymyositis | 113 | 1 | 01 | 785 | 02 | 4461 | 108 | 02995 | ||||||||||
| HIV | Primary biliary cirrhosis | 308 | 1 | 02 | 646 | 016 | 3624 | 077 | 03817 | ||||||||||
| HIV | Psoriasis | 3072 | 22 | 61 | 361 | 226 | 548 | 3875 | 0 | ||||||||||
| HIV | Rheumatoid arthritis | 9101 | 11 | 69 | 16 | 08 | 286 | 189 | 01697 | ||||||||||
| HIV | Scleroderma | 294 | 0 | 03 | 0 | 0 | 1121 | 009 | 07682 | ||||||||||
| HIV | Sjogrens syndrome | 565 | 2 | 05 | 436 | 053 | 1581 | 235 | 01253 | ||||||||||
| HIV | Systematic lupus erythematosus | 608 | 1 | 12 | 082 | 002 | 461 | 007 | 07944 | ||||||||||
| HIV | Thyrotoxicosis | 4243 | 5 | 43 | 118 | 038 | 275 | 001 | 09048 | ||||||||||
| HIV | Ulcerative colitis | 3123 | 17 | 75 | 229 | 133 | 367 | 1101 | 00009 |
| HIV b4 autos | |||||||||||||||||||
| exposure | outcome | obs in ref cohort | obs | exp | rate ratio | low CI | upr CI | chi-sq | p-value | ||||||||||
| HIV | Addisons disease | 821 | 1 | 01 | 78 | 02 | 4358 | 108 | 02995 | ||||||||||
| HIV | Ankylosing spondylitis | 1672 | 0 | 04 | 0 | 0 | 887 | 002 | 08966 | ||||||||||
| HIV | Autoimmune haemolytic anaemia | 1142 | 1 | 02 | 418 | 011 | 2333 | 028 | 05943 | ||||||||||
| HIV | Chronic active hepatitis | 300 | 1 | 01 | 1674 | 042 | 9401 | 323 | 00721 | ||||||||||
| HIV | Coeliac disease | 3003 | 0 | 04 | 0 | 0 | 836 | 001 | 09297 | ||||||||||
| HIV | Crohns disease | 4249 | 1 | 07 | 14 | 004 | 779 | 006 | 07988 | ||||||||||
| HIV | ITP | 2750 | 4 | 05 | 823 | 224 | 2109 | 1866 | 0 | ||||||||||
| HIV | Myxoedema | 111802 | 12 | 124 | 097 | 05 | 169 | 0 | 09748 | ||||||||||
| HIV | Pernicious anaemia | 13040 | 0 | 15 | 0 | 0 | 253 | 063 | 04283 | ||||||||||
| HIV | Polymyositis | 333 | 2 | 0 | 4371 | 527 | 15913 | 4594 | 0 | ||||||||||
| HIV | Primary biliary cirrhosis | 1120 | 0 | 01 | 0 | 0 | 3586 | 153 | 02162 | ||||||||||
| HIV | Psoriasis | 6100 | 2 | 15 | 131 | 016 | 472 | 0 | 09797 | ||||||||||
| HIV | Rheumatoid arthritis | 30228 | 7 | 41 | 172 | 069 | 355 | 146 | 02269 | ||||||||||
| HIV | Scleroderma | 909 | 0 | 01 | 0 | 0 | 3312 | 135 | 02449 | ||||||||||
| HIV | Sjogrens syndrome | 1883 | 0 | 02 | 0 | 0 | 1969 | 052 | 04704 | ||||||||||
| HIV | Systematic lupus erythematosus | 1056 | 0 | 02 | 0 | 0 | 1993 | 053 | 04648 | ||||||||||
| HIV | Thyrotoxicosis | 15247 | 4 | 19 | 21 | 057 | 538 | 134 | 0247 | ||||||||||
| HIV | Ulcerative colitis | 7697 | 5 | 16 | 317 | 103 | 74 | 541 | 002 |
| HIV b4 autos | |||||||||||||||||||
| exposure | outcome | obs in ref cohort | obs | exp | rate ratio | low CI | upr CI | chi-sq | p-value | ||||||||||
| HIV | Addisons disease | 326 | 3 | 03 | 893 | 183 | 2632 | 138 | 00002 | ||||||||||
| HIV | Ankylosing spondylitis | 971 | 0 | 14 | 0 | 0 | 272 | 054 | 04621 | ||||||||||
| HIV | Autoimmune haemolytic anaemia | 261 | 0 | 03 | 0 | 0 | 1419 | 022 | 06407 | ||||||||||
| HIV | Chronic active hepatitis | 143 | 1 | 01 | 733 | 018 | 415 | 096 | 03272 | ||||||||||
| HIV | Coeliac disease | 1492 | 0 | 11 | 0 | 0 | 331 | 034 | 05598 | ||||||||||
| HIV | Crohns disease | 1923 | 1 | 24 | 042 | 001 | 234 | 032 | 05686 | ||||||||||
| HIV | ITP | 712 | 3 | 09 | 329 | 068 | 964 | 274 | 00976 | ||||||||||
| HIV | Myxoedema | 30859 | 11 | 201 | 055 | 027 | 098 | 368 | 00552 | ||||||||||
| HIV | Pernicious anaemia | 1970 | 1 | 13 | 078 | 002 | 437 | 004 | 0844 | ||||||||||
| HIV | Polymyositis | 135 | 2 | 01 | 1436 | 172 | 5288 | 1309 | 00003 | ||||||||||
| HIV | Primary biliary cirrhosis | 377 | 1 | 02 | 575 | 015 | 3225 | 061 | 0435 | ||||||||||
| HIV | Psoriasis | 3545 | 5 | 48 | 104 | 034 | 244 | 002 | 08955 | ||||||||||
| HIV | Rheumatoid arthritis | 10250 | 4 | 88 | 045 | 012 | 116 | 214 | 01439 | ||||||||||
| HIV | Scleroderma | 463 | 0 | 03 | 0 | 0 | 1449 | 023 | 06285 | ||||||||||
| HIV | Sjogrens syndrome | 1053 | 1 | 05 | 2 | 005 | 1119 | 0 | 09991 | ||||||||||
| HIV | Systematic lupus erythematosus | 715 | 0 | 06 | 0 | 0 | 606 | 002 | 0888 | ||||||||||
| HIV | Thyrotoxicosis | 4076 | 4 | 35 | 115 | 031 | 295 | 0 | 0988 | ||||||||||
| HIV | Ulcerative colitis | 3588 | 8 | 49 | 164 | 071 | 324 | 141 | 02348 |

65+
interval lt1yr
1-4
5+
1+
males
females
The CHARCOT PROJECTINSPIRE
Isentress (Raltegravir)Pilot Study in Relapsing MS
bull Aims to investigate the concept of HERV+-EBV or herpes viruses as an etiology or trigger for MS
bull Disease controlling rather than disease modifying therapy
INSPIRE Design
bull Pilot study enrolling patients with active RRMS as defined by +ve Gd-enhanced MRI or documented relapse in previous 12 months
bull Baseline (3 months) followed by treatment (3 months)
bull Open label treatment phase with Raltegravir 400mg twice a day
INSPIRE Design 2bull 1deg Outcome number and rate of development
of Gd-enhanced lesionsbull 2deg outcomes are disability and quality-of-lifeStatistical considerations19 subjects need to complete trial to achieve 95 significance with 80 power for a 40 reduction in MS lesions compared with baseline (according to Sormani et al)
Trial design
change in gradient
change(in means)
V1 V2(screening before
visit)
V3 V4 V5 V6 V7 V8after
Raltegravirdispensed
A statistically significantchange in means is not inthis situation consistent
with a reduction inoutcome values due tointervention
3
Trial design
QOL QOL QOL QOL QOL QOL QOL
MSFC MSFC MSFC MSFC MSFC MSFC MSFCEDSS EDSS EDSS EDSS EDSS
blood blood blood blood blood blood blood blood
MRI MRI MRI MRI MRI MRI MRI
V1 V2 V3 V4 V5 V6 V7 V8(screening before after
visit)
bull Exploratory studybull Danger of Type II error of missing a real association arguably greater than
danger of Type I error of highlighting a spurious association
4
DATA
bull Patient socio-demographic and baseline
bull MRI
bull Viral and biomarkers
bull Disability
bull Quality of life
bull Laboratory safety tests
2
Patient socio-demographic and baseline
N mean min maxITTAge at baselineyrs 20 4073 3115 5299Height cm 18 16904 15600 18300Weight kg 18 7873 5190 10970Baseline EDSS 20 240 000 400Number of relapses in past year 20 150 100 300
PPAge at baselineyrs 16 4162 3115 5299Height cm 14 16891 15600 18000Weight kg 14 7790 5190 10830Baseline EDSS 16 225 000 350Number of relapses in past year 16 144 100 300
6
Patient adherenceITT PP
Visit mean
6 Number of tablets dispensed 60 60Number of tablets returned 235 269Adherence percentagea 9608 9552
7 Number of tablets dispensed 63 6375Number of tablets returned 72 675Adherence percentagea 88 8875
8 Number of tablets dispensed 597 5963Number of tablets returned 81 863Adherence percentagea 824 805
Over all three visits Number of tablets dispensed 609 6113Number of tablets returned 588 602Adherence percentagea 8883 8826
a100(tablets dispensed - tablets returned)tablets dispensed
7
MRI Total T1 Gd-enhancing lesionsTotal T1 (Gad enhanced) lesion rates
Before (visits 34 and 5) After (visits 67 and 8) Within-patient changea
Mean monthly Mean monthly Change Weightedrate rate in rate rate ratiob
ITT (n=20) 289 302 012 103PP (n=16) 251 233 -018 092
aChanges calculated after-before or afterbeforebRatios averaged on log scale before back-transforming substituting 01 for zero rates Weighted ratios pooled byweighting for total subject counts
Poisson regression analysis after vs before
ITT rate ratio after vs before as 104(95 CI 85 129) P=0681PP rate ratio after vs before as093(95 CI 072 120) P=0577
Poisson regression analysis gradient after vs gradient beforeITT test of difference in gradients P=0659PP test of difference in gradients P=0463
8
MRI New T1 Gd-enhancing lesionsNew T1 (Gad enhanced) lesion rates
Before (visits 34 and 5) After (visits 67 and 8) Within-patient changea
Mean monthly Mean monthly Changerate rate in rate
ITT (n=20) 143 167 023PP (n=16) 098 115 017
aChanges calculated after-before or afterbefore
Poisson regression analysis after vs beforeITT rate ratio after vs before as 116(95 CI 087 155) P=0314PP rate ratio after vs before as 116 (95 CI079 172) P=0456
Poisson regression analysis gradient after vs gradient beforeITT test of difference in gradients P=0562PP test of difference in gradients P=0137
9
MRI T1 Gd lesions
ITT Patients in order of difference in rate
010008010019010015010001010016010009010028010027010003010005010007010010010011010013010014010017010023
010012010020010024
-4 -2 0 2difference in rate lesions per month
Difference after - before
4
13
MRI lesions summary
Lesion outcomes provide no statistical evidence consistent with aneffect of raltegravir
14
Viral and biomarker data Before vs AfterBaselines (visit 2) Before (345) After (678)
Variable N mean sd N mean sd mean sd
MSRV A CtGAPDH Ct(dim-less) 20 094 01 20 093 007 20 092 007MSRV M CtGAPDH Ct(dim-less) 20 133 006 20 133 006 20 132 007TB HE23 CtGAPDH Ct(dim-less) 20 127 014 20 124 013 20 124 013HERV-W A CtGAPDH Ct(dim-less) 20 116 016 20 118 01 20 118 009HERV-W M CtGAPDH Ct(dim-less) 20 147 021 20 144 015 20 145 013TB HE1113 CtGAPDH Ct(dim-less) 20 127 01 20 128 006 20 129 006IL-8 pgmL 20 2805 8683 20 852 232 20 934 286HERV-WMSRV Gag Flix B cells (d-less) 13 118 011 19 119 01 18 115 006HERV-HF Gag Flix B cells (d-less) 12 114 01 17 108 007 20 112 011HERV-HF Env (H1) Flix B cells (d-less) 11 112 007 18 106 005 17 11 008HERV-HF Env (H3) Flix B cells (d-less) 19 156 024 20 147 015 20 152 016HERV-HF Env (W1) Flix B cells (d-less) 18 131 013 20 123 01 20 123 01HERV-HF Env (W3) Flix B cells (d-less) 17 125 015 20 122 009 20 124 017prop of B cells in sample () 19 914 38 20 859 306 20 905 379prop of monocytes in sample () 19 1533 92 20 1808 641 20 1609 623
HERV-WMSRV Gag Flix monocytes (d-less) 11 114 009 16 116 005 15 115 007MSRV F Gag Flix monocytes (d-less) 13 116 01 17 111 005 16 122 019Env (H1) Flix monocytes (d-less) 15 115 012 18 112 008 17 115 006Env (H3) Flix monocytes (d-less) 19 159 018 20 155 019 20 157 02Env (W1) Flix monocytes (d-less) 15 115 01 19 111 007 19 108 005Env (W3) Flix monocytes (d-less) 13 116 008 19 112 007 18 116 009HCRP ngmL 20 178383 21238 20 189945 176902 20 243527 224115CD163 ngmL 20 45667 15463 20 4239 10536 20 44257 12468EBV Copiesmicrolitre 16 21371 79687 16 238 6672 15 668 21274
Viral and biomarker data Before vs AfterHERV-WMSRV Gag Flix B cellsSignificant drop in means in ITT and PPNo significant change in gradient but steeper gradient before
HERV-WMSRV Gag Flix B cellsPP Individual subjects and fitted line
Significant overall drop notattributable to intervention
Similar story for
Env (W1) Flix monocytes
2 3 4 5 6 7 8monthly visits
Solid line fitted by modelA significant drop in means cannot be explained by intervention since decline is steeper before
17
MRI PP Persisting T1 Gd-enhancing lesionsBefore After Within-patient changea
Mean rate Mean rate Change in ratePP (n=16) 153 119 -034
80 of total reductionoccurs before theintervention
attributing the overallreduction to the interventioneven if reduction weresignificant would not be
-013 (P=0469)
P=0762-003 (P=0835)
credible
11
MRI T2 lesions
T2 lesion counts Observed at visits 5 (before) and 8 (after)
Before After Within-patient changea
Mean count Mean count Mean count changeP=0472
weighted ratiob
ITT 445PP 313
465 020P=0462331 019
105107
aChanges calculated after-before or afterbeforebWithin-patient ratios averaged on log scale before back transforming substituting 01 for zero counts Weighted meanratios pooled on log scale by weighting for lesion counts
12
Viral and biomarker data change vs T1 Gd lesion changePositive correlation
HERV-WMSRV Gag Flix B cells r=046 P=0057 ITT r=048 P=0086 PP
9
10
Additional analysis
A higher T1 Gd lesioncount at any visit isassociated with higher714
1619
28 27
20
1712
values of HERV-WMSRVGag Flix B cells at that visitP=0029 (ITT)
15
8 1
-3 -2 -1 0 1 2change in T1 lesion rate
Suggestion of decrease in HERV-WMSRV Gag Flix B cells associated with decrease in Gd-enhanced lesion rate PP r=-048 P=0086
23
Patients with a decrease in lesion count (eg patient 8) tend to have a decrease or a greater decrease in the biomarker than patients with an increase in lesion count (eg patient 20)
Viral and biomarker data summary
Some statistically significant changes in gradient before vs after wereobserved However whether these are consistent with an effect ofraltegravir depends partly on biological plausibility
A very small number of statistically significant correlations wereobserved between changes in these measures and changes in T1 Gdlesion counts their interpretation is again heavily dependent onbiological plausibility
Because of the number of measurestests any significant resultsshould be treated with caution Since results are singled out on thebasis of statistical significance rather than prior hypothesis Type Ierror is likely
25
Viral and biomarker data Before vs AfterHCRP ngmLSignificant increase in means in ITT and PPNo significant change in (positive) gradient similar slightly steeper gradient after
ITT------------------------------------------------------------------------------
| gradient SE z P-value [95 Conf Interval]-------------+----------------------------------------------------------------
before | 1221482 1495142 082 0414 -1708943 4151908after | 1406076 1495142 094 0347 -1524349 4336501
------------------------------------------------------------------------------
Significant overall increase not credibly attributable to intervention since the gradientbefore though non-significant is too similar to the gradient after intervention
18
Quality of life data summary
A number of measures showed statistically significant improvementsin well-being or a slowing of deterioration in the period aftercompared to before intervention
Although consistent with an effect of raltegravir this is most crediblyattributable to the placebo effect of patients receiving an unblindedintervention rather than to any action of the drug
The study design of not having a control group or a cross-over designmitigated against determining the possible effect of the interventionon Q0L
31
Viral and biomarker data Before vs AfterEnv (W3) Flix monocytesNon-significant decline before becomes borderline significant increase afterand significant change in gradient
Env (W3) Flix monocytesITT Individual subjects and fitted line
-002 P=0200
As before biologicalplausibility important bothfor change displayed andfor negative correlation
with Gd T1 lesions
+002 P=0055
P=0047
2 3 4 5 6 7 8monthly visits
Significant change in gradient in ITT (P=0047) and borderline in PP (P=0089)Change in means after - before negatively correlated withchange in rate of Gd enhancing T1 lesions r=-054 P=0015
21
Disability data
Summary of changes after-before
N mean sdEDSS 20 014 045 Neither change nor gradient change significant
MSFC 20 023 028 [Both change and change in gradient significant]9HPT peg speed 20 0003 0003 Highly significant improvementWalk speed (fs) 20 -004 047 Neither change nor gradient change significantPASAT score 20 466 521 Highly significant improvement
PASAT------------------------------------------------------------------------------
| gradient SE z P-value [95 Conf Interval]-------------+----------------------------------------------------------------
before | 2478954 4594816 540 0000 1578387 3379522after | 6377749 4534625 141 0160 -2509954 1526545
------------------------------------------------------------------------------
bull There is a significant gradient changebull But rate of improvement substantially greater before than after intervention
27
Quality of life data
Summary of changes after-before
change inITT n means
PQ - SF36 - Physical Functional Score (PF) 20 -092
PQ - SF36 - Role-Physical Scale (RP) 20 -948PQ - SF36 - Bodily Pain Scale (BP) 20 -542
PQ - SF36 - General Health Scale (GH) 20 -467
PQ - SF36 - Vitality Scale (VT) 20 506 PQ - SF36 - Social Functioning Scale (SF) 20 245 PQ - SF36 - Role Emotional Scale (RE) 20 -862 no statistically significant changes
PQ - SF36 - Mental Health Scale (MH) 20 572 PQ - PFA - Patient Fatigue Assessment 20 -151PQ - PPA - Patient Pain Assessment 19 407PQ - MSIS - Total Score 20 -210 no statistically significant changes
PQ - MSWS-12 - MSWS Total Score 20 -035
30
Quality of life dataSummary of changes after-before
change inITT n means
PQ - SF36 - Physical Functional Score (PF) 20 -092PQ - SF36 - Role-Physical Scale (RP) 20 -948PQ - SF36 - Bodily Pain Scale (BP) 20 -542PQ - SF36 - General Health Scale (GH) 20 -467PQ - SF36 - Vitality Scale (VT) 20 506
+ = improvement
PQ - SF36 - Social Functioning Scale (SF) 20 245PQ - SF36 - Role Emotional Scale (RE) 20 -862PQ - SF36 - Mental Health Scale (MH) 20 572PQ - PFA - Patient Fatigue Assessment 20 -151PQ - PPA - Patient Pain Assessment 19 407 - = improvementPQ - MSIS - Total Score 20 -210PQ - MSWS-12 - MSWS Total Score 20 -035
29
Disability data
Summary of changes after-before
N mean sdEDSS 20 014 045 Neither change nor gradient change significant
MSFC 20 023 028 [Both change and change in gradient significant]9HPT peg speed 20 0003 0003 Highly significant improvementWalk speed (fs) 20 -004 047 Neither change nor gradient change significantPASAT score 20 466 521
9HPT peg speed------------------------------------------------------------------------------
ITT | gradient SE z P-value [95 Conf Interval]-------------+----------------------------------------------------------------
before | 0009916 0002372 418 0000 0005267 0014565after | 000545 0002363 231 0021 0000818 0010082
------------------------------------------------------------------------------
bull No significant gradient changebull But rate of improvement substantially greater before than after intervention
26
Acknowledgementsbull Unit for Healthcare Epidemiology Oxford
ndash Raph Goldacrendash Michael Goldacrendash David Yeates
bull QMULbull Gavin Giovannoni
bull The Albion Centrebull Hubert Maruszak
bull UCLbull Robin Weiss
Laboratory safety tests
32
Laboratory safety tests significant changes
ITT change gradient gradient change inbefore after gradient
ADJUSTED CALCIUM SERUM +002 -000003 +0008 P=0406 increase could bep=0025 pgt09 p=0149 due intervention
CHLORIDE SERUM -075 +014 -031 p=0194 decrease could bep=0055 p=0503 p=0103 due to intervention
CHOLESTEROL SERUM +028 +008 +003 p=0437 increase notp=0004 p=0059 p=0521 plausibly duehellip
GLUCOSE PLASMA -018 +008 -015 p=0072 gradient changep=0196 p=0284 p=0037 could be duehellip
LDL CHOLESTEROL SERUM +017 +006 +0004 p=0432 increase notp=0018 p=0162 pgt09 plausibly duehellip
PLATELET COUNT +686 -027 +259 p=0352 increase could bep=0040 p=0880 p=0129 duehellip
WHITE BLOOD COUNT PP +022 +006 +010 p=0827 increase notp=0049 p=0579 p=0331 plausibly due
33
- Diapositive numeacutero 1
- Diapositive numeacutero 2
- Dr Jean-Martin Charcot
- Diapositive numeacutero 4
- Diapositive numeacutero 5
- Diapositive numeacutero 6
- Viruses and MS
- Are human endogenous retroviruses pathogenic An approach to testing the hypothesis
- How HERVs may induce autoimmune response
- Diapositive numeacutero 10
- Diapositive numeacutero 11
- Diapositive numeacutero 12
- Diapositive numeacutero 13
- How many cases of HIV and MS have been reported
- What do cohort studies show
- What is the Risk of Developing Multiple Sclerosis if you have HIV and are on HIV Anti-retroviral therapy
- Methods
- Diapositive numeacutero 18
- Diapositive numeacutero 19
- NHS Data on UK Healthcare events 1999-2011
- NHS Cohort gt One year after Exposure (HIV) Contact
- Diapositive numeacutero 22
- The CHARCOT PROJECTINSPIRE Isentress (Raltegravir)Pilot Study in Relapsing MS
- INSPIRE Design
- INSPIRE Design 2
- Diapositive numeacutero 26
- Diapositive numeacutero 27
- Diapositive numeacutero 28
- Diapositive numeacutero 29
- Diapositive numeacutero 30
- Diapositive numeacutero 31
- Diapositive numeacutero 32
- Diapositive numeacutero 34
- Diapositive numeacutero 35
- Diapositive numeacutero 36
- Diapositive numeacutero 37
- Diapositive numeacutero 38
- Diapositive numeacutero 39
- Diapositive numeacutero 40
- Diapositive numeacutero 41
- Diapositive numeacutero 42
- Diapositive numeacutero 43
- Diapositive numeacutero 44
- Diapositive numeacutero 45
- Diapositive numeacutero 47
- Diapositive numeacutero 48
- Diapositive numeacutero 49
- Diapositive numeacutero 50
- Acknowledgements
- Diapositive numeacutero 52
- Diapositive numeacutero 53
- Diapositive numeacutero 54
-
| HIV b4 autos | |||||||||||||||||||
| exposure | outcome | obs in ref cohort | obs | exp | rate ratio | low CI | upr CI | chi-sq | p-value | ||||||||||
| HIV | Addisons disease | 1107 | 13 | 15 | 881 | 468 | 1513 | 814 | 0 | ||||||||||
| HIV | Ankylosing spondylitis | 1686 | 0 | 22 | 0 | 0 | 164 | 136 | 02435 | ||||||||||
| HIV | Autoimmune haemolytic anaemia | 911 | 3 | 05 | 638 | 131 | 187 | 873 | 00031 | ||||||||||
| HIV | Chronic active hepatitis | 435 | 3 | 03 | 915 | 188 | 2693 | 143 | 00002 | ||||||||||
| HIV | Coeliac disease | 4991 | 3 | 76 | 04 | 008 | 116 | 218 | 01395 | ||||||||||
| HIV | Crohns disease | 6362 | 4 | 119 | 034 | 009 | 086 | 457 | 00325 | ||||||||||
| HIV | ITP | 2504 | 11 | 27 | 411 | 205 | 737 | 2278 | 0 | ||||||||||
| HIV | Myxoedema | 142597 | 33 | 977 | 034 | 023 | 047 | 4221 | 0 | ||||||||||
| HIV | Pernicious anaemia | 11732 | 2 | 49 | 04 | 005 | 146 | 121 | 02717 | ||||||||||
| HIV | Polymyositis | 395 | 3 | 05 | 622 | 128 | 183 | 837 | 00038 | ||||||||||
| HIV | Primary biliary cirrhosis | 1605 | 1 | 12 | 086 | 002 | 482 | 01 | 07507 | ||||||||||
| HIV | Psoriasis | 9262 | 7 | 129 | 054 | 022 | 111 | 229 | 01305 | ||||||||||
| HIV | Rheumatoid arthritis | 37706 | 11 | 28 | 039 | 02 | 07 | 969 | 00018 | ||||||||||
| HIV | Scleroderma | 1581 | 1 | 15 | 066 | 002 | 369 | 0 | 09916 | ||||||||||
| HIV | Sjogrens syndrome | 3640 | 0 | 31 | 0 | 0 | 12 | 215 | 01424 | ||||||||||
| HIV | Systematic lupus erythematosus | 3109 | 9 | 73 | 123 | 056 | 233 | 019 | 06667 | ||||||||||
| HIV | Thyrotoxicosis | 20268 | 16 | 193 | 083 | 047 | 135 | 04 | 05258 | ||||||||||
| HIV | Ulcerative colitis | 9235 | 5 | 155 | 032 | 01 | 075 | 65 | 00108 |
| HIV b4 autos | |||||||||||||||||||
| exposure | outcome | obs in ref cohort | obs | exp | rate ratio | low CI | upr CI | chi-sq | p-value | ||||||||||
| HIV | Addisons disease | 761 | 22 | 2 | 1108 | 69 | 169 | 18634 | 0 | ||||||||||
| HIV | Ankylosing spondylitis | 2883 | 3 | 97 | 031 | 006 | 091 | 395 | 0047 | ||||||||||
| HIV | Autoimmune haemolytic anaemia | 777 | 9 | 15 | 619 | 282 | 118 | 3371 | 0 | ||||||||||
| HIV | Chronic active hepatitis | 190 | 7 | 07 | 1106 | 439 | 2324 | 5245 | 0 | ||||||||||
| HIV | Coeliac disease | 3136 | 4 | 81 | 05 | 013 | 127 | 158 | 02085 | ||||||||||
| HIV | Crohns disease | 5938 | 27 | 231 | 117 | 077 | 171 | 051 | 04754 | ||||||||||
| HIV | ITP | 2190 | 32 | 52 | 628 | 428 | 889 | 13471 | 0 | ||||||||||
| HIV | Myxoedema | 38856 | 52 | 60 | 087 | 065 | 114 | 095 | 0331 | ||||||||||
| HIV | Pernicious anaemia | 5428 | 2 | 38 | 052 | 006 | 189 | 046 | 04974 | ||||||||||
| HIV | Polymyositis | 236 | 7 | 1 | 732 | 291 | 1531 | 3116 | 0 | ||||||||||
| HIV | Primary biliary cirrhosis | 312 | 1 | 09 | 115 | 003 | 648 | 016 | 06935 | ||||||||||
| HIV | Psoriasis | 9428 | 58 | 344 | 169 | 128 | 219 | 1556 | 00001 | ||||||||||
| HIV | Rheumatoid arthritis | 16087 | 28 | 31 | 09 | 06 | 131 | 02 | 06538 | ||||||||||
| HIV | Scleroderma | 349 | 0 | 1 | 0 | 0 | 366 | 026 | 06107 | ||||||||||
| HIV | Sjogrens syndrome | 461 | 2 | 12 | 17 | 02 | 617 | 009 | 07682 | ||||||||||
| HIV | Systematic lupus erythematosus | 559 | 1 | 25 | 04 | 001 | 226 | 038 | 05355 | ||||||||||
| HIV | Thyrotoxicosis | 5601 | 16 | 141 | 114 | 065 | 185 | 014 | 07078 | ||||||||||
| HIV | Ulcerative colitis | 10536 | 57 | 408 | 14 | 106 | 181 | 605 | 00139 |
| HIV b4 autos | |||||||||||||||||||
| exposure | outcome | obs in ref cohort | obs | exp | rate ratio | low CI | upr CI | chi-sq | p-value | ||||||||||
| HIV | Addisons disease | 1516 | 18 | 26 | 69 | 408 | 1094 | 8394 | 0 | ||||||||||
| HIV | Ankylosing spondylitis | 3802 | 2 | 108 | 019 | 002 | 067 | 638 | 00116 | ||||||||||
| HIV | Autoimmune haemolytic anaemia | 1382 | 5 | 15 | 325 | 105 | 761 | 568 | 00171 | ||||||||||
| HIV | Chronic active hepatitis | 507 | 4 | 08 | 517 | 14 | 1332 | 953 | 0002 | ||||||||||
| HIV | Coeliac disease | 6921 | 7 | 14 | 05 | 02 | 103 | 302 | 00822 | ||||||||||
| HIV | Crohns disease | 10404 | 16 | 299 | 053 | 031 | 087 | 603 | 00141 | ||||||||||
| HIV | ITP | 3966 | 21 | 57 | 368 | 227 | 563 | 3813 | 0 | ||||||||||
| HIV | Myxoedema | 153406 | 72 | 1414 | 051 | 04 | 064 | 3362 | 0 | ||||||||||
| HIV | Pernicious anaemia | 14387 | 3 | 78 | 038 | 008 | 112 | 24 | 01217 | ||||||||||
| HIV | Polymyositis | 518 | 9 | 13 | 682 | 31 | 1305 | 3841 | 0 | ||||||||||
| HIV | Primary biliary cirrhosis | 1609 | 1 | 19 | 053 | 001 | 298 | 007 | 0787 | ||||||||||
| HIV | Psoriasis | 15618 | 43 | 412 | 104 | 075 | 141 | 004 | 08421 | ||||||||||
| HIV | Rheumatoid arthritis | 44692 | 28 | 521 | 054 | 036 | 078 | 1067 | 00011 | ||||||||||
| HIV | Scleroderma | 1636 | 1 | 22 | 046 | 001 | 254 | 022 | 06394 | ||||||||||
| HIV | Sjogrens syndrome | 3536 | 0 | 38 | 0 | 0 | 097 | 286 | 0091 | ||||||||||
| HIV | Systematic lupus erythematosus | 3060 | 9 | 86 | 105 | 048 | 199 | 0 | 09745 | ||||||||||
| HIV | Thyrotoxicosis | 21626 | 27 | 291 | 093 | 061 | 135 | 009 | 07631 | ||||||||||
| HIV | Ulcerative colitis | 16648 | 45 | 489 | 092 | 067 | 123 | 024 | 06256 |
| HIV b4 autos | |||||||||||||||||||
| exposure | outcome | obs in ref cohort | obs | exp | rate ratio | low CI | upr CI | chi-sq | p-value | ||||||||||
| HIV | Addisons disease | 686 | 3 | 11 | 271 | 056 | 796 | 175 | 01859 | ||||||||||
| HIV | Ankylosing spondylitis | 1807 | 0 | 52 | 0 | 0 | 071 | 421 | 00401 | ||||||||||
| HIV | Autoimmune haemolytic anaemia | 586 | 1 | 06 | 169 | 004 | 943 | 001 | 09035 | ||||||||||
| HIV | Chronic active hepatitis | 167 | 1 | 02 | 466 | 012 | 2633 | 038 | 05397 | ||||||||||
| HIV | Coeliac disease | 3282 | 1 | 61 | 016 | 0 | 091 | 346 | 00628 | ||||||||||
| HIV | Crohns disease | 4709 | 3 | 132 | 023 | 005 | 066 | 717 | 00074 | ||||||||||
| HIV | ITP | 1824 | 6 | 25 | 236 | 087 | 515 | 344 | 00636 | ||||||||||
| HIV | Myxoedema | 75495 | 29 | 716 | 04 | 027 | 058 | 2479 | 0 | ||||||||||
| HIV | Pernicious anaemia | 6772 | 0 | 42 | 0 | 0 | 089 | 322 | 00729 | ||||||||||
| HIV | Polymyositis | 216 | 1 | 05 | 188 | 005 | 1057 | 0 | 09632 | ||||||||||
| HIV | Primary biliary cirrhosis | 690 | 1 | 07 | 142 | 004 | 794 | 006 | 08079 | ||||||||||
| HIV | Psoriasis | 7528 | 16 | 196 | 082 | 047 | 133 | 048 | 0489 | ||||||||||
| HIV | Rheumatoid arthritis | 20701 | 11 | 254 | 043 | 022 | 077 | 763 | 00058 | ||||||||||
| HIV | Scleroderma | 725 | 0 | 1 | 0 | 0 | 362 | 026 | 0607 | ||||||||||
| HIV | Sjogrens syndrome | 1700 | 0 | 17 | 0 | 0 | 218 | 084 | 03586 | ||||||||||
| HIV | Systematic lupus erythematosus | 1357 | 3 | 36 | 083 | 017 | 243 | 0 | 09495 | ||||||||||
| HIV | Thyrotoxicosis | 10097 | 13 | 136 | 095 | 051 | 163 | 0 | 09755 | ||||||||||
| HIV | Ulcerative colitis | 7325 | 15 | 207 | 072 | 04 | 119 | 131 | 02521 |
| HIV b4 autos | |||||||||||||||||||
| exposure | outcome | obs in ref cohort | obs | exp | rate ratio | low CI | upr CI | chi-sq | p-value | ||||||||||
| HIV | Addisons disease | 830 | 15 | 15 | 998 | 556 | 1655 | 11032 | 0 | ||||||||||
| HIV | Ankylosing spondylitis | 1995 | 2 | 56 | 035 | 004 | 128 | 174 | 01866 | ||||||||||
| HIV | Autoimmune haemolytic anaemia | 796 | 4 | 09 | 423 | 115 | 1088 | 687 | 00088 | ||||||||||
| HIV | Chronic active hepatitis | 340 | 3 | 06 | 537 | 11 | 1582 | 668 | 00098 | ||||||||||
| HIV | Coeliac disease | 3639 | 6 | 79 | 076 | 028 | 165 | 025 | 0616 | ||||||||||
| HIV | Crohns disease | 5695 | 13 | 167 | 078 | 041 | 133 | 061 | 04355 | ||||||||||
| HIV | ITP | 2142 | 15 | 32 | 473 | 265 | 783 | 4024 | 0 | ||||||||||
| HIV | Myxoedema | 77911 | 43 | 698 | 062 | 045 | 083 | 992 | 00016 | ||||||||||
| HIV | Pernicious anaemia | 7615 | 3 | 37 | 082 | 017 | 239 | 001 | 09271 | ||||||||||
| HIV | Polymyositis | 302 | 8 | 08 | 1018 | 435 | 2031 | 5584 | 0 | ||||||||||
| HIV | Primary biliary cirrhosis | 919 | 0 | 12 | 0 | 0 | 317 | 038 | 05375 | ||||||||||
| HIV | Psoriasis | 8090 | 27 | 217 | 125 | 082 | 182 | 108 | 02985 | ||||||||||
| HIV | Rheumatoid arthritis | 23991 | 17 | 266 | 064 | 037 | 102 | 314 | 00763 | ||||||||||
| HIV | Scleroderma | 911 | 1 | 12 | 085 | 002 | 475 | 009 | 07639 | ||||||||||
| HIV | Sjogrens syndrome | 1836 | 0 | 21 | 0 | 0 | 176 | 121 | 02704 | ||||||||||
| HIV | Systematic lupus erythematosus | 1703 | 6 | 5 | 121 | 044 | 263 | 006 | 0813 | ||||||||||
| HIV | Thyrotoxicosis | 11529 | 14 | 155 | 09 | 049 | 151 | 007 | 0797 | ||||||||||
| HIV | Ulcerative colitis | 9323 | 30 | 282 | 106 | 072 | 152 | 006 | 08069 |
| HIV b4 autos | |||||||||||||||||||
| exposure | outcome | obs in ref cohort | obs | exp | rate ratio | low CI | upr CI | chi-sq | p-value | ||||||||||
| HIV | Addisons disease | 352 | 17 | 09 | 1992 | 1147 | 3236 | 27362 | 0 | ||||||||||
| HIV | Ankylosing spondylitis | 767 | 1 | 11 | 088 | 002 | 493 | 012 | 07296 | ||||||||||
| HIV | Autoimmune haemolytic anaemia | 306 | 7 | 04 | 1792 | 714 | 3736 | 9338 | 0 | ||||||||||
| HIV | Chronic active hepatitis | 118 | 6 | 02 | 3067 | 1103 | 6878 | 13684 | 0 | ||||||||||
| HIV | Coeliac disease | 1206 | 0 | 16 | 0 | 0 | 226 | 079 | 03752 | ||||||||||
| HIV | Crohns disease | 1896 | 15 | 5 | 3 | 167 | 496 | 1787 | 0 | ||||||||||
| HIV | ITP | 728 | 22 | 21 | 1068 | 665 | 1629 | 17803 | 0 | ||||||||||
| HIV | Myxoedema | 28047 | 13 | 163 | 08 | 042 | 136 | 048 | 04889 | ||||||||||
| HIV | Pernicious anaemia | 2773 | 1 | 09 | 106 | 003 | 593 | 021 | 06495 | ||||||||||
| HIV | Polymyositis | 113 | 1 | 01 | 785 | 02 | 4461 | 108 | 02995 | ||||||||||
| HIV | Primary biliary cirrhosis | 308 | 1 | 02 | 646 | 016 | 3624 | 077 | 03817 | ||||||||||
| HIV | Psoriasis | 3072 | 22 | 61 | 361 | 226 | 548 | 3875 | 0 | ||||||||||
| HIV | Rheumatoid arthritis | 9101 | 11 | 69 | 16 | 08 | 286 | 189 | 01697 | ||||||||||
| HIV | Scleroderma | 294 | 0 | 03 | 0 | 0 | 1121 | 009 | 07682 | ||||||||||
| HIV | Sjogrens syndrome | 565 | 2 | 05 | 436 | 053 | 1581 | 235 | 01253 | ||||||||||
| HIV | Systematic lupus erythematosus | 608 | 1 | 12 | 082 | 002 | 461 | 007 | 07944 | ||||||||||
| HIV | Thyrotoxicosis | 4243 | 5 | 43 | 118 | 038 | 275 | 001 | 09048 | ||||||||||
| HIV | Ulcerative colitis | 3123 | 17 | 75 | 229 | 133 | 367 | 1101 | 00009 |
| HIV b4 autos | |||||||||||||||||||
| exposure | outcome | obs in ref cohort | obs | exp | rate ratio | low CI | upr CI | chi-sq | p-value | ||||||||||
| HIV | Addisons disease | 821 | 1 | 01 | 78 | 02 | 4358 | 108 | 02995 | ||||||||||
| HIV | Ankylosing spondylitis | 1672 | 0 | 04 | 0 | 0 | 887 | 002 | 08966 | ||||||||||
| HIV | Autoimmune haemolytic anaemia | 1142 | 1 | 02 | 418 | 011 | 2333 | 028 | 05943 | ||||||||||
| HIV | Chronic active hepatitis | 300 | 1 | 01 | 1674 | 042 | 9401 | 323 | 00721 | ||||||||||
| HIV | Coeliac disease | 3003 | 0 | 04 | 0 | 0 | 836 | 001 | 09297 | ||||||||||
| HIV | Crohns disease | 4249 | 1 | 07 | 14 | 004 | 779 | 006 | 07988 | ||||||||||
| HIV | ITP | 2750 | 4 | 05 | 823 | 224 | 2109 | 1866 | 0 | ||||||||||
| HIV | Myxoedema | 111802 | 12 | 124 | 097 | 05 | 169 | 0 | 09748 | ||||||||||
| HIV | Pernicious anaemia | 13040 | 0 | 15 | 0 | 0 | 253 | 063 | 04283 | ||||||||||
| HIV | Polymyositis | 333 | 2 | 0 | 4371 | 527 | 15913 | 4594 | 0 | ||||||||||
| HIV | Primary biliary cirrhosis | 1120 | 0 | 01 | 0 | 0 | 3586 | 153 | 02162 | ||||||||||
| HIV | Psoriasis | 6100 | 2 | 15 | 131 | 016 | 472 | 0 | 09797 | ||||||||||
| HIV | Rheumatoid arthritis | 30228 | 7 | 41 | 172 | 069 | 355 | 146 | 02269 | ||||||||||
| HIV | Scleroderma | 909 | 0 | 01 | 0 | 0 | 3312 | 135 | 02449 | ||||||||||
| HIV | Sjogrens syndrome | 1883 | 0 | 02 | 0 | 0 | 1969 | 052 | 04704 | ||||||||||
| HIV | Systematic lupus erythematosus | 1056 | 0 | 02 | 0 | 0 | 1993 | 053 | 04648 | ||||||||||
| HIV | Thyrotoxicosis | 15247 | 4 | 19 | 21 | 057 | 538 | 134 | 0247 | ||||||||||
| HIV | Ulcerative colitis | 7697 | 5 | 16 | 317 | 103 | 74 | 541 | 002 |

interval lt1yr
1-4
5+
1+
males
females
The CHARCOT PROJECTINSPIRE
Isentress (Raltegravir)Pilot Study in Relapsing MS
bull Aims to investigate the concept of HERV+-EBV or herpes viruses as an etiology or trigger for MS
bull Disease controlling rather than disease modifying therapy
INSPIRE Design
bull Pilot study enrolling patients with active RRMS as defined by +ve Gd-enhanced MRI or documented relapse in previous 12 months
bull Baseline (3 months) followed by treatment (3 months)
bull Open label treatment phase with Raltegravir 400mg twice a day
INSPIRE Design 2bull 1deg Outcome number and rate of development
of Gd-enhanced lesionsbull 2deg outcomes are disability and quality-of-lifeStatistical considerations19 subjects need to complete trial to achieve 95 significance with 80 power for a 40 reduction in MS lesions compared with baseline (according to Sormani et al)
Trial design
change in gradient
change(in means)
V1 V2(screening before
visit)
V3 V4 V5 V6 V7 V8after
Raltegravirdispensed
A statistically significantchange in means is not inthis situation consistent
with a reduction inoutcome values due tointervention
3
Trial design
QOL QOL QOL QOL QOL QOL QOL
MSFC MSFC MSFC MSFC MSFC MSFC MSFCEDSS EDSS EDSS EDSS EDSS
blood blood blood blood blood blood blood blood
MRI MRI MRI MRI MRI MRI MRI
V1 V2 V3 V4 V5 V6 V7 V8(screening before after
visit)
bull Exploratory studybull Danger of Type II error of missing a real association arguably greater than
danger of Type I error of highlighting a spurious association
4
DATA
bull Patient socio-demographic and baseline
bull MRI
bull Viral and biomarkers
bull Disability
bull Quality of life
bull Laboratory safety tests
2
Patient socio-demographic and baseline
N mean min maxITTAge at baselineyrs 20 4073 3115 5299Height cm 18 16904 15600 18300Weight kg 18 7873 5190 10970Baseline EDSS 20 240 000 400Number of relapses in past year 20 150 100 300
PPAge at baselineyrs 16 4162 3115 5299Height cm 14 16891 15600 18000Weight kg 14 7790 5190 10830Baseline EDSS 16 225 000 350Number of relapses in past year 16 144 100 300
6
Patient adherenceITT PP
Visit mean
6 Number of tablets dispensed 60 60Number of tablets returned 235 269Adherence percentagea 9608 9552
7 Number of tablets dispensed 63 6375Number of tablets returned 72 675Adherence percentagea 88 8875
8 Number of tablets dispensed 597 5963Number of tablets returned 81 863Adherence percentagea 824 805
Over all three visits Number of tablets dispensed 609 6113Number of tablets returned 588 602Adherence percentagea 8883 8826
a100(tablets dispensed - tablets returned)tablets dispensed
7
MRI Total T1 Gd-enhancing lesionsTotal T1 (Gad enhanced) lesion rates
Before (visits 34 and 5) After (visits 67 and 8) Within-patient changea
Mean monthly Mean monthly Change Weightedrate rate in rate rate ratiob
ITT (n=20) 289 302 012 103PP (n=16) 251 233 -018 092
aChanges calculated after-before or afterbeforebRatios averaged on log scale before back-transforming substituting 01 for zero rates Weighted ratios pooled byweighting for total subject counts
Poisson regression analysis after vs before
ITT rate ratio after vs before as 104(95 CI 85 129) P=0681PP rate ratio after vs before as093(95 CI 072 120) P=0577
Poisson regression analysis gradient after vs gradient beforeITT test of difference in gradients P=0659PP test of difference in gradients P=0463
8
MRI New T1 Gd-enhancing lesionsNew T1 (Gad enhanced) lesion rates
Before (visits 34 and 5) After (visits 67 and 8) Within-patient changea
Mean monthly Mean monthly Changerate rate in rate
ITT (n=20) 143 167 023PP (n=16) 098 115 017
aChanges calculated after-before or afterbefore
Poisson regression analysis after vs beforeITT rate ratio after vs before as 116(95 CI 087 155) P=0314PP rate ratio after vs before as 116 (95 CI079 172) P=0456
Poisson regression analysis gradient after vs gradient beforeITT test of difference in gradients P=0562PP test of difference in gradients P=0137
9
MRI T1 Gd lesions
ITT Patients in order of difference in rate
010008010019010015010001010016010009010028010027010003010005010007010010010011010013010014010017010023
010012010020010024
-4 -2 0 2difference in rate lesions per month
Difference after - before
4
13
MRI lesions summary
Lesion outcomes provide no statistical evidence consistent with aneffect of raltegravir
14
Viral and biomarker data Before vs AfterBaselines (visit 2) Before (345) After (678)
Variable N mean sd N mean sd mean sd
MSRV A CtGAPDH Ct(dim-less) 20 094 01 20 093 007 20 092 007MSRV M CtGAPDH Ct(dim-less) 20 133 006 20 133 006 20 132 007TB HE23 CtGAPDH Ct(dim-less) 20 127 014 20 124 013 20 124 013HERV-W A CtGAPDH Ct(dim-less) 20 116 016 20 118 01 20 118 009HERV-W M CtGAPDH Ct(dim-less) 20 147 021 20 144 015 20 145 013TB HE1113 CtGAPDH Ct(dim-less) 20 127 01 20 128 006 20 129 006IL-8 pgmL 20 2805 8683 20 852 232 20 934 286HERV-WMSRV Gag Flix B cells (d-less) 13 118 011 19 119 01 18 115 006HERV-HF Gag Flix B cells (d-less) 12 114 01 17 108 007 20 112 011HERV-HF Env (H1) Flix B cells (d-less) 11 112 007 18 106 005 17 11 008HERV-HF Env (H3) Flix B cells (d-less) 19 156 024 20 147 015 20 152 016HERV-HF Env (W1) Flix B cells (d-less) 18 131 013 20 123 01 20 123 01HERV-HF Env (W3) Flix B cells (d-less) 17 125 015 20 122 009 20 124 017prop of B cells in sample () 19 914 38 20 859 306 20 905 379prop of monocytes in sample () 19 1533 92 20 1808 641 20 1609 623
HERV-WMSRV Gag Flix monocytes (d-less) 11 114 009 16 116 005 15 115 007MSRV F Gag Flix monocytes (d-less) 13 116 01 17 111 005 16 122 019Env (H1) Flix monocytes (d-less) 15 115 012 18 112 008 17 115 006Env (H3) Flix monocytes (d-less) 19 159 018 20 155 019 20 157 02Env (W1) Flix monocytes (d-less) 15 115 01 19 111 007 19 108 005Env (W3) Flix monocytes (d-less) 13 116 008 19 112 007 18 116 009HCRP ngmL 20 178383 21238 20 189945 176902 20 243527 224115CD163 ngmL 20 45667 15463 20 4239 10536 20 44257 12468EBV Copiesmicrolitre 16 21371 79687 16 238 6672 15 668 21274
Viral and biomarker data Before vs AfterHERV-WMSRV Gag Flix B cellsSignificant drop in means in ITT and PPNo significant change in gradient but steeper gradient before
HERV-WMSRV Gag Flix B cellsPP Individual subjects and fitted line
Significant overall drop notattributable to intervention
Similar story for
Env (W1) Flix monocytes
2 3 4 5 6 7 8monthly visits
Solid line fitted by modelA significant drop in means cannot be explained by intervention since decline is steeper before
17
MRI PP Persisting T1 Gd-enhancing lesionsBefore After Within-patient changea
Mean rate Mean rate Change in ratePP (n=16) 153 119 -034
80 of total reductionoccurs before theintervention
attributing the overallreduction to the interventioneven if reduction weresignificant would not be
-013 (P=0469)
P=0762-003 (P=0835)
credible
11
MRI T2 lesions
T2 lesion counts Observed at visits 5 (before) and 8 (after)
Before After Within-patient changea
Mean count Mean count Mean count changeP=0472
weighted ratiob
ITT 445PP 313
465 020P=0462331 019
105107
aChanges calculated after-before or afterbeforebWithin-patient ratios averaged on log scale before back transforming substituting 01 for zero counts Weighted meanratios pooled on log scale by weighting for lesion counts
12
Viral and biomarker data change vs T1 Gd lesion changePositive correlation
HERV-WMSRV Gag Flix B cells r=046 P=0057 ITT r=048 P=0086 PP
9
10
Additional analysis
A higher T1 Gd lesioncount at any visit isassociated with higher714
1619
28 27
20
1712
values of HERV-WMSRVGag Flix B cells at that visitP=0029 (ITT)
15
8 1
-3 -2 -1 0 1 2change in T1 lesion rate
Suggestion of decrease in HERV-WMSRV Gag Flix B cells associated with decrease in Gd-enhanced lesion rate PP r=-048 P=0086
23
Patients with a decrease in lesion count (eg patient 8) tend to have a decrease or a greater decrease in the biomarker than patients with an increase in lesion count (eg patient 20)
Viral and biomarker data summary
Some statistically significant changes in gradient before vs after wereobserved However whether these are consistent with an effect ofraltegravir depends partly on biological plausibility
A very small number of statistically significant correlations wereobserved between changes in these measures and changes in T1 Gdlesion counts their interpretation is again heavily dependent onbiological plausibility
Because of the number of measurestests any significant resultsshould be treated with caution Since results are singled out on thebasis of statistical significance rather than prior hypothesis Type Ierror is likely
25
Viral and biomarker data Before vs AfterHCRP ngmLSignificant increase in means in ITT and PPNo significant change in (positive) gradient similar slightly steeper gradient after
ITT------------------------------------------------------------------------------
| gradient SE z P-value [95 Conf Interval]-------------+----------------------------------------------------------------
before | 1221482 1495142 082 0414 -1708943 4151908after | 1406076 1495142 094 0347 -1524349 4336501
------------------------------------------------------------------------------
Significant overall increase not credibly attributable to intervention since the gradientbefore though non-significant is too similar to the gradient after intervention
18
Quality of life data summary
A number of measures showed statistically significant improvementsin well-being or a slowing of deterioration in the period aftercompared to before intervention
Although consistent with an effect of raltegravir this is most crediblyattributable to the placebo effect of patients receiving an unblindedintervention rather than to any action of the drug
The study design of not having a control group or a cross-over designmitigated against determining the possible effect of the interventionon Q0L
31
Viral and biomarker data Before vs AfterEnv (W3) Flix monocytesNon-significant decline before becomes borderline significant increase afterand significant change in gradient
Env (W3) Flix monocytesITT Individual subjects and fitted line
-002 P=0200
As before biologicalplausibility important bothfor change displayed andfor negative correlation
with Gd T1 lesions
+002 P=0055
P=0047
2 3 4 5 6 7 8monthly visits
Significant change in gradient in ITT (P=0047) and borderline in PP (P=0089)Change in means after - before negatively correlated withchange in rate of Gd enhancing T1 lesions r=-054 P=0015
21
Disability data
Summary of changes after-before
N mean sdEDSS 20 014 045 Neither change nor gradient change significant
MSFC 20 023 028 [Both change and change in gradient significant]9HPT peg speed 20 0003 0003 Highly significant improvementWalk speed (fs) 20 -004 047 Neither change nor gradient change significantPASAT score 20 466 521 Highly significant improvement
PASAT------------------------------------------------------------------------------
| gradient SE z P-value [95 Conf Interval]-------------+----------------------------------------------------------------
before | 2478954 4594816 540 0000 1578387 3379522after | 6377749 4534625 141 0160 -2509954 1526545
------------------------------------------------------------------------------
bull There is a significant gradient changebull But rate of improvement substantially greater before than after intervention
27
Quality of life data
Summary of changes after-before
change inITT n means
PQ - SF36 - Physical Functional Score (PF) 20 -092
PQ - SF36 - Role-Physical Scale (RP) 20 -948PQ - SF36 - Bodily Pain Scale (BP) 20 -542
PQ - SF36 - General Health Scale (GH) 20 -467
PQ - SF36 - Vitality Scale (VT) 20 506 PQ - SF36 - Social Functioning Scale (SF) 20 245 PQ - SF36 - Role Emotional Scale (RE) 20 -862 no statistically significant changes
PQ - SF36 - Mental Health Scale (MH) 20 572 PQ - PFA - Patient Fatigue Assessment 20 -151PQ - PPA - Patient Pain Assessment 19 407PQ - MSIS - Total Score 20 -210 no statistically significant changes
PQ - MSWS-12 - MSWS Total Score 20 -035
30
Quality of life dataSummary of changes after-before
change inITT n means
PQ - SF36 - Physical Functional Score (PF) 20 -092PQ - SF36 - Role-Physical Scale (RP) 20 -948PQ - SF36 - Bodily Pain Scale (BP) 20 -542PQ - SF36 - General Health Scale (GH) 20 -467PQ - SF36 - Vitality Scale (VT) 20 506
+ = improvement
PQ - SF36 - Social Functioning Scale (SF) 20 245PQ - SF36 - Role Emotional Scale (RE) 20 -862PQ - SF36 - Mental Health Scale (MH) 20 572PQ - PFA - Patient Fatigue Assessment 20 -151PQ - PPA - Patient Pain Assessment 19 407 - = improvementPQ - MSIS - Total Score 20 -210PQ - MSWS-12 - MSWS Total Score 20 -035
29
Disability data
Summary of changes after-before
N mean sdEDSS 20 014 045 Neither change nor gradient change significant
MSFC 20 023 028 [Both change and change in gradient significant]9HPT peg speed 20 0003 0003 Highly significant improvementWalk speed (fs) 20 -004 047 Neither change nor gradient change significantPASAT score 20 466 521
9HPT peg speed------------------------------------------------------------------------------
ITT | gradient SE z P-value [95 Conf Interval]-------------+----------------------------------------------------------------
before | 0009916 0002372 418 0000 0005267 0014565after | 000545 0002363 231 0021 0000818 0010082
------------------------------------------------------------------------------
bull No significant gradient changebull But rate of improvement substantially greater before than after intervention
26
Acknowledgementsbull Unit for Healthcare Epidemiology Oxford
ndash Raph Goldacrendash Michael Goldacrendash David Yeates
bull QMULbull Gavin Giovannoni
bull The Albion Centrebull Hubert Maruszak
bull UCLbull Robin Weiss
Laboratory safety tests
32
Laboratory safety tests significant changes
ITT change gradient gradient change inbefore after gradient
ADJUSTED CALCIUM SERUM +002 -000003 +0008 P=0406 increase could bep=0025 pgt09 p=0149 due intervention
CHLORIDE SERUM -075 +014 -031 p=0194 decrease could bep=0055 p=0503 p=0103 due to intervention
CHOLESTEROL SERUM +028 +008 +003 p=0437 increase notp=0004 p=0059 p=0521 plausibly duehellip
GLUCOSE PLASMA -018 +008 -015 p=0072 gradient changep=0196 p=0284 p=0037 could be duehellip
LDL CHOLESTEROL SERUM +017 +006 +0004 p=0432 increase notp=0018 p=0162 pgt09 plausibly duehellip
PLATELET COUNT +686 -027 +259 p=0352 increase could bep=0040 p=0880 p=0129 duehellip
WHITE BLOOD COUNT PP +022 +006 +010 p=0827 increase notp=0049 p=0579 p=0331 plausibly due
33
- Diapositive numeacutero 1
- Diapositive numeacutero 2
- Dr Jean-Martin Charcot
- Diapositive numeacutero 4
- Diapositive numeacutero 5
- Diapositive numeacutero 6
- Viruses and MS
- Are human endogenous retroviruses pathogenic An approach to testing the hypothesis
- How HERVs may induce autoimmune response
- Diapositive numeacutero 10
- Diapositive numeacutero 11
- Diapositive numeacutero 12
- Diapositive numeacutero 13
- How many cases of HIV and MS have been reported
- What do cohort studies show
- What is the Risk of Developing Multiple Sclerosis if you have HIV and are on HIV Anti-retroviral therapy
- Methods
- Diapositive numeacutero 18
- Diapositive numeacutero 19
- NHS Data on UK Healthcare events 1999-2011
- NHS Cohort gt One year after Exposure (HIV) Contact
- Diapositive numeacutero 22
- The CHARCOT PROJECTINSPIRE Isentress (Raltegravir)Pilot Study in Relapsing MS
- INSPIRE Design
- INSPIRE Design 2
- Diapositive numeacutero 26
- Diapositive numeacutero 27
- Diapositive numeacutero 28
- Diapositive numeacutero 29
- Diapositive numeacutero 30
- Diapositive numeacutero 31
- Diapositive numeacutero 32
- Diapositive numeacutero 34
- Diapositive numeacutero 35
- Diapositive numeacutero 36
- Diapositive numeacutero 37
- Diapositive numeacutero 38
- Diapositive numeacutero 39
- Diapositive numeacutero 40
- Diapositive numeacutero 41
- Diapositive numeacutero 42
- Diapositive numeacutero 43
- Diapositive numeacutero 44
- Diapositive numeacutero 45
- Diapositive numeacutero 47
- Diapositive numeacutero 48
- Diapositive numeacutero 49
- Diapositive numeacutero 50
- Acknowledgements
- Diapositive numeacutero 52
- Diapositive numeacutero 53
- Diapositive numeacutero 54
-
| HIV b4 autos | |||||||||||||||||||
| exposure | outcome | obs in ref cohort | obs | exp | rate ratio | low CI | upr CI | chi-sq | p-value | ||||||||||
| HIV | Addisons disease | 1107 | 13 | 15 | 881 | 468 | 1513 | 814 | 0 | ||||||||||
| HIV | Ankylosing spondylitis | 1686 | 0 | 22 | 0 | 0 | 164 | 136 | 02435 | ||||||||||
| HIV | Autoimmune haemolytic anaemia | 911 | 3 | 05 | 638 | 131 | 187 | 873 | 00031 | ||||||||||
| HIV | Chronic active hepatitis | 435 | 3 | 03 | 915 | 188 | 2693 | 143 | 00002 | ||||||||||
| HIV | Coeliac disease | 4991 | 3 | 76 | 04 | 008 | 116 | 218 | 01395 | ||||||||||
| HIV | Crohns disease | 6362 | 4 | 119 | 034 | 009 | 086 | 457 | 00325 | ||||||||||
| HIV | ITP | 2504 | 11 | 27 | 411 | 205 | 737 | 2278 | 0 | ||||||||||
| HIV | Myxoedema | 142597 | 33 | 977 | 034 | 023 | 047 | 4221 | 0 | ||||||||||
| HIV | Pernicious anaemia | 11732 | 2 | 49 | 04 | 005 | 146 | 121 | 02717 | ||||||||||
| HIV | Polymyositis | 395 | 3 | 05 | 622 | 128 | 183 | 837 | 00038 | ||||||||||
| HIV | Primary biliary cirrhosis | 1605 | 1 | 12 | 086 | 002 | 482 | 01 | 07507 | ||||||||||
| HIV | Psoriasis | 9262 | 7 | 129 | 054 | 022 | 111 | 229 | 01305 | ||||||||||
| HIV | Rheumatoid arthritis | 37706 | 11 | 28 | 039 | 02 | 07 | 969 | 00018 | ||||||||||
| HIV | Scleroderma | 1581 | 1 | 15 | 066 | 002 | 369 | 0 | 09916 | ||||||||||
| HIV | Sjogrens syndrome | 3640 | 0 | 31 | 0 | 0 | 12 | 215 | 01424 | ||||||||||
| HIV | Systematic lupus erythematosus | 3109 | 9 | 73 | 123 | 056 | 233 | 019 | 06667 | ||||||||||
| HIV | Thyrotoxicosis | 20268 | 16 | 193 | 083 | 047 | 135 | 04 | 05258 | ||||||||||
| HIV | Ulcerative colitis | 9235 | 5 | 155 | 032 | 01 | 075 | 65 | 00108 |
| HIV b4 autos | |||||||||||||||||||
| exposure | outcome | obs in ref cohort | obs | exp | rate ratio | low CI | upr CI | chi-sq | p-value | ||||||||||
| HIV | Addisons disease | 761 | 22 | 2 | 1108 | 69 | 169 | 18634 | 0 | ||||||||||
| HIV | Ankylosing spondylitis | 2883 | 3 | 97 | 031 | 006 | 091 | 395 | 0047 | ||||||||||
| HIV | Autoimmune haemolytic anaemia | 777 | 9 | 15 | 619 | 282 | 118 | 3371 | 0 | ||||||||||
| HIV | Chronic active hepatitis | 190 | 7 | 07 | 1106 | 439 | 2324 | 5245 | 0 | ||||||||||
| HIV | Coeliac disease | 3136 | 4 | 81 | 05 | 013 | 127 | 158 | 02085 | ||||||||||
| HIV | Crohns disease | 5938 | 27 | 231 | 117 | 077 | 171 | 051 | 04754 | ||||||||||
| HIV | ITP | 2190 | 32 | 52 | 628 | 428 | 889 | 13471 | 0 | ||||||||||
| HIV | Myxoedema | 38856 | 52 | 60 | 087 | 065 | 114 | 095 | 0331 | ||||||||||
| HIV | Pernicious anaemia | 5428 | 2 | 38 | 052 | 006 | 189 | 046 | 04974 | ||||||||||
| HIV | Polymyositis | 236 | 7 | 1 | 732 | 291 | 1531 | 3116 | 0 | ||||||||||
| HIV | Primary biliary cirrhosis | 312 | 1 | 09 | 115 | 003 | 648 | 016 | 06935 | ||||||||||
| HIV | Psoriasis | 9428 | 58 | 344 | 169 | 128 | 219 | 1556 | 00001 | ||||||||||
| HIV | Rheumatoid arthritis | 16087 | 28 | 31 | 09 | 06 | 131 | 02 | 06538 | ||||||||||
| HIV | Scleroderma | 349 | 0 | 1 | 0 | 0 | 366 | 026 | 06107 | ||||||||||
| HIV | Sjogrens syndrome | 461 | 2 | 12 | 17 | 02 | 617 | 009 | 07682 | ||||||||||
| HIV | Systematic lupus erythematosus | 559 | 1 | 25 | 04 | 001 | 226 | 038 | 05355 | ||||||||||
| HIV | Thyrotoxicosis | 5601 | 16 | 141 | 114 | 065 | 185 | 014 | 07078 | ||||||||||
| HIV | Ulcerative colitis | 10536 | 57 | 408 | 14 | 106 | 181 | 605 | 00139 |
| HIV b4 autos | |||||||||||||||||||
| exposure | outcome | obs in ref cohort | obs | exp | rate ratio | low CI | upr CI | chi-sq | p-value | ||||||||||
| HIV | Addisons disease | 1516 | 18 | 26 | 69 | 408 | 1094 | 8394 | 0 | ||||||||||
| HIV | Ankylosing spondylitis | 3802 | 2 | 108 | 019 | 002 | 067 | 638 | 00116 | ||||||||||
| HIV | Autoimmune haemolytic anaemia | 1382 | 5 | 15 | 325 | 105 | 761 | 568 | 00171 | ||||||||||
| HIV | Chronic active hepatitis | 507 | 4 | 08 | 517 | 14 | 1332 | 953 | 0002 | ||||||||||
| HIV | Coeliac disease | 6921 | 7 | 14 | 05 | 02 | 103 | 302 | 00822 | ||||||||||
| HIV | Crohns disease | 10404 | 16 | 299 | 053 | 031 | 087 | 603 | 00141 | ||||||||||
| HIV | ITP | 3966 | 21 | 57 | 368 | 227 | 563 | 3813 | 0 | ||||||||||
| HIV | Myxoedema | 153406 | 72 | 1414 | 051 | 04 | 064 | 3362 | 0 | ||||||||||
| HIV | Pernicious anaemia | 14387 | 3 | 78 | 038 | 008 | 112 | 24 | 01217 | ||||||||||
| HIV | Polymyositis | 518 | 9 | 13 | 682 | 31 | 1305 | 3841 | 0 | ||||||||||
| HIV | Primary biliary cirrhosis | 1609 | 1 | 19 | 053 | 001 | 298 | 007 | 0787 | ||||||||||
| HIV | Psoriasis | 15618 | 43 | 412 | 104 | 075 | 141 | 004 | 08421 | ||||||||||
| HIV | Rheumatoid arthritis | 44692 | 28 | 521 | 054 | 036 | 078 | 1067 | 00011 | ||||||||||
| HIV | Scleroderma | 1636 | 1 | 22 | 046 | 001 | 254 | 022 | 06394 | ||||||||||
| HIV | Sjogrens syndrome | 3536 | 0 | 38 | 0 | 0 | 097 | 286 | 0091 | ||||||||||
| HIV | Systematic lupus erythematosus | 3060 | 9 | 86 | 105 | 048 | 199 | 0 | 09745 | ||||||||||
| HIV | Thyrotoxicosis | 21626 | 27 | 291 | 093 | 061 | 135 | 009 | 07631 | ||||||||||
| HIV | Ulcerative colitis | 16648 | 45 | 489 | 092 | 067 | 123 | 024 | 06256 |
| HIV b4 autos | |||||||||||||||||||
| exposure | outcome | obs in ref cohort | obs | exp | rate ratio | low CI | upr CI | chi-sq | p-value | ||||||||||
| HIV | Addisons disease | 686 | 3 | 11 | 271 | 056 | 796 | 175 | 01859 | ||||||||||
| HIV | Ankylosing spondylitis | 1807 | 0 | 52 | 0 | 0 | 071 | 421 | 00401 | ||||||||||
| HIV | Autoimmune haemolytic anaemia | 586 | 1 | 06 | 169 | 004 | 943 | 001 | 09035 | ||||||||||
| HIV | Chronic active hepatitis | 167 | 1 | 02 | 466 | 012 | 2633 | 038 | 05397 | ||||||||||
| HIV | Coeliac disease | 3282 | 1 | 61 | 016 | 0 | 091 | 346 | 00628 | ||||||||||
| HIV | Crohns disease | 4709 | 3 | 132 | 023 | 005 | 066 | 717 | 00074 | ||||||||||
| HIV | ITP | 1824 | 6 | 25 | 236 | 087 | 515 | 344 | 00636 | ||||||||||
| HIV | Myxoedema | 75495 | 29 | 716 | 04 | 027 | 058 | 2479 | 0 | ||||||||||
| HIV | Pernicious anaemia | 6772 | 0 | 42 | 0 | 0 | 089 | 322 | 00729 | ||||||||||
| HIV | Polymyositis | 216 | 1 | 05 | 188 | 005 | 1057 | 0 | 09632 | ||||||||||
| HIV | Primary biliary cirrhosis | 690 | 1 | 07 | 142 | 004 | 794 | 006 | 08079 | ||||||||||
| HIV | Psoriasis | 7528 | 16 | 196 | 082 | 047 | 133 | 048 | 0489 | ||||||||||
| HIV | Rheumatoid arthritis | 20701 | 11 | 254 | 043 | 022 | 077 | 763 | 00058 | ||||||||||
| HIV | Scleroderma | 725 | 0 | 1 | 0 | 0 | 362 | 026 | 0607 | ||||||||||
| HIV | Sjogrens syndrome | 1700 | 0 | 17 | 0 | 0 | 218 | 084 | 03586 | ||||||||||
| HIV | Systematic lupus erythematosus | 1357 | 3 | 36 | 083 | 017 | 243 | 0 | 09495 | ||||||||||
| HIV | Thyrotoxicosis | 10097 | 13 | 136 | 095 | 051 | 163 | 0 | 09755 | ||||||||||
| HIV | Ulcerative colitis | 7325 | 15 | 207 | 072 | 04 | 119 | 131 | 02521 |
| HIV b4 autos | |||||||||||||||||||
| exposure | outcome | obs in ref cohort | obs | exp | rate ratio | low CI | upr CI | chi-sq | p-value | ||||||||||
| HIV | Addisons disease | 830 | 15 | 15 | 998 | 556 | 1655 | 11032 | 0 | ||||||||||
| HIV | Ankylosing spondylitis | 1995 | 2 | 56 | 035 | 004 | 128 | 174 | 01866 | ||||||||||
| HIV | Autoimmune haemolytic anaemia | 796 | 4 | 09 | 423 | 115 | 1088 | 687 | 00088 | ||||||||||
| HIV | Chronic active hepatitis | 340 | 3 | 06 | 537 | 11 | 1582 | 668 | 00098 | ||||||||||
| HIV | Coeliac disease | 3639 | 6 | 79 | 076 | 028 | 165 | 025 | 0616 | ||||||||||
| HIV | Crohns disease | 5695 | 13 | 167 | 078 | 041 | 133 | 061 | 04355 | ||||||||||
| HIV | ITP | 2142 | 15 | 32 | 473 | 265 | 783 | 4024 | 0 | ||||||||||
| HIV | Myxoedema | 77911 | 43 | 698 | 062 | 045 | 083 | 992 | 00016 | ||||||||||
| HIV | Pernicious anaemia | 7615 | 3 | 37 | 082 | 017 | 239 | 001 | 09271 | ||||||||||
| HIV | Polymyositis | 302 | 8 | 08 | 1018 | 435 | 2031 | 5584 | 0 | ||||||||||
| HIV | Primary biliary cirrhosis | 919 | 0 | 12 | 0 | 0 | 317 | 038 | 05375 | ||||||||||
| HIV | Psoriasis | 8090 | 27 | 217 | 125 | 082 | 182 | 108 | 02985 | ||||||||||
| HIV | Rheumatoid arthritis | 23991 | 17 | 266 | 064 | 037 | 102 | 314 | 00763 | ||||||||||
| HIV | Scleroderma | 911 | 1 | 12 | 085 | 002 | 475 | 009 | 07639 | ||||||||||
| HIV | Sjogrens syndrome | 1836 | 0 | 21 | 0 | 0 | 176 | 121 | 02704 | ||||||||||
| HIV | Systematic lupus erythematosus | 1703 | 6 | 5 | 121 | 044 | 263 | 006 | 0813 | ||||||||||
| HIV | Thyrotoxicosis | 11529 | 14 | 155 | 09 | 049 | 151 | 007 | 0797 | ||||||||||
| HIV | Ulcerative colitis | 9323 | 30 | 282 | 106 | 072 | 152 | 006 | 08069 |
| HIV b4 autos | |||||||||||||||||||
| exposure | outcome | obs in ref cohort | obs | exp | rate ratio | low CI | upr CI | chi-sq | p-value | ||||||||||
| HIV | Addisons disease | 352 | 17 | 09 | 1992 | 1147 | 3236 | 27362 | 0 | ||||||||||
| HIV | Ankylosing spondylitis | 767 | 1 | 11 | 088 | 002 | 493 | 012 | 07296 | ||||||||||
| HIV | Autoimmune haemolytic anaemia | 306 | 7 | 04 | 1792 | 714 | 3736 | 9338 | 0 | ||||||||||
| HIV | Chronic active hepatitis | 118 | 6 | 02 | 3067 | 1103 | 6878 | 13684 | 0 | ||||||||||
| HIV | Coeliac disease | 1206 | 0 | 16 | 0 | 0 | 226 | 079 | 03752 | ||||||||||
| HIV | Crohns disease | 1896 | 15 | 5 | 3 | 167 | 496 | 1787 | 0 | ||||||||||
| HIV | ITP | 728 | 22 | 21 | 1068 | 665 | 1629 | 17803 | 0 | ||||||||||
| HIV | Myxoedema | 28047 | 13 | 163 | 08 | 042 | 136 | 048 | 04889 | ||||||||||
| HIV | Pernicious anaemia | 2773 | 1 | 09 | 106 | 003 | 593 | 021 | 06495 | ||||||||||
| HIV | Polymyositis | 113 | 1 | 01 | 785 | 02 | 4461 | 108 | 02995 | ||||||||||
| HIV | Primary biliary cirrhosis | 308 | 1 | 02 | 646 | 016 | 3624 | 077 | 03817 | ||||||||||
| HIV | Psoriasis | 3072 | 22 | 61 | 361 | 226 | 548 | 3875 | 0 | ||||||||||
| HIV | Rheumatoid arthritis | 9101 | 11 | 69 | 16 | 08 | 286 | 189 | 01697 | ||||||||||
| HIV | Scleroderma | 294 | 0 | 03 | 0 | 0 | 1121 | 009 | 07682 | ||||||||||
| HIV | Sjogrens syndrome | 565 | 2 | 05 | 436 | 053 | 1581 | 235 | 01253 | ||||||||||
| HIV | Systematic lupus erythematosus | 608 | 1 | 12 | 082 | 002 | 461 | 007 | 07944 | ||||||||||
| HIV | Thyrotoxicosis | 4243 | 5 | 43 | 118 | 038 | 275 | 001 | 09048 | ||||||||||
| HIV | Ulcerative colitis | 3123 | 17 | 75 | 229 | 133 | 367 | 1101 | 00009 |
1-4
5+
1+
males
females
The CHARCOT PROJECTINSPIRE
Isentress (Raltegravir)Pilot Study in Relapsing MS
bull Aims to investigate the concept of HERV+-EBV or herpes viruses as an etiology or trigger for MS
bull Disease controlling rather than disease modifying therapy
INSPIRE Design
bull Pilot study enrolling patients with active RRMS as defined by +ve Gd-enhanced MRI or documented relapse in previous 12 months
bull Baseline (3 months) followed by treatment (3 months)
bull Open label treatment phase with Raltegravir 400mg twice a day
INSPIRE Design 2bull 1deg Outcome number and rate of development
of Gd-enhanced lesionsbull 2deg outcomes are disability and quality-of-lifeStatistical considerations19 subjects need to complete trial to achieve 95 significance with 80 power for a 40 reduction in MS lesions compared with baseline (according to Sormani et al)
Trial design
change in gradient
change(in means)
V1 V2(screening before
visit)
V3 V4 V5 V6 V7 V8after
Raltegravirdispensed
A statistically significantchange in means is not inthis situation consistent
with a reduction inoutcome values due tointervention
3
Trial design
QOL QOL QOL QOL QOL QOL QOL
MSFC MSFC MSFC MSFC MSFC MSFC MSFCEDSS EDSS EDSS EDSS EDSS
blood blood blood blood blood blood blood blood
MRI MRI MRI MRI MRI MRI MRI
V1 V2 V3 V4 V5 V6 V7 V8(screening before after
visit)
bull Exploratory studybull Danger of Type II error of missing a real association arguably greater than
danger of Type I error of highlighting a spurious association
4
DATA
bull Patient socio-demographic and baseline
bull MRI
bull Viral and biomarkers
bull Disability
bull Quality of life
bull Laboratory safety tests
2
Patient socio-demographic and baseline
N mean min maxITTAge at baselineyrs 20 4073 3115 5299Height cm 18 16904 15600 18300Weight kg 18 7873 5190 10970Baseline EDSS 20 240 000 400Number of relapses in past year 20 150 100 300
PPAge at baselineyrs 16 4162 3115 5299Height cm 14 16891 15600 18000Weight kg 14 7790 5190 10830Baseline EDSS 16 225 000 350Number of relapses in past year 16 144 100 300
6
Patient adherenceITT PP
Visit mean
6 Number of tablets dispensed 60 60Number of tablets returned 235 269Adherence percentagea 9608 9552
7 Number of tablets dispensed 63 6375Number of tablets returned 72 675Adherence percentagea 88 8875
8 Number of tablets dispensed 597 5963Number of tablets returned 81 863Adherence percentagea 824 805
Over all three visits Number of tablets dispensed 609 6113Number of tablets returned 588 602Adherence percentagea 8883 8826
a100(tablets dispensed - tablets returned)tablets dispensed
7
MRI Total T1 Gd-enhancing lesionsTotal T1 (Gad enhanced) lesion rates
Before (visits 34 and 5) After (visits 67 and 8) Within-patient changea
Mean monthly Mean monthly Change Weightedrate rate in rate rate ratiob
ITT (n=20) 289 302 012 103PP (n=16) 251 233 -018 092
aChanges calculated after-before or afterbeforebRatios averaged on log scale before back-transforming substituting 01 for zero rates Weighted ratios pooled byweighting for total subject counts
Poisson regression analysis after vs before
ITT rate ratio after vs before as 104(95 CI 85 129) P=0681PP rate ratio after vs before as093(95 CI 072 120) P=0577
Poisson regression analysis gradient after vs gradient beforeITT test of difference in gradients P=0659PP test of difference in gradients P=0463
8
MRI New T1 Gd-enhancing lesionsNew T1 (Gad enhanced) lesion rates
Before (visits 34 and 5) After (visits 67 and 8) Within-patient changea
Mean monthly Mean monthly Changerate rate in rate
ITT (n=20) 143 167 023PP (n=16) 098 115 017
aChanges calculated after-before or afterbefore
Poisson regression analysis after vs beforeITT rate ratio after vs before as 116(95 CI 087 155) P=0314PP rate ratio after vs before as 116 (95 CI079 172) P=0456
Poisson regression analysis gradient after vs gradient beforeITT test of difference in gradients P=0562PP test of difference in gradients P=0137
9
MRI T1 Gd lesions
ITT Patients in order of difference in rate
010008010019010015010001010016010009010028010027010003010005010007010010010011010013010014010017010023
010012010020010024
-4 -2 0 2difference in rate lesions per month
Difference after - before
4
13
MRI lesions summary
Lesion outcomes provide no statistical evidence consistent with aneffect of raltegravir
14
Viral and biomarker data Before vs AfterBaselines (visit 2) Before (345) After (678)
Variable N mean sd N mean sd mean sd
MSRV A CtGAPDH Ct(dim-less) 20 094 01 20 093 007 20 092 007MSRV M CtGAPDH Ct(dim-less) 20 133 006 20 133 006 20 132 007TB HE23 CtGAPDH Ct(dim-less) 20 127 014 20 124 013 20 124 013HERV-W A CtGAPDH Ct(dim-less) 20 116 016 20 118 01 20 118 009HERV-W M CtGAPDH Ct(dim-less) 20 147 021 20 144 015 20 145 013TB HE1113 CtGAPDH Ct(dim-less) 20 127 01 20 128 006 20 129 006IL-8 pgmL 20 2805 8683 20 852 232 20 934 286HERV-WMSRV Gag Flix B cells (d-less) 13 118 011 19 119 01 18 115 006HERV-HF Gag Flix B cells (d-less) 12 114 01 17 108 007 20 112 011HERV-HF Env (H1) Flix B cells (d-less) 11 112 007 18 106 005 17 11 008HERV-HF Env (H3) Flix B cells (d-less) 19 156 024 20 147 015 20 152 016HERV-HF Env (W1) Flix B cells (d-less) 18 131 013 20 123 01 20 123 01HERV-HF Env (W3) Flix B cells (d-less) 17 125 015 20 122 009 20 124 017prop of B cells in sample () 19 914 38 20 859 306 20 905 379prop of monocytes in sample () 19 1533 92 20 1808 641 20 1609 623
HERV-WMSRV Gag Flix monocytes (d-less) 11 114 009 16 116 005 15 115 007MSRV F Gag Flix monocytes (d-less) 13 116 01 17 111 005 16 122 019Env (H1) Flix monocytes (d-less) 15 115 012 18 112 008 17 115 006Env (H3) Flix monocytes (d-less) 19 159 018 20 155 019 20 157 02Env (W1) Flix monocytes (d-less) 15 115 01 19 111 007 19 108 005Env (W3) Flix monocytes (d-less) 13 116 008 19 112 007 18 116 009HCRP ngmL 20 178383 21238 20 189945 176902 20 243527 224115CD163 ngmL 20 45667 15463 20 4239 10536 20 44257 12468EBV Copiesmicrolitre 16 21371 79687 16 238 6672 15 668 21274
Viral and biomarker data Before vs AfterHERV-WMSRV Gag Flix B cellsSignificant drop in means in ITT and PPNo significant change in gradient but steeper gradient before
HERV-WMSRV Gag Flix B cellsPP Individual subjects and fitted line
Significant overall drop notattributable to intervention
Similar story for
Env (W1) Flix monocytes
2 3 4 5 6 7 8monthly visits
Solid line fitted by modelA significant drop in means cannot be explained by intervention since decline is steeper before
17
MRI PP Persisting T1 Gd-enhancing lesionsBefore After Within-patient changea
Mean rate Mean rate Change in ratePP (n=16) 153 119 -034
80 of total reductionoccurs before theintervention
attributing the overallreduction to the interventioneven if reduction weresignificant would not be
-013 (P=0469)
P=0762-003 (P=0835)
credible
11
MRI T2 lesions
T2 lesion counts Observed at visits 5 (before) and 8 (after)
Before After Within-patient changea
Mean count Mean count Mean count changeP=0472
weighted ratiob
ITT 445PP 313
465 020P=0462331 019
105107
aChanges calculated after-before or afterbeforebWithin-patient ratios averaged on log scale before back transforming substituting 01 for zero counts Weighted meanratios pooled on log scale by weighting for lesion counts
12
Viral and biomarker data change vs T1 Gd lesion changePositive correlation
HERV-WMSRV Gag Flix B cells r=046 P=0057 ITT r=048 P=0086 PP
9
10
Additional analysis
A higher T1 Gd lesioncount at any visit isassociated with higher714
1619
28 27
20
1712
values of HERV-WMSRVGag Flix B cells at that visitP=0029 (ITT)
15
8 1
-3 -2 -1 0 1 2change in T1 lesion rate
Suggestion of decrease in HERV-WMSRV Gag Flix B cells associated with decrease in Gd-enhanced lesion rate PP r=-048 P=0086
23
Patients with a decrease in lesion count (eg patient 8) tend to have a decrease or a greater decrease in the biomarker than patients with an increase in lesion count (eg patient 20)
Viral and biomarker data summary
Some statistically significant changes in gradient before vs after wereobserved However whether these are consistent with an effect ofraltegravir depends partly on biological plausibility
A very small number of statistically significant correlations wereobserved between changes in these measures and changes in T1 Gdlesion counts their interpretation is again heavily dependent onbiological plausibility
Because of the number of measurestests any significant resultsshould be treated with caution Since results are singled out on thebasis of statistical significance rather than prior hypothesis Type Ierror is likely
25
Viral and biomarker data Before vs AfterHCRP ngmLSignificant increase in means in ITT and PPNo significant change in (positive) gradient similar slightly steeper gradient after
ITT------------------------------------------------------------------------------
| gradient SE z P-value [95 Conf Interval]-------------+----------------------------------------------------------------
before | 1221482 1495142 082 0414 -1708943 4151908after | 1406076 1495142 094 0347 -1524349 4336501
------------------------------------------------------------------------------
Significant overall increase not credibly attributable to intervention since the gradientbefore though non-significant is too similar to the gradient after intervention
18
Quality of life data summary
A number of measures showed statistically significant improvementsin well-being or a slowing of deterioration in the period aftercompared to before intervention
Although consistent with an effect of raltegravir this is most crediblyattributable to the placebo effect of patients receiving an unblindedintervention rather than to any action of the drug
The study design of not having a control group or a cross-over designmitigated against determining the possible effect of the interventionon Q0L
31
Viral and biomarker data Before vs AfterEnv (W3) Flix monocytesNon-significant decline before becomes borderline significant increase afterand significant change in gradient
Env (W3) Flix monocytesITT Individual subjects and fitted line
-002 P=0200
As before biologicalplausibility important bothfor change displayed andfor negative correlation
with Gd T1 lesions
+002 P=0055
P=0047
2 3 4 5 6 7 8monthly visits
Significant change in gradient in ITT (P=0047) and borderline in PP (P=0089)Change in means after - before negatively correlated withchange in rate of Gd enhancing T1 lesions r=-054 P=0015
21
Disability data
Summary of changes after-before
N mean sdEDSS 20 014 045 Neither change nor gradient change significant
MSFC 20 023 028 [Both change and change in gradient significant]9HPT peg speed 20 0003 0003 Highly significant improvementWalk speed (fs) 20 -004 047 Neither change nor gradient change significantPASAT score 20 466 521 Highly significant improvement
PASAT------------------------------------------------------------------------------
| gradient SE z P-value [95 Conf Interval]-------------+----------------------------------------------------------------
before | 2478954 4594816 540 0000 1578387 3379522after | 6377749 4534625 141 0160 -2509954 1526545
------------------------------------------------------------------------------
bull There is a significant gradient changebull But rate of improvement substantially greater before than after intervention
27
Quality of life data
Summary of changes after-before
change inITT n means
PQ - SF36 - Physical Functional Score (PF) 20 -092
PQ - SF36 - Role-Physical Scale (RP) 20 -948PQ - SF36 - Bodily Pain Scale (BP) 20 -542
PQ - SF36 - General Health Scale (GH) 20 -467
PQ - SF36 - Vitality Scale (VT) 20 506 PQ - SF36 - Social Functioning Scale (SF) 20 245 PQ - SF36 - Role Emotional Scale (RE) 20 -862 no statistically significant changes
PQ - SF36 - Mental Health Scale (MH) 20 572 PQ - PFA - Patient Fatigue Assessment 20 -151PQ - PPA - Patient Pain Assessment 19 407PQ - MSIS - Total Score 20 -210 no statistically significant changes
PQ - MSWS-12 - MSWS Total Score 20 -035
30
Quality of life dataSummary of changes after-before
change inITT n means
PQ - SF36 - Physical Functional Score (PF) 20 -092PQ - SF36 - Role-Physical Scale (RP) 20 -948PQ - SF36 - Bodily Pain Scale (BP) 20 -542PQ - SF36 - General Health Scale (GH) 20 -467PQ - SF36 - Vitality Scale (VT) 20 506
+ = improvement
PQ - SF36 - Social Functioning Scale (SF) 20 245PQ - SF36 - Role Emotional Scale (RE) 20 -862PQ - SF36 - Mental Health Scale (MH) 20 572PQ - PFA - Patient Fatigue Assessment 20 -151PQ - PPA - Patient Pain Assessment 19 407 - = improvementPQ - MSIS - Total Score 20 -210PQ - MSWS-12 - MSWS Total Score 20 -035
29
Disability data
Summary of changes after-before
N mean sdEDSS 20 014 045 Neither change nor gradient change significant
MSFC 20 023 028 [Both change and change in gradient significant]9HPT peg speed 20 0003 0003 Highly significant improvementWalk speed (fs) 20 -004 047 Neither change nor gradient change significantPASAT score 20 466 521
9HPT peg speed------------------------------------------------------------------------------
ITT | gradient SE z P-value [95 Conf Interval]-------------+----------------------------------------------------------------
before | 0009916 0002372 418 0000 0005267 0014565after | 000545 0002363 231 0021 0000818 0010082
------------------------------------------------------------------------------
bull No significant gradient changebull But rate of improvement substantially greater before than after intervention
26
Acknowledgementsbull Unit for Healthcare Epidemiology Oxford
ndash Raph Goldacrendash Michael Goldacrendash David Yeates
bull QMULbull Gavin Giovannoni
bull The Albion Centrebull Hubert Maruszak
bull UCLbull Robin Weiss
Laboratory safety tests
32
Laboratory safety tests significant changes
ITT change gradient gradient change inbefore after gradient
ADJUSTED CALCIUM SERUM +002 -000003 +0008 P=0406 increase could bep=0025 pgt09 p=0149 due intervention
CHLORIDE SERUM -075 +014 -031 p=0194 decrease could bep=0055 p=0503 p=0103 due to intervention
CHOLESTEROL SERUM +028 +008 +003 p=0437 increase notp=0004 p=0059 p=0521 plausibly duehellip
GLUCOSE PLASMA -018 +008 -015 p=0072 gradient changep=0196 p=0284 p=0037 could be duehellip
LDL CHOLESTEROL SERUM +017 +006 +0004 p=0432 increase notp=0018 p=0162 pgt09 plausibly duehellip
PLATELET COUNT +686 -027 +259 p=0352 increase could bep=0040 p=0880 p=0129 duehellip
WHITE BLOOD COUNT PP +022 +006 +010 p=0827 increase notp=0049 p=0579 p=0331 plausibly due
33
- Diapositive numeacutero 1
- Diapositive numeacutero 2
- Dr Jean-Martin Charcot
- Diapositive numeacutero 4
- Diapositive numeacutero 5
- Diapositive numeacutero 6
- Viruses and MS
- Are human endogenous retroviruses pathogenic An approach to testing the hypothesis
- How HERVs may induce autoimmune response
- Diapositive numeacutero 10
- Diapositive numeacutero 11
- Diapositive numeacutero 12
- Diapositive numeacutero 13
- How many cases of HIV and MS have been reported
- What do cohort studies show
- What is the Risk of Developing Multiple Sclerosis if you have HIV and are on HIV Anti-retroviral therapy
- Methods
- Diapositive numeacutero 18
- Diapositive numeacutero 19
- NHS Data on UK Healthcare events 1999-2011
- NHS Cohort gt One year after Exposure (HIV) Contact
- Diapositive numeacutero 22
- The CHARCOT PROJECTINSPIRE Isentress (Raltegravir)Pilot Study in Relapsing MS
- INSPIRE Design
- INSPIRE Design 2
- Diapositive numeacutero 26
- Diapositive numeacutero 27
- Diapositive numeacutero 28
- Diapositive numeacutero 29
- Diapositive numeacutero 30
- Diapositive numeacutero 31
- Diapositive numeacutero 32
- Diapositive numeacutero 34
- Diapositive numeacutero 35
- Diapositive numeacutero 36
- Diapositive numeacutero 37
- Diapositive numeacutero 38
- Diapositive numeacutero 39
- Diapositive numeacutero 40
- Diapositive numeacutero 41
- Diapositive numeacutero 42
- Diapositive numeacutero 43
- Diapositive numeacutero 44
- Diapositive numeacutero 45
- Diapositive numeacutero 47
- Diapositive numeacutero 48
- Diapositive numeacutero 49
- Diapositive numeacutero 50
- Acknowledgements
- Diapositive numeacutero 52
- Diapositive numeacutero 53
- Diapositive numeacutero 54
-
| HIV b4 autos | |||||||||||||||||||
| exposure | outcome | obs in ref cohort | obs | exp | rate ratio | low CI | upr CI | chi-sq | p-value | ||||||||||
| HIV | Addisons disease | 1107 | 13 | 15 | 881 | 468 | 1513 | 814 | 0 | ||||||||||
| HIV | Ankylosing spondylitis | 1686 | 0 | 22 | 0 | 0 | 164 | 136 | 02435 | ||||||||||
| HIV | Autoimmune haemolytic anaemia | 911 | 3 | 05 | 638 | 131 | 187 | 873 | 00031 | ||||||||||
| HIV | Chronic active hepatitis | 435 | 3 | 03 | 915 | 188 | 2693 | 143 | 00002 | ||||||||||
| HIV | Coeliac disease | 4991 | 3 | 76 | 04 | 008 | 116 | 218 | 01395 | ||||||||||
| HIV | Crohns disease | 6362 | 4 | 119 | 034 | 009 | 086 | 457 | 00325 | ||||||||||
| HIV | ITP | 2504 | 11 | 27 | 411 | 205 | 737 | 2278 | 0 | ||||||||||
| HIV | Myxoedema | 142597 | 33 | 977 | 034 | 023 | 047 | 4221 | 0 | ||||||||||
| HIV | Pernicious anaemia | 11732 | 2 | 49 | 04 | 005 | 146 | 121 | 02717 | ||||||||||
| HIV | Polymyositis | 395 | 3 | 05 | 622 | 128 | 183 | 837 | 00038 | ||||||||||
| HIV | Primary biliary cirrhosis | 1605 | 1 | 12 | 086 | 002 | 482 | 01 | 07507 | ||||||||||
| HIV | Psoriasis | 9262 | 7 | 129 | 054 | 022 | 111 | 229 | 01305 | ||||||||||
| HIV | Rheumatoid arthritis | 37706 | 11 | 28 | 039 | 02 | 07 | 969 | 00018 | ||||||||||
| HIV | Scleroderma | 1581 | 1 | 15 | 066 | 002 | 369 | 0 | 09916 | ||||||||||
| HIV | Sjogrens syndrome | 3640 | 0 | 31 | 0 | 0 | 12 | 215 | 01424 | ||||||||||
| HIV | Systematic lupus erythematosus | 3109 | 9 | 73 | 123 | 056 | 233 | 019 | 06667 | ||||||||||
| HIV | Thyrotoxicosis | 20268 | 16 | 193 | 083 | 047 | 135 | 04 | 05258 | ||||||||||
| HIV | Ulcerative colitis | 9235 | 5 | 155 | 032 | 01 | 075 | 65 | 00108 |
| HIV b4 autos | |||||||||||||||||||
| exposure | outcome | obs in ref cohort | obs | exp | rate ratio | low CI | upr CI | chi-sq | p-value | ||||||||||
| HIV | Addisons disease | 761 | 22 | 2 | 1108 | 69 | 169 | 18634 | 0 | ||||||||||
| HIV | Ankylosing spondylitis | 2883 | 3 | 97 | 031 | 006 | 091 | 395 | 0047 | ||||||||||
| HIV | Autoimmune haemolytic anaemia | 777 | 9 | 15 | 619 | 282 | 118 | 3371 | 0 | ||||||||||
| HIV | Chronic active hepatitis | 190 | 7 | 07 | 1106 | 439 | 2324 | 5245 | 0 | ||||||||||
| HIV | Coeliac disease | 3136 | 4 | 81 | 05 | 013 | 127 | 158 | 02085 | ||||||||||
| HIV | Crohns disease | 5938 | 27 | 231 | 117 | 077 | 171 | 051 | 04754 | ||||||||||
| HIV | ITP | 2190 | 32 | 52 | 628 | 428 | 889 | 13471 | 0 | ||||||||||
| HIV | Myxoedema | 38856 | 52 | 60 | 087 | 065 | 114 | 095 | 0331 | ||||||||||
| HIV | Pernicious anaemia | 5428 | 2 | 38 | 052 | 006 | 189 | 046 | 04974 | ||||||||||
| HIV | Polymyositis | 236 | 7 | 1 | 732 | 291 | 1531 | 3116 | 0 | ||||||||||
| HIV | Primary biliary cirrhosis | 312 | 1 | 09 | 115 | 003 | 648 | 016 | 06935 | ||||||||||
| HIV | Psoriasis | 9428 | 58 | 344 | 169 | 128 | 219 | 1556 | 00001 | ||||||||||
| HIV | Rheumatoid arthritis | 16087 | 28 | 31 | 09 | 06 | 131 | 02 | 06538 | ||||||||||
| HIV | Scleroderma | 349 | 0 | 1 | 0 | 0 | 366 | 026 | 06107 | ||||||||||
| HIV | Sjogrens syndrome | 461 | 2 | 12 | 17 | 02 | 617 | 009 | 07682 | ||||||||||
| HIV | Systematic lupus erythematosus | 559 | 1 | 25 | 04 | 001 | 226 | 038 | 05355 | ||||||||||
| HIV | Thyrotoxicosis | 5601 | 16 | 141 | 114 | 065 | 185 | 014 | 07078 | ||||||||||
| HIV | Ulcerative colitis | 10536 | 57 | 408 | 14 | 106 | 181 | 605 | 00139 |
| HIV b4 autos | |||||||||||||||||||
| exposure | outcome | obs in ref cohort | obs | exp | rate ratio | low CI | upr CI | chi-sq | p-value | ||||||||||
| HIV | Addisons disease | 1516 | 18 | 26 | 69 | 408 | 1094 | 8394 | 0 | ||||||||||
| HIV | Ankylosing spondylitis | 3802 | 2 | 108 | 019 | 002 | 067 | 638 | 00116 | ||||||||||
| HIV | Autoimmune haemolytic anaemia | 1382 | 5 | 15 | 325 | 105 | 761 | 568 | 00171 | ||||||||||
| HIV | Chronic active hepatitis | 507 | 4 | 08 | 517 | 14 | 1332 | 953 | 0002 | ||||||||||
| HIV | Coeliac disease | 6921 | 7 | 14 | 05 | 02 | 103 | 302 | 00822 | ||||||||||
| HIV | Crohns disease | 10404 | 16 | 299 | 053 | 031 | 087 | 603 | 00141 | ||||||||||
| HIV | ITP | 3966 | 21 | 57 | 368 | 227 | 563 | 3813 | 0 | ||||||||||
| HIV | Myxoedema | 153406 | 72 | 1414 | 051 | 04 | 064 | 3362 | 0 | ||||||||||
| HIV | Pernicious anaemia | 14387 | 3 | 78 | 038 | 008 | 112 | 24 | 01217 | ||||||||||
| HIV | Polymyositis | 518 | 9 | 13 | 682 | 31 | 1305 | 3841 | 0 | ||||||||||
| HIV | Primary biliary cirrhosis | 1609 | 1 | 19 | 053 | 001 | 298 | 007 | 0787 | ||||||||||
| HIV | Psoriasis | 15618 | 43 | 412 | 104 | 075 | 141 | 004 | 08421 | ||||||||||
| HIV | Rheumatoid arthritis | 44692 | 28 | 521 | 054 | 036 | 078 | 1067 | 00011 | ||||||||||
| HIV | Scleroderma | 1636 | 1 | 22 | 046 | 001 | 254 | 022 | 06394 | ||||||||||
| HIV | Sjogrens syndrome | 3536 | 0 | 38 | 0 | 0 | 097 | 286 | 0091 | ||||||||||
| HIV | Systematic lupus erythematosus | 3060 | 9 | 86 | 105 | 048 | 199 | 0 | 09745 | ||||||||||
| HIV | Thyrotoxicosis | 21626 | 27 | 291 | 093 | 061 | 135 | 009 | 07631 | ||||||||||
| HIV | Ulcerative colitis | 16648 | 45 | 489 | 092 | 067 | 123 | 024 | 06256 |
| HIV b4 autos | |||||||||||||||||||
| exposure | outcome | obs in ref cohort | obs | exp | rate ratio | low CI | upr CI | chi-sq | p-value | ||||||||||
| HIV | Addisons disease | 686 | 3 | 11 | 271 | 056 | 796 | 175 | 01859 | ||||||||||
| HIV | Ankylosing spondylitis | 1807 | 0 | 52 | 0 | 0 | 071 | 421 | 00401 | ||||||||||
| HIV | Autoimmune haemolytic anaemia | 586 | 1 | 06 | 169 | 004 | 943 | 001 | 09035 | ||||||||||
| HIV | Chronic active hepatitis | 167 | 1 | 02 | 466 | 012 | 2633 | 038 | 05397 | ||||||||||
| HIV | Coeliac disease | 3282 | 1 | 61 | 016 | 0 | 091 | 346 | 00628 | ||||||||||
| HIV | Crohns disease | 4709 | 3 | 132 | 023 | 005 | 066 | 717 | 00074 | ||||||||||
| HIV | ITP | 1824 | 6 | 25 | 236 | 087 | 515 | 344 | 00636 | ||||||||||
| HIV | Myxoedema | 75495 | 29 | 716 | 04 | 027 | 058 | 2479 | 0 | ||||||||||
| HIV | Pernicious anaemia | 6772 | 0 | 42 | 0 | 0 | 089 | 322 | 00729 | ||||||||||
| HIV | Polymyositis | 216 | 1 | 05 | 188 | 005 | 1057 | 0 | 09632 | ||||||||||
| HIV | Primary biliary cirrhosis | 690 | 1 | 07 | 142 | 004 | 794 | 006 | 08079 | ||||||||||
| HIV | Psoriasis | 7528 | 16 | 196 | 082 | 047 | 133 | 048 | 0489 | ||||||||||
| HIV | Rheumatoid arthritis | 20701 | 11 | 254 | 043 | 022 | 077 | 763 | 00058 | ||||||||||
| HIV | Scleroderma | 725 | 0 | 1 | 0 | 0 | 362 | 026 | 0607 | ||||||||||
| HIV | Sjogrens syndrome | 1700 | 0 | 17 | 0 | 0 | 218 | 084 | 03586 | ||||||||||
| HIV | Systematic lupus erythematosus | 1357 | 3 | 36 | 083 | 017 | 243 | 0 | 09495 | ||||||||||
| HIV | Thyrotoxicosis | 10097 | 13 | 136 | 095 | 051 | 163 | 0 | 09755 | ||||||||||
| HIV | Ulcerative colitis | 7325 | 15 | 207 | 072 | 04 | 119 | 131 | 02521 |
| HIV b4 autos | |||||||||||||||||||
| exposure | outcome | obs in ref cohort | obs | exp | rate ratio | low CI | upr CI | chi-sq | p-value | ||||||||||
| HIV | Addisons disease | 830 | 15 | 15 | 998 | 556 | 1655 | 11032 | 0 | ||||||||||
| HIV | Ankylosing spondylitis | 1995 | 2 | 56 | 035 | 004 | 128 | 174 | 01866 | ||||||||||
| HIV | Autoimmune haemolytic anaemia | 796 | 4 | 09 | 423 | 115 | 1088 | 687 | 00088 | ||||||||||
| HIV | Chronic active hepatitis | 340 | 3 | 06 | 537 | 11 | 1582 | 668 | 00098 | ||||||||||
| HIV | Coeliac disease | 3639 | 6 | 79 | 076 | 028 | 165 | 025 | 0616 | ||||||||||
| HIV | Crohns disease | 5695 | 13 | 167 | 078 | 041 | 133 | 061 | 04355 | ||||||||||
| HIV | ITP | 2142 | 15 | 32 | 473 | 265 | 783 | 4024 | 0 | ||||||||||
| HIV | Myxoedema | 77911 | 43 | 698 | 062 | 045 | 083 | 992 | 00016 | ||||||||||
| HIV | Pernicious anaemia | 7615 | 3 | 37 | 082 | 017 | 239 | 001 | 09271 | ||||||||||
| HIV | Polymyositis | 302 | 8 | 08 | 1018 | 435 | 2031 | 5584 | 0 | ||||||||||
| HIV | Primary biliary cirrhosis | 919 | 0 | 12 | 0 | 0 | 317 | 038 | 05375 | ||||||||||
| HIV | Psoriasis | 8090 | 27 | 217 | 125 | 082 | 182 | 108 | 02985 | ||||||||||
| HIV | Rheumatoid arthritis | 23991 | 17 | 266 | 064 | 037 | 102 | 314 | 00763 | ||||||||||
| HIV | Scleroderma | 911 | 1 | 12 | 085 | 002 | 475 | 009 | 07639 | ||||||||||
| HIV | Sjogrens syndrome | 1836 | 0 | 21 | 0 | 0 | 176 | 121 | 02704 | ||||||||||
| HIV | Systematic lupus erythematosus | 1703 | 6 | 5 | 121 | 044 | 263 | 006 | 0813 | ||||||||||
| HIV | Thyrotoxicosis | 11529 | 14 | 155 | 09 | 049 | 151 | 007 | 0797 | ||||||||||
| HIV | Ulcerative colitis | 9323 | 30 | 282 | 106 | 072 | 152 | 006 | 08069 |

5+
1+
males
females
The CHARCOT PROJECTINSPIRE
Isentress (Raltegravir)Pilot Study in Relapsing MS
bull Aims to investigate the concept of HERV+-EBV or herpes viruses as an etiology or trigger for MS
bull Disease controlling rather than disease modifying therapy
INSPIRE Design
bull Pilot study enrolling patients with active RRMS as defined by +ve Gd-enhanced MRI or documented relapse in previous 12 months
bull Baseline (3 months) followed by treatment (3 months)
bull Open label treatment phase with Raltegravir 400mg twice a day
INSPIRE Design 2bull 1deg Outcome number and rate of development
of Gd-enhanced lesionsbull 2deg outcomes are disability and quality-of-lifeStatistical considerations19 subjects need to complete trial to achieve 95 significance with 80 power for a 40 reduction in MS lesions compared with baseline (according to Sormani et al)
Trial design
change in gradient
change(in means)
V1 V2(screening before
visit)
V3 V4 V5 V6 V7 V8after
Raltegravirdispensed
A statistically significantchange in means is not inthis situation consistent
with a reduction inoutcome values due tointervention
3
Trial design
QOL QOL QOL QOL QOL QOL QOL
MSFC MSFC MSFC MSFC MSFC MSFC MSFCEDSS EDSS EDSS EDSS EDSS
blood blood blood blood blood blood blood blood
MRI MRI MRI MRI MRI MRI MRI
V1 V2 V3 V4 V5 V6 V7 V8(screening before after
visit)
bull Exploratory studybull Danger of Type II error of missing a real association arguably greater than
danger of Type I error of highlighting a spurious association
4
DATA
bull Patient socio-demographic and baseline
bull MRI
bull Viral and biomarkers
bull Disability
bull Quality of life
bull Laboratory safety tests
2
Patient socio-demographic and baseline
N mean min maxITTAge at baselineyrs 20 4073 3115 5299Height cm 18 16904 15600 18300Weight kg 18 7873 5190 10970Baseline EDSS 20 240 000 400Number of relapses in past year 20 150 100 300
PPAge at baselineyrs 16 4162 3115 5299Height cm 14 16891 15600 18000Weight kg 14 7790 5190 10830Baseline EDSS 16 225 000 350Number of relapses in past year 16 144 100 300
6
Patient adherenceITT PP
Visit mean
6 Number of tablets dispensed 60 60Number of tablets returned 235 269Adherence percentagea 9608 9552
7 Number of tablets dispensed 63 6375Number of tablets returned 72 675Adherence percentagea 88 8875
8 Number of tablets dispensed 597 5963Number of tablets returned 81 863Adherence percentagea 824 805
Over all three visits Number of tablets dispensed 609 6113Number of tablets returned 588 602Adherence percentagea 8883 8826
a100(tablets dispensed - tablets returned)tablets dispensed
7
MRI Total T1 Gd-enhancing lesionsTotal T1 (Gad enhanced) lesion rates
Before (visits 34 and 5) After (visits 67 and 8) Within-patient changea
Mean monthly Mean monthly Change Weightedrate rate in rate rate ratiob
ITT (n=20) 289 302 012 103PP (n=16) 251 233 -018 092
aChanges calculated after-before or afterbeforebRatios averaged on log scale before back-transforming substituting 01 for zero rates Weighted ratios pooled byweighting for total subject counts
Poisson regression analysis after vs before
ITT rate ratio after vs before as 104(95 CI 85 129) P=0681PP rate ratio after vs before as093(95 CI 072 120) P=0577
Poisson regression analysis gradient after vs gradient beforeITT test of difference in gradients P=0659PP test of difference in gradients P=0463
8
MRI New T1 Gd-enhancing lesionsNew T1 (Gad enhanced) lesion rates
Before (visits 34 and 5) After (visits 67 and 8) Within-patient changea
Mean monthly Mean monthly Changerate rate in rate
ITT (n=20) 143 167 023PP (n=16) 098 115 017
aChanges calculated after-before or afterbefore
Poisson regression analysis after vs beforeITT rate ratio after vs before as 116(95 CI 087 155) P=0314PP rate ratio after vs before as 116 (95 CI079 172) P=0456
Poisson regression analysis gradient after vs gradient beforeITT test of difference in gradients P=0562PP test of difference in gradients P=0137
9
MRI T1 Gd lesions
ITT Patients in order of difference in rate
010008010019010015010001010016010009010028010027010003010005010007010010010011010013010014010017010023
010012010020010024
-4 -2 0 2difference in rate lesions per month
Difference after - before
4
13
MRI lesions summary
Lesion outcomes provide no statistical evidence consistent with aneffect of raltegravir
14
Viral and biomarker data Before vs AfterBaselines (visit 2) Before (345) After (678)
Variable N mean sd N mean sd mean sd
MSRV A CtGAPDH Ct(dim-less) 20 094 01 20 093 007 20 092 007MSRV M CtGAPDH Ct(dim-less) 20 133 006 20 133 006 20 132 007TB HE23 CtGAPDH Ct(dim-less) 20 127 014 20 124 013 20 124 013HERV-W A CtGAPDH Ct(dim-less) 20 116 016 20 118 01 20 118 009HERV-W M CtGAPDH Ct(dim-less) 20 147 021 20 144 015 20 145 013TB HE1113 CtGAPDH Ct(dim-less) 20 127 01 20 128 006 20 129 006IL-8 pgmL 20 2805 8683 20 852 232 20 934 286HERV-WMSRV Gag Flix B cells (d-less) 13 118 011 19 119 01 18 115 006HERV-HF Gag Flix B cells (d-less) 12 114 01 17 108 007 20 112 011HERV-HF Env (H1) Flix B cells (d-less) 11 112 007 18 106 005 17 11 008HERV-HF Env (H3) Flix B cells (d-less) 19 156 024 20 147 015 20 152 016HERV-HF Env (W1) Flix B cells (d-less) 18 131 013 20 123 01 20 123 01HERV-HF Env (W3) Flix B cells (d-less) 17 125 015 20 122 009 20 124 017prop of B cells in sample () 19 914 38 20 859 306 20 905 379prop of monocytes in sample () 19 1533 92 20 1808 641 20 1609 623
HERV-WMSRV Gag Flix monocytes (d-less) 11 114 009 16 116 005 15 115 007MSRV F Gag Flix monocytes (d-less) 13 116 01 17 111 005 16 122 019Env (H1) Flix monocytes (d-less) 15 115 012 18 112 008 17 115 006Env (H3) Flix monocytes (d-less) 19 159 018 20 155 019 20 157 02Env (W1) Flix monocytes (d-less) 15 115 01 19 111 007 19 108 005Env (W3) Flix monocytes (d-less) 13 116 008 19 112 007 18 116 009HCRP ngmL 20 178383 21238 20 189945 176902 20 243527 224115CD163 ngmL 20 45667 15463 20 4239 10536 20 44257 12468EBV Copiesmicrolitre 16 21371 79687 16 238 6672 15 668 21274
Viral and biomarker data Before vs AfterHERV-WMSRV Gag Flix B cellsSignificant drop in means in ITT and PPNo significant change in gradient but steeper gradient before
HERV-WMSRV Gag Flix B cellsPP Individual subjects and fitted line
Significant overall drop notattributable to intervention
Similar story for
Env (W1) Flix monocytes
2 3 4 5 6 7 8monthly visits
Solid line fitted by modelA significant drop in means cannot be explained by intervention since decline is steeper before
17
MRI PP Persisting T1 Gd-enhancing lesionsBefore After Within-patient changea
Mean rate Mean rate Change in ratePP (n=16) 153 119 -034
80 of total reductionoccurs before theintervention
attributing the overallreduction to the interventioneven if reduction weresignificant would not be
-013 (P=0469)
P=0762-003 (P=0835)
credible
11
MRI T2 lesions
T2 lesion counts Observed at visits 5 (before) and 8 (after)
Before After Within-patient changea
Mean count Mean count Mean count changeP=0472
weighted ratiob
ITT 445PP 313
465 020P=0462331 019
105107
aChanges calculated after-before or afterbeforebWithin-patient ratios averaged on log scale before back transforming substituting 01 for zero counts Weighted meanratios pooled on log scale by weighting for lesion counts
12
Viral and biomarker data change vs T1 Gd lesion changePositive correlation
HERV-WMSRV Gag Flix B cells r=046 P=0057 ITT r=048 P=0086 PP
9
10
Additional analysis
A higher T1 Gd lesioncount at any visit isassociated with higher714
1619
28 27
20
1712
values of HERV-WMSRVGag Flix B cells at that visitP=0029 (ITT)
15
8 1
-3 -2 -1 0 1 2change in T1 lesion rate
Suggestion of decrease in HERV-WMSRV Gag Flix B cells associated with decrease in Gd-enhanced lesion rate PP r=-048 P=0086
23
Patients with a decrease in lesion count (eg patient 8) tend to have a decrease or a greater decrease in the biomarker than patients with an increase in lesion count (eg patient 20)
Viral and biomarker data summary
Some statistically significant changes in gradient before vs after wereobserved However whether these are consistent with an effect ofraltegravir depends partly on biological plausibility
A very small number of statistically significant correlations wereobserved between changes in these measures and changes in T1 Gdlesion counts their interpretation is again heavily dependent onbiological plausibility
Because of the number of measurestests any significant resultsshould be treated with caution Since results are singled out on thebasis of statistical significance rather than prior hypothesis Type Ierror is likely
25
Viral and biomarker data Before vs AfterHCRP ngmLSignificant increase in means in ITT and PPNo significant change in (positive) gradient similar slightly steeper gradient after
ITT------------------------------------------------------------------------------
| gradient SE z P-value [95 Conf Interval]-------------+----------------------------------------------------------------
before | 1221482 1495142 082 0414 -1708943 4151908after | 1406076 1495142 094 0347 -1524349 4336501
------------------------------------------------------------------------------
Significant overall increase not credibly attributable to intervention since the gradientbefore though non-significant is too similar to the gradient after intervention
18
Quality of life data summary
A number of measures showed statistically significant improvementsin well-being or a slowing of deterioration in the period aftercompared to before intervention
Although consistent with an effect of raltegravir this is most crediblyattributable to the placebo effect of patients receiving an unblindedintervention rather than to any action of the drug
The study design of not having a control group or a cross-over designmitigated against determining the possible effect of the interventionon Q0L
31
Viral and biomarker data Before vs AfterEnv (W3) Flix monocytesNon-significant decline before becomes borderline significant increase afterand significant change in gradient
Env (W3) Flix monocytesITT Individual subjects and fitted line
-002 P=0200
As before biologicalplausibility important bothfor change displayed andfor negative correlation
with Gd T1 lesions
+002 P=0055
P=0047
2 3 4 5 6 7 8monthly visits
Significant change in gradient in ITT (P=0047) and borderline in PP (P=0089)Change in means after - before negatively correlated withchange in rate of Gd enhancing T1 lesions r=-054 P=0015
21
Disability data
Summary of changes after-before
N mean sdEDSS 20 014 045 Neither change nor gradient change significant
MSFC 20 023 028 [Both change and change in gradient significant]9HPT peg speed 20 0003 0003 Highly significant improvementWalk speed (fs) 20 -004 047 Neither change nor gradient change significantPASAT score 20 466 521 Highly significant improvement
PASAT------------------------------------------------------------------------------
| gradient SE z P-value [95 Conf Interval]-------------+----------------------------------------------------------------
before | 2478954 4594816 540 0000 1578387 3379522after | 6377749 4534625 141 0160 -2509954 1526545
------------------------------------------------------------------------------
bull There is a significant gradient changebull But rate of improvement substantially greater before than after intervention
27
Quality of life data
Summary of changes after-before
change inITT n means
PQ - SF36 - Physical Functional Score (PF) 20 -092
PQ - SF36 - Role-Physical Scale (RP) 20 -948PQ - SF36 - Bodily Pain Scale (BP) 20 -542
PQ - SF36 - General Health Scale (GH) 20 -467
PQ - SF36 - Vitality Scale (VT) 20 506 PQ - SF36 - Social Functioning Scale (SF) 20 245 PQ - SF36 - Role Emotional Scale (RE) 20 -862 no statistically significant changes
PQ - SF36 - Mental Health Scale (MH) 20 572 PQ - PFA - Patient Fatigue Assessment 20 -151PQ - PPA - Patient Pain Assessment 19 407PQ - MSIS - Total Score 20 -210 no statistically significant changes
PQ - MSWS-12 - MSWS Total Score 20 -035
30
Quality of life dataSummary of changes after-before
change inITT n means
PQ - SF36 - Physical Functional Score (PF) 20 -092PQ - SF36 - Role-Physical Scale (RP) 20 -948PQ - SF36 - Bodily Pain Scale (BP) 20 -542PQ - SF36 - General Health Scale (GH) 20 -467PQ - SF36 - Vitality Scale (VT) 20 506
+ = improvement
PQ - SF36 - Social Functioning Scale (SF) 20 245PQ - SF36 - Role Emotional Scale (RE) 20 -862PQ - SF36 - Mental Health Scale (MH) 20 572PQ - PFA - Patient Fatigue Assessment 20 -151PQ - PPA - Patient Pain Assessment 19 407 - = improvementPQ - MSIS - Total Score 20 -210PQ - MSWS-12 - MSWS Total Score 20 -035
29
Disability data
Summary of changes after-before
N mean sdEDSS 20 014 045 Neither change nor gradient change significant
MSFC 20 023 028 [Both change and change in gradient significant]9HPT peg speed 20 0003 0003 Highly significant improvementWalk speed (fs) 20 -004 047 Neither change nor gradient change significantPASAT score 20 466 521
9HPT peg speed------------------------------------------------------------------------------
ITT | gradient SE z P-value [95 Conf Interval]-------------+----------------------------------------------------------------
before | 0009916 0002372 418 0000 0005267 0014565after | 000545 0002363 231 0021 0000818 0010082
------------------------------------------------------------------------------
bull No significant gradient changebull But rate of improvement substantially greater before than after intervention
26
Acknowledgementsbull Unit for Healthcare Epidemiology Oxford
ndash Raph Goldacrendash Michael Goldacrendash David Yeates
bull QMULbull Gavin Giovannoni
bull The Albion Centrebull Hubert Maruszak
bull UCLbull Robin Weiss
Laboratory safety tests
32
Laboratory safety tests significant changes
ITT change gradient gradient change inbefore after gradient
ADJUSTED CALCIUM SERUM +002 -000003 +0008 P=0406 increase could bep=0025 pgt09 p=0149 due intervention
CHLORIDE SERUM -075 +014 -031 p=0194 decrease could bep=0055 p=0503 p=0103 due to intervention
CHOLESTEROL SERUM +028 +008 +003 p=0437 increase notp=0004 p=0059 p=0521 plausibly duehellip
GLUCOSE PLASMA -018 +008 -015 p=0072 gradient changep=0196 p=0284 p=0037 could be duehellip
LDL CHOLESTEROL SERUM +017 +006 +0004 p=0432 increase notp=0018 p=0162 pgt09 plausibly duehellip
PLATELET COUNT +686 -027 +259 p=0352 increase could bep=0040 p=0880 p=0129 duehellip
WHITE BLOOD COUNT PP +022 +006 +010 p=0827 increase notp=0049 p=0579 p=0331 plausibly due
33
- Diapositive numeacutero 1
- Diapositive numeacutero 2
- Dr Jean-Martin Charcot
- Diapositive numeacutero 4
- Diapositive numeacutero 5
- Diapositive numeacutero 6
- Viruses and MS
- Are human endogenous retroviruses pathogenic An approach to testing the hypothesis
- How HERVs may induce autoimmune response
- Diapositive numeacutero 10
- Diapositive numeacutero 11
- Diapositive numeacutero 12
- Diapositive numeacutero 13
- How many cases of HIV and MS have been reported
- What do cohort studies show
- What is the Risk of Developing Multiple Sclerosis if you have HIV and are on HIV Anti-retroviral therapy
- Methods
- Diapositive numeacutero 18
- Diapositive numeacutero 19
- NHS Data on UK Healthcare events 1999-2011
- NHS Cohort gt One year after Exposure (HIV) Contact
- Diapositive numeacutero 22
- The CHARCOT PROJECTINSPIRE Isentress (Raltegravir)Pilot Study in Relapsing MS
- INSPIRE Design
- INSPIRE Design 2
- Diapositive numeacutero 26
- Diapositive numeacutero 27
- Diapositive numeacutero 28
- Diapositive numeacutero 29
- Diapositive numeacutero 30
- Diapositive numeacutero 31
- Diapositive numeacutero 32
- Diapositive numeacutero 34
- Diapositive numeacutero 35
- Diapositive numeacutero 36
- Diapositive numeacutero 37
- Diapositive numeacutero 38
- Diapositive numeacutero 39
- Diapositive numeacutero 40
- Diapositive numeacutero 41
- Diapositive numeacutero 42
- Diapositive numeacutero 43
- Diapositive numeacutero 44
- Diapositive numeacutero 45
- Diapositive numeacutero 47
- Diapositive numeacutero 48
- Diapositive numeacutero 49
- Diapositive numeacutero 50
- Acknowledgements
- Diapositive numeacutero 52
- Diapositive numeacutero 53
- Diapositive numeacutero 54
-
| HIV b4 autos | |||||||||||||||||||
| exposure | outcome | obs in ref cohort | obs | exp | rate ratio | low CI | upr CI | chi-sq | p-value | ||||||||||
| HIV | Addisons disease | 1107 | 13 | 15 | 881 | 468 | 1513 | 814 | 0 | ||||||||||
| HIV | Ankylosing spondylitis | 1686 | 0 | 22 | 0 | 0 | 164 | 136 | 02435 | ||||||||||
| HIV | Autoimmune haemolytic anaemia | 911 | 3 | 05 | 638 | 131 | 187 | 873 | 00031 | ||||||||||
| HIV | Chronic active hepatitis | 435 | 3 | 03 | 915 | 188 | 2693 | 143 | 00002 | ||||||||||
| HIV | Coeliac disease | 4991 | 3 | 76 | 04 | 008 | 116 | 218 | 01395 | ||||||||||
| HIV | Crohns disease | 6362 | 4 | 119 | 034 | 009 | 086 | 457 | 00325 | ||||||||||
| HIV | ITP | 2504 | 11 | 27 | 411 | 205 | 737 | 2278 | 0 | ||||||||||
| HIV | Myxoedema | 142597 | 33 | 977 | 034 | 023 | 047 | 4221 | 0 | ||||||||||
| HIV | Pernicious anaemia | 11732 | 2 | 49 | 04 | 005 | 146 | 121 | 02717 | ||||||||||
| HIV | Polymyositis | 395 | 3 | 05 | 622 | 128 | 183 | 837 | 00038 | ||||||||||
| HIV | Primary biliary cirrhosis | 1605 | 1 | 12 | 086 | 002 | 482 | 01 | 07507 | ||||||||||
| HIV | Psoriasis | 9262 | 7 | 129 | 054 | 022 | 111 | 229 | 01305 | ||||||||||
| HIV | Rheumatoid arthritis | 37706 | 11 | 28 | 039 | 02 | 07 | 969 | 00018 | ||||||||||
| HIV | Scleroderma | 1581 | 1 | 15 | 066 | 002 | 369 | 0 | 09916 | ||||||||||
| HIV | Sjogrens syndrome | 3640 | 0 | 31 | 0 | 0 | 12 | 215 | 01424 | ||||||||||
| HIV | Systematic lupus erythematosus | 3109 | 9 | 73 | 123 | 056 | 233 | 019 | 06667 | ||||||||||
| HIV | Thyrotoxicosis | 20268 | 16 | 193 | 083 | 047 | 135 | 04 | 05258 | ||||||||||
| HIV | Ulcerative colitis | 9235 | 5 | 155 | 032 | 01 | 075 | 65 | 00108 |
| HIV b4 autos | |||||||||||||||||||
| exposure | outcome | obs in ref cohort | obs | exp | rate ratio | low CI | upr CI | chi-sq | p-value | ||||||||||
| HIV | Addisons disease | 761 | 22 | 2 | 1108 | 69 | 169 | 18634 | 0 | ||||||||||
| HIV | Ankylosing spondylitis | 2883 | 3 | 97 | 031 | 006 | 091 | 395 | 0047 | ||||||||||
| HIV | Autoimmune haemolytic anaemia | 777 | 9 | 15 | 619 | 282 | 118 | 3371 | 0 | ||||||||||
| HIV | Chronic active hepatitis | 190 | 7 | 07 | 1106 | 439 | 2324 | 5245 | 0 | ||||||||||
| HIV | Coeliac disease | 3136 | 4 | 81 | 05 | 013 | 127 | 158 | 02085 | ||||||||||
| HIV | Crohns disease | 5938 | 27 | 231 | 117 | 077 | 171 | 051 | 04754 | ||||||||||
| HIV | ITP | 2190 | 32 | 52 | 628 | 428 | 889 | 13471 | 0 | ||||||||||
| HIV | Myxoedema | 38856 | 52 | 60 | 087 | 065 | 114 | 095 | 0331 | ||||||||||
| HIV | Pernicious anaemia | 5428 | 2 | 38 | 052 | 006 | 189 | 046 | 04974 | ||||||||||
| HIV | Polymyositis | 236 | 7 | 1 | 732 | 291 | 1531 | 3116 | 0 | ||||||||||
| HIV | Primary biliary cirrhosis | 312 | 1 | 09 | 115 | 003 | 648 | 016 | 06935 | ||||||||||
| HIV | Psoriasis | 9428 | 58 | 344 | 169 | 128 | 219 | 1556 | 00001 | ||||||||||
| HIV | Rheumatoid arthritis | 16087 | 28 | 31 | 09 | 06 | 131 | 02 | 06538 | ||||||||||
| HIV | Scleroderma | 349 | 0 | 1 | 0 | 0 | 366 | 026 | 06107 | ||||||||||
| HIV | Sjogrens syndrome | 461 | 2 | 12 | 17 | 02 | 617 | 009 | 07682 | ||||||||||
| HIV | Systematic lupus erythematosus | 559 | 1 | 25 | 04 | 001 | 226 | 038 | 05355 | ||||||||||
| HIV | Thyrotoxicosis | 5601 | 16 | 141 | 114 | 065 | 185 | 014 | 07078 | ||||||||||
| HIV | Ulcerative colitis | 10536 | 57 | 408 | 14 | 106 | 181 | 605 | 00139 |
| HIV b4 autos | |||||||||||||||||||
| exposure | outcome | obs in ref cohort | obs | exp | rate ratio | low CI | upr CI | chi-sq | p-value | ||||||||||
| HIV | Addisons disease | 1516 | 18 | 26 | 69 | 408 | 1094 | 8394 | 0 | ||||||||||
| HIV | Ankylosing spondylitis | 3802 | 2 | 108 | 019 | 002 | 067 | 638 | 00116 | ||||||||||
| HIV | Autoimmune haemolytic anaemia | 1382 | 5 | 15 | 325 | 105 | 761 | 568 | 00171 | ||||||||||
| HIV | Chronic active hepatitis | 507 | 4 | 08 | 517 | 14 | 1332 | 953 | 0002 | ||||||||||
| HIV | Coeliac disease | 6921 | 7 | 14 | 05 | 02 | 103 | 302 | 00822 | ||||||||||
| HIV | Crohns disease | 10404 | 16 | 299 | 053 | 031 | 087 | 603 | 00141 | ||||||||||
| HIV | ITP | 3966 | 21 | 57 | 368 | 227 | 563 | 3813 | 0 | ||||||||||
| HIV | Myxoedema | 153406 | 72 | 1414 | 051 | 04 | 064 | 3362 | 0 | ||||||||||
| HIV | Pernicious anaemia | 14387 | 3 | 78 | 038 | 008 | 112 | 24 | 01217 | ||||||||||
| HIV | Polymyositis | 518 | 9 | 13 | 682 | 31 | 1305 | 3841 | 0 | ||||||||||
| HIV | Primary biliary cirrhosis | 1609 | 1 | 19 | 053 | 001 | 298 | 007 | 0787 | ||||||||||
| HIV | Psoriasis | 15618 | 43 | 412 | 104 | 075 | 141 | 004 | 08421 | ||||||||||
| HIV | Rheumatoid arthritis | 44692 | 28 | 521 | 054 | 036 | 078 | 1067 | 00011 | ||||||||||
| HIV | Scleroderma | 1636 | 1 | 22 | 046 | 001 | 254 | 022 | 06394 | ||||||||||
| HIV | Sjogrens syndrome | 3536 | 0 | 38 | 0 | 0 | 097 | 286 | 0091 | ||||||||||
| HIV | Systematic lupus erythematosus | 3060 | 9 | 86 | 105 | 048 | 199 | 0 | 09745 | ||||||||||
| HIV | Thyrotoxicosis | 21626 | 27 | 291 | 093 | 061 | 135 | 009 | 07631 | ||||||||||
| HIV | Ulcerative colitis | 16648 | 45 | 489 | 092 | 067 | 123 | 024 | 06256 |
| HIV b4 autos | |||||||||||||||||||
| exposure | outcome | obs in ref cohort | obs | exp | rate ratio | low CI | upr CI | chi-sq | p-value | ||||||||||
| HIV | Addisons disease | 686 | 3 | 11 | 271 | 056 | 796 | 175 | 01859 | ||||||||||
| HIV | Ankylosing spondylitis | 1807 | 0 | 52 | 0 | 0 | 071 | 421 | 00401 | ||||||||||
| HIV | Autoimmune haemolytic anaemia | 586 | 1 | 06 | 169 | 004 | 943 | 001 | 09035 | ||||||||||
| HIV | Chronic active hepatitis | 167 | 1 | 02 | 466 | 012 | 2633 | 038 | 05397 | ||||||||||
| HIV | Coeliac disease | 3282 | 1 | 61 | 016 | 0 | 091 | 346 | 00628 | ||||||||||
| HIV | Crohns disease | 4709 | 3 | 132 | 023 | 005 | 066 | 717 | 00074 | ||||||||||
| HIV | ITP | 1824 | 6 | 25 | 236 | 087 | 515 | 344 | 00636 | ||||||||||
| HIV | Myxoedema | 75495 | 29 | 716 | 04 | 027 | 058 | 2479 | 0 | ||||||||||
| HIV | Pernicious anaemia | 6772 | 0 | 42 | 0 | 0 | 089 | 322 | 00729 | ||||||||||
| HIV | Polymyositis | 216 | 1 | 05 | 188 | 005 | 1057 | 0 | 09632 | ||||||||||
| HIV | Primary biliary cirrhosis | 690 | 1 | 07 | 142 | 004 | 794 | 006 | 08079 | ||||||||||
| HIV | Psoriasis | 7528 | 16 | 196 | 082 | 047 | 133 | 048 | 0489 | ||||||||||
| HIV | Rheumatoid arthritis | 20701 | 11 | 254 | 043 | 022 | 077 | 763 | 00058 | ||||||||||
| HIV | Scleroderma | 725 | 0 | 1 | 0 | 0 | 362 | 026 | 0607 | ||||||||||
| HIV | Sjogrens syndrome | 1700 | 0 | 17 | 0 | 0 | 218 | 084 | 03586 | ||||||||||
| HIV | Systematic lupus erythematosus | 1357 | 3 | 36 | 083 | 017 | 243 | 0 | 09495 | ||||||||||
| HIV | Thyrotoxicosis | 10097 | 13 | 136 | 095 | 051 | 163 | 0 | 09755 | ||||||||||
| HIV | Ulcerative colitis | 7325 | 15 | 207 | 072 | 04 | 119 | 131 | 02521 |

1+
males
females
The CHARCOT PROJECTINSPIRE
Isentress (Raltegravir)Pilot Study in Relapsing MS
bull Aims to investigate the concept of HERV+-EBV or herpes viruses as an etiology or trigger for MS
bull Disease controlling rather than disease modifying therapy
INSPIRE Design
bull Pilot study enrolling patients with active RRMS as defined by +ve Gd-enhanced MRI or documented relapse in previous 12 months
bull Baseline (3 months) followed by treatment (3 months)
bull Open label treatment phase with Raltegravir 400mg twice a day
INSPIRE Design 2bull 1deg Outcome number and rate of development
of Gd-enhanced lesionsbull 2deg outcomes are disability and quality-of-lifeStatistical considerations19 subjects need to complete trial to achieve 95 significance with 80 power for a 40 reduction in MS lesions compared with baseline (according to Sormani et al)
Trial design
change in gradient
change(in means)
V1 V2(screening before
visit)
V3 V4 V5 V6 V7 V8after
Raltegravirdispensed
A statistically significantchange in means is not inthis situation consistent
with a reduction inoutcome values due tointervention
3
Trial design
QOL QOL QOL QOL QOL QOL QOL
MSFC MSFC MSFC MSFC MSFC MSFC MSFCEDSS EDSS EDSS EDSS EDSS
blood blood blood blood blood blood blood blood
MRI MRI MRI MRI MRI MRI MRI
V1 V2 V3 V4 V5 V6 V7 V8(screening before after
visit)
bull Exploratory studybull Danger of Type II error of missing a real association arguably greater than
danger of Type I error of highlighting a spurious association
4
DATA
bull Patient socio-demographic and baseline
bull MRI
bull Viral and biomarkers
bull Disability
bull Quality of life
bull Laboratory safety tests
2
Patient socio-demographic and baseline
N mean min maxITTAge at baselineyrs 20 4073 3115 5299Height cm 18 16904 15600 18300Weight kg 18 7873 5190 10970Baseline EDSS 20 240 000 400Number of relapses in past year 20 150 100 300
PPAge at baselineyrs 16 4162 3115 5299Height cm 14 16891 15600 18000Weight kg 14 7790 5190 10830Baseline EDSS 16 225 000 350Number of relapses in past year 16 144 100 300
6
Patient adherenceITT PP
Visit mean
6 Number of tablets dispensed 60 60Number of tablets returned 235 269Adherence percentagea 9608 9552
7 Number of tablets dispensed 63 6375Number of tablets returned 72 675Adherence percentagea 88 8875
8 Number of tablets dispensed 597 5963Number of tablets returned 81 863Adherence percentagea 824 805
Over all three visits Number of tablets dispensed 609 6113Number of tablets returned 588 602Adherence percentagea 8883 8826
a100(tablets dispensed - tablets returned)tablets dispensed
7
MRI Total T1 Gd-enhancing lesionsTotal T1 (Gad enhanced) lesion rates
Before (visits 34 and 5) After (visits 67 and 8) Within-patient changea
Mean monthly Mean monthly Change Weightedrate rate in rate rate ratiob
ITT (n=20) 289 302 012 103PP (n=16) 251 233 -018 092
aChanges calculated after-before or afterbeforebRatios averaged on log scale before back-transforming substituting 01 for zero rates Weighted ratios pooled byweighting for total subject counts
Poisson regression analysis after vs before
ITT rate ratio after vs before as 104(95 CI 85 129) P=0681PP rate ratio after vs before as093(95 CI 072 120) P=0577
Poisson regression analysis gradient after vs gradient beforeITT test of difference in gradients P=0659PP test of difference in gradients P=0463
8
MRI New T1 Gd-enhancing lesionsNew T1 (Gad enhanced) lesion rates
Before (visits 34 and 5) After (visits 67 and 8) Within-patient changea
Mean monthly Mean monthly Changerate rate in rate
ITT (n=20) 143 167 023PP (n=16) 098 115 017
aChanges calculated after-before or afterbefore
Poisson regression analysis after vs beforeITT rate ratio after vs before as 116(95 CI 087 155) P=0314PP rate ratio after vs before as 116 (95 CI079 172) P=0456
Poisson regression analysis gradient after vs gradient beforeITT test of difference in gradients P=0562PP test of difference in gradients P=0137
9
MRI T1 Gd lesions
ITT Patients in order of difference in rate
010008010019010015010001010016010009010028010027010003010005010007010010010011010013010014010017010023
010012010020010024
-4 -2 0 2difference in rate lesions per month
Difference after - before
4
13
MRI lesions summary
Lesion outcomes provide no statistical evidence consistent with aneffect of raltegravir
14
Viral and biomarker data Before vs AfterBaselines (visit 2) Before (345) After (678)
Variable N mean sd N mean sd mean sd
MSRV A CtGAPDH Ct(dim-less) 20 094 01 20 093 007 20 092 007MSRV M CtGAPDH Ct(dim-less) 20 133 006 20 133 006 20 132 007TB HE23 CtGAPDH Ct(dim-less) 20 127 014 20 124 013 20 124 013HERV-W A CtGAPDH Ct(dim-less) 20 116 016 20 118 01 20 118 009HERV-W M CtGAPDH Ct(dim-less) 20 147 021 20 144 015 20 145 013TB HE1113 CtGAPDH Ct(dim-less) 20 127 01 20 128 006 20 129 006IL-8 pgmL 20 2805 8683 20 852 232 20 934 286HERV-WMSRV Gag Flix B cells (d-less) 13 118 011 19 119 01 18 115 006HERV-HF Gag Flix B cells (d-less) 12 114 01 17 108 007 20 112 011HERV-HF Env (H1) Flix B cells (d-less) 11 112 007 18 106 005 17 11 008HERV-HF Env (H3) Flix B cells (d-less) 19 156 024 20 147 015 20 152 016HERV-HF Env (W1) Flix B cells (d-less) 18 131 013 20 123 01 20 123 01HERV-HF Env (W3) Flix B cells (d-less) 17 125 015 20 122 009 20 124 017prop of B cells in sample () 19 914 38 20 859 306 20 905 379prop of monocytes in sample () 19 1533 92 20 1808 641 20 1609 623
HERV-WMSRV Gag Flix monocytes (d-less) 11 114 009 16 116 005 15 115 007MSRV F Gag Flix monocytes (d-less) 13 116 01 17 111 005 16 122 019Env (H1) Flix monocytes (d-less) 15 115 012 18 112 008 17 115 006Env (H3) Flix monocytes (d-less) 19 159 018 20 155 019 20 157 02Env (W1) Flix monocytes (d-less) 15 115 01 19 111 007 19 108 005Env (W3) Flix monocytes (d-less) 13 116 008 19 112 007 18 116 009HCRP ngmL 20 178383 21238 20 189945 176902 20 243527 224115CD163 ngmL 20 45667 15463 20 4239 10536 20 44257 12468EBV Copiesmicrolitre 16 21371 79687 16 238 6672 15 668 21274
Viral and biomarker data Before vs AfterHERV-WMSRV Gag Flix B cellsSignificant drop in means in ITT and PPNo significant change in gradient but steeper gradient before
HERV-WMSRV Gag Flix B cellsPP Individual subjects and fitted line
Significant overall drop notattributable to intervention
Similar story for
Env (W1) Flix monocytes
2 3 4 5 6 7 8monthly visits
Solid line fitted by modelA significant drop in means cannot be explained by intervention since decline is steeper before
17
MRI PP Persisting T1 Gd-enhancing lesionsBefore After Within-patient changea
Mean rate Mean rate Change in ratePP (n=16) 153 119 -034
80 of total reductionoccurs before theintervention
attributing the overallreduction to the interventioneven if reduction weresignificant would not be
-013 (P=0469)
P=0762-003 (P=0835)
credible
11
MRI T2 lesions
T2 lesion counts Observed at visits 5 (before) and 8 (after)
Before After Within-patient changea
Mean count Mean count Mean count changeP=0472
weighted ratiob
ITT 445PP 313
465 020P=0462331 019
105107
aChanges calculated after-before or afterbeforebWithin-patient ratios averaged on log scale before back transforming substituting 01 for zero counts Weighted meanratios pooled on log scale by weighting for lesion counts
12
Viral and biomarker data change vs T1 Gd lesion changePositive correlation
HERV-WMSRV Gag Flix B cells r=046 P=0057 ITT r=048 P=0086 PP
9
10
Additional analysis
A higher T1 Gd lesioncount at any visit isassociated with higher714
1619
28 27
20
1712
values of HERV-WMSRVGag Flix B cells at that visitP=0029 (ITT)
15
8 1
-3 -2 -1 0 1 2change in T1 lesion rate
Suggestion of decrease in HERV-WMSRV Gag Flix B cells associated with decrease in Gd-enhanced lesion rate PP r=-048 P=0086
23
Patients with a decrease in lesion count (eg patient 8) tend to have a decrease or a greater decrease in the biomarker than patients with an increase in lesion count (eg patient 20)
Viral and biomarker data summary
Some statistically significant changes in gradient before vs after wereobserved However whether these are consistent with an effect ofraltegravir depends partly on biological plausibility
A very small number of statistically significant correlations wereobserved between changes in these measures and changes in T1 Gdlesion counts their interpretation is again heavily dependent onbiological plausibility
Because of the number of measurestests any significant resultsshould be treated with caution Since results are singled out on thebasis of statistical significance rather than prior hypothesis Type Ierror is likely
25
Viral and biomarker data Before vs AfterHCRP ngmLSignificant increase in means in ITT and PPNo significant change in (positive) gradient similar slightly steeper gradient after
ITT------------------------------------------------------------------------------
| gradient SE z P-value [95 Conf Interval]-------------+----------------------------------------------------------------
before | 1221482 1495142 082 0414 -1708943 4151908after | 1406076 1495142 094 0347 -1524349 4336501
------------------------------------------------------------------------------
Significant overall increase not credibly attributable to intervention since the gradientbefore though non-significant is too similar to the gradient after intervention
18
Quality of life data summary
A number of measures showed statistically significant improvementsin well-being or a slowing of deterioration in the period aftercompared to before intervention
Although consistent with an effect of raltegravir this is most crediblyattributable to the placebo effect of patients receiving an unblindedintervention rather than to any action of the drug
The study design of not having a control group or a cross-over designmitigated against determining the possible effect of the interventionon Q0L
31
Viral and biomarker data Before vs AfterEnv (W3) Flix monocytesNon-significant decline before becomes borderline significant increase afterand significant change in gradient
Env (W3) Flix monocytesITT Individual subjects and fitted line
-002 P=0200
As before biologicalplausibility important bothfor change displayed andfor negative correlation
with Gd T1 lesions
+002 P=0055
P=0047
2 3 4 5 6 7 8monthly visits
Significant change in gradient in ITT (P=0047) and borderline in PP (P=0089)Change in means after - before negatively correlated withchange in rate of Gd enhancing T1 lesions r=-054 P=0015
21
Disability data
Summary of changes after-before
N mean sdEDSS 20 014 045 Neither change nor gradient change significant
MSFC 20 023 028 [Both change and change in gradient significant]9HPT peg speed 20 0003 0003 Highly significant improvementWalk speed (fs) 20 -004 047 Neither change nor gradient change significantPASAT score 20 466 521 Highly significant improvement
PASAT------------------------------------------------------------------------------
| gradient SE z P-value [95 Conf Interval]-------------+----------------------------------------------------------------
before | 2478954 4594816 540 0000 1578387 3379522after | 6377749 4534625 141 0160 -2509954 1526545
------------------------------------------------------------------------------
bull There is a significant gradient changebull But rate of improvement substantially greater before than after intervention
27
Quality of life data
Summary of changes after-before
change inITT n means
PQ - SF36 - Physical Functional Score (PF) 20 -092
PQ - SF36 - Role-Physical Scale (RP) 20 -948PQ - SF36 - Bodily Pain Scale (BP) 20 -542
PQ - SF36 - General Health Scale (GH) 20 -467
PQ - SF36 - Vitality Scale (VT) 20 506 PQ - SF36 - Social Functioning Scale (SF) 20 245 PQ - SF36 - Role Emotional Scale (RE) 20 -862 no statistically significant changes
PQ - SF36 - Mental Health Scale (MH) 20 572 PQ - PFA - Patient Fatigue Assessment 20 -151PQ - PPA - Patient Pain Assessment 19 407PQ - MSIS - Total Score 20 -210 no statistically significant changes
PQ - MSWS-12 - MSWS Total Score 20 -035
30
Quality of life dataSummary of changes after-before
change inITT n means
PQ - SF36 - Physical Functional Score (PF) 20 -092PQ - SF36 - Role-Physical Scale (RP) 20 -948PQ - SF36 - Bodily Pain Scale (BP) 20 -542PQ - SF36 - General Health Scale (GH) 20 -467PQ - SF36 - Vitality Scale (VT) 20 506
+ = improvement
PQ - SF36 - Social Functioning Scale (SF) 20 245PQ - SF36 - Role Emotional Scale (RE) 20 -862PQ - SF36 - Mental Health Scale (MH) 20 572PQ - PFA - Patient Fatigue Assessment 20 -151PQ - PPA - Patient Pain Assessment 19 407 - = improvementPQ - MSIS - Total Score 20 -210PQ - MSWS-12 - MSWS Total Score 20 -035
29
Disability data
Summary of changes after-before
N mean sdEDSS 20 014 045 Neither change nor gradient change significant
MSFC 20 023 028 [Both change and change in gradient significant]9HPT peg speed 20 0003 0003 Highly significant improvementWalk speed (fs) 20 -004 047 Neither change nor gradient change significantPASAT score 20 466 521
9HPT peg speed------------------------------------------------------------------------------
ITT | gradient SE z P-value [95 Conf Interval]-------------+----------------------------------------------------------------
before | 0009916 0002372 418 0000 0005267 0014565after | 000545 0002363 231 0021 0000818 0010082
------------------------------------------------------------------------------
bull No significant gradient changebull But rate of improvement substantially greater before than after intervention
26
Acknowledgementsbull Unit for Healthcare Epidemiology Oxford
ndash Raph Goldacrendash Michael Goldacrendash David Yeates
bull QMULbull Gavin Giovannoni
bull The Albion Centrebull Hubert Maruszak
bull UCLbull Robin Weiss
Laboratory safety tests
32
Laboratory safety tests significant changes
ITT change gradient gradient change inbefore after gradient
ADJUSTED CALCIUM SERUM +002 -000003 +0008 P=0406 increase could bep=0025 pgt09 p=0149 due intervention
CHLORIDE SERUM -075 +014 -031 p=0194 decrease could bep=0055 p=0503 p=0103 due to intervention
CHOLESTEROL SERUM +028 +008 +003 p=0437 increase notp=0004 p=0059 p=0521 plausibly duehellip
GLUCOSE PLASMA -018 +008 -015 p=0072 gradient changep=0196 p=0284 p=0037 could be duehellip
LDL CHOLESTEROL SERUM +017 +006 +0004 p=0432 increase notp=0018 p=0162 pgt09 plausibly duehellip
PLATELET COUNT +686 -027 +259 p=0352 increase could bep=0040 p=0880 p=0129 duehellip
WHITE BLOOD COUNT PP +022 +006 +010 p=0827 increase notp=0049 p=0579 p=0331 plausibly due
33
- Diapositive numeacutero 1
- Diapositive numeacutero 2
- Dr Jean-Martin Charcot
- Diapositive numeacutero 4
- Diapositive numeacutero 5
- Diapositive numeacutero 6
- Viruses and MS
- Are human endogenous retroviruses pathogenic An approach to testing the hypothesis
- How HERVs may induce autoimmune response
- Diapositive numeacutero 10
- Diapositive numeacutero 11
- Diapositive numeacutero 12
- Diapositive numeacutero 13
- How many cases of HIV and MS have been reported
- What do cohort studies show
- What is the Risk of Developing Multiple Sclerosis if you have HIV and are on HIV Anti-retroviral therapy
- Methods
- Diapositive numeacutero 18
- Diapositive numeacutero 19
- NHS Data on UK Healthcare events 1999-2011
- NHS Cohort gt One year after Exposure (HIV) Contact
- Diapositive numeacutero 22
- The CHARCOT PROJECTINSPIRE Isentress (Raltegravir)Pilot Study in Relapsing MS
- INSPIRE Design
- INSPIRE Design 2
- Diapositive numeacutero 26
- Diapositive numeacutero 27
- Diapositive numeacutero 28
- Diapositive numeacutero 29
- Diapositive numeacutero 30
- Diapositive numeacutero 31
- Diapositive numeacutero 32
- Diapositive numeacutero 34
- Diapositive numeacutero 35
- Diapositive numeacutero 36
- Diapositive numeacutero 37
- Diapositive numeacutero 38
- Diapositive numeacutero 39
- Diapositive numeacutero 40
- Diapositive numeacutero 41
- Diapositive numeacutero 42
- Diapositive numeacutero 43
- Diapositive numeacutero 44
- Diapositive numeacutero 45
- Diapositive numeacutero 47
- Diapositive numeacutero 48
- Diapositive numeacutero 49
- Diapositive numeacutero 50
- Acknowledgements
- Diapositive numeacutero 52
- Diapositive numeacutero 53
- Diapositive numeacutero 54
-
| HIV b4 autos | |||||||||||||||||||
| exposure | outcome | obs in ref cohort | obs | exp | rate ratio | low CI | upr CI | chi-sq | p-value | ||||||||||
| HIV | Addisons disease | 1107 | 13 | 15 | 881 | 468 | 1513 | 814 | 0 | ||||||||||
| HIV | Ankylosing spondylitis | 1686 | 0 | 22 | 0 | 0 | 164 | 136 | 02435 | ||||||||||
| HIV | Autoimmune haemolytic anaemia | 911 | 3 | 05 | 638 | 131 | 187 | 873 | 00031 | ||||||||||
| HIV | Chronic active hepatitis | 435 | 3 | 03 | 915 | 188 | 2693 | 143 | 00002 | ||||||||||
| HIV | Coeliac disease | 4991 | 3 | 76 | 04 | 008 | 116 | 218 | 01395 | ||||||||||
| HIV | Crohns disease | 6362 | 4 | 119 | 034 | 009 | 086 | 457 | 00325 | ||||||||||
| HIV | ITP | 2504 | 11 | 27 | 411 | 205 | 737 | 2278 | 0 | ||||||||||
| HIV | Myxoedema | 142597 | 33 | 977 | 034 | 023 | 047 | 4221 | 0 | ||||||||||
| HIV | Pernicious anaemia | 11732 | 2 | 49 | 04 | 005 | 146 | 121 | 02717 | ||||||||||
| HIV | Polymyositis | 395 | 3 | 05 | 622 | 128 | 183 | 837 | 00038 | ||||||||||
| HIV | Primary biliary cirrhosis | 1605 | 1 | 12 | 086 | 002 | 482 | 01 | 07507 | ||||||||||
| HIV | Psoriasis | 9262 | 7 | 129 | 054 | 022 | 111 | 229 | 01305 | ||||||||||
| HIV | Rheumatoid arthritis | 37706 | 11 | 28 | 039 | 02 | 07 | 969 | 00018 | ||||||||||
| HIV | Scleroderma | 1581 | 1 | 15 | 066 | 002 | 369 | 0 | 09916 | ||||||||||
| HIV | Sjogrens syndrome | 3640 | 0 | 31 | 0 | 0 | 12 | 215 | 01424 | ||||||||||
| HIV | Systematic lupus erythematosus | 3109 | 9 | 73 | 123 | 056 | 233 | 019 | 06667 | ||||||||||
| HIV | Thyrotoxicosis | 20268 | 16 | 193 | 083 | 047 | 135 | 04 | 05258 | ||||||||||
| HIV | Ulcerative colitis | 9235 | 5 | 155 | 032 | 01 | 075 | 65 | 00108 |
| HIV b4 autos | |||||||||||||||||||
| exposure | outcome | obs in ref cohort | obs | exp | rate ratio | low CI | upr CI | chi-sq | p-value | ||||||||||
| HIV | Addisons disease | 761 | 22 | 2 | 1108 | 69 | 169 | 18634 | 0 | ||||||||||
| HIV | Ankylosing spondylitis | 2883 | 3 | 97 | 031 | 006 | 091 | 395 | 0047 | ||||||||||
| HIV | Autoimmune haemolytic anaemia | 777 | 9 | 15 | 619 | 282 | 118 | 3371 | 0 | ||||||||||
| HIV | Chronic active hepatitis | 190 | 7 | 07 | 1106 | 439 | 2324 | 5245 | 0 | ||||||||||
| HIV | Coeliac disease | 3136 | 4 | 81 | 05 | 013 | 127 | 158 | 02085 | ||||||||||
| HIV | Crohns disease | 5938 | 27 | 231 | 117 | 077 | 171 | 051 | 04754 | ||||||||||
| HIV | ITP | 2190 | 32 | 52 | 628 | 428 | 889 | 13471 | 0 | ||||||||||
| HIV | Myxoedema | 38856 | 52 | 60 | 087 | 065 | 114 | 095 | 0331 | ||||||||||
| HIV | Pernicious anaemia | 5428 | 2 | 38 | 052 | 006 | 189 | 046 | 04974 | ||||||||||
| HIV | Polymyositis | 236 | 7 | 1 | 732 | 291 | 1531 | 3116 | 0 | ||||||||||
| HIV | Primary biliary cirrhosis | 312 | 1 | 09 | 115 | 003 | 648 | 016 | 06935 | ||||||||||
| HIV | Psoriasis | 9428 | 58 | 344 | 169 | 128 | 219 | 1556 | 00001 | ||||||||||
| HIV | Rheumatoid arthritis | 16087 | 28 | 31 | 09 | 06 | 131 | 02 | 06538 | ||||||||||
| HIV | Scleroderma | 349 | 0 | 1 | 0 | 0 | 366 | 026 | 06107 | ||||||||||
| HIV | Sjogrens syndrome | 461 | 2 | 12 | 17 | 02 | 617 | 009 | 07682 | ||||||||||
| HIV | Systematic lupus erythematosus | 559 | 1 | 25 | 04 | 001 | 226 | 038 | 05355 | ||||||||||
| HIV | Thyrotoxicosis | 5601 | 16 | 141 | 114 | 065 | 185 | 014 | 07078 | ||||||||||
| HIV | Ulcerative colitis | 10536 | 57 | 408 | 14 | 106 | 181 | 605 | 00139 |
| HIV b4 autos | |||||||||||||||||||
| exposure | outcome | obs in ref cohort | obs | exp | rate ratio | low CI | upr CI | chi-sq | p-value | ||||||||||
| HIV | Addisons disease | 1516 | 18 | 26 | 69 | 408 | 1094 | 8394 | 0 | ||||||||||
| HIV | Ankylosing spondylitis | 3802 | 2 | 108 | 019 | 002 | 067 | 638 | 00116 | ||||||||||
| HIV | Autoimmune haemolytic anaemia | 1382 | 5 | 15 | 325 | 105 | 761 | 568 | 00171 | ||||||||||
| HIV | Chronic active hepatitis | 507 | 4 | 08 | 517 | 14 | 1332 | 953 | 0002 | ||||||||||
| HIV | Coeliac disease | 6921 | 7 | 14 | 05 | 02 | 103 | 302 | 00822 | ||||||||||
| HIV | Crohns disease | 10404 | 16 | 299 | 053 | 031 | 087 | 603 | 00141 | ||||||||||
| HIV | ITP | 3966 | 21 | 57 | 368 | 227 | 563 | 3813 | 0 | ||||||||||
| HIV | Myxoedema | 153406 | 72 | 1414 | 051 | 04 | 064 | 3362 | 0 | ||||||||||
| HIV | Pernicious anaemia | 14387 | 3 | 78 | 038 | 008 | 112 | 24 | 01217 | ||||||||||
| HIV | Polymyositis | 518 | 9 | 13 | 682 | 31 | 1305 | 3841 | 0 | ||||||||||
| HIV | Primary biliary cirrhosis | 1609 | 1 | 19 | 053 | 001 | 298 | 007 | 0787 | ||||||||||
| HIV | Psoriasis | 15618 | 43 | 412 | 104 | 075 | 141 | 004 | 08421 | ||||||||||
| HIV | Rheumatoid arthritis | 44692 | 28 | 521 | 054 | 036 | 078 | 1067 | 00011 | ||||||||||
| HIV | Scleroderma | 1636 | 1 | 22 | 046 | 001 | 254 | 022 | 06394 | ||||||||||
| HIV | Sjogrens syndrome | 3536 | 0 | 38 | 0 | 0 | 097 | 286 | 0091 | ||||||||||
| HIV | Systematic lupus erythematosus | 3060 | 9 | 86 | 105 | 048 | 199 | 0 | 09745 | ||||||||||
| HIV | Thyrotoxicosis | 21626 | 27 | 291 | 093 | 061 | 135 | 009 | 07631 | ||||||||||
| HIV | Ulcerative colitis | 16648 | 45 | 489 | 092 | 067 | 123 | 024 | 06256 |
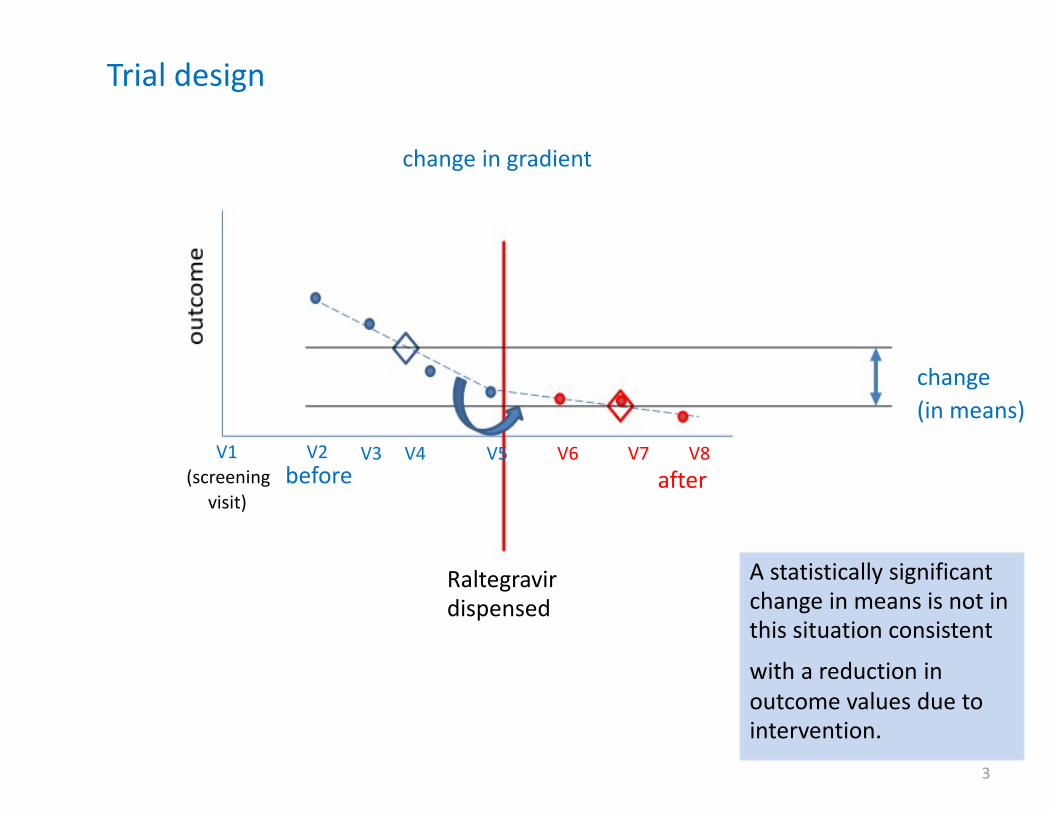
males
females
The CHARCOT PROJECTINSPIRE
Isentress (Raltegravir)Pilot Study in Relapsing MS
bull Aims to investigate the concept of HERV+-EBV or herpes viruses as an etiology or trigger for MS
bull Disease controlling rather than disease modifying therapy
INSPIRE Design
bull Pilot study enrolling patients with active RRMS as defined by +ve Gd-enhanced MRI or documented relapse in previous 12 months
bull Baseline (3 months) followed by treatment (3 months)
bull Open label treatment phase with Raltegravir 400mg twice a day
INSPIRE Design 2bull 1deg Outcome number and rate of development
of Gd-enhanced lesionsbull 2deg outcomes are disability and quality-of-lifeStatistical considerations19 subjects need to complete trial to achieve 95 significance with 80 power for a 40 reduction in MS lesions compared with baseline (according to Sormani et al)
Trial design
change in gradient
change(in means)
V1 V2(screening before
visit)
V3 V4 V5 V6 V7 V8after
Raltegravirdispensed
A statistically significantchange in means is not inthis situation consistent
with a reduction inoutcome values due tointervention
3
Trial design
QOL QOL QOL QOL QOL QOL QOL
MSFC MSFC MSFC MSFC MSFC MSFC MSFCEDSS EDSS EDSS EDSS EDSS
blood blood blood blood blood blood blood blood
MRI MRI MRI MRI MRI MRI MRI
V1 V2 V3 V4 V5 V6 V7 V8(screening before after
visit)
bull Exploratory studybull Danger of Type II error of missing a real association arguably greater than
danger of Type I error of highlighting a spurious association
4
DATA
bull Patient socio-demographic and baseline
bull MRI
bull Viral and biomarkers
bull Disability
bull Quality of life
bull Laboratory safety tests
2
Patient socio-demographic and baseline
N mean min maxITTAge at baselineyrs 20 4073 3115 5299Height cm 18 16904 15600 18300Weight kg 18 7873 5190 10970Baseline EDSS 20 240 000 400Number of relapses in past year 20 150 100 300
PPAge at baselineyrs 16 4162 3115 5299Height cm 14 16891 15600 18000Weight kg 14 7790 5190 10830Baseline EDSS 16 225 000 350Number of relapses in past year 16 144 100 300
6
Patient adherenceITT PP
Visit mean
6 Number of tablets dispensed 60 60Number of tablets returned 235 269Adherence percentagea 9608 9552
7 Number of tablets dispensed 63 6375Number of tablets returned 72 675Adherence percentagea 88 8875
8 Number of tablets dispensed 597 5963Number of tablets returned 81 863Adherence percentagea 824 805
Over all three visits Number of tablets dispensed 609 6113Number of tablets returned 588 602Adherence percentagea 8883 8826
a100(tablets dispensed - tablets returned)tablets dispensed
7
MRI Total T1 Gd-enhancing lesionsTotal T1 (Gad enhanced) lesion rates
Before (visits 34 and 5) After (visits 67 and 8) Within-patient changea
Mean monthly Mean monthly Change Weightedrate rate in rate rate ratiob
ITT (n=20) 289 302 012 103PP (n=16) 251 233 -018 092
aChanges calculated after-before or afterbeforebRatios averaged on log scale before back-transforming substituting 01 for zero rates Weighted ratios pooled byweighting for total subject counts
Poisson regression analysis after vs before
ITT rate ratio after vs before as 104(95 CI 85 129) P=0681PP rate ratio after vs before as093(95 CI 072 120) P=0577
Poisson regression analysis gradient after vs gradient beforeITT test of difference in gradients P=0659PP test of difference in gradients P=0463
8
MRI New T1 Gd-enhancing lesionsNew T1 (Gad enhanced) lesion rates
Before (visits 34 and 5) After (visits 67 and 8) Within-patient changea
Mean monthly Mean monthly Changerate rate in rate
ITT (n=20) 143 167 023PP (n=16) 098 115 017
aChanges calculated after-before or afterbefore
Poisson regression analysis after vs beforeITT rate ratio after vs before as 116(95 CI 087 155) P=0314PP rate ratio after vs before as 116 (95 CI079 172) P=0456
Poisson regression analysis gradient after vs gradient beforeITT test of difference in gradients P=0562PP test of difference in gradients P=0137
9
MRI T1 Gd lesions
ITT Patients in order of difference in rate
010008010019010015010001010016010009010028010027010003010005010007010010010011010013010014010017010023
010012010020010024
-4 -2 0 2difference in rate lesions per month
Difference after - before
4
13
MRI lesions summary
Lesion outcomes provide no statistical evidence consistent with aneffect of raltegravir
14
Viral and biomarker data Before vs AfterBaselines (visit 2) Before (345) After (678)
Variable N mean sd N mean sd mean sd
MSRV A CtGAPDH Ct(dim-less) 20 094 01 20 093 007 20 092 007MSRV M CtGAPDH Ct(dim-less) 20 133 006 20 133 006 20 132 007TB HE23 CtGAPDH Ct(dim-less) 20 127 014 20 124 013 20 124 013HERV-W A CtGAPDH Ct(dim-less) 20 116 016 20 118 01 20 118 009HERV-W M CtGAPDH Ct(dim-less) 20 147 021 20 144 015 20 145 013TB HE1113 CtGAPDH Ct(dim-less) 20 127 01 20 128 006 20 129 006IL-8 pgmL 20 2805 8683 20 852 232 20 934 286HERV-WMSRV Gag Flix B cells (d-less) 13 118 011 19 119 01 18 115 006HERV-HF Gag Flix B cells (d-less) 12 114 01 17 108 007 20 112 011HERV-HF Env (H1) Flix B cells (d-less) 11 112 007 18 106 005 17 11 008HERV-HF Env (H3) Flix B cells (d-less) 19 156 024 20 147 015 20 152 016HERV-HF Env (W1) Flix B cells (d-less) 18 131 013 20 123 01 20 123 01HERV-HF Env (W3) Flix B cells (d-less) 17 125 015 20 122 009 20 124 017prop of B cells in sample () 19 914 38 20 859 306 20 905 379prop of monocytes in sample () 19 1533 92 20 1808 641 20 1609 623
HERV-WMSRV Gag Flix monocytes (d-less) 11 114 009 16 116 005 15 115 007MSRV F Gag Flix monocytes (d-less) 13 116 01 17 111 005 16 122 019Env (H1) Flix monocytes (d-less) 15 115 012 18 112 008 17 115 006Env (H3) Flix monocytes (d-less) 19 159 018 20 155 019 20 157 02Env (W1) Flix monocytes (d-less) 15 115 01 19 111 007 19 108 005Env (W3) Flix monocytes (d-less) 13 116 008 19 112 007 18 116 009HCRP ngmL 20 178383 21238 20 189945 176902 20 243527 224115CD163 ngmL 20 45667 15463 20 4239 10536 20 44257 12468EBV Copiesmicrolitre 16 21371 79687 16 238 6672 15 668 21274
Viral and biomarker data Before vs AfterHERV-WMSRV Gag Flix B cellsSignificant drop in means in ITT and PPNo significant change in gradient but steeper gradient before
HERV-WMSRV Gag Flix B cellsPP Individual subjects and fitted line
Significant overall drop notattributable to intervention
Similar story for
Env (W1) Flix monocytes
2 3 4 5 6 7 8monthly visits
Solid line fitted by modelA significant drop in means cannot be explained by intervention since decline is steeper before
17
MRI PP Persisting T1 Gd-enhancing lesionsBefore After Within-patient changea
Mean rate Mean rate Change in ratePP (n=16) 153 119 -034
80 of total reductionoccurs before theintervention
attributing the overallreduction to the interventioneven if reduction weresignificant would not be
-013 (P=0469)
P=0762-003 (P=0835)
credible
11
MRI T2 lesions
T2 lesion counts Observed at visits 5 (before) and 8 (after)
Before After Within-patient changea
Mean count Mean count Mean count changeP=0472
weighted ratiob
ITT 445PP 313
465 020P=0462331 019
105107
aChanges calculated after-before or afterbeforebWithin-patient ratios averaged on log scale before back transforming substituting 01 for zero counts Weighted meanratios pooled on log scale by weighting for lesion counts
12
Viral and biomarker data change vs T1 Gd lesion changePositive correlation
HERV-WMSRV Gag Flix B cells r=046 P=0057 ITT r=048 P=0086 PP
9
10
Additional analysis
A higher T1 Gd lesioncount at any visit isassociated with higher714
1619
28 27
20
1712
values of HERV-WMSRVGag Flix B cells at that visitP=0029 (ITT)
15
8 1
-3 -2 -1 0 1 2change in T1 lesion rate
Suggestion of decrease in HERV-WMSRV Gag Flix B cells associated with decrease in Gd-enhanced lesion rate PP r=-048 P=0086
23
Patients with a decrease in lesion count (eg patient 8) tend to have a decrease or a greater decrease in the biomarker than patients with an increase in lesion count (eg patient 20)
Viral and biomarker data summary
Some statistically significant changes in gradient before vs after wereobserved However whether these are consistent with an effect ofraltegravir depends partly on biological plausibility
A very small number of statistically significant correlations wereobserved between changes in these measures and changes in T1 Gdlesion counts their interpretation is again heavily dependent onbiological plausibility
Because of the number of measurestests any significant resultsshould be treated with caution Since results are singled out on thebasis of statistical significance rather than prior hypothesis Type Ierror is likely
25
Viral and biomarker data Before vs AfterHCRP ngmLSignificant increase in means in ITT and PPNo significant change in (positive) gradient similar slightly steeper gradient after
ITT------------------------------------------------------------------------------
| gradient SE z P-value [95 Conf Interval]-------------+----------------------------------------------------------------
before | 1221482 1495142 082 0414 -1708943 4151908after | 1406076 1495142 094 0347 -1524349 4336501
------------------------------------------------------------------------------
Significant overall increase not credibly attributable to intervention since the gradientbefore though non-significant is too similar to the gradient after intervention
18
Quality of life data summary
A number of measures showed statistically significant improvementsin well-being or a slowing of deterioration in the period aftercompared to before intervention
Although consistent with an effect of raltegravir this is most crediblyattributable to the placebo effect of patients receiving an unblindedintervention rather than to any action of the drug
The study design of not having a control group or a cross-over designmitigated against determining the possible effect of the interventionon Q0L
31
Viral and biomarker data Before vs AfterEnv (W3) Flix monocytesNon-significant decline before becomes borderline significant increase afterand significant change in gradient
Env (W3) Flix monocytesITT Individual subjects and fitted line
-002 P=0200
As before biologicalplausibility important bothfor change displayed andfor negative correlation
with Gd T1 lesions
+002 P=0055
P=0047
2 3 4 5 6 7 8monthly visits
Significant change in gradient in ITT (P=0047) and borderline in PP (P=0089)Change in means after - before negatively correlated withchange in rate of Gd enhancing T1 lesions r=-054 P=0015
21
Disability data
Summary of changes after-before
N mean sdEDSS 20 014 045 Neither change nor gradient change significant
MSFC 20 023 028 [Both change and change in gradient significant]9HPT peg speed 20 0003 0003 Highly significant improvementWalk speed (fs) 20 -004 047 Neither change nor gradient change significantPASAT score 20 466 521 Highly significant improvement
PASAT------------------------------------------------------------------------------
| gradient SE z P-value [95 Conf Interval]-------------+----------------------------------------------------------------
before | 2478954 4594816 540 0000 1578387 3379522after | 6377749 4534625 141 0160 -2509954 1526545
------------------------------------------------------------------------------
bull There is a significant gradient changebull But rate of improvement substantially greater before than after intervention
27
Quality of life data
Summary of changes after-before
change inITT n means
PQ - SF36 - Physical Functional Score (PF) 20 -092
PQ - SF36 - Role-Physical Scale (RP) 20 -948PQ - SF36 - Bodily Pain Scale (BP) 20 -542
PQ - SF36 - General Health Scale (GH) 20 -467
PQ - SF36 - Vitality Scale (VT) 20 506 PQ - SF36 - Social Functioning Scale (SF) 20 245 PQ - SF36 - Role Emotional Scale (RE) 20 -862 no statistically significant changes
PQ - SF36 - Mental Health Scale (MH) 20 572 PQ - PFA - Patient Fatigue Assessment 20 -151PQ - PPA - Patient Pain Assessment 19 407PQ - MSIS - Total Score 20 -210 no statistically significant changes
PQ - MSWS-12 - MSWS Total Score 20 -035
30
Quality of life dataSummary of changes after-before
change inITT n means
PQ - SF36 - Physical Functional Score (PF) 20 -092PQ - SF36 - Role-Physical Scale (RP) 20 -948PQ - SF36 - Bodily Pain Scale (BP) 20 -542PQ - SF36 - General Health Scale (GH) 20 -467PQ - SF36 - Vitality Scale (VT) 20 506
+ = improvement
PQ - SF36 - Social Functioning Scale (SF) 20 245PQ - SF36 - Role Emotional Scale (RE) 20 -862PQ - SF36 - Mental Health Scale (MH) 20 572PQ - PFA - Patient Fatigue Assessment 20 -151PQ - PPA - Patient Pain Assessment 19 407 - = improvementPQ - MSIS - Total Score 20 -210PQ - MSWS-12 - MSWS Total Score 20 -035
29
Disability data
Summary of changes after-before
N mean sdEDSS 20 014 045 Neither change nor gradient change significant
MSFC 20 023 028 [Both change and change in gradient significant]9HPT peg speed 20 0003 0003 Highly significant improvementWalk speed (fs) 20 -004 047 Neither change nor gradient change significantPASAT score 20 466 521
9HPT peg speed------------------------------------------------------------------------------
ITT | gradient SE z P-value [95 Conf Interval]-------------+----------------------------------------------------------------
before | 0009916 0002372 418 0000 0005267 0014565after | 000545 0002363 231 0021 0000818 0010082
------------------------------------------------------------------------------
bull No significant gradient changebull But rate of improvement substantially greater before than after intervention
26
Acknowledgementsbull Unit for Healthcare Epidemiology Oxford
ndash Raph Goldacrendash Michael Goldacrendash David Yeates
bull QMULbull Gavin Giovannoni
bull The Albion Centrebull Hubert Maruszak
bull UCLbull Robin Weiss
Laboratory safety tests
32
Laboratory safety tests significant changes
ITT change gradient gradient change inbefore after gradient
ADJUSTED CALCIUM SERUM +002 -000003 +0008 P=0406 increase could bep=0025 pgt09 p=0149 due intervention
CHLORIDE SERUM -075 +014 -031 p=0194 decrease could bep=0055 p=0503 p=0103 due to intervention
CHOLESTEROL SERUM +028 +008 +003 p=0437 increase notp=0004 p=0059 p=0521 plausibly duehellip
GLUCOSE PLASMA -018 +008 -015 p=0072 gradient changep=0196 p=0284 p=0037 could be duehellip
LDL CHOLESTEROL SERUM +017 +006 +0004 p=0432 increase notp=0018 p=0162 pgt09 plausibly duehellip
PLATELET COUNT +686 -027 +259 p=0352 increase could bep=0040 p=0880 p=0129 duehellip
WHITE BLOOD COUNT PP +022 +006 +010 p=0827 increase notp=0049 p=0579 p=0331 plausibly due
33
- Diapositive numeacutero 1
- Diapositive numeacutero 2
- Dr Jean-Martin Charcot
- Diapositive numeacutero 4
- Diapositive numeacutero 5
- Diapositive numeacutero 6
- Viruses and MS
- Are human endogenous retroviruses pathogenic An approach to testing the hypothesis
- How HERVs may induce autoimmune response
- Diapositive numeacutero 10
- Diapositive numeacutero 11
- Diapositive numeacutero 12
- Diapositive numeacutero 13
- How many cases of HIV and MS have been reported
- What do cohort studies show
- What is the Risk of Developing Multiple Sclerosis if you have HIV and are on HIV Anti-retroviral therapy
- Methods
- Diapositive numeacutero 18
- Diapositive numeacutero 19
- NHS Data on UK Healthcare events 1999-2011
- NHS Cohort gt One year after Exposure (HIV) Contact
- Diapositive numeacutero 22
- The CHARCOT PROJECTINSPIRE Isentress (Raltegravir)Pilot Study in Relapsing MS
- INSPIRE Design
- INSPIRE Design 2
- Diapositive numeacutero 26
- Diapositive numeacutero 27
- Diapositive numeacutero 28
- Diapositive numeacutero 29
- Diapositive numeacutero 30
- Diapositive numeacutero 31
- Diapositive numeacutero 32
- Diapositive numeacutero 34
- Diapositive numeacutero 35
- Diapositive numeacutero 36
- Diapositive numeacutero 37
- Diapositive numeacutero 38
- Diapositive numeacutero 39
- Diapositive numeacutero 40
- Diapositive numeacutero 41
- Diapositive numeacutero 42
- Diapositive numeacutero 43
- Diapositive numeacutero 44
- Diapositive numeacutero 45
- Diapositive numeacutero 47
- Diapositive numeacutero 48
- Diapositive numeacutero 49
- Diapositive numeacutero 50
- Acknowledgements
- Diapositive numeacutero 52
- Diapositive numeacutero 53
- Diapositive numeacutero 54
-
| HIV b4 autos | |||||||||||||||||||
| exposure | outcome | obs in ref cohort | obs | exp | rate ratio | low CI | upr CI | chi-sq | p-value | ||||||||||
| HIV | Addisons disease | 1107 | 13 | 15 | 881 | 468 | 1513 | 814 | 0 | ||||||||||
| HIV | Ankylosing spondylitis | 1686 | 0 | 22 | 0 | 0 | 164 | 136 | 02435 | ||||||||||
| HIV | Autoimmune haemolytic anaemia | 911 | 3 | 05 | 638 | 131 | 187 | 873 | 00031 | ||||||||||
| HIV | Chronic active hepatitis | 435 | 3 | 03 | 915 | 188 | 2693 | 143 | 00002 | ||||||||||
| HIV | Coeliac disease | 4991 | 3 | 76 | 04 | 008 | 116 | 218 | 01395 | ||||||||||
| HIV | Crohns disease | 6362 | 4 | 119 | 034 | 009 | 086 | 457 | 00325 | ||||||||||
| HIV | ITP | 2504 | 11 | 27 | 411 | 205 | 737 | 2278 | 0 | ||||||||||
| HIV | Myxoedema | 142597 | 33 | 977 | 034 | 023 | 047 | 4221 | 0 | ||||||||||
| HIV | Pernicious anaemia | 11732 | 2 | 49 | 04 | 005 | 146 | 121 | 02717 | ||||||||||
| HIV | Polymyositis | 395 | 3 | 05 | 622 | 128 | 183 | 837 | 00038 | ||||||||||
| HIV | Primary biliary cirrhosis | 1605 | 1 | 12 | 086 | 002 | 482 | 01 | 07507 | ||||||||||
| HIV | Psoriasis | 9262 | 7 | 129 | 054 | 022 | 111 | 229 | 01305 | ||||||||||
| HIV | Rheumatoid arthritis | 37706 | 11 | 28 | 039 | 02 | 07 | 969 | 00018 | ||||||||||
| HIV | Scleroderma | 1581 | 1 | 15 | 066 | 002 | 369 | 0 | 09916 | ||||||||||
| HIV | Sjogrens syndrome | 3640 | 0 | 31 | 0 | 0 | 12 | 215 | 01424 | ||||||||||
| HIV | Systematic lupus erythematosus | 3109 | 9 | 73 | 123 | 056 | 233 | 019 | 06667 | ||||||||||
| HIV | Thyrotoxicosis | 20268 | 16 | 193 | 083 | 047 | 135 | 04 | 05258 | ||||||||||
| HIV | Ulcerative colitis | 9235 | 5 | 155 | 032 | 01 | 075 | 65 | 00108 |
| HIV b4 autos | |||||||||||||||||||
| exposure | outcome | obs in ref cohort | obs | exp | rate ratio | low CI | upr CI | chi-sq | p-value | ||||||||||
| HIV | Addisons disease | 761 | 22 | 2 | 1108 | 69 | 169 | 18634 | 0 | ||||||||||
| HIV | Ankylosing spondylitis | 2883 | 3 | 97 | 031 | 006 | 091 | 395 | 0047 | ||||||||||
| HIV | Autoimmune haemolytic anaemia | 777 | 9 | 15 | 619 | 282 | 118 | 3371 | 0 | ||||||||||
| HIV | Chronic active hepatitis | 190 | 7 | 07 | 1106 | 439 | 2324 | 5245 | 0 | ||||||||||
| HIV | Coeliac disease | 3136 | 4 | 81 | 05 | 013 | 127 | 158 | 02085 | ||||||||||
| HIV | Crohns disease | 5938 | 27 | 231 | 117 | 077 | 171 | 051 | 04754 | ||||||||||
| HIV | ITP | 2190 | 32 | 52 | 628 | 428 | 889 | 13471 | 0 | ||||||||||
| HIV | Myxoedema | 38856 | 52 | 60 | 087 | 065 | 114 | 095 | 0331 | ||||||||||
| HIV | Pernicious anaemia | 5428 | 2 | 38 | 052 | 006 | 189 | 046 | 04974 | ||||||||||
| HIV | Polymyositis | 236 | 7 | 1 | 732 | 291 | 1531 | 3116 | 0 | ||||||||||
| HIV | Primary biliary cirrhosis | 312 | 1 | 09 | 115 | 003 | 648 | 016 | 06935 | ||||||||||
| HIV | Psoriasis | 9428 | 58 | 344 | 169 | 128 | 219 | 1556 | 00001 | ||||||||||
| HIV | Rheumatoid arthritis | 16087 | 28 | 31 | 09 | 06 | 131 | 02 | 06538 | ||||||||||
| HIV | Scleroderma | 349 | 0 | 1 | 0 | 0 | 366 | 026 | 06107 | ||||||||||
| HIV | Sjogrens syndrome | 461 | 2 | 12 | 17 | 02 | 617 | 009 | 07682 | ||||||||||
| HIV | Systematic lupus erythematosus | 559 | 1 | 25 | 04 | 001 | 226 | 038 | 05355 | ||||||||||
| HIV | Thyrotoxicosis | 5601 | 16 | 141 | 114 | 065 | 185 | 014 | 07078 | ||||||||||
| HIV | Ulcerative colitis | 10536 | 57 | 408 | 14 | 106 | 181 | 605 | 00139 |

females
The CHARCOT PROJECTINSPIRE
Isentress (Raltegravir)Pilot Study in Relapsing MS
bull Aims to investigate the concept of HERV+-EBV or herpes viruses as an etiology or trigger for MS
bull Disease controlling rather than disease modifying therapy
INSPIRE Design
bull Pilot study enrolling patients with active RRMS as defined by +ve Gd-enhanced MRI or documented relapse in previous 12 months
bull Baseline (3 months) followed by treatment (3 months)
bull Open label treatment phase with Raltegravir 400mg twice a day
INSPIRE Design 2bull 1deg Outcome number and rate of development
of Gd-enhanced lesionsbull 2deg outcomes are disability and quality-of-lifeStatistical considerations19 subjects need to complete trial to achieve 95 significance with 80 power for a 40 reduction in MS lesions compared with baseline (according to Sormani et al)
Trial design
change in gradient
change(in means)
V1 V2(screening before
visit)
V3 V4 V5 V6 V7 V8after
Raltegravirdispensed
A statistically significantchange in means is not inthis situation consistent
with a reduction inoutcome values due tointervention
3
Trial design
QOL QOL QOL QOL QOL QOL QOL
MSFC MSFC MSFC MSFC MSFC MSFC MSFCEDSS EDSS EDSS EDSS EDSS
blood blood blood blood blood blood blood blood
MRI MRI MRI MRI MRI MRI MRI
V1 V2 V3 V4 V5 V6 V7 V8(screening before after
visit)
bull Exploratory studybull Danger of Type II error of missing a real association arguably greater than
danger of Type I error of highlighting a spurious association
4
DATA
bull Patient socio-demographic and baseline
bull MRI
bull Viral and biomarkers
bull Disability
bull Quality of life
bull Laboratory safety tests
2
Patient socio-demographic and baseline
N mean min maxITTAge at baselineyrs 20 4073 3115 5299Height cm 18 16904 15600 18300Weight kg 18 7873 5190 10970Baseline EDSS 20 240 000 400Number of relapses in past year 20 150 100 300
PPAge at baselineyrs 16 4162 3115 5299Height cm 14 16891 15600 18000Weight kg 14 7790 5190 10830Baseline EDSS 16 225 000 350Number of relapses in past year 16 144 100 300
6
Patient adherenceITT PP
Visit mean
6 Number of tablets dispensed 60 60Number of tablets returned 235 269Adherence percentagea 9608 9552
7 Number of tablets dispensed 63 6375Number of tablets returned 72 675Adherence percentagea 88 8875
8 Number of tablets dispensed 597 5963Number of tablets returned 81 863Adherence percentagea 824 805
Over all three visits Number of tablets dispensed 609 6113Number of tablets returned 588 602Adherence percentagea 8883 8826
a100(tablets dispensed - tablets returned)tablets dispensed
7
MRI Total T1 Gd-enhancing lesionsTotal T1 (Gad enhanced) lesion rates
Before (visits 34 and 5) After (visits 67 and 8) Within-patient changea
Mean monthly Mean monthly Change Weightedrate rate in rate rate ratiob
ITT (n=20) 289 302 012 103PP (n=16) 251 233 -018 092
aChanges calculated after-before or afterbeforebRatios averaged on log scale before back-transforming substituting 01 for zero rates Weighted ratios pooled byweighting for total subject counts
Poisson regression analysis after vs before
ITT rate ratio after vs before as 104(95 CI 85 129) P=0681PP rate ratio after vs before as093(95 CI 072 120) P=0577
Poisson regression analysis gradient after vs gradient beforeITT test of difference in gradients P=0659PP test of difference in gradients P=0463
8
MRI New T1 Gd-enhancing lesionsNew T1 (Gad enhanced) lesion rates
Before (visits 34 and 5) After (visits 67 and 8) Within-patient changea
Mean monthly Mean monthly Changerate rate in rate
ITT (n=20) 143 167 023PP (n=16) 098 115 017
aChanges calculated after-before or afterbefore
Poisson regression analysis after vs beforeITT rate ratio after vs before as 116(95 CI 087 155) P=0314PP rate ratio after vs before as 116 (95 CI079 172) P=0456
Poisson regression analysis gradient after vs gradient beforeITT test of difference in gradients P=0562PP test of difference in gradients P=0137
9
MRI T1 Gd lesions
ITT Patients in order of difference in rate
010008010019010015010001010016010009010028010027010003010005010007010010010011010013010014010017010023
010012010020010024
-4 -2 0 2difference in rate lesions per month
Difference after - before
4
13
MRI lesions summary
Lesion outcomes provide no statistical evidence consistent with aneffect of raltegravir
14
Viral and biomarker data Before vs AfterBaselines (visit 2) Before (345) After (678)
Variable N mean sd N mean sd mean sd
MSRV A CtGAPDH Ct(dim-less) 20 094 01 20 093 007 20 092 007MSRV M CtGAPDH Ct(dim-less) 20 133 006 20 133 006 20 132 007TB HE23 CtGAPDH Ct(dim-less) 20 127 014 20 124 013 20 124 013HERV-W A CtGAPDH Ct(dim-less) 20 116 016 20 118 01 20 118 009HERV-W M CtGAPDH Ct(dim-less) 20 147 021 20 144 015 20 145 013TB HE1113 CtGAPDH Ct(dim-less) 20 127 01 20 128 006 20 129 006IL-8 pgmL 20 2805 8683 20 852 232 20 934 286HERV-WMSRV Gag Flix B cells (d-less) 13 118 011 19 119 01 18 115 006HERV-HF Gag Flix B cells (d-less) 12 114 01 17 108 007 20 112 011HERV-HF Env (H1) Flix B cells (d-less) 11 112 007 18 106 005 17 11 008HERV-HF Env (H3) Flix B cells (d-less) 19 156 024 20 147 015 20 152 016HERV-HF Env (W1) Flix B cells (d-less) 18 131 013 20 123 01 20 123 01HERV-HF Env (W3) Flix B cells (d-less) 17 125 015 20 122 009 20 124 017prop of B cells in sample () 19 914 38 20 859 306 20 905 379prop of monocytes in sample () 19 1533 92 20 1808 641 20 1609 623
HERV-WMSRV Gag Flix monocytes (d-less) 11 114 009 16 116 005 15 115 007MSRV F Gag Flix monocytes (d-less) 13 116 01 17 111 005 16 122 019Env (H1) Flix monocytes (d-less) 15 115 012 18 112 008 17 115 006Env (H3) Flix monocytes (d-less) 19 159 018 20 155 019 20 157 02Env (W1) Flix monocytes (d-less) 15 115 01 19 111 007 19 108 005Env (W3) Flix monocytes (d-less) 13 116 008 19 112 007 18 116 009HCRP ngmL 20 178383 21238 20 189945 176902 20 243527 224115CD163 ngmL 20 45667 15463 20 4239 10536 20 44257 12468EBV Copiesmicrolitre 16 21371 79687 16 238 6672 15 668 21274
Viral and biomarker data Before vs AfterHERV-WMSRV Gag Flix B cellsSignificant drop in means in ITT and PPNo significant change in gradient but steeper gradient before
HERV-WMSRV Gag Flix B cellsPP Individual subjects and fitted line
Significant overall drop notattributable to intervention
Similar story for
Env (W1) Flix monocytes
2 3 4 5 6 7 8monthly visits
Solid line fitted by modelA significant drop in means cannot be explained by intervention since decline is steeper before
17
MRI PP Persisting T1 Gd-enhancing lesionsBefore After Within-patient changea
Mean rate Mean rate Change in ratePP (n=16) 153 119 -034
80 of total reductionoccurs before theintervention
attributing the overallreduction to the interventioneven if reduction weresignificant would not be
-013 (P=0469)
P=0762-003 (P=0835)
credible
11
MRI T2 lesions
T2 lesion counts Observed at visits 5 (before) and 8 (after)
Before After Within-patient changea
Mean count Mean count Mean count changeP=0472
weighted ratiob
ITT 445PP 313
465 020P=0462331 019
105107
aChanges calculated after-before or afterbeforebWithin-patient ratios averaged on log scale before back transforming substituting 01 for zero counts Weighted meanratios pooled on log scale by weighting for lesion counts
12
Viral and biomarker data change vs T1 Gd lesion changePositive correlation
HERV-WMSRV Gag Flix B cells r=046 P=0057 ITT r=048 P=0086 PP
9
10
Additional analysis
A higher T1 Gd lesioncount at any visit isassociated with higher714
1619
28 27
20
1712
values of HERV-WMSRVGag Flix B cells at that visitP=0029 (ITT)
15
8 1
-3 -2 -1 0 1 2change in T1 lesion rate
Suggestion of decrease in HERV-WMSRV Gag Flix B cells associated with decrease in Gd-enhanced lesion rate PP r=-048 P=0086
23
Patients with a decrease in lesion count (eg patient 8) tend to have a decrease or a greater decrease in the biomarker than patients with an increase in lesion count (eg patient 20)
Viral and biomarker data summary
Some statistically significant changes in gradient before vs after wereobserved However whether these are consistent with an effect ofraltegravir depends partly on biological plausibility
A very small number of statistically significant correlations wereobserved between changes in these measures and changes in T1 Gdlesion counts their interpretation is again heavily dependent onbiological plausibility
Because of the number of measurestests any significant resultsshould be treated with caution Since results are singled out on thebasis of statistical significance rather than prior hypothesis Type Ierror is likely
25
Viral and biomarker data Before vs AfterHCRP ngmLSignificant increase in means in ITT and PPNo significant change in (positive) gradient similar slightly steeper gradient after
ITT------------------------------------------------------------------------------
| gradient SE z P-value [95 Conf Interval]-------------+----------------------------------------------------------------
before | 1221482 1495142 082 0414 -1708943 4151908after | 1406076 1495142 094 0347 -1524349 4336501
------------------------------------------------------------------------------
Significant overall increase not credibly attributable to intervention since the gradientbefore though non-significant is too similar to the gradient after intervention
18
Quality of life data summary
A number of measures showed statistically significant improvementsin well-being or a slowing of deterioration in the period aftercompared to before intervention
Although consistent with an effect of raltegravir this is most crediblyattributable to the placebo effect of patients receiving an unblindedintervention rather than to any action of the drug
The study design of not having a control group or a cross-over designmitigated against determining the possible effect of the interventionon Q0L
31
Viral and biomarker data Before vs AfterEnv (W3) Flix monocytesNon-significant decline before becomes borderline significant increase afterand significant change in gradient
Env (W3) Flix monocytesITT Individual subjects and fitted line
-002 P=0200
As before biologicalplausibility important bothfor change displayed andfor negative correlation
with Gd T1 lesions
+002 P=0055
P=0047
2 3 4 5 6 7 8monthly visits
Significant change in gradient in ITT (P=0047) and borderline in PP (P=0089)Change in means after - before negatively correlated withchange in rate of Gd enhancing T1 lesions r=-054 P=0015
21
Disability data
Summary of changes after-before
N mean sdEDSS 20 014 045 Neither change nor gradient change significant
MSFC 20 023 028 [Both change and change in gradient significant]9HPT peg speed 20 0003 0003 Highly significant improvementWalk speed (fs) 20 -004 047 Neither change nor gradient change significantPASAT score 20 466 521 Highly significant improvement
PASAT------------------------------------------------------------------------------
| gradient SE z P-value [95 Conf Interval]-------------+----------------------------------------------------------------
before | 2478954 4594816 540 0000 1578387 3379522after | 6377749 4534625 141 0160 -2509954 1526545
------------------------------------------------------------------------------
bull There is a significant gradient changebull But rate of improvement substantially greater before than after intervention
27
Quality of life data
Summary of changes after-before
change inITT n means
PQ - SF36 - Physical Functional Score (PF) 20 -092
PQ - SF36 - Role-Physical Scale (RP) 20 -948PQ - SF36 - Bodily Pain Scale (BP) 20 -542
PQ - SF36 - General Health Scale (GH) 20 -467
PQ - SF36 - Vitality Scale (VT) 20 506 PQ - SF36 - Social Functioning Scale (SF) 20 245 PQ - SF36 - Role Emotional Scale (RE) 20 -862 no statistically significant changes
PQ - SF36 - Mental Health Scale (MH) 20 572 PQ - PFA - Patient Fatigue Assessment 20 -151PQ - PPA - Patient Pain Assessment 19 407PQ - MSIS - Total Score 20 -210 no statistically significant changes
PQ - MSWS-12 - MSWS Total Score 20 -035
30
Quality of life dataSummary of changes after-before
change inITT n means
PQ - SF36 - Physical Functional Score (PF) 20 -092PQ - SF36 - Role-Physical Scale (RP) 20 -948PQ - SF36 - Bodily Pain Scale (BP) 20 -542PQ - SF36 - General Health Scale (GH) 20 -467PQ - SF36 - Vitality Scale (VT) 20 506
+ = improvement
PQ - SF36 - Social Functioning Scale (SF) 20 245PQ - SF36 - Role Emotional Scale (RE) 20 -862PQ - SF36 - Mental Health Scale (MH) 20 572PQ - PFA - Patient Fatigue Assessment 20 -151PQ - PPA - Patient Pain Assessment 19 407 - = improvementPQ - MSIS - Total Score 20 -210PQ - MSWS-12 - MSWS Total Score 20 -035
29
Disability data
Summary of changes after-before
N mean sdEDSS 20 014 045 Neither change nor gradient change significant
MSFC 20 023 028 [Both change and change in gradient significant]9HPT peg speed 20 0003 0003 Highly significant improvementWalk speed (fs) 20 -004 047 Neither change nor gradient change significantPASAT score 20 466 521
9HPT peg speed------------------------------------------------------------------------------
ITT | gradient SE z P-value [95 Conf Interval]-------------+----------------------------------------------------------------
before | 0009916 0002372 418 0000 0005267 0014565after | 000545 0002363 231 0021 0000818 0010082
------------------------------------------------------------------------------
bull No significant gradient changebull But rate of improvement substantially greater before than after intervention
26
Acknowledgementsbull Unit for Healthcare Epidemiology Oxford
ndash Raph Goldacrendash Michael Goldacrendash David Yeates
bull QMULbull Gavin Giovannoni
bull The Albion Centrebull Hubert Maruszak
bull UCLbull Robin Weiss
Laboratory safety tests
32
Laboratory safety tests significant changes
ITT change gradient gradient change inbefore after gradient
ADJUSTED CALCIUM SERUM +002 -000003 +0008 P=0406 increase could bep=0025 pgt09 p=0149 due intervention
CHLORIDE SERUM -075 +014 -031 p=0194 decrease could bep=0055 p=0503 p=0103 due to intervention
CHOLESTEROL SERUM +028 +008 +003 p=0437 increase notp=0004 p=0059 p=0521 plausibly duehellip
GLUCOSE PLASMA -018 +008 -015 p=0072 gradient changep=0196 p=0284 p=0037 could be duehellip
LDL CHOLESTEROL SERUM +017 +006 +0004 p=0432 increase notp=0018 p=0162 pgt09 plausibly duehellip
PLATELET COUNT +686 -027 +259 p=0352 increase could bep=0040 p=0880 p=0129 duehellip
WHITE BLOOD COUNT PP +022 +006 +010 p=0827 increase notp=0049 p=0579 p=0331 plausibly due
33
- Diapositive numeacutero 1
- Diapositive numeacutero 2
- Dr Jean-Martin Charcot
- Diapositive numeacutero 4
- Diapositive numeacutero 5
- Diapositive numeacutero 6
- Viruses and MS
- Are human endogenous retroviruses pathogenic An approach to testing the hypothesis
- How HERVs may induce autoimmune response
- Diapositive numeacutero 10
- Diapositive numeacutero 11
- Diapositive numeacutero 12
- Diapositive numeacutero 13
- How many cases of HIV and MS have been reported
- What do cohort studies show
- What is the Risk of Developing Multiple Sclerosis if you have HIV and are on HIV Anti-retroviral therapy
- Methods
- Diapositive numeacutero 18
- Diapositive numeacutero 19
- NHS Data on UK Healthcare events 1999-2011
- NHS Cohort gt One year after Exposure (HIV) Contact
- Diapositive numeacutero 22
- The CHARCOT PROJECTINSPIRE Isentress (Raltegravir)Pilot Study in Relapsing MS
- INSPIRE Design
- INSPIRE Design 2
- Diapositive numeacutero 26
- Diapositive numeacutero 27
- Diapositive numeacutero 28
- Diapositive numeacutero 29
- Diapositive numeacutero 30
- Diapositive numeacutero 31
- Diapositive numeacutero 32
- Diapositive numeacutero 34
- Diapositive numeacutero 35
- Diapositive numeacutero 36
- Diapositive numeacutero 37
- Diapositive numeacutero 38
- Diapositive numeacutero 39
- Diapositive numeacutero 40
- Diapositive numeacutero 41
- Diapositive numeacutero 42
- Diapositive numeacutero 43
- Diapositive numeacutero 44
- Diapositive numeacutero 45
- Diapositive numeacutero 47
- Diapositive numeacutero 48
- Diapositive numeacutero 49
- Diapositive numeacutero 50
- Acknowledgements
- Diapositive numeacutero 52
- Diapositive numeacutero 53
- Diapositive numeacutero 54
-
| HIV b4 autos | |||||||||||||||||||
| exposure | outcome | obs in ref cohort | obs | exp | rate ratio | low CI | upr CI | chi-sq | p-value | ||||||||||
| HIV | Addisons disease | 1107 | 13 | 15 | 881 | 468 | 1513 | 814 | 0 | ||||||||||
| HIV | Ankylosing spondylitis | 1686 | 0 | 22 | 0 | 0 | 164 | 136 | 02435 | ||||||||||
| HIV | Autoimmune haemolytic anaemia | 911 | 3 | 05 | 638 | 131 | 187 | 873 | 00031 | ||||||||||
| HIV | Chronic active hepatitis | 435 | 3 | 03 | 915 | 188 | 2693 | 143 | 00002 | ||||||||||
| HIV | Coeliac disease | 4991 | 3 | 76 | 04 | 008 | 116 | 218 | 01395 | ||||||||||
| HIV | Crohns disease | 6362 | 4 | 119 | 034 | 009 | 086 | 457 | 00325 | ||||||||||
| HIV | ITP | 2504 | 11 | 27 | 411 | 205 | 737 | 2278 | 0 | ||||||||||
| HIV | Myxoedema | 142597 | 33 | 977 | 034 | 023 | 047 | 4221 | 0 | ||||||||||
| HIV | Pernicious anaemia | 11732 | 2 | 49 | 04 | 005 | 146 | 121 | 02717 | ||||||||||
| HIV | Polymyositis | 395 | 3 | 05 | 622 | 128 | 183 | 837 | 00038 | ||||||||||
| HIV | Primary biliary cirrhosis | 1605 | 1 | 12 | 086 | 002 | 482 | 01 | 07507 | ||||||||||
| HIV | Psoriasis | 9262 | 7 | 129 | 054 | 022 | 111 | 229 | 01305 | ||||||||||
| HIV | Rheumatoid arthritis | 37706 | 11 | 28 | 039 | 02 | 07 | 969 | 00018 | ||||||||||
| HIV | Scleroderma | 1581 | 1 | 15 | 066 | 002 | 369 | 0 | 09916 | ||||||||||
| HIV | Sjogrens syndrome | 3640 | 0 | 31 | 0 | 0 | 12 | 215 | 01424 | ||||||||||
| HIV | Systematic lupus erythematosus | 3109 | 9 | 73 | 123 | 056 | 233 | 019 | 06667 | ||||||||||
| HIV | Thyrotoxicosis | 20268 | 16 | 193 | 083 | 047 | 135 | 04 | 05258 | ||||||||||
| HIV | Ulcerative colitis | 9235 | 5 | 155 | 032 | 01 | 075 | 65 | 00108 |

The CHARCOT PROJECTINSPIRE
Isentress (Raltegravir)Pilot Study in Relapsing MS
bull Aims to investigate the concept of HERV+-EBV or herpes viruses as an etiology or trigger for MS
bull Disease controlling rather than disease modifying therapy
INSPIRE Design
bull Pilot study enrolling patients with active RRMS as defined by +ve Gd-enhanced MRI or documented relapse in previous 12 months
bull Baseline (3 months) followed by treatment (3 months)
bull Open label treatment phase with Raltegravir 400mg twice a day
INSPIRE Design 2bull 1deg Outcome number and rate of development
of Gd-enhanced lesionsbull 2deg outcomes are disability and quality-of-lifeStatistical considerations19 subjects need to complete trial to achieve 95 significance with 80 power for a 40 reduction in MS lesions compared with baseline (according to Sormani et al)
Trial design
change in gradient
change(in means)
V1 V2(screening before
visit)
V3 V4 V5 V6 V7 V8after
Raltegravirdispensed
A statistically significantchange in means is not inthis situation consistent
with a reduction inoutcome values due tointervention
3
Trial design
QOL QOL QOL QOL QOL QOL QOL
MSFC MSFC MSFC MSFC MSFC MSFC MSFCEDSS EDSS EDSS EDSS EDSS
blood blood blood blood blood blood blood blood
MRI MRI MRI MRI MRI MRI MRI
V1 V2 V3 V4 V5 V6 V7 V8(screening before after
visit)
bull Exploratory studybull Danger of Type II error of missing a real association arguably greater than
danger of Type I error of highlighting a spurious association
4
DATA
bull Patient socio-demographic and baseline
bull MRI
bull Viral and biomarkers
bull Disability
bull Quality of life
bull Laboratory safety tests
2
Patient socio-demographic and baseline
N mean min maxITTAge at baselineyrs 20 4073 3115 5299Height cm 18 16904 15600 18300Weight kg 18 7873 5190 10970Baseline EDSS 20 240 000 400Number of relapses in past year 20 150 100 300
PPAge at baselineyrs 16 4162 3115 5299Height cm 14 16891 15600 18000Weight kg 14 7790 5190 10830Baseline EDSS 16 225 000 350Number of relapses in past year 16 144 100 300
6
Patient adherenceITT PP
Visit mean
6 Number of tablets dispensed 60 60Number of tablets returned 235 269Adherence percentagea 9608 9552
7 Number of tablets dispensed 63 6375Number of tablets returned 72 675Adherence percentagea 88 8875
8 Number of tablets dispensed 597 5963Number of tablets returned 81 863Adherence percentagea 824 805
Over all three visits Number of tablets dispensed 609 6113Number of tablets returned 588 602Adherence percentagea 8883 8826
a100(tablets dispensed - tablets returned)tablets dispensed
7
MRI Total T1 Gd-enhancing lesionsTotal T1 (Gad enhanced) lesion rates
Before (visits 34 and 5) After (visits 67 and 8) Within-patient changea
Mean monthly Mean monthly Change Weightedrate rate in rate rate ratiob
ITT (n=20) 289 302 012 103PP (n=16) 251 233 -018 092
aChanges calculated after-before or afterbeforebRatios averaged on log scale before back-transforming substituting 01 for zero rates Weighted ratios pooled byweighting for total subject counts
Poisson regression analysis after vs before
ITT rate ratio after vs before as 104(95 CI 85 129) P=0681PP rate ratio after vs before as093(95 CI 072 120) P=0577
Poisson regression analysis gradient after vs gradient beforeITT test of difference in gradients P=0659PP test of difference in gradients P=0463
8
MRI New T1 Gd-enhancing lesionsNew T1 (Gad enhanced) lesion rates
Before (visits 34 and 5) After (visits 67 and 8) Within-patient changea
Mean monthly Mean monthly Changerate rate in rate
ITT (n=20) 143 167 023PP (n=16) 098 115 017
aChanges calculated after-before or afterbefore
Poisson regression analysis after vs beforeITT rate ratio after vs before as 116(95 CI 087 155) P=0314PP rate ratio after vs before as 116 (95 CI079 172) P=0456
Poisson regression analysis gradient after vs gradient beforeITT test of difference in gradients P=0562PP test of difference in gradients P=0137
9
MRI T1 Gd lesions
ITT Patients in order of difference in rate
010008010019010015010001010016010009010028010027010003010005010007010010010011010013010014010017010023
010012010020010024
-4 -2 0 2difference in rate lesions per month
Difference after - before
4
13
MRI lesions summary
Lesion outcomes provide no statistical evidence consistent with aneffect of raltegravir
14
Viral and biomarker data Before vs AfterBaselines (visit 2) Before (345) After (678)
Variable N mean sd N mean sd mean sd
MSRV A CtGAPDH Ct(dim-less) 20 094 01 20 093 007 20 092 007MSRV M CtGAPDH Ct(dim-less) 20 133 006 20 133 006 20 132 007TB HE23 CtGAPDH Ct(dim-less) 20 127 014 20 124 013 20 124 013HERV-W A CtGAPDH Ct(dim-less) 20 116 016 20 118 01 20 118 009HERV-W M CtGAPDH Ct(dim-less) 20 147 021 20 144 015 20 145 013TB HE1113 CtGAPDH Ct(dim-less) 20 127 01 20 128 006 20 129 006IL-8 pgmL 20 2805 8683 20 852 232 20 934 286HERV-WMSRV Gag Flix B cells (d-less) 13 118 011 19 119 01 18 115 006HERV-HF Gag Flix B cells (d-less) 12 114 01 17 108 007 20 112 011HERV-HF Env (H1) Flix B cells (d-less) 11 112 007 18 106 005 17 11 008HERV-HF Env (H3) Flix B cells (d-less) 19 156 024 20 147 015 20 152 016HERV-HF Env (W1) Flix B cells (d-less) 18 131 013 20 123 01 20 123 01HERV-HF Env (W3) Flix B cells (d-less) 17 125 015 20 122 009 20 124 017prop of B cells in sample () 19 914 38 20 859 306 20 905 379prop of monocytes in sample () 19 1533 92 20 1808 641 20 1609 623
HERV-WMSRV Gag Flix monocytes (d-less) 11 114 009 16 116 005 15 115 007MSRV F Gag Flix monocytes (d-less) 13 116 01 17 111 005 16 122 019Env (H1) Flix monocytes (d-less) 15 115 012 18 112 008 17 115 006Env (H3) Flix monocytes (d-less) 19 159 018 20 155 019 20 157 02Env (W1) Flix monocytes (d-less) 15 115 01 19 111 007 19 108 005Env (W3) Flix monocytes (d-less) 13 116 008 19 112 007 18 116 009HCRP ngmL 20 178383 21238 20 189945 176902 20 243527 224115CD163 ngmL 20 45667 15463 20 4239 10536 20 44257 12468EBV Copiesmicrolitre 16 21371 79687 16 238 6672 15 668 21274
Viral and biomarker data Before vs AfterHERV-WMSRV Gag Flix B cellsSignificant drop in means in ITT and PPNo significant change in gradient but steeper gradient before
HERV-WMSRV Gag Flix B cellsPP Individual subjects and fitted line
Significant overall drop notattributable to intervention
Similar story for
Env (W1) Flix monocytes
2 3 4 5 6 7 8monthly visits
Solid line fitted by modelA significant drop in means cannot be explained by intervention since decline is steeper before
17
MRI PP Persisting T1 Gd-enhancing lesionsBefore After Within-patient changea
Mean rate Mean rate Change in ratePP (n=16) 153 119 -034
80 of total reductionoccurs before theintervention
attributing the overallreduction to the interventioneven if reduction weresignificant would not be
-013 (P=0469)
P=0762-003 (P=0835)
credible
11
MRI T2 lesions
T2 lesion counts Observed at visits 5 (before) and 8 (after)
Before After Within-patient changea
Mean count Mean count Mean count changeP=0472
weighted ratiob
ITT 445PP 313
465 020P=0462331 019
105107
aChanges calculated after-before or afterbeforebWithin-patient ratios averaged on log scale before back transforming substituting 01 for zero counts Weighted meanratios pooled on log scale by weighting for lesion counts
12
Viral and biomarker data change vs T1 Gd lesion changePositive correlation
HERV-WMSRV Gag Flix B cells r=046 P=0057 ITT r=048 P=0086 PP
9
10
Additional analysis
A higher T1 Gd lesioncount at any visit isassociated with higher714
1619
28 27
20
1712
values of HERV-WMSRVGag Flix B cells at that visitP=0029 (ITT)
15
8 1
-3 -2 -1 0 1 2change in T1 lesion rate
Suggestion of decrease in HERV-WMSRV Gag Flix B cells associated with decrease in Gd-enhanced lesion rate PP r=-048 P=0086
23
Patients with a decrease in lesion count (eg patient 8) tend to have a decrease or a greater decrease in the biomarker than patients with an increase in lesion count (eg patient 20)
Viral and biomarker data summary
Some statistically significant changes in gradient before vs after wereobserved However whether these are consistent with an effect ofraltegravir depends partly on biological plausibility
A very small number of statistically significant correlations wereobserved between changes in these measures and changes in T1 Gdlesion counts their interpretation is again heavily dependent onbiological plausibility
Because of the number of measurestests any significant resultsshould be treated with caution Since results are singled out on thebasis of statistical significance rather than prior hypothesis Type Ierror is likely
25
Viral and biomarker data Before vs AfterHCRP ngmLSignificant increase in means in ITT and PPNo significant change in (positive) gradient similar slightly steeper gradient after
ITT------------------------------------------------------------------------------
| gradient SE z P-value [95 Conf Interval]-------------+----------------------------------------------------------------
before | 1221482 1495142 082 0414 -1708943 4151908after | 1406076 1495142 094 0347 -1524349 4336501
------------------------------------------------------------------------------
Significant overall increase not credibly attributable to intervention since the gradientbefore though non-significant is too similar to the gradient after intervention
18
Quality of life data summary
A number of measures showed statistically significant improvementsin well-being or a slowing of deterioration in the period aftercompared to before intervention
Although consistent with an effect of raltegravir this is most crediblyattributable to the placebo effect of patients receiving an unblindedintervention rather than to any action of the drug
The study design of not having a control group or a cross-over designmitigated against determining the possible effect of the interventionon Q0L
31
Viral and biomarker data Before vs AfterEnv (W3) Flix monocytesNon-significant decline before becomes borderline significant increase afterand significant change in gradient
Env (W3) Flix monocytesITT Individual subjects and fitted line
-002 P=0200
As before biologicalplausibility important bothfor change displayed andfor negative correlation
with Gd T1 lesions
+002 P=0055
P=0047
2 3 4 5 6 7 8monthly visits
Significant change in gradient in ITT (P=0047) and borderline in PP (P=0089)Change in means after - before negatively correlated withchange in rate of Gd enhancing T1 lesions r=-054 P=0015
21
Disability data
Summary of changes after-before
N mean sdEDSS 20 014 045 Neither change nor gradient change significant
MSFC 20 023 028 [Both change and change in gradient significant]9HPT peg speed 20 0003 0003 Highly significant improvementWalk speed (fs) 20 -004 047 Neither change nor gradient change significantPASAT score 20 466 521 Highly significant improvement
PASAT------------------------------------------------------------------------------
| gradient SE z P-value [95 Conf Interval]-------------+----------------------------------------------------------------
before | 2478954 4594816 540 0000 1578387 3379522after | 6377749 4534625 141 0160 -2509954 1526545
------------------------------------------------------------------------------
bull There is a significant gradient changebull But rate of improvement substantially greater before than after intervention
27
Quality of life data
Summary of changes after-before
change inITT n means
PQ - SF36 - Physical Functional Score (PF) 20 -092
PQ - SF36 - Role-Physical Scale (RP) 20 -948PQ - SF36 - Bodily Pain Scale (BP) 20 -542
PQ - SF36 - General Health Scale (GH) 20 -467
PQ - SF36 - Vitality Scale (VT) 20 506 PQ - SF36 - Social Functioning Scale (SF) 20 245 PQ - SF36 - Role Emotional Scale (RE) 20 -862 no statistically significant changes
PQ - SF36 - Mental Health Scale (MH) 20 572 PQ - PFA - Patient Fatigue Assessment 20 -151PQ - PPA - Patient Pain Assessment 19 407PQ - MSIS - Total Score 20 -210 no statistically significant changes
PQ - MSWS-12 - MSWS Total Score 20 -035
30
Quality of life dataSummary of changes after-before
change inITT n means
PQ - SF36 - Physical Functional Score (PF) 20 -092PQ - SF36 - Role-Physical Scale (RP) 20 -948PQ - SF36 - Bodily Pain Scale (BP) 20 -542PQ - SF36 - General Health Scale (GH) 20 -467PQ - SF36 - Vitality Scale (VT) 20 506
+ = improvement
PQ - SF36 - Social Functioning Scale (SF) 20 245PQ - SF36 - Role Emotional Scale (RE) 20 -862PQ - SF36 - Mental Health Scale (MH) 20 572PQ - PFA - Patient Fatigue Assessment 20 -151PQ - PPA - Patient Pain Assessment 19 407 - = improvementPQ - MSIS - Total Score 20 -210PQ - MSWS-12 - MSWS Total Score 20 -035
29
Disability data
Summary of changes after-before
N mean sdEDSS 20 014 045 Neither change nor gradient change significant
MSFC 20 023 028 [Both change and change in gradient significant]9HPT peg speed 20 0003 0003 Highly significant improvementWalk speed (fs) 20 -004 047 Neither change nor gradient change significantPASAT score 20 466 521
9HPT peg speed------------------------------------------------------------------------------
ITT | gradient SE z P-value [95 Conf Interval]-------------+----------------------------------------------------------------
before | 0009916 0002372 418 0000 0005267 0014565after | 000545 0002363 231 0021 0000818 0010082
------------------------------------------------------------------------------
bull No significant gradient changebull But rate of improvement substantially greater before than after intervention
26
Acknowledgementsbull Unit for Healthcare Epidemiology Oxford
ndash Raph Goldacrendash Michael Goldacrendash David Yeates
bull QMULbull Gavin Giovannoni
bull The Albion Centrebull Hubert Maruszak
bull UCLbull Robin Weiss
Laboratory safety tests
32
Laboratory safety tests significant changes
ITT change gradient gradient change inbefore after gradient
ADJUSTED CALCIUM SERUM +002 -000003 +0008 P=0406 increase could bep=0025 pgt09 p=0149 due intervention
CHLORIDE SERUM -075 +014 -031 p=0194 decrease could bep=0055 p=0503 p=0103 due to intervention
CHOLESTEROL SERUM +028 +008 +003 p=0437 increase notp=0004 p=0059 p=0521 plausibly duehellip
GLUCOSE PLASMA -018 +008 -015 p=0072 gradient changep=0196 p=0284 p=0037 could be duehellip
LDL CHOLESTEROL SERUM +017 +006 +0004 p=0432 increase notp=0018 p=0162 pgt09 plausibly duehellip
PLATELET COUNT +686 -027 +259 p=0352 increase could bep=0040 p=0880 p=0129 duehellip
WHITE BLOOD COUNT PP +022 +006 +010 p=0827 increase notp=0049 p=0579 p=0331 plausibly due
33
- Diapositive numeacutero 1
- Diapositive numeacutero 2
- Dr Jean-Martin Charcot
- Diapositive numeacutero 4
- Diapositive numeacutero 5
- Diapositive numeacutero 6
- Viruses and MS
- Are human endogenous retroviruses pathogenic An approach to testing the hypothesis
- How HERVs may induce autoimmune response
- Diapositive numeacutero 10
- Diapositive numeacutero 11
- Diapositive numeacutero 12
- Diapositive numeacutero 13
- How many cases of HIV and MS have been reported
- What do cohort studies show
- What is the Risk of Developing Multiple Sclerosis if you have HIV and are on HIV Anti-retroviral therapy
- Methods
- Diapositive numeacutero 18
- Diapositive numeacutero 19
- NHS Data on UK Healthcare events 1999-2011
- NHS Cohort gt One year after Exposure (HIV) Contact
- Diapositive numeacutero 22
- The CHARCOT PROJECTINSPIRE Isentress (Raltegravir)Pilot Study in Relapsing MS
- INSPIRE Design
- INSPIRE Design 2
- Diapositive numeacutero 26
- Diapositive numeacutero 27
- Diapositive numeacutero 28
- Diapositive numeacutero 29
- Diapositive numeacutero 30
- Diapositive numeacutero 31
- Diapositive numeacutero 32
- Diapositive numeacutero 34
- Diapositive numeacutero 35
- Diapositive numeacutero 36
- Diapositive numeacutero 37
- Diapositive numeacutero 38
- Diapositive numeacutero 39
- Diapositive numeacutero 40
- Diapositive numeacutero 41
- Diapositive numeacutero 42
- Diapositive numeacutero 43
- Diapositive numeacutero 44
- Diapositive numeacutero 45
- Diapositive numeacutero 47
- Diapositive numeacutero 48
- Diapositive numeacutero 49
- Diapositive numeacutero 50
- Acknowledgements
- Diapositive numeacutero 52
- Diapositive numeacutero 53
- Diapositive numeacutero 54
-

Trial design
change in gradient
change(in means)
V1 V2(screening before
visit)
V3 V4 V5 V6 V7 V8after
Raltegravirdispensed
A statistically significantchange in means is not inthis situation consistent
with a reduction inoutcome values due tointervention
3
Trial design
QOL QOL QOL QOL QOL QOL QOL
MSFC MSFC MSFC MSFC MSFC MSFC MSFCEDSS EDSS EDSS EDSS EDSS
blood blood blood blood blood blood blood blood
MRI MRI MRI MRI MRI MRI MRI
V1 V2 V3 V4 V5 V6 V7 V8(screening before after
visit)
bull Exploratory studybull Danger of Type II error of missing a real association arguably greater than
danger of Type I error of highlighting a spurious association
4
DATA
bull Patient socio-demographic and baseline
bull MRI
bull Viral and biomarkers
bull Disability
bull Quality of life
bull Laboratory safety tests
2
Patient socio-demographic and baseline
N mean min maxITTAge at baselineyrs 20 4073 3115 5299Height cm 18 16904 15600 18300Weight kg 18 7873 5190 10970Baseline EDSS 20 240 000 400Number of relapses in past year 20 150 100 300
PPAge at baselineyrs 16 4162 3115 5299Height cm 14 16891 15600 18000Weight kg 14 7790 5190 10830Baseline EDSS 16 225 000 350Number of relapses in past year 16 144 100 300
6
Patient adherenceITT PP
Visit mean
6 Number of tablets dispensed 60 60Number of tablets returned 235 269Adherence percentagea 9608 9552
7 Number of tablets dispensed 63 6375Number of tablets returned 72 675Adherence percentagea 88 8875
8 Number of tablets dispensed 597 5963Number of tablets returned 81 863Adherence percentagea 824 805
Over all three visits Number of tablets dispensed 609 6113Number of tablets returned 588 602Adherence percentagea 8883 8826
a100(tablets dispensed - tablets returned)tablets dispensed
7
MRI Total T1 Gd-enhancing lesionsTotal T1 (Gad enhanced) lesion rates
Before (visits 34 and 5) After (visits 67 and 8) Within-patient changea
Mean monthly Mean monthly Change Weightedrate rate in rate rate ratiob
ITT (n=20) 289 302 012 103PP (n=16) 251 233 -018 092
aChanges calculated after-before or afterbeforebRatios averaged on log scale before back-transforming substituting 01 for zero rates Weighted ratios pooled byweighting for total subject counts
Poisson regression analysis after vs before
ITT rate ratio after vs before as 104(95 CI 85 129) P=0681PP rate ratio after vs before as093(95 CI 072 120) P=0577
Poisson regression analysis gradient after vs gradient beforeITT test of difference in gradients P=0659PP test of difference in gradients P=0463
8
MRI New T1 Gd-enhancing lesionsNew T1 (Gad enhanced) lesion rates
Before (visits 34 and 5) After (visits 67 and 8) Within-patient changea
Mean monthly Mean monthly Changerate rate in rate
ITT (n=20) 143 167 023PP (n=16) 098 115 017
aChanges calculated after-before or afterbefore
Poisson regression analysis after vs beforeITT rate ratio after vs before as 116(95 CI 087 155) P=0314PP rate ratio after vs before as 116 (95 CI079 172) P=0456
Poisson regression analysis gradient after vs gradient beforeITT test of difference in gradients P=0562PP test of difference in gradients P=0137
9
MRI T1 Gd lesions
ITT Patients in order of difference in rate
010008010019010015010001010016010009010028010027010003010005010007010010010011010013010014010017010023
010012010020010024
-4 -2 0 2difference in rate lesions per month
Difference after - before
4
13
MRI lesions summary
Lesion outcomes provide no statistical evidence consistent with aneffect of raltegravir
14
Viral and biomarker data Before vs AfterBaselines (visit 2) Before (345) After (678)
Variable N mean sd N mean sd mean sd
MSRV A CtGAPDH Ct(dim-less) 20 094 01 20 093 007 20 092 007MSRV M CtGAPDH Ct(dim-less) 20 133 006 20 133 006 20 132 007TB HE23 CtGAPDH Ct(dim-less) 20 127 014 20 124 013 20 124 013HERV-W A CtGAPDH Ct(dim-less) 20 116 016 20 118 01 20 118 009HERV-W M CtGAPDH Ct(dim-less) 20 147 021 20 144 015 20 145 013TB HE1113 CtGAPDH Ct(dim-less) 20 127 01 20 128 006 20 129 006IL-8 pgmL 20 2805 8683 20 852 232 20 934 286HERV-WMSRV Gag Flix B cells (d-less) 13 118 011 19 119 01 18 115 006HERV-HF Gag Flix B cells (d-less) 12 114 01 17 108 007 20 112 011HERV-HF Env (H1) Flix B cells (d-less) 11 112 007 18 106 005 17 11 008HERV-HF Env (H3) Flix B cells (d-less) 19 156 024 20 147 015 20 152 016HERV-HF Env (W1) Flix B cells (d-less) 18 131 013 20 123 01 20 123 01HERV-HF Env (W3) Flix B cells (d-less) 17 125 015 20 122 009 20 124 017prop of B cells in sample () 19 914 38 20 859 306 20 905 379prop of monocytes in sample () 19 1533 92 20 1808 641 20 1609 623
HERV-WMSRV Gag Flix monocytes (d-less) 11 114 009 16 116 005 15 115 007MSRV F Gag Flix monocytes (d-less) 13 116 01 17 111 005 16 122 019Env (H1) Flix monocytes (d-less) 15 115 012 18 112 008 17 115 006Env (H3) Flix monocytes (d-less) 19 159 018 20 155 019 20 157 02Env (W1) Flix monocytes (d-less) 15 115 01 19 111 007 19 108 005Env (W3) Flix monocytes (d-less) 13 116 008 19 112 007 18 116 009HCRP ngmL 20 178383 21238 20 189945 176902 20 243527 224115CD163 ngmL 20 45667 15463 20 4239 10536 20 44257 12468EBV Copiesmicrolitre 16 21371 79687 16 238 6672 15 668 21274
Viral and biomarker data Before vs AfterHERV-WMSRV Gag Flix B cellsSignificant drop in means in ITT and PPNo significant change in gradient but steeper gradient before
HERV-WMSRV Gag Flix B cellsPP Individual subjects and fitted line
Significant overall drop notattributable to intervention
Similar story for
Env (W1) Flix monocytes
2 3 4 5 6 7 8monthly visits
Solid line fitted by modelA significant drop in means cannot be explained by intervention since decline is steeper before
17
MRI PP Persisting T1 Gd-enhancing lesionsBefore After Within-patient changea
Mean rate Mean rate Change in ratePP (n=16) 153 119 -034
80 of total reductionoccurs before theintervention
attributing the overallreduction to the interventioneven if reduction weresignificant would not be
-013 (P=0469)
P=0762-003 (P=0835)
credible
11
MRI T2 lesions
T2 lesion counts Observed at visits 5 (before) and 8 (after)
Before After Within-patient changea
Mean count Mean count Mean count changeP=0472
weighted ratiob
ITT 445PP 313
465 020P=0462331 019
105107
aChanges calculated after-before or afterbeforebWithin-patient ratios averaged on log scale before back transforming substituting 01 for zero counts Weighted meanratios pooled on log scale by weighting for lesion counts
12
Viral and biomarker data change vs T1 Gd lesion changePositive correlation
HERV-WMSRV Gag Flix B cells r=046 P=0057 ITT r=048 P=0086 PP
9
10
Additional analysis
A higher T1 Gd lesioncount at any visit isassociated with higher714
1619
28 27
20
1712
values of HERV-WMSRVGag Flix B cells at that visitP=0029 (ITT)
15
8 1
-3 -2 -1 0 1 2change in T1 lesion rate
Suggestion of decrease in HERV-WMSRV Gag Flix B cells associated with decrease in Gd-enhanced lesion rate PP r=-048 P=0086
23
Patients with a decrease in lesion count (eg patient 8) tend to have a decrease or a greater decrease in the biomarker than patients with an increase in lesion count (eg patient 20)
Viral and biomarker data summary
Some statistically significant changes in gradient before vs after wereobserved However whether these are consistent with an effect ofraltegravir depends partly on biological plausibility
A very small number of statistically significant correlations wereobserved between changes in these measures and changes in T1 Gdlesion counts their interpretation is again heavily dependent onbiological plausibility
Because of the number of measurestests any significant resultsshould be treated with caution Since results are singled out on thebasis of statistical significance rather than prior hypothesis Type Ierror is likely
25
Viral and biomarker data Before vs AfterHCRP ngmLSignificant increase in means in ITT and PPNo significant change in (positive) gradient similar slightly steeper gradient after
ITT------------------------------------------------------------------------------
| gradient SE z P-value [95 Conf Interval]-------------+----------------------------------------------------------------
before | 1221482 1495142 082 0414 -1708943 4151908after | 1406076 1495142 094 0347 -1524349 4336501
------------------------------------------------------------------------------
Significant overall increase not credibly attributable to intervention since the gradientbefore though non-significant is too similar to the gradient after intervention
18
Quality of life data summary
A number of measures showed statistically significant improvementsin well-being or a slowing of deterioration in the period aftercompared to before intervention
Although consistent with an effect of raltegravir this is most crediblyattributable to the placebo effect of patients receiving an unblindedintervention rather than to any action of the drug
The study design of not having a control group or a cross-over designmitigated against determining the possible effect of the interventionon Q0L
31
Viral and biomarker data Before vs AfterEnv (W3) Flix monocytesNon-significant decline before becomes borderline significant increase afterand significant change in gradient
Env (W3) Flix monocytesITT Individual subjects and fitted line
-002 P=0200
As before biologicalplausibility important bothfor change displayed andfor negative correlation
with Gd T1 lesions
+002 P=0055
P=0047
2 3 4 5 6 7 8monthly visits
Significant change in gradient in ITT (P=0047) and borderline in PP (P=0089)Change in means after - before negatively correlated withchange in rate of Gd enhancing T1 lesions r=-054 P=0015
21
Disability data
Summary of changes after-before
N mean sdEDSS 20 014 045 Neither change nor gradient change significant
MSFC 20 023 028 [Both change and change in gradient significant]9HPT peg speed 20 0003 0003 Highly significant improvementWalk speed (fs) 20 -004 047 Neither change nor gradient change significantPASAT score 20 466 521 Highly significant improvement
PASAT------------------------------------------------------------------------------
| gradient SE z P-value [95 Conf Interval]-------------+----------------------------------------------------------------
before | 2478954 4594816 540 0000 1578387 3379522after | 6377749 4534625 141 0160 -2509954 1526545
------------------------------------------------------------------------------
bull There is a significant gradient changebull But rate of improvement substantially greater before than after intervention
27
Quality of life data
Summary of changes after-before
change inITT n means
PQ - SF36 - Physical Functional Score (PF) 20 -092
PQ - SF36 - Role-Physical Scale (RP) 20 -948PQ - SF36 - Bodily Pain Scale (BP) 20 -542
PQ - SF36 - General Health Scale (GH) 20 -467
PQ - SF36 - Vitality Scale (VT) 20 506 PQ - SF36 - Social Functioning Scale (SF) 20 245 PQ - SF36 - Role Emotional Scale (RE) 20 -862 no statistically significant changes
PQ - SF36 - Mental Health Scale (MH) 20 572 PQ - PFA - Patient Fatigue Assessment 20 -151PQ - PPA - Patient Pain Assessment 19 407PQ - MSIS - Total Score 20 -210 no statistically significant changes
PQ - MSWS-12 - MSWS Total Score 20 -035
30
Quality of life dataSummary of changes after-before
change inITT n means
PQ - SF36 - Physical Functional Score (PF) 20 -092PQ - SF36 - Role-Physical Scale (RP) 20 -948PQ - SF36 - Bodily Pain Scale (BP) 20 -542PQ - SF36 - General Health Scale (GH) 20 -467PQ - SF36 - Vitality Scale (VT) 20 506
+ = improvement
PQ - SF36 - Social Functioning Scale (SF) 20 245PQ - SF36 - Role Emotional Scale (RE) 20 -862PQ - SF36 - Mental Health Scale (MH) 20 572PQ - PFA - Patient Fatigue Assessment 20 -151PQ - PPA - Patient Pain Assessment 19 407 - = improvementPQ - MSIS - Total Score 20 -210PQ - MSWS-12 - MSWS Total Score 20 -035
29
Disability data
Summary of changes after-before
N mean sdEDSS 20 014 045 Neither change nor gradient change significant
MSFC 20 023 028 [Both change and change in gradient significant]9HPT peg speed 20 0003 0003 Highly significant improvementWalk speed (fs) 20 -004 047 Neither change nor gradient change significantPASAT score 20 466 521
9HPT peg speed------------------------------------------------------------------------------
ITT | gradient SE z P-value [95 Conf Interval]-------------+----------------------------------------------------------------
before | 0009916 0002372 418 0000 0005267 0014565after | 000545 0002363 231 0021 0000818 0010082
------------------------------------------------------------------------------
bull No significant gradient changebull But rate of improvement substantially greater before than after intervention
26
Acknowledgementsbull Unit for Healthcare Epidemiology Oxford
ndash Raph Goldacrendash Michael Goldacrendash David Yeates
bull QMULbull Gavin Giovannoni
bull The Albion Centrebull Hubert Maruszak
bull UCLbull Robin Weiss
Laboratory safety tests
32
Laboratory safety tests significant changes
ITT change gradient gradient change inbefore after gradient
ADJUSTED CALCIUM SERUM +002 -000003 +0008 P=0406 increase could bep=0025 pgt09 p=0149 due intervention
CHLORIDE SERUM -075 +014 -031 p=0194 decrease could bep=0055 p=0503 p=0103 due to intervention
CHOLESTEROL SERUM +028 +008 +003 p=0437 increase notp=0004 p=0059 p=0521 plausibly duehellip
GLUCOSE PLASMA -018 +008 -015 p=0072 gradient changep=0196 p=0284 p=0037 could be duehellip
LDL CHOLESTEROL SERUM +017 +006 +0004 p=0432 increase notp=0018 p=0162 pgt09 plausibly duehellip
PLATELET COUNT +686 -027 +259 p=0352 increase could bep=0040 p=0880 p=0129 duehellip
WHITE BLOOD COUNT PP +022 +006 +010 p=0827 increase notp=0049 p=0579 p=0331 plausibly due
33
- Diapositive numeacutero 1
- Diapositive numeacutero 2
- Dr Jean-Martin Charcot
- Diapositive numeacutero 4
- Diapositive numeacutero 5
- Diapositive numeacutero 6
- Viruses and MS
- Are human endogenous retroviruses pathogenic An approach to testing the hypothesis
- How HERVs may induce autoimmune response
- Diapositive numeacutero 10
- Diapositive numeacutero 11
- Diapositive numeacutero 12
- Diapositive numeacutero 13
- How many cases of HIV and MS have been reported
- What do cohort studies show
- What is the Risk of Developing Multiple Sclerosis if you have HIV and are on HIV Anti-retroviral therapy
- Methods
- Diapositive numeacutero 18
- Diapositive numeacutero 19
- NHS Data on UK Healthcare events 1999-2011
- NHS Cohort gt One year after Exposure (HIV) Contact
- Diapositive numeacutero 22
- The CHARCOT PROJECTINSPIRE Isentress (Raltegravir)Pilot Study in Relapsing MS
- INSPIRE Design
- INSPIRE Design 2
- Diapositive numeacutero 26
- Diapositive numeacutero 27
- Diapositive numeacutero 28
- Diapositive numeacutero 29
- Diapositive numeacutero 30
- Diapositive numeacutero 31
- Diapositive numeacutero 32
- Diapositive numeacutero 34
- Diapositive numeacutero 35
- Diapositive numeacutero 36
- Diapositive numeacutero 37
- Diapositive numeacutero 38
- Diapositive numeacutero 39
- Diapositive numeacutero 40
- Diapositive numeacutero 41
- Diapositive numeacutero 42
- Diapositive numeacutero 43
- Diapositive numeacutero 44
- Diapositive numeacutero 45
- Diapositive numeacutero 47
- Diapositive numeacutero 48
- Diapositive numeacutero 49
- Diapositive numeacutero 50
- Acknowledgements
- Diapositive numeacutero 52
- Diapositive numeacutero 53
- Diapositive numeacutero 54
-
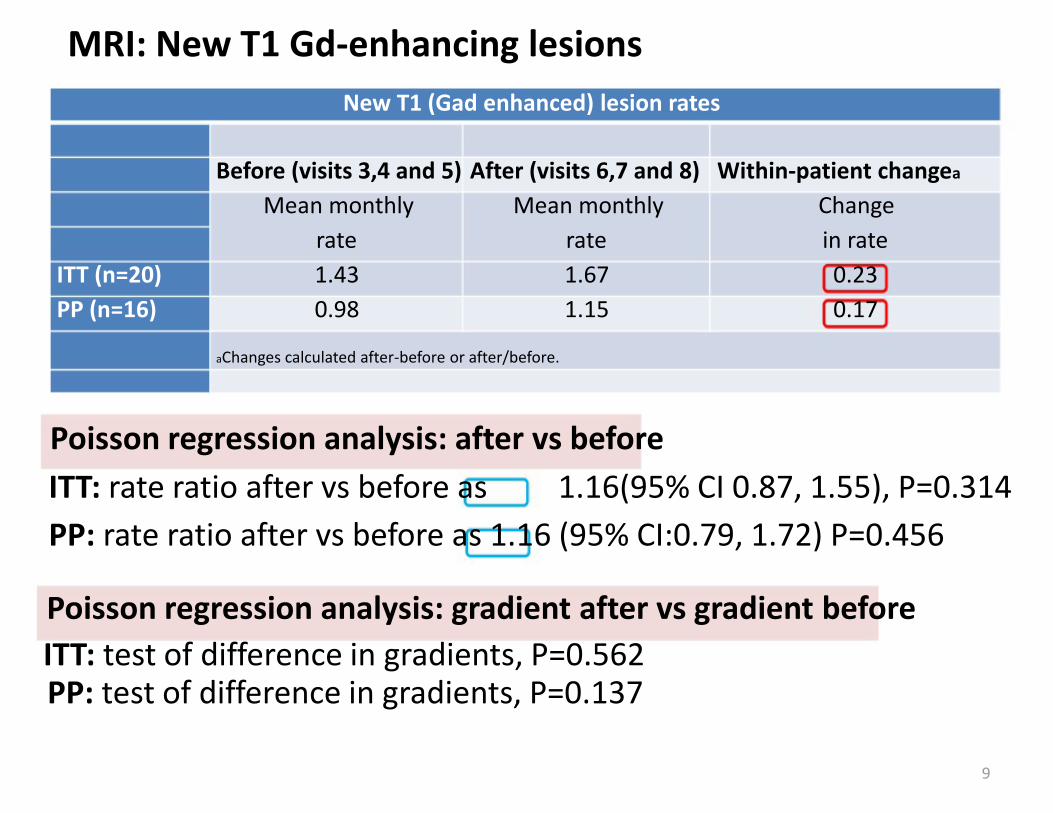
Trial design
QOL QOL QOL QOL QOL QOL QOL
MSFC MSFC MSFC MSFC MSFC MSFC MSFCEDSS EDSS EDSS EDSS EDSS
blood blood blood blood blood blood blood blood
MRI MRI MRI MRI MRI MRI MRI
V1 V2 V3 V4 V5 V6 V7 V8(screening before after
visit)
bull Exploratory studybull Danger of Type II error of missing a real association arguably greater than
danger of Type I error of highlighting a spurious association
4
DATA
bull Patient socio-demographic and baseline
bull MRI
bull Viral and biomarkers
bull Disability
bull Quality of life
bull Laboratory safety tests
2
Patient socio-demographic and baseline
N mean min maxITTAge at baselineyrs 20 4073 3115 5299Height cm 18 16904 15600 18300Weight kg 18 7873 5190 10970Baseline EDSS 20 240 000 400Number of relapses in past year 20 150 100 300
PPAge at baselineyrs 16 4162 3115 5299Height cm 14 16891 15600 18000Weight kg 14 7790 5190 10830Baseline EDSS 16 225 000 350Number of relapses in past year 16 144 100 300
6
Patient adherenceITT PP
Visit mean
6 Number of tablets dispensed 60 60Number of tablets returned 235 269Adherence percentagea 9608 9552
7 Number of tablets dispensed 63 6375Number of tablets returned 72 675Adherence percentagea 88 8875
8 Number of tablets dispensed 597 5963Number of tablets returned 81 863Adherence percentagea 824 805
Over all three visits Number of tablets dispensed 609 6113Number of tablets returned 588 602Adherence percentagea 8883 8826
a100(tablets dispensed - tablets returned)tablets dispensed
7
MRI Total T1 Gd-enhancing lesionsTotal T1 (Gad enhanced) lesion rates
Before (visits 34 and 5) After (visits 67 and 8) Within-patient changea
Mean monthly Mean monthly Change Weightedrate rate in rate rate ratiob
ITT (n=20) 289 302 012 103PP (n=16) 251 233 -018 092
aChanges calculated after-before or afterbeforebRatios averaged on log scale before back-transforming substituting 01 for zero rates Weighted ratios pooled byweighting for total subject counts
Poisson regression analysis after vs before
ITT rate ratio after vs before as 104(95 CI 85 129) P=0681PP rate ratio after vs before as093(95 CI 072 120) P=0577
Poisson regression analysis gradient after vs gradient beforeITT test of difference in gradients P=0659PP test of difference in gradients P=0463
8
MRI New T1 Gd-enhancing lesionsNew T1 (Gad enhanced) lesion rates
Before (visits 34 and 5) After (visits 67 and 8) Within-patient changea
Mean monthly Mean monthly Changerate rate in rate
ITT (n=20) 143 167 023PP (n=16) 098 115 017
aChanges calculated after-before or afterbefore
Poisson regression analysis after vs beforeITT rate ratio after vs before as 116(95 CI 087 155) P=0314PP rate ratio after vs before as 116 (95 CI079 172) P=0456
Poisson regression analysis gradient after vs gradient beforeITT test of difference in gradients P=0562PP test of difference in gradients P=0137
9
MRI T1 Gd lesions
ITT Patients in order of difference in rate
010008010019010015010001010016010009010028010027010003010005010007010010010011010013010014010017010023
010012010020010024
-4 -2 0 2difference in rate lesions per month
Difference after - before
4
13
MRI lesions summary
Lesion outcomes provide no statistical evidence consistent with aneffect of raltegravir
14
Viral and biomarker data Before vs AfterBaselines (visit 2) Before (345) After (678)
Variable N mean sd N mean sd mean sd
MSRV A CtGAPDH Ct(dim-less) 20 094 01 20 093 007 20 092 007MSRV M CtGAPDH Ct(dim-less) 20 133 006 20 133 006 20 132 007TB HE23 CtGAPDH Ct(dim-less) 20 127 014 20 124 013 20 124 013HERV-W A CtGAPDH Ct(dim-less) 20 116 016 20 118 01 20 118 009HERV-W M CtGAPDH Ct(dim-less) 20 147 021 20 144 015 20 145 013TB HE1113 CtGAPDH Ct(dim-less) 20 127 01 20 128 006 20 129 006IL-8 pgmL 20 2805 8683 20 852 232 20 934 286HERV-WMSRV Gag Flix B cells (d-less) 13 118 011 19 119 01 18 115 006HERV-HF Gag Flix B cells (d-less) 12 114 01 17 108 007 20 112 011HERV-HF Env (H1) Flix B cells (d-less) 11 112 007 18 106 005 17 11 008HERV-HF Env (H3) Flix B cells (d-less) 19 156 024 20 147 015 20 152 016HERV-HF Env (W1) Flix B cells (d-less) 18 131 013 20 123 01 20 123 01HERV-HF Env (W3) Flix B cells (d-less) 17 125 015 20 122 009 20 124 017prop of B cells in sample () 19 914 38 20 859 306 20 905 379prop of monocytes in sample () 19 1533 92 20 1808 641 20 1609 623
HERV-WMSRV Gag Flix monocytes (d-less) 11 114 009 16 116 005 15 115 007MSRV F Gag Flix monocytes (d-less) 13 116 01 17 111 005 16 122 019Env (H1) Flix monocytes (d-less) 15 115 012 18 112 008 17 115 006Env (H3) Flix monocytes (d-less) 19 159 018 20 155 019 20 157 02Env (W1) Flix monocytes (d-less) 15 115 01 19 111 007 19 108 005Env (W3) Flix monocytes (d-less) 13 116 008 19 112 007 18 116 009HCRP ngmL 20 178383 21238 20 189945 176902 20 243527 224115CD163 ngmL 20 45667 15463 20 4239 10536 20 44257 12468EBV Copiesmicrolitre 16 21371 79687 16 238 6672 15 668 21274
Viral and biomarker data Before vs AfterHERV-WMSRV Gag Flix B cellsSignificant drop in means in ITT and PPNo significant change in gradient but steeper gradient before
HERV-WMSRV Gag Flix B cellsPP Individual subjects and fitted line
Significant overall drop notattributable to intervention
Similar story for
Env (W1) Flix monocytes
2 3 4 5 6 7 8monthly visits
Solid line fitted by modelA significant drop in means cannot be explained by intervention since decline is steeper before
17
MRI PP Persisting T1 Gd-enhancing lesionsBefore After Within-patient changea
Mean rate Mean rate Change in ratePP (n=16) 153 119 -034
80 of total reductionoccurs before theintervention
attributing the overallreduction to the interventioneven if reduction weresignificant would not be
-013 (P=0469)
P=0762-003 (P=0835)
credible
11
MRI T2 lesions
T2 lesion counts Observed at visits 5 (before) and 8 (after)
Before After Within-patient changea
Mean count Mean count Mean count changeP=0472
weighted ratiob
ITT 445PP 313
465 020P=0462331 019
105107
aChanges calculated after-before or afterbeforebWithin-patient ratios averaged on log scale before back transforming substituting 01 for zero counts Weighted meanratios pooled on log scale by weighting for lesion counts
12
Viral and biomarker data change vs T1 Gd lesion changePositive correlation
HERV-WMSRV Gag Flix B cells r=046 P=0057 ITT r=048 P=0086 PP
9
10
Additional analysis
A higher T1 Gd lesioncount at any visit isassociated with higher714
1619
28 27
20
1712
values of HERV-WMSRVGag Flix B cells at that visitP=0029 (ITT)
15
8 1
-3 -2 -1 0 1 2change in T1 lesion rate
Suggestion of decrease in HERV-WMSRV Gag Flix B cells associated with decrease in Gd-enhanced lesion rate PP r=-048 P=0086
23
Patients with a decrease in lesion count (eg patient 8) tend to have a decrease or a greater decrease in the biomarker than patients with an increase in lesion count (eg patient 20)
Viral and biomarker data summary
Some statistically significant changes in gradient before vs after wereobserved However whether these are consistent with an effect ofraltegravir depends partly on biological plausibility
A very small number of statistically significant correlations wereobserved between changes in these measures and changes in T1 Gdlesion counts their interpretation is again heavily dependent onbiological plausibility
Because of the number of measurestests any significant resultsshould be treated with caution Since results are singled out on thebasis of statistical significance rather than prior hypothesis Type Ierror is likely
25
Viral and biomarker data Before vs AfterHCRP ngmLSignificant increase in means in ITT and PPNo significant change in (positive) gradient similar slightly steeper gradient after
ITT------------------------------------------------------------------------------
| gradient SE z P-value [95 Conf Interval]-------------+----------------------------------------------------------------
before | 1221482 1495142 082 0414 -1708943 4151908after | 1406076 1495142 094 0347 -1524349 4336501
------------------------------------------------------------------------------
Significant overall increase not credibly attributable to intervention since the gradientbefore though non-significant is too similar to the gradient after intervention
18
Quality of life data summary
A number of measures showed statistically significant improvementsin well-being or a slowing of deterioration in the period aftercompared to before intervention
Although consistent with an effect of raltegravir this is most crediblyattributable to the placebo effect of patients receiving an unblindedintervention rather than to any action of the drug
The study design of not having a control group or a cross-over designmitigated against determining the possible effect of the interventionon Q0L
31
Viral and biomarker data Before vs AfterEnv (W3) Flix monocytesNon-significant decline before becomes borderline significant increase afterand significant change in gradient
Env (W3) Flix monocytesITT Individual subjects and fitted line
-002 P=0200
As before biologicalplausibility important bothfor change displayed andfor negative correlation
with Gd T1 lesions
+002 P=0055
P=0047
2 3 4 5 6 7 8monthly visits
Significant change in gradient in ITT (P=0047) and borderline in PP (P=0089)Change in means after - before negatively correlated withchange in rate of Gd enhancing T1 lesions r=-054 P=0015
21
Disability data
Summary of changes after-before
N mean sdEDSS 20 014 045 Neither change nor gradient change significant
MSFC 20 023 028 [Both change and change in gradient significant]9HPT peg speed 20 0003 0003 Highly significant improvementWalk speed (fs) 20 -004 047 Neither change nor gradient change significantPASAT score 20 466 521 Highly significant improvement
PASAT------------------------------------------------------------------------------
| gradient SE z P-value [95 Conf Interval]-------------+----------------------------------------------------------------
before | 2478954 4594816 540 0000 1578387 3379522after | 6377749 4534625 141 0160 -2509954 1526545
------------------------------------------------------------------------------
bull There is a significant gradient changebull But rate of improvement substantially greater before than after intervention
27
Quality of life data
Summary of changes after-before
change inITT n means
PQ - SF36 - Physical Functional Score (PF) 20 -092
PQ - SF36 - Role-Physical Scale (RP) 20 -948PQ - SF36 - Bodily Pain Scale (BP) 20 -542
PQ - SF36 - General Health Scale (GH) 20 -467
PQ - SF36 - Vitality Scale (VT) 20 506 PQ - SF36 - Social Functioning Scale (SF) 20 245 PQ - SF36 - Role Emotional Scale (RE) 20 -862 no statistically significant changes
PQ - SF36 - Mental Health Scale (MH) 20 572 PQ - PFA - Patient Fatigue Assessment 20 -151PQ - PPA - Patient Pain Assessment 19 407PQ - MSIS - Total Score 20 -210 no statistically significant changes
PQ - MSWS-12 - MSWS Total Score 20 -035
30
Quality of life dataSummary of changes after-before
change inITT n means
PQ - SF36 - Physical Functional Score (PF) 20 -092PQ - SF36 - Role-Physical Scale (RP) 20 -948PQ - SF36 - Bodily Pain Scale (BP) 20 -542PQ - SF36 - General Health Scale (GH) 20 -467PQ - SF36 - Vitality Scale (VT) 20 506
+ = improvement
PQ - SF36 - Social Functioning Scale (SF) 20 245PQ - SF36 - Role Emotional Scale (RE) 20 -862PQ - SF36 - Mental Health Scale (MH) 20 572PQ - PFA - Patient Fatigue Assessment 20 -151PQ - PPA - Patient Pain Assessment 19 407 - = improvementPQ - MSIS - Total Score 20 -210PQ - MSWS-12 - MSWS Total Score 20 -035
29
Disability data
Summary of changes after-before
N mean sdEDSS 20 014 045 Neither change nor gradient change significant
MSFC 20 023 028 [Both change and change in gradient significant]9HPT peg speed 20 0003 0003 Highly significant improvementWalk speed (fs) 20 -004 047 Neither change nor gradient change significantPASAT score 20 466 521
9HPT peg speed------------------------------------------------------------------------------
ITT | gradient SE z P-value [95 Conf Interval]-------------+----------------------------------------------------------------
before | 0009916 0002372 418 0000 0005267 0014565after | 000545 0002363 231 0021 0000818 0010082
------------------------------------------------------------------------------
bull No significant gradient changebull But rate of improvement substantially greater before than after intervention
26
Acknowledgementsbull Unit for Healthcare Epidemiology Oxford
ndash Raph Goldacrendash Michael Goldacrendash David Yeates
bull QMULbull Gavin Giovannoni
bull The Albion Centrebull Hubert Maruszak
bull UCLbull Robin Weiss
Laboratory safety tests
32
Laboratory safety tests significant changes
ITT change gradient gradient change inbefore after gradient
ADJUSTED CALCIUM SERUM +002 -000003 +0008 P=0406 increase could bep=0025 pgt09 p=0149 due intervention
CHLORIDE SERUM -075 +014 -031 p=0194 decrease could bep=0055 p=0503 p=0103 due to intervention
CHOLESTEROL SERUM +028 +008 +003 p=0437 increase notp=0004 p=0059 p=0521 plausibly duehellip
GLUCOSE PLASMA -018 +008 -015 p=0072 gradient changep=0196 p=0284 p=0037 could be duehellip
LDL CHOLESTEROL SERUM +017 +006 +0004 p=0432 increase notp=0018 p=0162 pgt09 plausibly duehellip
PLATELET COUNT +686 -027 +259 p=0352 increase could bep=0040 p=0880 p=0129 duehellip
WHITE BLOOD COUNT PP +022 +006 +010 p=0827 increase notp=0049 p=0579 p=0331 plausibly due
33
- Diapositive numeacutero 1
- Diapositive numeacutero 2
- Dr Jean-Martin Charcot
- Diapositive numeacutero 4
- Diapositive numeacutero 5
- Diapositive numeacutero 6
- Viruses and MS
- Are human endogenous retroviruses pathogenic An approach to testing the hypothesis
- How HERVs may induce autoimmune response
- Diapositive numeacutero 10
- Diapositive numeacutero 11
- Diapositive numeacutero 12
- Diapositive numeacutero 13
- How many cases of HIV and MS have been reported
- What do cohort studies show
- What is the Risk of Developing Multiple Sclerosis if you have HIV and are on HIV Anti-retroviral therapy
- Methods
- Diapositive numeacutero 18
- Diapositive numeacutero 19
- NHS Data on UK Healthcare events 1999-2011
- NHS Cohort gt One year after Exposure (HIV) Contact
- Diapositive numeacutero 22
- The CHARCOT PROJECTINSPIRE Isentress (Raltegravir)Pilot Study in Relapsing MS
- INSPIRE Design
- INSPIRE Design 2
- Diapositive numeacutero 26
- Diapositive numeacutero 27
- Diapositive numeacutero 28
- Diapositive numeacutero 29
- Diapositive numeacutero 30
- Diapositive numeacutero 31
- Diapositive numeacutero 32
- Diapositive numeacutero 34
- Diapositive numeacutero 35
- Diapositive numeacutero 36
- Diapositive numeacutero 37
- Diapositive numeacutero 38
- Diapositive numeacutero 39
- Diapositive numeacutero 40
- Diapositive numeacutero 41
- Diapositive numeacutero 42
- Diapositive numeacutero 43
- Diapositive numeacutero 44
- Diapositive numeacutero 45
- Diapositive numeacutero 47
- Diapositive numeacutero 48
- Diapositive numeacutero 49
- Diapositive numeacutero 50
- Acknowledgements
- Diapositive numeacutero 52
- Diapositive numeacutero 53
- Diapositive numeacutero 54
-
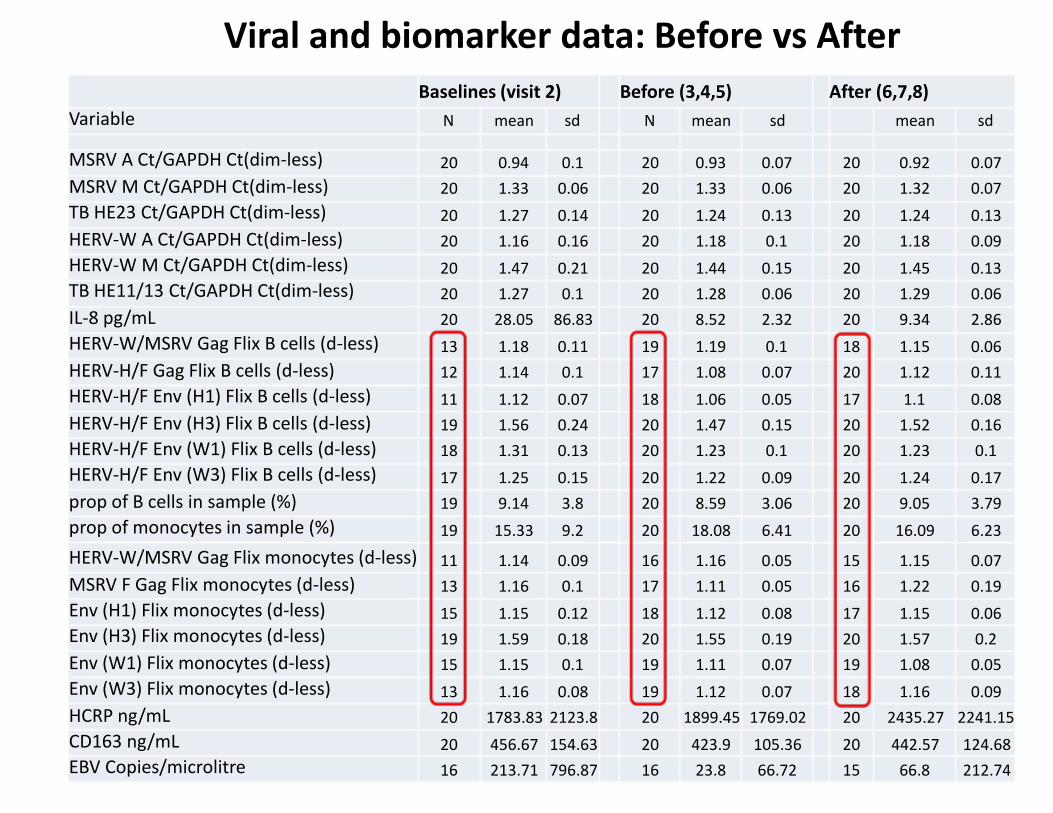
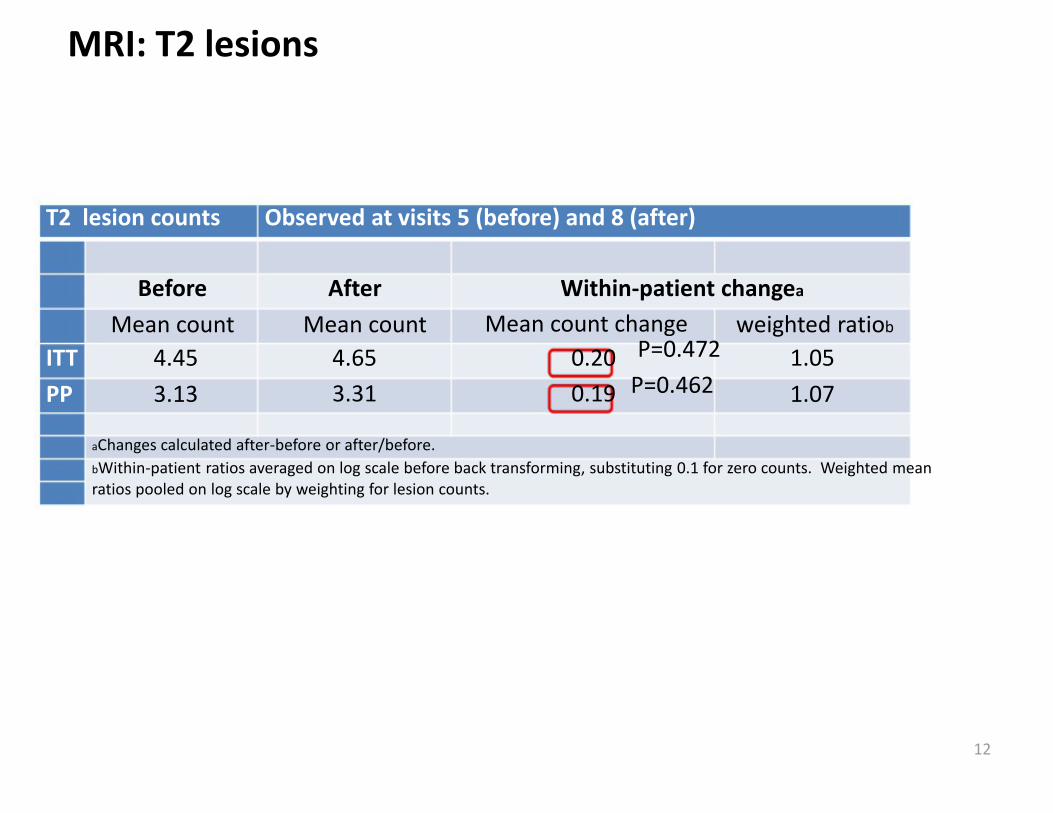
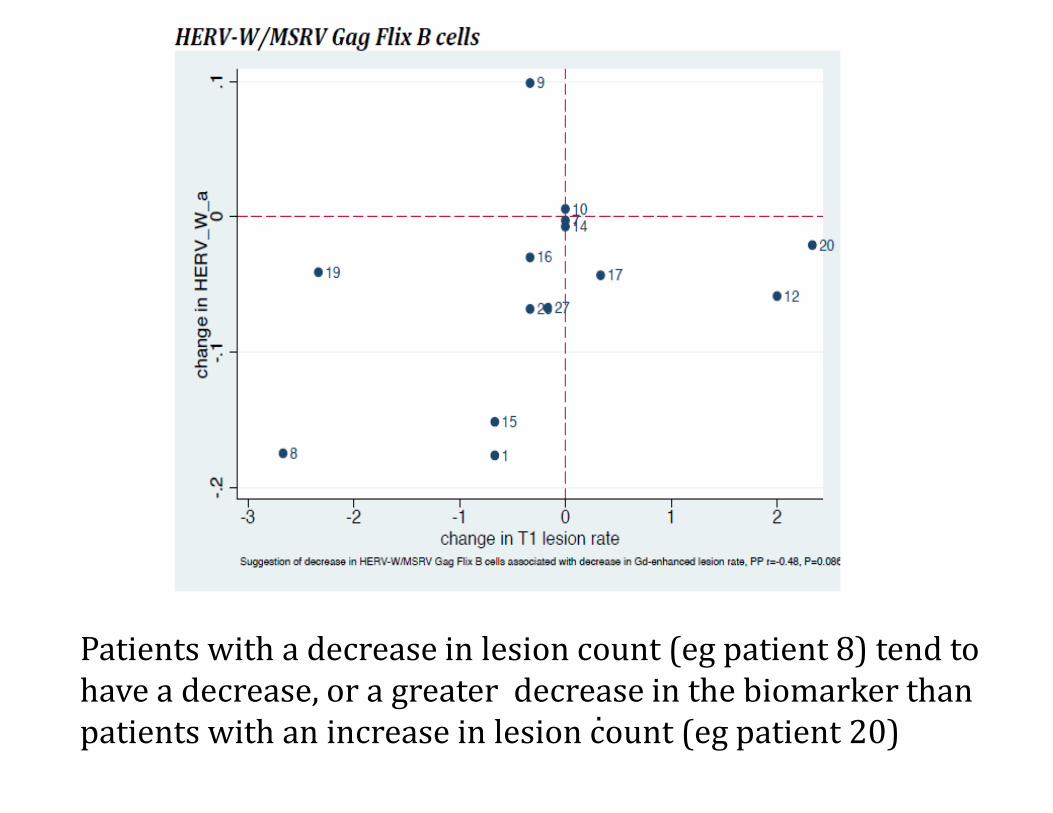
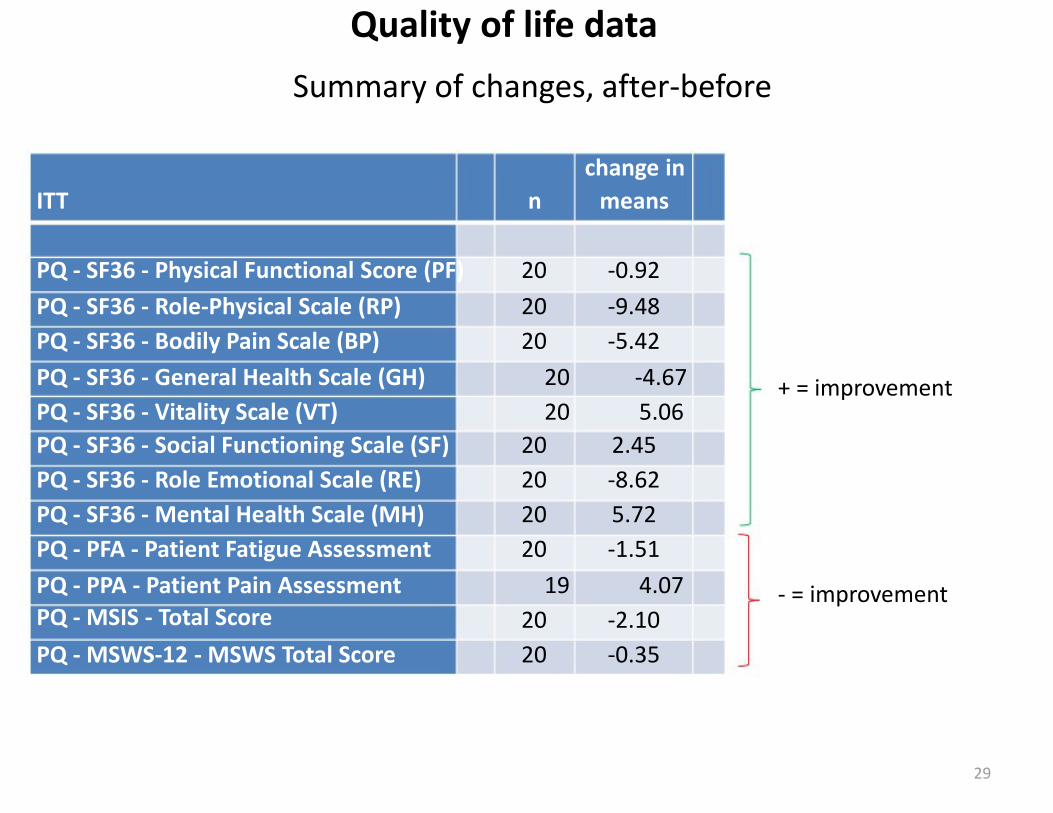
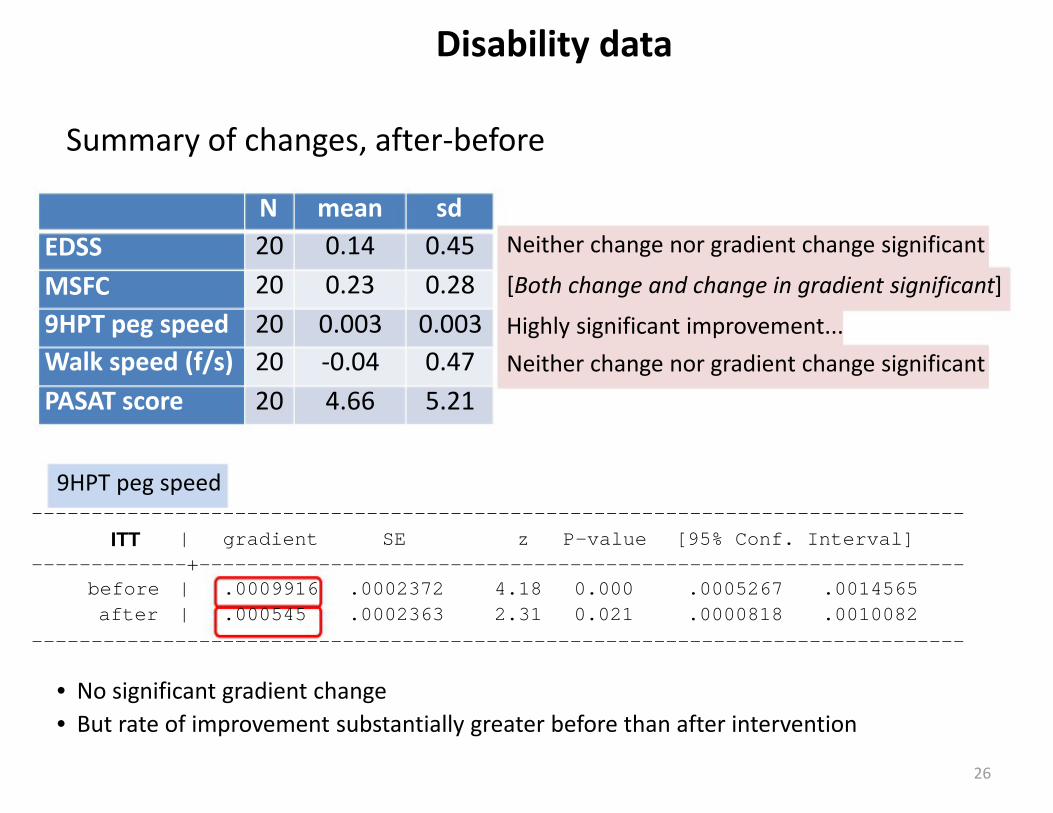

Disability data
Summary of changes after-before
N mean sdEDSS 20 014 045 Neither change nor gradient change significant
MSFC 20 023 028 [Both change and change in gradient significant]9HPT peg speed 20 0003 0003 Highly significant improvementWalk speed (fs) 20 -004 047 Neither change nor gradient change significantPASAT score 20 466 521 Highly significant improvement
PASAT------------------------------------------------------------------------------
| gradient SE z P-value [95 Conf Interval]-------------+----------------------------------------------------------------
before | 2478954 4594816 540 0000 1578387 3379522after | 6377749 4534625 141 0160 -2509954 1526545
------------------------------------------------------------------------------
bull There is a significant gradient changebull But rate of improvement substantially greater before than after intervention
27
Quality of life data
Summary of changes after-before
change inITT n means
PQ - SF36 - Physical Functional Score (PF) 20 -092
PQ - SF36 - Role-Physical Scale (RP) 20 -948PQ - SF36 - Bodily Pain Scale (BP) 20 -542
PQ - SF36 - General Health Scale (GH) 20 -467
PQ - SF36 - Vitality Scale (VT) 20 506 PQ - SF36 - Social Functioning Scale (SF) 20 245 PQ - SF36 - Role Emotional Scale (RE) 20 -862 no statistically significant changes
PQ - SF36 - Mental Health Scale (MH) 20 572 PQ - PFA - Patient Fatigue Assessment 20 -151PQ - PPA - Patient Pain Assessment 19 407PQ - MSIS - Total Score 20 -210 no statistically significant changes
PQ - MSWS-12 - MSWS Total Score 20 -035
30
Quality of life dataSummary of changes after-before
change inITT n means
PQ - SF36 - Physical Functional Score (PF) 20 -092PQ - SF36 - Role-Physical Scale (RP) 20 -948PQ - SF36 - Bodily Pain Scale (BP) 20 -542PQ - SF36 - General Health Scale (GH) 20 -467PQ - SF36 - Vitality Scale (VT) 20 506
+ = improvement
PQ - SF36 - Social Functioning Scale (SF) 20 245PQ - SF36 - Role Emotional Scale (RE) 20 -862PQ - SF36 - Mental Health Scale (MH) 20 572PQ - PFA - Patient Fatigue Assessment 20 -151PQ - PPA - Patient Pain Assessment 19 407 - = improvementPQ - MSIS - Total Score 20 -210PQ - MSWS-12 - MSWS Total Score 20 -035
29
Disability data
Summary of changes after-before
N mean sdEDSS 20 014 045 Neither change nor gradient change significant
MSFC 20 023 028 [Both change and change in gradient significant]9HPT peg speed 20 0003 0003 Highly significant improvementWalk speed (fs) 20 -004 047 Neither change nor gradient change significantPASAT score 20 466 521
9HPT peg speed------------------------------------------------------------------------------
ITT | gradient SE z P-value [95 Conf Interval]-------------+----------------------------------------------------------------
before | 0009916 0002372 418 0000 0005267 0014565after | 000545 0002363 231 0021 0000818 0010082
------------------------------------------------------------------------------
bull No significant gradient changebull But rate of improvement substantially greater before than after intervention
26
Acknowledgementsbull Unit for Healthcare Epidemiology Oxford
ndash Raph Goldacrendash Michael Goldacrendash David Yeates
bull QMULbull Gavin Giovannoni
bull The Albion Centrebull Hubert Maruszak
bull UCLbull Robin Weiss
Laboratory safety tests
32
Laboratory safety tests significant changes
ITT change gradient gradient change inbefore after gradient
ADJUSTED CALCIUM SERUM +002 -000003 +0008 P=0406 increase could bep=0025 pgt09 p=0149 due intervention
CHLORIDE SERUM -075 +014 -031 p=0194 decrease could bep=0055 p=0503 p=0103 due to intervention
CHOLESTEROL SERUM +028 +008 +003 p=0437 increase notp=0004 p=0059 p=0521 plausibly duehellip
GLUCOSE PLASMA -018 +008 -015 p=0072 gradient changep=0196 p=0284 p=0037 could be duehellip
LDL CHOLESTEROL SERUM +017 +006 +0004 p=0432 increase notp=0018 p=0162 pgt09 plausibly duehellip
PLATELET COUNT +686 -027 +259 p=0352 increase could bep=0040 p=0880 p=0129 duehellip
WHITE BLOOD COUNT PP +022 +006 +010 p=0827 increase notp=0049 p=0579 p=0331 plausibly due
33
- Diapositive numeacutero 1
- Diapositive numeacutero 2
- Dr Jean-Martin Charcot
- Diapositive numeacutero 4
- Diapositive numeacutero 5
- Diapositive numeacutero 6
- Viruses and MS
- Are human endogenous retroviruses pathogenic An approach to testing the hypothesis
- How HERVs may induce autoimmune response
- Diapositive numeacutero 10
- Diapositive numeacutero 11
- Diapositive numeacutero 12
- Diapositive numeacutero 13
- How many cases of HIV and MS have been reported
- What do cohort studies show
- What is the Risk of Developing Multiple Sclerosis if you have HIV and are on HIV Anti-retroviral therapy
- Methods
- Diapositive numeacutero 18
- Diapositive numeacutero 19
- NHS Data on UK Healthcare events 1999-2011
- NHS Cohort gt One year after Exposure (HIV) Contact
- Diapositive numeacutero 22
- The CHARCOT PROJECTINSPIRE Isentress (Raltegravir)Pilot Study in Relapsing MS
- INSPIRE Design
- INSPIRE Design 2
- Diapositive numeacutero 26
- Diapositive numeacutero 27
- Diapositive numeacutero 28
- Diapositive numeacutero 29
- Diapositive numeacutero 30
- Diapositive numeacutero 31
- Diapositive numeacutero 32
- Diapositive numeacutero 34
- Diapositive numeacutero 35
- Diapositive numeacutero 36
- Diapositive numeacutero 37
- Diapositive numeacutero 38
- Diapositive numeacutero 39
- Diapositive numeacutero 40
- Diapositive numeacutero 41
- Diapositive numeacutero 42
- Diapositive numeacutero 43
- Diapositive numeacutero 44
- Diapositive numeacutero 45
- Diapositive numeacutero 47
- Diapositive numeacutero 48
- Diapositive numeacutero 49
- Diapositive numeacutero 50
- Acknowledgements
- Diapositive numeacutero 52
- Diapositive numeacutero 53
- Diapositive numeacutero 54
-
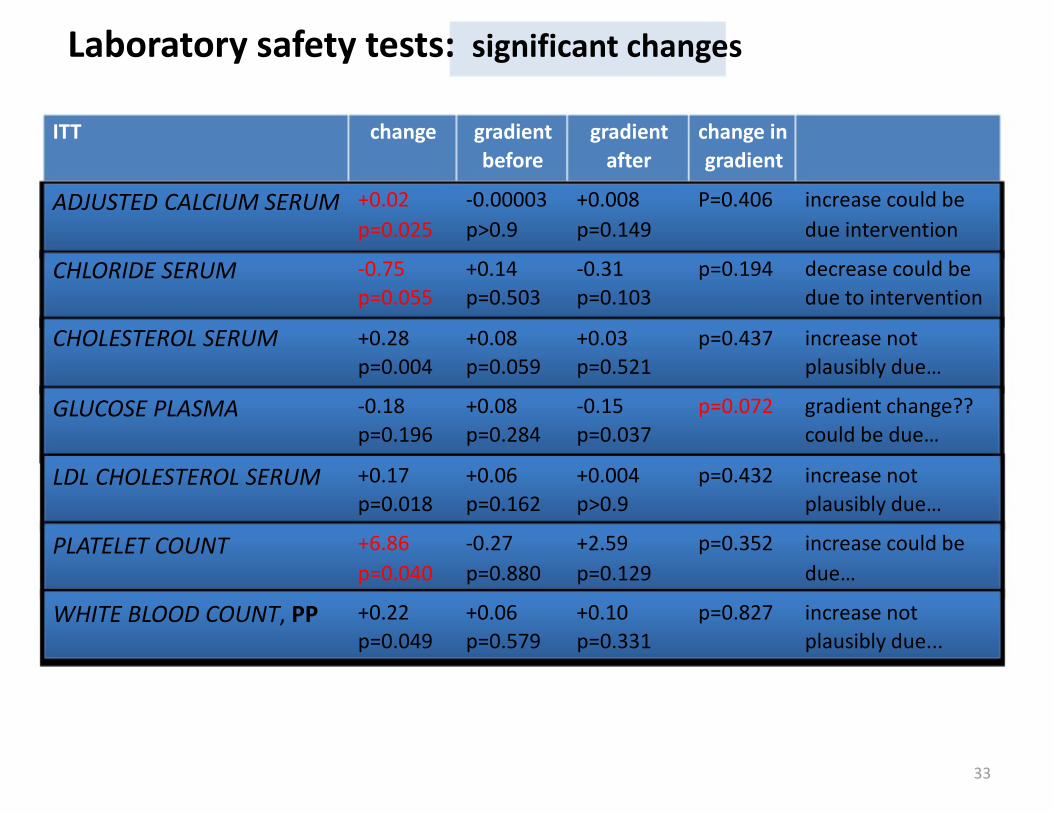