insolvency prediction in the portuguese …dosya.marmara.edu.tr/avrupa/mjes arsiv/vol 21 2...
TRANSCRIPT
MARMARA JOURNAL OF EUROPEAN STUDIES Volume 21 No: 2 2013 143
INSOLVENCY PREDICTION
IN THE PORTUGUESE CONSTRUCTION INDUSTRY
Elisabete S. VIEIRA
Carlos PINHO
Carla CORREIA
Abstract
This study tries to determine the firms’ specific variables considered
determinant to predict the probability of insolvency of Portuguese companies in the
construction industry, considering a sample of 150 insolvent firms and 150
operating companies. We consider a set of economic and financial ratios to analyze
the insolvency prediction and apply the linear probability model, as well as the
Logit and Probit models. The results show that the main ratio to predict the
insolvency was the cash-flow to total assets ratio, suggesting that the higher the
cash-flow to total assets ratio value, the lower the probability of insolvency. The
results can be used by policy makers to minimize the spill over effect of construction
crisis to the economy.
Keywords: Bankruptcy, insolvency prediction, financial ratios
PORTEKİZ İNŞAAT SEKTÖRÜNDE İFLAS BEKLENTİSİ
Özet
Bu çalışma, 150 iflas etmiş ve 150 halihazırda faaliyet gösteren şirketi
inceleyerek, inşaat sektöründe bulunan Portekizli şirketlerin iflas olasılığı
tahmininde belirleyici olduğu düşünülen, firmalara özgü değişkenleri belirlemeye
çalışmaktadır. Makalede, iflas tahmini analiz etmek ve Logit ve Probit modellerinin
yanı sıra doğrusal olasılık modeli uygulamak için, bir dizi ekonomik ve finansal
oran kullanılmaktadır. Sonuçlar, iflas tahmini için en önemli oranın, nakit akışının
toplam aktiflere oranı arttıkça iflas olasılığının düştüğünü belirten, nakit akışının
toplam aktiflere oranı olduğunu göstermektedir. İnşaat krizinin ekonomiye yayılma
etkisini en aza indirmek için sonuçlar politika yapıcılar tarafından kullanılabilir.
Anahtar Kelimeler: İflas, iflas tahmini, finansal oranlar
Coordinator Prof. Dr., GOVCOPP Unit Research, ISCA – University of Aveiro, e-mail:
[email protected] Assoc. Prof. Dr., GOVCOPP Unit Research, DEGEI – University of Aveiro, e-mail: [email protected] MA, DEGEI – University of Aveiro, e-mail: [email protected]
144 INSOLVENCY PREDICTION IN CONSTRUCTION INDUSTRY: PORTUGAL
Introduction
Since Beaver (1966), Altman (1968) and Blum (1974) presented their
pioneering studies on bankruptcy prediction that relied mainly in financial ratios, a
vast literature has emerged applying several performance analyses of financial
ratios to predict the bankrupt probability in the coming years. Despite the increasing
methodological sophistication, the financial ratios’ selection to analyze this
phenomenon remains as relevant as in previous decades. In fact, Voulgaris,
Doumpos and Zopounidis (2000) continue to share the opinion that financial ratios
are unbiased quantitative representations of the firms’ context.
The European prevailing financial crisis has increased the relevance of financial
insolvency prediction models. Additionally, there are an increasing number of
bankrupt companies recorded in recent years in Portugal, which reinforces their
relevance.
In this context, we intend to analyze some models based on economic and
financial indicators that can predict future situations of insolvency, within five years
prior to insolvency, in the Portuguese construction industry, which is one of the
most fragile sectors in what concerns the economic environment, and,
consequently, is facing extreme difficulties nowadays.
This study contributes to the empirical evidence for business failure prediction
models in construction companies and selects the best model that helps
understanding which are the main ratios to study the insolvency.
The remainder of this paper is organized as follows. Section 2 reviews the
related literature. Section 3 describes the methodology and data. Section 4 presents
the empirical results. Finally, section 5 concludes the paper.
1. Literature Review
The first technique to be developed on financial failure prediction was based on
a univariate model analysis. This type of analysis consists on a model in which the
dependent variable is explained by a single independent variable. Thus, each
indicator was studied separately. For instance, the model explores the ratios that can
explain the probability of a firm to become insolvent.
In this context, the first known study on the analysis of financial ratios in
predicting insolvencies is assigned to Beaver (1966), who presented his univariate
analysis in predicting the failure of companies in the United States of America. The
results show that the financial ratios could be useful to predict failure at least five
years before the bankruptcy. Beaver’s study was based in 79 insolvent companies
and 79 healthy companies, in 38 different industries between 1954 and 1964. At
first, the author considered 30 financial ratios and ended up by selecting 6 of them.

MARMARA JOURNAL OF EUROPEAN STUDIES 145
Globally, all ratios were able to predict insolvency, however, not all had the same
predictive capacity. This model was criticized because an individual ratio cannot
entail sufficient information to describe the solvency of a firm.
The multiple discriminant analysis (MDA) is a multivariate statistical method
consisting in the determination of a linear combination of discriminating variables,
in order to statistically distinguish two groups previously defined. The dependent
variable is qualitative and the discriminant features are firms’ specific variables,
such as financial ratios. Based on the discriminant function, the predictive
capability of company insolvency can be tested.
The first MDA study was published by Altman (1968), which becomes the well-
known Z-score model. Altman used this analysis to develop a bankruptcy predictive
model for productive companies, accounting for 5 discriminating factors. The study
focused on 33 insolvent and 33 healthy companies between 1946 and 1965,
covering ratios considered important for the financial stability of companies, such
as liquidity, solvency, profitability and indebtedness. The discriminant function
seems to show that financial distress could be anticipated one year prior to
insolvency with accuracy for 94% of insolvent companies and 97% of healthy
firms. However, the model lost ability to accurately forecast from the first to the
fifth year prior to bankruptcy, from 95% to 36%.
Some years later, Altman, Haldeman and Narayanan (1977) improved the
original model, bringing up a new model, denominated by ZETA. In this empirical
study, the authors analysed a sample of manufacturing firms and retailers, of which
53 were insolvent and 58 were healthy, for the period between 1965 and 1972. The
discriminant function ZETA included 7 variables: Return on assets (EBIT / Total
assets), stability of profitability, debt, cumulative profitability, liquidity,
capitalization and size. This kind of model presents some restrictions as MDA
assumes that the ratios are multivariate normally distributed. Further, linear
discriminant analysis is more appropriate when the covariance across the variables
is equal for the groups of failed and operating firms. Nevertheless, several authors
used this model, such as Edmister (1972) and Agarwal and Taffler (2008).
Other studies have considered conditional probability models, such as the logit
and Probit models. The Logit model uses conditional probability and is obtained
from a logistic regression. This model is a statistical technique in which the
dependent variable is qualitative, assuming two possible values, and can be
interpreted as the probability that a particular event occurs (in this case, the
particular event is the bankruptcy).
Given that the discriminant analysis model entails vulnerability, Ohlson (1980)
presented a logistic regression model, which assumes a non-linear estimation.
Ohlson’s study was based on information collected in the period between 1970 and
146 INSOLVENCY PREDICTION IN CONSTRUCTION INDUSTRY: PORTUGAL
1976, in the industrial domain, with a sample of 105 insolvent companies and 2,058
healthy companies, which resulted in an unbalanced sample. The author used 9
explanatory variables and estimated three Logit models in cross-section data. The
results showed 4 significant factors, affecting the likelihood of bankruptcy:
company size, financial structure, and several performance and liquidity measures.
Ohlson concluded that the predictive power of this model depend on the timing at
which the company’s financial information was obtained.
Regarding the Probit model, it derives from the cumulative function of a normal
distribution and is similar to the Logit model. The two models have the same
fundamental, differing only in the distribution. Zmijewski (1984) used a sample of
40 insolvent companies and 800 operating companies, analysing the period between
1972 and 1978. The author concluded that this technique did not provide qualitative
results different from the results provided by random sampling techniques.
Some authors compare these models. Laitinen and Kankaanpää (1999) stated
that the prediction accuracy depends on the model applied and Ugurlu and Aksoy
(2006) concluded that the logistic regression produced better results than the
discriminant analysis model.
Correa, Acosta and González (2003) analyzed a SME sample from Santa Cruz
of Tenerife, concluding that the variables with greater explanatory capacity for
bankruptcy diagnostic are the indebtedness, the economic yield and solvency
indicators.
There are some empirical studies conducted in the Portuguese market.
Leal and Machado-Santos (2007) explored the bankruptcy phenomenon in the
Portuguese textile industry, using a sample of 52 companies for the period 1996 to
2002. They concluded that financial distress could be anticipated with an accuracy
of 97%, 85% and 76.5%, respectively for one, two and three years before
bankruptcy. In addition, they concluded that while the discriminant model separates
the healthy firms from those that have financial problems, the Logit model allows
estimating the probability of the company becoming insolvent.
Barros (2008) forecasted the bankruptcy of small and medium size Portuguese
companies, based on a sample of 336 operating and 336 insolvent companies.
Employing the Logit and the Probit models, he verified that the Z-score model was
not appropriate for the sample. The results showed that the ratios with greater
predictive power of bankruptcy were the profitability and the financial ratios, which
measure the company’s ability to meet its financial commitments.
Lacerda and Moro (2008) analyzed the companies’ behavior, according to its
payment obligations. Testing 47 ratios containing information on earnings,
leverage, cost structure, activity, size and no accounting characteristics, they
MARMARA JOURNAL OF EUROPEAN STUDIES 147
concluded that the support vector machine model outperformed the Logit model
and the discriminant analysis.
Ribeiro (2011) tried to anticipate the failure tax firms in the wood furniture
industry, using the multivariate discriminant analysis and the Logit model. Their
results showed a positive relationship between debt and fiscal failure and a negative
relationship between fiscal solvency and short-term failure.
2. Methodology and Data
2.1 Methodology
As this study intends to analyze the relationship between insolvency and
economic and financial variables, we consider conditional probabilistic models,
where the dependent variable is a dummy, which assumes the value of one if the
firm is an insolvent firm, and zero otherwise (if it is an operating firm). This
categorization is complete given that each company belongs to one group or to the
other.
Three different approaches of analysis were considered: The linear probabilistic
model (LPM), the Logit and the Probit model. The LPM is estimated by the
ordinary least squares method (OLS) and the other two models are estimated by the
maximum likelihood estimation (MLE).
The LPM presents some disadvantages, such as the fact that it does not
guarantee the probability of a firm becoming insolvent restricted to (0,1). The
alternatives to LPM are the Logit and Probit models, which restrain the function to
(0,1). Probit assumes the normal standard distribution function and Logit assumes
the logistic distribution. These models are suitable for modelling events in terms of
probability and rating of one or two outputs and to assess the statistical significance
of the explanatory variables of the model, capturing the heterogeneity of individual
companies.
The McFadden’s (1974) R-squared test may be interpreted as a measure of
quality adjustment in the logistic regression. Wooldridge (2009) stated that this test
is similar to the R-square in the OLS regression.
2.2 Variables
We start by selecting 8 variables as predictors of financial insolvency, based on
previous studies. We consider these ratios preferred relative to others as they were
considered determinant for insolvency prediction in earlier evidence (e.g., Beaver,
1966; Altman, 1968; Ohlson, 1980; Zmijewski, 1984).
The first ratio was considered relevant in the studies of Beaver (1966) and
Zavgren (1985), and is defined as the Cash flow to total assets (CFA). The CFA
148 INSOLVENCY PREDICTION IN CONSTRUCTION INDUSTRY: PORTUGAL
ratio measures how successfully a company is in its capability to generate cash
from its resources, and it is calculated as follows:
Cash flow to total assets ratio Cash flow
Total assets
The debt ratio (Debt) indicates the level of indebtedness of a company. This
ratio measures the level of borrowed funds used to finance the company, assessing
the company’s level of dependence. The greater the ratio, the higher the risk to the
firm as a whole. This ratio was used by several authors, such as Beaver (1966),
Ohlson (1980) and Frydman, Altman and Kao (1985), and is computed as follows:
ebt ratio Total liabilities
Total assets
To evaluate the adequacy of the firm’s cash resources relative to its obligations
in order to verify the ability of debt repayment in the short term, we consider the
current ratio (CR). This ratio was used by Beaver (1966) and Altman, Haldeman
and Narayanan (1977):
Current ratio Current assets
Current liabilities
The return on assets (ROA) measures the operating efficiency of the firm, or the
ability to generate net income with the firms’ assets. Ohlson (1980) tested the
discriminant ability of this ratio:
Return on assets et income
Total assets
The asset turnover ratio (ATR) measures a company’s investment efficiency by
aggregating the joint impact of short and long-term assets. A higher asset turnover
ratio suggests that the company is working very close to the limit of its capacity
(Altman, 1968). It is determined by the equation:
Asset turnover ratio Sales
Total assets
Following Altman (1968), we consider the working capital ratio (WCR), given
that working capital is the excess of current assets to cover short-term debts. This
ratio indicates the security margin when the lenders claim the reimbursement of the
debts, and its value is given by:
orking capital ratio Capital ratio
Total assets
MARMARA JOURNAL OF EUROPEAN STUDIES 149
The net sales margin ratio (NSM) measures the contribution of sales in
generating net income. The higher the ratio value, the more its earnings power is
enhanced. This ratio is derived from the net margin achieved by the company after
deducting all charges:
et sales margin et income
Sales
Finally, the return on equity (ROE) indicates how well a company generates net
income from its equity, and reflects the return to common shareholders. This ratio
was used, for example, by Zmijewski (1984):
Return on equity et income
Equity
These ratios analyses the firm’s debt levels, the liquidity, the profitability and
the business efficiency.
It is expected a positive sign to the Debt ratio, since the higher the debt, the
higher the probability of a firm becoming insolvent. Regarding the profitability, the
liquidity and the activity ratios, it is expected a negative sign, since the higher the
ratios, the lower the probability of companies coming into economic and financial
difficulties situations. The greater the ability to generate results (profitability), to
pay the short-term debt on time (liquidity) and the business efficiency in generating
sales (turnover), the less likely the company becomes insolvent.
Thus, we can hypothesize that the debt ratio is positively related to the
probability of a firm becoming insolvent and that the cash-flow/total assets, the
current asset/current liabilities, the net income/total assets, the sales/total assets, the
working capital/total assets, the net income/sales and the net income/equity are
negatively related to the firms’ insolvency probability.
Our econometric model is based on a cross-section analysis and is given by the
following expression:
(1)
where:
= 1 if the company is insolvent and 0 otherwise;
= Cash-flow/Total assets;
= Liabilities/Total assets;
= Current asset/Current liabilities;
= Net income/Total assets;
= Sales/Total assets;
= Working capital/Total assets;

150 INSOLVENCY PREDICTION IN CONSTRUCTION INDUSTRY: PORTUGAL
= Net income/Sales;
= Net income/Equity;
= Error term.
Because we want to study several years prior to the insolvency date, cross-
function models were run for each different year.
2.3 Data
Before deciding which industry to consider in the study, we analyse the
evolution of insolvency cases between 2009 and 2011, in order to see which the
most precarious sectors are.
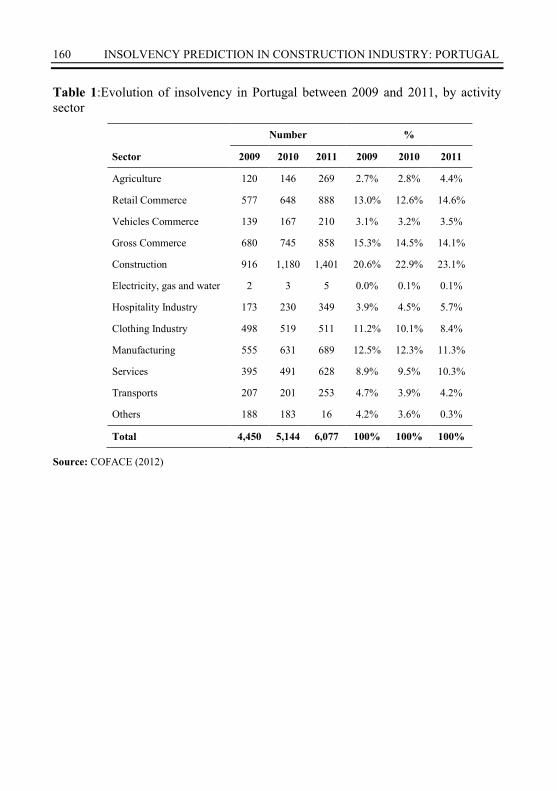
Table 1 shows the evolution of insolvencies number between 2009 and 2011,
characterized by the activity sector.
As we can see, the construction sector is the most affected by insolvencies,
increasing from 916 in 2009 to 1,401 in 2011, representing a raise of about 53%,
well above the overall increase of 37%. In this context, we focused our study in the
construction industry.
The sample consists of 150 failed and 150 operating construction firms. The
first group includes firms that were considered insolvent between 2010 and 2011.
The financial and economic data were collected from the SABI database of Bureau
Van Dijk, considering the following filters: the firm must be Portuguese, belong to
the construction sector, be a legally public or private held company, have a
maximum of 250 employees and must have information available from 2005 to
2010. With these criteria 150 small and medium sized companies were obtained.
The group of operating firms must be in activity at the data collection date. A
sample of 150 “healthy” companies was taken keeping the same criteria as above
mentioned.
3. Empirical Results
Table 2 reports the Pearson correlations among the independent variables for all
the firms (Panel A), the insolvent firms (Panel B) and the “healthy” firms (Panel C).
For reasons of simplicity, only the results for the year prior to the insolvency are
shown.
Concerning the global sample (Panel A), we can see that the highest values for
correlations are between CFA and ROA (positive), between ROA and Debt
(negative) and between CFA and Debt (negative). When observing the insolvent
firms (Panel B), it is noticed that highest correlations are between CFA and ROA
(positive) and between CFA and ATR (negative). Finally, in relation to operating
firms (Panel C), the highest value for the Pearson correlation is between CFA and
MARMARA JOURNAL OF EUROPEAN STUDIES 151
WCR. Globally, it does not appear to be sufficiently large to cause concern about
multicollinearity problems.
Table 3 presents the variables descriptive statistics for the year prior to
insolvency regarding the insolvent companies (Panel A) and the operating
companies (Panel B).
As expected, the group of insolvent firms presents lower levels of liquidity and
profitability, and higher levels of indebtedness, reflecting its financial distress.
Furthermore, the cash-flow to total assets is negative in insolvent firms, and
positive in operating firms.
We estimate the LPM, the Logit and the Probit models. Table 4 presents the
results for the three models in the year prior to insolvency, considering first all
previously mentioned ratios (Panel A) and later the ratios considered significant to
predict insolvency (Panel B).
It is important to emphasize that, according the F-statistic in LPM and the LR-
statistic in Logit and Probit models, all the models are statistically significant at 1%
level, explaining the insolvency phenomenon. This result is important because,
otherwise, the models would be inappropriate for the study of forecasting
insolvency.
According the LPM results (Panel A), with the exceptions of the return on
equity and the current ratio, all the other variables are statistically significant, being
appropriate for the bankruptcy prediction.
According to the LPM results on Panel B, where only the significant variables
of LPM initial model (Panel A) were considered, the results can be expressed as
follows:
probi 0.38 - 1.13CFA 0.12 ebt 0.49 ROA -0.1 ATR 0.22 CR - 0.0002 S (2)
This is the expression of LPM for the previous year before insolvency. It can be
concluded that 61.54% of variations of endogenous variable are explained by the
model, according to the R-squared.
However, although we expect a positive value only for the coefficient of
indebtedness, the ROA and the WCR show also positive values, meaning that, as
these ratios increase, the likelihood of the company being insolvent is higher.
Regarding the Logit and Probit models estimates (Panel A), the cash-flow to
total assets and the asset turnover ratio are statistically significant and have the
expected sign. In addition, for the Probit model, the return on assets is also
significant.

152 INSOLVENCY PREDICTION IN CONSTRUCTION INDUSTRY: PORTUGAL
The Panel B shows the estimated coefficients considered relevant in the
previous Panel. In the Probit model, the return on assets ratio is relevant but the
sign is contrary to the expected one.
The Logit model’s regression can be expressed in the following way:
Probi 1
1 e-(4. 7 – 29.79 CFA – 1. 1 ATR) (3)
The estimative of Probit in the previous year can be described by the expression:
probi (2.89 – 19.1 CFA 7.01 ROA – 1.09 ATR) (4)
According to the Probit model results, it can be stated that when cash-flow to
total assets and assets turnover ratio are higher, the probability of a firm become
insolvent is lower. Nevertheless, the fact of return on assets being directly related
with insolvency probability is an interesting result. In what concerns the return on
assets, our results are consistent with the ones of Barros (2008). However, we find a
negative sign in the turnover assets ratio, and Barros (2008) found a positive sign.
Comparing through the McFadden’s R-squared, the Probit model is more
enhanced than the Logit, because the Probit value is higher. However, we cannot
compare directly the R-squared of those models with the one of the LPM model.
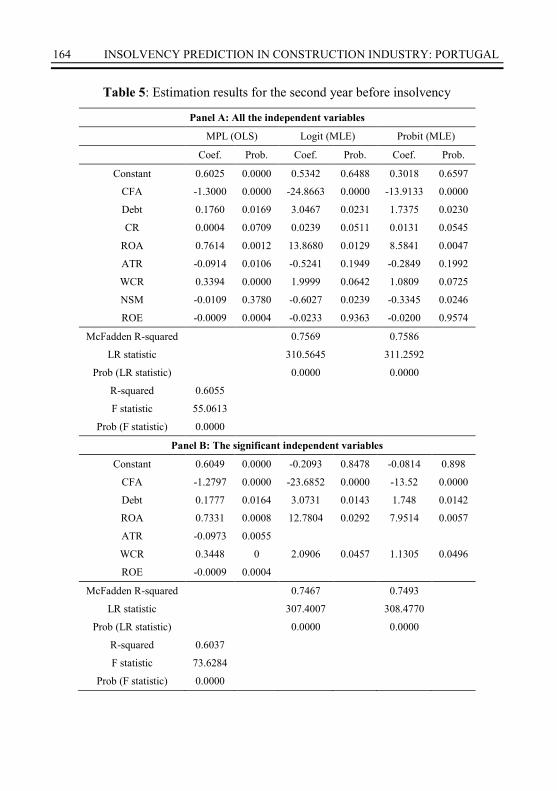
Table 5 shows the results for the second year previous of insolvency,
considering all the ratios (Panel A) and only those considered significant to predict
insolvency (Panel B).
Compared with Table 4 in the LPM, there is a reduction in the explanatory
power of the model for the second year before the insolvency, decreasing the R-
squared from 61.54% to 60.37%. It can be seen that all variables are statistically
significant except the profitability on net sales ratio that becomes insignificant in
relation to the previous year before insolvency (Panel A).
The expression of the probability of insolvency when reducing the number of
independent variables (Panel B) can be expressed as:
probi 0. 0 – 1.28CFA 0.18 ebt 0.73ROA – 0.097ATR 0.34 CR – 0.0009ROE (5)
As we can see, all the coefficients have the expected signal, with the exception
of the ROA.

MARMARA JOURNAL OF EUROPEAN STUDIES 153
Regarding the Logit and the Probit models (Panel B), all the variables are
significant. However, the WCR and the profitability on net sales ratio present a
positive sign when they are expected to be negative.
The results indicate that the higher the values on ROA, WCR and debt ratios,
the higher the probability of a firm becoming insolvent in two years before the
insolvency. In addition, when the cash-flow ratio increases, the probability of
insolvency decreases.
The expression of the Logit model for the second year previous the insolvency
is the following:
probi
1
1 e-(-0.21 – 23. 9 CFA 3.07 ebt 12.78 ROA 2.09 CR) (6)
probi (- 0.08 – 13. 2 CFA 1.7 ebt 7.9 ROA 1.13 CR) (7)
The Probit model can be expressed as follows:
The explanatory capacity of the two models decreases slightly from the first to
the second year, according to the McFadden’s R-Squared. It decreases from 0.76 to
0.75 in both models. For this year, the Probit model is better than the Logit model.
For the third year prior to the bankruptcy, the LPM results in the following
expression1:
probi 0.29 – 1. CFA 0.202 ebt 0.91ROA – 0.1ATR 0. 7 CR 0.00 SM (8)
Concerning the significant ratios, the turnover on assets ratio, the debt ratio and
the cash-flow to total assets present the expected sign. Nevertheless, the
profitability indicators sign remain positive, opposite to the expected negative. The
R-squared of that expression is 62.17%. This percentage increased comparing with
the last years.
The Logit model is the following:
probi 1
1 e- (- 0.7 – 22.42 CFA 4.4 ebt – 1.19 ROA .19 CR) (9)
1 For reasons of simplicity, we do not include the following tables, but they are available upon request to
the authors.

154 INSOLVENCY PREDICTION IN CONSTRUCTION INDUSTRY: PORTUGAL
The Probit model can be expressed as:
probi (-0.4 – 12.44 CFA 2.44 ebt – 0.7 ROA 3.7 CR) (10)
From the obtained results, when cash-flow and the ROA increase, the
probability of a firm to become insolvent decreases. On the other hand, when WCR
and debt ratio increase, the probability is higher. With the exception of the WCR,
all the other coefficients are coherent with the expected sign. Once again, the Probit
model is better, presenting a McFadden R-squared of 0.75.
The estimations for the fourth year previous of insolvency results in the
following expressions for the LPM model (11), the Probit model (12) and the Logit
model (13):
probi 0. – 1. 4 CFA 0.1 ebt 0. 9 ROA 0.39 CR 0.01 SM (11)
In this year the capacity to explain the probability of bankruptcy with the LPM
model decreases approximately 60%. According to our expectations, the cash-flow
to total assets is negative and the debt ratio is positive, suggesting that firms with
higher ratios of cash-flow to total assets present lower probability of bankruptcy
and that higher level of indebtedness results in higher probability to become
insolvent. Once again, the profitability ratios have a positive impact in insolvency
probability.
probi
1
1 e-(3.2 – 22.4 CFA) (12)
probi (1.84 – 12.9 CFA) (13)
In expression (13), the sign of the only relevant ratio is negative, according to
our expectation. The fact that many ratios are irrelevant led to the conclusion that
by the fourth year before insolvency it is hard to demonstrate if a firm will become
insolvent or not in a foreseeable future.
Finally, we present the results for the estimations for the fifth year previous the
insolvency. It was expected that the model presents a lower capacity of explaining
the bankruptcy probability given the time distance to the phenomenon.
MARMARA JOURNAL OF EUROPEAN STUDIES 155
According to the model results, we can express the LPM model as follows:
probi 0.4 – 1.47 CFA 0.22 ebt 0.001 CR 0.9 ROA 0.48 ATR 0.48 CR – 0.0 ROE (14)
There are 7 determinants of bankruptcy and the explaining power of the model
is 61.2%.
The expression of the Logit model can be expressed by:
probi
1
1 e-(-0.1 – 14.3 CFA 2.33 ebt 2.22 CR) (15)
According to these two models, the results show that the likelihood to become
insolvent decreases with the cash-flow to total assets ratio, and increases with the
indebtedness and WCR.
The Probit model can be shown by the following expression:
probi (-0.7 – 7.9 CFA 2 ebt 3.78 ROA 1.7 CR) (16)
According to (16), the probability of a firm to become insolvent increases with
debt, ROA and WCR, and decreases with CFA.
From the fourth to the fifth year before insolvency, the McFadden’s R-Squared
decreases in both models, from 0.69 to 0,64 in the Logit model and from 0.70 to
0,64 in the Probit model.
Summarising the obtained results, the Logit and the Probit models loose
adjustment quality as the year considered moves away from the year in which the
companies were declared insolvent, which can be seen in the McFadden R-squared
that decreases when we move away from the insolvency year. In general, the Probit
model presents more robust results than the Logit model2.
The current ratio is not important to the prediction of insolvency, since it is not
statistically significant in all years, and for all models, with the exception of the
MPL (and only in the fifth year prior to insolvency).
2 Although the McFadden R-square is a measure of quality fitting, it cannot be directly compared with
the R-squared of MPL.

156 INSOLVENCY PREDICTION IN CONSTRUCTION INDUSTRY: PORTUGAL
The cash-flow to total assets ratio is negative and statistically significant in all
models, as well as in all the periods, suggesting that the likelihood of a firm to
become insolvent decreases with the cash-flow on total assets ratio.
The results show that the probability to bankruptcy increases with the
indebtedness of the companies. This evidence is consistent with the results of
Ohlson (1980), Zavgren (1985), Barros (2008) and Ribeiro (2011), which generally
concluded that the debt ratio has a positive impact on the insolvency prediction.
Despite the sign is always positive for the Logit and Probit models, in two of the
years it does not show statistically significant values. A possible explanation for
this evidence is based on the evidence that both operating and insolvent firms
present high degrees of indebtedness in these years.
The ROA and the WCR have been inconsistent with our expectations. Although
we expect a negative sign, the results show a positive coefficient. However, the
WCR sign is consistent with the results of Altman (1968).
The ROA ratio presents the expected sign in the Logit and the Probit models,
but only for the third year before the insolvency. The ROE and the profitability on
net sales do not appear to be good predictors to explain the insolvency
phenomenon, which is in line with the results of Zavgren (1985). Particularly, the
profitability on net sales has only statistical significance in the first, third and fourth
year prior to the insolvency in the LPM, and the sign is negative in the first year and
positive in the other two periods, which suggests that the analysis of the capacity of
generating a net margin on sales is not the main factor to explain the insolvency
phenomenon. Although there is consistency with the negative sign of the ROE, this
is only significant in the linear probability model in the second and fifth year prior
of insolvency.
The turnover asset ratio appears to be a good predictor of insolvency in the three
years prior to insolvency in LPM, but only in the first year prior to insolvency in the
case of the Probit and the Logit models. Its sign is negative, suggesting that the
higher the ratio of turnover asset, the less the probability of a company to become
insolvent. This variable is not statistically significant after the third year prior to the
bankruptcy, which might be explained by the similar ROA values in the “healthy”
and “non-healthy” firms.
In sum, the ratio that has more capacity to predict bankruptcy over the different
periods in the Portuguese construction industry is the ratio of cash-flow to total
assets, which is consistent with the results of Beaver (1966).
Although we compare our results with previous studies, we must be cautious
because the results are dependent on the period of analysis, the industry considered
and the economic and social environment.
MARMARA JOURNAL OF EUROPEAN STUDIES 157
Conclusion
In the actual context of recession, companies are facing financial increasing
difficulties, being relevant the analysis of the probability of bankruptcy. In this
context, we run different models of insolvency, considering a sample of Portuguese
firms in the construction industry, which had suffered with the global crisis context.
The LPM, the Logit and the Probit models were adopted.
Globally, we find evidence that the variables that can explain the phenomenon
of insolvency are the liquidity, leverage, profitability and activity ratios. Overall,
the conditional probability models, the Logit and the Probit, exhibit a decrease in
the explanatory power over the period in which they move away from the
insolvency year.
When comparing the Logit and the Probit models, the results shows that,
globally, the Probit is the best model to explain the phenomenon of insolvency,
telling that the sample of companies are homogeneous.
The results achieved with the econometric models suggest that there is a
relationship between the economic and financial indicators and the probability that
a company presents financial difficulties. However, not all the ratios have the same
predictive capacity. The profitability ratios do not appear to be good predictors of
insolvency, as also concluded by Zavgren (1985). In addition, the results show a
positive relationship between the debt ratio and the probability of a firm becoming
insolvent, which is in accordance with several previous studies (Ohlson, 1980;
Zavgren, 1985; Barros, 2008; Ribeiro, 2011).
We conclude that the ratio that can best catch the phenomenon of insolvency in
the Portuguese construction industry is the cash-flow to total assets ratio. Beaver
(1966) found also a significant relationship between this ratio and the probability of
insolvency.
The conducted research can help in the determination of some warning signs of
insolvency, as well as in the relative positioning of each company in terms of
insolvency risk. However, we must be aware that the global crisis might influence
the findings.
158 INSOLVENCY PREDICTION IN CONSTRUCTION INDUSTRY: PORTUGAL
References:
Agarwal, V., & Taffler, R., (2008), “Comparing the performance of market-based and
accounting-based bankruptcy prediction models”, Journal of Banking & Finance, 32, pp.
1541-1551.
Altman, E., (1968), “Financial Ratios, Discriminant Analysis and the Prediction of Corporate
Bankruptcy”, The Journal of Finance, 23 (4), pp. 589-609.
Altman, E., Haldeman, R., & Narayanan, P., (1977), “Zeta analysis: A new model to identify
bankruptcy risk of corporations”, Journal of Banking and Finance, 1, pp. 29-54.
Barros, G., (2008), “Modelos de previsão da falência de Empresas: Aplicação Empírica ao
Caso das Pequenas e Médias Empresas Portuguesas”, Master Dissertation, ISCTE,
Instituto Universitário de Lisboa.
Beaver, W., (1966), “Financial Ratios as Predictors of Failure”, Empirical Research in
Accounting, selected studies, in supplement to the Journal of Accounting Research, pp.
71-111.
Blum, M. (1974), “Failing Company iscriminant Analysis”, Journal of Accounting
Research, Spring, pp. 1-25.
COFACE - Serviços Portugal (2012), Estudo anual de insolvências, créditos vencidos e
constituições de empresas Portugal 2011.
Correa, A., Acosta, M., & González, A. L., (2003), “La insolvencia empresarial: un análisis
empírico para la pequeña y mediana empresa”, Spanish Accounting Review, 6 (12), pp.
47-79.
Edmister, R. (1972), “An Empirical Test of Financial Ratio Analysis for Small Business
Failure Prediction”, The Journal of Financial and Quantitative Analysis, 7 (2), pp. 1477-
1493.
Frydman, H., Altman, E., & Kao, D., (1985), “Introducing Recursive Partitioning for
Financial Classification: The Case of Financial Distress”, The Journal of Finance, 40 (1),
pp. 269-291.
Lacerda, A., & Moro, A., (2008), Analysis of the predictors of default for Portuguese firms.
Working Paper 22, Banco de Portugal, Retrieved: 15 March 2013, http://www.diw-
econ.de/de/downloads/Moro%20BdP_2008-22.pdf.
Laitinen, T., & Kankaanpää, M., (1999), “Comparative analysis of failure prediction
methods: the Finnish case”, The European Accounting Review, 8 (1), pp. 67–92.
Leal, C., & Machado-Santos, C., (2007), “Insolvency prediction in the Portuguese textile
industry”, European Journal of Finance and Banking Research, 1 (1), pp. 16-28.
McFadden, D., (1974), Condicional Logit Analysis of Qualitative Choice Analysis. New
York: Academic Press.
Ohlson, J., (1980), “Financial Ratios and the Probabilistic Prediction of Bankruptcy”,
Journal of Accounting Research, 18 (1), pp. 109-131.
Ribeiro, S., (2011), “Modelos de Previsão de Incumprimento Fiscal Através de Informação
Financeira: Estudo das Empresas de Mobiliário de Madeira” Master Dissertation,
Faculdade de Economia da Universidade do Porto.
MARMARA JOURNAL OF EUROPEAN STUDIES 159
Ugurlu, M., & Aksoy, H., (2006), “Predicting Corporate financial distress in an emerging
market: the case of Turkey”, Cross Cultural Management: An International Journal, 13
(4), pp. 277-295.
Voulgaris, F., Doumpos, M., & Zopounidis, C., (2000), “On the Evaluation of Greek
Industrial SMEs’: Performance via Multicriteria Analysis of Financial Ratios”, Small
Business Economics, 15, pp. 127-136.
Wooldridge, J., (2009) Introductory Econometrics. South-Western: Cengage Learning.
Zavgren, C., (1985), “Assessing the vulnerability to failure of American Industrial Firms: A
Logistic Analysis”, Journal of Business & Accounting, 12 (1), pp. 19-45.
Zmijewski, M., (1984), “Methodological Issues Related to the Estimation of Financial
Distress Prediction Models”, Journal of Accounting Research, 22 Supplement, pp. 59-82.
160 INSOLVENCY PREDICTION IN CONSTRUCTION INDUSTRY: PORTUGAL
Table 1:Evolution of insolvency in Portugal between 2009 and 2011, by activity
sector
Number %
Sector 2009 2010 2011 2009 2010 2011
Agriculture 120 146 269 2.7% 2.8% 4.4%
Retail Commerce 577 648 888 13.0% 12.6% 14.6%
Vehicles Commerce 139 167 210 3.1% 3.2% 3.5%
Gross Commerce 680 745 858 15.3% 14.5% 14.1%
Construction 916 1,180 1,401 20.6% 22.9% 23.1%
Electricity, gas and water 2 3 5 0.0% 0.1% 0.1%
Hospitality Industry 173 230 349 3.9% 4.5% 5.7%
Clothing Industry 498 519 511 11.2% 10.1% 8.4%
Manufacturing 555 631 689 12.5% 12.3% 11.3%
Services 395 491 628 8.9% 9.5% 10.3%
Transports 207 201 253 4.7% 3.9% 4.2%
Others 188 183 16 4.2% 3.6% 0.3%
Total 4,450 5,144 6,077 100% 100% 100%
Source: COFACE (2012)

MARMARA JOURNAL OF EUROPEAN STUDIES 161
Table 2: Correlation matrix
Panel A: All Companies
CFA Debt CR ROA ATR WCR NSM ROE
CFA 1 -0.5881 0.2077 0.7054 -0.3708 0.5411 0.029 0.005
Debt
1 -0.1354 -0.6146 0.3669 -0.5232 0.0718 0.0228
CR
1 0.0448 -0.1108 0.1842 0.0006 -0.0044
ROA
1 -0.5458 0.3262 -0.0041 0.0081
ATR
1 -0.3644 0.0746 -0.0229
WCR
1 0.0254 -0.0621
NSM
1 0.0011
ROE
1
Panel B: Insolvent Companies
CFA Debt CR ROA ATR WCR NSM ROE
CFA 1 -0.6782 0.2827 0.9958 -0.7202 0.3668 0.0218 0.0091
Debt
1 -0.4736 -0.6757 0.6159 -0.6122 0.1115 0.0245
CR
1 0.2956 -0.1746 0.4849 -0.2284 -0.0887
ROA
1 -0.7374 0.3731 -0.0259 -0.0018
ATR
1 -0.4372 0.0859 -0.0293
WCR
1 0.0101 -0.0729
NSM
1 0.0008
ROE
1
Panel C: Operating Companies
CFA Debt CR ROA ATR WCR NSM ROE
CFA 1 0.0449 0.2663 -0.1561 -0.3114 0.9118 0.0027 -0.1717
Debt
1 -0.1986 0.025 -0.1101 0.023 -0.1492 0.2165
CR
1 -0.0087 -0.1969 0.2768 0.0549 -0.0349
ROA
1 -0.2203 -0.1112 0.1325 0.7064
ATR
1 -0.3229 0.0513 0.0043
WCR
1 0.1077 -0.1159
NSM
1 0.0927
ROE
1

162 INSOLVENCY PREDICTION IN CONSTRUCTION INDUSTRY: PORTUGAL
Table 3: Descriptive statistics
Panel A: Insolvent Companies
CFA Debt CR ROA ATR WCR NSM ROE
Mean -0.1282 1.1269 1.2464 -0.1562 0.9322 0.3059 -0.3931 0.1747
Median 0.0021 0.8949 1.1046 -0.0177 0.7598 0.3754 -0.0288 0.0388
Maximum 0.3151 5.8703 5.8566 0.3102 6.7862 0.9183 0.5744 69.9892
Minimum -2.3714 0.1144 0.0503 -2.8333 0.0000 -2.0687 -8.3940 8.0212
Std. Dev. 0.3765 0.7512 0.8343 0.3881 0.9640 0.4161 1.1519 8.0213
Panel B: Operating Companies
CFA Debt CR ROA ATR WCR NSM ROE
Mean 0.4506 0.6902 3 0.0145 1.0821 0.4775 -0.0706 0.1082
Median 0.4278 0.7307 1.4474 0.021 1.0442 0.4363 0.0177 0.0729
Maximum 0.9998 2.9914 21.2118 0.3167 5.2819 0.9998 14.2016 1.3253
Minimum 0.0312 0.0055 0.3343 -1.4674 0.0005 0.0487 -27.8089 -1.8669
Std. Dev. 0.2597 0.3155 18.3446 0.1552 0.7230 0.2447 2.4689 0.2808

MARMARA JOURNAL OF EUROPEAN STUDIES 163
Table 4: Estimation results for the first year before insolvency
Panel A: All the independent variables
MPL (OLS) Logit (MLE) Probit (MLE)
Coef. Prob. Coef. Prob. Coef. Prob.
Constant 0.6693 0.0000 3.6156 0.0417 2.1307 0.0378
CFA -1.1458 0.0000 -33.5934 0.0000 -18.5666 0.0000
Debt 0.1293 0.0394 1.7350 0.3034 0.8679 0.3639
CR 0.0006 0.3422 -1.1426 0.6276 -0.0881 0.5939
ROA 0.5076 0.0388 11.4067 0.1098 6.8123 0.0689
ATR -0.1635 0.0000 -2.1781 0.0047 -1.2260 0.0029
WCR 0.2422 0.0017 1.9270 0.1786 1.0357 0.1852
NSM -0.0002 0.0000 -0.1149 0.5664 -0.0629 0.5428
ROE 0.0000 0.9976 0.0267 0.6174 0.0152 0.5822
McFadden R-squared
0.8174
0.8178
LR statistic
320.6685
320.8448
Prob (LR statistic)
0.0000
0.0000
R-squared 0.6154
F statistic 74.1343
Prob (F statistic) 0.0000
Panel B: The significant independent variables
Constant 0.3825 0.0000 4.5722 0.0000 2.8865 0.0000
CFA -1.1304 0.0000 -29.7859 0.0000 -19.1577 0.0000
Debt 0.1186 0.0457
ROA 0.4923 0.0337
7.0087 0.0383
ATR -0.1629 0.0003 -1.5103 0.0204 -1.0883 0.0032
WCR 0.2241 0.0023
ROE -0.0002 0.0001
McFadden R-squared
0.8040
0.8131
LR statistic
326.4513
330.1408
Prob (LR statistic)
0.0000
0.0000
R-squared 0.6154
F statistic 74.1343
Prob (F statistic) 0.0000
164 INSOLVENCY PREDICTION IN CONSTRUCTION INDUSTRY: PORTUGAL
Table 5: Estimation results for the second year before insolvency
Panel A: All the independent variables
MPL (OLS) Logit (MLE) Probit (MLE)
Coef. Prob. Coef. Prob. Coef. Prob.
Constant 0.6025 0.0000 0.5342 0.6488 0.3018 0.6597
CFA -1.3000 0.0000 -24.8663 0.0000 -13.9133 0.0000
Debt 0.1760 0.0169 3.0467 0.0231 1.7375 0.0230
CR 0.0004 0.0709 0.0239 0.0511 0.0131 0.0545
ROA 0.7614 0.0012 13.8680 0.0129 8.5841 0.0047
ATR -0.0914 0.0106 -0.5241 0.1949 -0.2849 0.1992
WCR 0.3394 0.0000 1.9999 0.0642 1.0809 0.0725
NSM -0.0109 0.3780 -0.6027 0.0239 -0.3345 0.0246
ROE -0.0009 0.0004 -0.0233 0.9363 -0.0200 0.9574
McFadden R-squared
0.7569
0.7586
LR statistic
310.5645
311.2592
Prob (LR statistic)
0.0000
0.0000
R-squared 0.6055
F statistic 55.0613
Prob (F statistic) 0.0000
Panel B: The significant independent variables
Constant 0.6049 0.0000 -0.2093 0.8478 -0.0814 0.898
CFA -1.2797 0.0000 -23.6852 0.0000 -13.52 0.0000
Debt 0.1777 0.0164 3.0731 0.0143 1.748 0.0142
ROA 0.7331 0.0008 12.7804 0.0292 7.9514 0.0057
ATR -0.0973 0.0055
WCR 0.3448 0 2.0906 0.0457 1.1305 0.0496
ROE -0.0009 0.0004
McFadden R-squared
0.7467
0.7493
LR statistic
307.4007
308.4770
Prob (LR statistic)
0.0000
0.0000
R-squared 0.6037
F statistic 73.6284
Prob (F statistic) 0.0000