insights from gene expression patterns of heat shock...
TRANSCRIPT

Universidade de Lisboa
Faculdade de Ciecircncias
Departamento de Biologia Animal
Insights from gene expression patterns of
heat shock proteins in thermal adaptation of
Iberian Cyprinids and its implications for
conservation
Tiago Filipe Salgueiro de Jesus
Mestrado em Biologia da Conservaccedilatildeo
2010
Universidade de Lisboa
Faculdade de Ciecircncias
Departamento de Biologia Animal
Insights from gene expression patterns of
heat shock proteins in thermal adaptation of
Iberian Cyprinids and its implications for
conservation
Tiago Filipe Salgueiro de Jesus
Dissertaccedilatildeo orientada por
Prof Doutora Maria Manuela Gomes Coelho Noronha Trancoso
Doutora Maria Acircngela Ribeiro Marques Inaacutecio
Mestrado em Biologia da Conservaccedilatildeo
2010
Abstract
The freshwater fish of the Squalius genus are distributed throughout a latitudinal
gradient in the river basins of the Iberia Peninsula namely in Portugal in which distinct
species are exposed to different river regimes S carolitertii inhabits in the northern
region S pyrenaicus in the central and southern region and S torgalensis is restricted to
a river in the southwestern region Watercourses from these distinct regions differ in
their environmental conditions namely in temperature The Heat Shock Proteins are a
widely studied group of proteins involved in stress responses such as heat stress
Aiming to provide new insights on the molecular mechanisms involved in thermal
adaptation of three species of the Squalius genus distributed throughout a latitudinal
cline several experimental assays were performed exposing fish to different
temperature treatments Results suggest the existence of latitudinal variation in the
expression patterns of the hsp70 gene with the southern species S torgalensis having
the higher induction of hsp70 Similarly to S torgalensis S pyrenaicus presented an
increment in hsp70 mRNA levels when exposed to high temperatures Despite it had not
been possible to test the existence of a similar pattern for hsc70 gene a significant
induction of this gene was observed for S torgalensis On the other hand S carolitertii
did not present a significant increment in both genes though many other genes may be
involved in thermal tolerance All together these results point that S torgalensis is well
adapted to a harsher environment However careful should be taken when interpreting
these results because climate change may increase the severity of the intermittent river
regime in the southern region with the increasing occurrence of extreme drought
events The comprehension of these mechanisms by which fish deal with harsh
environments is of extreme importance for conservation purposes in a context of climate
change
Keywords Cyprinidae Squalius thermal tolerance hsp70 hsc70 gene expression
Resumo
O stress ambiental nomeadamente o stress teacutermico limita a distribuiccedilatildeo geograacutefica de
muitos dos seres vivos dado que coloca grandes desafios agrave sua sobrevivecircncia e
reproduccedilatildeo Estas condiccedilotildees de stress ambiental levam a que os organismos tenham que
mover-se para ambientes mais favoraacuteveis de forma a evitaacute-las Os organismos podem
ainda adaptar-se ao meio em questatildeo ou caso contraacuterio poderatildeo caminhar para a
extinccedilatildeo A compreensatildeo dos efeitos que o stress ambiental tem nas populaccedilotildees naturais
reveste-se de particular importacircncia devido aos crescentes efeitos das alteraccedilotildees
climaacuteticas particularmente nos ecossistemas de aacutegua doce
As proteiacutenas de choque teacutermico pertencem a um grupo de proteiacutenas amplamente
estudado e tecircm sido sugeridas como um mecanismo importante na resposta ao stress
teacutermico Estas desempenham diversos papeacuteis na manutenccedilatildeo da homeostase celular
nomeadamente assistindo na manutenccedilatildeo da estrutura de outras proteiacutenas e na
eliminaccedilatildeo de conformaccedilotildees de proteiacutenas natildeo nativas Apesar de serem amplamente
estudadas em diversos organismos modelo pouco se conhece da sua importacircncia nas
populaccedilotildees naturais nomeadamente ao niacutevel da expressatildeo geacutenica Contudo alguns
estudos jaacute demonstraram que estas proteiacutenas poderatildeo desempenhar um papel importante
em populaccedilotildees de animais expostos a temperaturas extremas
Estas proteiacutenas satildeo constituiacutedas por diversas famiacutelias nas quais as diferentes proteiacutenas
de choque teacutermico se agrupam de acordo com o seu peso molecular Particularmente a
famiacutelia das hsp70 eacute constituiacuteda por diversas formas induzidas por factores de stress e
por outras formas que se expressam constitutivamente durante o funcionamento normal
das ceacutelulas Estas uacuteltimas satildeo geralmente conhecidas por hsc70 enquanto que as
primeiras denominam-se por hsp70
Os peixes de aacutegua doce do geacutenero Squalius encontram-se amplamente distribuiacutedos na
Peniacutensula Ibeacuterica com diferentes espeacutecies expostas a diferentes tipos de regimes
sazonais No presente estudo testou-se a existecircncia de diferentes pradotildees de expressatildeo
dos genes hsp70 e hsc70 em trecircs espeacutecies do geacutenero Squalius que habitam trecircs regiotildees
distintas de Portugal Uma dessas trecircs espeacutecies foi S torgalensis uma espeacutecie ameaccedilada
com estatuto de ldquocriticamente em perigordquo que habita uma pequena bacia do Sul do paiacutes
(rio Mira) a qual eacute caracterizada por um regime intermitente de cheias e secas na
estaccedilatildeo chuvosa e na estaccedilatildeo seca respectivamente Outra das espeacutecies em estudo foi S
pyrenaicus classificada como ldquoespeacutecie em perigordquo com uma ampla distribuiccedilatildeo
geograacutefica na regiatildeo Centro e Sul da Peniacutensula Ibeacuterica Por fim S carolitertii cuja
distribuiccedilatildeo geograacutefica compreende os rios da regiatildeo Norte da Peniacutensula Ibeacuterica foi
amostrado em diversas bacias do Norte do paiacutes Os padrotildees de expressatildeo geacutenica destas
espeacutecies foram estudados em indiviacuteduos das trecircs espeacutecies submetidos a diferentes
condiccedilotildees experimentais nas quais estes eram expostos a diferentes temperaturas (20ordmC
25ordmC 30ordmC e 35ordmC)
Num ensaio preliminar foram comparados os padrotildees de expressatildeo geacutenica do gene
hsp70 no muacutesculo e barbatanas de peixes expostos aos diferentes tratamentos Com esta
comparaccedilatildeo foi possiacutevel verificar que os padrotildees de expressatildeo deste gene satildeo
semelhantes nos dois tecidos e por isso o estudo pocircde ser realizado nas barbatanas o
que constitui uma grande vantagem pois natildeo implica o sacriacuteficio dos animais
Os resultados obtidos nas diferentes condiccedilotildees experimentais sugerem a existecircncia de
um padratildeo de variaccedilatildeo na expressatildeo geacutenica do gene hsp70 de acordo com um gradiente
latitudinal de temperaturas no qual a espeacutecie que geralmente se encontra exposta a
temperaturas mais elevadas (S torgalensis) durante a estaccedilatildeo seca apresenta maior
induccedilatildeo deste gene relativamente agrave situaccedilatildeo controlo Tambeacutem S pyrenaicus
apresentou um incremento significativo na expressatildeo deste gene no entanto nenhum
indiviacuteduo desta espeacutecie conseguiu resistir ateacute aos 35ordmC Por outro lado S carolitertii
natildeo apresentou um aumento significativo de expressatildeo deste gene com o aumento da
temperatura Estes resultados sugerem que para S torgalensis e para S pyrenaicus a
induccedilatildeo do gene hsp70 pode ser importante para resistirem a temperaturas elevadas
nomeadamente durante a estaccedilatildeo seca No entanto no caso de S carolitertii dado que o
seu ambiente eacute mais estaacutevel do ponto de vista teacutermico a expressatildeo deste gene pode natildeo
ser tatildeo importante na medida em que muito raramente esta espeacutecie se encontra sujeita a
temperaturas tatildeo elevadas Relativamente agrave expressatildeo da forma constitutiva hsc70
devido agrave ausecircncia de amplificaccedilatildeo deste gene em indiviacuteduos de S pyrenaicus
possiacutevelmente relacionada com a existecircncia de mutaccedilotildees na zona de emparelhamento
dos primers natildeo foi possiacutevel averiguar a existecircncia de um padratildeo latitudinal semelhante
ao encontrado para o hsp70 No entanto tambeacutem natildeo era expectaacutevel que os niacuteveis de
expressatildeo da forma constitutiva aumentassem durante uma situaccedilatildeo de stress teacutermico
tal como aconteceu para S carolitertii para o qual natildeo se observou variaccedilatildeo
significativa da expressatildeo deste gene nas diferentes condiccedilotildees de teste Contudo S
torgalensis apresentou um aumento significativo dos niacuteveis de expressatildeo deste gene
quando exposto a 35ordmC Esta induccedilatildeo de uma forma da famiacutelia hsp70 que se pensava ser
constitutivamente expressa ou seja cuja expressatildeo natildeo variasse ou ateacute fosse reprimida
em situaccedilotildees de stress poderaacute constituir uma vantagem para S torgalensis no meio
onde vive dado que este apresenta um regime bastante severo durante a estaccedilatildeo seca
Esta vantagem poderaacute ser explicada pelo facto desta espeacutecie poder atraveacutes do aumento
dos niacuteveis de hsc70 poupar energia na resposta ao stress teacutermico natildeo necessitando
assim de mobilizar ainda mais o mecanismo de siacutentese de hsp70
Este conjunto de resultados sugere que S torgalensis estaacute bem adaptado agraves condiccedilotildees
extremas do seu habitat pois natildeo soacute esta espeacutecie eacute capaz de induzir de forma
signficativa a resposta de choque teacutermico como tambeacutem de aumentar os niacuteveis da
forma constitutiva Por outro lado apesar de S pyrenaicus tambeacutem induzir os niacuteveis de
hsp70 de forma significativa os indiviacuteduos desta espeacutecie sujeitos agraves condiccedilotildees de teste
natildeo conseguiram sobreviver a temperaturas superiores a 33ordmC o que sugere que esta
espeacutecie poderaacute enfrentar seacuterias dificuldades se ocorrerem alteraccedilotildees da temperatura
maacutexima da aacutegua na estaccedilatildeo quente ou variaccedilotildees diaacuterias da temperatura da aacutegua mais
pronunciadas Relativamente a S carolitertii o facto de alguns indiviacuteduos conseguirem
sobreviver a temperaturas mais elevadas do que S pyrenaicus poderaacute sugerir que a
primeira espeacutecie eacute mais tolerante ao stress teacutermico No entanto estes resultados devem
ser interpretados com reservas dado que neste estudo natildeo foi possiacutevel encontrar
nenhum mecanismo de resposta ao stress teacutermico para S carolitertii Contudo eacute
provaacutevel que existam outros mecanismos moleculares envolvidos na resposta ao stress
teacutermico que natildeo soacute possam ser importantes para S carolitertii como para as outras
espeacutecies estudadas
Eacute ainda possiacutevel que no futuro os efeitos das alteraccedilotildees climaacutetica se faccedilam sentir de
forma mais significativa em ambientes mais severos e nesse sentido a regiatildeo Sul do paiacutes
poderaacute vir a ser mais afectada por alteraccedilotildees do actual regime sazonal Um eventual
aumento de vagas de calor e da ocorrecircncia de secas extremas poderaacute constituir uma
ameaccedila acrescida a S torgalensis que apesar de bem adaptado pode natildeo conseguir
lidar com o agravar destas condiccedilotildees Nesse sentido deveraacute ser dada atenccedilatildeo agrave
preservaccedilatildeo dos pecircgos nos quais estes peixes se refugiam durante a estaccedilatildeo seca
O presente trabalho ilustra a importacircncia de estudar mecanismos de toleracircncia ao stress
ambiental e neste caso particular ao stress teacutermico de forma a compreender o
potencial que determinada espeacutecie tem para lidar com o ambiente no qual se encontra
Palavras-chave Cyprinidae Squalius toleracircncia teacutermica hsp70 hsc70 expressatildeo
geacutenica
Acknowledgements
To Professor Maria Manuela Coelho for having guided me during the elaboration of
this master thesis
To Doctor Maria Acircngela Inaacutecio for having tirelessly helped in practical questions
regarding the ldquoworld of RNArdquo and for the guidance provided during the elaboration of
the thesis
To Silke Waap for training me in basic laboratory techniques in molecular biology
To Maria Ana Ana Rita and Moacutenica Silva for being always available to discuss ideas
To the ldquoS alburnoides teamrdquo Miguel Machado Miguel Santos and Isa Matos for the
good humor and for the adventures that gave me some hair falling I know that Irsquom not
alone in the latter
To Ana Vieira for showing that someone can be even more stressed than me and
obviously for the useful share of angst regarding the RNA issues
To Diogo Silva for being such an enthusiast that share with me the passion for
molecular biology Our brainstorming sessions were most of the times very exciting
including those in which biology was not the discussed topic
To my parents who conceived and raised me
To myself for containing all my insanity for so long
To Rafaela Santos the most annoying person I have ever met and who supported me
whenever I needed the most
Contents
Preliminary note 1
List of abbreviations 2
Research article (in preparation) 3
Summary 3
Introduction 4
Materials and methods 8
Results 13
Discussion 22
Supplementary material 34
Appendix 37
1
Preliminary note
Initially this thesis had its main focus on the role of adaptative genetic variation of the
hsp70 gene in species previously included in the formerly described Chondrostoma
genus (recently revised) and Squalius genus inhabiting the Portuguese rivers However
during the elaboration of this master thesis some results cast doubt on the validity of
the comparison of the sequence variation between species as described in the Annex I
Neverthless these results were valuable to design the approach developed in the
scientific article now presented
2
List of abbreviations
ANOVA ndash Analysis Of Variance
bp ndash base pairs
cDNA ndash complementary DNA DNA synthesized from a mRNA template in a reaction
catalyzed by the enzyme reverse transcriptase
df ndash degrees of freedom
DNA ndash Deoxyribonucleic acid
gapdh ndash gene that encodes the Glyceraldehyde 3-phosphate dehydrogenase
HSF1 ndash Heat Shock Factor 1
HSP ndash Heat Shock Protein
HSR ndash Heat Shock Response
kDa ndash kiloDalton Unit of mass used express atomic and molecular weights
LiCl ndash Lithium chloride
min ndash minutes
mRNA ndash messenger RNA
PCR ndash Polymerase Chain Reaction
RNA ndash Ribonucleic acid
RT ndash Reverse Transcription
sec ndash seconds
Research article In preparation
3
Insights from gene expression patterns of heat shock proteins in
thermal adaptation of Iberian Cyprinids and its implications for
conservation
T F Jesus M A Inaacutecio M M Coelho
Summary
Thermal adaptation is vital for ectotherms such as fishes namely when exposed to large
variations in seasonal and even daily temperature Heat shock proteins (HSPs) are
molecular chaperones with an important role in several stress conditions such as high
temperatures In Portugal freshwater fish of the Squalius genus are distributed
throughout a latitudinal gradient in which different species are exposed to different
river regimes The southern rivers are characterized by an intermittent regime of floods
and droughts in which during the dry season fish are subject to harsh temperatures
while the northern rivers are characterized by a less severe environment To test whether
these different thermal regimes influence the expression patterns of hsp70 and hsc70 in
three species of the Squalius genus a set of experimental conditions was conducted
exposing fish to different temperatures Results indicate that there is latitudinal variation
in the expression of hsp70 gene with higher induction in southern species At higher
temperatures the southern species S torgalensis significantly induced its levels of
hsc70 and hsp70 while the northern species S carolitertii did not present any increase
in mRNA levels of both genes Similarly to S torgalensis S pyrenaicus inhabiting in
the central region presented an increment in hsp70 mRNA levels when exposed to high
temperatures Increments in hsp70 and hsc70 mRNA levels may allow S torgalensis to
cope with harsher environmental conditions although the thermal tolerance limits of
this species are unknown Indeed S torgalensis seem to be well adapted to its
environment yet the unpredictability of climate changes may still threaten this species
Keywords Cyprinidae Squalius thermal tolerance hsp70 hsc70 gene expression
Research article In preparation
4
Introduction
Many organisms are exposed to stressful environmental conditions such as temperature
variations that pose substantial challenges to their survival and reproduction (Loacutepez-
Maury et al 2008) These stressful conditions may limit the geographical distribution of
organisms since they tend to move to more suitable locations to avoid them (Sorensen
et al 2003 Dahlhoff amp Rank 2007) They can also adapt through selection or
phenotypic plasticity otherwise they may become extinct (Sorensen et al 2003
Dahlhoff amp Rank 2007) Understanding the effects of stress in shaping the distribution
and abundance of species and populations in their natural habitats is of the utmost
importance due to the increasing effects of climate changes conducted by humans
(Montoya amp Raffaelli 2010 Hance et al 2007 Reusch amp Wood 2007) Particularly
freshwater ecosystems are notably vulnerable to climate change not only because they
are isolated and fragmented but also due to the huge human pressure in these habitats
(Woodward et al 2010)
Evolutionary thermal adaptation is one of the most studied topics in biology but it is
still very raw in realizing an integrated view of this thematic (Walters et al 2010) For
example little is known about thermal adaptation at the level of gene expression which
may have consequences in organismrsquos fitness (Clarke 2003)
The Heat shock proteins (HSPs) have been widely reported as part of an important
mechanism that helps organisms to cope with several environmental stresses and thus
playing a significant ecological and evolutionary role in natural populations (Sorensen
et al 2003) HSPs are proteins involved in housekeeping roles in cells that act mainly
as molecular chaperones (Sorensen et al 2003 Mayer amp Bukau 2005) This set of
proteins is vital for cell functioning since they facilitate folding and refolding of
proteins and degradation of non-native proteins which can be either misfolded
aggregated to other proteins or denaturating (Sorensen et al 2003) The name of these
proteins stems from the fact that most of them are induced by heat although some are
induced by other stress factors including insecticides heavy metals desiccation
diseases and parasites (Sorensen et al 2003 Lindquist amp Craig 1988) Furthermore
inbreed populations may further be more susceptible to these stress factor (Sorensen et
al 2003) In a broader sense their response is triggered by the presence of higher levels
Research article In preparation
5
of non-native protein conformations than in normal cell functioning This response is
known as the heat shock response (HSR) (Sorensen et al 2003 Lindquist amp Craig
1988)
HSPs are one of the most conserved groups of proteins known and as far as we know
present in all living organisms from bacteria to plants and animals (Sorensen et al
2003 Lindquist amp Craig 1988) Several closely related genes have been identified
named according to their enconded protein molecular weight and grouped into families
ndash hsp100 hsp90 hsp70 hsp60 hsp40 and small hsps (Sorensen et al 2003 Lindquist amp
Craig 1988) Particularly the widely studied 70-kDA heat shock protein (HSP70)
belongs to a multi-gene family whose gene expressions vary in several physiological
conditions (Lindquist amp Craig 1988) Hsp70s are considered the major hsp gene family
and is composed by exclusively inducible exclusively constitutive [Heat Shock
Cognates (HSCs)] and even by simultaneously inducible and constitutive proteins Both
hsp70 genes and hsc70 genes belong to the hsp70 gene family and while hsp70 genes
are notably induced by several types of stress hsc70 genes are mainly reported to be
constitutively expressed under normal (non-stress) conditions (Lindquist amp Craig 1988
Yamashita et al 2004)
The HSR is mostly
regulated by transcription
factors and particularly
the heat shock factor 1
(HSF1) regulates several
inducible hsps (Fig 1)
During non-stress
conditions HSF-1 is
inactive forming a multi-
protein complex with
HSP40 HSP70 and
HSP90 proteins which
inactive these proteins Upon environmental or physiological stress this multi-protein
complex dissociates releasing the HSPs for chaperone activity Free HSF-1 monomers
form an active trimeric protein that binds to the heat shock element (HSE) present in
the promoter region of the hsps genes promoting the transcription of the hsps genes
Fig 1 ndash The ldquocellular thermometerrdquo model of hsp expression
(adapted from Tomanek amp Somero 2002)
Research article In preparation
6
(Fig 1) Once the cell homeostasis is restored HSF1 is again sequestered by the multi-
protein complex and inactivated This regulatory mechanism is known as the ldquocellular
thermometerrdquo model of hsps expression in which HSPs autoregulate their own
synthesis by ruling out the levels of free HSF1 (Tomanek amp Somero 2002 Tomanek
2010 Buckley et al 2001)
Members of hsp70 gene family have been widely studied in many organisms and
distinct expression patterns have been found Several studies succeeded in finding a
relation between the expression patterns of hsp70 and altitudinal or latitudinal variations
in species range (Fangue et al 2006 Sorensen et al 2001 Karl et al 2009 Sarup amp
Loeschcke 2010 Blackman 2010) For example Fangue et al (2006) detected significant
differences in the expression levels of hsp70 between northern and southern populations
of the killifish Fundulus heteroclitus Though Sorensen et al (2009) had found
different patterns of hsp70 expression along a latitudinal gradient in Rana temporaria
they did not find any relationship between hsp70 expression and thermal tolerance
(Sorensen et al 2009) Concerning the hsc70 it is expected to be expressed under non
stress conditions and maintained or even repressed in stressful conditions since this
protein was firstly described as a constitutive form (Loacutepez-Maury et al 2008 Lindquist
amp Craig 1988) Yamashita et al (2004) and Yeh et al (2002) found that hsc70 was
constitutively expressed in several stress conditions including heat shock However
Fangue et al (2006) found differences in hsc70 gene expression levels between
different populations of Fundulus heteroclitus exposed to different thermal regimes
This demonstrates the importance of studying gene expression of hsp70 gene family in
closely related speciespopulations exposed to different temperature regimes in their
natural habitats All together these findings point out that hsps seem to play an
important role in thermal-tolerance and despite being occasionally paradoxical the
expression patterns of these genes must be interpreted according to the ecological
context and evolutionary history of each species (Sorensen et al 2003)
In the Iberian Peninsula particularly in Portugal the freshwater fish species of the
Squalius Bonaparte 1837 genus (family Cyprinidae) are constituted by four different
allopatric taxa S carolitertii (Doadrio 1988) S pyrenaicus (Guumlnther 1868) S
torgalensis (Coelho Bogutskaya Rodrigues amp Collares-Pereira 1998) and S aradensis
(Coelho Bogutskaya Rodrigues amp Collares-Pereira 1998) Another member of this
genus is the S alburnoides complex (Steindachner 1866) of hybrid origin and
Research article In preparation
7
widespread distribution in the Iberian Peninsula Three of these Squalius species
distributed throughout a latitudinal gradient (Fig 2) were used in this study S
carolitertii inhabiting the northern region S pyrenaicus in the central region and
southern region and S torgalensis restricted to a small river basin (Mira river) in the
southwestern region Fish from these three species are exposed to environments with
distinct seasonal and even daily water temperature variations
The northern rivers of Portugal
present lower temperatures
and temperature fluctuations
than the southern ones
(Henriques et al 2010)(
httpsnirhpt) In the northern
rivers maximum temperature
usually never exceeds 31ordmC
while in rivers from the central
region such as the Tejo river
are exposed to temperatures
around 35ordmC The southern
region is included in the
circum-Mediterranean region
a hotspot of biodiversity
(Myers et al 2000) and is
characterized by an
intermittent regime of floods
and droughts in which during
the dry season freshwater fish are trapped in small pools with very harsh temperatures
that can reach 38ordmC (Henriques et al 2010 Magalhaes et al 2003)(httpsnirhpt)
These distinct regimes between different species of the Squalius genus make them an
interesting case study of thermal adaptation along a latitudinal gradient
Genetic studies in species of the Squalius genus have been mainly focused on
understanding the demographic and evolutionary history of the Squalius genus
Consistently S carolitertii and S torgalensis have low levels of genetic diversity
(Henriques et al 2010 Brito et al 1997 Pala amp Coelho 2005) while S pyrenaicus
present high values of genetic diversity (Brito et al 1997 Pala amp Coelho 2005 Sanjur
Fig 2 - Geographical distribution of the Squalius species
present in Portugal S alburnoides was excluded from this
representation
Research article In preparation
8
et al 2003) The low genetic diversity of S carolitertii has been explained as a
consequence of genetic bottlenecks that might have occurred during the Pleistocene
glaciations (Brito et al 1997) However the reduced genetic diversity of S torgalensis
seems to be more related to the characteristics of their river regime which causes a high
mortality during the dry season (Henriques et al 2010) Nevertheless this species
appear to be adapted to this unstable environment since they typical exhibit life history
traits that are characteristics of species inhabiting in such conditions shorter life span
earlier spawning age and smaller body length (Henriques et al 2010)
Notwithstanding other mechanisms may also allow these species to deal with
environmental stress such as the gene expression regulation of genes involved in the
HSR This is particularly important since two of these species S pyrenaicus and S
torgalensis are endangered and critically endangered respectively (Cabral et al 2006)
The main goal of this study is to provide insights on the molecular mechanisms
involved in adaptation to thermal stress of three species of the Squalius genus (S
carolitertii S pyrenaicus and S torgalensis) distributed throughout a latitudinal cline
Particularly this study aims to (i) evaluate hsp70 and hsc70 gene expression patterns of
each species exposed to different temperatures (ii) compare these patterns between the
three species and (iii) relate the results obtained with the ecological context of each
species The accomplishment of these objectives will contribute to an insightful
perspective of the role of hsp70 and hsc70 gene expression patterns in thermal
adaptation of Iberian Squalius Moreover understanding the mechanisms by which
these fish deal with thermal stress is important to define management options that
contemplate the threats that freshwater fish will face with the increasing occurrence of
extreme episodes of heat waves and severe droughts in a context of climate change
(Reusch amp Wood 2007 Hance et al 2007)
Materials and methods
Sampling and maintenance of fish
Adult fish from three species of the Squalius genus were collected by electro-fishing
along a latitudinal gradient in Portuguese rivers (Fig 2) S torgalensis were sampled in
Research article In preparation
9
Mira basin since it is the only river they are known to inhabit S pyrenaicus were
sampled in Colares stream which is located in the central region of Portugal S
carolitertii were sampled in several river basins of the northern region namely in
Mondego Vouga and Douro Fishes were maintained in approximately 30 liters aquaria
at 20ordmC with 12 hours of daylight and 12 hours of darkness
Experimental design
After two weeks of acclimatization individuals of each species were subjected to 4
temperature treatments 20ordmC (control temperature) 25ordmC 30ordmC and 35ordmC These
treatments were carried out with gradual increments of 1ordmC per day and once the testing
temperature was reached individuals were kept 24 hours at that temperature (long term
survival experiment) Additionally another experimental assay consisted in exposing
individuals to gradual temperature increments for about 4 hours until 30ordmC at which
they were maintained for 1 hour (short term survival experiment) For this last
experiment the control situation was also the 20ordmC When fish showed signs of losing
equilibrium the experiments were terminated and temperature registered
In long term survival experiments 6-7 individuals of each species were exposed to each
temperature treatment while 2 individuals of each species were exposed to each
treatment in short term survival experiments It is worth to note that each individual
was exposed to only one treatment After the testing conditions were reached fin clips
were collected from the pectoral pelvic and upper caudal fins Fins from each fish were
pooled and stored at -80ordmC for subsequent RNA extraction Moreover muscle tissue
from 4 individuals of S torgalensis one per temperature (long term survival
experiments) were collected in order to perform a preliminary comparison between fin
and muscle tissue to validate the use of fin clips for measuring the expression patterns
of the target transcripts The fish used in this experiment will be integrated in the
collection of National Museum of Natural History (Museu Bocage)
RNA extraction and cDNA synthesis
For RNA extraction TRI Reagentreg (Ambion) was added to fin clips and muscle
samples After homogenization with Ultra-Turrax homogenizer (Janke amp Kunkel IKA-
Research article In preparation
10
WERZ) RNA was extracted following the manufacturers protocol and DNA
contamination was avoided using TURBOtrade DNase (Ambion) followed by
phenolchloroform purification and LiCl precipitation Glycogen was used as a co-
precipitant in order to promote RNA precipitation The quality of the samples was
checked in Nanodrop 1000 (Thermo Scientific) by the absorbance ratios and
concentration of the sample was determined in order to have always the same RNA
quantity for complementary DNA (cDNA) synthesis cDNA was synthesized using
RevertAidTM H Minus First Strand cDNA Synthess Kit (Fermentas) and stored at -
20ordmC before PCR
Hsp primers design
In order to amplify hsp70 cDNAs the forward 5-TACACGTCCATCACCAGAGC-3
(Hsp70_F2) and reverse 5-ACTTTCTCCAGCTCCTTCAG-3 (Hsp70_R2) primers
(designed from NCBI and Ensembl database) were used in polymerase chain reaction
(PCR) in a total volume
of 25 microl with a final
concentration of 03 μM
of each primer 025 mM
of each dNTP and 2mM
of MgCl2 Amplicons
from two individuals
one exposed to 20ordmC
treatment and other
exposed to 30ordmC were
sent for sequencing in Macrogen Korea and subsequently the identity of the sequences
obtained were compared against public databases (Zhang et al 2000) This procedure
was performed for two species S torgalensis and S carolitertii and results suggested
the existence of two sequences per amplicon corresponding to hsp70 and hsc70
Therefore these sequences corresponding to hsp70 and hsc70 transcripts of Danio
rerio Cyprinus carpio and Megalobrama amblycephala were used to design specific
primers (Table 1) using PerlPrimer software v1119 (Marshall 2004)
Subsequently the primers designed for both transcripts were tested in the same
Table 1 - Primers used in this study
Primer name Primer Sequence 5 - 3
Hsp70_Fc GGCCCTCATCAAACGC
Hsp70_Rc TTGAAGGCGTAAGACTCCAG
Hsc70_F1 GTTCAAGCAGCCATCTTAGC
Hsc70_R2 TGACCTTCTCCTTCTGAGC
Gapdh F1 ATCAGGCATAATGGTTAAAGTTGG
Gapdh Ri GGCTGGGATAATGTTCTGAC
In semi-quantivative RT-PCR the primers Hsp70_Fc and Hsp70_Rc
were used to amplify the hsp70 transcript while the Hsc70_F1 and
Hsc70_R2 were used to amplify the hsc70 transcript The pair Gapdh
F1Gapdh Ri was used to amplify the control transcript primer
designed in Pala et al (2008)
Research article In preparation
11
conditions described above All Sequences obtained were edited and their
chromatograms manually checked for errors in SEQUENCHER v42 (Gene Codes
Corporation) BLAST analyses (Zhang et al 2000) were used to confirm the identity of
the new amplified transcripts
Semi quantitative RT-PCR
In order to amplify an internal control (gapdh cDNA) together with the gene of interest
multiplex PCRs were performed allowing the normalized quantification of mRNAs of
interest (hsp70 or hsc70) Semi-quantitative RT-PCR (Reverse Transcription-PCR)
reaction was optimized in order to have the amplification of both cDNAs in the
exponential phase (Serazin-Leroy et al 1998 Breljak amp Gabrilovac 2005) The
optimized conditionsfor the pair hsp70gapdh were the use of a QIAGENreg Multiplex
PCR Kit according with the manufactures (final concentration 1times PCR master mix with
3 mM MgCl2 05times of Q-Solution and 02 μM of each primer) with an initial
denaturation step at 95ordmC for 15 min followed by 30 cycles at 95ordmC for 1 min 58ordmC for
1 min and 30 sec and 72ordmC for 1 min with a final extension period of 72ordmC for 10 min
The optimized conditions for the hsc70gapdh reaction were using DNA polymerase
Gotaq flexi (fermentas) with 03 μM of each primer 025 mM of each dNTP and 2mM
of MgCl2 subjected to an initial denaturation step at 95ordmC for 5 min followed by 35
cycles at 95ordmC for 1 min 58ordmC for and 45 sec and 72ordmC for 1 min and 30 sec with a
final extension period of 72ordmC for 10 min No template and minus RT (reverse
transcription) controls were performed in order to control for PCR contamination and
genomic DNA contamination in the RT reaction respectively
Image densitometry
For gene expression quantification 4ul of each PCR product were loaded in a 1
agarose gel stained with RedSafetrade and each gel photographed in a DC290 Kodak
digital camera for image densitometry analysis using Image J 143u (Abramoff et al
2004) Uncalibred OD was used for image calibration (Abramoff et al 2004) and the
band of interest was quantified and normalized against the internal control band
(gapdh) present in the same gel image
Research article In preparation
12
Statistical analyses
Arbitrary values resulting from the quantification of the band of interest (hsp70hsc70)
were divided by the value obtained for the control band (gapdh) giving a hsp70gapdh
or hsc70gapdh ratio
In graphical representations of gene expression fold increment with temperature for
each gene of interest we considered the 20ordmC testing temperature as the control
situation and thus fold equal to 1 The fold variation observed in the other treatments
relatively to the control situation was calculated as follows
ndash mean expression fold increment - observation value ndash mean value of
observations at 20ordmC testing temperature for each species - number of individuals of
each species per testing temperature
Moreover factorial analyses of variance (factorial ANOVAs) were undertaken in order
to understand if the two factors (species and temperature) and the interaction between
them were significantly influencing the expression of the two genes hsp70 and hsc70
Whenever differences were detected post hoc comparisons were performed using
Tukey test (Pestana et al 2006 StatSoft 2010) The hsp70 dataset violated the
assumptions of normality and homocedasticity while hsc70 dataset violated only the
former assumption To deal with this issue several strategies were tested including
outliersrsquo removal and data transformations The latter comprising square root [radic(x+1)]
natural logarithm [ln(x+1)] and logarithmic [log10(x+1)] transformations (Osborne
2005) Nevertheless data transformation requires careful interpretation of results
(Osborne 2005) thus whenever possible the transformed dataset was compared to the
non transformed dataset Despite sometimes the dataset violate the assumptions
factorial ANOVAs were performed since there is no satisfactory nonparametrics
alternative to this test (StatSoft 2010) Since unbalanced designs ie with unequal
number of individuals of each species per testing temperature ( ) can affect the
performance of factorial ANOVAs type III sum of squares methodology was applied in
order to correct this effect (StatSoft 2010)
Furthermore whenever the assumptions were not met with the non transformed data
Research article In preparation
13
non-parametric one-way Kruskal-Wallis ANOVAs were performed considering each
experimenter (each aquarium) an individual sample With this proceeding effect(s) that
influence the expression of hsp70 andor hsc70 in the different experiments cannot be
identified however by carrying out post hoc tests (Dunns test) one could look for
differences between experiments All statistical decisions were based on a p-level =
005 Statistical tests were performed in Statistica 90 software (StatSoft 2009)
Results
Survival to the experiments
During long term survival experiments some
individuals subjected to 4 temperature treatments
(20ordmC 25ordmC 30ordmC and 35ordmC) died or started to show
signs of losing equilibrium A total of 8 individuals
did not reach the 35ordmC experimental condition two S
carolitertii died during the increment from 34ordm to 35ordm
(without any sign of losing equilibrium during
observation periods) and all the six S pyrenaicus
exposed to the increment to 35ordm did not reached that
condition Six individuals S pyrenaicus demonstrated
symptoms of losing equilibrium at 32ordmC33ordmC (2 at
32ordmC and 4 at 33ordmC) These 6 individuals of S
pyrenaicus were represented in the 35ordmC category in
the subsequent analysis S torgalensis individuals
never showed any stress symptom In experiments of
short term survival no individual died or showed
signs of losing its balance or died
A total of 74 individuals (25 S torgalensis 27 S pyrenaicus and 22 S carolitertii) were
used (Table 2) in gene expression quantification of the target genes in long term survival
experiments Since the RNA from two individuals S carolitertii was degraded only 4
individuals of this species were used at 20ordmC for gene expression quantification and in
the subsequent analysis
n are the number of individuals subjected to the experiments all 6 fishes lost equilibrium before the experiments end four of these individuals were used in gene expression quantification In brackets is the number of individuals that died during the experiments
Table 2 ndash Number of individuals used in long term survival experiments
Treatments n
S torgalensis 20degC 6
S torgalensis 25degC 6
S torgalensis 30degC 7
S torgalensis 35degC 6
S pyrenaicus 20degC 7
S pyrenaicus 25degC 7
S pyrenaicus 30degC 7
S pyrenaicus 35degC 6
S carolitertii 20degC 6
S carolitertii 25degC 6
S carolitertii 30degC 7
S carolitertii 35degC 7 (2)
Research article In preparation
14
Identification of two members of the hsp70 family
Using the first pair of primers (Hsp70_F2 and Hsp70_R2) two copies of the hsp70 gene
family were identified from the sequences obtained with the amplified cDNAs of S
carolitertii and S torgalensis individuals The chromatograms of the sequences
resulting from the 20ordmC treatment showed a single copy of hsp70 gene family that
matched with high identity with hsc70-1 from Cyprinus carpio (accession number
AY1208931) (followed by hsc70 from Danio rerio [accession number L771461]
Megalobrama amblycephala [accession number EU623471] Ctenopharyngodon idella
[accession number EU816595]) A quite different result was observed in the 30ordmC
sample with the observation of double peaks in some sites suggesting the presence of
more than one transcript In fact two peak patterns were distinguished one consistently
matching the hsc70 transcript (already sequenced at 20ordmC) and the other appeared to be
somewhat divergent with BLAST results showing a high similarity with the inducible
form of hsp70 from other cyprinids (accession numbers EU884290 HQ007352
AY120894 AB092839 BC056709)
Afterwards specific primers were designed for each hsp gene (Table 1) The new hsp70
sequences had 351 base pairs (bp) and no variable sites were detected contrasting with
the previous pair of primers which had nucleotide differences in this region of the
hsp70 gene (Fig S2 supplementary material) For hsc70 sequences 458 bp were
sequenced and two variable sites were found although these nucleotide substitutions are
both synonymous (Fig S3 supplementary material) However this new pair of primers
specific of the hsc70 transcript did not amplify in S pyrenaicus individuals and thus
this species was not included in expression analyses of this gene
Analysis of the expression patterns of hsp70 in long term survival experiments
For S torgalensis both fin clips and muscle presented a similar incremental pattern in
the hsp70 mRNA levels with the increase of water temperature (Fig 3) Therefore a
more accurate analysis was performed with the data obtained from fin clips allowing to
carry out a statistical analysis
Expression levels of the three species at 20ordmC (control temperature) showed that S
Research article In preparation
15
carolitertii has higher expression levels of hsp70 than the other two species (Fig 4)
Fig 3 - Comparison of hsp70 gene expression patterns between fin clips and muscle samples from S
torgalensis (A) gel images showing the increment in both tissues (B) Fold increment graphical
representation also showing the similar incremental pattern in both tissues
In these experimental conditions S torgalensis exposed to 35ordmC treatment had an
increment in hsp70 mRNA levels in average 59 times higher than those observed in the
control situation (20ordmC) and about 53 times higher than at 30ordmC In S pyrenaicus
individuals a similar pattern was observed with a mean 34 and 29 fold increment in the
35ordmC treatment relatively to the control situation and 30ordmC treatment respectively In the
other hand S carolitertii did not exceed the 3 fold increment even in the harsher
temperature treatment (Fig 5)
A
B
Research article In preparation
16
In order to test if the main
differences found are
statistically significant
several statistical analyses
were performed Firstly it
was tested if the dataset met
the assumptions of normality
and homocedasticity Both
assumptions were not
satisfied and although
several data transformation
have been realized none of
these improved data Thus transformations were not applied since they did not have any
effect in the assumptions However the removal of some outliers from experimental
conditions that did not present normal distributions (Fig S1 supplementary material)
assisted in achieving the assumption of normality Despite the lack of homocedasticity
two factorial ANOVAs were performed a first one with the full data and a second one
with the removal of 4 outliers (one S torgalensis at 20ordmC one S torgalensis at 25ordmC
one S torgalensis at 30ordmC one S pyrenaicus at 30ordmC) Results from both datasets are
similar in the main conclusions despite having different values
Fig 5 ndash Hsp70 fold increment in long term survival experiments for all the studied species
For the full dataset the factors species (F=7270 df=2 p=0001) and temperature
(F=23196 df=3 p=0000) are significantly influencing hsp70 expression levels The
Fig 4 ndash Hsp70 expression levels at 20ordmC
Research article In preparation
17
interaction of both variables was also significant (F=4521 df=6 p=0001) After the
removal of outliers the interpretation remained the same being species (F=6792 df=2
p=0002) temperature (F=25077 df=3 p=0000) and interaction of both (F=4495
df=6 p=0001) statistically significant Post hoc comparisons showed that S pyrenaicus
has a significantly higher expression of hsp70 when exposed to temperatures of 32-
33ordmC compared with all the other conditions tested even in other species (Table 3) It is
worth to note that the category S pyrenaicus 35ordmC represent those individuals that lost
their balance at 32ordm-33ordmC S torgalensis exposed to 35ordmC also presented an increment of
hsp70 levels comparing with those observed at 20ordmC 25ordmC and 30ordmC (Table 3) S
carolitertii did not statistically differ from any other treatment
Subsequently differences between experimental conditions were investigated Since all
assumptions were not met for full dataset and after the removal of 4 outliers a
nonparametric Kruskal-Wallis ANOVA was performed using this dataset revealing
significant differences (H=48985 df=11 p=0000) between the different treatments
(differences between each experimental condition) Post hoc comparisons with Dunns
test (Zar 1996 StatSoft 2010) revealed significant differences in S torgalensis
expression levels at 35ordmC treatment compared with 20ordm (Q=3893 p=0007) and 25ordm
treatments (Q=3960 p=0005) S pyrenaicus exposed to 32ordmC and 33ordmC also had
significant differences from the control situation at 20ordmC (Q=3494 p=0003) With
nonparametrics statistics S carolitertii remained without significant increase in hsp70
expression
Regarding the differences between species at 20ordmC (Fig 4) an one-way ANOVA was
performed Since the dataset violated the assumptions of normality and homogeneity of
variances the removal of two previously identified outliers (one S torgalensis at 20ordmC
and one S pyrenaicus at 20ordmC) was useful to meet these assumptions Though results
with and without these outliers point to statistically significant differences of hsp70
expression between species at 20ordmC (F=29455 df=2 p=0000 and F=56203 df=2
p=0000 respectively with and without outliers) Post hoc comparisons revealed that S
carolitertii expression levels at 20ordmC significantly differ from those of S torgalensis
(df=13 p=0000) and S pyrenaicus (df=13 p=0001) (Fig 4)
Research article In preparation
18
Table 3 ndash Post hoc comparisons using Tukey HSD test statistics
Each cell represents the p-value in each pairwise comparison Significant differences are marked with an Upper diagonal ndash dataset with outlier
removal (df=58) lower diagonal ndash full dataset (df=62) S pyrenaicus 35ordmC represent those individuals that lost their balance at 32ordm-33ordmC
S
torgalensis
20ordmC
S
torgalensis
25ordmC
S
torgalensis
30ordmC
S
torgalensis
35ordmC
S
pyrenaicus
20ordmC
S
pyrenaicus
25ordmC
S
pyrenaicus
30ordmC
S
pyrenaicus
35ordmC
S
carolitertii
20ordmC
S
carolitertii
25ordmC
S
carolitertii
30ordmC
S
carolitertii
35ordmC
S torgalensis
20ordmC 1000 1000 0021 1000 0849 1000 0000 1000 0998 0993 0567
S torgalensis
25ordmC 1000 1000 0021 1000 0845 1000 0000 1000 0998 0992 0561
S torgalensis
30ordmC 1000 1000 0024 1000 0934 1000 0000 1000 1000 0999 0688
S torgalensis
35ordmC 0016 0016 0028 0015 0535 0104 0003 0193 0166 0241 0951
S pyrenaicus
20ordmC 1000 1000 1000 0018 0872 1000 0000 1000 1000 0997 0582
S pyrenaicus
25ordmC 0832 0837 0942 0564 0886 0997 0000 0998 1000 1000 1000
S pyrenaicus
30ordmC 0985 0986 0999 0239 0994 1000 0000 1000 1000 1000 0926
S pyrenaicus
35ordmC 0000 0000 0000 0003 0000 0000 0000 0000 0000 0000 0000
S carolitertii
20ordmC 1000 1000 1000 0214 1000 0999 1000 0000 1000 1000 0952
S carolitertii
25ordmC 0998 0998 1000 0185 1000 1000 1000 0000 1000 1000 0971
S carolitertii
30ordmC 0799 0804 0920 0703 0856 1000 1000 0000 0997 0999 0990
S carolitertii
35ordmC 0543 0550 0712 0957 0610 1000 0992 0000 0958 0975 1000
Research article In preparation
19
Kruskal-Wallis ANOVA was also performed given that the original data slightly violates
homocedasticity and normality assumptions Results also indicated that there are
differences between species in the expression levels at 20ordmC (H=12235 df=2 p=0002)
being this differences between S carolitertii and S torgalensis (Q=3471 p=0002)
Analysis of the expression patterns of hsc70 in long term survival experiments
Expression levels at 20ordmC (control
temperature) did not show
significant differences between S
carolitertii and S torgalensis (Fig
6) S torgalensis exposed to 35ordmC
treatment had an increment in
hsp70 mRNA levels in average 14
times higher than those observed
in the control situation and about
12 times higher than at 30ordmC In
the other hand S carolitertii did
not exceeded the 3 fold increment
being the 30ordmC the temperature at
which hsc70 expression levels were more elevated however no significance was
achieved (Fig 7)
In order to statistically test the different patterns observed above several statistical
analysis were performed Hsc70 dataset met the assumption of homogeneity of
variances (F=2050 df=7 39 p=0073) yet with some deviations from normality
Square root logarithmic and natural logarithmic transformations were applied Since
square root transformation was sufficient to meet all the assumptions this
transformation was used instead of the others As previously done for the hsp70 dataset
the non transformed data and transformed data were analyzed in factorial ANOVAs
With the non transformed dataset significant differences were found for the factors
species (F=4548 df=1 p=0039) temperature (F=10887 df=3 p=0000) and to the
interaction between them (F=9493 df=3 p=0000)
Fig 6 - Hsc70 expression levels at 20ordmC
Research article In preparation
20
Fig 7 - Hsc70 fold increment in long term survival experiments for S torgalensis and Scarolitertii
Results obtained with the transformed dataset were slightly different since only the
factor temperature (F=12001 df=3 p=0000) and the interaction between temperature
and species (F=10335 df=3 p=0000) were significant Post hoc comparisons revealed
that S torgalensis exposed to 35ordmC are different from all the other treatments applied to
this species and to S carolitertii (Table 4)
Since the normality assumption were not achieved with the non transformed data
Kruskal-Wallis ANOVA were carried out and significance was found (H=22502 df=7
p=0002) for differences between the different treatments (differences between
experimental aquariums) Post hoc comparisons with Dunns test revealed that exists
significant differences in S torgalensis expression levels at 35ordmC treatment compared
with 20ordm (Q=3684 p=0006) and 25ordm treatments (Q=4042 p=0001) No other
statistical differences were found with multiple comparisons
Analysis of the expression patterns of hsp70 in short term survival experiments
Results from this experiment show that the expression levels of S torgalensis S
pyrenaicus and S carolitertii exposed to a rapid increment to 30ordmC resulted in average
fold increments of 26 23 and 7 in hsp70 mRNA respectively Comparing with the
results of the long term survival experiments at 30ordmC hsp70 mRNA levels are in
average 20 18 and 4 times higher for S torgalensis S pyrenaicus and S carolitertii
respectively (Fig 8A)
Research article In preparation
21
Table 4 - Post hoc comparisons using Tukey HSD test statistics
Each cell represents the p-value in each pairwise comparison Significant differences are marked with an Upper diagonal ndash dataset with square
root transformation (df=39) lower diagonal ndash non transformed dataset (df=39)
S torgalensis
20ordmC
S torgalensis
25ordmC
S torgalensis
30ordmC
S torgalensis
35ordmC
S carolitertii
20ordmC
S carolitertii
25ordmC
S carolitertii
30ordmC
S carolitertii
35ordmC
S torgalensis
20ordmC 1000 0958 0000 1000 1000 0218 0952 S torgalensis
25ordmC 1000 0793 0000 0988 0983 0088 0798 S torgalensis
30ordmC 0996 0980 0000 1000 0999 0803 1000 S torgalensis
35ordmC 0000 0000 0000 0000 0000 0001 0000 S carolitertii
20ordmC 1000 1000 1000 0000 1000 0665 0999 S carolitertii
25ordmC 1000 1000 0999 0000 1000 0488 0998 S carolitertii
30ordmC 0656 0505 0956 0000 0860 0756 0911 S carolitertii
35ordmC 0997 0984 1000 0000 1000 0999 0979
Research article In preparation
22
Analysis of the expression patterns of hsc70 in short term survival experiments
In hsc70 mRNA expression levels a fold increment of 5 for S torgalensis and 2 for S
carolitertii relatively to the control temperature were observed In this case the
differences between this experiment and the long term survival experiments were not so
pronounced as can be seen in Fig 8B
Fig 8 ndash Differences in fold increment between short term survival and long term survival experiments at
30ordmC in (A) hsp70 relative mRNA levels and (B) hsc70 relative mRNA levels
Discussion
To our knowledge this was the first study to quantify hsp70 and hsc70 mRNAs using fin
clips instead of other fish organs avoiding the sacrifice of animals which is particularly
relevant when studying endangered species Nonetheless Yamachita et al (2004) found
S torgalensis S pyrenaicus S carolitertii
S torgalensis S carolitertii
A
B
Research article In preparation
23
similar patterns of hsp70 gene expression between muscle and fibroblast culture from
the caudal fin tissue of Xyphophorus maculatus (platyfish) Our comparison of the
expression patterns of hsp70 between fin clips and muscle samples suggest that there
exist similarity in hsp70 expression levels of these two tissues in response to
temperature increment (Fig 3) Thus the usage of fin clips instead of muscle seems
perfectly legitimate for the quantification of hsp70 mRNAs
Hsp70 and hsc70 genes identification
Using a non specific pair of primers (Hsp70_F2Hsp70_R2) for hsp70 amplification
hsc70 was the only transcript present at 20ordmC while at 30ordmC a mixture of hsc70 and
hsp70 transcripts was observed This may be caused by the lowest expression of hsp70
at 20ordmC than at 30ordmC making it easier to amplify hsc70 since it is expressed in normal
cell functioning (Lindquist amp Craig 1988 Yamashita et al 2004) whereas hsp70 are
induced in stress situations as it is the increase of the temperature (Dahlhoff amp Rank
2007 Lindquist amp Craig 1988 Sorensen et al 2009 Chapple et al 1998 Buckley et al
2001) Another observation that corroborates the lack of transcript specificity with the
first pair of primers is the absence of variable sites in the sequence obtained with the
second and more specific hsp70 primers (Hsp70_Fc and Hsp70_Rc) (Table S2
Supplementary material)
The absence of hsc70 amplification in S pyrenaicus samples with the hsc70 specific
primers may be caused by two reasons S pyrenaicus may have a very low expression
of hsc70 thus not being detected with semi-quantitative RT-PCR (Serazin-Leroy et al
1998 Breljak amp Gabrilovac 2005) or the hsc70 gene in this species has some variable
site(s) that prevents the annealing of the primers However given the importance of this
gene in normal cell function (Yamashita et al 2004 Fangue et al 2006 Somji et al
1999) the latter hypothesis is the most likely This issue will require further
investigation with the design of new specific primers for hsc70 for this species
The role of hsp70 in thermal adaptation
Our results are consistent in confirming that hsp70 mRNA has indeed a response to
temperature increment as shown in other studies on hsp70s (Yamashita et al 2004 Yeh
Research article In preparation
24
amp Hsu 2002 Buckley et al 2001 McMillan et al 2005 Waagner et al 2010)
However few studies have found a relation between hsp70 expression levels variation
and natural occurring clines (Karl et al 2009 Sarup amp Loeschcke 2010) such as
latitudinal ones (Fangue et al 2006 Sorensen et al 2009)
According with the results from the present study it is clear that S torgalensis and S
pyrenaicus greatly increase their hsp70 mRNA levels when exposed to higher
temperatures in both long and short term survival experiments Significant differences
were found in these two species between the control and the remaining temperature
treatments particularly the most severe one (35ordmC) Despite the absence of significant
differences in nonparametric statistics between S torgalensis at 30ordmC and at 35ordmC and
between S pyrenaicus at 25ordmC 30ordmC and 35ordmC a significant increment can be observed
between 35ordmC expression levels and the control in both species Interestingly S
carolitertii did not significantly increment their expression levels which could suggest
that this fish are not in a stress condition at 25ordmC 30ordmC and 35ordmC (Sorensen et al 2003)
However contrarily to what was observed for S torgalensis (with the largest induction
of the hsp70 gene) some individuals of S carolitertii died at 35ordmC contradicting the
suggestion that they were not in a situation of extreme stress Indeed the mere failure of
S carolitertii to increase the expression of this gene may be due to a maladaption to
temperatures of around 35ordmC (Tomanek 2010) which was expected since in their natural
environment S carolitertii usually never experience temperatures higher than
approximately 31ordmC (httpsnirhpt) The lack of increment in hsp70 does not mean that
this species is not adapted to deal with thermal stress since many other mechanisms
may be involved in thermal tolerance (Sarropoulou et al 2010 Kassahn et al 2007
Tymchuk et al 2010)
However in the central region watercourses temperature can reach 35ordmC and in the
southern rivers 38ordmC (httpsnirhpt) making relevant that S pyrenaicus and S
torgalensis respond to harsh temperatures with an increment of hsp70 levels
Notwithstanding it is odd that S pyrenaicus individuals started to lose their balance at
around 32-33ordmC and some S carolitertii individuals survived at 35degC Thus in this
particular case the costs of an over expression of S pyrenaicus relatively to S
carolitertii may surpass its benefits leading to an earlier lethal condition in the former
species (Loacutepez-Maury et al 2008 Dahlhoff amp Rank 2007 Karl et al 2009 Reusch amp
Wood 2007 Tomanek 2010 Hodgins-davis amp Townsend 2009)
Research article In preparation
25
Another curious observation was that the expression levels of hsp70 in S carolitertii at
20ordmC are already high and statistically higher than those observed in the other species
(Fig 4) suggesting that S carolitertii may be exposed to a more stressful situation than
the other two species at this temperature (Tomanek 2010) In order to clarify this
situation a further experiment with a lower testing temperature need to be performed
Alternatively the hsp70 regulation in S carolitertii may be less important than for the
other two species (Place et al 2004 Tomanek 2010 Place amp Hofmann 2004) This
possible minor role of regulating hsp70 mRNA levels in S carolitertii could be
explained by a more stable environment in the northern than in the southern regions
where temperature range and maximum temperature are usually lower (Tomanek 2010)(
httpsnirhpt) Notwithstanding higher steady-state levels of hsp70 may prevent from
early heat stress since this can delay the activation of the HSR (Fangue et al 2006 Yeh
amp Hsu 2002 Buckley et al 2001 Tomanek 2010 Tomanek amp Somero 2002)
Interestingly in short term survival experiments S carolitertii was again the species
that experienced the minor increment in hsp70 mRNA levels corroborating the
hypothesis that this species inhabit in a more stable environment and thus the species
has no need to better regulate the hsp70 expression Rapid temperature increments
raised hsp70 expression levels more significantly than with the exposure to slow
increments suggesting that hsp70 may be more mobilized in short periods of heat
stress Hsp70 rapid response may be important when species are exposed to harsh
temperature variations in a daily basis as it is the case of S torgalensis which seem to
have the higher induction of hsp70 levels (Loacutepez-Maury et al 2008 Waagner et al
2010)
Therefore these results suggest the existence of a latitudinal pattern in the expression of
hsp70 in which the southern and northern species had the higher and lower response to
heat stress respectively
The relevance of upregulating hsc70
Hsc70 is thought to be part of the constitutive cell function in non stress situations and
thus it was expected two scenarios for the expression patterns of this gene with the
increment of temperature a decrease or no variation (Loacutepez-Maury et al 2008
Yamashita et al 2004 Yeh amp Hsu 2002) Genes expressed in normal cell function often
Research article In preparation
26
shut down in stress conditions which triggers the stress response that in the case of
Heat Shock Proteins lead to an increased expression of the stress inducible forms like
hsp70 (Loacutepez-Maury et al 2008 Lindquist amp Craig 1988) An expected pattern was
confirmed in S carolitertii with no significant variation in hsc70 mRNA expression
across all treatments However hsc70 levels significantly increased at 35ordmC in S
torgalensis being significantly higher than in any other treatment performed in this
study for this gene This surprising finding may somewhat confer an advantage for S
torgalensis in an environment constantly exposed to severe temperatures and daily
fluctuations in water temperature in the dry season (Sorensen et al 2003)
(httpsnirhpt) Place amp Hofmann (2001) studying Gillichthys mirabilis observed
ATPase activity of this protein at high temperatures proposing that despite HSC70 not
being an extremely thermally stable protein it is functional even at extreme
temperatures Thus an increase in the levels of this protein may be beneficial since it is
active at high temperatures In fact nor only S torgalensis can fine tune their hsp70
expression to increase during exposure to high temperatures as also they seem to be able
to increment their levels of the constitutive hsc70 (Loacutepez-Maury et al 2008)
Supporting these findings Fangue et al (2006) suggested an important role for the
hsc70 gene in killifish from the southern region of North America in dealing with
protein damage caused by daily fluctuations in temperature However results from our
experimental design suggest another explanation since individuals exposed to a faster
temperature variation did not greatly increase their hsc70 mRNA levels relatively to
long term survival experiments (Fig 8B) Induction of hsc70 can be advantageous for S
torgalensis since hsc70 may enhance their stress response to constant elevated
temperatures that they usually experience in their rivers of origin (Loacutepez-Maury et al
2008 Sorensen et al 2003) Furthermore it may be more cost effective to induce a
constitutively expressed gene than to overexploit the cascade of stress related genes
(Loacutepez-Maury et al 2008 Sorensen et al 2003) If we sum to this result the elevated
hsp70 expression levels at 35ordmC of S torgalensis we can indeed conclude that this
species is clearly adapted to their severe river regime in the expression of these genes
Although to better understand the latitudinal expression pattern of hsc70 gene it is
important to include S pyrenaicus in gene expression profiling which will be carried
out in a further investigation
Research article In preparation
27
Implications for conservation
One application of studying hspsrsquo expression patterns is to implement them as a
biomarker of environmental stress whether it is heat stress or other type of stress that
induce hsps These biomarkers can be more effective and rapid in detecting stress
disturbances than biomarkers based on growth rate mortality or fertility (Sorensen et al
2003 Karouna-Renier amp Zehr 1999) However the results from each study have to be
interpreted taking into account the evolutionary history and the ecological context of
each species Our findings suggest that hsp70 can be used as a biomarker of
environmental stress for S torgalensis and S pyrenaicus although using hsp70 as a
biomarker of environmental stress in S carolitertii may be risky A more holistic and
comprehensive approach is desirable in order to draw more accurate decisions regarding
the use of hsp70 as biomarker namely by using a larger set of genes
Concerning the threats that each of the studied species face with climate change and the
priorities that should be given to conservation of these endemic species of the Iberian
Peninsula a few considerations can be drawn Survival to the experiments results
suggest that despite S pyrenaicus individuals have increased their hsp70 mRNA levels
during temperature increment this species do not tolerate temperatures higher than
33ordmC Thus they seem to face great threats with significant changes in daily temperature
variations andor increases in maximum temperature of water during the dry season
Even though S pyrenaicus from Colares stream is representative of the genetic diversity
present in the populations of the Tejo river (Sousa-Santos et al 2007) a sample with
more populations of the wide distribution of the species would be desirable However
the Colares riverside was chosen because it is one of the few basins where S pyrenaicus
remains in a pristine state since they are not introgressed with S alburnoides genome in
this basin Introgression effects on the expression of these genes would be a
confounding variable in this experiment and thus only pure individuals were used
S carolitertii seems to have a more plastic response to environmental thermal stress
than S pyrenaicus since five individuals resisted to the 35ordmC whereas no single S
pyrenaicus individual reached this temperature However these results have to be
interpreted with caution since in the present study we cannot unveil why S carolitertii
did not significantly induce hsc70 or hsp70 transcripts Further studies in other
transcripts such as the heat shock factors other hsps and even transcripts that encode
other proteins (like Wap65 protein) putatively involved in thermal tolerance
Research article In preparation
28
(Sarropoulou et al 2010) are needed in order to unravel this issue On the other hand
the challenges of climate change will tend to be major in the southern than in the
northern region due to the particular regime of severe droughts that characterize the
former region (Somero 2010 Henriques et al 2010)(httpsnirhpt) Finally species
living closer to their thermal tolerance limits may be the more threatened with climate
changes since minor variations in environmental conditions can lead to distribution
range shifts and decreases in the abundance of these species (Dahlhoff amp Rank 2007
Tomanek 2010 Sorensen et al 2009) In this sense despite S torgalensis have proved
to better perform the induction of hsp70 and hsc70 transcripts and even in survival rates
suggesting that they are well adapted to this harsh environment this species may still be
threatened with climate change (Reusch amp Wood 2007 Tomanek 2010 Somero 2010)
Intermittent systems such as the Mira river basin are particularly vulnerable to
environmental changes Changes in the seasonal regime of floods and droughts with the
increasing occurrence of severe droughts will impact this species distribution
abundance and diversity Furthermore due to their very restricted distribution local
extinction cannot be compensated from other geographically or genetically close
populations whereas for the other two species natural or human mediated re-
colonization is more likely to be possible Thus in order to preserve this species it would
be advisable to promote habitat restoration and conservation with particular focus in the
preservation of refuges (pools) during the dry season (Henriques et al 2010 Sousa-
Santos et al 2009)
Acknowledgments
We are thankful to Carla Sousa-Santos Maria Ana Aboim Miguel Santos Miguel
Machado Silke Waap and Isa Matos for the help provided in fish capture We are also
grateful to Isa Matos and Silke Waap who designed the Gapdh_Ri and Hsp70_F2
Hsp70_R2 primers respectively
References
Abramoff MD Magelhaes PJ Ram SJ (2004) Image Processing with ImageJ
Biophotonics International 11 36-42
Research article In preparation
29
Blackman BK (2010) Connecting genetic variation to phenotypic clines Molecular
Ecology 19 621-623
Breljak D Gabrilovac J (2005) Comparison of Three RT-PCR Based Methods for
Relative Quantification of mRNA Food Technology and Biotechnology 43 379-
388
Brito RM Briolay J Coelho MM (1997) Phylogenetic Relationships within Genus
Leuciscus (Pisces Cyprinidae) in Portuguese FreshWaters Based on
Mitochondrial DNA Cytochrome b Sequences Molecular Phylogenetics and
Evolution 8 435-442
Buckley BA Owen ME Hofmann GE (2001) Adjusting the thermostat the threshold
induction temperature for the heat-shock response in intertidal mussels (genus
Mytilus) changes as a function of thermal history The Journal of Experimental
Biology 204 3571-3579
Cabral MJ (coord ) Almeida J Almeida PR Dellinger T Ferrand de Almeida N
Oliveira ME Pamleirim JM Queiroz AI Rogado L Santos-Reis M (eds) (2006)
Livro Vermelho dos Vertebrados de Portugal 2nd ed Instituto da Conservaccedilatildeo da
NaturezaAssiacuterio amp Alvim Lisboa 660 pp
Chapple JP Smerdon GR Berry RJ Hawkins AJS (1998) Seasonal changes in stress-70
protein levels reflect thermal tolerance in the marine bivalve Mytilus edulis L
Journal of Experimental Marine Biology and Ecology 229 53-68
Clarke A (2003) Costs and consequences of evolutionary temperature adaptation
Trends in Ecology amp Evolution 18 573-581
Dahlhoff EP Rank NE (2007) The role of stress proteins in responses of a montane
willow leaf beetle to environmental temperature variation Journal of biosciences
32 477-488
Fangue NA Hofmeister M Schulte PM (2006) Intraspecific variation in thermal
tolerance and heat shock protein gene expression in common killifish Fundulus
heteroclitus The Journal of Experimental Biology 209 2859-2872
Hance T Baaren J Vernon P Boivin G (2007) Impact of extreme temperatures on
parasitoids in a climate change perspective Annual Review of Entomology 52 107-
126
Henriques R Sousa V Coelho MM (2010) Migration patterns counteract seasonal
isolation of Squalius torgalensis a critically endangered freshwater fish inhabiting
a typical Circum-Mediterranean small drainage Conservation Genetics 11 1859-
1870
Hodgins-davis A Townsend JP (2009) Evolving gene expression from G to E to G x E
Trends in Ecology amp Evolution 24 649-658
Research article In preparation
30
Karl I Sorensen JG Loeschcke V Fischer K (2009) HSP70 expression in the Copper
butterfly Lycaena tityrus across altitudes and temperatures Journal of
Evolutionary Biology 22 172-178
Karouna-Renier NK Zehr JP (1999) Ecological implications of molecular biomarkers
assaying sub-lethal stress in the midge Chironomus tentans using heat shock
protein 70 (HSP-70) expression Hydrobiologia 401 255-264
Kassahn KS Crozier RH Ward AC Stone G Caley MJ (2007) From transcriptome to
biological function environmental stress in an ectothermic vertebrate the coral
reef fish Pomacentrus moluccensis BMC Genomics 8 358
Lindquist S Craig EA (1988) The heat-shock proteins Annual Review of Genetics 22
631-677
Loacutepez-Maury L Marguerat S Baumlhler J (2008) Tuning gene expression to changing
environments from rapid responses to evolutionary adaptation Nature Reviews
Genetics 9 583-593
Magalhaes MF Schlosser IJ Collares-Pereira MJ (2003) The role of life history in the
relationship between population dynamics and environmental variability in two
Mediterranean stream fishes Journal of Fish Biology 63 300-317
Marshall OJ (2004) PerlPrimer cross-platform graphical primer design for standard
bisulphite and real-time PCR Bioinformatics (Oxford England) 20 2471-2472
Mayer MP Bukau B (2005) Hsp70 chaperones cellular functions and molecular
mechanism Cellular and Molecular Life Sciences 62 670-684
McMillan DM Fearnley SL Rank NE and Dahlhoff EP (2005) Natural temperature
variation affects larval survival development and Hsp70 expression in a leaf
beetle Functional Ecology 19 844-852
Montoya JM Raffaelli D (2010) Climate change biotic interactions and ecosystem
services Philosophical Transactions of the Royal Society B Biological Sciences
365 2013-2018
Myers N Mittermeier RA Mittermeier CG Fonseca GA Kent J (2000) Biodiversity
hotspots for conservation priorities Nature 403 853-858
Osborne JW (2005) Notes on the use of data transformations Pratical Assessment
Research amp Evaluation 8 2-9
Pala I Coelho MM (2005) Contrasting views over a hybrid complex Between
speciation and evolutionary dead-end Gene 347 283-294
Pala I Coelho MM Schartl M (2008) Dosage compensation by gene-copy silencing in a
triploid hybrid fish Current Biology 18 1344-8
Research article In preparation
31
Pestana DD Velosa SF (2006) Introduccedilatildeo agrave Probabilidade e Estatiacutestica 2nd ed Lisboa
Fundaccedilatildeo Calouste Gulbenkian
Place SP Hofmann GE (2001) Temperature interactions of the molecular chaperone
Hsc70 from the eurythermal marine goby Gillichthys mirabilis The Journal of
experimental biology 204 2675-2682
Place SP Zippay ML Hofmann GE (2004) Constitutive roles for inducible genes
evidence for the alteration in expression of the inducible hsp70 gene in Antarctic
notothenioid fishes American Journal of Physiology Regulatory Integrative and
Comparative Physiology 287 R429-436
Place SP Hofmann GE (2004) Constitutive expression of a stress-inducible heat shock
protein gene hsp70 in phylogenetically distant Antarctic fish Polar Biology 28
261-267
Reusch TBH Wood TE (2007) Molecular ecology of global change Molecular Ecology
16 3973-92
Sanjur O Carmona JA Doadrio I (2003) Evolutionary and biogeographical patterns
within Iberian populations of the genus Squalius inferred from molecular data
Molecular Phylogenetics and Evolution 2920-30
Sarropoulou E Fernandes JMO Mitter K Magoulas A Mulero V Sepulcre MP
Figueras A Novoa B Kotoulas G (2010) Evolution of a multifunctional gene The
warm temperature acclimation protein Wap65 in the European seabass
Dicentrarchus labrax Molecular Phylogenetics and Evolution 55 640-649
Sarup P Loeschcke V (2010) Developmental acclimation affects clinal variation in
stress resistance traits in Drosophila buzzatii Journal of Evolutionary Biology 23
957-965
Serazin-Leroy V Denis-Henriot D Morot M Mazancourt P Giudicelli Y (1998) Semi-
quantitative RT-PCR for comparison of mRNAs in cells with different amounts of
housekeeping gene transcripts Molecular and Cellular Probes 12 283-291
SNIRH Sistema Nacional de Informaccedilatildeo de Recursos Hiacutedricos Available at
httpsnirhpt Accessed in 22 August 2010
Somero GN (2010) The physiology of climate change how potentials for
acclimatization and genetic adaptation will determine ldquowinnersrdquo and ldquolosersrdquo The
Journal of Experimental Biology 213 912-920
Somji S Todd JH Sens MA Garrett SH Sens DA (1999) Expression of the
constitutive and inducible forms of heat shock protein 70 in human proximal
tubule cells exposed to heat sodium arsenite and CdCl(2) Environmental Health
Perspectives 107 887-893
Sorensen JG Pekkonen M Lindgren B Loeschcke V Laurila A Merila J (2009)
Complex patterns of geographic variation in heat tolerance and Hsp70 expression
Research article In preparation
32
levels in the common frog Rana temporaria Journal of Thermal Biology 34 49-
54
Sorensen JG Dahlgaard J Loeschcke V (2001) Genetic variation in thermal tolerance
among natural populations of Drosophila buzzatii down regulation of Hsp70
expression and variation in heat stress resistance traits Functional Ecology 15
289-296
Sorensen JG Kristensen TN Loeschcke V (2003) The evolutionary and ecological role
of heat shock proteins Ecology Letters 6 1025-1037
Sousa-Santos C Collares-Pereira MJ Almada V (2007) Reading the history of a hybrid
fish complex from its molecular record Molecular Phylogenetics and Evolution
45 981-996
Sousa-Santos C Robalo JI Almada VC (2009) Threatened fishes of the world Squalius
torgalensis (Coelho Bogutskaya Rodrigues amp Collares-Pereira 1998)
(Cyprinidae) Environmental Biology of Fishes 87 123-124
StatSoft I (2010) Electronic Statistics Textbook (Electronic Version) Available at
httpwwwstatsoftcomtextbook
StatSoft I (2009) STATISTICA (data analysis software system) Available at
wwwstatsoftcom
Tomanek L (2010) Variation in the heat shock response and its implication for
predicting the effect of global climate change on species biogeographical
distribution ranges and metabolic costs The Journal of Experimental Biology 213
971-979
Tomanek L Somero GN (2002) Interspecific- and acclimation-induced variation in
levels of heat-shock proteins 70 (hsp70) and 90 (hsp90) and heat-shock
transcription factor-1 (HSF1) in congeneric marine snails (genus Tegula)
implications for regulation of hsp gene expression The Journal of Experimental
Biology 205 677-685
Tymchuk W OrsquoReilly P Bittman J Macdonald D Schulte P (2010) Conservation
genomics of Atlantic salmon variation in gene expression between and within
regions of the Bay of Fundy Molecular Ecology 19 1842-1859
Waagner D Heckmann LH Malmendal A Nielsen NC Holmstrup M Bayley M
(2010) Hsp70 expression and metabolite composition in response to short-term
thermal changes in Folsomia candida (Collembola) Comparative biochemistry and
physiology Part A Molecular amp integrative physiology 157 177-183
Walters RJ Berger D (2010) Thermal Games Putting Temperature Back on the
Evolutionary Agenda Evolution 64 1184-1187
Research article In preparation
33
Woodward G Perkins DM Brown LE (2010) Climate change and freshwater
ecosystems impacts across multiple levels of organization Philosophical
Transactions of the Royal Society B Biological Sciences 365 2093-2106
Yamashita M Hirayoshi K Nagata K (2004) Characterization of multiple members of
the HSP70 family in platyfish culture cells molecular evolution of stress protein
HSP70 in vertebrates Gene 336 207-218
Yeh FL Hsu T (2002) Differential regulation of spontaneous and heat-induced HSP 70
expression in developing zebrafish (Danio rerio) The Journal of Experimental
Zoology 293 349-359
Zar JH (1996) Biostatistical Analysis 3rd ed 662 pp New Jersey Prentice Hall
Zhang Z Schwartz S Wagner L Miller W (2000) A greedy algorithm for aligning
DNA sequences Journal of Computational Biology 7 203-214
Research article In preparation
34
Supplementary material
Fig S1 ndash Box plots for all the treatments performed in long term survival experiments Dark red arrows
point to the samples in which the removal of an outlier helped in meeting the normality assumption
Research article In preparation
35
1 100
||||||||||||||||||||
Ce5-Hsp70_Fc_Rc
ACCTTCACCACCTACTCAGACAACCAGCCCGGTGTCCTGATCCAGGTGTATGAGGGAGAGAGGGCCATGACAAAAGACAACAACCTGCTGGGTAAATTTG
Te15-Hsp70_Rc_Fc
---
101 200
||||||||||||||||||||
Ce5-Hsp70_Fc_Rc
AGCTCACAGGAATTCCACCTGCACCACGTGGAGTCCCGCAGATTGAAGTGACCTTTGACATTGACGCCAACGGAATCCTAAATGTGTCAGCGGTGGACAA
Te15-Hsp70_Rc_Fc
201 300
||||||||||||||||||||
Ce5-Hsp70_Fc_Rc
AAGCACTGGAAAAGAGAACAAGATCACCATCACCAATGACAAGGGCAGACTGAGCAAAGAGGAGATTGAGAGAATGGTGCAGGACGCAGACAAGTACAAA
Te15-Hsp70_Rc_Fc
301 365
|||||||||||||
Ce5-Hsp70_Fc_Rc GCTGAAGATGATCAGCAAAGAGAGAAGATTGCTGCCAAAAACTCCCTGGAGTCTTACGCCTTCAA
Te15-Hsp70_Rc_Fc -----------
Fig S2 - Sequence alignment of the cDNA of two individuals at 30ordmC (long term survival experiments) one S carolitertii (Ce5-Hsp70_Fc_Rc) and one S
torgalensis (Te15- Hsp70_Fc_Rc) Here it is possible to observe that there are no differences (represented as dots) between these two individuals in the
nucleotide sequence of hsp70 with the Hsp70_FcHsp70_Rc primers
Research article In preparation
36
1 100
||||||||||||||||||||
Ce5_hsc70 TTAGCGGGTGATAAATCTGAGAATGTCCAAGACCTTTTGCTGTTGGATGTCACTCCTCTCTCTCTGGGCATTGAGACGGCTGGTGGTGTCATGACTGTAT
Te8_hsc70 A
101 200
||||||||||||||||||||
Ce5_hsc70 TAATTAAGAGGAACACCACCATTCCCACCAAGCAAACCCAGACCTTCACCACTTACTCAGACAACCAGCCCGGTGTACTGATCCAGGTATATGAAGGAGA
Te8_hsc70
201 300
||||||||||||||||||||
Ce5_hsc70 GAGAGCCATGACAAAGGACAACAACCTTCTTGGAAAATTTGAGTTGACAGGCATCCCTCCCGCTCCTCGTGGTGTGCCACAGATCGAAGTTACCTTCGAC
Te8_hsc70
301 400
||||||||||||||||||||
Ce5_hsc70 ATTGACGCCAATGGCATTCTCAATGTATCCGCAGTGGACAAAAGCACTGGCAAAGAAAACAAGATCACGATTACTAACGACAAAGGTCGTTTGAGCAAGG
Te8_hsc70 G
401 458
|||||||||||
Ce5_hsc70 AAGACATTGAACGTATGGTACAAGAGGCTGACCAATACAAAGCAGAGGATGAAGCTCA
Te8_hsc70
Fig S3 - Sequence alignment of the cDNA of two individuals at 30ordmC (long term survival experiments) one S carolitertii (Ce5_hsc70) and one S torgalensis
(Te8_hsc70) The two nucleotide differences presented here (surrounded by a red line) did not have any implications in amino acid composition of the encoded
protein
Appendix
37
Introduction
Until recently neutral genetic markers were the state of the art tools in conservation genetics used to
access the risk of extinction of several species allowing the identification of management units
(Gebremedhin et al 2009) There are mainly two types of conservation units widely employed in
conservation genetics Evolutionary Significant Units (ESUs) and Management Units (MUs) defined
by Moritz (1994) ESUs correspond to populations whose differentiation is high and between which
took long enough so that reciprocal monophyly has occurred and they should be preserved as
independent units MUs are populations that recently diverged and between which some genetic flow
might still occur However with the increasing number of adaptative genetic makers available the field
of conservation genetics is transitioning to pay more attention to adaptative genetic variation
(Gebremedhin et al 2009 Reusch amp Wood 2007)
Local adaptation has a key role in the evolutionary history and in species ecology and thus efforts
should be carried out in order to incorporate this relevant information in making decisions for
conservation purposes (Gebremedhin et al 2009 Reusch amp Wood 2007) Important polymorphism
variation in loci with potential adaptative role might have profound effects in species ability to deal
with environmental changes stress and ultimately in populations subsistence (Gebremedhin et al
2009) Furthermore reduced neutral genetic variability is not synonymous of reduced evolutionary or
adaptative potential Populations may have reduced neutral genetic variability and yet be well adapted
to their environmental conditions (Gebremedhin et al 2009)
Temperature is one of the most challenging abiotic variables that organisms have to face in order to
avoid extinction (Clarke 2003) Temperature effects in physiological and biochemical processes are
considered to have an important role in shaping species distribution and abundance particularly for
ectotherms (Chevin et al 2010 Clarke 2003 Somero 2010) Several studies have been performed in
candidate genes of thermal adaptation namely the Heat Shock Proteins (HSPs) HSPs are important in
cellular response mechanisms during several stresses particularly heat stress and this suggests that
these proteins may have a significant role in the ecological context (Lindquist amp Craig 1988 Dahlhoff
amp Rank 2007) Sequence variation alongside with protein or mRNA expression profiles of HSPs have
been the subject of many studies that tried to understand the role of these proteins in thermal tolerance
of species enhancing our capacity to predict the responses of these species to environmental changes
Starret amp Waters (2007) studied the sequence evolution of a heat inducible hsp70 gene in three spider
families They verified that populations from the heat-tolerant family Diguetidae that inhabits the
Appendix
38
deserts of Sonoran and Mojave in North America have evidence of positive natural selection that
altered hsp70 coding sequence This alteration in the gene coding sequence may have conferred
adaptative advantage to these spiders deal with heat allowing them to colonize desert habitats (Starrett
amp Waters 2007) Changes in the coding sequence of hsps have also been found in Drosophila
melanogaster Frydenberg et al (2003) found that hsp26 and hsp27 genes have several polymorphisms
with implications in protein coding sequence (nonsynonimous nucleotide substitutions) Interestingly
the hsp26 polymorphism presented a latitudinal pattern along the east coast of Australia similar to what
as previously been found for hsp23 gene Clinal sequence variation can be a challenging subject for
study because it provides the possibility to identify specific polymorphisms responsible for climatic
adaptations (Reusch amp Wood 2007 Blackman 2010) Nonetheless Fangue et al (2006) did not find
differences in the amino acid sequence between populations of Fundulus heteroclitus (killifish) Rather
they find differences in gene expression patterns of hsp70-2 gene between northern and southern
populations of this killifish
Several species of the Leuciscinae sub-family are distributed throughout the Portuguese rivers in
which different species inhabit rivers with different regimes Some of these species inhabit in rivers of
the southern part of Portugal which are characterized by a regime of severe droughts that subjects
fishes to high temperatures when trapped in small water bodies during the dry season (Henriques et al
2010) Our first aim was to test the existence of a latitudinal adaptative variation in the DNA sequence
of the hsp70 gene in speciespopulations of the Leuciscinae sub-family [in Squalius genus and in the
formerly described Chondrostoma genus (Robalo et al 2007)] given that sequence variation had been
previously detected in this gene by our Research Group (MMCoelho personnal communication)
Material and methods
Genomic DNA extraction PCR amplification and sequencing
Genomic DNA was extracted from fin clips following standard protocols of digestion with SDS and
proteinase K and phenolchlorophorm extraction (Miller et al 1988) in a total of 51 individuals 17
from Squalius genus and 34 from ldquoChondrostomardquo genera Approximately 819 bp of the hsp70 gene
were amplified in a total volume of 25 microl with a final concentration of 125 units of DNA polymerase
Gotaq flexi (Fermentas) 03 μM of each primer 025 mM of each dNTP and 2mM of MgCl2 using the
forward 5-TACACGTCCATCACCAGAGC-3 (Hsp70_F2) and reverse 5-
ACTTTCTCCAGCTCCTTCAG-3 (Hsp70_R2) primers PCR products were purified and sent for
Appendix
39
sequencing in Macrogen Korea
Meanwhile two other pairs of primers
(Table 1) were designed in order to extend
the coverage of this gene which improve
the power of the subsequent analysis Both
pairs of primers were designed using the
information of the already sequenced
amplicon and sequences of this gene from other fish species (Danio rerio Carassius auratus
Megalobrama amblycephala) available in public databases (NCBI and Ensembl) One pair of primers
were designed to cover the ATPase domain of the gene (Hsp70_FATPaseHsp70_RATPase) and
amplification was carried out in a total volume of 25 ul with a final concentration of 125 units of DNA
polymerase Gotaq flexi (fermentas) 08 μM of forward primer and 04 μM of reverse primer 025 mM
of each dNTP and 175 mM of MgCl2 with an initial denaturation step at 94degC during 5 min followed
by 35 cycles at 94degC for 1 min 56degC for 1 min and 72ordmC 1min and 30 seconds and to a final extension
of 10 min at 72ordmC The other pair of primers was designed to cover the C-terminal
(Hsp70_F2Hsp70_Rc-term) of the gene and were amplified in a total volume of 25 ul with a final
concentration of 125 units of DNA polymerase Gotaq flexi (fermentas) 03 μM each primer 025 mM
of each dNTP and 15 mM of MgCl2 with an initial denaturation step at 94degC during 5 min followed
by 35 cycles at 94degC for 1 min 66degC for 30 seconds and 72ordmC 1min and to a final extension of 10 min
at 72ordmC The obtained amplicons were sent for sequencing in Macrogen Korea All Sequences obtained
were edited and their chromatograms manually checked for errors in SEQUENCHER v42 (Gene
Codes Corporation) BLAST analyses (Zhang et al 2000) were used to confirm the identity of the
gene
Phylogenetic and evolutionary analysis
Hsp70 phylogenetic tree was generated with 2 millions generations sampled every 100th
generation in
two independent runs using MrBayes v 31 (Ronquist amp Huelsenbeck 2003)
and was used in the
subsequent analysis
Codeml module of the PAML package (Yang 2007) was used to test for the existence of natural
selection in this gene between the species of the Leuciscinae sub-family studied here This module have
implemented codon substitution models useful for detecting positive natural selection branch models
Primer name Primer Sequence 5 - 3
Hsp70_FATPase AGGARTYGCTATTGGSATTG
Hsp70_RATPase CTGCCRTTGAAGAAATCCT
Hsp70_F2 TACACGTCCATCACCAGAGC
Hsp70_R2 ACTTTCTCCAGCTCCTTCAG
Hsp70_Rc-term CTGGAGGMTGTGGAGCTCAG
Table 1 ndash Primers used in this study
Appendix
40
sites models and branch-site models (Yang 2007) Branch models were used to test different ω=dSdN
ratios for distinct branches on the phylogeny (Yang 2007 Yang amp Nielsen 2002) dNdS is the
nonsynonymoussynonymous substitution rate ratio that measures the direction and magnitude of
selection on amino acid changes with values of ωlt1 =1 and gt1 indicating negative purifying
selection neutral evolution and positive selection respectively Site models tested the presence of sites
under positive selection in the nucleotide sequence Finally branch-site models were used to detect
positive selection affecting only a few sites on certain lineages (branches on the phylogeny) (Yang
2007 Yang amp Nielsen 2002) Likelihood ratio tests (LRTs) were used to determine the model that best
fits and statistical decisions were based on a p-level = 005
Results and Discussion
The analysis of the hsp70 gene 819 bp primarily sequenced revealed that for all the species analyzed
a ω = 0145 was obtained suggesting that the hsp70 gene in these species is mainly conserved as it
was expected according to the fact that HSPs are one of the most conserved proteins between different
organisms (Lindquist amp Craig 1988)
Table 2 ndash Likelihood ratio test statistics Significant tests are marked with an
Hypotheses LRT df 2Δl p value
Branch models
one vs two (ω0 - others ω1 - southern species) 14948 1 7474 0008
one ω vs two ω (ω0 - Chondrostoma ω1 - Squalius) 1246 1 0623 1000
one vs two (ω0 - others ω1 - southern speciesS carolitertii group) 17934 1 8967 0005
one vs three (ω0 - others ω1 - southern species ω2 - S carolitertii) 17527 2 17527 0000
two (ω0 - others ω1 - southern speciesS carolitertii group) vs three (ω0 - others ω1 - southern species ω2 - S carolitertii) 0407 1 0204 1000
Sites models
M1a vs M2a 0002 2 0002 1000
M7 vs M8 0001 2 0001 1000
Branch-site
models ma(fixed) vs ma(modified)
3440 1 1720 0317
We tested the hypothesis of the ω ratio for the southern species (S torgalensis S aradensis and
Iberochondrostoma almacai) of both lineages (Squalius and ldquoChondrostomardquo) being different from the
other species using branch models and results suggest that there exists a different ω ratio for the
southern species when compared to the other species We also tested the hypothesis of Squalius have a
different ω ratio from ldquoChondrostomardquo although this time there were no differences between this
model and the null model of one ω ratio for the entire phylogeny Since S carolitertii from Vouga and
Douro drainages also seem to present a higher number of nucleotide substitutions as suggested by the
Appendix
41
hsp70 phylogeny (Fig 1) we tested a new model including these S carolitertii in the southern group
and this model was statistically different from the null model (one ω ratio for all the lineages)
However this last model has a higher likelihood than the model with only the southern species having
a different ω ratio (Table 2) Three-ratio models were also tested one ω ratio for S carolitertii lineage
previously referred other for the southern species group (S torgalensis S aradensis and
Iberochondrostoma almacai) and another for the remaining species The model also reject the null
hypothesis suggesting the existence of more than one ω ratio however this model is not significantly
different from the two-ratio model with S carolitertii included in the southern group and its likelihood
is also slightly lower thus the simpler model was preferred (Table 2) In order to examine if natural
selection is acting on specific codons across all the species analyzed here we carry out two tests
implemented in PAML package (M1a versus M2a and M7 versus M8 see Table 2) In each case we do
not reject the null hypothesis that there are not codons under positive selection across the hsp70
phylogeny (Table 2) Branch-site models were carried out in order to test the presence of sites under
positive selection between the group southern speciesS carolitertii and the remaining species and the
null hypothesis of neutrality was not rejected suggesting that in this portion of the hsp70 gene there is
no evidence of positive for these lineages
Appendix
42
Fig 1- Phylogenetic relationships of the sampled species based in the 819 bp sequenced of hsp70 gene with primers
Hsp70_F2Hsp70_R2 Individuals with similar sequences were grouped in order to facilitate the interpretation of the results
Black stars represent the species that were included in the southern group while the black arrow points to the lineage of S
carolitertii which was grouped with the southern species in some analysis of branch models ldquoChondrostomardquo group
include three different genera Iberochondrostoma Pseudochondrostoma Achondrostoma
Furthermore since natural selection may act in the entire protein coding sequence and not only in a
portion of it we tried to sequence other portions of the gene However the results of sequencing with
the Hsp70_F2 and Hsp70_Rc-term primers did not match the same gene from the previous sequences
(obtained with the Hsp70_F2 and Hsp70_R2 primers) (Fig 2) This issue was even more important
given that the individuals sequenced were the same that have been already sequenced with the F2 and
R2 primers These observations suggest that many hsp70 genes can be amplified with the Hsp70_F2
Hsp70_R2 pair of primers and which makes it very difficult to design gene specific sets of primers to
amplify the entire gene sequence
Appendix
43
1 100
||||||||||||||||||||
V5ScarlV (Hsp70 F2Rc-term primers)
GGAACACTTGAGCCCGTGGAGAAAGCCCTGAGAGACGCCAAGATGGACAAGTCTCAGATCCATGACGTCGTTCTGGTTGGTGGATCAACAAGAATCCCAA
T7Storg (Hsp70 F2Rc-term primers)
V5ScarlV (Hsp70 F2R2 primers)
TATGTTCG
T7Storg (Hsp70 F2R2 primers)
TATGTTCG
101 200
||||||||||||||||||||
V5ScarlV (Hsp70 F2Rc-term primers)
AGATCCAGAAGCTTCTGCAGGATTTCTTCAACGGCAGGGACTTGAACAAGAGCATCAACCCAGATGAGGCAGTGGCTTATGGTGCAGCGGTGCAAGCCGC
T7Storg (Hsp70 F2Rc-term primers)
V5ScarlV (Hsp70 F2R2 primers)
T7Storg (Hsp70 F2R2 primers)
201 300
||||||||||||||||||||
V5ScarlV (Hsp70 F2Rc-term primers)
CATCCTCATGGGTGACACATCTGGAAATGTCCAGGACCTGCTGCTGCTGGATGTTGCGCCACTCTCTTTGGGCATCGAGACTGCAGGTGGAGTCATGACG
T7Storg (Hsp70 F2Rc-term primers)
V5ScarlV (Hsp70 F2R2 primers)
T7Storg (Hsp70 F2R2 primers)
A
301 400
||||||||||||||||||||
V5ScarlV (Hsp70 F2Rc-term primers)
GCCCTCATCAAACGCAACACCACCATCCCCACCAAACAGACCCAGACCTTCACCACCTACTCAGACAACCAGCCCGGTGTCCTGATCCAGGTGTATGAGG
T7Storg (Hsp70 F2Rc-term primers)
V5ScarlV (Hsp70 F2R2 primers)
T7Storg (Hsp70 F2R2 primers)
401 500
||||||||||||||||||||
V5ScarlV (Hsp70 F2Rc-term primers)
GAGAGAGGGCCATGACAAAAGACAACAACCTGCTGGGTAAATTTGAGCTCACAGGAATTCCACCTGCACCACGTGGAGTCCCGCAGATTGAAGTGACCTT
T7Storg (Hsp70 F2Rc-term primers)
V5ScarlV (Hsp70 F2R2 primers)
G
T7Storg (Hsp70 F2R2 primers)
T
501 600
||||||||||||||||||||
V5ScarlV (Hsp70 F2Rc-term primers)
TGACATTGACGCCAACGGAATCCTAAATGTGTCAGCGGTGGACAAAAGCACTGGAAAAGAGAACAAGATCACCATCACCAATGACAAGGGCAGACTGAGC
T7Storg (Hsp70 F2Rc-term primers)
V5ScarlV (Hsp70 F2R2 primers)
T7Storg (Hsp70 F2R2 primers)
A
Appendix
44
601 700
||||||||||||||||||||
V5ScarlV (Hsp70 F2Rc-term primers)
AAAGAGGAGATTGAGAGAATGGTGCAGGACGCAGACAAGTACAAAGCTGAAGATGATCAGCAAAGAGAGAAGATTGCTGCCAAAAACTCCCTGGAGTCTT
T7Storg (Hsp70 F2Rc-term primers)
V5ScarlV (Hsp70 F2R2 primers)
T7Storg (Hsp70 F2R2 primers)
701 800
||||||||||||||||||||
V5ScarlV (Hsp70 F2Rc-term primers)
ACGCCTTCAACATGAAGAGCAGTGTGGAAGATGAGAACCTGAAAGGCAAGATCAGCGAGGATGACAAGAAGAAAGTTATTGAGAAATGCAACGCCACCAT
T7Storg (Hsp70 F2Rc-term primers)
V5ScarlV (Hsp70 F2R2 primers)
AAA
T7Storg (Hsp70 F2R2 primers)
AA
801 897
|||||||||||||||||||
V5ScarlV (Hsp70 F2Rc-term primers)
CAGCTGGCTAGAGAACAACCAGCTGGCTGATAAGGAGGAGTATGAACATCAGTTGAAGGAGTTGGAGAAAGTCTGCAACCCAATCATCACTAAGCTT
T7Storg (Hsp70 F2Rc-term primers)
V5ScarlV (Hsp70 F2R2 primers)
------------------------------------------------------------------------------
T7Storg (Hsp70 F2R2 primers)
------------------------------------------------------------------------------
Fig 2 ndash Sequence alignment of the same two individuals (one of each species) using two different pair of primers
(Hsp70_F2Hsp70_R2 and Hsp70_F2Hsp70_Rc-term) Here it is possible to observe that there are no differences
(represented as dots) between V5CarlV (S carolitertii) and T7Storg (S torgalensis) in the nucleotide sequence of hsp70
with the Hsp70_F2Hsp70_Rc-term However with the other pair of primers (Hsp70_F2Hsp70_R2) it is possible to
observe several polymorphisms (indicated by their respective nucleotides in each sequence) Given the incongruence
between the two pair of primers there are doubts about the specificity of the Hsp70_F2Hsp70_R2 pair of primers
Final remarks
Having into account the doubt raised by the expansion of the sequenced amplicon this study was
abandoned since the validity of these results is questionable However the information obtained here
provided the opportunity to follow a new approach presented in this master thesis (Page 1) Namely the
information obtained from the sequences generated helped in the design of gene specific primers
Acknowledgments
I would like to thank Silke Waap for providing the phylogenetic tree of the hsp70 gene used here and
for the design of the primers Hsp70_F2 and Hsp70_R2
Appendix
45
References
Blackman BK (2010) Connecting genetic variation to phenotypic clines Molecular ecology 19 621-3
Chevin LM Lande R Mace GM (2010) Adaptation Plasticity and Extinction in a Changing
Environment Towards a Predictive Theory PLoS Biology 8 e1000357
Clarke A (2003) Costs and consequences of evolutionary temperature adaptation Trends in Ecology amp
Evolution 18 573-581
Dahlhoff EP Rank NE (2007) The role of stress proteins in responses of a montane willow leaf beetle
to environmental temperature variation Journal of biosciences 32 477-88
Fangue NA Hofmeister M Schulte PM (2006) Intraspecific variation in thermal tolerance and heat
shock protein gene expression in common killifish Fundulus heteroclitus The Journal of
experimental biology 209 2859-72
Frydenberg J Hoffmann AA Loeschcke V (2003) DNA sequence variation and latitudinal associations
in hsp23 hsp26 and hsp27 from natural populations of Drosophila melanogaster Molecular
Ecology 12 2025-2032
Gebremedhin B Ficetola GF Naderi S Rezaei HR Maudet C Rioux D Luikart G Flagstad Oslash
Thuiller W Taberlet P (2009) Frontiers in identifying conservation units from neutral markers to
adaptive genetic variation Animal Conservation 12 107-109
Henriques R Sousa V Coelho MM (2010) Migration patterns counteract seasonal isolation of Squalius
torgalensis a critically endangered freshwater fish inhabiting a typical Circum-Mediterranean
small drainage Conservation Genetics
Lindquist S Craig EA (1988) The heat-shock proteins Annual Review of Genetics 22 631-77
Miller S Dykes D Polesky H (1988) A simple salting out procedure for extracting dna from human
nucleated cells Nucleic Acids Research 16 1215
Moritz C (1994) Defining ldquoEvolutionarily Significant Unitsrdquo for conservation Trends in Ecology amp
Evolution 9 373-375
Reusch TBH Wood TE (2007) Molecular ecology of global change Molecular ecology 16 3973-92
Robalo JI Almada VC Levy A Doadrio I (2007) Re-examination and phylogeny of the genus
Chondrostoma based on mitochondrial and nuclear data and the definition of 5 new genera
Molecular phylogenetics and evolution 42 362-72
Ronquist F Huelsenbeck JP (2003) MrBayes 3 Bayesian phylogenetic inference under mixed models
Bioinformatics 19 1572-1574
Appendix
46
Somero GN (2010) The physiology of climate change how potentials for acclimatization and genetic
adaptation will determine ldquowinnersrdquo and ldquolosersrdquo The Journal of experimental biology 213 912-
20
Starrett J Waters ER (2007) Positive natural selection has driven the evolution of the Hsp70s in
Diguetia spiders Biology letters 3 439-44
Yang Z (2007) Paml 4 a program package for phylogenetic analysis by maximum likelihood
Molecular Biology and Evolution 24 1586-1591
Yang Z Nielsen R (2002) Codon-substitution models for detecting molecular adaptation at individual
sites along specific lineages Molecular biology and evolution 19 908-17
Zhang Z Schwartz S Wagner L Miller W (2000) A greedy algorithm for aligning DNA sequences
Journal of computational biology a journal of computational molecular cell biology 7 203-214

Research article In preparation
13
non-parametric one-way Kruskal-Wallis ANOVAs were performed considering each
experimenter (each aquarium) an individual sample With this proceeding effect(s) that
influence the expression of hsp70 andor hsc70 in the different experiments cannot be
identified however by carrying out post hoc tests (Dunns test) one could look for
differences between experiments All statistical decisions were based on a p-level =
005 Statistical tests were performed in Statistica 90 software (StatSoft 2009)
Results
Survival to the experiments
During long term survival experiments some
individuals subjected to 4 temperature treatments
(20ordmC 25ordmC 30ordmC and 35ordmC) died or started to show
signs of losing equilibrium A total of 8 individuals
did not reach the 35ordmC experimental condition two S
carolitertii died during the increment from 34ordm to 35ordm
(without any sign of losing equilibrium during
observation periods) and all the six S pyrenaicus
exposed to the increment to 35ordm did not reached that
condition Six individuals S pyrenaicus demonstrated
symptoms of losing equilibrium at 32ordmC33ordmC (2 at
32ordmC and 4 at 33ordmC) These 6 individuals of S
pyrenaicus were represented in the 35ordmC category in
the subsequent analysis S torgalensis individuals
never showed any stress symptom In experiments of
short term survival no individual died or showed
signs of losing its balance or died
A total of 74 individuals (25 S torgalensis 27 S pyrenaicus and 22 S carolitertii) were
used (Table 2) in gene expression quantification of the target genes in long term survival
experiments Since the RNA from two individuals S carolitertii was degraded only 4
individuals of this species were used at 20ordmC for gene expression quantification and in
the subsequent analysis
n are the number of individuals subjected to the experiments all 6 fishes lost equilibrium before the experiments end four of these individuals were used in gene expression quantification In brackets is the number of individuals that died during the experiments
Table 2 ndash Number of individuals used in long term survival experiments
Treatments n
S torgalensis 20degC 6
S torgalensis 25degC 6
S torgalensis 30degC 7
S torgalensis 35degC 6
S pyrenaicus 20degC 7
S pyrenaicus 25degC 7
S pyrenaicus 30degC 7
S pyrenaicus 35degC 6
S carolitertii 20degC 6
S carolitertii 25degC 6
S carolitertii 30degC 7
S carolitertii 35degC 7 (2)
Research article In preparation
14
Identification of two members of the hsp70 family
Using the first pair of primers (Hsp70_F2 and Hsp70_R2) two copies of the hsp70 gene
family were identified from the sequences obtained with the amplified cDNAs of S
carolitertii and S torgalensis individuals The chromatograms of the sequences
resulting from the 20ordmC treatment showed a single copy of hsp70 gene family that
matched with high identity with hsc70-1 from Cyprinus carpio (accession number
AY1208931) (followed by hsc70 from Danio rerio [accession number L771461]
Megalobrama amblycephala [accession number EU623471] Ctenopharyngodon idella
[accession number EU816595]) A quite different result was observed in the 30ordmC
sample with the observation of double peaks in some sites suggesting the presence of
more than one transcript In fact two peak patterns were distinguished one consistently
matching the hsc70 transcript (already sequenced at 20ordmC) and the other appeared to be
somewhat divergent with BLAST results showing a high similarity with the inducible
form of hsp70 from other cyprinids (accession numbers EU884290 HQ007352
AY120894 AB092839 BC056709)
Afterwards specific primers were designed for each hsp gene (Table 1) The new hsp70
sequences had 351 base pairs (bp) and no variable sites were detected contrasting with
the previous pair of primers which had nucleotide differences in this region of the
hsp70 gene (Fig S2 supplementary material) For hsc70 sequences 458 bp were
sequenced and two variable sites were found although these nucleotide substitutions are
both synonymous (Fig S3 supplementary material) However this new pair of primers
specific of the hsc70 transcript did not amplify in S pyrenaicus individuals and thus
this species was not included in expression analyses of this gene
Analysis of the expression patterns of hsp70 in long term survival experiments
For S torgalensis both fin clips and muscle presented a similar incremental pattern in
the hsp70 mRNA levels with the increase of water temperature (Fig 3) Therefore a
more accurate analysis was performed with the data obtained from fin clips allowing to
carry out a statistical analysis
Expression levels of the three species at 20ordmC (control temperature) showed that S
Research article In preparation
15
carolitertii has higher expression levels of hsp70 than the other two species (Fig 4)
Fig 3 - Comparison of hsp70 gene expression patterns between fin clips and muscle samples from S
torgalensis (A) gel images showing the increment in both tissues (B) Fold increment graphical
representation also showing the similar incremental pattern in both tissues
In these experimental conditions S torgalensis exposed to 35ordmC treatment had an
increment in hsp70 mRNA levels in average 59 times higher than those observed in the
control situation (20ordmC) and about 53 times higher than at 30ordmC In S pyrenaicus
individuals a similar pattern was observed with a mean 34 and 29 fold increment in the
35ordmC treatment relatively to the control situation and 30ordmC treatment respectively In the
other hand S carolitertii did not exceed the 3 fold increment even in the harsher
temperature treatment (Fig 5)
A
B
Research article In preparation
16
In order to test if the main
differences found are
statistically significant
several statistical analyses
were performed Firstly it
was tested if the dataset met
the assumptions of normality
and homocedasticity Both
assumptions were not
satisfied and although
several data transformation
have been realized none of
these improved data Thus transformations were not applied since they did not have any
effect in the assumptions However the removal of some outliers from experimental
conditions that did not present normal distributions (Fig S1 supplementary material)
assisted in achieving the assumption of normality Despite the lack of homocedasticity
two factorial ANOVAs were performed a first one with the full data and a second one
with the removal of 4 outliers (one S torgalensis at 20ordmC one S torgalensis at 25ordmC
one S torgalensis at 30ordmC one S pyrenaicus at 30ordmC) Results from both datasets are
similar in the main conclusions despite having different values
Fig 5 ndash Hsp70 fold increment in long term survival experiments for all the studied species
For the full dataset the factors species (F=7270 df=2 p=0001) and temperature
(F=23196 df=3 p=0000) are significantly influencing hsp70 expression levels The
Fig 4 ndash Hsp70 expression levels at 20ordmC
Research article In preparation
17
interaction of both variables was also significant (F=4521 df=6 p=0001) After the
removal of outliers the interpretation remained the same being species (F=6792 df=2
p=0002) temperature (F=25077 df=3 p=0000) and interaction of both (F=4495
df=6 p=0001) statistically significant Post hoc comparisons showed that S pyrenaicus
has a significantly higher expression of hsp70 when exposed to temperatures of 32-
33ordmC compared with all the other conditions tested even in other species (Table 3) It is
worth to note that the category S pyrenaicus 35ordmC represent those individuals that lost
their balance at 32ordm-33ordmC S torgalensis exposed to 35ordmC also presented an increment of
hsp70 levels comparing with those observed at 20ordmC 25ordmC and 30ordmC (Table 3) S
carolitertii did not statistically differ from any other treatment
Subsequently differences between experimental conditions were investigated Since all
assumptions were not met for full dataset and after the removal of 4 outliers a
nonparametric Kruskal-Wallis ANOVA was performed using this dataset revealing
significant differences (H=48985 df=11 p=0000) between the different treatments
(differences between each experimental condition) Post hoc comparisons with Dunns
test (Zar 1996 StatSoft 2010) revealed significant differences in S torgalensis
expression levels at 35ordmC treatment compared with 20ordm (Q=3893 p=0007) and 25ordm
treatments (Q=3960 p=0005) S pyrenaicus exposed to 32ordmC and 33ordmC also had
significant differences from the control situation at 20ordmC (Q=3494 p=0003) With
nonparametrics statistics S carolitertii remained without significant increase in hsp70
expression
Regarding the differences between species at 20ordmC (Fig 4) an one-way ANOVA was
performed Since the dataset violated the assumptions of normality and homogeneity of
variances the removal of two previously identified outliers (one S torgalensis at 20ordmC
and one S pyrenaicus at 20ordmC) was useful to meet these assumptions Though results
with and without these outliers point to statistically significant differences of hsp70
expression between species at 20ordmC (F=29455 df=2 p=0000 and F=56203 df=2
p=0000 respectively with and without outliers) Post hoc comparisons revealed that S
carolitertii expression levels at 20ordmC significantly differ from those of S torgalensis
(df=13 p=0000) and S pyrenaicus (df=13 p=0001) (Fig 4)
Research article In preparation
18
Table 3 ndash Post hoc comparisons using Tukey HSD test statistics
Each cell represents the p-value in each pairwise comparison Significant differences are marked with an Upper diagonal ndash dataset with outlier
removal (df=58) lower diagonal ndash full dataset (df=62) S pyrenaicus 35ordmC represent those individuals that lost their balance at 32ordm-33ordmC
S
torgalensis
20ordmC
S
torgalensis
25ordmC
S
torgalensis
30ordmC
S
torgalensis
35ordmC
S
pyrenaicus
20ordmC
S
pyrenaicus
25ordmC
S
pyrenaicus
30ordmC
S
pyrenaicus
35ordmC
S
carolitertii
20ordmC
S
carolitertii
25ordmC
S
carolitertii
30ordmC
S
carolitertii
35ordmC
S torgalensis
20ordmC 1000 1000 0021 1000 0849 1000 0000 1000 0998 0993 0567
S torgalensis
25ordmC 1000 1000 0021 1000 0845 1000 0000 1000 0998 0992 0561
S torgalensis
30ordmC 1000 1000 0024 1000 0934 1000 0000 1000 1000 0999 0688
S torgalensis
35ordmC 0016 0016 0028 0015 0535 0104 0003 0193 0166 0241 0951
S pyrenaicus
20ordmC 1000 1000 1000 0018 0872 1000 0000 1000 1000 0997 0582
S pyrenaicus
25ordmC 0832 0837 0942 0564 0886 0997 0000 0998 1000 1000 1000
S pyrenaicus
30ordmC 0985 0986 0999 0239 0994 1000 0000 1000 1000 1000 0926
S pyrenaicus
35ordmC 0000 0000 0000 0003 0000 0000 0000 0000 0000 0000 0000
S carolitertii
20ordmC 1000 1000 1000 0214 1000 0999 1000 0000 1000 1000 0952
S carolitertii
25ordmC 0998 0998 1000 0185 1000 1000 1000 0000 1000 1000 0971
S carolitertii
30ordmC 0799 0804 0920 0703 0856 1000 1000 0000 0997 0999 0990
S carolitertii
35ordmC 0543 0550 0712 0957 0610 1000 0992 0000 0958 0975 1000
Research article In preparation
19
Kruskal-Wallis ANOVA was also performed given that the original data slightly violates
homocedasticity and normality assumptions Results also indicated that there are
differences between species in the expression levels at 20ordmC (H=12235 df=2 p=0002)
being this differences between S carolitertii and S torgalensis (Q=3471 p=0002)
Analysis of the expression patterns of hsc70 in long term survival experiments
Expression levels at 20ordmC (control
temperature) did not show
significant differences between S
carolitertii and S torgalensis (Fig
6) S torgalensis exposed to 35ordmC
treatment had an increment in
hsp70 mRNA levels in average 14
times higher than those observed
in the control situation and about
12 times higher than at 30ordmC In
the other hand S carolitertii did
not exceeded the 3 fold increment
being the 30ordmC the temperature at
which hsc70 expression levels were more elevated however no significance was
achieved (Fig 7)
In order to statistically test the different patterns observed above several statistical
analysis were performed Hsc70 dataset met the assumption of homogeneity of
variances (F=2050 df=7 39 p=0073) yet with some deviations from normality
Square root logarithmic and natural logarithmic transformations were applied Since
square root transformation was sufficient to meet all the assumptions this
transformation was used instead of the others As previously done for the hsp70 dataset
the non transformed data and transformed data were analyzed in factorial ANOVAs
With the non transformed dataset significant differences were found for the factors
species (F=4548 df=1 p=0039) temperature (F=10887 df=3 p=0000) and to the
interaction between them (F=9493 df=3 p=0000)
Fig 6 - Hsc70 expression levels at 20ordmC
Research article In preparation
20
Fig 7 - Hsc70 fold increment in long term survival experiments for S torgalensis and Scarolitertii
Results obtained with the transformed dataset were slightly different since only the
factor temperature (F=12001 df=3 p=0000) and the interaction between temperature
and species (F=10335 df=3 p=0000) were significant Post hoc comparisons revealed
that S torgalensis exposed to 35ordmC are different from all the other treatments applied to
this species and to S carolitertii (Table 4)
Since the normality assumption were not achieved with the non transformed data
Kruskal-Wallis ANOVA were carried out and significance was found (H=22502 df=7
p=0002) for differences between the different treatments (differences between
experimental aquariums) Post hoc comparisons with Dunns test revealed that exists
significant differences in S torgalensis expression levels at 35ordmC treatment compared
with 20ordm (Q=3684 p=0006) and 25ordm treatments (Q=4042 p=0001) No other
statistical differences were found with multiple comparisons
Analysis of the expression patterns of hsp70 in short term survival experiments
Results from this experiment show that the expression levels of S torgalensis S
pyrenaicus and S carolitertii exposed to a rapid increment to 30ordmC resulted in average
fold increments of 26 23 and 7 in hsp70 mRNA respectively Comparing with the
results of the long term survival experiments at 30ordmC hsp70 mRNA levels are in
average 20 18 and 4 times higher for S torgalensis S pyrenaicus and S carolitertii
respectively (Fig 8A)
Research article In preparation
21
Table 4 - Post hoc comparisons using Tukey HSD test statistics
Each cell represents the p-value in each pairwise comparison Significant differences are marked with an Upper diagonal ndash dataset with square
root transformation (df=39) lower diagonal ndash non transformed dataset (df=39)
S torgalensis
20ordmC
S torgalensis
25ordmC
S torgalensis
30ordmC
S torgalensis
35ordmC
S carolitertii
20ordmC
S carolitertii
25ordmC
S carolitertii
30ordmC
S carolitertii
35ordmC
S torgalensis
20ordmC 1000 0958 0000 1000 1000 0218 0952 S torgalensis
25ordmC 1000 0793 0000 0988 0983 0088 0798 S torgalensis
30ordmC 0996 0980 0000 1000 0999 0803 1000 S torgalensis
35ordmC 0000 0000 0000 0000 0000 0001 0000 S carolitertii
20ordmC 1000 1000 1000 0000 1000 0665 0999 S carolitertii
25ordmC 1000 1000 0999 0000 1000 0488 0998 S carolitertii
30ordmC 0656 0505 0956 0000 0860 0756 0911 S carolitertii
35ordmC 0997 0984 1000 0000 1000 0999 0979
Research article In preparation
22
Analysis of the expression patterns of hsc70 in short term survival experiments
In hsc70 mRNA expression levels a fold increment of 5 for S torgalensis and 2 for S
carolitertii relatively to the control temperature were observed In this case the
differences between this experiment and the long term survival experiments were not so
pronounced as can be seen in Fig 8B
Fig 8 ndash Differences in fold increment between short term survival and long term survival experiments at
30ordmC in (A) hsp70 relative mRNA levels and (B) hsc70 relative mRNA levels
Discussion
To our knowledge this was the first study to quantify hsp70 and hsc70 mRNAs using fin
clips instead of other fish organs avoiding the sacrifice of animals which is particularly
relevant when studying endangered species Nonetheless Yamachita et al (2004) found
S torgalensis S pyrenaicus S carolitertii
S torgalensis S carolitertii
A
B
Research article In preparation
23
similar patterns of hsp70 gene expression between muscle and fibroblast culture from
the caudal fin tissue of Xyphophorus maculatus (platyfish) Our comparison of the
expression patterns of hsp70 between fin clips and muscle samples suggest that there
exist similarity in hsp70 expression levels of these two tissues in response to
temperature increment (Fig 3) Thus the usage of fin clips instead of muscle seems
perfectly legitimate for the quantification of hsp70 mRNAs
Hsp70 and hsc70 genes identification
Using a non specific pair of primers (Hsp70_F2Hsp70_R2) for hsp70 amplification
hsc70 was the only transcript present at 20ordmC while at 30ordmC a mixture of hsc70 and
hsp70 transcripts was observed This may be caused by the lowest expression of hsp70
at 20ordmC than at 30ordmC making it easier to amplify hsc70 since it is expressed in normal
cell functioning (Lindquist amp Craig 1988 Yamashita et al 2004) whereas hsp70 are
induced in stress situations as it is the increase of the temperature (Dahlhoff amp Rank
2007 Lindquist amp Craig 1988 Sorensen et al 2009 Chapple et al 1998 Buckley et al
2001) Another observation that corroborates the lack of transcript specificity with the
first pair of primers is the absence of variable sites in the sequence obtained with the
second and more specific hsp70 primers (Hsp70_Fc and Hsp70_Rc) (Table S2
Supplementary material)
The absence of hsc70 amplification in S pyrenaicus samples with the hsc70 specific
primers may be caused by two reasons S pyrenaicus may have a very low expression
of hsc70 thus not being detected with semi-quantitative RT-PCR (Serazin-Leroy et al
1998 Breljak amp Gabrilovac 2005) or the hsc70 gene in this species has some variable
site(s) that prevents the annealing of the primers However given the importance of this
gene in normal cell function (Yamashita et al 2004 Fangue et al 2006 Somji et al
1999) the latter hypothesis is the most likely This issue will require further
investigation with the design of new specific primers for hsc70 for this species
The role of hsp70 in thermal adaptation
Our results are consistent in confirming that hsp70 mRNA has indeed a response to
temperature increment as shown in other studies on hsp70s (Yamashita et al 2004 Yeh
Research article In preparation
24
amp Hsu 2002 Buckley et al 2001 McMillan et al 2005 Waagner et al 2010)
However few studies have found a relation between hsp70 expression levels variation
and natural occurring clines (Karl et al 2009 Sarup amp Loeschcke 2010) such as
latitudinal ones (Fangue et al 2006 Sorensen et al 2009)
According with the results from the present study it is clear that S torgalensis and S
pyrenaicus greatly increase their hsp70 mRNA levels when exposed to higher
temperatures in both long and short term survival experiments Significant differences
were found in these two species between the control and the remaining temperature
treatments particularly the most severe one (35ordmC) Despite the absence of significant
differences in nonparametric statistics between S torgalensis at 30ordmC and at 35ordmC and
between S pyrenaicus at 25ordmC 30ordmC and 35ordmC a significant increment can be observed
between 35ordmC expression levels and the control in both species Interestingly S
carolitertii did not significantly increment their expression levels which could suggest
that this fish are not in a stress condition at 25ordmC 30ordmC and 35ordmC (Sorensen et al 2003)
However contrarily to what was observed for S torgalensis (with the largest induction
of the hsp70 gene) some individuals of S carolitertii died at 35ordmC contradicting the
suggestion that they were not in a situation of extreme stress Indeed the mere failure of
S carolitertii to increase the expression of this gene may be due to a maladaption to
temperatures of around 35ordmC (Tomanek 2010) which was expected since in their natural
environment S carolitertii usually never experience temperatures higher than
approximately 31ordmC (httpsnirhpt) The lack of increment in hsp70 does not mean that
this species is not adapted to deal with thermal stress since many other mechanisms
may be involved in thermal tolerance (Sarropoulou et al 2010 Kassahn et al 2007
Tymchuk et al 2010)
However in the central region watercourses temperature can reach 35ordmC and in the
southern rivers 38ordmC (httpsnirhpt) making relevant that S pyrenaicus and S
torgalensis respond to harsh temperatures with an increment of hsp70 levels
Notwithstanding it is odd that S pyrenaicus individuals started to lose their balance at
around 32-33ordmC and some S carolitertii individuals survived at 35degC Thus in this
particular case the costs of an over expression of S pyrenaicus relatively to S
carolitertii may surpass its benefits leading to an earlier lethal condition in the former
species (Loacutepez-Maury et al 2008 Dahlhoff amp Rank 2007 Karl et al 2009 Reusch amp
Wood 2007 Tomanek 2010 Hodgins-davis amp Townsend 2009)
Research article In preparation
25
Another curious observation was that the expression levels of hsp70 in S carolitertii at
20ordmC are already high and statistically higher than those observed in the other species
(Fig 4) suggesting that S carolitertii may be exposed to a more stressful situation than
the other two species at this temperature (Tomanek 2010) In order to clarify this
situation a further experiment with a lower testing temperature need to be performed
Alternatively the hsp70 regulation in S carolitertii may be less important than for the
other two species (Place et al 2004 Tomanek 2010 Place amp Hofmann 2004) This
possible minor role of regulating hsp70 mRNA levels in S carolitertii could be
explained by a more stable environment in the northern than in the southern regions
where temperature range and maximum temperature are usually lower (Tomanek 2010)(
httpsnirhpt) Notwithstanding higher steady-state levels of hsp70 may prevent from
early heat stress since this can delay the activation of the HSR (Fangue et al 2006 Yeh
amp Hsu 2002 Buckley et al 2001 Tomanek 2010 Tomanek amp Somero 2002)
Interestingly in short term survival experiments S carolitertii was again the species
that experienced the minor increment in hsp70 mRNA levels corroborating the
hypothesis that this species inhabit in a more stable environment and thus the species
has no need to better regulate the hsp70 expression Rapid temperature increments
raised hsp70 expression levels more significantly than with the exposure to slow
increments suggesting that hsp70 may be more mobilized in short periods of heat
stress Hsp70 rapid response may be important when species are exposed to harsh
temperature variations in a daily basis as it is the case of S torgalensis which seem to
have the higher induction of hsp70 levels (Loacutepez-Maury et al 2008 Waagner et al
2010)
Therefore these results suggest the existence of a latitudinal pattern in the expression of
hsp70 in which the southern and northern species had the higher and lower response to
heat stress respectively
The relevance of upregulating hsc70
Hsc70 is thought to be part of the constitutive cell function in non stress situations and
thus it was expected two scenarios for the expression patterns of this gene with the
increment of temperature a decrease or no variation (Loacutepez-Maury et al 2008
Yamashita et al 2004 Yeh amp Hsu 2002) Genes expressed in normal cell function often
Research article In preparation
26
shut down in stress conditions which triggers the stress response that in the case of
Heat Shock Proteins lead to an increased expression of the stress inducible forms like
hsp70 (Loacutepez-Maury et al 2008 Lindquist amp Craig 1988) An expected pattern was
confirmed in S carolitertii with no significant variation in hsc70 mRNA expression
across all treatments However hsc70 levels significantly increased at 35ordmC in S
torgalensis being significantly higher than in any other treatment performed in this
study for this gene This surprising finding may somewhat confer an advantage for S
torgalensis in an environment constantly exposed to severe temperatures and daily
fluctuations in water temperature in the dry season (Sorensen et al 2003)
(httpsnirhpt) Place amp Hofmann (2001) studying Gillichthys mirabilis observed
ATPase activity of this protein at high temperatures proposing that despite HSC70 not
being an extremely thermally stable protein it is functional even at extreme
temperatures Thus an increase in the levels of this protein may be beneficial since it is
active at high temperatures In fact nor only S torgalensis can fine tune their hsp70
expression to increase during exposure to high temperatures as also they seem to be able
to increment their levels of the constitutive hsc70 (Loacutepez-Maury et al 2008)
Supporting these findings Fangue et al (2006) suggested an important role for the
hsc70 gene in killifish from the southern region of North America in dealing with
protein damage caused by daily fluctuations in temperature However results from our
experimental design suggest another explanation since individuals exposed to a faster
temperature variation did not greatly increase their hsc70 mRNA levels relatively to
long term survival experiments (Fig 8B) Induction of hsc70 can be advantageous for S
torgalensis since hsc70 may enhance their stress response to constant elevated
temperatures that they usually experience in their rivers of origin (Loacutepez-Maury et al
2008 Sorensen et al 2003) Furthermore it may be more cost effective to induce a
constitutively expressed gene than to overexploit the cascade of stress related genes
(Loacutepez-Maury et al 2008 Sorensen et al 2003) If we sum to this result the elevated
hsp70 expression levels at 35ordmC of S torgalensis we can indeed conclude that this
species is clearly adapted to their severe river regime in the expression of these genes
Although to better understand the latitudinal expression pattern of hsc70 gene it is
important to include S pyrenaicus in gene expression profiling which will be carried
out in a further investigation
Research article In preparation
27
Implications for conservation
One application of studying hspsrsquo expression patterns is to implement them as a
biomarker of environmental stress whether it is heat stress or other type of stress that
induce hsps These biomarkers can be more effective and rapid in detecting stress
disturbances than biomarkers based on growth rate mortality or fertility (Sorensen et al
2003 Karouna-Renier amp Zehr 1999) However the results from each study have to be
interpreted taking into account the evolutionary history and the ecological context of
each species Our findings suggest that hsp70 can be used as a biomarker of
environmental stress for S torgalensis and S pyrenaicus although using hsp70 as a
biomarker of environmental stress in S carolitertii may be risky A more holistic and
comprehensive approach is desirable in order to draw more accurate decisions regarding
the use of hsp70 as biomarker namely by using a larger set of genes
Concerning the threats that each of the studied species face with climate change and the
priorities that should be given to conservation of these endemic species of the Iberian
Peninsula a few considerations can be drawn Survival to the experiments results
suggest that despite S pyrenaicus individuals have increased their hsp70 mRNA levels
during temperature increment this species do not tolerate temperatures higher than
33ordmC Thus they seem to face great threats with significant changes in daily temperature
variations andor increases in maximum temperature of water during the dry season
Even though S pyrenaicus from Colares stream is representative of the genetic diversity
present in the populations of the Tejo river (Sousa-Santos et al 2007) a sample with
more populations of the wide distribution of the species would be desirable However
the Colares riverside was chosen because it is one of the few basins where S pyrenaicus
remains in a pristine state since they are not introgressed with S alburnoides genome in
this basin Introgression effects on the expression of these genes would be a
confounding variable in this experiment and thus only pure individuals were used
S carolitertii seems to have a more plastic response to environmental thermal stress
than S pyrenaicus since five individuals resisted to the 35ordmC whereas no single S
pyrenaicus individual reached this temperature However these results have to be
interpreted with caution since in the present study we cannot unveil why S carolitertii
did not significantly induce hsc70 or hsp70 transcripts Further studies in other
transcripts such as the heat shock factors other hsps and even transcripts that encode
other proteins (like Wap65 protein) putatively involved in thermal tolerance
Research article In preparation
28
(Sarropoulou et al 2010) are needed in order to unravel this issue On the other hand
the challenges of climate change will tend to be major in the southern than in the
northern region due to the particular regime of severe droughts that characterize the
former region (Somero 2010 Henriques et al 2010)(httpsnirhpt) Finally species
living closer to their thermal tolerance limits may be the more threatened with climate
changes since minor variations in environmental conditions can lead to distribution
range shifts and decreases in the abundance of these species (Dahlhoff amp Rank 2007
Tomanek 2010 Sorensen et al 2009) In this sense despite S torgalensis have proved
to better perform the induction of hsp70 and hsc70 transcripts and even in survival rates
suggesting that they are well adapted to this harsh environment this species may still be
threatened with climate change (Reusch amp Wood 2007 Tomanek 2010 Somero 2010)
Intermittent systems such as the Mira river basin are particularly vulnerable to
environmental changes Changes in the seasonal regime of floods and droughts with the
increasing occurrence of severe droughts will impact this species distribution
abundance and diversity Furthermore due to their very restricted distribution local
extinction cannot be compensated from other geographically or genetically close
populations whereas for the other two species natural or human mediated re-
colonization is more likely to be possible Thus in order to preserve this species it would
be advisable to promote habitat restoration and conservation with particular focus in the
preservation of refuges (pools) during the dry season (Henriques et al 2010 Sousa-
Santos et al 2009)
Acknowledgments
We are thankful to Carla Sousa-Santos Maria Ana Aboim Miguel Santos Miguel
Machado Silke Waap and Isa Matos for the help provided in fish capture We are also
grateful to Isa Matos and Silke Waap who designed the Gapdh_Ri and Hsp70_F2
Hsp70_R2 primers respectively
References
Abramoff MD Magelhaes PJ Ram SJ (2004) Image Processing with ImageJ
Biophotonics International 11 36-42
Research article In preparation
29
Blackman BK (2010) Connecting genetic variation to phenotypic clines Molecular
Ecology 19 621-623
Breljak D Gabrilovac J (2005) Comparison of Three RT-PCR Based Methods for
Relative Quantification of mRNA Food Technology and Biotechnology 43 379-
388
Brito RM Briolay J Coelho MM (1997) Phylogenetic Relationships within Genus
Leuciscus (Pisces Cyprinidae) in Portuguese FreshWaters Based on
Mitochondrial DNA Cytochrome b Sequences Molecular Phylogenetics and
Evolution 8 435-442
Buckley BA Owen ME Hofmann GE (2001) Adjusting the thermostat the threshold
induction temperature for the heat-shock response in intertidal mussels (genus
Mytilus) changes as a function of thermal history The Journal of Experimental
Biology 204 3571-3579
Cabral MJ (coord ) Almeida J Almeida PR Dellinger T Ferrand de Almeida N
Oliveira ME Pamleirim JM Queiroz AI Rogado L Santos-Reis M (eds) (2006)
Livro Vermelho dos Vertebrados de Portugal 2nd ed Instituto da Conservaccedilatildeo da
NaturezaAssiacuterio amp Alvim Lisboa 660 pp
Chapple JP Smerdon GR Berry RJ Hawkins AJS (1998) Seasonal changes in stress-70
protein levels reflect thermal tolerance in the marine bivalve Mytilus edulis L
Journal of Experimental Marine Biology and Ecology 229 53-68
Clarke A (2003) Costs and consequences of evolutionary temperature adaptation
Trends in Ecology amp Evolution 18 573-581
Dahlhoff EP Rank NE (2007) The role of stress proteins in responses of a montane
willow leaf beetle to environmental temperature variation Journal of biosciences
32 477-488
Fangue NA Hofmeister M Schulte PM (2006) Intraspecific variation in thermal
tolerance and heat shock protein gene expression in common killifish Fundulus
heteroclitus The Journal of Experimental Biology 209 2859-2872
Hance T Baaren J Vernon P Boivin G (2007) Impact of extreme temperatures on
parasitoids in a climate change perspective Annual Review of Entomology 52 107-
126
Henriques R Sousa V Coelho MM (2010) Migration patterns counteract seasonal
isolation of Squalius torgalensis a critically endangered freshwater fish inhabiting
a typical Circum-Mediterranean small drainage Conservation Genetics 11 1859-
1870
Hodgins-davis A Townsend JP (2009) Evolving gene expression from G to E to G x E
Trends in Ecology amp Evolution 24 649-658
Research article In preparation
30
Karl I Sorensen JG Loeschcke V Fischer K (2009) HSP70 expression in the Copper
butterfly Lycaena tityrus across altitudes and temperatures Journal of
Evolutionary Biology 22 172-178
Karouna-Renier NK Zehr JP (1999) Ecological implications of molecular biomarkers
assaying sub-lethal stress in the midge Chironomus tentans using heat shock
protein 70 (HSP-70) expression Hydrobiologia 401 255-264
Kassahn KS Crozier RH Ward AC Stone G Caley MJ (2007) From transcriptome to
biological function environmental stress in an ectothermic vertebrate the coral
reef fish Pomacentrus moluccensis BMC Genomics 8 358
Lindquist S Craig EA (1988) The heat-shock proteins Annual Review of Genetics 22
631-677
Loacutepez-Maury L Marguerat S Baumlhler J (2008) Tuning gene expression to changing
environments from rapid responses to evolutionary adaptation Nature Reviews
Genetics 9 583-593
Magalhaes MF Schlosser IJ Collares-Pereira MJ (2003) The role of life history in the
relationship between population dynamics and environmental variability in two
Mediterranean stream fishes Journal of Fish Biology 63 300-317
Marshall OJ (2004) PerlPrimer cross-platform graphical primer design for standard
bisulphite and real-time PCR Bioinformatics (Oxford England) 20 2471-2472
Mayer MP Bukau B (2005) Hsp70 chaperones cellular functions and molecular
mechanism Cellular and Molecular Life Sciences 62 670-684
McMillan DM Fearnley SL Rank NE and Dahlhoff EP (2005) Natural temperature
variation affects larval survival development and Hsp70 expression in a leaf
beetle Functional Ecology 19 844-852
Montoya JM Raffaelli D (2010) Climate change biotic interactions and ecosystem
services Philosophical Transactions of the Royal Society B Biological Sciences
365 2013-2018
Myers N Mittermeier RA Mittermeier CG Fonseca GA Kent J (2000) Biodiversity
hotspots for conservation priorities Nature 403 853-858
Osborne JW (2005) Notes on the use of data transformations Pratical Assessment
Research amp Evaluation 8 2-9
Pala I Coelho MM (2005) Contrasting views over a hybrid complex Between
speciation and evolutionary dead-end Gene 347 283-294
Pala I Coelho MM Schartl M (2008) Dosage compensation by gene-copy silencing in a
triploid hybrid fish Current Biology 18 1344-8
Research article In preparation
31
Pestana DD Velosa SF (2006) Introduccedilatildeo agrave Probabilidade e Estatiacutestica 2nd ed Lisboa
Fundaccedilatildeo Calouste Gulbenkian
Place SP Hofmann GE (2001) Temperature interactions of the molecular chaperone
Hsc70 from the eurythermal marine goby Gillichthys mirabilis The Journal of
experimental biology 204 2675-2682
Place SP Zippay ML Hofmann GE (2004) Constitutive roles for inducible genes
evidence for the alteration in expression of the inducible hsp70 gene in Antarctic
notothenioid fishes American Journal of Physiology Regulatory Integrative and
Comparative Physiology 287 R429-436
Place SP Hofmann GE (2004) Constitutive expression of a stress-inducible heat shock
protein gene hsp70 in phylogenetically distant Antarctic fish Polar Biology 28
261-267
Reusch TBH Wood TE (2007) Molecular ecology of global change Molecular Ecology
16 3973-92
Sanjur O Carmona JA Doadrio I (2003) Evolutionary and biogeographical patterns
within Iberian populations of the genus Squalius inferred from molecular data
Molecular Phylogenetics and Evolution 2920-30
Sarropoulou E Fernandes JMO Mitter K Magoulas A Mulero V Sepulcre MP
Figueras A Novoa B Kotoulas G (2010) Evolution of a multifunctional gene The
warm temperature acclimation protein Wap65 in the European seabass
Dicentrarchus labrax Molecular Phylogenetics and Evolution 55 640-649
Sarup P Loeschcke V (2010) Developmental acclimation affects clinal variation in
stress resistance traits in Drosophila buzzatii Journal of Evolutionary Biology 23
957-965
Serazin-Leroy V Denis-Henriot D Morot M Mazancourt P Giudicelli Y (1998) Semi-
quantitative RT-PCR for comparison of mRNAs in cells with different amounts of
housekeeping gene transcripts Molecular and Cellular Probes 12 283-291
SNIRH Sistema Nacional de Informaccedilatildeo de Recursos Hiacutedricos Available at
httpsnirhpt Accessed in 22 August 2010
Somero GN (2010) The physiology of climate change how potentials for
acclimatization and genetic adaptation will determine ldquowinnersrdquo and ldquolosersrdquo The
Journal of Experimental Biology 213 912-920
Somji S Todd JH Sens MA Garrett SH Sens DA (1999) Expression of the
constitutive and inducible forms of heat shock protein 70 in human proximal
tubule cells exposed to heat sodium arsenite and CdCl(2) Environmental Health
Perspectives 107 887-893
Sorensen JG Pekkonen M Lindgren B Loeschcke V Laurila A Merila J (2009)
Complex patterns of geographic variation in heat tolerance and Hsp70 expression
Research article In preparation
32
levels in the common frog Rana temporaria Journal of Thermal Biology 34 49-
54
Sorensen JG Dahlgaard J Loeschcke V (2001) Genetic variation in thermal tolerance
among natural populations of Drosophila buzzatii down regulation of Hsp70
expression and variation in heat stress resistance traits Functional Ecology 15
289-296
Sorensen JG Kristensen TN Loeschcke V (2003) The evolutionary and ecological role
of heat shock proteins Ecology Letters 6 1025-1037
Sousa-Santos C Collares-Pereira MJ Almada V (2007) Reading the history of a hybrid
fish complex from its molecular record Molecular Phylogenetics and Evolution
45 981-996
Sousa-Santos C Robalo JI Almada VC (2009) Threatened fishes of the world Squalius
torgalensis (Coelho Bogutskaya Rodrigues amp Collares-Pereira 1998)
(Cyprinidae) Environmental Biology of Fishes 87 123-124
StatSoft I (2010) Electronic Statistics Textbook (Electronic Version) Available at
httpwwwstatsoftcomtextbook
StatSoft I (2009) STATISTICA (data analysis software system) Available at
wwwstatsoftcom
Tomanek L (2010) Variation in the heat shock response and its implication for
predicting the effect of global climate change on species biogeographical
distribution ranges and metabolic costs The Journal of Experimental Biology 213
971-979
Tomanek L Somero GN (2002) Interspecific- and acclimation-induced variation in
levels of heat-shock proteins 70 (hsp70) and 90 (hsp90) and heat-shock
transcription factor-1 (HSF1) in congeneric marine snails (genus Tegula)
implications for regulation of hsp gene expression The Journal of Experimental
Biology 205 677-685
Tymchuk W OrsquoReilly P Bittman J Macdonald D Schulte P (2010) Conservation
genomics of Atlantic salmon variation in gene expression between and within
regions of the Bay of Fundy Molecular Ecology 19 1842-1859
Waagner D Heckmann LH Malmendal A Nielsen NC Holmstrup M Bayley M
(2010) Hsp70 expression and metabolite composition in response to short-term
thermal changes in Folsomia candida (Collembola) Comparative biochemistry and
physiology Part A Molecular amp integrative physiology 157 177-183
Walters RJ Berger D (2010) Thermal Games Putting Temperature Back on the
Evolutionary Agenda Evolution 64 1184-1187
Research article In preparation
33
Woodward G Perkins DM Brown LE (2010) Climate change and freshwater
ecosystems impacts across multiple levels of organization Philosophical
Transactions of the Royal Society B Biological Sciences 365 2093-2106
Yamashita M Hirayoshi K Nagata K (2004) Characterization of multiple members of
the HSP70 family in platyfish culture cells molecular evolution of stress protein
HSP70 in vertebrates Gene 336 207-218
Yeh FL Hsu T (2002) Differential regulation of spontaneous and heat-induced HSP 70
expression in developing zebrafish (Danio rerio) The Journal of Experimental
Zoology 293 349-359
Zar JH (1996) Biostatistical Analysis 3rd ed 662 pp New Jersey Prentice Hall
Zhang Z Schwartz S Wagner L Miller W (2000) A greedy algorithm for aligning
DNA sequences Journal of Computational Biology 7 203-214
Research article In preparation
34
Supplementary material
Fig S1 ndash Box plots for all the treatments performed in long term survival experiments Dark red arrows
point to the samples in which the removal of an outlier helped in meeting the normality assumption
Research article In preparation
35
1 100
||||||||||||||||||||
Ce5-Hsp70_Fc_Rc
ACCTTCACCACCTACTCAGACAACCAGCCCGGTGTCCTGATCCAGGTGTATGAGGGAGAGAGGGCCATGACAAAAGACAACAACCTGCTGGGTAAATTTG
Te15-Hsp70_Rc_Fc
---
101 200
||||||||||||||||||||
Ce5-Hsp70_Fc_Rc
AGCTCACAGGAATTCCACCTGCACCACGTGGAGTCCCGCAGATTGAAGTGACCTTTGACATTGACGCCAACGGAATCCTAAATGTGTCAGCGGTGGACAA
Te15-Hsp70_Rc_Fc
201 300
||||||||||||||||||||
Ce5-Hsp70_Fc_Rc
AAGCACTGGAAAAGAGAACAAGATCACCATCACCAATGACAAGGGCAGACTGAGCAAAGAGGAGATTGAGAGAATGGTGCAGGACGCAGACAAGTACAAA
Te15-Hsp70_Rc_Fc
301 365
|||||||||||||
Ce5-Hsp70_Fc_Rc GCTGAAGATGATCAGCAAAGAGAGAAGATTGCTGCCAAAAACTCCCTGGAGTCTTACGCCTTCAA
Te15-Hsp70_Rc_Fc -----------
Fig S2 - Sequence alignment of the cDNA of two individuals at 30ordmC (long term survival experiments) one S carolitertii (Ce5-Hsp70_Fc_Rc) and one S
torgalensis (Te15- Hsp70_Fc_Rc) Here it is possible to observe that there are no differences (represented as dots) between these two individuals in the
nucleotide sequence of hsp70 with the Hsp70_FcHsp70_Rc primers
Research article In preparation
36
1 100
||||||||||||||||||||
Ce5_hsc70 TTAGCGGGTGATAAATCTGAGAATGTCCAAGACCTTTTGCTGTTGGATGTCACTCCTCTCTCTCTGGGCATTGAGACGGCTGGTGGTGTCATGACTGTAT
Te8_hsc70 A
101 200
||||||||||||||||||||
Ce5_hsc70 TAATTAAGAGGAACACCACCATTCCCACCAAGCAAACCCAGACCTTCACCACTTACTCAGACAACCAGCCCGGTGTACTGATCCAGGTATATGAAGGAGA
Te8_hsc70
201 300
||||||||||||||||||||
Ce5_hsc70 GAGAGCCATGACAAAGGACAACAACCTTCTTGGAAAATTTGAGTTGACAGGCATCCCTCCCGCTCCTCGTGGTGTGCCACAGATCGAAGTTACCTTCGAC
Te8_hsc70
301 400
||||||||||||||||||||
Ce5_hsc70 ATTGACGCCAATGGCATTCTCAATGTATCCGCAGTGGACAAAAGCACTGGCAAAGAAAACAAGATCACGATTACTAACGACAAAGGTCGTTTGAGCAAGG
Te8_hsc70 G
401 458
|||||||||||
Ce5_hsc70 AAGACATTGAACGTATGGTACAAGAGGCTGACCAATACAAAGCAGAGGATGAAGCTCA
Te8_hsc70
Fig S3 - Sequence alignment of the cDNA of two individuals at 30ordmC (long term survival experiments) one S carolitertii (Ce5_hsc70) and one S torgalensis
(Te8_hsc70) The two nucleotide differences presented here (surrounded by a red line) did not have any implications in amino acid composition of the encoded
protein
Appendix
37
Introduction
Until recently neutral genetic markers were the state of the art tools in conservation genetics used to
access the risk of extinction of several species allowing the identification of management units
(Gebremedhin et al 2009) There are mainly two types of conservation units widely employed in
conservation genetics Evolutionary Significant Units (ESUs) and Management Units (MUs) defined
by Moritz (1994) ESUs correspond to populations whose differentiation is high and between which
took long enough so that reciprocal monophyly has occurred and they should be preserved as
independent units MUs are populations that recently diverged and between which some genetic flow
might still occur However with the increasing number of adaptative genetic makers available the field
of conservation genetics is transitioning to pay more attention to adaptative genetic variation
(Gebremedhin et al 2009 Reusch amp Wood 2007)
Local adaptation has a key role in the evolutionary history and in species ecology and thus efforts
should be carried out in order to incorporate this relevant information in making decisions for
conservation purposes (Gebremedhin et al 2009 Reusch amp Wood 2007) Important polymorphism
variation in loci with potential adaptative role might have profound effects in species ability to deal
with environmental changes stress and ultimately in populations subsistence (Gebremedhin et al
2009) Furthermore reduced neutral genetic variability is not synonymous of reduced evolutionary or
adaptative potential Populations may have reduced neutral genetic variability and yet be well adapted
to their environmental conditions (Gebremedhin et al 2009)
Temperature is one of the most challenging abiotic variables that organisms have to face in order to
avoid extinction (Clarke 2003) Temperature effects in physiological and biochemical processes are
considered to have an important role in shaping species distribution and abundance particularly for
ectotherms (Chevin et al 2010 Clarke 2003 Somero 2010) Several studies have been performed in
candidate genes of thermal adaptation namely the Heat Shock Proteins (HSPs) HSPs are important in
cellular response mechanisms during several stresses particularly heat stress and this suggests that
these proteins may have a significant role in the ecological context (Lindquist amp Craig 1988 Dahlhoff
amp Rank 2007) Sequence variation alongside with protein or mRNA expression profiles of HSPs have
been the subject of many studies that tried to understand the role of these proteins in thermal tolerance
of species enhancing our capacity to predict the responses of these species to environmental changes
Starret amp Waters (2007) studied the sequence evolution of a heat inducible hsp70 gene in three spider
families They verified that populations from the heat-tolerant family Diguetidae that inhabits the
Appendix
38
deserts of Sonoran and Mojave in North America have evidence of positive natural selection that
altered hsp70 coding sequence This alteration in the gene coding sequence may have conferred
adaptative advantage to these spiders deal with heat allowing them to colonize desert habitats (Starrett
amp Waters 2007) Changes in the coding sequence of hsps have also been found in Drosophila
melanogaster Frydenberg et al (2003) found that hsp26 and hsp27 genes have several polymorphisms
with implications in protein coding sequence (nonsynonimous nucleotide substitutions) Interestingly
the hsp26 polymorphism presented a latitudinal pattern along the east coast of Australia similar to what
as previously been found for hsp23 gene Clinal sequence variation can be a challenging subject for
study because it provides the possibility to identify specific polymorphisms responsible for climatic
adaptations (Reusch amp Wood 2007 Blackman 2010) Nonetheless Fangue et al (2006) did not find
differences in the amino acid sequence between populations of Fundulus heteroclitus (killifish) Rather
they find differences in gene expression patterns of hsp70-2 gene between northern and southern
populations of this killifish
Several species of the Leuciscinae sub-family are distributed throughout the Portuguese rivers in
which different species inhabit rivers with different regimes Some of these species inhabit in rivers of
the southern part of Portugal which are characterized by a regime of severe droughts that subjects
fishes to high temperatures when trapped in small water bodies during the dry season (Henriques et al
2010) Our first aim was to test the existence of a latitudinal adaptative variation in the DNA sequence
of the hsp70 gene in speciespopulations of the Leuciscinae sub-family [in Squalius genus and in the
formerly described Chondrostoma genus (Robalo et al 2007)] given that sequence variation had been
previously detected in this gene by our Research Group (MMCoelho personnal communication)
Material and methods
Genomic DNA extraction PCR amplification and sequencing
Genomic DNA was extracted from fin clips following standard protocols of digestion with SDS and
proteinase K and phenolchlorophorm extraction (Miller et al 1988) in a total of 51 individuals 17
from Squalius genus and 34 from ldquoChondrostomardquo genera Approximately 819 bp of the hsp70 gene
were amplified in a total volume of 25 microl with a final concentration of 125 units of DNA polymerase
Gotaq flexi (Fermentas) 03 μM of each primer 025 mM of each dNTP and 2mM of MgCl2 using the
forward 5-TACACGTCCATCACCAGAGC-3 (Hsp70_F2) and reverse 5-
ACTTTCTCCAGCTCCTTCAG-3 (Hsp70_R2) primers PCR products were purified and sent for
Appendix
39
sequencing in Macrogen Korea
Meanwhile two other pairs of primers
(Table 1) were designed in order to extend
the coverage of this gene which improve
the power of the subsequent analysis Both
pairs of primers were designed using the
information of the already sequenced
amplicon and sequences of this gene from other fish species (Danio rerio Carassius auratus
Megalobrama amblycephala) available in public databases (NCBI and Ensembl) One pair of primers
were designed to cover the ATPase domain of the gene (Hsp70_FATPaseHsp70_RATPase) and
amplification was carried out in a total volume of 25 ul with a final concentration of 125 units of DNA
polymerase Gotaq flexi (fermentas) 08 μM of forward primer and 04 μM of reverse primer 025 mM
of each dNTP and 175 mM of MgCl2 with an initial denaturation step at 94degC during 5 min followed
by 35 cycles at 94degC for 1 min 56degC for 1 min and 72ordmC 1min and 30 seconds and to a final extension
of 10 min at 72ordmC The other pair of primers was designed to cover the C-terminal
(Hsp70_F2Hsp70_Rc-term) of the gene and were amplified in a total volume of 25 ul with a final
concentration of 125 units of DNA polymerase Gotaq flexi (fermentas) 03 μM each primer 025 mM
of each dNTP and 15 mM of MgCl2 with an initial denaturation step at 94degC during 5 min followed
by 35 cycles at 94degC for 1 min 66degC for 30 seconds and 72ordmC 1min and to a final extension of 10 min
at 72ordmC The obtained amplicons were sent for sequencing in Macrogen Korea All Sequences obtained
were edited and their chromatograms manually checked for errors in SEQUENCHER v42 (Gene
Codes Corporation) BLAST analyses (Zhang et al 2000) were used to confirm the identity of the
gene
Phylogenetic and evolutionary analysis
Hsp70 phylogenetic tree was generated with 2 millions generations sampled every 100th
generation in
two independent runs using MrBayes v 31 (Ronquist amp Huelsenbeck 2003)
and was used in the
subsequent analysis
Codeml module of the PAML package (Yang 2007) was used to test for the existence of natural
selection in this gene between the species of the Leuciscinae sub-family studied here This module have
implemented codon substitution models useful for detecting positive natural selection branch models
Primer name Primer Sequence 5 - 3
Hsp70_FATPase AGGARTYGCTATTGGSATTG
Hsp70_RATPase CTGCCRTTGAAGAAATCCT
Hsp70_F2 TACACGTCCATCACCAGAGC
Hsp70_R2 ACTTTCTCCAGCTCCTTCAG
Hsp70_Rc-term CTGGAGGMTGTGGAGCTCAG
Table 1 ndash Primers used in this study
Appendix
40
sites models and branch-site models (Yang 2007) Branch models were used to test different ω=dSdN
ratios for distinct branches on the phylogeny (Yang 2007 Yang amp Nielsen 2002) dNdS is the
nonsynonymoussynonymous substitution rate ratio that measures the direction and magnitude of
selection on amino acid changes with values of ωlt1 =1 and gt1 indicating negative purifying
selection neutral evolution and positive selection respectively Site models tested the presence of sites
under positive selection in the nucleotide sequence Finally branch-site models were used to detect
positive selection affecting only a few sites on certain lineages (branches on the phylogeny) (Yang
2007 Yang amp Nielsen 2002) Likelihood ratio tests (LRTs) were used to determine the model that best
fits and statistical decisions were based on a p-level = 005
Results and Discussion
The analysis of the hsp70 gene 819 bp primarily sequenced revealed that for all the species analyzed
a ω = 0145 was obtained suggesting that the hsp70 gene in these species is mainly conserved as it
was expected according to the fact that HSPs are one of the most conserved proteins between different
organisms (Lindquist amp Craig 1988)
Table 2 ndash Likelihood ratio test statistics Significant tests are marked with an
Hypotheses LRT df 2Δl p value
Branch models
one vs two (ω0 - others ω1 - southern species) 14948 1 7474 0008
one ω vs two ω (ω0 - Chondrostoma ω1 - Squalius) 1246 1 0623 1000
one vs two (ω0 - others ω1 - southern speciesS carolitertii group) 17934 1 8967 0005
one vs three (ω0 - others ω1 - southern species ω2 - S carolitertii) 17527 2 17527 0000
two (ω0 - others ω1 - southern speciesS carolitertii group) vs three (ω0 - others ω1 - southern species ω2 - S carolitertii) 0407 1 0204 1000
Sites models
M1a vs M2a 0002 2 0002 1000
M7 vs M8 0001 2 0001 1000
Branch-site
models ma(fixed) vs ma(modified)
3440 1 1720 0317
We tested the hypothesis of the ω ratio for the southern species (S torgalensis S aradensis and
Iberochondrostoma almacai) of both lineages (Squalius and ldquoChondrostomardquo) being different from the
other species using branch models and results suggest that there exists a different ω ratio for the
southern species when compared to the other species We also tested the hypothesis of Squalius have a
different ω ratio from ldquoChondrostomardquo although this time there were no differences between this
model and the null model of one ω ratio for the entire phylogeny Since S carolitertii from Vouga and
Douro drainages also seem to present a higher number of nucleotide substitutions as suggested by the
Appendix
41
hsp70 phylogeny (Fig 1) we tested a new model including these S carolitertii in the southern group
and this model was statistically different from the null model (one ω ratio for all the lineages)
However this last model has a higher likelihood than the model with only the southern species having
a different ω ratio (Table 2) Three-ratio models were also tested one ω ratio for S carolitertii lineage
previously referred other for the southern species group (S torgalensis S aradensis and
Iberochondrostoma almacai) and another for the remaining species The model also reject the null
hypothesis suggesting the existence of more than one ω ratio however this model is not significantly
different from the two-ratio model with S carolitertii included in the southern group and its likelihood
is also slightly lower thus the simpler model was preferred (Table 2) In order to examine if natural
selection is acting on specific codons across all the species analyzed here we carry out two tests
implemented in PAML package (M1a versus M2a and M7 versus M8 see Table 2) In each case we do
not reject the null hypothesis that there are not codons under positive selection across the hsp70
phylogeny (Table 2) Branch-site models were carried out in order to test the presence of sites under
positive selection between the group southern speciesS carolitertii and the remaining species and the
null hypothesis of neutrality was not rejected suggesting that in this portion of the hsp70 gene there is
no evidence of positive for these lineages
Appendix
42
Fig 1- Phylogenetic relationships of the sampled species based in the 819 bp sequenced of hsp70 gene with primers
Hsp70_F2Hsp70_R2 Individuals with similar sequences were grouped in order to facilitate the interpretation of the results
Black stars represent the species that were included in the southern group while the black arrow points to the lineage of S
carolitertii which was grouped with the southern species in some analysis of branch models ldquoChondrostomardquo group
include three different genera Iberochondrostoma Pseudochondrostoma Achondrostoma
Furthermore since natural selection may act in the entire protein coding sequence and not only in a
portion of it we tried to sequence other portions of the gene However the results of sequencing with
the Hsp70_F2 and Hsp70_Rc-term primers did not match the same gene from the previous sequences
(obtained with the Hsp70_F2 and Hsp70_R2 primers) (Fig 2) This issue was even more important
given that the individuals sequenced were the same that have been already sequenced with the F2 and
R2 primers These observations suggest that many hsp70 genes can be amplified with the Hsp70_F2
Hsp70_R2 pair of primers and which makes it very difficult to design gene specific sets of primers to
amplify the entire gene sequence
Appendix
43
1 100
||||||||||||||||||||
V5ScarlV (Hsp70 F2Rc-term primers)
GGAACACTTGAGCCCGTGGAGAAAGCCCTGAGAGACGCCAAGATGGACAAGTCTCAGATCCATGACGTCGTTCTGGTTGGTGGATCAACAAGAATCCCAA
T7Storg (Hsp70 F2Rc-term primers)
V5ScarlV (Hsp70 F2R2 primers)
TATGTTCG
T7Storg (Hsp70 F2R2 primers)
TATGTTCG
101 200
||||||||||||||||||||
V5ScarlV (Hsp70 F2Rc-term primers)
AGATCCAGAAGCTTCTGCAGGATTTCTTCAACGGCAGGGACTTGAACAAGAGCATCAACCCAGATGAGGCAGTGGCTTATGGTGCAGCGGTGCAAGCCGC
T7Storg (Hsp70 F2Rc-term primers)
V5ScarlV (Hsp70 F2R2 primers)
T7Storg (Hsp70 F2R2 primers)
201 300
||||||||||||||||||||
V5ScarlV (Hsp70 F2Rc-term primers)
CATCCTCATGGGTGACACATCTGGAAATGTCCAGGACCTGCTGCTGCTGGATGTTGCGCCACTCTCTTTGGGCATCGAGACTGCAGGTGGAGTCATGACG
T7Storg (Hsp70 F2Rc-term primers)
V5ScarlV (Hsp70 F2R2 primers)
T7Storg (Hsp70 F2R2 primers)
A
301 400
||||||||||||||||||||
V5ScarlV (Hsp70 F2Rc-term primers)
GCCCTCATCAAACGCAACACCACCATCCCCACCAAACAGACCCAGACCTTCACCACCTACTCAGACAACCAGCCCGGTGTCCTGATCCAGGTGTATGAGG
T7Storg (Hsp70 F2Rc-term primers)
V5ScarlV (Hsp70 F2R2 primers)
T7Storg (Hsp70 F2R2 primers)
401 500
||||||||||||||||||||
V5ScarlV (Hsp70 F2Rc-term primers)
GAGAGAGGGCCATGACAAAAGACAACAACCTGCTGGGTAAATTTGAGCTCACAGGAATTCCACCTGCACCACGTGGAGTCCCGCAGATTGAAGTGACCTT
T7Storg (Hsp70 F2Rc-term primers)
V5ScarlV (Hsp70 F2R2 primers)
G
T7Storg (Hsp70 F2R2 primers)
T
501 600
||||||||||||||||||||
V5ScarlV (Hsp70 F2Rc-term primers)
TGACATTGACGCCAACGGAATCCTAAATGTGTCAGCGGTGGACAAAAGCACTGGAAAAGAGAACAAGATCACCATCACCAATGACAAGGGCAGACTGAGC
T7Storg (Hsp70 F2Rc-term primers)
V5ScarlV (Hsp70 F2R2 primers)
T7Storg (Hsp70 F2R2 primers)
A
Appendix
44
601 700
||||||||||||||||||||
V5ScarlV (Hsp70 F2Rc-term primers)
AAAGAGGAGATTGAGAGAATGGTGCAGGACGCAGACAAGTACAAAGCTGAAGATGATCAGCAAAGAGAGAAGATTGCTGCCAAAAACTCCCTGGAGTCTT
T7Storg (Hsp70 F2Rc-term primers)
V5ScarlV (Hsp70 F2R2 primers)
T7Storg (Hsp70 F2R2 primers)
701 800
||||||||||||||||||||
V5ScarlV (Hsp70 F2Rc-term primers)
ACGCCTTCAACATGAAGAGCAGTGTGGAAGATGAGAACCTGAAAGGCAAGATCAGCGAGGATGACAAGAAGAAAGTTATTGAGAAATGCAACGCCACCAT
T7Storg (Hsp70 F2Rc-term primers)
V5ScarlV (Hsp70 F2R2 primers)
AAA
T7Storg (Hsp70 F2R2 primers)
AA
801 897
|||||||||||||||||||
V5ScarlV (Hsp70 F2Rc-term primers)
CAGCTGGCTAGAGAACAACCAGCTGGCTGATAAGGAGGAGTATGAACATCAGTTGAAGGAGTTGGAGAAAGTCTGCAACCCAATCATCACTAAGCTT
T7Storg (Hsp70 F2Rc-term primers)
V5ScarlV (Hsp70 F2R2 primers)
------------------------------------------------------------------------------
T7Storg (Hsp70 F2R2 primers)
------------------------------------------------------------------------------
Fig 2 ndash Sequence alignment of the same two individuals (one of each species) using two different pair of primers
(Hsp70_F2Hsp70_R2 and Hsp70_F2Hsp70_Rc-term) Here it is possible to observe that there are no differences
(represented as dots) between V5CarlV (S carolitertii) and T7Storg (S torgalensis) in the nucleotide sequence of hsp70
with the Hsp70_F2Hsp70_Rc-term However with the other pair of primers (Hsp70_F2Hsp70_R2) it is possible to
observe several polymorphisms (indicated by their respective nucleotides in each sequence) Given the incongruence
between the two pair of primers there are doubts about the specificity of the Hsp70_F2Hsp70_R2 pair of primers
Final remarks
Having into account the doubt raised by the expansion of the sequenced amplicon this study was
abandoned since the validity of these results is questionable However the information obtained here
provided the opportunity to follow a new approach presented in this master thesis (Page 1) Namely the
information obtained from the sequences generated helped in the design of gene specific primers
Acknowledgments
I would like to thank Silke Waap for providing the phylogenetic tree of the hsp70 gene used here and
for the design of the primers Hsp70_F2 and Hsp70_R2
Appendix
45
References
Blackman BK (2010) Connecting genetic variation to phenotypic clines Molecular ecology 19 621-3
Chevin LM Lande R Mace GM (2010) Adaptation Plasticity and Extinction in a Changing
Environment Towards a Predictive Theory PLoS Biology 8 e1000357
Clarke A (2003) Costs and consequences of evolutionary temperature adaptation Trends in Ecology amp
Evolution 18 573-581
Dahlhoff EP Rank NE (2007) The role of stress proteins in responses of a montane willow leaf beetle
to environmental temperature variation Journal of biosciences 32 477-88
Fangue NA Hofmeister M Schulte PM (2006) Intraspecific variation in thermal tolerance and heat
shock protein gene expression in common killifish Fundulus heteroclitus The Journal of
experimental biology 209 2859-72
Frydenberg J Hoffmann AA Loeschcke V (2003) DNA sequence variation and latitudinal associations
in hsp23 hsp26 and hsp27 from natural populations of Drosophila melanogaster Molecular
Ecology 12 2025-2032
Gebremedhin B Ficetola GF Naderi S Rezaei HR Maudet C Rioux D Luikart G Flagstad Oslash
Thuiller W Taberlet P (2009) Frontiers in identifying conservation units from neutral markers to
adaptive genetic variation Animal Conservation 12 107-109
Henriques R Sousa V Coelho MM (2010) Migration patterns counteract seasonal isolation of Squalius
torgalensis a critically endangered freshwater fish inhabiting a typical Circum-Mediterranean
small drainage Conservation Genetics
Lindquist S Craig EA (1988) The heat-shock proteins Annual Review of Genetics 22 631-77
Miller S Dykes D Polesky H (1988) A simple salting out procedure for extracting dna from human
nucleated cells Nucleic Acids Research 16 1215
Moritz C (1994) Defining ldquoEvolutionarily Significant Unitsrdquo for conservation Trends in Ecology amp
Evolution 9 373-375
Reusch TBH Wood TE (2007) Molecular ecology of global change Molecular ecology 16 3973-92
Robalo JI Almada VC Levy A Doadrio I (2007) Re-examination and phylogeny of the genus
Chondrostoma based on mitochondrial and nuclear data and the definition of 5 new genera
Molecular phylogenetics and evolution 42 362-72
Ronquist F Huelsenbeck JP (2003) MrBayes 3 Bayesian phylogenetic inference under mixed models
Bioinformatics 19 1572-1574
Appendix
46
Somero GN (2010) The physiology of climate change how potentials for acclimatization and genetic
adaptation will determine ldquowinnersrdquo and ldquolosersrdquo The Journal of experimental biology 213 912-
20
Starrett J Waters ER (2007) Positive natural selection has driven the evolution of the Hsp70s in
Diguetia spiders Biology letters 3 439-44
Yang Z (2007) Paml 4 a program package for phylogenetic analysis by maximum likelihood
Molecular Biology and Evolution 24 1586-1591
Yang Z Nielsen R (2002) Codon-substitution models for detecting molecular adaptation at individual
sites along specific lineages Molecular biology and evolution 19 908-17
Zhang Z Schwartz S Wagner L Miller W (2000) A greedy algorithm for aligning DNA sequences
Journal of computational biology a journal of computational molecular cell biology 7 203-214
Research article In preparation
14
Identification of two members of the hsp70 family
Using the first pair of primers (Hsp70_F2 and Hsp70_R2) two copies of the hsp70 gene
family were identified from the sequences obtained with the amplified cDNAs of S
carolitertii and S torgalensis individuals The chromatograms of the sequences
resulting from the 20ordmC treatment showed a single copy of hsp70 gene family that
matched with high identity with hsc70-1 from Cyprinus carpio (accession number
AY1208931) (followed by hsc70 from Danio rerio [accession number L771461]
Megalobrama amblycephala [accession number EU623471] Ctenopharyngodon idella
[accession number EU816595]) A quite different result was observed in the 30ordmC
sample with the observation of double peaks in some sites suggesting the presence of
more than one transcript In fact two peak patterns were distinguished one consistently
matching the hsc70 transcript (already sequenced at 20ordmC) and the other appeared to be
somewhat divergent with BLAST results showing a high similarity with the inducible
form of hsp70 from other cyprinids (accession numbers EU884290 HQ007352
AY120894 AB092839 BC056709)
Afterwards specific primers were designed for each hsp gene (Table 1) The new hsp70
sequences had 351 base pairs (bp) and no variable sites were detected contrasting with
the previous pair of primers which had nucleotide differences in this region of the
hsp70 gene (Fig S2 supplementary material) For hsc70 sequences 458 bp were
sequenced and two variable sites were found although these nucleotide substitutions are
both synonymous (Fig S3 supplementary material) However this new pair of primers
specific of the hsc70 transcript did not amplify in S pyrenaicus individuals and thus
this species was not included in expression analyses of this gene
Analysis of the expression patterns of hsp70 in long term survival experiments
For S torgalensis both fin clips and muscle presented a similar incremental pattern in
the hsp70 mRNA levels with the increase of water temperature (Fig 3) Therefore a
more accurate analysis was performed with the data obtained from fin clips allowing to
carry out a statistical analysis
Expression levels of the three species at 20ordmC (control temperature) showed that S
Research article In preparation
15
carolitertii has higher expression levels of hsp70 than the other two species (Fig 4)
Fig 3 - Comparison of hsp70 gene expression patterns between fin clips and muscle samples from S
torgalensis (A) gel images showing the increment in both tissues (B) Fold increment graphical
representation also showing the similar incremental pattern in both tissues
In these experimental conditions S torgalensis exposed to 35ordmC treatment had an
increment in hsp70 mRNA levels in average 59 times higher than those observed in the
control situation (20ordmC) and about 53 times higher than at 30ordmC In S pyrenaicus
individuals a similar pattern was observed with a mean 34 and 29 fold increment in the
35ordmC treatment relatively to the control situation and 30ordmC treatment respectively In the
other hand S carolitertii did not exceed the 3 fold increment even in the harsher
temperature treatment (Fig 5)
A
B
Research article In preparation
16
In order to test if the main
differences found are
statistically significant
several statistical analyses
were performed Firstly it
was tested if the dataset met
the assumptions of normality
and homocedasticity Both
assumptions were not
satisfied and although
several data transformation
have been realized none of
these improved data Thus transformations were not applied since they did not have any
effect in the assumptions However the removal of some outliers from experimental
conditions that did not present normal distributions (Fig S1 supplementary material)
assisted in achieving the assumption of normality Despite the lack of homocedasticity
two factorial ANOVAs were performed a first one with the full data and a second one
with the removal of 4 outliers (one S torgalensis at 20ordmC one S torgalensis at 25ordmC
one S torgalensis at 30ordmC one S pyrenaicus at 30ordmC) Results from both datasets are
similar in the main conclusions despite having different values
Fig 5 ndash Hsp70 fold increment in long term survival experiments for all the studied species
For the full dataset the factors species (F=7270 df=2 p=0001) and temperature
(F=23196 df=3 p=0000) are significantly influencing hsp70 expression levels The
Fig 4 ndash Hsp70 expression levels at 20ordmC
Research article In preparation
17
interaction of both variables was also significant (F=4521 df=6 p=0001) After the
removal of outliers the interpretation remained the same being species (F=6792 df=2
p=0002) temperature (F=25077 df=3 p=0000) and interaction of both (F=4495
df=6 p=0001) statistically significant Post hoc comparisons showed that S pyrenaicus
has a significantly higher expression of hsp70 when exposed to temperatures of 32-
33ordmC compared with all the other conditions tested even in other species (Table 3) It is
worth to note that the category S pyrenaicus 35ordmC represent those individuals that lost
their balance at 32ordm-33ordmC S torgalensis exposed to 35ordmC also presented an increment of
hsp70 levels comparing with those observed at 20ordmC 25ordmC and 30ordmC (Table 3) S
carolitertii did not statistically differ from any other treatment
Subsequently differences between experimental conditions were investigated Since all
assumptions were not met for full dataset and after the removal of 4 outliers a
nonparametric Kruskal-Wallis ANOVA was performed using this dataset revealing
significant differences (H=48985 df=11 p=0000) between the different treatments
(differences between each experimental condition) Post hoc comparisons with Dunns
test (Zar 1996 StatSoft 2010) revealed significant differences in S torgalensis
expression levels at 35ordmC treatment compared with 20ordm (Q=3893 p=0007) and 25ordm
treatments (Q=3960 p=0005) S pyrenaicus exposed to 32ordmC and 33ordmC also had
significant differences from the control situation at 20ordmC (Q=3494 p=0003) With
nonparametrics statistics S carolitertii remained without significant increase in hsp70
expression
Regarding the differences between species at 20ordmC (Fig 4) an one-way ANOVA was
performed Since the dataset violated the assumptions of normality and homogeneity of
variances the removal of two previously identified outliers (one S torgalensis at 20ordmC
and one S pyrenaicus at 20ordmC) was useful to meet these assumptions Though results
with and without these outliers point to statistically significant differences of hsp70
expression between species at 20ordmC (F=29455 df=2 p=0000 and F=56203 df=2
p=0000 respectively with and without outliers) Post hoc comparisons revealed that S
carolitertii expression levels at 20ordmC significantly differ from those of S torgalensis
(df=13 p=0000) and S pyrenaicus (df=13 p=0001) (Fig 4)
Research article In preparation
18
Table 3 ndash Post hoc comparisons using Tukey HSD test statistics
Each cell represents the p-value in each pairwise comparison Significant differences are marked with an Upper diagonal ndash dataset with outlier
removal (df=58) lower diagonal ndash full dataset (df=62) S pyrenaicus 35ordmC represent those individuals that lost their balance at 32ordm-33ordmC
S
torgalensis
20ordmC
S
torgalensis
25ordmC
S
torgalensis
30ordmC
S
torgalensis
35ordmC
S
pyrenaicus
20ordmC
S
pyrenaicus
25ordmC
S
pyrenaicus
30ordmC
S
pyrenaicus
35ordmC
S
carolitertii
20ordmC
S
carolitertii
25ordmC
S
carolitertii
30ordmC
S
carolitertii
35ordmC
S torgalensis
20ordmC 1000 1000 0021 1000 0849 1000 0000 1000 0998 0993 0567
S torgalensis
25ordmC 1000 1000 0021 1000 0845 1000 0000 1000 0998 0992 0561
S torgalensis
30ordmC 1000 1000 0024 1000 0934 1000 0000 1000 1000 0999 0688
S torgalensis
35ordmC 0016 0016 0028 0015 0535 0104 0003 0193 0166 0241 0951
S pyrenaicus
20ordmC 1000 1000 1000 0018 0872 1000 0000 1000 1000 0997 0582
S pyrenaicus
25ordmC 0832 0837 0942 0564 0886 0997 0000 0998 1000 1000 1000
S pyrenaicus
30ordmC 0985 0986 0999 0239 0994 1000 0000 1000 1000 1000 0926
S pyrenaicus
35ordmC 0000 0000 0000 0003 0000 0000 0000 0000 0000 0000 0000
S carolitertii
20ordmC 1000 1000 1000 0214 1000 0999 1000 0000 1000 1000 0952
S carolitertii
25ordmC 0998 0998 1000 0185 1000 1000 1000 0000 1000 1000 0971
S carolitertii
30ordmC 0799 0804 0920 0703 0856 1000 1000 0000 0997 0999 0990
S carolitertii
35ordmC 0543 0550 0712 0957 0610 1000 0992 0000 0958 0975 1000
Research article In preparation
19
Kruskal-Wallis ANOVA was also performed given that the original data slightly violates
homocedasticity and normality assumptions Results also indicated that there are
differences between species in the expression levels at 20ordmC (H=12235 df=2 p=0002)
being this differences between S carolitertii and S torgalensis (Q=3471 p=0002)
Analysis of the expression patterns of hsc70 in long term survival experiments
Expression levels at 20ordmC (control
temperature) did not show
significant differences between S
carolitertii and S torgalensis (Fig
6) S torgalensis exposed to 35ordmC
treatment had an increment in
hsp70 mRNA levels in average 14
times higher than those observed
in the control situation and about
12 times higher than at 30ordmC In
the other hand S carolitertii did
not exceeded the 3 fold increment
being the 30ordmC the temperature at
which hsc70 expression levels were more elevated however no significance was
achieved (Fig 7)
In order to statistically test the different patterns observed above several statistical
analysis were performed Hsc70 dataset met the assumption of homogeneity of
variances (F=2050 df=7 39 p=0073) yet with some deviations from normality
Square root logarithmic and natural logarithmic transformations were applied Since
square root transformation was sufficient to meet all the assumptions this
transformation was used instead of the others As previously done for the hsp70 dataset
the non transformed data and transformed data were analyzed in factorial ANOVAs
With the non transformed dataset significant differences were found for the factors
species (F=4548 df=1 p=0039) temperature (F=10887 df=3 p=0000) and to the
interaction between them (F=9493 df=3 p=0000)
Fig 6 - Hsc70 expression levels at 20ordmC
Research article In preparation
20
Fig 7 - Hsc70 fold increment in long term survival experiments for S torgalensis and Scarolitertii
Results obtained with the transformed dataset were slightly different since only the
factor temperature (F=12001 df=3 p=0000) and the interaction between temperature
and species (F=10335 df=3 p=0000) were significant Post hoc comparisons revealed
that S torgalensis exposed to 35ordmC are different from all the other treatments applied to
this species and to S carolitertii (Table 4)
Since the normality assumption were not achieved with the non transformed data
Kruskal-Wallis ANOVA were carried out and significance was found (H=22502 df=7
p=0002) for differences between the different treatments (differences between
experimental aquariums) Post hoc comparisons with Dunns test revealed that exists
significant differences in S torgalensis expression levels at 35ordmC treatment compared
with 20ordm (Q=3684 p=0006) and 25ordm treatments (Q=4042 p=0001) No other
statistical differences were found with multiple comparisons
Analysis of the expression patterns of hsp70 in short term survival experiments
Results from this experiment show that the expression levels of S torgalensis S
pyrenaicus and S carolitertii exposed to a rapid increment to 30ordmC resulted in average
fold increments of 26 23 and 7 in hsp70 mRNA respectively Comparing with the
results of the long term survival experiments at 30ordmC hsp70 mRNA levels are in
average 20 18 and 4 times higher for S torgalensis S pyrenaicus and S carolitertii
respectively (Fig 8A)
Research article In preparation
21
Table 4 - Post hoc comparisons using Tukey HSD test statistics
Each cell represents the p-value in each pairwise comparison Significant differences are marked with an Upper diagonal ndash dataset with square
root transformation (df=39) lower diagonal ndash non transformed dataset (df=39)
S torgalensis
20ordmC
S torgalensis
25ordmC
S torgalensis
30ordmC
S torgalensis
35ordmC
S carolitertii
20ordmC
S carolitertii
25ordmC
S carolitertii
30ordmC
S carolitertii
35ordmC
S torgalensis
20ordmC 1000 0958 0000 1000 1000 0218 0952 S torgalensis
25ordmC 1000 0793 0000 0988 0983 0088 0798 S torgalensis
30ordmC 0996 0980 0000 1000 0999 0803 1000 S torgalensis
35ordmC 0000 0000 0000 0000 0000 0001 0000 S carolitertii
20ordmC 1000 1000 1000 0000 1000 0665 0999 S carolitertii
25ordmC 1000 1000 0999 0000 1000 0488 0998 S carolitertii
30ordmC 0656 0505 0956 0000 0860 0756 0911 S carolitertii
35ordmC 0997 0984 1000 0000 1000 0999 0979
Research article In preparation
22
Analysis of the expression patterns of hsc70 in short term survival experiments
In hsc70 mRNA expression levels a fold increment of 5 for S torgalensis and 2 for S
carolitertii relatively to the control temperature were observed In this case the
differences between this experiment and the long term survival experiments were not so
pronounced as can be seen in Fig 8B
Fig 8 ndash Differences in fold increment between short term survival and long term survival experiments at
30ordmC in (A) hsp70 relative mRNA levels and (B) hsc70 relative mRNA levels
Discussion
To our knowledge this was the first study to quantify hsp70 and hsc70 mRNAs using fin
clips instead of other fish organs avoiding the sacrifice of animals which is particularly
relevant when studying endangered species Nonetheless Yamachita et al (2004) found
S torgalensis S pyrenaicus S carolitertii
S torgalensis S carolitertii
A
B
Research article In preparation
23
similar patterns of hsp70 gene expression between muscle and fibroblast culture from
the caudal fin tissue of Xyphophorus maculatus (platyfish) Our comparison of the
expression patterns of hsp70 between fin clips and muscle samples suggest that there
exist similarity in hsp70 expression levels of these two tissues in response to
temperature increment (Fig 3) Thus the usage of fin clips instead of muscle seems
perfectly legitimate for the quantification of hsp70 mRNAs
Hsp70 and hsc70 genes identification
Using a non specific pair of primers (Hsp70_F2Hsp70_R2) for hsp70 amplification
hsc70 was the only transcript present at 20ordmC while at 30ordmC a mixture of hsc70 and
hsp70 transcripts was observed This may be caused by the lowest expression of hsp70
at 20ordmC than at 30ordmC making it easier to amplify hsc70 since it is expressed in normal
cell functioning (Lindquist amp Craig 1988 Yamashita et al 2004) whereas hsp70 are
induced in stress situations as it is the increase of the temperature (Dahlhoff amp Rank
2007 Lindquist amp Craig 1988 Sorensen et al 2009 Chapple et al 1998 Buckley et al
2001) Another observation that corroborates the lack of transcript specificity with the
first pair of primers is the absence of variable sites in the sequence obtained with the
second and more specific hsp70 primers (Hsp70_Fc and Hsp70_Rc) (Table S2
Supplementary material)
The absence of hsc70 amplification in S pyrenaicus samples with the hsc70 specific
primers may be caused by two reasons S pyrenaicus may have a very low expression
of hsc70 thus not being detected with semi-quantitative RT-PCR (Serazin-Leroy et al
1998 Breljak amp Gabrilovac 2005) or the hsc70 gene in this species has some variable
site(s) that prevents the annealing of the primers However given the importance of this
gene in normal cell function (Yamashita et al 2004 Fangue et al 2006 Somji et al
1999) the latter hypothesis is the most likely This issue will require further
investigation with the design of new specific primers for hsc70 for this species
The role of hsp70 in thermal adaptation
Our results are consistent in confirming that hsp70 mRNA has indeed a response to
temperature increment as shown in other studies on hsp70s (Yamashita et al 2004 Yeh
Research article In preparation
24
amp Hsu 2002 Buckley et al 2001 McMillan et al 2005 Waagner et al 2010)
However few studies have found a relation between hsp70 expression levels variation
and natural occurring clines (Karl et al 2009 Sarup amp Loeschcke 2010) such as
latitudinal ones (Fangue et al 2006 Sorensen et al 2009)
According with the results from the present study it is clear that S torgalensis and S
pyrenaicus greatly increase their hsp70 mRNA levels when exposed to higher
temperatures in both long and short term survival experiments Significant differences
were found in these two species between the control and the remaining temperature
treatments particularly the most severe one (35ordmC) Despite the absence of significant
differences in nonparametric statistics between S torgalensis at 30ordmC and at 35ordmC and
between S pyrenaicus at 25ordmC 30ordmC and 35ordmC a significant increment can be observed
between 35ordmC expression levels and the control in both species Interestingly S
carolitertii did not significantly increment their expression levels which could suggest
that this fish are not in a stress condition at 25ordmC 30ordmC and 35ordmC (Sorensen et al 2003)
However contrarily to what was observed for S torgalensis (with the largest induction
of the hsp70 gene) some individuals of S carolitertii died at 35ordmC contradicting the
suggestion that they were not in a situation of extreme stress Indeed the mere failure of
S carolitertii to increase the expression of this gene may be due to a maladaption to
temperatures of around 35ordmC (Tomanek 2010) which was expected since in their natural
environment S carolitertii usually never experience temperatures higher than
approximately 31ordmC (httpsnirhpt) The lack of increment in hsp70 does not mean that
this species is not adapted to deal with thermal stress since many other mechanisms
may be involved in thermal tolerance (Sarropoulou et al 2010 Kassahn et al 2007
Tymchuk et al 2010)
However in the central region watercourses temperature can reach 35ordmC and in the
southern rivers 38ordmC (httpsnirhpt) making relevant that S pyrenaicus and S
torgalensis respond to harsh temperatures with an increment of hsp70 levels
Notwithstanding it is odd that S pyrenaicus individuals started to lose their balance at
around 32-33ordmC and some S carolitertii individuals survived at 35degC Thus in this
particular case the costs of an over expression of S pyrenaicus relatively to S
carolitertii may surpass its benefits leading to an earlier lethal condition in the former
species (Loacutepez-Maury et al 2008 Dahlhoff amp Rank 2007 Karl et al 2009 Reusch amp
Wood 2007 Tomanek 2010 Hodgins-davis amp Townsend 2009)
Research article In preparation
25
Another curious observation was that the expression levels of hsp70 in S carolitertii at
20ordmC are already high and statistically higher than those observed in the other species
(Fig 4) suggesting that S carolitertii may be exposed to a more stressful situation than
the other two species at this temperature (Tomanek 2010) In order to clarify this
situation a further experiment with a lower testing temperature need to be performed
Alternatively the hsp70 regulation in S carolitertii may be less important than for the
other two species (Place et al 2004 Tomanek 2010 Place amp Hofmann 2004) This
possible minor role of regulating hsp70 mRNA levels in S carolitertii could be
explained by a more stable environment in the northern than in the southern regions
where temperature range and maximum temperature are usually lower (Tomanek 2010)(
httpsnirhpt) Notwithstanding higher steady-state levels of hsp70 may prevent from
early heat stress since this can delay the activation of the HSR (Fangue et al 2006 Yeh
amp Hsu 2002 Buckley et al 2001 Tomanek 2010 Tomanek amp Somero 2002)
Interestingly in short term survival experiments S carolitertii was again the species
that experienced the minor increment in hsp70 mRNA levels corroborating the
hypothesis that this species inhabit in a more stable environment and thus the species
has no need to better regulate the hsp70 expression Rapid temperature increments
raised hsp70 expression levels more significantly than with the exposure to slow
increments suggesting that hsp70 may be more mobilized in short periods of heat
stress Hsp70 rapid response may be important when species are exposed to harsh
temperature variations in a daily basis as it is the case of S torgalensis which seem to
have the higher induction of hsp70 levels (Loacutepez-Maury et al 2008 Waagner et al
2010)
Therefore these results suggest the existence of a latitudinal pattern in the expression of
hsp70 in which the southern and northern species had the higher and lower response to
heat stress respectively
The relevance of upregulating hsc70
Hsc70 is thought to be part of the constitutive cell function in non stress situations and
thus it was expected two scenarios for the expression patterns of this gene with the
increment of temperature a decrease or no variation (Loacutepez-Maury et al 2008
Yamashita et al 2004 Yeh amp Hsu 2002) Genes expressed in normal cell function often
Research article In preparation
26
shut down in stress conditions which triggers the stress response that in the case of
Heat Shock Proteins lead to an increased expression of the stress inducible forms like
hsp70 (Loacutepez-Maury et al 2008 Lindquist amp Craig 1988) An expected pattern was
confirmed in S carolitertii with no significant variation in hsc70 mRNA expression
across all treatments However hsc70 levels significantly increased at 35ordmC in S
torgalensis being significantly higher than in any other treatment performed in this
study for this gene This surprising finding may somewhat confer an advantage for S
torgalensis in an environment constantly exposed to severe temperatures and daily
fluctuations in water temperature in the dry season (Sorensen et al 2003)
(httpsnirhpt) Place amp Hofmann (2001) studying Gillichthys mirabilis observed
ATPase activity of this protein at high temperatures proposing that despite HSC70 not
being an extremely thermally stable protein it is functional even at extreme
temperatures Thus an increase in the levels of this protein may be beneficial since it is
active at high temperatures In fact nor only S torgalensis can fine tune their hsp70
expression to increase during exposure to high temperatures as also they seem to be able
to increment their levels of the constitutive hsc70 (Loacutepez-Maury et al 2008)
Supporting these findings Fangue et al (2006) suggested an important role for the
hsc70 gene in killifish from the southern region of North America in dealing with
protein damage caused by daily fluctuations in temperature However results from our
experimental design suggest another explanation since individuals exposed to a faster
temperature variation did not greatly increase their hsc70 mRNA levels relatively to
long term survival experiments (Fig 8B) Induction of hsc70 can be advantageous for S
torgalensis since hsc70 may enhance their stress response to constant elevated
temperatures that they usually experience in their rivers of origin (Loacutepez-Maury et al
2008 Sorensen et al 2003) Furthermore it may be more cost effective to induce a
constitutively expressed gene than to overexploit the cascade of stress related genes
(Loacutepez-Maury et al 2008 Sorensen et al 2003) If we sum to this result the elevated
hsp70 expression levels at 35ordmC of S torgalensis we can indeed conclude that this
species is clearly adapted to their severe river regime in the expression of these genes
Although to better understand the latitudinal expression pattern of hsc70 gene it is
important to include S pyrenaicus in gene expression profiling which will be carried
out in a further investigation
Research article In preparation
27
Implications for conservation
One application of studying hspsrsquo expression patterns is to implement them as a
biomarker of environmental stress whether it is heat stress or other type of stress that
induce hsps These biomarkers can be more effective and rapid in detecting stress
disturbances than biomarkers based on growth rate mortality or fertility (Sorensen et al
2003 Karouna-Renier amp Zehr 1999) However the results from each study have to be
interpreted taking into account the evolutionary history and the ecological context of
each species Our findings suggest that hsp70 can be used as a biomarker of
environmental stress for S torgalensis and S pyrenaicus although using hsp70 as a
biomarker of environmental stress in S carolitertii may be risky A more holistic and
comprehensive approach is desirable in order to draw more accurate decisions regarding
the use of hsp70 as biomarker namely by using a larger set of genes
Concerning the threats that each of the studied species face with climate change and the
priorities that should be given to conservation of these endemic species of the Iberian
Peninsula a few considerations can be drawn Survival to the experiments results
suggest that despite S pyrenaicus individuals have increased their hsp70 mRNA levels
during temperature increment this species do not tolerate temperatures higher than
33ordmC Thus they seem to face great threats with significant changes in daily temperature
variations andor increases in maximum temperature of water during the dry season
Even though S pyrenaicus from Colares stream is representative of the genetic diversity
present in the populations of the Tejo river (Sousa-Santos et al 2007) a sample with
more populations of the wide distribution of the species would be desirable However
the Colares riverside was chosen because it is one of the few basins where S pyrenaicus
remains in a pristine state since they are not introgressed with S alburnoides genome in
this basin Introgression effects on the expression of these genes would be a
confounding variable in this experiment and thus only pure individuals were used
S carolitertii seems to have a more plastic response to environmental thermal stress
than S pyrenaicus since five individuals resisted to the 35ordmC whereas no single S
pyrenaicus individual reached this temperature However these results have to be
interpreted with caution since in the present study we cannot unveil why S carolitertii
did not significantly induce hsc70 or hsp70 transcripts Further studies in other
transcripts such as the heat shock factors other hsps and even transcripts that encode
other proteins (like Wap65 protein) putatively involved in thermal tolerance
Research article In preparation
28
(Sarropoulou et al 2010) are needed in order to unravel this issue On the other hand
the challenges of climate change will tend to be major in the southern than in the
northern region due to the particular regime of severe droughts that characterize the
former region (Somero 2010 Henriques et al 2010)(httpsnirhpt) Finally species
living closer to their thermal tolerance limits may be the more threatened with climate
changes since minor variations in environmental conditions can lead to distribution
range shifts and decreases in the abundance of these species (Dahlhoff amp Rank 2007
Tomanek 2010 Sorensen et al 2009) In this sense despite S torgalensis have proved
to better perform the induction of hsp70 and hsc70 transcripts and even in survival rates
suggesting that they are well adapted to this harsh environment this species may still be
threatened with climate change (Reusch amp Wood 2007 Tomanek 2010 Somero 2010)
Intermittent systems such as the Mira river basin are particularly vulnerable to
environmental changes Changes in the seasonal regime of floods and droughts with the
increasing occurrence of severe droughts will impact this species distribution
abundance and diversity Furthermore due to their very restricted distribution local
extinction cannot be compensated from other geographically or genetically close
populations whereas for the other two species natural or human mediated re-
colonization is more likely to be possible Thus in order to preserve this species it would
be advisable to promote habitat restoration and conservation with particular focus in the
preservation of refuges (pools) during the dry season (Henriques et al 2010 Sousa-
Santos et al 2009)
Acknowledgments
We are thankful to Carla Sousa-Santos Maria Ana Aboim Miguel Santos Miguel
Machado Silke Waap and Isa Matos for the help provided in fish capture We are also
grateful to Isa Matos and Silke Waap who designed the Gapdh_Ri and Hsp70_F2
Hsp70_R2 primers respectively
References
Abramoff MD Magelhaes PJ Ram SJ (2004) Image Processing with ImageJ
Biophotonics International 11 36-42
Research article In preparation
29
Blackman BK (2010) Connecting genetic variation to phenotypic clines Molecular
Ecology 19 621-623
Breljak D Gabrilovac J (2005) Comparison of Three RT-PCR Based Methods for
Relative Quantification of mRNA Food Technology and Biotechnology 43 379-
388
Brito RM Briolay J Coelho MM (1997) Phylogenetic Relationships within Genus
Leuciscus (Pisces Cyprinidae) in Portuguese FreshWaters Based on
Mitochondrial DNA Cytochrome b Sequences Molecular Phylogenetics and
Evolution 8 435-442
Buckley BA Owen ME Hofmann GE (2001) Adjusting the thermostat the threshold
induction temperature for the heat-shock response in intertidal mussels (genus
Mytilus) changes as a function of thermal history The Journal of Experimental
Biology 204 3571-3579
Cabral MJ (coord ) Almeida J Almeida PR Dellinger T Ferrand de Almeida N
Oliveira ME Pamleirim JM Queiroz AI Rogado L Santos-Reis M (eds) (2006)
Livro Vermelho dos Vertebrados de Portugal 2nd ed Instituto da Conservaccedilatildeo da
NaturezaAssiacuterio amp Alvim Lisboa 660 pp
Chapple JP Smerdon GR Berry RJ Hawkins AJS (1998) Seasonal changes in stress-70
protein levels reflect thermal tolerance in the marine bivalve Mytilus edulis L
Journal of Experimental Marine Biology and Ecology 229 53-68
Clarke A (2003) Costs and consequences of evolutionary temperature adaptation
Trends in Ecology amp Evolution 18 573-581
Dahlhoff EP Rank NE (2007) The role of stress proteins in responses of a montane
willow leaf beetle to environmental temperature variation Journal of biosciences
32 477-488
Fangue NA Hofmeister M Schulte PM (2006) Intraspecific variation in thermal
tolerance and heat shock protein gene expression in common killifish Fundulus
heteroclitus The Journal of Experimental Biology 209 2859-2872
Hance T Baaren J Vernon P Boivin G (2007) Impact of extreme temperatures on
parasitoids in a climate change perspective Annual Review of Entomology 52 107-
126
Henriques R Sousa V Coelho MM (2010) Migration patterns counteract seasonal
isolation of Squalius torgalensis a critically endangered freshwater fish inhabiting
a typical Circum-Mediterranean small drainage Conservation Genetics 11 1859-
1870
Hodgins-davis A Townsend JP (2009) Evolving gene expression from G to E to G x E
Trends in Ecology amp Evolution 24 649-658
Research article In preparation
30
Karl I Sorensen JG Loeschcke V Fischer K (2009) HSP70 expression in the Copper
butterfly Lycaena tityrus across altitudes and temperatures Journal of
Evolutionary Biology 22 172-178
Karouna-Renier NK Zehr JP (1999) Ecological implications of molecular biomarkers
assaying sub-lethal stress in the midge Chironomus tentans using heat shock
protein 70 (HSP-70) expression Hydrobiologia 401 255-264
Kassahn KS Crozier RH Ward AC Stone G Caley MJ (2007) From transcriptome to
biological function environmental stress in an ectothermic vertebrate the coral
reef fish Pomacentrus moluccensis BMC Genomics 8 358
Lindquist S Craig EA (1988) The heat-shock proteins Annual Review of Genetics 22
631-677
Loacutepez-Maury L Marguerat S Baumlhler J (2008) Tuning gene expression to changing
environments from rapid responses to evolutionary adaptation Nature Reviews
Genetics 9 583-593
Magalhaes MF Schlosser IJ Collares-Pereira MJ (2003) The role of life history in the
relationship between population dynamics and environmental variability in two
Mediterranean stream fishes Journal of Fish Biology 63 300-317
Marshall OJ (2004) PerlPrimer cross-platform graphical primer design for standard
bisulphite and real-time PCR Bioinformatics (Oxford England) 20 2471-2472
Mayer MP Bukau B (2005) Hsp70 chaperones cellular functions and molecular
mechanism Cellular and Molecular Life Sciences 62 670-684
McMillan DM Fearnley SL Rank NE and Dahlhoff EP (2005) Natural temperature
variation affects larval survival development and Hsp70 expression in a leaf
beetle Functional Ecology 19 844-852
Montoya JM Raffaelli D (2010) Climate change biotic interactions and ecosystem
services Philosophical Transactions of the Royal Society B Biological Sciences
365 2013-2018
Myers N Mittermeier RA Mittermeier CG Fonseca GA Kent J (2000) Biodiversity
hotspots for conservation priorities Nature 403 853-858
Osborne JW (2005) Notes on the use of data transformations Pratical Assessment
Research amp Evaluation 8 2-9
Pala I Coelho MM (2005) Contrasting views over a hybrid complex Between
speciation and evolutionary dead-end Gene 347 283-294
Pala I Coelho MM Schartl M (2008) Dosage compensation by gene-copy silencing in a
triploid hybrid fish Current Biology 18 1344-8
Research article In preparation
31
Pestana DD Velosa SF (2006) Introduccedilatildeo agrave Probabilidade e Estatiacutestica 2nd ed Lisboa
Fundaccedilatildeo Calouste Gulbenkian
Place SP Hofmann GE (2001) Temperature interactions of the molecular chaperone
Hsc70 from the eurythermal marine goby Gillichthys mirabilis The Journal of
experimental biology 204 2675-2682
Place SP Zippay ML Hofmann GE (2004) Constitutive roles for inducible genes
evidence for the alteration in expression of the inducible hsp70 gene in Antarctic
notothenioid fishes American Journal of Physiology Regulatory Integrative and
Comparative Physiology 287 R429-436
Place SP Hofmann GE (2004) Constitutive expression of a stress-inducible heat shock
protein gene hsp70 in phylogenetically distant Antarctic fish Polar Biology 28
261-267
Reusch TBH Wood TE (2007) Molecular ecology of global change Molecular Ecology
16 3973-92
Sanjur O Carmona JA Doadrio I (2003) Evolutionary and biogeographical patterns
within Iberian populations of the genus Squalius inferred from molecular data
Molecular Phylogenetics and Evolution 2920-30
Sarropoulou E Fernandes JMO Mitter K Magoulas A Mulero V Sepulcre MP
Figueras A Novoa B Kotoulas G (2010) Evolution of a multifunctional gene The
warm temperature acclimation protein Wap65 in the European seabass
Dicentrarchus labrax Molecular Phylogenetics and Evolution 55 640-649
Sarup P Loeschcke V (2010) Developmental acclimation affects clinal variation in
stress resistance traits in Drosophila buzzatii Journal of Evolutionary Biology 23
957-965
Serazin-Leroy V Denis-Henriot D Morot M Mazancourt P Giudicelli Y (1998) Semi-
quantitative RT-PCR for comparison of mRNAs in cells with different amounts of
housekeeping gene transcripts Molecular and Cellular Probes 12 283-291
SNIRH Sistema Nacional de Informaccedilatildeo de Recursos Hiacutedricos Available at
httpsnirhpt Accessed in 22 August 2010
Somero GN (2010) The physiology of climate change how potentials for
acclimatization and genetic adaptation will determine ldquowinnersrdquo and ldquolosersrdquo The
Journal of Experimental Biology 213 912-920
Somji S Todd JH Sens MA Garrett SH Sens DA (1999) Expression of the
constitutive and inducible forms of heat shock protein 70 in human proximal
tubule cells exposed to heat sodium arsenite and CdCl(2) Environmental Health
Perspectives 107 887-893
Sorensen JG Pekkonen M Lindgren B Loeschcke V Laurila A Merila J (2009)
Complex patterns of geographic variation in heat tolerance and Hsp70 expression
Research article In preparation
32
levels in the common frog Rana temporaria Journal of Thermal Biology 34 49-
54
Sorensen JG Dahlgaard J Loeschcke V (2001) Genetic variation in thermal tolerance
among natural populations of Drosophila buzzatii down regulation of Hsp70
expression and variation in heat stress resistance traits Functional Ecology 15
289-296
Sorensen JG Kristensen TN Loeschcke V (2003) The evolutionary and ecological role
of heat shock proteins Ecology Letters 6 1025-1037
Sousa-Santos C Collares-Pereira MJ Almada V (2007) Reading the history of a hybrid
fish complex from its molecular record Molecular Phylogenetics and Evolution
45 981-996
Sousa-Santos C Robalo JI Almada VC (2009) Threatened fishes of the world Squalius
torgalensis (Coelho Bogutskaya Rodrigues amp Collares-Pereira 1998)
(Cyprinidae) Environmental Biology of Fishes 87 123-124
StatSoft I (2010) Electronic Statistics Textbook (Electronic Version) Available at
httpwwwstatsoftcomtextbook
StatSoft I (2009) STATISTICA (data analysis software system) Available at
wwwstatsoftcom
Tomanek L (2010) Variation in the heat shock response and its implication for
predicting the effect of global climate change on species biogeographical
distribution ranges and metabolic costs The Journal of Experimental Biology 213
971-979
Tomanek L Somero GN (2002) Interspecific- and acclimation-induced variation in
levels of heat-shock proteins 70 (hsp70) and 90 (hsp90) and heat-shock
transcription factor-1 (HSF1) in congeneric marine snails (genus Tegula)
implications for regulation of hsp gene expression The Journal of Experimental
Biology 205 677-685
Tymchuk W OrsquoReilly P Bittman J Macdonald D Schulte P (2010) Conservation
genomics of Atlantic salmon variation in gene expression between and within
regions of the Bay of Fundy Molecular Ecology 19 1842-1859
Waagner D Heckmann LH Malmendal A Nielsen NC Holmstrup M Bayley M
(2010) Hsp70 expression and metabolite composition in response to short-term
thermal changes in Folsomia candida (Collembola) Comparative biochemistry and
physiology Part A Molecular amp integrative physiology 157 177-183
Walters RJ Berger D (2010) Thermal Games Putting Temperature Back on the
Evolutionary Agenda Evolution 64 1184-1187
Research article In preparation
33
Woodward G Perkins DM Brown LE (2010) Climate change and freshwater
ecosystems impacts across multiple levels of organization Philosophical
Transactions of the Royal Society B Biological Sciences 365 2093-2106
Yamashita M Hirayoshi K Nagata K (2004) Characterization of multiple members of
the HSP70 family in platyfish culture cells molecular evolution of stress protein
HSP70 in vertebrates Gene 336 207-218
Yeh FL Hsu T (2002) Differential regulation of spontaneous and heat-induced HSP 70
expression in developing zebrafish (Danio rerio) The Journal of Experimental
Zoology 293 349-359
Zar JH (1996) Biostatistical Analysis 3rd ed 662 pp New Jersey Prentice Hall
Zhang Z Schwartz S Wagner L Miller W (2000) A greedy algorithm for aligning
DNA sequences Journal of Computational Biology 7 203-214
Research article In preparation
34
Supplementary material
Fig S1 ndash Box plots for all the treatments performed in long term survival experiments Dark red arrows
point to the samples in which the removal of an outlier helped in meeting the normality assumption
Research article In preparation
35
1 100
||||||||||||||||||||
Ce5-Hsp70_Fc_Rc
ACCTTCACCACCTACTCAGACAACCAGCCCGGTGTCCTGATCCAGGTGTATGAGGGAGAGAGGGCCATGACAAAAGACAACAACCTGCTGGGTAAATTTG
Te15-Hsp70_Rc_Fc
---
101 200
||||||||||||||||||||
Ce5-Hsp70_Fc_Rc
AGCTCACAGGAATTCCACCTGCACCACGTGGAGTCCCGCAGATTGAAGTGACCTTTGACATTGACGCCAACGGAATCCTAAATGTGTCAGCGGTGGACAA
Te15-Hsp70_Rc_Fc
201 300
||||||||||||||||||||
Ce5-Hsp70_Fc_Rc
AAGCACTGGAAAAGAGAACAAGATCACCATCACCAATGACAAGGGCAGACTGAGCAAAGAGGAGATTGAGAGAATGGTGCAGGACGCAGACAAGTACAAA
Te15-Hsp70_Rc_Fc
301 365
|||||||||||||
Ce5-Hsp70_Fc_Rc GCTGAAGATGATCAGCAAAGAGAGAAGATTGCTGCCAAAAACTCCCTGGAGTCTTACGCCTTCAA
Te15-Hsp70_Rc_Fc -----------
Fig S2 - Sequence alignment of the cDNA of two individuals at 30ordmC (long term survival experiments) one S carolitertii (Ce5-Hsp70_Fc_Rc) and one S
torgalensis (Te15- Hsp70_Fc_Rc) Here it is possible to observe that there are no differences (represented as dots) between these two individuals in the
nucleotide sequence of hsp70 with the Hsp70_FcHsp70_Rc primers
Research article In preparation
36
1 100
||||||||||||||||||||
Ce5_hsc70 TTAGCGGGTGATAAATCTGAGAATGTCCAAGACCTTTTGCTGTTGGATGTCACTCCTCTCTCTCTGGGCATTGAGACGGCTGGTGGTGTCATGACTGTAT
Te8_hsc70 A
101 200
||||||||||||||||||||
Ce5_hsc70 TAATTAAGAGGAACACCACCATTCCCACCAAGCAAACCCAGACCTTCACCACTTACTCAGACAACCAGCCCGGTGTACTGATCCAGGTATATGAAGGAGA
Te8_hsc70
201 300
||||||||||||||||||||
Ce5_hsc70 GAGAGCCATGACAAAGGACAACAACCTTCTTGGAAAATTTGAGTTGACAGGCATCCCTCCCGCTCCTCGTGGTGTGCCACAGATCGAAGTTACCTTCGAC
Te8_hsc70
301 400
||||||||||||||||||||
Ce5_hsc70 ATTGACGCCAATGGCATTCTCAATGTATCCGCAGTGGACAAAAGCACTGGCAAAGAAAACAAGATCACGATTACTAACGACAAAGGTCGTTTGAGCAAGG
Te8_hsc70 G
401 458
|||||||||||
Ce5_hsc70 AAGACATTGAACGTATGGTACAAGAGGCTGACCAATACAAAGCAGAGGATGAAGCTCA
Te8_hsc70
Fig S3 - Sequence alignment of the cDNA of two individuals at 30ordmC (long term survival experiments) one S carolitertii (Ce5_hsc70) and one S torgalensis
(Te8_hsc70) The two nucleotide differences presented here (surrounded by a red line) did not have any implications in amino acid composition of the encoded
protein
Appendix
37
Introduction
Until recently neutral genetic markers were the state of the art tools in conservation genetics used to
access the risk of extinction of several species allowing the identification of management units
(Gebremedhin et al 2009) There are mainly two types of conservation units widely employed in
conservation genetics Evolutionary Significant Units (ESUs) and Management Units (MUs) defined
by Moritz (1994) ESUs correspond to populations whose differentiation is high and between which
took long enough so that reciprocal monophyly has occurred and they should be preserved as
independent units MUs are populations that recently diverged and between which some genetic flow
might still occur However with the increasing number of adaptative genetic makers available the field
of conservation genetics is transitioning to pay more attention to adaptative genetic variation
(Gebremedhin et al 2009 Reusch amp Wood 2007)
Local adaptation has a key role in the evolutionary history and in species ecology and thus efforts
should be carried out in order to incorporate this relevant information in making decisions for
conservation purposes (Gebremedhin et al 2009 Reusch amp Wood 2007) Important polymorphism
variation in loci with potential adaptative role might have profound effects in species ability to deal
with environmental changes stress and ultimately in populations subsistence (Gebremedhin et al
2009) Furthermore reduced neutral genetic variability is not synonymous of reduced evolutionary or
adaptative potential Populations may have reduced neutral genetic variability and yet be well adapted
to their environmental conditions (Gebremedhin et al 2009)
Temperature is one of the most challenging abiotic variables that organisms have to face in order to
avoid extinction (Clarke 2003) Temperature effects in physiological and biochemical processes are
considered to have an important role in shaping species distribution and abundance particularly for
ectotherms (Chevin et al 2010 Clarke 2003 Somero 2010) Several studies have been performed in
candidate genes of thermal adaptation namely the Heat Shock Proteins (HSPs) HSPs are important in
cellular response mechanisms during several stresses particularly heat stress and this suggests that
these proteins may have a significant role in the ecological context (Lindquist amp Craig 1988 Dahlhoff
amp Rank 2007) Sequence variation alongside with protein or mRNA expression profiles of HSPs have
been the subject of many studies that tried to understand the role of these proteins in thermal tolerance
of species enhancing our capacity to predict the responses of these species to environmental changes
Starret amp Waters (2007) studied the sequence evolution of a heat inducible hsp70 gene in three spider
families They verified that populations from the heat-tolerant family Diguetidae that inhabits the
Appendix
38
deserts of Sonoran and Mojave in North America have evidence of positive natural selection that
altered hsp70 coding sequence This alteration in the gene coding sequence may have conferred
adaptative advantage to these spiders deal with heat allowing them to colonize desert habitats (Starrett
amp Waters 2007) Changes in the coding sequence of hsps have also been found in Drosophila
melanogaster Frydenberg et al (2003) found that hsp26 and hsp27 genes have several polymorphisms
with implications in protein coding sequence (nonsynonimous nucleotide substitutions) Interestingly
the hsp26 polymorphism presented a latitudinal pattern along the east coast of Australia similar to what
as previously been found for hsp23 gene Clinal sequence variation can be a challenging subject for
study because it provides the possibility to identify specific polymorphisms responsible for climatic
adaptations (Reusch amp Wood 2007 Blackman 2010) Nonetheless Fangue et al (2006) did not find
differences in the amino acid sequence between populations of Fundulus heteroclitus (killifish) Rather
they find differences in gene expression patterns of hsp70-2 gene between northern and southern
populations of this killifish
Several species of the Leuciscinae sub-family are distributed throughout the Portuguese rivers in
which different species inhabit rivers with different regimes Some of these species inhabit in rivers of
the southern part of Portugal which are characterized by a regime of severe droughts that subjects
fishes to high temperatures when trapped in small water bodies during the dry season (Henriques et al
2010) Our first aim was to test the existence of a latitudinal adaptative variation in the DNA sequence
of the hsp70 gene in speciespopulations of the Leuciscinae sub-family [in Squalius genus and in the
formerly described Chondrostoma genus (Robalo et al 2007)] given that sequence variation had been
previously detected in this gene by our Research Group (MMCoelho personnal communication)
Material and methods
Genomic DNA extraction PCR amplification and sequencing
Genomic DNA was extracted from fin clips following standard protocols of digestion with SDS and
proteinase K and phenolchlorophorm extraction (Miller et al 1988) in a total of 51 individuals 17
from Squalius genus and 34 from ldquoChondrostomardquo genera Approximately 819 bp of the hsp70 gene
were amplified in a total volume of 25 microl with a final concentration of 125 units of DNA polymerase
Gotaq flexi (Fermentas) 03 μM of each primer 025 mM of each dNTP and 2mM of MgCl2 using the
forward 5-TACACGTCCATCACCAGAGC-3 (Hsp70_F2) and reverse 5-
ACTTTCTCCAGCTCCTTCAG-3 (Hsp70_R2) primers PCR products were purified and sent for
Appendix
39
sequencing in Macrogen Korea
Meanwhile two other pairs of primers
(Table 1) were designed in order to extend
the coverage of this gene which improve
the power of the subsequent analysis Both
pairs of primers were designed using the
information of the already sequenced
amplicon and sequences of this gene from other fish species (Danio rerio Carassius auratus
Megalobrama amblycephala) available in public databases (NCBI and Ensembl) One pair of primers
were designed to cover the ATPase domain of the gene (Hsp70_FATPaseHsp70_RATPase) and
amplification was carried out in a total volume of 25 ul with a final concentration of 125 units of DNA
polymerase Gotaq flexi (fermentas) 08 μM of forward primer and 04 μM of reverse primer 025 mM
of each dNTP and 175 mM of MgCl2 with an initial denaturation step at 94degC during 5 min followed
by 35 cycles at 94degC for 1 min 56degC for 1 min and 72ordmC 1min and 30 seconds and to a final extension
of 10 min at 72ordmC The other pair of primers was designed to cover the C-terminal
(Hsp70_F2Hsp70_Rc-term) of the gene and were amplified in a total volume of 25 ul with a final
concentration of 125 units of DNA polymerase Gotaq flexi (fermentas) 03 μM each primer 025 mM
of each dNTP and 15 mM of MgCl2 with an initial denaturation step at 94degC during 5 min followed
by 35 cycles at 94degC for 1 min 66degC for 30 seconds and 72ordmC 1min and to a final extension of 10 min
at 72ordmC The obtained amplicons were sent for sequencing in Macrogen Korea All Sequences obtained
were edited and their chromatograms manually checked for errors in SEQUENCHER v42 (Gene
Codes Corporation) BLAST analyses (Zhang et al 2000) were used to confirm the identity of the
gene
Phylogenetic and evolutionary analysis
Hsp70 phylogenetic tree was generated with 2 millions generations sampled every 100th
generation in
two independent runs using MrBayes v 31 (Ronquist amp Huelsenbeck 2003)
and was used in the
subsequent analysis
Codeml module of the PAML package (Yang 2007) was used to test for the existence of natural
selection in this gene between the species of the Leuciscinae sub-family studied here This module have
implemented codon substitution models useful for detecting positive natural selection branch models
Primer name Primer Sequence 5 - 3
Hsp70_FATPase AGGARTYGCTATTGGSATTG
Hsp70_RATPase CTGCCRTTGAAGAAATCCT
Hsp70_F2 TACACGTCCATCACCAGAGC
Hsp70_R2 ACTTTCTCCAGCTCCTTCAG
Hsp70_Rc-term CTGGAGGMTGTGGAGCTCAG
Table 1 ndash Primers used in this study
Appendix
40
sites models and branch-site models (Yang 2007) Branch models were used to test different ω=dSdN
ratios for distinct branches on the phylogeny (Yang 2007 Yang amp Nielsen 2002) dNdS is the
nonsynonymoussynonymous substitution rate ratio that measures the direction and magnitude of
selection on amino acid changes with values of ωlt1 =1 and gt1 indicating negative purifying
selection neutral evolution and positive selection respectively Site models tested the presence of sites
under positive selection in the nucleotide sequence Finally branch-site models were used to detect
positive selection affecting only a few sites on certain lineages (branches on the phylogeny) (Yang
2007 Yang amp Nielsen 2002) Likelihood ratio tests (LRTs) were used to determine the model that best
fits and statistical decisions were based on a p-level = 005
Results and Discussion
The analysis of the hsp70 gene 819 bp primarily sequenced revealed that for all the species analyzed
a ω = 0145 was obtained suggesting that the hsp70 gene in these species is mainly conserved as it
was expected according to the fact that HSPs are one of the most conserved proteins between different
organisms (Lindquist amp Craig 1988)
Table 2 ndash Likelihood ratio test statistics Significant tests are marked with an
Hypotheses LRT df 2Δl p value
Branch models
one vs two (ω0 - others ω1 - southern species) 14948 1 7474 0008
one ω vs two ω (ω0 - Chondrostoma ω1 - Squalius) 1246 1 0623 1000
one vs two (ω0 - others ω1 - southern speciesS carolitertii group) 17934 1 8967 0005
one vs three (ω0 - others ω1 - southern species ω2 - S carolitertii) 17527 2 17527 0000
two (ω0 - others ω1 - southern speciesS carolitertii group) vs three (ω0 - others ω1 - southern species ω2 - S carolitertii) 0407 1 0204 1000
Sites models
M1a vs M2a 0002 2 0002 1000
M7 vs M8 0001 2 0001 1000
Branch-site
models ma(fixed) vs ma(modified)
3440 1 1720 0317
We tested the hypothesis of the ω ratio for the southern species (S torgalensis S aradensis and
Iberochondrostoma almacai) of both lineages (Squalius and ldquoChondrostomardquo) being different from the
other species using branch models and results suggest that there exists a different ω ratio for the
southern species when compared to the other species We also tested the hypothesis of Squalius have a
different ω ratio from ldquoChondrostomardquo although this time there were no differences between this
model and the null model of one ω ratio for the entire phylogeny Since S carolitertii from Vouga and
Douro drainages also seem to present a higher number of nucleotide substitutions as suggested by the
Appendix
41
hsp70 phylogeny (Fig 1) we tested a new model including these S carolitertii in the southern group
and this model was statistically different from the null model (one ω ratio for all the lineages)
However this last model has a higher likelihood than the model with only the southern species having
a different ω ratio (Table 2) Three-ratio models were also tested one ω ratio for S carolitertii lineage
previously referred other for the southern species group (S torgalensis S aradensis and
Iberochondrostoma almacai) and another for the remaining species The model also reject the null
hypothesis suggesting the existence of more than one ω ratio however this model is not significantly
different from the two-ratio model with S carolitertii included in the southern group and its likelihood
is also slightly lower thus the simpler model was preferred (Table 2) In order to examine if natural
selection is acting on specific codons across all the species analyzed here we carry out two tests
implemented in PAML package (M1a versus M2a and M7 versus M8 see Table 2) In each case we do
not reject the null hypothesis that there are not codons under positive selection across the hsp70
phylogeny (Table 2) Branch-site models were carried out in order to test the presence of sites under
positive selection between the group southern speciesS carolitertii and the remaining species and the
null hypothesis of neutrality was not rejected suggesting that in this portion of the hsp70 gene there is
no evidence of positive for these lineages
Appendix
42
Fig 1- Phylogenetic relationships of the sampled species based in the 819 bp sequenced of hsp70 gene with primers
Hsp70_F2Hsp70_R2 Individuals with similar sequences were grouped in order to facilitate the interpretation of the results
Black stars represent the species that were included in the southern group while the black arrow points to the lineage of S
carolitertii which was grouped with the southern species in some analysis of branch models ldquoChondrostomardquo group
include three different genera Iberochondrostoma Pseudochondrostoma Achondrostoma
Furthermore since natural selection may act in the entire protein coding sequence and not only in a
portion of it we tried to sequence other portions of the gene However the results of sequencing with
the Hsp70_F2 and Hsp70_Rc-term primers did not match the same gene from the previous sequences
(obtained with the Hsp70_F2 and Hsp70_R2 primers) (Fig 2) This issue was even more important
given that the individuals sequenced were the same that have been already sequenced with the F2 and
R2 primers These observations suggest that many hsp70 genes can be amplified with the Hsp70_F2
Hsp70_R2 pair of primers and which makes it very difficult to design gene specific sets of primers to
amplify the entire gene sequence
Appendix
43
1 100
||||||||||||||||||||
V5ScarlV (Hsp70 F2Rc-term primers)
GGAACACTTGAGCCCGTGGAGAAAGCCCTGAGAGACGCCAAGATGGACAAGTCTCAGATCCATGACGTCGTTCTGGTTGGTGGATCAACAAGAATCCCAA
T7Storg (Hsp70 F2Rc-term primers)
V5ScarlV (Hsp70 F2R2 primers)
TATGTTCG
T7Storg (Hsp70 F2R2 primers)
TATGTTCG
101 200
||||||||||||||||||||
V5ScarlV (Hsp70 F2Rc-term primers)
AGATCCAGAAGCTTCTGCAGGATTTCTTCAACGGCAGGGACTTGAACAAGAGCATCAACCCAGATGAGGCAGTGGCTTATGGTGCAGCGGTGCAAGCCGC
T7Storg (Hsp70 F2Rc-term primers)
V5ScarlV (Hsp70 F2R2 primers)
T7Storg (Hsp70 F2R2 primers)
201 300
||||||||||||||||||||
V5ScarlV (Hsp70 F2Rc-term primers)
CATCCTCATGGGTGACACATCTGGAAATGTCCAGGACCTGCTGCTGCTGGATGTTGCGCCACTCTCTTTGGGCATCGAGACTGCAGGTGGAGTCATGACG
T7Storg (Hsp70 F2Rc-term primers)
V5ScarlV (Hsp70 F2R2 primers)
T7Storg (Hsp70 F2R2 primers)
A
301 400
||||||||||||||||||||
V5ScarlV (Hsp70 F2Rc-term primers)
GCCCTCATCAAACGCAACACCACCATCCCCACCAAACAGACCCAGACCTTCACCACCTACTCAGACAACCAGCCCGGTGTCCTGATCCAGGTGTATGAGG
T7Storg (Hsp70 F2Rc-term primers)
V5ScarlV (Hsp70 F2R2 primers)
T7Storg (Hsp70 F2R2 primers)
401 500
||||||||||||||||||||
V5ScarlV (Hsp70 F2Rc-term primers)
GAGAGAGGGCCATGACAAAAGACAACAACCTGCTGGGTAAATTTGAGCTCACAGGAATTCCACCTGCACCACGTGGAGTCCCGCAGATTGAAGTGACCTT
T7Storg (Hsp70 F2Rc-term primers)
V5ScarlV (Hsp70 F2R2 primers)
G
T7Storg (Hsp70 F2R2 primers)
T
501 600
||||||||||||||||||||
V5ScarlV (Hsp70 F2Rc-term primers)
TGACATTGACGCCAACGGAATCCTAAATGTGTCAGCGGTGGACAAAAGCACTGGAAAAGAGAACAAGATCACCATCACCAATGACAAGGGCAGACTGAGC
T7Storg (Hsp70 F2Rc-term primers)
V5ScarlV (Hsp70 F2R2 primers)
T7Storg (Hsp70 F2R2 primers)
A
Appendix
44
601 700
||||||||||||||||||||
V5ScarlV (Hsp70 F2Rc-term primers)
AAAGAGGAGATTGAGAGAATGGTGCAGGACGCAGACAAGTACAAAGCTGAAGATGATCAGCAAAGAGAGAAGATTGCTGCCAAAAACTCCCTGGAGTCTT
T7Storg (Hsp70 F2Rc-term primers)
V5ScarlV (Hsp70 F2R2 primers)
T7Storg (Hsp70 F2R2 primers)
701 800
||||||||||||||||||||
V5ScarlV (Hsp70 F2Rc-term primers)
ACGCCTTCAACATGAAGAGCAGTGTGGAAGATGAGAACCTGAAAGGCAAGATCAGCGAGGATGACAAGAAGAAAGTTATTGAGAAATGCAACGCCACCAT
T7Storg (Hsp70 F2Rc-term primers)
V5ScarlV (Hsp70 F2R2 primers)
AAA
T7Storg (Hsp70 F2R2 primers)
AA
801 897
|||||||||||||||||||
V5ScarlV (Hsp70 F2Rc-term primers)
CAGCTGGCTAGAGAACAACCAGCTGGCTGATAAGGAGGAGTATGAACATCAGTTGAAGGAGTTGGAGAAAGTCTGCAACCCAATCATCACTAAGCTT
T7Storg (Hsp70 F2Rc-term primers)
V5ScarlV (Hsp70 F2R2 primers)
------------------------------------------------------------------------------
T7Storg (Hsp70 F2R2 primers)
------------------------------------------------------------------------------
Fig 2 ndash Sequence alignment of the same two individuals (one of each species) using two different pair of primers
(Hsp70_F2Hsp70_R2 and Hsp70_F2Hsp70_Rc-term) Here it is possible to observe that there are no differences
(represented as dots) between V5CarlV (S carolitertii) and T7Storg (S torgalensis) in the nucleotide sequence of hsp70
with the Hsp70_F2Hsp70_Rc-term However with the other pair of primers (Hsp70_F2Hsp70_R2) it is possible to
observe several polymorphisms (indicated by their respective nucleotides in each sequence) Given the incongruence
between the two pair of primers there are doubts about the specificity of the Hsp70_F2Hsp70_R2 pair of primers
Final remarks
Having into account the doubt raised by the expansion of the sequenced amplicon this study was
abandoned since the validity of these results is questionable However the information obtained here
provided the opportunity to follow a new approach presented in this master thesis (Page 1) Namely the
information obtained from the sequences generated helped in the design of gene specific primers
Acknowledgments
I would like to thank Silke Waap for providing the phylogenetic tree of the hsp70 gene used here and
for the design of the primers Hsp70_F2 and Hsp70_R2
Appendix
45
References
Blackman BK (2010) Connecting genetic variation to phenotypic clines Molecular ecology 19 621-3
Chevin LM Lande R Mace GM (2010) Adaptation Plasticity and Extinction in a Changing
Environment Towards a Predictive Theory PLoS Biology 8 e1000357
Clarke A (2003) Costs and consequences of evolutionary temperature adaptation Trends in Ecology amp
Evolution 18 573-581
Dahlhoff EP Rank NE (2007) The role of stress proteins in responses of a montane willow leaf beetle
to environmental temperature variation Journal of biosciences 32 477-88
Fangue NA Hofmeister M Schulte PM (2006) Intraspecific variation in thermal tolerance and heat
shock protein gene expression in common killifish Fundulus heteroclitus The Journal of
experimental biology 209 2859-72
Frydenberg J Hoffmann AA Loeschcke V (2003) DNA sequence variation and latitudinal associations
in hsp23 hsp26 and hsp27 from natural populations of Drosophila melanogaster Molecular
Ecology 12 2025-2032
Gebremedhin B Ficetola GF Naderi S Rezaei HR Maudet C Rioux D Luikart G Flagstad Oslash
Thuiller W Taberlet P (2009) Frontiers in identifying conservation units from neutral markers to
adaptive genetic variation Animal Conservation 12 107-109
Henriques R Sousa V Coelho MM (2010) Migration patterns counteract seasonal isolation of Squalius
torgalensis a critically endangered freshwater fish inhabiting a typical Circum-Mediterranean
small drainage Conservation Genetics
Lindquist S Craig EA (1988) The heat-shock proteins Annual Review of Genetics 22 631-77
Miller S Dykes D Polesky H (1988) A simple salting out procedure for extracting dna from human
nucleated cells Nucleic Acids Research 16 1215
Moritz C (1994) Defining ldquoEvolutionarily Significant Unitsrdquo for conservation Trends in Ecology amp
Evolution 9 373-375
Reusch TBH Wood TE (2007) Molecular ecology of global change Molecular ecology 16 3973-92
Robalo JI Almada VC Levy A Doadrio I (2007) Re-examination and phylogeny of the genus
Chondrostoma based on mitochondrial and nuclear data and the definition of 5 new genera
Molecular phylogenetics and evolution 42 362-72
Ronquist F Huelsenbeck JP (2003) MrBayes 3 Bayesian phylogenetic inference under mixed models
Bioinformatics 19 1572-1574
Appendix
46
Somero GN (2010) The physiology of climate change how potentials for acclimatization and genetic
adaptation will determine ldquowinnersrdquo and ldquolosersrdquo The Journal of experimental biology 213 912-
20
Starrett J Waters ER (2007) Positive natural selection has driven the evolution of the Hsp70s in
Diguetia spiders Biology letters 3 439-44
Yang Z (2007) Paml 4 a program package for phylogenetic analysis by maximum likelihood
Molecular Biology and Evolution 24 1586-1591
Yang Z Nielsen R (2002) Codon-substitution models for detecting molecular adaptation at individual
sites along specific lineages Molecular biology and evolution 19 908-17
Zhang Z Schwartz S Wagner L Miller W (2000) A greedy algorithm for aligning DNA sequences
Journal of computational biology a journal of computational molecular cell biology 7 203-214

Research article In preparation
20
Fig 7 - Hsc70 fold increment in long term survival experiments for S torgalensis and Scarolitertii
Results obtained with the transformed dataset were slightly different since only the
factor temperature (F=12001 df=3 p=0000) and the interaction between temperature
and species (F=10335 df=3 p=0000) were significant Post hoc comparisons revealed
that S torgalensis exposed to 35ordmC are different from all the other treatments applied to
this species and to S carolitertii (Table 4)
Since the normality assumption were not achieved with the non transformed data
Kruskal-Wallis ANOVA were carried out and significance was found (H=22502 df=7
p=0002) for differences between the different treatments (differences between
experimental aquariums) Post hoc comparisons with Dunns test revealed that exists
significant differences in S torgalensis expression levels at 35ordmC treatment compared
with 20ordm (Q=3684 p=0006) and 25ordm treatments (Q=4042 p=0001) No other
statistical differences were found with multiple comparisons
Analysis of the expression patterns of hsp70 in short term survival experiments
Results from this experiment show that the expression levels of S torgalensis S
pyrenaicus and S carolitertii exposed to a rapid increment to 30ordmC resulted in average
fold increments of 26 23 and 7 in hsp70 mRNA respectively Comparing with the
results of the long term survival experiments at 30ordmC hsp70 mRNA levels are in
average 20 18 and 4 times higher for S torgalensis S pyrenaicus and S carolitertii
respectively (Fig 8A)
Research article In preparation
21
Table 4 - Post hoc comparisons using Tukey HSD test statistics
Each cell represents the p-value in each pairwise comparison Significant differences are marked with an Upper diagonal ndash dataset with square
root transformation (df=39) lower diagonal ndash non transformed dataset (df=39)
S torgalensis
20ordmC
S torgalensis
25ordmC
S torgalensis
30ordmC
S torgalensis
35ordmC
S carolitertii
20ordmC
S carolitertii
25ordmC
S carolitertii
30ordmC
S carolitertii
35ordmC
S torgalensis
20ordmC 1000 0958 0000 1000 1000 0218 0952 S torgalensis
25ordmC 1000 0793 0000 0988 0983 0088 0798 S torgalensis
30ordmC 0996 0980 0000 1000 0999 0803 1000 S torgalensis
35ordmC 0000 0000 0000 0000 0000 0001 0000 S carolitertii
20ordmC 1000 1000 1000 0000 1000 0665 0999 S carolitertii
25ordmC 1000 1000 0999 0000 1000 0488 0998 S carolitertii
30ordmC 0656 0505 0956 0000 0860 0756 0911 S carolitertii
35ordmC 0997 0984 1000 0000 1000 0999 0979
Research article In preparation
22
Analysis of the expression patterns of hsc70 in short term survival experiments
In hsc70 mRNA expression levels a fold increment of 5 for S torgalensis and 2 for S
carolitertii relatively to the control temperature were observed In this case the
differences between this experiment and the long term survival experiments were not so
pronounced as can be seen in Fig 8B
Fig 8 ndash Differences in fold increment between short term survival and long term survival experiments at
30ordmC in (A) hsp70 relative mRNA levels and (B) hsc70 relative mRNA levels
Discussion
To our knowledge this was the first study to quantify hsp70 and hsc70 mRNAs using fin
clips instead of other fish organs avoiding the sacrifice of animals which is particularly
relevant when studying endangered species Nonetheless Yamachita et al (2004) found
S torgalensis S pyrenaicus S carolitertii
S torgalensis S carolitertii
A
B
Research article In preparation
23
similar patterns of hsp70 gene expression between muscle and fibroblast culture from
the caudal fin tissue of Xyphophorus maculatus (platyfish) Our comparison of the
expression patterns of hsp70 between fin clips and muscle samples suggest that there
exist similarity in hsp70 expression levels of these two tissues in response to
temperature increment (Fig 3) Thus the usage of fin clips instead of muscle seems
perfectly legitimate for the quantification of hsp70 mRNAs
Hsp70 and hsc70 genes identification
Using a non specific pair of primers (Hsp70_F2Hsp70_R2) for hsp70 amplification
hsc70 was the only transcript present at 20ordmC while at 30ordmC a mixture of hsc70 and
hsp70 transcripts was observed This may be caused by the lowest expression of hsp70
at 20ordmC than at 30ordmC making it easier to amplify hsc70 since it is expressed in normal
cell functioning (Lindquist amp Craig 1988 Yamashita et al 2004) whereas hsp70 are
induced in stress situations as it is the increase of the temperature (Dahlhoff amp Rank
2007 Lindquist amp Craig 1988 Sorensen et al 2009 Chapple et al 1998 Buckley et al
2001) Another observation that corroborates the lack of transcript specificity with the
first pair of primers is the absence of variable sites in the sequence obtained with the
second and more specific hsp70 primers (Hsp70_Fc and Hsp70_Rc) (Table S2
Supplementary material)
The absence of hsc70 amplification in S pyrenaicus samples with the hsc70 specific
primers may be caused by two reasons S pyrenaicus may have a very low expression
of hsc70 thus not being detected with semi-quantitative RT-PCR (Serazin-Leroy et al
1998 Breljak amp Gabrilovac 2005) or the hsc70 gene in this species has some variable
site(s) that prevents the annealing of the primers However given the importance of this
gene in normal cell function (Yamashita et al 2004 Fangue et al 2006 Somji et al
1999) the latter hypothesis is the most likely This issue will require further
investigation with the design of new specific primers for hsc70 for this species
The role of hsp70 in thermal adaptation
Our results are consistent in confirming that hsp70 mRNA has indeed a response to
temperature increment as shown in other studies on hsp70s (Yamashita et al 2004 Yeh
Research article In preparation
24
amp Hsu 2002 Buckley et al 2001 McMillan et al 2005 Waagner et al 2010)
However few studies have found a relation between hsp70 expression levels variation
and natural occurring clines (Karl et al 2009 Sarup amp Loeschcke 2010) such as
latitudinal ones (Fangue et al 2006 Sorensen et al 2009)
According with the results from the present study it is clear that S torgalensis and S
pyrenaicus greatly increase their hsp70 mRNA levels when exposed to higher
temperatures in both long and short term survival experiments Significant differences
were found in these two species between the control and the remaining temperature
treatments particularly the most severe one (35ordmC) Despite the absence of significant
differences in nonparametric statistics between S torgalensis at 30ordmC and at 35ordmC and
between S pyrenaicus at 25ordmC 30ordmC and 35ordmC a significant increment can be observed
between 35ordmC expression levels and the control in both species Interestingly S
carolitertii did not significantly increment their expression levels which could suggest
that this fish are not in a stress condition at 25ordmC 30ordmC and 35ordmC (Sorensen et al 2003)
However contrarily to what was observed for S torgalensis (with the largest induction
of the hsp70 gene) some individuals of S carolitertii died at 35ordmC contradicting the
suggestion that they were not in a situation of extreme stress Indeed the mere failure of
S carolitertii to increase the expression of this gene may be due to a maladaption to
temperatures of around 35ordmC (Tomanek 2010) which was expected since in their natural
environment S carolitertii usually never experience temperatures higher than
approximately 31ordmC (httpsnirhpt) The lack of increment in hsp70 does not mean that
this species is not adapted to deal with thermal stress since many other mechanisms
may be involved in thermal tolerance (Sarropoulou et al 2010 Kassahn et al 2007
Tymchuk et al 2010)
However in the central region watercourses temperature can reach 35ordmC and in the
southern rivers 38ordmC (httpsnirhpt) making relevant that S pyrenaicus and S
torgalensis respond to harsh temperatures with an increment of hsp70 levels
Notwithstanding it is odd that S pyrenaicus individuals started to lose their balance at
around 32-33ordmC and some S carolitertii individuals survived at 35degC Thus in this
particular case the costs of an over expression of S pyrenaicus relatively to S
carolitertii may surpass its benefits leading to an earlier lethal condition in the former
species (Loacutepez-Maury et al 2008 Dahlhoff amp Rank 2007 Karl et al 2009 Reusch amp
Wood 2007 Tomanek 2010 Hodgins-davis amp Townsend 2009)
Research article In preparation
25
Another curious observation was that the expression levels of hsp70 in S carolitertii at
20ordmC are already high and statistically higher than those observed in the other species
(Fig 4) suggesting that S carolitertii may be exposed to a more stressful situation than
the other two species at this temperature (Tomanek 2010) In order to clarify this
situation a further experiment with a lower testing temperature need to be performed
Alternatively the hsp70 regulation in S carolitertii may be less important than for the
other two species (Place et al 2004 Tomanek 2010 Place amp Hofmann 2004) This
possible minor role of regulating hsp70 mRNA levels in S carolitertii could be
explained by a more stable environment in the northern than in the southern regions
where temperature range and maximum temperature are usually lower (Tomanek 2010)(
httpsnirhpt) Notwithstanding higher steady-state levels of hsp70 may prevent from
early heat stress since this can delay the activation of the HSR (Fangue et al 2006 Yeh
amp Hsu 2002 Buckley et al 2001 Tomanek 2010 Tomanek amp Somero 2002)
Interestingly in short term survival experiments S carolitertii was again the species
that experienced the minor increment in hsp70 mRNA levels corroborating the
hypothesis that this species inhabit in a more stable environment and thus the species
has no need to better regulate the hsp70 expression Rapid temperature increments
raised hsp70 expression levels more significantly than with the exposure to slow
increments suggesting that hsp70 may be more mobilized in short periods of heat
stress Hsp70 rapid response may be important when species are exposed to harsh
temperature variations in a daily basis as it is the case of S torgalensis which seem to
have the higher induction of hsp70 levels (Loacutepez-Maury et al 2008 Waagner et al
2010)
Therefore these results suggest the existence of a latitudinal pattern in the expression of
hsp70 in which the southern and northern species had the higher and lower response to
heat stress respectively
The relevance of upregulating hsc70
Hsc70 is thought to be part of the constitutive cell function in non stress situations and
thus it was expected two scenarios for the expression patterns of this gene with the
increment of temperature a decrease or no variation (Loacutepez-Maury et al 2008
Yamashita et al 2004 Yeh amp Hsu 2002) Genes expressed in normal cell function often
Research article In preparation
26
shut down in stress conditions which triggers the stress response that in the case of
Heat Shock Proteins lead to an increased expression of the stress inducible forms like
hsp70 (Loacutepez-Maury et al 2008 Lindquist amp Craig 1988) An expected pattern was
confirmed in S carolitertii with no significant variation in hsc70 mRNA expression
across all treatments However hsc70 levels significantly increased at 35ordmC in S
torgalensis being significantly higher than in any other treatment performed in this
study for this gene This surprising finding may somewhat confer an advantage for S
torgalensis in an environment constantly exposed to severe temperatures and daily
fluctuations in water temperature in the dry season (Sorensen et al 2003)
(httpsnirhpt) Place amp Hofmann (2001) studying Gillichthys mirabilis observed
ATPase activity of this protein at high temperatures proposing that despite HSC70 not
being an extremely thermally stable protein it is functional even at extreme
temperatures Thus an increase in the levels of this protein may be beneficial since it is
active at high temperatures In fact nor only S torgalensis can fine tune their hsp70
expression to increase during exposure to high temperatures as also they seem to be able
to increment their levels of the constitutive hsc70 (Loacutepez-Maury et al 2008)
Supporting these findings Fangue et al (2006) suggested an important role for the
hsc70 gene in killifish from the southern region of North America in dealing with
protein damage caused by daily fluctuations in temperature However results from our
experimental design suggest another explanation since individuals exposed to a faster
temperature variation did not greatly increase their hsc70 mRNA levels relatively to
long term survival experiments (Fig 8B) Induction of hsc70 can be advantageous for S
torgalensis since hsc70 may enhance their stress response to constant elevated
temperatures that they usually experience in their rivers of origin (Loacutepez-Maury et al
2008 Sorensen et al 2003) Furthermore it may be more cost effective to induce a
constitutively expressed gene than to overexploit the cascade of stress related genes
(Loacutepez-Maury et al 2008 Sorensen et al 2003) If we sum to this result the elevated
hsp70 expression levels at 35ordmC of S torgalensis we can indeed conclude that this
species is clearly adapted to their severe river regime in the expression of these genes
Although to better understand the latitudinal expression pattern of hsc70 gene it is
important to include S pyrenaicus in gene expression profiling which will be carried
out in a further investigation
Research article In preparation
27
Implications for conservation
One application of studying hspsrsquo expression patterns is to implement them as a
biomarker of environmental stress whether it is heat stress or other type of stress that
induce hsps These biomarkers can be more effective and rapid in detecting stress
disturbances than biomarkers based on growth rate mortality or fertility (Sorensen et al
2003 Karouna-Renier amp Zehr 1999) However the results from each study have to be
interpreted taking into account the evolutionary history and the ecological context of
each species Our findings suggest that hsp70 can be used as a biomarker of
environmental stress for S torgalensis and S pyrenaicus although using hsp70 as a
biomarker of environmental stress in S carolitertii may be risky A more holistic and
comprehensive approach is desirable in order to draw more accurate decisions regarding
the use of hsp70 as biomarker namely by using a larger set of genes
Concerning the threats that each of the studied species face with climate change and the
priorities that should be given to conservation of these endemic species of the Iberian
Peninsula a few considerations can be drawn Survival to the experiments results
suggest that despite S pyrenaicus individuals have increased their hsp70 mRNA levels
during temperature increment this species do not tolerate temperatures higher than
33ordmC Thus they seem to face great threats with significant changes in daily temperature
variations andor increases in maximum temperature of water during the dry season
Even though S pyrenaicus from Colares stream is representative of the genetic diversity
present in the populations of the Tejo river (Sousa-Santos et al 2007) a sample with
more populations of the wide distribution of the species would be desirable However
the Colares riverside was chosen because it is one of the few basins where S pyrenaicus
remains in a pristine state since they are not introgressed with S alburnoides genome in
this basin Introgression effects on the expression of these genes would be a
confounding variable in this experiment and thus only pure individuals were used
S carolitertii seems to have a more plastic response to environmental thermal stress
than S pyrenaicus since five individuals resisted to the 35ordmC whereas no single S
pyrenaicus individual reached this temperature However these results have to be
interpreted with caution since in the present study we cannot unveil why S carolitertii
did not significantly induce hsc70 or hsp70 transcripts Further studies in other
transcripts such as the heat shock factors other hsps and even transcripts that encode
other proteins (like Wap65 protein) putatively involved in thermal tolerance
Research article In preparation
28
(Sarropoulou et al 2010) are needed in order to unravel this issue On the other hand
the challenges of climate change will tend to be major in the southern than in the
northern region due to the particular regime of severe droughts that characterize the
former region (Somero 2010 Henriques et al 2010)(httpsnirhpt) Finally species
living closer to their thermal tolerance limits may be the more threatened with climate
changes since minor variations in environmental conditions can lead to distribution
range shifts and decreases in the abundance of these species (Dahlhoff amp Rank 2007
Tomanek 2010 Sorensen et al 2009) In this sense despite S torgalensis have proved
to better perform the induction of hsp70 and hsc70 transcripts and even in survival rates
suggesting that they are well adapted to this harsh environment this species may still be
threatened with climate change (Reusch amp Wood 2007 Tomanek 2010 Somero 2010)
Intermittent systems such as the Mira river basin are particularly vulnerable to
environmental changes Changes in the seasonal regime of floods and droughts with the
increasing occurrence of severe droughts will impact this species distribution
abundance and diversity Furthermore due to their very restricted distribution local
extinction cannot be compensated from other geographically or genetically close
populations whereas for the other two species natural or human mediated re-
colonization is more likely to be possible Thus in order to preserve this species it would
be advisable to promote habitat restoration and conservation with particular focus in the
preservation of refuges (pools) during the dry season (Henriques et al 2010 Sousa-
Santos et al 2009)
Acknowledgments
We are thankful to Carla Sousa-Santos Maria Ana Aboim Miguel Santos Miguel
Machado Silke Waap and Isa Matos for the help provided in fish capture We are also
grateful to Isa Matos and Silke Waap who designed the Gapdh_Ri and Hsp70_F2
Hsp70_R2 primers respectively
References
Abramoff MD Magelhaes PJ Ram SJ (2004) Image Processing with ImageJ
Biophotonics International 11 36-42
Research article In preparation
29
Blackman BK (2010) Connecting genetic variation to phenotypic clines Molecular
Ecology 19 621-623
Breljak D Gabrilovac J (2005) Comparison of Three RT-PCR Based Methods for
Relative Quantification of mRNA Food Technology and Biotechnology 43 379-
388
Brito RM Briolay J Coelho MM (1997) Phylogenetic Relationships within Genus
Leuciscus (Pisces Cyprinidae) in Portuguese FreshWaters Based on
Mitochondrial DNA Cytochrome b Sequences Molecular Phylogenetics and
Evolution 8 435-442
Buckley BA Owen ME Hofmann GE (2001) Adjusting the thermostat the threshold
induction temperature for the heat-shock response in intertidal mussels (genus
Mytilus) changes as a function of thermal history The Journal of Experimental
Biology 204 3571-3579
Cabral MJ (coord ) Almeida J Almeida PR Dellinger T Ferrand de Almeida N
Oliveira ME Pamleirim JM Queiroz AI Rogado L Santos-Reis M (eds) (2006)
Livro Vermelho dos Vertebrados de Portugal 2nd ed Instituto da Conservaccedilatildeo da
NaturezaAssiacuterio amp Alvim Lisboa 660 pp
Chapple JP Smerdon GR Berry RJ Hawkins AJS (1998) Seasonal changes in stress-70
protein levels reflect thermal tolerance in the marine bivalve Mytilus edulis L
Journal of Experimental Marine Biology and Ecology 229 53-68
Clarke A (2003) Costs and consequences of evolutionary temperature adaptation
Trends in Ecology amp Evolution 18 573-581
Dahlhoff EP Rank NE (2007) The role of stress proteins in responses of a montane
willow leaf beetle to environmental temperature variation Journal of biosciences
32 477-488
Fangue NA Hofmeister M Schulte PM (2006) Intraspecific variation in thermal
tolerance and heat shock protein gene expression in common killifish Fundulus
heteroclitus The Journal of Experimental Biology 209 2859-2872
Hance T Baaren J Vernon P Boivin G (2007) Impact of extreme temperatures on
parasitoids in a climate change perspective Annual Review of Entomology 52 107-
126
Henriques R Sousa V Coelho MM (2010) Migration patterns counteract seasonal
isolation of Squalius torgalensis a critically endangered freshwater fish inhabiting
a typical Circum-Mediterranean small drainage Conservation Genetics 11 1859-
1870
Hodgins-davis A Townsend JP (2009) Evolving gene expression from G to E to G x E
Trends in Ecology amp Evolution 24 649-658
Research article In preparation
30
Karl I Sorensen JG Loeschcke V Fischer K (2009) HSP70 expression in the Copper
butterfly Lycaena tityrus across altitudes and temperatures Journal of
Evolutionary Biology 22 172-178
Karouna-Renier NK Zehr JP (1999) Ecological implications of molecular biomarkers
assaying sub-lethal stress in the midge Chironomus tentans using heat shock
protein 70 (HSP-70) expression Hydrobiologia 401 255-264
Kassahn KS Crozier RH Ward AC Stone G Caley MJ (2007) From transcriptome to
biological function environmental stress in an ectothermic vertebrate the coral
reef fish Pomacentrus moluccensis BMC Genomics 8 358
Lindquist S Craig EA (1988) The heat-shock proteins Annual Review of Genetics 22
631-677
Loacutepez-Maury L Marguerat S Baumlhler J (2008) Tuning gene expression to changing
environments from rapid responses to evolutionary adaptation Nature Reviews
Genetics 9 583-593
Magalhaes MF Schlosser IJ Collares-Pereira MJ (2003) The role of life history in the
relationship between population dynamics and environmental variability in two
Mediterranean stream fishes Journal of Fish Biology 63 300-317
Marshall OJ (2004) PerlPrimer cross-platform graphical primer design for standard
bisulphite and real-time PCR Bioinformatics (Oxford England) 20 2471-2472
Mayer MP Bukau B (2005) Hsp70 chaperones cellular functions and molecular
mechanism Cellular and Molecular Life Sciences 62 670-684
McMillan DM Fearnley SL Rank NE and Dahlhoff EP (2005) Natural temperature
variation affects larval survival development and Hsp70 expression in a leaf
beetle Functional Ecology 19 844-852
Montoya JM Raffaelli D (2010) Climate change biotic interactions and ecosystem
services Philosophical Transactions of the Royal Society B Biological Sciences
365 2013-2018
Myers N Mittermeier RA Mittermeier CG Fonseca GA Kent J (2000) Biodiversity
hotspots for conservation priorities Nature 403 853-858
Osborne JW (2005) Notes on the use of data transformations Pratical Assessment
Research amp Evaluation 8 2-9
Pala I Coelho MM (2005) Contrasting views over a hybrid complex Between
speciation and evolutionary dead-end Gene 347 283-294
Pala I Coelho MM Schartl M (2008) Dosage compensation by gene-copy silencing in a
triploid hybrid fish Current Biology 18 1344-8
Research article In preparation
31
Pestana DD Velosa SF (2006) Introduccedilatildeo agrave Probabilidade e Estatiacutestica 2nd ed Lisboa
Fundaccedilatildeo Calouste Gulbenkian
Place SP Hofmann GE (2001) Temperature interactions of the molecular chaperone
Hsc70 from the eurythermal marine goby Gillichthys mirabilis The Journal of
experimental biology 204 2675-2682
Place SP Zippay ML Hofmann GE (2004) Constitutive roles for inducible genes
evidence for the alteration in expression of the inducible hsp70 gene in Antarctic
notothenioid fishes American Journal of Physiology Regulatory Integrative and
Comparative Physiology 287 R429-436
Place SP Hofmann GE (2004) Constitutive expression of a stress-inducible heat shock
protein gene hsp70 in phylogenetically distant Antarctic fish Polar Biology 28
261-267
Reusch TBH Wood TE (2007) Molecular ecology of global change Molecular Ecology
16 3973-92
Sanjur O Carmona JA Doadrio I (2003) Evolutionary and biogeographical patterns
within Iberian populations of the genus Squalius inferred from molecular data
Molecular Phylogenetics and Evolution 2920-30
Sarropoulou E Fernandes JMO Mitter K Magoulas A Mulero V Sepulcre MP
Figueras A Novoa B Kotoulas G (2010) Evolution of a multifunctional gene The
warm temperature acclimation protein Wap65 in the European seabass
Dicentrarchus labrax Molecular Phylogenetics and Evolution 55 640-649
Sarup P Loeschcke V (2010) Developmental acclimation affects clinal variation in
stress resistance traits in Drosophila buzzatii Journal of Evolutionary Biology 23
957-965
Serazin-Leroy V Denis-Henriot D Morot M Mazancourt P Giudicelli Y (1998) Semi-
quantitative RT-PCR for comparison of mRNAs in cells with different amounts of
housekeeping gene transcripts Molecular and Cellular Probes 12 283-291
SNIRH Sistema Nacional de Informaccedilatildeo de Recursos Hiacutedricos Available at
httpsnirhpt Accessed in 22 August 2010
Somero GN (2010) The physiology of climate change how potentials for
acclimatization and genetic adaptation will determine ldquowinnersrdquo and ldquolosersrdquo The
Journal of Experimental Biology 213 912-920
Somji S Todd JH Sens MA Garrett SH Sens DA (1999) Expression of the
constitutive and inducible forms of heat shock protein 70 in human proximal
tubule cells exposed to heat sodium arsenite and CdCl(2) Environmental Health
Perspectives 107 887-893
Sorensen JG Pekkonen M Lindgren B Loeschcke V Laurila A Merila J (2009)
Complex patterns of geographic variation in heat tolerance and Hsp70 expression
Research article In preparation
32
levels in the common frog Rana temporaria Journal of Thermal Biology 34 49-
54
Sorensen JG Dahlgaard J Loeschcke V (2001) Genetic variation in thermal tolerance
among natural populations of Drosophila buzzatii down regulation of Hsp70
expression and variation in heat stress resistance traits Functional Ecology 15
289-296
Sorensen JG Kristensen TN Loeschcke V (2003) The evolutionary and ecological role
of heat shock proteins Ecology Letters 6 1025-1037
Sousa-Santos C Collares-Pereira MJ Almada V (2007) Reading the history of a hybrid
fish complex from its molecular record Molecular Phylogenetics and Evolution
45 981-996
Sousa-Santos C Robalo JI Almada VC (2009) Threatened fishes of the world Squalius
torgalensis (Coelho Bogutskaya Rodrigues amp Collares-Pereira 1998)
(Cyprinidae) Environmental Biology of Fishes 87 123-124
StatSoft I (2010) Electronic Statistics Textbook (Electronic Version) Available at
httpwwwstatsoftcomtextbook
StatSoft I (2009) STATISTICA (data analysis software system) Available at
wwwstatsoftcom
Tomanek L (2010) Variation in the heat shock response and its implication for
predicting the effect of global climate change on species biogeographical
distribution ranges and metabolic costs The Journal of Experimental Biology 213
971-979
Tomanek L Somero GN (2002) Interspecific- and acclimation-induced variation in
levels of heat-shock proteins 70 (hsp70) and 90 (hsp90) and heat-shock
transcription factor-1 (HSF1) in congeneric marine snails (genus Tegula)
implications for regulation of hsp gene expression The Journal of Experimental
Biology 205 677-685
Tymchuk W OrsquoReilly P Bittman J Macdonald D Schulte P (2010) Conservation
genomics of Atlantic salmon variation in gene expression between and within
regions of the Bay of Fundy Molecular Ecology 19 1842-1859
Waagner D Heckmann LH Malmendal A Nielsen NC Holmstrup M Bayley M
(2010) Hsp70 expression and metabolite composition in response to short-term
thermal changes in Folsomia candida (Collembola) Comparative biochemistry and
physiology Part A Molecular amp integrative physiology 157 177-183
Walters RJ Berger D (2010) Thermal Games Putting Temperature Back on the
Evolutionary Agenda Evolution 64 1184-1187
Research article In preparation
33
Woodward G Perkins DM Brown LE (2010) Climate change and freshwater
ecosystems impacts across multiple levels of organization Philosophical
Transactions of the Royal Society B Biological Sciences 365 2093-2106
Yamashita M Hirayoshi K Nagata K (2004) Characterization of multiple members of
the HSP70 family in platyfish culture cells molecular evolution of stress protein
HSP70 in vertebrates Gene 336 207-218
Yeh FL Hsu T (2002) Differential regulation of spontaneous and heat-induced HSP 70
expression in developing zebrafish (Danio rerio) The Journal of Experimental
Zoology 293 349-359
Zar JH (1996) Biostatistical Analysis 3rd ed 662 pp New Jersey Prentice Hall
Zhang Z Schwartz S Wagner L Miller W (2000) A greedy algorithm for aligning
DNA sequences Journal of Computational Biology 7 203-214
Research article In preparation
34
Supplementary material
Fig S1 ndash Box plots for all the treatments performed in long term survival experiments Dark red arrows
point to the samples in which the removal of an outlier helped in meeting the normality assumption
Research article In preparation
35
1 100
||||||||||||||||||||
Ce5-Hsp70_Fc_Rc
ACCTTCACCACCTACTCAGACAACCAGCCCGGTGTCCTGATCCAGGTGTATGAGGGAGAGAGGGCCATGACAAAAGACAACAACCTGCTGGGTAAATTTG
Te15-Hsp70_Rc_Fc
---
101 200
||||||||||||||||||||
Ce5-Hsp70_Fc_Rc
AGCTCACAGGAATTCCACCTGCACCACGTGGAGTCCCGCAGATTGAAGTGACCTTTGACATTGACGCCAACGGAATCCTAAATGTGTCAGCGGTGGACAA
Te15-Hsp70_Rc_Fc
201 300
||||||||||||||||||||
Ce5-Hsp70_Fc_Rc
AAGCACTGGAAAAGAGAACAAGATCACCATCACCAATGACAAGGGCAGACTGAGCAAAGAGGAGATTGAGAGAATGGTGCAGGACGCAGACAAGTACAAA
Te15-Hsp70_Rc_Fc
301 365
|||||||||||||
Ce5-Hsp70_Fc_Rc GCTGAAGATGATCAGCAAAGAGAGAAGATTGCTGCCAAAAACTCCCTGGAGTCTTACGCCTTCAA
Te15-Hsp70_Rc_Fc -----------
Fig S2 - Sequence alignment of the cDNA of two individuals at 30ordmC (long term survival experiments) one S carolitertii (Ce5-Hsp70_Fc_Rc) and one S
torgalensis (Te15- Hsp70_Fc_Rc) Here it is possible to observe that there are no differences (represented as dots) between these two individuals in the
nucleotide sequence of hsp70 with the Hsp70_FcHsp70_Rc primers
Research article In preparation
36
1 100
||||||||||||||||||||
Ce5_hsc70 TTAGCGGGTGATAAATCTGAGAATGTCCAAGACCTTTTGCTGTTGGATGTCACTCCTCTCTCTCTGGGCATTGAGACGGCTGGTGGTGTCATGACTGTAT
Te8_hsc70 A
101 200
||||||||||||||||||||
Ce5_hsc70 TAATTAAGAGGAACACCACCATTCCCACCAAGCAAACCCAGACCTTCACCACTTACTCAGACAACCAGCCCGGTGTACTGATCCAGGTATATGAAGGAGA
Te8_hsc70
201 300
||||||||||||||||||||
Ce5_hsc70 GAGAGCCATGACAAAGGACAACAACCTTCTTGGAAAATTTGAGTTGACAGGCATCCCTCCCGCTCCTCGTGGTGTGCCACAGATCGAAGTTACCTTCGAC
Te8_hsc70
301 400
||||||||||||||||||||
Ce5_hsc70 ATTGACGCCAATGGCATTCTCAATGTATCCGCAGTGGACAAAAGCACTGGCAAAGAAAACAAGATCACGATTACTAACGACAAAGGTCGTTTGAGCAAGG
Te8_hsc70 G
401 458
|||||||||||
Ce5_hsc70 AAGACATTGAACGTATGGTACAAGAGGCTGACCAATACAAAGCAGAGGATGAAGCTCA
Te8_hsc70
Fig S3 - Sequence alignment of the cDNA of two individuals at 30ordmC (long term survival experiments) one S carolitertii (Ce5_hsc70) and one S torgalensis
(Te8_hsc70) The two nucleotide differences presented here (surrounded by a red line) did not have any implications in amino acid composition of the encoded
protein
Appendix
37
Introduction
Until recently neutral genetic markers were the state of the art tools in conservation genetics used to
access the risk of extinction of several species allowing the identification of management units
(Gebremedhin et al 2009) There are mainly two types of conservation units widely employed in
conservation genetics Evolutionary Significant Units (ESUs) and Management Units (MUs) defined
by Moritz (1994) ESUs correspond to populations whose differentiation is high and between which
took long enough so that reciprocal monophyly has occurred and they should be preserved as
independent units MUs are populations that recently diverged and between which some genetic flow
might still occur However with the increasing number of adaptative genetic makers available the field
of conservation genetics is transitioning to pay more attention to adaptative genetic variation
(Gebremedhin et al 2009 Reusch amp Wood 2007)
Local adaptation has a key role in the evolutionary history and in species ecology and thus efforts
should be carried out in order to incorporate this relevant information in making decisions for
conservation purposes (Gebremedhin et al 2009 Reusch amp Wood 2007) Important polymorphism
variation in loci with potential adaptative role might have profound effects in species ability to deal
with environmental changes stress and ultimately in populations subsistence (Gebremedhin et al
2009) Furthermore reduced neutral genetic variability is not synonymous of reduced evolutionary or
adaptative potential Populations may have reduced neutral genetic variability and yet be well adapted
to their environmental conditions (Gebremedhin et al 2009)
Temperature is one of the most challenging abiotic variables that organisms have to face in order to
avoid extinction (Clarke 2003) Temperature effects in physiological and biochemical processes are
considered to have an important role in shaping species distribution and abundance particularly for
ectotherms (Chevin et al 2010 Clarke 2003 Somero 2010) Several studies have been performed in
candidate genes of thermal adaptation namely the Heat Shock Proteins (HSPs) HSPs are important in
cellular response mechanisms during several stresses particularly heat stress and this suggests that
these proteins may have a significant role in the ecological context (Lindquist amp Craig 1988 Dahlhoff
amp Rank 2007) Sequence variation alongside with protein or mRNA expression profiles of HSPs have
been the subject of many studies that tried to understand the role of these proteins in thermal tolerance
of species enhancing our capacity to predict the responses of these species to environmental changes
Starret amp Waters (2007) studied the sequence evolution of a heat inducible hsp70 gene in three spider
families They verified that populations from the heat-tolerant family Diguetidae that inhabits the
Appendix
38
deserts of Sonoran and Mojave in North America have evidence of positive natural selection that
altered hsp70 coding sequence This alteration in the gene coding sequence may have conferred
adaptative advantage to these spiders deal with heat allowing them to colonize desert habitats (Starrett
amp Waters 2007) Changes in the coding sequence of hsps have also been found in Drosophila
melanogaster Frydenberg et al (2003) found that hsp26 and hsp27 genes have several polymorphisms
with implications in protein coding sequence (nonsynonimous nucleotide substitutions) Interestingly
the hsp26 polymorphism presented a latitudinal pattern along the east coast of Australia similar to what
as previously been found for hsp23 gene Clinal sequence variation can be a challenging subject for
study because it provides the possibility to identify specific polymorphisms responsible for climatic
adaptations (Reusch amp Wood 2007 Blackman 2010) Nonetheless Fangue et al (2006) did not find
differences in the amino acid sequence between populations of Fundulus heteroclitus (killifish) Rather
they find differences in gene expression patterns of hsp70-2 gene between northern and southern
populations of this killifish
Several species of the Leuciscinae sub-family are distributed throughout the Portuguese rivers in
which different species inhabit rivers with different regimes Some of these species inhabit in rivers of
the southern part of Portugal which are characterized by a regime of severe droughts that subjects
fishes to high temperatures when trapped in small water bodies during the dry season (Henriques et al
2010) Our first aim was to test the existence of a latitudinal adaptative variation in the DNA sequence
of the hsp70 gene in speciespopulations of the Leuciscinae sub-family [in Squalius genus and in the
formerly described Chondrostoma genus (Robalo et al 2007)] given that sequence variation had been
previously detected in this gene by our Research Group (MMCoelho personnal communication)
Material and methods
Genomic DNA extraction PCR amplification and sequencing
Genomic DNA was extracted from fin clips following standard protocols of digestion with SDS and
proteinase K and phenolchlorophorm extraction (Miller et al 1988) in a total of 51 individuals 17
from Squalius genus and 34 from ldquoChondrostomardquo genera Approximately 819 bp of the hsp70 gene
were amplified in a total volume of 25 microl with a final concentration of 125 units of DNA polymerase
Gotaq flexi (Fermentas) 03 μM of each primer 025 mM of each dNTP and 2mM of MgCl2 using the
forward 5-TACACGTCCATCACCAGAGC-3 (Hsp70_F2) and reverse 5-
ACTTTCTCCAGCTCCTTCAG-3 (Hsp70_R2) primers PCR products were purified and sent for
Appendix
39
sequencing in Macrogen Korea
Meanwhile two other pairs of primers
(Table 1) were designed in order to extend
the coverage of this gene which improve
the power of the subsequent analysis Both
pairs of primers were designed using the
information of the already sequenced
amplicon and sequences of this gene from other fish species (Danio rerio Carassius auratus
Megalobrama amblycephala) available in public databases (NCBI and Ensembl) One pair of primers
were designed to cover the ATPase domain of the gene (Hsp70_FATPaseHsp70_RATPase) and
amplification was carried out in a total volume of 25 ul with a final concentration of 125 units of DNA
polymerase Gotaq flexi (fermentas) 08 μM of forward primer and 04 μM of reverse primer 025 mM
of each dNTP and 175 mM of MgCl2 with an initial denaturation step at 94degC during 5 min followed
by 35 cycles at 94degC for 1 min 56degC for 1 min and 72ordmC 1min and 30 seconds and to a final extension
of 10 min at 72ordmC The other pair of primers was designed to cover the C-terminal
(Hsp70_F2Hsp70_Rc-term) of the gene and were amplified in a total volume of 25 ul with a final
concentration of 125 units of DNA polymerase Gotaq flexi (fermentas) 03 μM each primer 025 mM
of each dNTP and 15 mM of MgCl2 with an initial denaturation step at 94degC during 5 min followed
by 35 cycles at 94degC for 1 min 66degC for 30 seconds and 72ordmC 1min and to a final extension of 10 min
at 72ordmC The obtained amplicons were sent for sequencing in Macrogen Korea All Sequences obtained
were edited and their chromatograms manually checked for errors in SEQUENCHER v42 (Gene
Codes Corporation) BLAST analyses (Zhang et al 2000) were used to confirm the identity of the
gene
Phylogenetic and evolutionary analysis
Hsp70 phylogenetic tree was generated with 2 millions generations sampled every 100th
generation in
two independent runs using MrBayes v 31 (Ronquist amp Huelsenbeck 2003)
and was used in the
subsequent analysis
Codeml module of the PAML package (Yang 2007) was used to test for the existence of natural
selection in this gene between the species of the Leuciscinae sub-family studied here This module have
implemented codon substitution models useful for detecting positive natural selection branch models
Primer name Primer Sequence 5 - 3
Hsp70_FATPase AGGARTYGCTATTGGSATTG
Hsp70_RATPase CTGCCRTTGAAGAAATCCT
Hsp70_F2 TACACGTCCATCACCAGAGC
Hsp70_R2 ACTTTCTCCAGCTCCTTCAG
Hsp70_Rc-term CTGGAGGMTGTGGAGCTCAG
Table 1 ndash Primers used in this study
Appendix
40
sites models and branch-site models (Yang 2007) Branch models were used to test different ω=dSdN
ratios for distinct branches on the phylogeny (Yang 2007 Yang amp Nielsen 2002) dNdS is the
nonsynonymoussynonymous substitution rate ratio that measures the direction and magnitude of
selection on amino acid changes with values of ωlt1 =1 and gt1 indicating negative purifying
selection neutral evolution and positive selection respectively Site models tested the presence of sites
under positive selection in the nucleotide sequence Finally branch-site models were used to detect
positive selection affecting only a few sites on certain lineages (branches on the phylogeny) (Yang
2007 Yang amp Nielsen 2002) Likelihood ratio tests (LRTs) were used to determine the model that best
fits and statistical decisions were based on a p-level = 005
Results and Discussion
The analysis of the hsp70 gene 819 bp primarily sequenced revealed that for all the species analyzed
a ω = 0145 was obtained suggesting that the hsp70 gene in these species is mainly conserved as it
was expected according to the fact that HSPs are one of the most conserved proteins between different
organisms (Lindquist amp Craig 1988)
Table 2 ndash Likelihood ratio test statistics Significant tests are marked with an
Hypotheses LRT df 2Δl p value
Branch models
one vs two (ω0 - others ω1 - southern species) 14948 1 7474 0008
one ω vs two ω (ω0 - Chondrostoma ω1 - Squalius) 1246 1 0623 1000
one vs two (ω0 - others ω1 - southern speciesS carolitertii group) 17934 1 8967 0005
one vs three (ω0 - others ω1 - southern species ω2 - S carolitertii) 17527 2 17527 0000
two (ω0 - others ω1 - southern speciesS carolitertii group) vs three (ω0 - others ω1 - southern species ω2 - S carolitertii) 0407 1 0204 1000
Sites models
M1a vs M2a 0002 2 0002 1000
M7 vs M8 0001 2 0001 1000
Branch-site
models ma(fixed) vs ma(modified)
3440 1 1720 0317
We tested the hypothesis of the ω ratio for the southern species (S torgalensis S aradensis and
Iberochondrostoma almacai) of both lineages (Squalius and ldquoChondrostomardquo) being different from the
other species using branch models and results suggest that there exists a different ω ratio for the
southern species when compared to the other species We also tested the hypothesis of Squalius have a
different ω ratio from ldquoChondrostomardquo although this time there were no differences between this
model and the null model of one ω ratio for the entire phylogeny Since S carolitertii from Vouga and
Douro drainages also seem to present a higher number of nucleotide substitutions as suggested by the
Appendix
41
hsp70 phylogeny (Fig 1) we tested a new model including these S carolitertii in the southern group
and this model was statistically different from the null model (one ω ratio for all the lineages)
However this last model has a higher likelihood than the model with only the southern species having
a different ω ratio (Table 2) Three-ratio models were also tested one ω ratio for S carolitertii lineage
previously referred other for the southern species group (S torgalensis S aradensis and
Iberochondrostoma almacai) and another for the remaining species The model also reject the null
hypothesis suggesting the existence of more than one ω ratio however this model is not significantly
different from the two-ratio model with S carolitertii included in the southern group and its likelihood
is also slightly lower thus the simpler model was preferred (Table 2) In order to examine if natural
selection is acting on specific codons across all the species analyzed here we carry out two tests
implemented in PAML package (M1a versus M2a and M7 versus M8 see Table 2) In each case we do
not reject the null hypothesis that there are not codons under positive selection across the hsp70
phylogeny (Table 2) Branch-site models were carried out in order to test the presence of sites under
positive selection between the group southern speciesS carolitertii and the remaining species and the
null hypothesis of neutrality was not rejected suggesting that in this portion of the hsp70 gene there is
no evidence of positive for these lineages
Appendix
42
Fig 1- Phylogenetic relationships of the sampled species based in the 819 bp sequenced of hsp70 gene with primers
Hsp70_F2Hsp70_R2 Individuals with similar sequences were grouped in order to facilitate the interpretation of the results
Black stars represent the species that were included in the southern group while the black arrow points to the lineage of S
carolitertii which was grouped with the southern species in some analysis of branch models ldquoChondrostomardquo group
include three different genera Iberochondrostoma Pseudochondrostoma Achondrostoma
Furthermore since natural selection may act in the entire protein coding sequence and not only in a
portion of it we tried to sequence other portions of the gene However the results of sequencing with
the Hsp70_F2 and Hsp70_Rc-term primers did not match the same gene from the previous sequences
(obtained with the Hsp70_F2 and Hsp70_R2 primers) (Fig 2) This issue was even more important
given that the individuals sequenced were the same that have been already sequenced with the F2 and
R2 primers These observations suggest that many hsp70 genes can be amplified with the Hsp70_F2
Hsp70_R2 pair of primers and which makes it very difficult to design gene specific sets of primers to
amplify the entire gene sequence
Appendix
43
1 100
||||||||||||||||||||
V5ScarlV (Hsp70 F2Rc-term primers)
GGAACACTTGAGCCCGTGGAGAAAGCCCTGAGAGACGCCAAGATGGACAAGTCTCAGATCCATGACGTCGTTCTGGTTGGTGGATCAACAAGAATCCCAA
T7Storg (Hsp70 F2Rc-term primers)
V5ScarlV (Hsp70 F2R2 primers)
TATGTTCG
T7Storg (Hsp70 F2R2 primers)
TATGTTCG
101 200
||||||||||||||||||||
V5ScarlV (Hsp70 F2Rc-term primers)
AGATCCAGAAGCTTCTGCAGGATTTCTTCAACGGCAGGGACTTGAACAAGAGCATCAACCCAGATGAGGCAGTGGCTTATGGTGCAGCGGTGCAAGCCGC
T7Storg (Hsp70 F2Rc-term primers)
V5ScarlV (Hsp70 F2R2 primers)
T7Storg (Hsp70 F2R2 primers)
201 300
||||||||||||||||||||
V5ScarlV (Hsp70 F2Rc-term primers)
CATCCTCATGGGTGACACATCTGGAAATGTCCAGGACCTGCTGCTGCTGGATGTTGCGCCACTCTCTTTGGGCATCGAGACTGCAGGTGGAGTCATGACG
T7Storg (Hsp70 F2Rc-term primers)
V5ScarlV (Hsp70 F2R2 primers)
T7Storg (Hsp70 F2R2 primers)
A
301 400
||||||||||||||||||||
V5ScarlV (Hsp70 F2Rc-term primers)
GCCCTCATCAAACGCAACACCACCATCCCCACCAAACAGACCCAGACCTTCACCACCTACTCAGACAACCAGCCCGGTGTCCTGATCCAGGTGTATGAGG
T7Storg (Hsp70 F2Rc-term primers)
V5ScarlV (Hsp70 F2R2 primers)
T7Storg (Hsp70 F2R2 primers)
401 500
||||||||||||||||||||
V5ScarlV (Hsp70 F2Rc-term primers)
GAGAGAGGGCCATGACAAAAGACAACAACCTGCTGGGTAAATTTGAGCTCACAGGAATTCCACCTGCACCACGTGGAGTCCCGCAGATTGAAGTGACCTT
T7Storg (Hsp70 F2Rc-term primers)
V5ScarlV (Hsp70 F2R2 primers)
G
T7Storg (Hsp70 F2R2 primers)
T
501 600
||||||||||||||||||||
V5ScarlV (Hsp70 F2Rc-term primers)
TGACATTGACGCCAACGGAATCCTAAATGTGTCAGCGGTGGACAAAAGCACTGGAAAAGAGAACAAGATCACCATCACCAATGACAAGGGCAGACTGAGC
T7Storg (Hsp70 F2Rc-term primers)
V5ScarlV (Hsp70 F2R2 primers)
T7Storg (Hsp70 F2R2 primers)
A
Appendix
44
601 700
||||||||||||||||||||
V5ScarlV (Hsp70 F2Rc-term primers)
AAAGAGGAGATTGAGAGAATGGTGCAGGACGCAGACAAGTACAAAGCTGAAGATGATCAGCAAAGAGAGAAGATTGCTGCCAAAAACTCCCTGGAGTCTT
T7Storg (Hsp70 F2Rc-term primers)
V5ScarlV (Hsp70 F2R2 primers)
T7Storg (Hsp70 F2R2 primers)
701 800
||||||||||||||||||||
V5ScarlV (Hsp70 F2Rc-term primers)
ACGCCTTCAACATGAAGAGCAGTGTGGAAGATGAGAACCTGAAAGGCAAGATCAGCGAGGATGACAAGAAGAAAGTTATTGAGAAATGCAACGCCACCAT
T7Storg (Hsp70 F2Rc-term primers)
V5ScarlV (Hsp70 F2R2 primers)
AAA
T7Storg (Hsp70 F2R2 primers)
AA
801 897
|||||||||||||||||||
V5ScarlV (Hsp70 F2Rc-term primers)
CAGCTGGCTAGAGAACAACCAGCTGGCTGATAAGGAGGAGTATGAACATCAGTTGAAGGAGTTGGAGAAAGTCTGCAACCCAATCATCACTAAGCTT
T7Storg (Hsp70 F2Rc-term primers)
V5ScarlV (Hsp70 F2R2 primers)
------------------------------------------------------------------------------
T7Storg (Hsp70 F2R2 primers)
------------------------------------------------------------------------------
Fig 2 ndash Sequence alignment of the same two individuals (one of each species) using two different pair of primers
(Hsp70_F2Hsp70_R2 and Hsp70_F2Hsp70_Rc-term) Here it is possible to observe that there are no differences
(represented as dots) between V5CarlV (S carolitertii) and T7Storg (S torgalensis) in the nucleotide sequence of hsp70
with the Hsp70_F2Hsp70_Rc-term However with the other pair of primers (Hsp70_F2Hsp70_R2) it is possible to
observe several polymorphisms (indicated by their respective nucleotides in each sequence) Given the incongruence
between the two pair of primers there are doubts about the specificity of the Hsp70_F2Hsp70_R2 pair of primers
Final remarks
Having into account the doubt raised by the expansion of the sequenced amplicon this study was
abandoned since the validity of these results is questionable However the information obtained here
provided the opportunity to follow a new approach presented in this master thesis (Page 1) Namely the
information obtained from the sequences generated helped in the design of gene specific primers
Acknowledgments
I would like to thank Silke Waap for providing the phylogenetic tree of the hsp70 gene used here and
for the design of the primers Hsp70_F2 and Hsp70_R2
Appendix
45
References
Blackman BK (2010) Connecting genetic variation to phenotypic clines Molecular ecology 19 621-3
Chevin LM Lande R Mace GM (2010) Adaptation Plasticity and Extinction in a Changing
Environment Towards a Predictive Theory PLoS Biology 8 e1000357
Clarke A (2003) Costs and consequences of evolutionary temperature adaptation Trends in Ecology amp
Evolution 18 573-581
Dahlhoff EP Rank NE (2007) The role of stress proteins in responses of a montane willow leaf beetle
to environmental temperature variation Journal of biosciences 32 477-88
Fangue NA Hofmeister M Schulte PM (2006) Intraspecific variation in thermal tolerance and heat
shock protein gene expression in common killifish Fundulus heteroclitus The Journal of
experimental biology 209 2859-72
Frydenberg J Hoffmann AA Loeschcke V (2003) DNA sequence variation and latitudinal associations
in hsp23 hsp26 and hsp27 from natural populations of Drosophila melanogaster Molecular
Ecology 12 2025-2032
Gebremedhin B Ficetola GF Naderi S Rezaei HR Maudet C Rioux D Luikart G Flagstad Oslash
Thuiller W Taberlet P (2009) Frontiers in identifying conservation units from neutral markers to
adaptive genetic variation Animal Conservation 12 107-109
Henriques R Sousa V Coelho MM (2010) Migration patterns counteract seasonal isolation of Squalius
torgalensis a critically endangered freshwater fish inhabiting a typical Circum-Mediterranean
small drainage Conservation Genetics
Lindquist S Craig EA (1988) The heat-shock proteins Annual Review of Genetics 22 631-77
Miller S Dykes D Polesky H (1988) A simple salting out procedure for extracting dna from human
nucleated cells Nucleic Acids Research 16 1215
Moritz C (1994) Defining ldquoEvolutionarily Significant Unitsrdquo for conservation Trends in Ecology amp
Evolution 9 373-375
Reusch TBH Wood TE (2007) Molecular ecology of global change Molecular ecology 16 3973-92
Robalo JI Almada VC Levy A Doadrio I (2007) Re-examination and phylogeny of the genus
Chondrostoma based on mitochondrial and nuclear data and the definition of 5 new genera
Molecular phylogenetics and evolution 42 362-72
Ronquist F Huelsenbeck JP (2003) MrBayes 3 Bayesian phylogenetic inference under mixed models
Bioinformatics 19 1572-1574
Appendix
46
Somero GN (2010) The physiology of climate change how potentials for acclimatization and genetic
adaptation will determine ldquowinnersrdquo and ldquolosersrdquo The Journal of experimental biology 213 912-
20
Starrett J Waters ER (2007) Positive natural selection has driven the evolution of the Hsp70s in
Diguetia spiders Biology letters 3 439-44
Yang Z (2007) Paml 4 a program package for phylogenetic analysis by maximum likelihood
Molecular Biology and Evolution 24 1586-1591
Yang Z Nielsen R (2002) Codon-substitution models for detecting molecular adaptation at individual
sites along specific lineages Molecular biology and evolution 19 908-17
Zhang Z Schwartz S Wagner L Miller W (2000) A greedy algorithm for aligning DNA sequences
Journal of computational biology a journal of computational molecular cell biology 7 203-214

Research article In preparation
29
Blackman BK (2010) Connecting genetic variation to phenotypic clines Molecular
Ecology 19 621-623
Breljak D Gabrilovac J (2005) Comparison of Three RT-PCR Based Methods for
Relative Quantification of mRNA Food Technology and Biotechnology 43 379-
388
Brito RM Briolay J Coelho MM (1997) Phylogenetic Relationships within Genus
Leuciscus (Pisces Cyprinidae) in Portuguese FreshWaters Based on
Mitochondrial DNA Cytochrome b Sequences Molecular Phylogenetics and
Evolution 8 435-442
Buckley BA Owen ME Hofmann GE (2001) Adjusting the thermostat the threshold
induction temperature for the heat-shock response in intertidal mussels (genus
Mytilus) changes as a function of thermal history The Journal of Experimental
Biology 204 3571-3579
Cabral MJ (coord ) Almeida J Almeida PR Dellinger T Ferrand de Almeida N
Oliveira ME Pamleirim JM Queiroz AI Rogado L Santos-Reis M (eds) (2006)
Livro Vermelho dos Vertebrados de Portugal 2nd ed Instituto da Conservaccedilatildeo da
NaturezaAssiacuterio amp Alvim Lisboa 660 pp
Chapple JP Smerdon GR Berry RJ Hawkins AJS (1998) Seasonal changes in stress-70
protein levels reflect thermal tolerance in the marine bivalve Mytilus edulis L
Journal of Experimental Marine Biology and Ecology 229 53-68
Clarke A (2003) Costs and consequences of evolutionary temperature adaptation
Trends in Ecology amp Evolution 18 573-581
Dahlhoff EP Rank NE (2007) The role of stress proteins in responses of a montane
willow leaf beetle to environmental temperature variation Journal of biosciences
32 477-488
Fangue NA Hofmeister M Schulte PM (2006) Intraspecific variation in thermal
tolerance and heat shock protein gene expression in common killifish Fundulus
heteroclitus The Journal of Experimental Biology 209 2859-2872
Hance T Baaren J Vernon P Boivin G (2007) Impact of extreme temperatures on
parasitoids in a climate change perspective Annual Review of Entomology 52 107-
126
Henriques R Sousa V Coelho MM (2010) Migration patterns counteract seasonal
isolation of Squalius torgalensis a critically endangered freshwater fish inhabiting
a typical Circum-Mediterranean small drainage Conservation Genetics 11 1859-
1870
Hodgins-davis A Townsend JP (2009) Evolving gene expression from G to E to G x E
Trends in Ecology amp Evolution 24 649-658
Research article In preparation
30
Karl I Sorensen JG Loeschcke V Fischer K (2009) HSP70 expression in the Copper
butterfly Lycaena tityrus across altitudes and temperatures Journal of
Evolutionary Biology 22 172-178
Karouna-Renier NK Zehr JP (1999) Ecological implications of molecular biomarkers
assaying sub-lethal stress in the midge Chironomus tentans using heat shock
protein 70 (HSP-70) expression Hydrobiologia 401 255-264
Kassahn KS Crozier RH Ward AC Stone G Caley MJ (2007) From transcriptome to
biological function environmental stress in an ectothermic vertebrate the coral
reef fish Pomacentrus moluccensis BMC Genomics 8 358
Lindquist S Craig EA (1988) The heat-shock proteins Annual Review of Genetics 22
631-677
Loacutepez-Maury L Marguerat S Baumlhler J (2008) Tuning gene expression to changing
environments from rapid responses to evolutionary adaptation Nature Reviews
Genetics 9 583-593
Magalhaes MF Schlosser IJ Collares-Pereira MJ (2003) The role of life history in the
relationship between population dynamics and environmental variability in two
Mediterranean stream fishes Journal of Fish Biology 63 300-317
Marshall OJ (2004) PerlPrimer cross-platform graphical primer design for standard
bisulphite and real-time PCR Bioinformatics (Oxford England) 20 2471-2472
Mayer MP Bukau B (2005) Hsp70 chaperones cellular functions and molecular
mechanism Cellular and Molecular Life Sciences 62 670-684
McMillan DM Fearnley SL Rank NE and Dahlhoff EP (2005) Natural temperature
variation affects larval survival development and Hsp70 expression in a leaf
beetle Functional Ecology 19 844-852
Montoya JM Raffaelli D (2010) Climate change biotic interactions and ecosystem
services Philosophical Transactions of the Royal Society B Biological Sciences
365 2013-2018
Myers N Mittermeier RA Mittermeier CG Fonseca GA Kent J (2000) Biodiversity
hotspots for conservation priorities Nature 403 853-858
Osborne JW (2005) Notes on the use of data transformations Pratical Assessment
Research amp Evaluation 8 2-9
Pala I Coelho MM (2005) Contrasting views over a hybrid complex Between
speciation and evolutionary dead-end Gene 347 283-294
Pala I Coelho MM Schartl M (2008) Dosage compensation by gene-copy silencing in a
triploid hybrid fish Current Biology 18 1344-8
Research article In preparation
31
Pestana DD Velosa SF (2006) Introduccedilatildeo agrave Probabilidade e Estatiacutestica 2nd ed Lisboa
Fundaccedilatildeo Calouste Gulbenkian
Place SP Hofmann GE (2001) Temperature interactions of the molecular chaperone
Hsc70 from the eurythermal marine goby Gillichthys mirabilis The Journal of
experimental biology 204 2675-2682
Place SP Zippay ML Hofmann GE (2004) Constitutive roles for inducible genes
evidence for the alteration in expression of the inducible hsp70 gene in Antarctic
notothenioid fishes American Journal of Physiology Regulatory Integrative and
Comparative Physiology 287 R429-436
Place SP Hofmann GE (2004) Constitutive expression of a stress-inducible heat shock
protein gene hsp70 in phylogenetically distant Antarctic fish Polar Biology 28
261-267
Reusch TBH Wood TE (2007) Molecular ecology of global change Molecular Ecology
16 3973-92
Sanjur O Carmona JA Doadrio I (2003) Evolutionary and biogeographical patterns
within Iberian populations of the genus Squalius inferred from molecular data
Molecular Phylogenetics and Evolution 2920-30
Sarropoulou E Fernandes JMO Mitter K Magoulas A Mulero V Sepulcre MP
Figueras A Novoa B Kotoulas G (2010) Evolution of a multifunctional gene The
warm temperature acclimation protein Wap65 in the European seabass
Dicentrarchus labrax Molecular Phylogenetics and Evolution 55 640-649
Sarup P Loeschcke V (2010) Developmental acclimation affects clinal variation in
stress resistance traits in Drosophila buzzatii Journal of Evolutionary Biology 23
957-965
Serazin-Leroy V Denis-Henriot D Morot M Mazancourt P Giudicelli Y (1998) Semi-
quantitative RT-PCR for comparison of mRNAs in cells with different amounts of
housekeeping gene transcripts Molecular and Cellular Probes 12 283-291
SNIRH Sistema Nacional de Informaccedilatildeo de Recursos Hiacutedricos Available at
httpsnirhpt Accessed in 22 August 2010
Somero GN (2010) The physiology of climate change how potentials for
acclimatization and genetic adaptation will determine ldquowinnersrdquo and ldquolosersrdquo The
Journal of Experimental Biology 213 912-920
Somji S Todd JH Sens MA Garrett SH Sens DA (1999) Expression of the
constitutive and inducible forms of heat shock protein 70 in human proximal
tubule cells exposed to heat sodium arsenite and CdCl(2) Environmental Health
Perspectives 107 887-893
Sorensen JG Pekkonen M Lindgren B Loeschcke V Laurila A Merila J (2009)
Complex patterns of geographic variation in heat tolerance and Hsp70 expression
Research article In preparation
32
levels in the common frog Rana temporaria Journal of Thermal Biology 34 49-
54
Sorensen JG Dahlgaard J Loeschcke V (2001) Genetic variation in thermal tolerance
among natural populations of Drosophila buzzatii down regulation of Hsp70
expression and variation in heat stress resistance traits Functional Ecology 15
289-296
Sorensen JG Kristensen TN Loeschcke V (2003) The evolutionary and ecological role
of heat shock proteins Ecology Letters 6 1025-1037
Sousa-Santos C Collares-Pereira MJ Almada V (2007) Reading the history of a hybrid
fish complex from its molecular record Molecular Phylogenetics and Evolution
45 981-996
Sousa-Santos C Robalo JI Almada VC (2009) Threatened fishes of the world Squalius
torgalensis (Coelho Bogutskaya Rodrigues amp Collares-Pereira 1998)
(Cyprinidae) Environmental Biology of Fishes 87 123-124
StatSoft I (2010) Electronic Statistics Textbook (Electronic Version) Available at
httpwwwstatsoftcomtextbook
StatSoft I (2009) STATISTICA (data analysis software system) Available at
wwwstatsoftcom
Tomanek L (2010) Variation in the heat shock response and its implication for
predicting the effect of global climate change on species biogeographical
distribution ranges and metabolic costs The Journal of Experimental Biology 213
971-979
Tomanek L Somero GN (2002) Interspecific- and acclimation-induced variation in
levels of heat-shock proteins 70 (hsp70) and 90 (hsp90) and heat-shock
transcription factor-1 (HSF1) in congeneric marine snails (genus Tegula)
implications for regulation of hsp gene expression The Journal of Experimental
Biology 205 677-685
Tymchuk W OrsquoReilly P Bittman J Macdonald D Schulte P (2010) Conservation
genomics of Atlantic salmon variation in gene expression between and within
regions of the Bay of Fundy Molecular Ecology 19 1842-1859
Waagner D Heckmann LH Malmendal A Nielsen NC Holmstrup M Bayley M
(2010) Hsp70 expression and metabolite composition in response to short-term
thermal changes in Folsomia candida (Collembola) Comparative biochemistry and
physiology Part A Molecular amp integrative physiology 157 177-183
Walters RJ Berger D (2010) Thermal Games Putting Temperature Back on the
Evolutionary Agenda Evolution 64 1184-1187
Research article In preparation
33
Woodward G Perkins DM Brown LE (2010) Climate change and freshwater
ecosystems impacts across multiple levels of organization Philosophical
Transactions of the Royal Society B Biological Sciences 365 2093-2106
Yamashita M Hirayoshi K Nagata K (2004) Characterization of multiple members of
the HSP70 family in platyfish culture cells molecular evolution of stress protein
HSP70 in vertebrates Gene 336 207-218
Yeh FL Hsu T (2002) Differential regulation of spontaneous and heat-induced HSP 70
expression in developing zebrafish (Danio rerio) The Journal of Experimental
Zoology 293 349-359
Zar JH (1996) Biostatistical Analysis 3rd ed 662 pp New Jersey Prentice Hall
Zhang Z Schwartz S Wagner L Miller W (2000) A greedy algorithm for aligning
DNA sequences Journal of Computational Biology 7 203-214
Research article In preparation
34
Supplementary material
Fig S1 ndash Box plots for all the treatments performed in long term survival experiments Dark red arrows
point to the samples in which the removal of an outlier helped in meeting the normality assumption
Research article In preparation
35
1 100
||||||||||||||||||||
Ce5-Hsp70_Fc_Rc
ACCTTCACCACCTACTCAGACAACCAGCCCGGTGTCCTGATCCAGGTGTATGAGGGAGAGAGGGCCATGACAAAAGACAACAACCTGCTGGGTAAATTTG
Te15-Hsp70_Rc_Fc
---
101 200
||||||||||||||||||||
Ce5-Hsp70_Fc_Rc
AGCTCACAGGAATTCCACCTGCACCACGTGGAGTCCCGCAGATTGAAGTGACCTTTGACATTGACGCCAACGGAATCCTAAATGTGTCAGCGGTGGACAA
Te15-Hsp70_Rc_Fc
201 300
||||||||||||||||||||
Ce5-Hsp70_Fc_Rc
AAGCACTGGAAAAGAGAACAAGATCACCATCACCAATGACAAGGGCAGACTGAGCAAAGAGGAGATTGAGAGAATGGTGCAGGACGCAGACAAGTACAAA
Te15-Hsp70_Rc_Fc
301 365
|||||||||||||
Ce5-Hsp70_Fc_Rc GCTGAAGATGATCAGCAAAGAGAGAAGATTGCTGCCAAAAACTCCCTGGAGTCTTACGCCTTCAA
Te15-Hsp70_Rc_Fc -----------
Fig S2 - Sequence alignment of the cDNA of two individuals at 30ordmC (long term survival experiments) one S carolitertii (Ce5-Hsp70_Fc_Rc) and one S
torgalensis (Te15- Hsp70_Fc_Rc) Here it is possible to observe that there are no differences (represented as dots) between these two individuals in the
nucleotide sequence of hsp70 with the Hsp70_FcHsp70_Rc primers
Research article In preparation
36
1 100
||||||||||||||||||||
Ce5_hsc70 TTAGCGGGTGATAAATCTGAGAATGTCCAAGACCTTTTGCTGTTGGATGTCACTCCTCTCTCTCTGGGCATTGAGACGGCTGGTGGTGTCATGACTGTAT
Te8_hsc70 A
101 200
||||||||||||||||||||
Ce5_hsc70 TAATTAAGAGGAACACCACCATTCCCACCAAGCAAACCCAGACCTTCACCACTTACTCAGACAACCAGCCCGGTGTACTGATCCAGGTATATGAAGGAGA
Te8_hsc70
201 300
||||||||||||||||||||
Ce5_hsc70 GAGAGCCATGACAAAGGACAACAACCTTCTTGGAAAATTTGAGTTGACAGGCATCCCTCCCGCTCCTCGTGGTGTGCCACAGATCGAAGTTACCTTCGAC
Te8_hsc70
301 400
||||||||||||||||||||
Ce5_hsc70 ATTGACGCCAATGGCATTCTCAATGTATCCGCAGTGGACAAAAGCACTGGCAAAGAAAACAAGATCACGATTACTAACGACAAAGGTCGTTTGAGCAAGG
Te8_hsc70 G
401 458
|||||||||||
Ce5_hsc70 AAGACATTGAACGTATGGTACAAGAGGCTGACCAATACAAAGCAGAGGATGAAGCTCA
Te8_hsc70
Fig S3 - Sequence alignment of the cDNA of two individuals at 30ordmC (long term survival experiments) one S carolitertii (Ce5_hsc70) and one S torgalensis
(Te8_hsc70) The two nucleotide differences presented here (surrounded by a red line) did not have any implications in amino acid composition of the encoded
protein
Appendix
37
Introduction
Until recently neutral genetic markers were the state of the art tools in conservation genetics used to
access the risk of extinction of several species allowing the identification of management units
(Gebremedhin et al 2009) There are mainly two types of conservation units widely employed in
conservation genetics Evolutionary Significant Units (ESUs) and Management Units (MUs) defined
by Moritz (1994) ESUs correspond to populations whose differentiation is high and between which
took long enough so that reciprocal monophyly has occurred and they should be preserved as
independent units MUs are populations that recently diverged and between which some genetic flow
might still occur However with the increasing number of adaptative genetic makers available the field
of conservation genetics is transitioning to pay more attention to adaptative genetic variation
(Gebremedhin et al 2009 Reusch amp Wood 2007)
Local adaptation has a key role in the evolutionary history and in species ecology and thus efforts
should be carried out in order to incorporate this relevant information in making decisions for
conservation purposes (Gebremedhin et al 2009 Reusch amp Wood 2007) Important polymorphism
variation in loci with potential adaptative role might have profound effects in species ability to deal
with environmental changes stress and ultimately in populations subsistence (Gebremedhin et al
2009) Furthermore reduced neutral genetic variability is not synonymous of reduced evolutionary or
adaptative potential Populations may have reduced neutral genetic variability and yet be well adapted
to their environmental conditions (Gebremedhin et al 2009)
Temperature is one of the most challenging abiotic variables that organisms have to face in order to
avoid extinction (Clarke 2003) Temperature effects in physiological and biochemical processes are
considered to have an important role in shaping species distribution and abundance particularly for
ectotherms (Chevin et al 2010 Clarke 2003 Somero 2010) Several studies have been performed in
candidate genes of thermal adaptation namely the Heat Shock Proteins (HSPs) HSPs are important in
cellular response mechanisms during several stresses particularly heat stress and this suggests that
these proteins may have a significant role in the ecological context (Lindquist amp Craig 1988 Dahlhoff
amp Rank 2007) Sequence variation alongside with protein or mRNA expression profiles of HSPs have
been the subject of many studies that tried to understand the role of these proteins in thermal tolerance
of species enhancing our capacity to predict the responses of these species to environmental changes
Starret amp Waters (2007) studied the sequence evolution of a heat inducible hsp70 gene in three spider
families They verified that populations from the heat-tolerant family Diguetidae that inhabits the
Appendix
38
deserts of Sonoran and Mojave in North America have evidence of positive natural selection that
altered hsp70 coding sequence This alteration in the gene coding sequence may have conferred
adaptative advantage to these spiders deal with heat allowing them to colonize desert habitats (Starrett
amp Waters 2007) Changes in the coding sequence of hsps have also been found in Drosophila
melanogaster Frydenberg et al (2003) found that hsp26 and hsp27 genes have several polymorphisms
with implications in protein coding sequence (nonsynonimous nucleotide substitutions) Interestingly
the hsp26 polymorphism presented a latitudinal pattern along the east coast of Australia similar to what
as previously been found for hsp23 gene Clinal sequence variation can be a challenging subject for
study because it provides the possibility to identify specific polymorphisms responsible for climatic
adaptations (Reusch amp Wood 2007 Blackman 2010) Nonetheless Fangue et al (2006) did not find
differences in the amino acid sequence between populations of Fundulus heteroclitus (killifish) Rather
they find differences in gene expression patterns of hsp70-2 gene between northern and southern
populations of this killifish
Several species of the Leuciscinae sub-family are distributed throughout the Portuguese rivers in
which different species inhabit rivers with different regimes Some of these species inhabit in rivers of
the southern part of Portugal which are characterized by a regime of severe droughts that subjects
fishes to high temperatures when trapped in small water bodies during the dry season (Henriques et al
2010) Our first aim was to test the existence of a latitudinal adaptative variation in the DNA sequence
of the hsp70 gene in speciespopulations of the Leuciscinae sub-family [in Squalius genus and in the
formerly described Chondrostoma genus (Robalo et al 2007)] given that sequence variation had been
previously detected in this gene by our Research Group (MMCoelho personnal communication)
Material and methods
Genomic DNA extraction PCR amplification and sequencing
Genomic DNA was extracted from fin clips following standard protocols of digestion with SDS and
proteinase K and phenolchlorophorm extraction (Miller et al 1988) in a total of 51 individuals 17
from Squalius genus and 34 from ldquoChondrostomardquo genera Approximately 819 bp of the hsp70 gene
were amplified in a total volume of 25 microl with a final concentration of 125 units of DNA polymerase
Gotaq flexi (Fermentas) 03 μM of each primer 025 mM of each dNTP and 2mM of MgCl2 using the
forward 5-TACACGTCCATCACCAGAGC-3 (Hsp70_F2) and reverse 5-
ACTTTCTCCAGCTCCTTCAG-3 (Hsp70_R2) primers PCR products were purified and sent for
Appendix
39
sequencing in Macrogen Korea
Meanwhile two other pairs of primers
(Table 1) were designed in order to extend
the coverage of this gene which improve
the power of the subsequent analysis Both
pairs of primers were designed using the
information of the already sequenced
amplicon and sequences of this gene from other fish species (Danio rerio Carassius auratus
Megalobrama amblycephala) available in public databases (NCBI and Ensembl) One pair of primers
were designed to cover the ATPase domain of the gene (Hsp70_FATPaseHsp70_RATPase) and
amplification was carried out in a total volume of 25 ul with a final concentration of 125 units of DNA
polymerase Gotaq flexi (fermentas) 08 μM of forward primer and 04 μM of reverse primer 025 mM
of each dNTP and 175 mM of MgCl2 with an initial denaturation step at 94degC during 5 min followed
by 35 cycles at 94degC for 1 min 56degC for 1 min and 72ordmC 1min and 30 seconds and to a final extension
of 10 min at 72ordmC The other pair of primers was designed to cover the C-terminal
(Hsp70_F2Hsp70_Rc-term) of the gene and were amplified in a total volume of 25 ul with a final
concentration of 125 units of DNA polymerase Gotaq flexi (fermentas) 03 μM each primer 025 mM
of each dNTP and 15 mM of MgCl2 with an initial denaturation step at 94degC during 5 min followed
by 35 cycles at 94degC for 1 min 66degC for 30 seconds and 72ordmC 1min and to a final extension of 10 min
at 72ordmC The obtained amplicons were sent for sequencing in Macrogen Korea All Sequences obtained
were edited and their chromatograms manually checked for errors in SEQUENCHER v42 (Gene
Codes Corporation) BLAST analyses (Zhang et al 2000) were used to confirm the identity of the
gene
Phylogenetic and evolutionary analysis
Hsp70 phylogenetic tree was generated with 2 millions generations sampled every 100th
generation in
two independent runs using MrBayes v 31 (Ronquist amp Huelsenbeck 2003)
and was used in the
subsequent analysis
Codeml module of the PAML package (Yang 2007) was used to test for the existence of natural
selection in this gene between the species of the Leuciscinae sub-family studied here This module have
implemented codon substitution models useful for detecting positive natural selection branch models
Primer name Primer Sequence 5 - 3
Hsp70_FATPase AGGARTYGCTATTGGSATTG
Hsp70_RATPase CTGCCRTTGAAGAAATCCT
Hsp70_F2 TACACGTCCATCACCAGAGC
Hsp70_R2 ACTTTCTCCAGCTCCTTCAG
Hsp70_Rc-term CTGGAGGMTGTGGAGCTCAG
Table 1 ndash Primers used in this study
Appendix
40
sites models and branch-site models (Yang 2007) Branch models were used to test different ω=dSdN
ratios for distinct branches on the phylogeny (Yang 2007 Yang amp Nielsen 2002) dNdS is the
nonsynonymoussynonymous substitution rate ratio that measures the direction and magnitude of
selection on amino acid changes with values of ωlt1 =1 and gt1 indicating negative purifying
selection neutral evolution and positive selection respectively Site models tested the presence of sites
under positive selection in the nucleotide sequence Finally branch-site models were used to detect
positive selection affecting only a few sites on certain lineages (branches on the phylogeny) (Yang
2007 Yang amp Nielsen 2002) Likelihood ratio tests (LRTs) were used to determine the model that best
fits and statistical decisions were based on a p-level = 005
Results and Discussion
The analysis of the hsp70 gene 819 bp primarily sequenced revealed that for all the species analyzed
a ω = 0145 was obtained suggesting that the hsp70 gene in these species is mainly conserved as it
was expected according to the fact that HSPs are one of the most conserved proteins between different
organisms (Lindquist amp Craig 1988)
Table 2 ndash Likelihood ratio test statistics Significant tests are marked with an
Hypotheses LRT df 2Δl p value
Branch models
one vs two (ω0 - others ω1 - southern species) 14948 1 7474 0008
one ω vs two ω (ω0 - Chondrostoma ω1 - Squalius) 1246 1 0623 1000
one vs two (ω0 - others ω1 - southern speciesS carolitertii group) 17934 1 8967 0005
one vs three (ω0 - others ω1 - southern species ω2 - S carolitertii) 17527 2 17527 0000
two (ω0 - others ω1 - southern speciesS carolitertii group) vs three (ω0 - others ω1 - southern species ω2 - S carolitertii) 0407 1 0204 1000
Sites models
M1a vs M2a 0002 2 0002 1000
M7 vs M8 0001 2 0001 1000
Branch-site
models ma(fixed) vs ma(modified)
3440 1 1720 0317
We tested the hypothesis of the ω ratio for the southern species (S torgalensis S aradensis and
Iberochondrostoma almacai) of both lineages (Squalius and ldquoChondrostomardquo) being different from the
other species using branch models and results suggest that there exists a different ω ratio for the
southern species when compared to the other species We also tested the hypothesis of Squalius have a
different ω ratio from ldquoChondrostomardquo although this time there were no differences between this
model and the null model of one ω ratio for the entire phylogeny Since S carolitertii from Vouga and
Douro drainages also seem to present a higher number of nucleotide substitutions as suggested by the
Appendix
41
hsp70 phylogeny (Fig 1) we tested a new model including these S carolitertii in the southern group
and this model was statistically different from the null model (one ω ratio for all the lineages)
However this last model has a higher likelihood than the model with only the southern species having
a different ω ratio (Table 2) Three-ratio models were also tested one ω ratio for S carolitertii lineage
previously referred other for the southern species group (S torgalensis S aradensis and
Iberochondrostoma almacai) and another for the remaining species The model also reject the null
hypothesis suggesting the existence of more than one ω ratio however this model is not significantly
different from the two-ratio model with S carolitertii included in the southern group and its likelihood
is also slightly lower thus the simpler model was preferred (Table 2) In order to examine if natural
selection is acting on specific codons across all the species analyzed here we carry out two tests
implemented in PAML package (M1a versus M2a and M7 versus M8 see Table 2) In each case we do
not reject the null hypothesis that there are not codons under positive selection across the hsp70
phylogeny (Table 2) Branch-site models were carried out in order to test the presence of sites under
positive selection between the group southern speciesS carolitertii and the remaining species and the
null hypothesis of neutrality was not rejected suggesting that in this portion of the hsp70 gene there is
no evidence of positive for these lineages
Appendix
42
Fig 1- Phylogenetic relationships of the sampled species based in the 819 bp sequenced of hsp70 gene with primers
Hsp70_F2Hsp70_R2 Individuals with similar sequences were grouped in order to facilitate the interpretation of the results
Black stars represent the species that were included in the southern group while the black arrow points to the lineage of S
carolitertii which was grouped with the southern species in some analysis of branch models ldquoChondrostomardquo group
include three different genera Iberochondrostoma Pseudochondrostoma Achondrostoma
Furthermore since natural selection may act in the entire protein coding sequence and not only in a
portion of it we tried to sequence other portions of the gene However the results of sequencing with
the Hsp70_F2 and Hsp70_Rc-term primers did not match the same gene from the previous sequences
(obtained with the Hsp70_F2 and Hsp70_R2 primers) (Fig 2) This issue was even more important
given that the individuals sequenced were the same that have been already sequenced with the F2 and
R2 primers These observations suggest that many hsp70 genes can be amplified with the Hsp70_F2
Hsp70_R2 pair of primers and which makes it very difficult to design gene specific sets of primers to
amplify the entire gene sequence
Appendix
43
1 100
||||||||||||||||||||
V5ScarlV (Hsp70 F2Rc-term primers)
GGAACACTTGAGCCCGTGGAGAAAGCCCTGAGAGACGCCAAGATGGACAAGTCTCAGATCCATGACGTCGTTCTGGTTGGTGGATCAACAAGAATCCCAA
T7Storg (Hsp70 F2Rc-term primers)
V5ScarlV (Hsp70 F2R2 primers)
TATGTTCG
T7Storg (Hsp70 F2R2 primers)
TATGTTCG
101 200
||||||||||||||||||||
V5ScarlV (Hsp70 F2Rc-term primers)
AGATCCAGAAGCTTCTGCAGGATTTCTTCAACGGCAGGGACTTGAACAAGAGCATCAACCCAGATGAGGCAGTGGCTTATGGTGCAGCGGTGCAAGCCGC
T7Storg (Hsp70 F2Rc-term primers)
V5ScarlV (Hsp70 F2R2 primers)
T7Storg (Hsp70 F2R2 primers)
201 300
||||||||||||||||||||
V5ScarlV (Hsp70 F2Rc-term primers)
CATCCTCATGGGTGACACATCTGGAAATGTCCAGGACCTGCTGCTGCTGGATGTTGCGCCACTCTCTTTGGGCATCGAGACTGCAGGTGGAGTCATGACG
T7Storg (Hsp70 F2Rc-term primers)
V5ScarlV (Hsp70 F2R2 primers)
T7Storg (Hsp70 F2R2 primers)
A
301 400
||||||||||||||||||||
V5ScarlV (Hsp70 F2Rc-term primers)
GCCCTCATCAAACGCAACACCACCATCCCCACCAAACAGACCCAGACCTTCACCACCTACTCAGACAACCAGCCCGGTGTCCTGATCCAGGTGTATGAGG
T7Storg (Hsp70 F2Rc-term primers)
V5ScarlV (Hsp70 F2R2 primers)
T7Storg (Hsp70 F2R2 primers)
401 500
||||||||||||||||||||
V5ScarlV (Hsp70 F2Rc-term primers)
GAGAGAGGGCCATGACAAAAGACAACAACCTGCTGGGTAAATTTGAGCTCACAGGAATTCCACCTGCACCACGTGGAGTCCCGCAGATTGAAGTGACCTT
T7Storg (Hsp70 F2Rc-term primers)
V5ScarlV (Hsp70 F2R2 primers)
G
T7Storg (Hsp70 F2R2 primers)
T
501 600
||||||||||||||||||||
V5ScarlV (Hsp70 F2Rc-term primers)
TGACATTGACGCCAACGGAATCCTAAATGTGTCAGCGGTGGACAAAAGCACTGGAAAAGAGAACAAGATCACCATCACCAATGACAAGGGCAGACTGAGC
T7Storg (Hsp70 F2Rc-term primers)
V5ScarlV (Hsp70 F2R2 primers)
T7Storg (Hsp70 F2R2 primers)
A
Appendix
44
601 700
||||||||||||||||||||
V5ScarlV (Hsp70 F2Rc-term primers)
AAAGAGGAGATTGAGAGAATGGTGCAGGACGCAGACAAGTACAAAGCTGAAGATGATCAGCAAAGAGAGAAGATTGCTGCCAAAAACTCCCTGGAGTCTT
T7Storg (Hsp70 F2Rc-term primers)
V5ScarlV (Hsp70 F2R2 primers)
T7Storg (Hsp70 F2R2 primers)
701 800
||||||||||||||||||||
V5ScarlV (Hsp70 F2Rc-term primers)
ACGCCTTCAACATGAAGAGCAGTGTGGAAGATGAGAACCTGAAAGGCAAGATCAGCGAGGATGACAAGAAGAAAGTTATTGAGAAATGCAACGCCACCAT
T7Storg (Hsp70 F2Rc-term primers)
V5ScarlV (Hsp70 F2R2 primers)
AAA
T7Storg (Hsp70 F2R2 primers)
AA
801 897
|||||||||||||||||||
V5ScarlV (Hsp70 F2Rc-term primers)
CAGCTGGCTAGAGAACAACCAGCTGGCTGATAAGGAGGAGTATGAACATCAGTTGAAGGAGTTGGAGAAAGTCTGCAACCCAATCATCACTAAGCTT
T7Storg (Hsp70 F2Rc-term primers)
V5ScarlV (Hsp70 F2R2 primers)
------------------------------------------------------------------------------
T7Storg (Hsp70 F2R2 primers)
------------------------------------------------------------------------------
Fig 2 ndash Sequence alignment of the same two individuals (one of each species) using two different pair of primers
(Hsp70_F2Hsp70_R2 and Hsp70_F2Hsp70_Rc-term) Here it is possible to observe that there are no differences
(represented as dots) between V5CarlV (S carolitertii) and T7Storg (S torgalensis) in the nucleotide sequence of hsp70
with the Hsp70_F2Hsp70_Rc-term However with the other pair of primers (Hsp70_F2Hsp70_R2) it is possible to
observe several polymorphisms (indicated by their respective nucleotides in each sequence) Given the incongruence
between the two pair of primers there are doubts about the specificity of the Hsp70_F2Hsp70_R2 pair of primers
Final remarks
Having into account the doubt raised by the expansion of the sequenced amplicon this study was
abandoned since the validity of these results is questionable However the information obtained here
provided the opportunity to follow a new approach presented in this master thesis (Page 1) Namely the
information obtained from the sequences generated helped in the design of gene specific primers
Acknowledgments
I would like to thank Silke Waap for providing the phylogenetic tree of the hsp70 gene used here and
for the design of the primers Hsp70_F2 and Hsp70_R2
Appendix
45
References
Blackman BK (2010) Connecting genetic variation to phenotypic clines Molecular ecology 19 621-3
Chevin LM Lande R Mace GM (2010) Adaptation Plasticity and Extinction in a Changing
Environment Towards a Predictive Theory PLoS Biology 8 e1000357
Clarke A (2003) Costs and consequences of evolutionary temperature adaptation Trends in Ecology amp
Evolution 18 573-581
Dahlhoff EP Rank NE (2007) The role of stress proteins in responses of a montane willow leaf beetle
to environmental temperature variation Journal of biosciences 32 477-88
Fangue NA Hofmeister M Schulte PM (2006) Intraspecific variation in thermal tolerance and heat
shock protein gene expression in common killifish Fundulus heteroclitus The Journal of
experimental biology 209 2859-72
Frydenberg J Hoffmann AA Loeschcke V (2003) DNA sequence variation and latitudinal associations
in hsp23 hsp26 and hsp27 from natural populations of Drosophila melanogaster Molecular
Ecology 12 2025-2032
Gebremedhin B Ficetola GF Naderi S Rezaei HR Maudet C Rioux D Luikart G Flagstad Oslash
Thuiller W Taberlet P (2009) Frontiers in identifying conservation units from neutral markers to
adaptive genetic variation Animal Conservation 12 107-109
Henriques R Sousa V Coelho MM (2010) Migration patterns counteract seasonal isolation of Squalius
torgalensis a critically endangered freshwater fish inhabiting a typical Circum-Mediterranean
small drainage Conservation Genetics
Lindquist S Craig EA (1988) The heat-shock proteins Annual Review of Genetics 22 631-77
Miller S Dykes D Polesky H (1988) A simple salting out procedure for extracting dna from human
nucleated cells Nucleic Acids Research 16 1215
Moritz C (1994) Defining ldquoEvolutionarily Significant Unitsrdquo for conservation Trends in Ecology amp
Evolution 9 373-375
Reusch TBH Wood TE (2007) Molecular ecology of global change Molecular ecology 16 3973-92
Robalo JI Almada VC Levy A Doadrio I (2007) Re-examination and phylogeny of the genus
Chondrostoma based on mitochondrial and nuclear data and the definition of 5 new genera
Molecular phylogenetics and evolution 42 362-72
Ronquist F Huelsenbeck JP (2003) MrBayes 3 Bayesian phylogenetic inference under mixed models
Bioinformatics 19 1572-1574
Appendix
46
Somero GN (2010) The physiology of climate change how potentials for acclimatization and genetic
adaptation will determine ldquowinnersrdquo and ldquolosersrdquo The Journal of experimental biology 213 912-
20
Starrett J Waters ER (2007) Positive natural selection has driven the evolution of the Hsp70s in
Diguetia spiders Biology letters 3 439-44
Yang Z (2007) Paml 4 a program package for phylogenetic analysis by maximum likelihood
Molecular Biology and Evolution 24 1586-1591
Yang Z Nielsen R (2002) Codon-substitution models for detecting molecular adaptation at individual
sites along specific lineages Molecular biology and evolution 19 908-17
Zhang Z Schwartz S Wagner L Miller W (2000) A greedy algorithm for aligning DNA sequences
Journal of computational biology a journal of computational molecular cell biology 7 203-214
Research article In preparation
30
Karl I Sorensen JG Loeschcke V Fischer K (2009) HSP70 expression in the Copper
butterfly Lycaena tityrus across altitudes and temperatures Journal of
Evolutionary Biology 22 172-178
Karouna-Renier NK Zehr JP (1999) Ecological implications of molecular biomarkers
assaying sub-lethal stress in the midge Chironomus tentans using heat shock
protein 70 (HSP-70) expression Hydrobiologia 401 255-264
Kassahn KS Crozier RH Ward AC Stone G Caley MJ (2007) From transcriptome to
biological function environmental stress in an ectothermic vertebrate the coral
reef fish Pomacentrus moluccensis BMC Genomics 8 358
Lindquist S Craig EA (1988) The heat-shock proteins Annual Review of Genetics 22
631-677
Loacutepez-Maury L Marguerat S Baumlhler J (2008) Tuning gene expression to changing
environments from rapid responses to evolutionary adaptation Nature Reviews
Genetics 9 583-593
Magalhaes MF Schlosser IJ Collares-Pereira MJ (2003) The role of life history in the
relationship between population dynamics and environmental variability in two
Mediterranean stream fishes Journal of Fish Biology 63 300-317
Marshall OJ (2004) PerlPrimer cross-platform graphical primer design for standard
bisulphite and real-time PCR Bioinformatics (Oxford England) 20 2471-2472
Mayer MP Bukau B (2005) Hsp70 chaperones cellular functions and molecular
mechanism Cellular and Molecular Life Sciences 62 670-684
McMillan DM Fearnley SL Rank NE and Dahlhoff EP (2005) Natural temperature
variation affects larval survival development and Hsp70 expression in a leaf
beetle Functional Ecology 19 844-852
Montoya JM Raffaelli D (2010) Climate change biotic interactions and ecosystem
services Philosophical Transactions of the Royal Society B Biological Sciences
365 2013-2018
Myers N Mittermeier RA Mittermeier CG Fonseca GA Kent J (2000) Biodiversity
hotspots for conservation priorities Nature 403 853-858
Osborne JW (2005) Notes on the use of data transformations Pratical Assessment
Research amp Evaluation 8 2-9
Pala I Coelho MM (2005) Contrasting views over a hybrid complex Between
speciation and evolutionary dead-end Gene 347 283-294
Pala I Coelho MM Schartl M (2008) Dosage compensation by gene-copy silencing in a
triploid hybrid fish Current Biology 18 1344-8
Research article In preparation
31
Pestana DD Velosa SF (2006) Introduccedilatildeo agrave Probabilidade e Estatiacutestica 2nd ed Lisboa
Fundaccedilatildeo Calouste Gulbenkian
Place SP Hofmann GE (2001) Temperature interactions of the molecular chaperone
Hsc70 from the eurythermal marine goby Gillichthys mirabilis The Journal of
experimental biology 204 2675-2682
Place SP Zippay ML Hofmann GE (2004) Constitutive roles for inducible genes
evidence for the alteration in expression of the inducible hsp70 gene in Antarctic
notothenioid fishes American Journal of Physiology Regulatory Integrative and
Comparative Physiology 287 R429-436
Place SP Hofmann GE (2004) Constitutive expression of a stress-inducible heat shock
protein gene hsp70 in phylogenetically distant Antarctic fish Polar Biology 28
261-267
Reusch TBH Wood TE (2007) Molecular ecology of global change Molecular Ecology
16 3973-92
Sanjur O Carmona JA Doadrio I (2003) Evolutionary and biogeographical patterns
within Iberian populations of the genus Squalius inferred from molecular data
Molecular Phylogenetics and Evolution 2920-30
Sarropoulou E Fernandes JMO Mitter K Magoulas A Mulero V Sepulcre MP
Figueras A Novoa B Kotoulas G (2010) Evolution of a multifunctional gene The
warm temperature acclimation protein Wap65 in the European seabass
Dicentrarchus labrax Molecular Phylogenetics and Evolution 55 640-649
Sarup P Loeschcke V (2010) Developmental acclimation affects clinal variation in
stress resistance traits in Drosophila buzzatii Journal of Evolutionary Biology 23
957-965
Serazin-Leroy V Denis-Henriot D Morot M Mazancourt P Giudicelli Y (1998) Semi-
quantitative RT-PCR for comparison of mRNAs in cells with different amounts of
housekeeping gene transcripts Molecular and Cellular Probes 12 283-291
SNIRH Sistema Nacional de Informaccedilatildeo de Recursos Hiacutedricos Available at
httpsnirhpt Accessed in 22 August 2010
Somero GN (2010) The physiology of climate change how potentials for
acclimatization and genetic adaptation will determine ldquowinnersrdquo and ldquolosersrdquo The
Journal of Experimental Biology 213 912-920
Somji S Todd JH Sens MA Garrett SH Sens DA (1999) Expression of the
constitutive and inducible forms of heat shock protein 70 in human proximal
tubule cells exposed to heat sodium arsenite and CdCl(2) Environmental Health
Perspectives 107 887-893
Sorensen JG Pekkonen M Lindgren B Loeschcke V Laurila A Merila J (2009)
Complex patterns of geographic variation in heat tolerance and Hsp70 expression
Research article In preparation
32
levels in the common frog Rana temporaria Journal of Thermal Biology 34 49-
54
Sorensen JG Dahlgaard J Loeschcke V (2001) Genetic variation in thermal tolerance
among natural populations of Drosophila buzzatii down regulation of Hsp70
expression and variation in heat stress resistance traits Functional Ecology 15
289-296
Sorensen JG Kristensen TN Loeschcke V (2003) The evolutionary and ecological role
of heat shock proteins Ecology Letters 6 1025-1037
Sousa-Santos C Collares-Pereira MJ Almada V (2007) Reading the history of a hybrid
fish complex from its molecular record Molecular Phylogenetics and Evolution
45 981-996
Sousa-Santos C Robalo JI Almada VC (2009) Threatened fishes of the world Squalius
torgalensis (Coelho Bogutskaya Rodrigues amp Collares-Pereira 1998)
(Cyprinidae) Environmental Biology of Fishes 87 123-124
StatSoft I (2010) Electronic Statistics Textbook (Electronic Version) Available at
httpwwwstatsoftcomtextbook
StatSoft I (2009) STATISTICA (data analysis software system) Available at
wwwstatsoftcom
Tomanek L (2010) Variation in the heat shock response and its implication for
predicting the effect of global climate change on species biogeographical
distribution ranges and metabolic costs The Journal of Experimental Biology 213
971-979
Tomanek L Somero GN (2002) Interspecific- and acclimation-induced variation in
levels of heat-shock proteins 70 (hsp70) and 90 (hsp90) and heat-shock
transcription factor-1 (HSF1) in congeneric marine snails (genus Tegula)
implications for regulation of hsp gene expression The Journal of Experimental
Biology 205 677-685
Tymchuk W OrsquoReilly P Bittman J Macdonald D Schulte P (2010) Conservation
genomics of Atlantic salmon variation in gene expression between and within
regions of the Bay of Fundy Molecular Ecology 19 1842-1859
Waagner D Heckmann LH Malmendal A Nielsen NC Holmstrup M Bayley M
(2010) Hsp70 expression and metabolite composition in response to short-term
thermal changes in Folsomia candida (Collembola) Comparative biochemistry and
physiology Part A Molecular amp integrative physiology 157 177-183
Walters RJ Berger D (2010) Thermal Games Putting Temperature Back on the
Evolutionary Agenda Evolution 64 1184-1187
Research article In preparation
33
Woodward G Perkins DM Brown LE (2010) Climate change and freshwater
ecosystems impacts across multiple levels of organization Philosophical
Transactions of the Royal Society B Biological Sciences 365 2093-2106
Yamashita M Hirayoshi K Nagata K (2004) Characterization of multiple members of
the HSP70 family in platyfish culture cells molecular evolution of stress protein
HSP70 in vertebrates Gene 336 207-218
Yeh FL Hsu T (2002) Differential regulation of spontaneous and heat-induced HSP 70
expression in developing zebrafish (Danio rerio) The Journal of Experimental
Zoology 293 349-359
Zar JH (1996) Biostatistical Analysis 3rd ed 662 pp New Jersey Prentice Hall
Zhang Z Schwartz S Wagner L Miller W (2000) A greedy algorithm for aligning
DNA sequences Journal of Computational Biology 7 203-214
Research article In preparation
34
Supplementary material
Fig S1 ndash Box plots for all the treatments performed in long term survival experiments Dark red arrows
point to the samples in which the removal of an outlier helped in meeting the normality assumption
Research article In preparation
35
1 100
||||||||||||||||||||
Ce5-Hsp70_Fc_Rc
ACCTTCACCACCTACTCAGACAACCAGCCCGGTGTCCTGATCCAGGTGTATGAGGGAGAGAGGGCCATGACAAAAGACAACAACCTGCTGGGTAAATTTG
Te15-Hsp70_Rc_Fc
---
101 200
||||||||||||||||||||
Ce5-Hsp70_Fc_Rc
AGCTCACAGGAATTCCACCTGCACCACGTGGAGTCCCGCAGATTGAAGTGACCTTTGACATTGACGCCAACGGAATCCTAAATGTGTCAGCGGTGGACAA
Te15-Hsp70_Rc_Fc
201 300
||||||||||||||||||||
Ce5-Hsp70_Fc_Rc
AAGCACTGGAAAAGAGAACAAGATCACCATCACCAATGACAAGGGCAGACTGAGCAAAGAGGAGATTGAGAGAATGGTGCAGGACGCAGACAAGTACAAA
Te15-Hsp70_Rc_Fc
301 365
|||||||||||||
Ce5-Hsp70_Fc_Rc GCTGAAGATGATCAGCAAAGAGAGAAGATTGCTGCCAAAAACTCCCTGGAGTCTTACGCCTTCAA
Te15-Hsp70_Rc_Fc -----------
Fig S2 - Sequence alignment of the cDNA of two individuals at 30ordmC (long term survival experiments) one S carolitertii (Ce5-Hsp70_Fc_Rc) and one S
torgalensis (Te15- Hsp70_Fc_Rc) Here it is possible to observe that there are no differences (represented as dots) between these two individuals in the
nucleotide sequence of hsp70 with the Hsp70_FcHsp70_Rc primers
Research article In preparation
36
1 100
||||||||||||||||||||
Ce5_hsc70 TTAGCGGGTGATAAATCTGAGAATGTCCAAGACCTTTTGCTGTTGGATGTCACTCCTCTCTCTCTGGGCATTGAGACGGCTGGTGGTGTCATGACTGTAT
Te8_hsc70 A
101 200
||||||||||||||||||||
Ce5_hsc70 TAATTAAGAGGAACACCACCATTCCCACCAAGCAAACCCAGACCTTCACCACTTACTCAGACAACCAGCCCGGTGTACTGATCCAGGTATATGAAGGAGA
Te8_hsc70
201 300
||||||||||||||||||||
Ce5_hsc70 GAGAGCCATGACAAAGGACAACAACCTTCTTGGAAAATTTGAGTTGACAGGCATCCCTCCCGCTCCTCGTGGTGTGCCACAGATCGAAGTTACCTTCGAC
Te8_hsc70
301 400
||||||||||||||||||||
Ce5_hsc70 ATTGACGCCAATGGCATTCTCAATGTATCCGCAGTGGACAAAAGCACTGGCAAAGAAAACAAGATCACGATTACTAACGACAAAGGTCGTTTGAGCAAGG
Te8_hsc70 G
401 458
|||||||||||
Ce5_hsc70 AAGACATTGAACGTATGGTACAAGAGGCTGACCAATACAAAGCAGAGGATGAAGCTCA
Te8_hsc70
Fig S3 - Sequence alignment of the cDNA of two individuals at 30ordmC (long term survival experiments) one S carolitertii (Ce5_hsc70) and one S torgalensis
(Te8_hsc70) The two nucleotide differences presented here (surrounded by a red line) did not have any implications in amino acid composition of the encoded
protein
Appendix
37
Introduction
Until recently neutral genetic markers were the state of the art tools in conservation genetics used to
access the risk of extinction of several species allowing the identification of management units
(Gebremedhin et al 2009) There are mainly two types of conservation units widely employed in
conservation genetics Evolutionary Significant Units (ESUs) and Management Units (MUs) defined
by Moritz (1994) ESUs correspond to populations whose differentiation is high and between which
took long enough so that reciprocal monophyly has occurred and they should be preserved as
independent units MUs are populations that recently diverged and between which some genetic flow
might still occur However with the increasing number of adaptative genetic makers available the field
of conservation genetics is transitioning to pay more attention to adaptative genetic variation
(Gebremedhin et al 2009 Reusch amp Wood 2007)
Local adaptation has a key role in the evolutionary history and in species ecology and thus efforts
should be carried out in order to incorporate this relevant information in making decisions for
conservation purposes (Gebremedhin et al 2009 Reusch amp Wood 2007) Important polymorphism
variation in loci with potential adaptative role might have profound effects in species ability to deal
with environmental changes stress and ultimately in populations subsistence (Gebremedhin et al
2009) Furthermore reduced neutral genetic variability is not synonymous of reduced evolutionary or
adaptative potential Populations may have reduced neutral genetic variability and yet be well adapted
to their environmental conditions (Gebremedhin et al 2009)
Temperature is one of the most challenging abiotic variables that organisms have to face in order to
avoid extinction (Clarke 2003) Temperature effects in physiological and biochemical processes are
considered to have an important role in shaping species distribution and abundance particularly for
ectotherms (Chevin et al 2010 Clarke 2003 Somero 2010) Several studies have been performed in
candidate genes of thermal adaptation namely the Heat Shock Proteins (HSPs) HSPs are important in
cellular response mechanisms during several stresses particularly heat stress and this suggests that
these proteins may have a significant role in the ecological context (Lindquist amp Craig 1988 Dahlhoff
amp Rank 2007) Sequence variation alongside with protein or mRNA expression profiles of HSPs have
been the subject of many studies that tried to understand the role of these proteins in thermal tolerance
of species enhancing our capacity to predict the responses of these species to environmental changes
Starret amp Waters (2007) studied the sequence evolution of a heat inducible hsp70 gene in three spider
families They verified that populations from the heat-tolerant family Diguetidae that inhabits the
Appendix
38
deserts of Sonoran and Mojave in North America have evidence of positive natural selection that
altered hsp70 coding sequence This alteration in the gene coding sequence may have conferred
adaptative advantage to these spiders deal with heat allowing them to colonize desert habitats (Starrett
amp Waters 2007) Changes in the coding sequence of hsps have also been found in Drosophila
melanogaster Frydenberg et al (2003) found that hsp26 and hsp27 genes have several polymorphisms
with implications in protein coding sequence (nonsynonimous nucleotide substitutions) Interestingly
the hsp26 polymorphism presented a latitudinal pattern along the east coast of Australia similar to what
as previously been found for hsp23 gene Clinal sequence variation can be a challenging subject for
study because it provides the possibility to identify specific polymorphisms responsible for climatic
adaptations (Reusch amp Wood 2007 Blackman 2010) Nonetheless Fangue et al (2006) did not find
differences in the amino acid sequence between populations of Fundulus heteroclitus (killifish) Rather
they find differences in gene expression patterns of hsp70-2 gene between northern and southern
populations of this killifish
Several species of the Leuciscinae sub-family are distributed throughout the Portuguese rivers in
which different species inhabit rivers with different regimes Some of these species inhabit in rivers of
the southern part of Portugal which are characterized by a regime of severe droughts that subjects
fishes to high temperatures when trapped in small water bodies during the dry season (Henriques et al
2010) Our first aim was to test the existence of a latitudinal adaptative variation in the DNA sequence
of the hsp70 gene in speciespopulations of the Leuciscinae sub-family [in Squalius genus and in the
formerly described Chondrostoma genus (Robalo et al 2007)] given that sequence variation had been
previously detected in this gene by our Research Group (MMCoelho personnal communication)
Material and methods
Genomic DNA extraction PCR amplification and sequencing
Genomic DNA was extracted from fin clips following standard protocols of digestion with SDS and
proteinase K and phenolchlorophorm extraction (Miller et al 1988) in a total of 51 individuals 17
from Squalius genus and 34 from ldquoChondrostomardquo genera Approximately 819 bp of the hsp70 gene
were amplified in a total volume of 25 microl with a final concentration of 125 units of DNA polymerase
Gotaq flexi (Fermentas) 03 μM of each primer 025 mM of each dNTP and 2mM of MgCl2 using the
forward 5-TACACGTCCATCACCAGAGC-3 (Hsp70_F2) and reverse 5-
ACTTTCTCCAGCTCCTTCAG-3 (Hsp70_R2) primers PCR products were purified and sent for
Appendix
39
sequencing in Macrogen Korea
Meanwhile two other pairs of primers
(Table 1) were designed in order to extend
the coverage of this gene which improve
the power of the subsequent analysis Both
pairs of primers were designed using the
information of the already sequenced
amplicon and sequences of this gene from other fish species (Danio rerio Carassius auratus
Megalobrama amblycephala) available in public databases (NCBI and Ensembl) One pair of primers
were designed to cover the ATPase domain of the gene (Hsp70_FATPaseHsp70_RATPase) and
amplification was carried out in a total volume of 25 ul with a final concentration of 125 units of DNA
polymerase Gotaq flexi (fermentas) 08 μM of forward primer and 04 μM of reverse primer 025 mM
of each dNTP and 175 mM of MgCl2 with an initial denaturation step at 94degC during 5 min followed
by 35 cycles at 94degC for 1 min 56degC for 1 min and 72ordmC 1min and 30 seconds and to a final extension
of 10 min at 72ordmC The other pair of primers was designed to cover the C-terminal
(Hsp70_F2Hsp70_Rc-term) of the gene and were amplified in a total volume of 25 ul with a final
concentration of 125 units of DNA polymerase Gotaq flexi (fermentas) 03 μM each primer 025 mM
of each dNTP and 15 mM of MgCl2 with an initial denaturation step at 94degC during 5 min followed
by 35 cycles at 94degC for 1 min 66degC for 30 seconds and 72ordmC 1min and to a final extension of 10 min
at 72ordmC The obtained amplicons were sent for sequencing in Macrogen Korea All Sequences obtained
were edited and their chromatograms manually checked for errors in SEQUENCHER v42 (Gene
Codes Corporation) BLAST analyses (Zhang et al 2000) were used to confirm the identity of the
gene
Phylogenetic and evolutionary analysis
Hsp70 phylogenetic tree was generated with 2 millions generations sampled every 100th
generation in
two independent runs using MrBayes v 31 (Ronquist amp Huelsenbeck 2003)
and was used in the
subsequent analysis
Codeml module of the PAML package (Yang 2007) was used to test for the existence of natural
selection in this gene between the species of the Leuciscinae sub-family studied here This module have
implemented codon substitution models useful for detecting positive natural selection branch models
Primer name Primer Sequence 5 - 3
Hsp70_FATPase AGGARTYGCTATTGGSATTG
Hsp70_RATPase CTGCCRTTGAAGAAATCCT
Hsp70_F2 TACACGTCCATCACCAGAGC
Hsp70_R2 ACTTTCTCCAGCTCCTTCAG
Hsp70_Rc-term CTGGAGGMTGTGGAGCTCAG
Table 1 ndash Primers used in this study
Appendix
40
sites models and branch-site models (Yang 2007) Branch models were used to test different ω=dSdN
ratios for distinct branches on the phylogeny (Yang 2007 Yang amp Nielsen 2002) dNdS is the
nonsynonymoussynonymous substitution rate ratio that measures the direction and magnitude of
selection on amino acid changes with values of ωlt1 =1 and gt1 indicating negative purifying
selection neutral evolution and positive selection respectively Site models tested the presence of sites
under positive selection in the nucleotide sequence Finally branch-site models were used to detect
positive selection affecting only a few sites on certain lineages (branches on the phylogeny) (Yang
2007 Yang amp Nielsen 2002) Likelihood ratio tests (LRTs) were used to determine the model that best
fits and statistical decisions were based on a p-level = 005
Results and Discussion
The analysis of the hsp70 gene 819 bp primarily sequenced revealed that for all the species analyzed
a ω = 0145 was obtained suggesting that the hsp70 gene in these species is mainly conserved as it
was expected according to the fact that HSPs are one of the most conserved proteins between different
organisms (Lindquist amp Craig 1988)
Table 2 ndash Likelihood ratio test statistics Significant tests are marked with an
Hypotheses LRT df 2Δl p value
Branch models
one vs two (ω0 - others ω1 - southern species) 14948 1 7474 0008
one ω vs two ω (ω0 - Chondrostoma ω1 - Squalius) 1246 1 0623 1000
one vs two (ω0 - others ω1 - southern speciesS carolitertii group) 17934 1 8967 0005
one vs three (ω0 - others ω1 - southern species ω2 - S carolitertii) 17527 2 17527 0000
two (ω0 - others ω1 - southern speciesS carolitertii group) vs three (ω0 - others ω1 - southern species ω2 - S carolitertii) 0407 1 0204 1000
Sites models
M1a vs M2a 0002 2 0002 1000
M7 vs M8 0001 2 0001 1000
Branch-site
models ma(fixed) vs ma(modified)
3440 1 1720 0317
We tested the hypothesis of the ω ratio for the southern species (S torgalensis S aradensis and
Iberochondrostoma almacai) of both lineages (Squalius and ldquoChondrostomardquo) being different from the
other species using branch models and results suggest that there exists a different ω ratio for the
southern species when compared to the other species We also tested the hypothesis of Squalius have a
different ω ratio from ldquoChondrostomardquo although this time there were no differences between this
model and the null model of one ω ratio for the entire phylogeny Since S carolitertii from Vouga and
Douro drainages also seem to present a higher number of nucleotide substitutions as suggested by the
Appendix
41
hsp70 phylogeny (Fig 1) we tested a new model including these S carolitertii in the southern group
and this model was statistically different from the null model (one ω ratio for all the lineages)
However this last model has a higher likelihood than the model with only the southern species having
a different ω ratio (Table 2) Three-ratio models were also tested one ω ratio for S carolitertii lineage
previously referred other for the southern species group (S torgalensis S aradensis and
Iberochondrostoma almacai) and another for the remaining species The model also reject the null
hypothesis suggesting the existence of more than one ω ratio however this model is not significantly
different from the two-ratio model with S carolitertii included in the southern group and its likelihood
is also slightly lower thus the simpler model was preferred (Table 2) In order to examine if natural
selection is acting on specific codons across all the species analyzed here we carry out two tests
implemented in PAML package (M1a versus M2a and M7 versus M8 see Table 2) In each case we do
not reject the null hypothesis that there are not codons under positive selection across the hsp70
phylogeny (Table 2) Branch-site models were carried out in order to test the presence of sites under
positive selection between the group southern speciesS carolitertii and the remaining species and the
null hypothesis of neutrality was not rejected suggesting that in this portion of the hsp70 gene there is
no evidence of positive for these lineages
Appendix
42
Fig 1- Phylogenetic relationships of the sampled species based in the 819 bp sequenced of hsp70 gene with primers
Hsp70_F2Hsp70_R2 Individuals with similar sequences were grouped in order to facilitate the interpretation of the results
Black stars represent the species that were included in the southern group while the black arrow points to the lineage of S
carolitertii which was grouped with the southern species in some analysis of branch models ldquoChondrostomardquo group
include three different genera Iberochondrostoma Pseudochondrostoma Achondrostoma
Furthermore since natural selection may act in the entire protein coding sequence and not only in a
portion of it we tried to sequence other portions of the gene However the results of sequencing with
the Hsp70_F2 and Hsp70_Rc-term primers did not match the same gene from the previous sequences
(obtained with the Hsp70_F2 and Hsp70_R2 primers) (Fig 2) This issue was even more important
given that the individuals sequenced were the same that have been already sequenced with the F2 and
R2 primers These observations suggest that many hsp70 genes can be amplified with the Hsp70_F2
Hsp70_R2 pair of primers and which makes it very difficult to design gene specific sets of primers to
amplify the entire gene sequence
Appendix
43
1 100
||||||||||||||||||||
V5ScarlV (Hsp70 F2Rc-term primers)
GGAACACTTGAGCCCGTGGAGAAAGCCCTGAGAGACGCCAAGATGGACAAGTCTCAGATCCATGACGTCGTTCTGGTTGGTGGATCAACAAGAATCCCAA
T7Storg (Hsp70 F2Rc-term primers)
V5ScarlV (Hsp70 F2R2 primers)
TATGTTCG
T7Storg (Hsp70 F2R2 primers)
TATGTTCG
101 200
||||||||||||||||||||
V5ScarlV (Hsp70 F2Rc-term primers)
AGATCCAGAAGCTTCTGCAGGATTTCTTCAACGGCAGGGACTTGAACAAGAGCATCAACCCAGATGAGGCAGTGGCTTATGGTGCAGCGGTGCAAGCCGC
T7Storg (Hsp70 F2Rc-term primers)
V5ScarlV (Hsp70 F2R2 primers)
T7Storg (Hsp70 F2R2 primers)
201 300
||||||||||||||||||||
V5ScarlV (Hsp70 F2Rc-term primers)
CATCCTCATGGGTGACACATCTGGAAATGTCCAGGACCTGCTGCTGCTGGATGTTGCGCCACTCTCTTTGGGCATCGAGACTGCAGGTGGAGTCATGACG
T7Storg (Hsp70 F2Rc-term primers)
V5ScarlV (Hsp70 F2R2 primers)
T7Storg (Hsp70 F2R2 primers)
A
301 400
||||||||||||||||||||
V5ScarlV (Hsp70 F2Rc-term primers)
GCCCTCATCAAACGCAACACCACCATCCCCACCAAACAGACCCAGACCTTCACCACCTACTCAGACAACCAGCCCGGTGTCCTGATCCAGGTGTATGAGG
T7Storg (Hsp70 F2Rc-term primers)
V5ScarlV (Hsp70 F2R2 primers)
T7Storg (Hsp70 F2R2 primers)
401 500
||||||||||||||||||||
V5ScarlV (Hsp70 F2Rc-term primers)
GAGAGAGGGCCATGACAAAAGACAACAACCTGCTGGGTAAATTTGAGCTCACAGGAATTCCACCTGCACCACGTGGAGTCCCGCAGATTGAAGTGACCTT
T7Storg (Hsp70 F2Rc-term primers)
V5ScarlV (Hsp70 F2R2 primers)
G
T7Storg (Hsp70 F2R2 primers)
T
501 600
||||||||||||||||||||
V5ScarlV (Hsp70 F2Rc-term primers)
TGACATTGACGCCAACGGAATCCTAAATGTGTCAGCGGTGGACAAAAGCACTGGAAAAGAGAACAAGATCACCATCACCAATGACAAGGGCAGACTGAGC
T7Storg (Hsp70 F2Rc-term primers)
V5ScarlV (Hsp70 F2R2 primers)
T7Storg (Hsp70 F2R2 primers)
A
Appendix
44
601 700
||||||||||||||||||||
V5ScarlV (Hsp70 F2Rc-term primers)
AAAGAGGAGATTGAGAGAATGGTGCAGGACGCAGACAAGTACAAAGCTGAAGATGATCAGCAAAGAGAGAAGATTGCTGCCAAAAACTCCCTGGAGTCTT
T7Storg (Hsp70 F2Rc-term primers)
V5ScarlV (Hsp70 F2R2 primers)
T7Storg (Hsp70 F2R2 primers)
701 800
||||||||||||||||||||
V5ScarlV (Hsp70 F2Rc-term primers)
ACGCCTTCAACATGAAGAGCAGTGTGGAAGATGAGAACCTGAAAGGCAAGATCAGCGAGGATGACAAGAAGAAAGTTATTGAGAAATGCAACGCCACCAT
T7Storg (Hsp70 F2Rc-term primers)
V5ScarlV (Hsp70 F2R2 primers)
AAA
T7Storg (Hsp70 F2R2 primers)
AA
801 897
|||||||||||||||||||
V5ScarlV (Hsp70 F2Rc-term primers)
CAGCTGGCTAGAGAACAACCAGCTGGCTGATAAGGAGGAGTATGAACATCAGTTGAAGGAGTTGGAGAAAGTCTGCAACCCAATCATCACTAAGCTT
T7Storg (Hsp70 F2Rc-term primers)
V5ScarlV (Hsp70 F2R2 primers)
------------------------------------------------------------------------------
T7Storg (Hsp70 F2R2 primers)
------------------------------------------------------------------------------
Fig 2 ndash Sequence alignment of the same two individuals (one of each species) using two different pair of primers
(Hsp70_F2Hsp70_R2 and Hsp70_F2Hsp70_Rc-term) Here it is possible to observe that there are no differences
(represented as dots) between V5CarlV (S carolitertii) and T7Storg (S torgalensis) in the nucleotide sequence of hsp70
with the Hsp70_F2Hsp70_Rc-term However with the other pair of primers (Hsp70_F2Hsp70_R2) it is possible to
observe several polymorphisms (indicated by their respective nucleotides in each sequence) Given the incongruence
between the two pair of primers there are doubts about the specificity of the Hsp70_F2Hsp70_R2 pair of primers
Final remarks
Having into account the doubt raised by the expansion of the sequenced amplicon this study was
abandoned since the validity of these results is questionable However the information obtained here
provided the opportunity to follow a new approach presented in this master thesis (Page 1) Namely the
information obtained from the sequences generated helped in the design of gene specific primers
Acknowledgments
I would like to thank Silke Waap for providing the phylogenetic tree of the hsp70 gene used here and
for the design of the primers Hsp70_F2 and Hsp70_R2
Appendix
45
References
Blackman BK (2010) Connecting genetic variation to phenotypic clines Molecular ecology 19 621-3
Chevin LM Lande R Mace GM (2010) Adaptation Plasticity and Extinction in a Changing
Environment Towards a Predictive Theory PLoS Biology 8 e1000357
Clarke A (2003) Costs and consequences of evolutionary temperature adaptation Trends in Ecology amp
Evolution 18 573-581
Dahlhoff EP Rank NE (2007) The role of stress proteins in responses of a montane willow leaf beetle
to environmental temperature variation Journal of biosciences 32 477-88
Fangue NA Hofmeister M Schulte PM (2006) Intraspecific variation in thermal tolerance and heat
shock protein gene expression in common killifish Fundulus heteroclitus The Journal of
experimental biology 209 2859-72
Frydenberg J Hoffmann AA Loeschcke V (2003) DNA sequence variation and latitudinal associations
in hsp23 hsp26 and hsp27 from natural populations of Drosophila melanogaster Molecular
Ecology 12 2025-2032
Gebremedhin B Ficetola GF Naderi S Rezaei HR Maudet C Rioux D Luikart G Flagstad Oslash
Thuiller W Taberlet P (2009) Frontiers in identifying conservation units from neutral markers to
adaptive genetic variation Animal Conservation 12 107-109
Henriques R Sousa V Coelho MM (2010) Migration patterns counteract seasonal isolation of Squalius
torgalensis a critically endangered freshwater fish inhabiting a typical Circum-Mediterranean
small drainage Conservation Genetics
Lindquist S Craig EA (1988) The heat-shock proteins Annual Review of Genetics 22 631-77
Miller S Dykes D Polesky H (1988) A simple salting out procedure for extracting dna from human
nucleated cells Nucleic Acids Research 16 1215
Moritz C (1994) Defining ldquoEvolutionarily Significant Unitsrdquo for conservation Trends in Ecology amp
Evolution 9 373-375
Reusch TBH Wood TE (2007) Molecular ecology of global change Molecular ecology 16 3973-92
Robalo JI Almada VC Levy A Doadrio I (2007) Re-examination and phylogeny of the genus
Chondrostoma based on mitochondrial and nuclear data and the definition of 5 new genera
Molecular phylogenetics and evolution 42 362-72
Ronquist F Huelsenbeck JP (2003) MrBayes 3 Bayesian phylogenetic inference under mixed models
Bioinformatics 19 1572-1574
Appendix
46
Somero GN (2010) The physiology of climate change how potentials for acclimatization and genetic
adaptation will determine ldquowinnersrdquo and ldquolosersrdquo The Journal of experimental biology 213 912-
20
Starrett J Waters ER (2007) Positive natural selection has driven the evolution of the Hsp70s in
Diguetia spiders Biology letters 3 439-44
Yang Z (2007) Paml 4 a program package for phylogenetic analysis by maximum likelihood
Molecular Biology and Evolution 24 1586-1591
Yang Z Nielsen R (2002) Codon-substitution models for detecting molecular adaptation at individual
sites along specific lineages Molecular biology and evolution 19 908-17
Zhang Z Schwartz S Wagner L Miller W (2000) A greedy algorithm for aligning DNA sequences
Journal of computational biology a journal of computational molecular cell biology 7 203-214

Research article In preparation
36
1 100
||||||||||||||||||||
Ce5_hsc70 TTAGCGGGTGATAAATCTGAGAATGTCCAAGACCTTTTGCTGTTGGATGTCACTCCTCTCTCTCTGGGCATTGAGACGGCTGGTGGTGTCATGACTGTAT
Te8_hsc70 A
101 200
||||||||||||||||||||
Ce5_hsc70 TAATTAAGAGGAACACCACCATTCCCACCAAGCAAACCCAGACCTTCACCACTTACTCAGACAACCAGCCCGGTGTACTGATCCAGGTATATGAAGGAGA
Te8_hsc70
201 300
||||||||||||||||||||
Ce5_hsc70 GAGAGCCATGACAAAGGACAACAACCTTCTTGGAAAATTTGAGTTGACAGGCATCCCTCCCGCTCCTCGTGGTGTGCCACAGATCGAAGTTACCTTCGAC
Te8_hsc70
301 400
||||||||||||||||||||
Ce5_hsc70 ATTGACGCCAATGGCATTCTCAATGTATCCGCAGTGGACAAAAGCACTGGCAAAGAAAACAAGATCACGATTACTAACGACAAAGGTCGTTTGAGCAAGG
Te8_hsc70 G
401 458
|||||||||||
Ce5_hsc70 AAGACATTGAACGTATGGTACAAGAGGCTGACCAATACAAAGCAGAGGATGAAGCTCA
Te8_hsc70
Fig S3 - Sequence alignment of the cDNA of two individuals at 30ordmC (long term survival experiments) one S carolitertii (Ce5_hsc70) and one S torgalensis
(Te8_hsc70) The two nucleotide differences presented here (surrounded by a red line) did not have any implications in amino acid composition of the encoded
protein
Appendix
37
Introduction
Until recently neutral genetic markers were the state of the art tools in conservation genetics used to
access the risk of extinction of several species allowing the identification of management units
(Gebremedhin et al 2009) There are mainly two types of conservation units widely employed in
conservation genetics Evolutionary Significant Units (ESUs) and Management Units (MUs) defined
by Moritz (1994) ESUs correspond to populations whose differentiation is high and between which
took long enough so that reciprocal monophyly has occurred and they should be preserved as
independent units MUs are populations that recently diverged and between which some genetic flow
might still occur However with the increasing number of adaptative genetic makers available the field
of conservation genetics is transitioning to pay more attention to adaptative genetic variation
(Gebremedhin et al 2009 Reusch amp Wood 2007)
Local adaptation has a key role in the evolutionary history and in species ecology and thus efforts
should be carried out in order to incorporate this relevant information in making decisions for
conservation purposes (Gebremedhin et al 2009 Reusch amp Wood 2007) Important polymorphism
variation in loci with potential adaptative role might have profound effects in species ability to deal
with environmental changes stress and ultimately in populations subsistence (Gebremedhin et al
2009) Furthermore reduced neutral genetic variability is not synonymous of reduced evolutionary or
adaptative potential Populations may have reduced neutral genetic variability and yet be well adapted
to their environmental conditions (Gebremedhin et al 2009)
Temperature is one of the most challenging abiotic variables that organisms have to face in order to
avoid extinction (Clarke 2003) Temperature effects in physiological and biochemical processes are
considered to have an important role in shaping species distribution and abundance particularly for
ectotherms (Chevin et al 2010 Clarke 2003 Somero 2010) Several studies have been performed in
candidate genes of thermal adaptation namely the Heat Shock Proteins (HSPs) HSPs are important in
cellular response mechanisms during several stresses particularly heat stress and this suggests that
these proteins may have a significant role in the ecological context (Lindquist amp Craig 1988 Dahlhoff
amp Rank 2007) Sequence variation alongside with protein or mRNA expression profiles of HSPs have
been the subject of many studies that tried to understand the role of these proteins in thermal tolerance
of species enhancing our capacity to predict the responses of these species to environmental changes
Starret amp Waters (2007) studied the sequence evolution of a heat inducible hsp70 gene in three spider
families They verified that populations from the heat-tolerant family Diguetidae that inhabits the
Appendix
38
deserts of Sonoran and Mojave in North America have evidence of positive natural selection that
altered hsp70 coding sequence This alteration in the gene coding sequence may have conferred
adaptative advantage to these spiders deal with heat allowing them to colonize desert habitats (Starrett
amp Waters 2007) Changes in the coding sequence of hsps have also been found in Drosophila
melanogaster Frydenberg et al (2003) found that hsp26 and hsp27 genes have several polymorphisms
with implications in protein coding sequence (nonsynonimous nucleotide substitutions) Interestingly
the hsp26 polymorphism presented a latitudinal pattern along the east coast of Australia similar to what
as previously been found for hsp23 gene Clinal sequence variation can be a challenging subject for
study because it provides the possibility to identify specific polymorphisms responsible for climatic
adaptations (Reusch amp Wood 2007 Blackman 2010) Nonetheless Fangue et al (2006) did not find
differences in the amino acid sequence between populations of Fundulus heteroclitus (killifish) Rather
they find differences in gene expression patterns of hsp70-2 gene between northern and southern
populations of this killifish
Several species of the Leuciscinae sub-family are distributed throughout the Portuguese rivers in
which different species inhabit rivers with different regimes Some of these species inhabit in rivers of
the southern part of Portugal which are characterized by a regime of severe droughts that subjects
fishes to high temperatures when trapped in small water bodies during the dry season (Henriques et al
2010) Our first aim was to test the existence of a latitudinal adaptative variation in the DNA sequence
of the hsp70 gene in speciespopulations of the Leuciscinae sub-family [in Squalius genus and in the
formerly described Chondrostoma genus (Robalo et al 2007)] given that sequence variation had been
previously detected in this gene by our Research Group (MMCoelho personnal communication)
Material and methods
Genomic DNA extraction PCR amplification and sequencing
Genomic DNA was extracted from fin clips following standard protocols of digestion with SDS and
proteinase K and phenolchlorophorm extraction (Miller et al 1988) in a total of 51 individuals 17
from Squalius genus and 34 from ldquoChondrostomardquo genera Approximately 819 bp of the hsp70 gene
were amplified in a total volume of 25 microl with a final concentration of 125 units of DNA polymerase
Gotaq flexi (Fermentas) 03 μM of each primer 025 mM of each dNTP and 2mM of MgCl2 using the
forward 5-TACACGTCCATCACCAGAGC-3 (Hsp70_F2) and reverse 5-
ACTTTCTCCAGCTCCTTCAG-3 (Hsp70_R2) primers PCR products were purified and sent for
Appendix
39
sequencing in Macrogen Korea
Meanwhile two other pairs of primers
(Table 1) were designed in order to extend
the coverage of this gene which improve
the power of the subsequent analysis Both
pairs of primers were designed using the
information of the already sequenced
amplicon and sequences of this gene from other fish species (Danio rerio Carassius auratus
Megalobrama amblycephala) available in public databases (NCBI and Ensembl) One pair of primers
were designed to cover the ATPase domain of the gene (Hsp70_FATPaseHsp70_RATPase) and
amplification was carried out in a total volume of 25 ul with a final concentration of 125 units of DNA
polymerase Gotaq flexi (fermentas) 08 μM of forward primer and 04 μM of reverse primer 025 mM
of each dNTP and 175 mM of MgCl2 with an initial denaturation step at 94degC during 5 min followed
by 35 cycles at 94degC for 1 min 56degC for 1 min and 72ordmC 1min and 30 seconds and to a final extension
of 10 min at 72ordmC The other pair of primers was designed to cover the C-terminal
(Hsp70_F2Hsp70_Rc-term) of the gene and were amplified in a total volume of 25 ul with a final
concentration of 125 units of DNA polymerase Gotaq flexi (fermentas) 03 μM each primer 025 mM
of each dNTP and 15 mM of MgCl2 with an initial denaturation step at 94degC during 5 min followed
by 35 cycles at 94degC for 1 min 66degC for 30 seconds and 72ordmC 1min and to a final extension of 10 min
at 72ordmC The obtained amplicons were sent for sequencing in Macrogen Korea All Sequences obtained
were edited and their chromatograms manually checked for errors in SEQUENCHER v42 (Gene
Codes Corporation) BLAST analyses (Zhang et al 2000) were used to confirm the identity of the
gene
Phylogenetic and evolutionary analysis
Hsp70 phylogenetic tree was generated with 2 millions generations sampled every 100th
generation in
two independent runs using MrBayes v 31 (Ronquist amp Huelsenbeck 2003)
and was used in the
subsequent analysis
Codeml module of the PAML package (Yang 2007) was used to test for the existence of natural
selection in this gene between the species of the Leuciscinae sub-family studied here This module have
implemented codon substitution models useful for detecting positive natural selection branch models
Primer name Primer Sequence 5 - 3
Hsp70_FATPase AGGARTYGCTATTGGSATTG
Hsp70_RATPase CTGCCRTTGAAGAAATCCT
Hsp70_F2 TACACGTCCATCACCAGAGC
Hsp70_R2 ACTTTCTCCAGCTCCTTCAG
Hsp70_Rc-term CTGGAGGMTGTGGAGCTCAG
Table 1 ndash Primers used in this study
Appendix
40
sites models and branch-site models (Yang 2007) Branch models were used to test different ω=dSdN
ratios for distinct branches on the phylogeny (Yang 2007 Yang amp Nielsen 2002) dNdS is the
nonsynonymoussynonymous substitution rate ratio that measures the direction and magnitude of
selection on amino acid changes with values of ωlt1 =1 and gt1 indicating negative purifying
selection neutral evolution and positive selection respectively Site models tested the presence of sites
under positive selection in the nucleotide sequence Finally branch-site models were used to detect
positive selection affecting only a few sites on certain lineages (branches on the phylogeny) (Yang
2007 Yang amp Nielsen 2002) Likelihood ratio tests (LRTs) were used to determine the model that best
fits and statistical decisions were based on a p-level = 005
Results and Discussion
The analysis of the hsp70 gene 819 bp primarily sequenced revealed that for all the species analyzed
a ω = 0145 was obtained suggesting that the hsp70 gene in these species is mainly conserved as it
was expected according to the fact that HSPs are one of the most conserved proteins between different
organisms (Lindquist amp Craig 1988)
Table 2 ndash Likelihood ratio test statistics Significant tests are marked with an
Hypotheses LRT df 2Δl p value
Branch models
one vs two (ω0 - others ω1 - southern species) 14948 1 7474 0008
one ω vs two ω (ω0 - Chondrostoma ω1 - Squalius) 1246 1 0623 1000
one vs two (ω0 - others ω1 - southern speciesS carolitertii group) 17934 1 8967 0005
one vs three (ω0 - others ω1 - southern species ω2 - S carolitertii) 17527 2 17527 0000
two (ω0 - others ω1 - southern speciesS carolitertii group) vs three (ω0 - others ω1 - southern species ω2 - S carolitertii) 0407 1 0204 1000
Sites models
M1a vs M2a 0002 2 0002 1000
M7 vs M8 0001 2 0001 1000
Branch-site
models ma(fixed) vs ma(modified)
3440 1 1720 0317
We tested the hypothesis of the ω ratio for the southern species (S torgalensis S aradensis and
Iberochondrostoma almacai) of both lineages (Squalius and ldquoChondrostomardquo) being different from the
other species using branch models and results suggest that there exists a different ω ratio for the
southern species when compared to the other species We also tested the hypothesis of Squalius have a
different ω ratio from ldquoChondrostomardquo although this time there were no differences between this
model and the null model of one ω ratio for the entire phylogeny Since S carolitertii from Vouga and
Douro drainages also seem to present a higher number of nucleotide substitutions as suggested by the
Appendix
41
hsp70 phylogeny (Fig 1) we tested a new model including these S carolitertii in the southern group
and this model was statistically different from the null model (one ω ratio for all the lineages)
However this last model has a higher likelihood than the model with only the southern species having
a different ω ratio (Table 2) Three-ratio models were also tested one ω ratio for S carolitertii lineage
previously referred other for the southern species group (S torgalensis S aradensis and
Iberochondrostoma almacai) and another for the remaining species The model also reject the null
hypothesis suggesting the existence of more than one ω ratio however this model is not significantly
different from the two-ratio model with S carolitertii included in the southern group and its likelihood
is also slightly lower thus the simpler model was preferred (Table 2) In order to examine if natural
selection is acting on specific codons across all the species analyzed here we carry out two tests
implemented in PAML package (M1a versus M2a and M7 versus M8 see Table 2) In each case we do
not reject the null hypothesis that there are not codons under positive selection across the hsp70
phylogeny (Table 2) Branch-site models were carried out in order to test the presence of sites under
positive selection between the group southern speciesS carolitertii and the remaining species and the
null hypothesis of neutrality was not rejected suggesting that in this portion of the hsp70 gene there is
no evidence of positive for these lineages
Appendix
42
Fig 1- Phylogenetic relationships of the sampled species based in the 819 bp sequenced of hsp70 gene with primers
Hsp70_F2Hsp70_R2 Individuals with similar sequences were grouped in order to facilitate the interpretation of the results
Black stars represent the species that were included in the southern group while the black arrow points to the lineage of S
carolitertii which was grouped with the southern species in some analysis of branch models ldquoChondrostomardquo group
include three different genera Iberochondrostoma Pseudochondrostoma Achondrostoma
Furthermore since natural selection may act in the entire protein coding sequence and not only in a
portion of it we tried to sequence other portions of the gene However the results of sequencing with
the Hsp70_F2 and Hsp70_Rc-term primers did not match the same gene from the previous sequences
(obtained with the Hsp70_F2 and Hsp70_R2 primers) (Fig 2) This issue was even more important
given that the individuals sequenced were the same that have been already sequenced with the F2 and
R2 primers These observations suggest that many hsp70 genes can be amplified with the Hsp70_F2
Hsp70_R2 pair of primers and which makes it very difficult to design gene specific sets of primers to
amplify the entire gene sequence
Appendix
43
1 100
||||||||||||||||||||
V5ScarlV (Hsp70 F2Rc-term primers)
GGAACACTTGAGCCCGTGGAGAAAGCCCTGAGAGACGCCAAGATGGACAAGTCTCAGATCCATGACGTCGTTCTGGTTGGTGGATCAACAAGAATCCCAA
T7Storg (Hsp70 F2Rc-term primers)
V5ScarlV (Hsp70 F2R2 primers)
TATGTTCG
T7Storg (Hsp70 F2R2 primers)
TATGTTCG
101 200
||||||||||||||||||||
V5ScarlV (Hsp70 F2Rc-term primers)
AGATCCAGAAGCTTCTGCAGGATTTCTTCAACGGCAGGGACTTGAACAAGAGCATCAACCCAGATGAGGCAGTGGCTTATGGTGCAGCGGTGCAAGCCGC
T7Storg (Hsp70 F2Rc-term primers)
V5ScarlV (Hsp70 F2R2 primers)
T7Storg (Hsp70 F2R2 primers)
201 300
||||||||||||||||||||
V5ScarlV (Hsp70 F2Rc-term primers)
CATCCTCATGGGTGACACATCTGGAAATGTCCAGGACCTGCTGCTGCTGGATGTTGCGCCACTCTCTTTGGGCATCGAGACTGCAGGTGGAGTCATGACG
T7Storg (Hsp70 F2Rc-term primers)
V5ScarlV (Hsp70 F2R2 primers)
T7Storg (Hsp70 F2R2 primers)
A
301 400
||||||||||||||||||||
V5ScarlV (Hsp70 F2Rc-term primers)
GCCCTCATCAAACGCAACACCACCATCCCCACCAAACAGACCCAGACCTTCACCACCTACTCAGACAACCAGCCCGGTGTCCTGATCCAGGTGTATGAGG
T7Storg (Hsp70 F2Rc-term primers)
V5ScarlV (Hsp70 F2R2 primers)
T7Storg (Hsp70 F2R2 primers)
401 500
||||||||||||||||||||
V5ScarlV (Hsp70 F2Rc-term primers)
GAGAGAGGGCCATGACAAAAGACAACAACCTGCTGGGTAAATTTGAGCTCACAGGAATTCCACCTGCACCACGTGGAGTCCCGCAGATTGAAGTGACCTT
T7Storg (Hsp70 F2Rc-term primers)
V5ScarlV (Hsp70 F2R2 primers)
G
T7Storg (Hsp70 F2R2 primers)
T
501 600
||||||||||||||||||||
V5ScarlV (Hsp70 F2Rc-term primers)
TGACATTGACGCCAACGGAATCCTAAATGTGTCAGCGGTGGACAAAAGCACTGGAAAAGAGAACAAGATCACCATCACCAATGACAAGGGCAGACTGAGC
T7Storg (Hsp70 F2Rc-term primers)
V5ScarlV (Hsp70 F2R2 primers)
T7Storg (Hsp70 F2R2 primers)
A
Appendix
44
601 700
||||||||||||||||||||
V5ScarlV (Hsp70 F2Rc-term primers)
AAAGAGGAGATTGAGAGAATGGTGCAGGACGCAGACAAGTACAAAGCTGAAGATGATCAGCAAAGAGAGAAGATTGCTGCCAAAAACTCCCTGGAGTCTT
T7Storg (Hsp70 F2Rc-term primers)
V5ScarlV (Hsp70 F2R2 primers)
T7Storg (Hsp70 F2R2 primers)
701 800
||||||||||||||||||||
V5ScarlV (Hsp70 F2Rc-term primers)
ACGCCTTCAACATGAAGAGCAGTGTGGAAGATGAGAACCTGAAAGGCAAGATCAGCGAGGATGACAAGAAGAAAGTTATTGAGAAATGCAACGCCACCAT
T7Storg (Hsp70 F2Rc-term primers)
V5ScarlV (Hsp70 F2R2 primers)
AAA
T7Storg (Hsp70 F2R2 primers)
AA
801 897
|||||||||||||||||||
V5ScarlV (Hsp70 F2Rc-term primers)
CAGCTGGCTAGAGAACAACCAGCTGGCTGATAAGGAGGAGTATGAACATCAGTTGAAGGAGTTGGAGAAAGTCTGCAACCCAATCATCACTAAGCTT
T7Storg (Hsp70 F2Rc-term primers)
V5ScarlV (Hsp70 F2R2 primers)
------------------------------------------------------------------------------
T7Storg (Hsp70 F2R2 primers)
------------------------------------------------------------------------------
Fig 2 ndash Sequence alignment of the same two individuals (one of each species) using two different pair of primers
(Hsp70_F2Hsp70_R2 and Hsp70_F2Hsp70_Rc-term) Here it is possible to observe that there are no differences
(represented as dots) between V5CarlV (S carolitertii) and T7Storg (S torgalensis) in the nucleotide sequence of hsp70
with the Hsp70_F2Hsp70_Rc-term However with the other pair of primers (Hsp70_F2Hsp70_R2) it is possible to
observe several polymorphisms (indicated by their respective nucleotides in each sequence) Given the incongruence
between the two pair of primers there are doubts about the specificity of the Hsp70_F2Hsp70_R2 pair of primers
Final remarks
Having into account the doubt raised by the expansion of the sequenced amplicon this study was
abandoned since the validity of these results is questionable However the information obtained here
provided the opportunity to follow a new approach presented in this master thesis (Page 1) Namely the
information obtained from the sequences generated helped in the design of gene specific primers
Acknowledgments
I would like to thank Silke Waap for providing the phylogenetic tree of the hsp70 gene used here and
for the design of the primers Hsp70_F2 and Hsp70_R2
Appendix
45
References
Blackman BK (2010) Connecting genetic variation to phenotypic clines Molecular ecology 19 621-3
Chevin LM Lande R Mace GM (2010) Adaptation Plasticity and Extinction in a Changing
Environment Towards a Predictive Theory PLoS Biology 8 e1000357
Clarke A (2003) Costs and consequences of evolutionary temperature adaptation Trends in Ecology amp
Evolution 18 573-581
Dahlhoff EP Rank NE (2007) The role of stress proteins in responses of a montane willow leaf beetle
to environmental temperature variation Journal of biosciences 32 477-88
Fangue NA Hofmeister M Schulte PM (2006) Intraspecific variation in thermal tolerance and heat
shock protein gene expression in common killifish Fundulus heteroclitus The Journal of
experimental biology 209 2859-72
Frydenberg J Hoffmann AA Loeschcke V (2003) DNA sequence variation and latitudinal associations
in hsp23 hsp26 and hsp27 from natural populations of Drosophila melanogaster Molecular
Ecology 12 2025-2032
Gebremedhin B Ficetola GF Naderi S Rezaei HR Maudet C Rioux D Luikart G Flagstad Oslash
Thuiller W Taberlet P (2009) Frontiers in identifying conservation units from neutral markers to
adaptive genetic variation Animal Conservation 12 107-109
Henriques R Sousa V Coelho MM (2010) Migration patterns counteract seasonal isolation of Squalius
torgalensis a critically endangered freshwater fish inhabiting a typical Circum-Mediterranean
small drainage Conservation Genetics
Lindquist S Craig EA (1988) The heat-shock proteins Annual Review of Genetics 22 631-77
Miller S Dykes D Polesky H (1988) A simple salting out procedure for extracting dna from human
nucleated cells Nucleic Acids Research 16 1215
Moritz C (1994) Defining ldquoEvolutionarily Significant Unitsrdquo for conservation Trends in Ecology amp
Evolution 9 373-375
Reusch TBH Wood TE (2007) Molecular ecology of global change Molecular ecology 16 3973-92
Robalo JI Almada VC Levy A Doadrio I (2007) Re-examination and phylogeny of the genus
Chondrostoma based on mitochondrial and nuclear data and the definition of 5 new genera
Molecular phylogenetics and evolution 42 362-72
Ronquist F Huelsenbeck JP (2003) MrBayes 3 Bayesian phylogenetic inference under mixed models
Bioinformatics 19 1572-1574
Appendix
46
Somero GN (2010) The physiology of climate change how potentials for acclimatization and genetic
adaptation will determine ldquowinnersrdquo and ldquolosersrdquo The Journal of experimental biology 213 912-
20
Starrett J Waters ER (2007) Positive natural selection has driven the evolution of the Hsp70s in
Diguetia spiders Biology letters 3 439-44
Yang Z (2007) Paml 4 a program package for phylogenetic analysis by maximum likelihood
Molecular Biology and Evolution 24 1586-1591
Yang Z Nielsen R (2002) Codon-substitution models for detecting molecular adaptation at individual
sites along specific lineages Molecular biology and evolution 19 908-17
Zhang Z Schwartz S Wagner L Miller W (2000) A greedy algorithm for aligning DNA sequences
Journal of computational biology a journal of computational molecular cell biology 7 203-214

Appendix
42
Fig 1- Phylogenetic relationships of the sampled species based in the 819 bp sequenced of hsp70 gene with primers
Hsp70_F2Hsp70_R2 Individuals with similar sequences were grouped in order to facilitate the interpretation of the results
Black stars represent the species that were included in the southern group while the black arrow points to the lineage of S
carolitertii which was grouped with the southern species in some analysis of branch models ldquoChondrostomardquo group
include three different genera Iberochondrostoma Pseudochondrostoma Achondrostoma
Furthermore since natural selection may act in the entire protein coding sequence and not only in a
portion of it we tried to sequence other portions of the gene However the results of sequencing with
the Hsp70_F2 and Hsp70_Rc-term primers did not match the same gene from the previous sequences
(obtained with the Hsp70_F2 and Hsp70_R2 primers) (Fig 2) This issue was even more important
given that the individuals sequenced were the same that have been already sequenced with the F2 and
R2 primers These observations suggest that many hsp70 genes can be amplified with the Hsp70_F2
Hsp70_R2 pair of primers and which makes it very difficult to design gene specific sets of primers to
amplify the entire gene sequence
Appendix
43
1 100
||||||||||||||||||||
V5ScarlV (Hsp70 F2Rc-term primers)
GGAACACTTGAGCCCGTGGAGAAAGCCCTGAGAGACGCCAAGATGGACAAGTCTCAGATCCATGACGTCGTTCTGGTTGGTGGATCAACAAGAATCCCAA
T7Storg (Hsp70 F2Rc-term primers)
V5ScarlV (Hsp70 F2R2 primers)
TATGTTCG
T7Storg (Hsp70 F2R2 primers)
TATGTTCG
101 200
||||||||||||||||||||
V5ScarlV (Hsp70 F2Rc-term primers)
AGATCCAGAAGCTTCTGCAGGATTTCTTCAACGGCAGGGACTTGAACAAGAGCATCAACCCAGATGAGGCAGTGGCTTATGGTGCAGCGGTGCAAGCCGC
T7Storg (Hsp70 F2Rc-term primers)
V5ScarlV (Hsp70 F2R2 primers)
T7Storg (Hsp70 F2R2 primers)
201 300
||||||||||||||||||||
V5ScarlV (Hsp70 F2Rc-term primers)
CATCCTCATGGGTGACACATCTGGAAATGTCCAGGACCTGCTGCTGCTGGATGTTGCGCCACTCTCTTTGGGCATCGAGACTGCAGGTGGAGTCATGACG
T7Storg (Hsp70 F2Rc-term primers)
V5ScarlV (Hsp70 F2R2 primers)
T7Storg (Hsp70 F2R2 primers)
A
301 400
||||||||||||||||||||
V5ScarlV (Hsp70 F2Rc-term primers)
GCCCTCATCAAACGCAACACCACCATCCCCACCAAACAGACCCAGACCTTCACCACCTACTCAGACAACCAGCCCGGTGTCCTGATCCAGGTGTATGAGG
T7Storg (Hsp70 F2Rc-term primers)
V5ScarlV (Hsp70 F2R2 primers)
T7Storg (Hsp70 F2R2 primers)
401 500
||||||||||||||||||||
V5ScarlV (Hsp70 F2Rc-term primers)
GAGAGAGGGCCATGACAAAAGACAACAACCTGCTGGGTAAATTTGAGCTCACAGGAATTCCACCTGCACCACGTGGAGTCCCGCAGATTGAAGTGACCTT
T7Storg (Hsp70 F2Rc-term primers)
V5ScarlV (Hsp70 F2R2 primers)
G
T7Storg (Hsp70 F2R2 primers)
T
501 600
||||||||||||||||||||
V5ScarlV (Hsp70 F2Rc-term primers)
TGACATTGACGCCAACGGAATCCTAAATGTGTCAGCGGTGGACAAAAGCACTGGAAAAGAGAACAAGATCACCATCACCAATGACAAGGGCAGACTGAGC
T7Storg (Hsp70 F2Rc-term primers)
V5ScarlV (Hsp70 F2R2 primers)
T7Storg (Hsp70 F2R2 primers)
A
Appendix
44
601 700
||||||||||||||||||||
V5ScarlV (Hsp70 F2Rc-term primers)
AAAGAGGAGATTGAGAGAATGGTGCAGGACGCAGACAAGTACAAAGCTGAAGATGATCAGCAAAGAGAGAAGATTGCTGCCAAAAACTCCCTGGAGTCTT
T7Storg (Hsp70 F2Rc-term primers)
V5ScarlV (Hsp70 F2R2 primers)
T7Storg (Hsp70 F2R2 primers)
701 800
||||||||||||||||||||
V5ScarlV (Hsp70 F2Rc-term primers)
ACGCCTTCAACATGAAGAGCAGTGTGGAAGATGAGAACCTGAAAGGCAAGATCAGCGAGGATGACAAGAAGAAAGTTATTGAGAAATGCAACGCCACCAT
T7Storg (Hsp70 F2Rc-term primers)
V5ScarlV (Hsp70 F2R2 primers)
AAA
T7Storg (Hsp70 F2R2 primers)
AA
801 897
|||||||||||||||||||
V5ScarlV (Hsp70 F2Rc-term primers)
CAGCTGGCTAGAGAACAACCAGCTGGCTGATAAGGAGGAGTATGAACATCAGTTGAAGGAGTTGGAGAAAGTCTGCAACCCAATCATCACTAAGCTT
T7Storg (Hsp70 F2Rc-term primers)
V5ScarlV (Hsp70 F2R2 primers)
------------------------------------------------------------------------------
T7Storg (Hsp70 F2R2 primers)
------------------------------------------------------------------------------
Fig 2 ndash Sequence alignment of the same two individuals (one of each species) using two different pair of primers
(Hsp70_F2Hsp70_R2 and Hsp70_F2Hsp70_Rc-term) Here it is possible to observe that there are no differences
(represented as dots) between V5CarlV (S carolitertii) and T7Storg (S torgalensis) in the nucleotide sequence of hsp70
with the Hsp70_F2Hsp70_Rc-term However with the other pair of primers (Hsp70_F2Hsp70_R2) it is possible to
observe several polymorphisms (indicated by their respective nucleotides in each sequence) Given the incongruence
between the two pair of primers there are doubts about the specificity of the Hsp70_F2Hsp70_R2 pair of primers
Final remarks
Having into account the doubt raised by the expansion of the sequenced amplicon this study was
abandoned since the validity of these results is questionable However the information obtained here
provided the opportunity to follow a new approach presented in this master thesis (Page 1) Namely the
information obtained from the sequences generated helped in the design of gene specific primers
Acknowledgments
I would like to thank Silke Waap for providing the phylogenetic tree of the hsp70 gene used here and
for the design of the primers Hsp70_F2 and Hsp70_R2
Appendix
45
References
Blackman BK (2010) Connecting genetic variation to phenotypic clines Molecular ecology 19 621-3
Chevin LM Lande R Mace GM (2010) Adaptation Plasticity and Extinction in a Changing
Environment Towards a Predictive Theory PLoS Biology 8 e1000357
Clarke A (2003) Costs and consequences of evolutionary temperature adaptation Trends in Ecology amp
Evolution 18 573-581
Dahlhoff EP Rank NE (2007) The role of stress proteins in responses of a montane willow leaf beetle
to environmental temperature variation Journal of biosciences 32 477-88
Fangue NA Hofmeister M Schulte PM (2006) Intraspecific variation in thermal tolerance and heat
shock protein gene expression in common killifish Fundulus heteroclitus The Journal of
experimental biology 209 2859-72
Frydenberg J Hoffmann AA Loeschcke V (2003) DNA sequence variation and latitudinal associations
in hsp23 hsp26 and hsp27 from natural populations of Drosophila melanogaster Molecular
Ecology 12 2025-2032
Gebremedhin B Ficetola GF Naderi S Rezaei HR Maudet C Rioux D Luikart G Flagstad Oslash
Thuiller W Taberlet P (2009) Frontiers in identifying conservation units from neutral markers to
adaptive genetic variation Animal Conservation 12 107-109
Henriques R Sousa V Coelho MM (2010) Migration patterns counteract seasonal isolation of Squalius
torgalensis a critically endangered freshwater fish inhabiting a typical Circum-Mediterranean
small drainage Conservation Genetics
Lindquist S Craig EA (1988) The heat-shock proteins Annual Review of Genetics 22 631-77
Miller S Dykes D Polesky H (1988) A simple salting out procedure for extracting dna from human
nucleated cells Nucleic Acids Research 16 1215
Moritz C (1994) Defining ldquoEvolutionarily Significant Unitsrdquo for conservation Trends in Ecology amp
Evolution 9 373-375
Reusch TBH Wood TE (2007) Molecular ecology of global change Molecular ecology 16 3973-92
Robalo JI Almada VC Levy A Doadrio I (2007) Re-examination and phylogeny of the genus
Chondrostoma based on mitochondrial and nuclear data and the definition of 5 new genera
Molecular phylogenetics and evolution 42 362-72
Ronquist F Huelsenbeck JP (2003) MrBayes 3 Bayesian phylogenetic inference under mixed models
Bioinformatics 19 1572-1574
Appendix
46
Somero GN (2010) The physiology of climate change how potentials for acclimatization and genetic
adaptation will determine ldquowinnersrdquo and ldquolosersrdquo The Journal of experimental biology 213 912-
20
Starrett J Waters ER (2007) Positive natural selection has driven the evolution of the Hsp70s in
Diguetia spiders Biology letters 3 439-44
Yang Z (2007) Paml 4 a program package for phylogenetic analysis by maximum likelihood
Molecular Biology and Evolution 24 1586-1591
Yang Z Nielsen R (2002) Codon-substitution models for detecting molecular adaptation at individual
sites along specific lineages Molecular biology and evolution 19 908-17
Zhang Z Schwartz S Wagner L Miller W (2000) A greedy algorithm for aligning DNA sequences
Journal of computational biology a journal of computational molecular cell biology 7 203-214
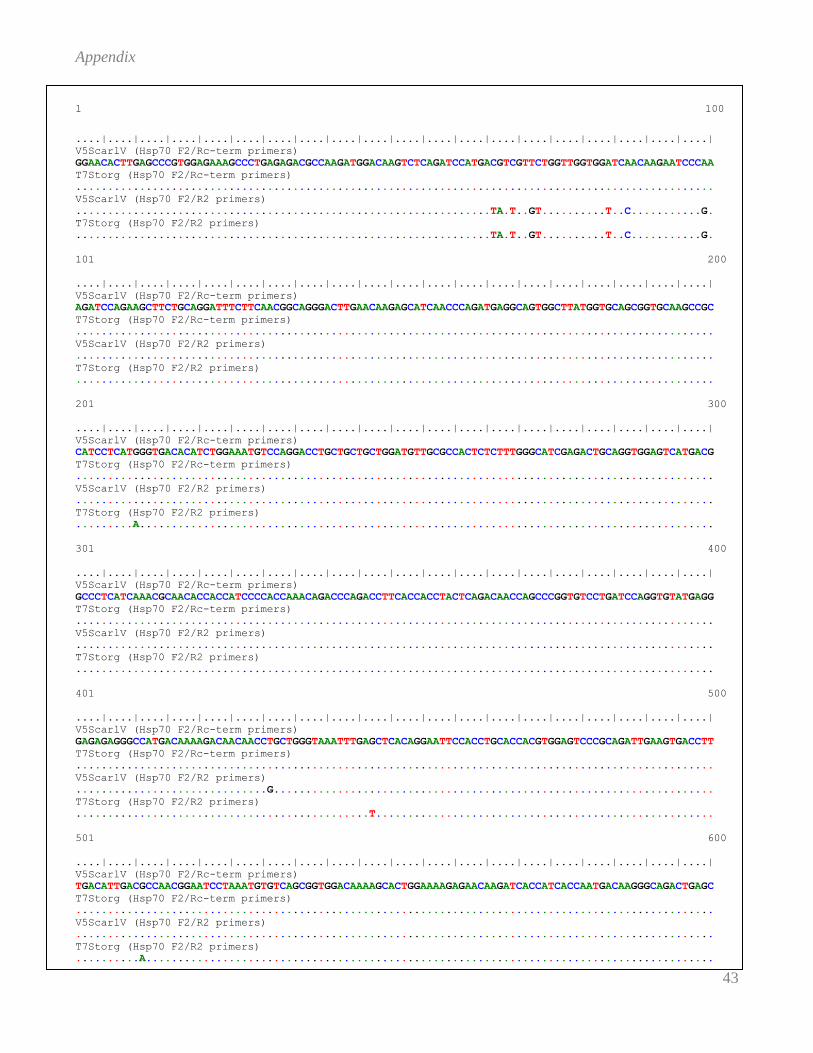
Appendix
43
1 100
||||||||||||||||||||
V5ScarlV (Hsp70 F2Rc-term primers)
GGAACACTTGAGCCCGTGGAGAAAGCCCTGAGAGACGCCAAGATGGACAAGTCTCAGATCCATGACGTCGTTCTGGTTGGTGGATCAACAAGAATCCCAA
T7Storg (Hsp70 F2Rc-term primers)
V5ScarlV (Hsp70 F2R2 primers)
TATGTTCG
T7Storg (Hsp70 F2R2 primers)
TATGTTCG
101 200
||||||||||||||||||||
V5ScarlV (Hsp70 F2Rc-term primers)
AGATCCAGAAGCTTCTGCAGGATTTCTTCAACGGCAGGGACTTGAACAAGAGCATCAACCCAGATGAGGCAGTGGCTTATGGTGCAGCGGTGCAAGCCGC
T7Storg (Hsp70 F2Rc-term primers)
V5ScarlV (Hsp70 F2R2 primers)
T7Storg (Hsp70 F2R2 primers)
201 300
||||||||||||||||||||
V5ScarlV (Hsp70 F2Rc-term primers)
CATCCTCATGGGTGACACATCTGGAAATGTCCAGGACCTGCTGCTGCTGGATGTTGCGCCACTCTCTTTGGGCATCGAGACTGCAGGTGGAGTCATGACG
T7Storg (Hsp70 F2Rc-term primers)
V5ScarlV (Hsp70 F2R2 primers)
T7Storg (Hsp70 F2R2 primers)
A
301 400
||||||||||||||||||||
V5ScarlV (Hsp70 F2Rc-term primers)
GCCCTCATCAAACGCAACACCACCATCCCCACCAAACAGACCCAGACCTTCACCACCTACTCAGACAACCAGCCCGGTGTCCTGATCCAGGTGTATGAGG
T7Storg (Hsp70 F2Rc-term primers)
V5ScarlV (Hsp70 F2R2 primers)
T7Storg (Hsp70 F2R2 primers)
401 500
||||||||||||||||||||
V5ScarlV (Hsp70 F2Rc-term primers)
GAGAGAGGGCCATGACAAAAGACAACAACCTGCTGGGTAAATTTGAGCTCACAGGAATTCCACCTGCACCACGTGGAGTCCCGCAGATTGAAGTGACCTT
T7Storg (Hsp70 F2Rc-term primers)
V5ScarlV (Hsp70 F2R2 primers)
G
T7Storg (Hsp70 F2R2 primers)
T
501 600
||||||||||||||||||||
V5ScarlV (Hsp70 F2Rc-term primers)
TGACATTGACGCCAACGGAATCCTAAATGTGTCAGCGGTGGACAAAAGCACTGGAAAAGAGAACAAGATCACCATCACCAATGACAAGGGCAGACTGAGC
T7Storg (Hsp70 F2Rc-term primers)
V5ScarlV (Hsp70 F2R2 primers)
T7Storg (Hsp70 F2R2 primers)
A
Appendix
44
601 700
||||||||||||||||||||
V5ScarlV (Hsp70 F2Rc-term primers)
AAAGAGGAGATTGAGAGAATGGTGCAGGACGCAGACAAGTACAAAGCTGAAGATGATCAGCAAAGAGAGAAGATTGCTGCCAAAAACTCCCTGGAGTCTT
T7Storg (Hsp70 F2Rc-term primers)
V5ScarlV (Hsp70 F2R2 primers)
T7Storg (Hsp70 F2R2 primers)
701 800
||||||||||||||||||||
V5ScarlV (Hsp70 F2Rc-term primers)
ACGCCTTCAACATGAAGAGCAGTGTGGAAGATGAGAACCTGAAAGGCAAGATCAGCGAGGATGACAAGAAGAAAGTTATTGAGAAATGCAACGCCACCAT
T7Storg (Hsp70 F2Rc-term primers)
V5ScarlV (Hsp70 F2R2 primers)
AAA
T7Storg (Hsp70 F2R2 primers)
AA
801 897
|||||||||||||||||||
V5ScarlV (Hsp70 F2Rc-term primers)
CAGCTGGCTAGAGAACAACCAGCTGGCTGATAAGGAGGAGTATGAACATCAGTTGAAGGAGTTGGAGAAAGTCTGCAACCCAATCATCACTAAGCTT
T7Storg (Hsp70 F2Rc-term primers)
V5ScarlV (Hsp70 F2R2 primers)
------------------------------------------------------------------------------
T7Storg (Hsp70 F2R2 primers)
------------------------------------------------------------------------------
Fig 2 ndash Sequence alignment of the same two individuals (one of each species) using two different pair of primers
(Hsp70_F2Hsp70_R2 and Hsp70_F2Hsp70_Rc-term) Here it is possible to observe that there are no differences
(represented as dots) between V5CarlV (S carolitertii) and T7Storg (S torgalensis) in the nucleotide sequence of hsp70
with the Hsp70_F2Hsp70_Rc-term However with the other pair of primers (Hsp70_F2Hsp70_R2) it is possible to
observe several polymorphisms (indicated by their respective nucleotides in each sequence) Given the incongruence
between the two pair of primers there are doubts about the specificity of the Hsp70_F2Hsp70_R2 pair of primers
Final remarks
Having into account the doubt raised by the expansion of the sequenced amplicon this study was
abandoned since the validity of these results is questionable However the information obtained here
provided the opportunity to follow a new approach presented in this master thesis (Page 1) Namely the
information obtained from the sequences generated helped in the design of gene specific primers
Acknowledgments
I would like to thank Silke Waap for providing the phylogenetic tree of the hsp70 gene used here and
for the design of the primers Hsp70_F2 and Hsp70_R2
Appendix
45
References
Blackman BK (2010) Connecting genetic variation to phenotypic clines Molecular ecology 19 621-3
Chevin LM Lande R Mace GM (2010) Adaptation Plasticity and Extinction in a Changing
Environment Towards a Predictive Theory PLoS Biology 8 e1000357
Clarke A (2003) Costs and consequences of evolutionary temperature adaptation Trends in Ecology amp
Evolution 18 573-581
Dahlhoff EP Rank NE (2007) The role of stress proteins in responses of a montane willow leaf beetle
to environmental temperature variation Journal of biosciences 32 477-88
Fangue NA Hofmeister M Schulte PM (2006) Intraspecific variation in thermal tolerance and heat
shock protein gene expression in common killifish Fundulus heteroclitus The Journal of
experimental biology 209 2859-72
Frydenberg J Hoffmann AA Loeschcke V (2003) DNA sequence variation and latitudinal associations
in hsp23 hsp26 and hsp27 from natural populations of Drosophila melanogaster Molecular
Ecology 12 2025-2032
Gebremedhin B Ficetola GF Naderi S Rezaei HR Maudet C Rioux D Luikart G Flagstad Oslash
Thuiller W Taberlet P (2009) Frontiers in identifying conservation units from neutral markers to
adaptive genetic variation Animal Conservation 12 107-109
Henriques R Sousa V Coelho MM (2010) Migration patterns counteract seasonal isolation of Squalius
torgalensis a critically endangered freshwater fish inhabiting a typical Circum-Mediterranean
small drainage Conservation Genetics
Lindquist S Craig EA (1988) The heat-shock proteins Annual Review of Genetics 22 631-77
Miller S Dykes D Polesky H (1988) A simple salting out procedure for extracting dna from human
nucleated cells Nucleic Acids Research 16 1215
Moritz C (1994) Defining ldquoEvolutionarily Significant Unitsrdquo for conservation Trends in Ecology amp
Evolution 9 373-375
Reusch TBH Wood TE (2007) Molecular ecology of global change Molecular ecology 16 3973-92
Robalo JI Almada VC Levy A Doadrio I (2007) Re-examination and phylogeny of the genus
Chondrostoma based on mitochondrial and nuclear data and the definition of 5 new genera
Molecular phylogenetics and evolution 42 362-72
Ronquist F Huelsenbeck JP (2003) MrBayes 3 Bayesian phylogenetic inference under mixed models
Bioinformatics 19 1572-1574
Appendix
46
Somero GN (2010) The physiology of climate change how potentials for acclimatization and genetic
adaptation will determine ldquowinnersrdquo and ldquolosersrdquo The Journal of experimental biology 213 912-
20
Starrett J Waters ER (2007) Positive natural selection has driven the evolution of the Hsp70s in
Diguetia spiders Biology letters 3 439-44
Yang Z (2007) Paml 4 a program package for phylogenetic analysis by maximum likelihood
Molecular Biology and Evolution 24 1586-1591
Yang Z Nielsen R (2002) Codon-substitution models for detecting molecular adaptation at individual
sites along specific lineages Molecular biology and evolution 19 908-17
Zhang Z Schwartz S Wagner L Miller W (2000) A greedy algorithm for aligning DNA sequences
Journal of computational biology a journal of computational molecular cell biology 7 203-214
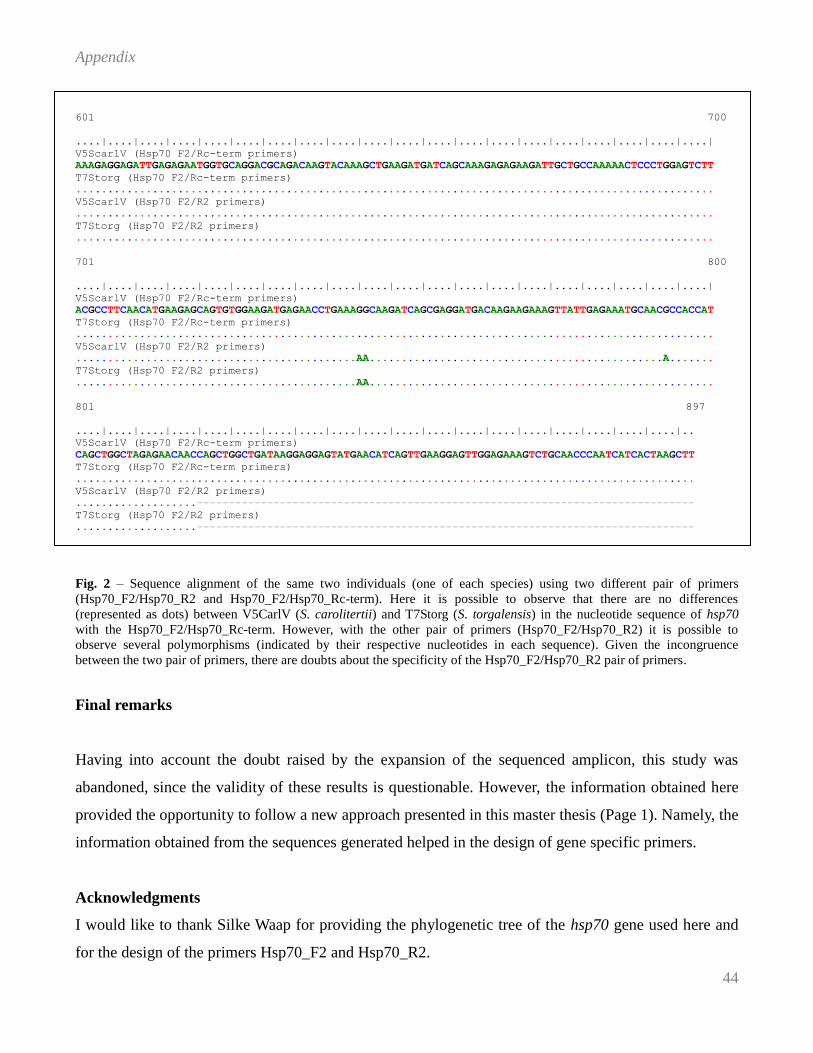
Appendix
46
Somero GN (2010) The physiology of climate change how potentials for acclimatization and genetic
adaptation will determine ldquowinnersrdquo and ldquolosersrdquo The Journal of experimental biology 213 912-
20
Starrett J Waters ER (2007) Positive natural selection has driven the evolution of the Hsp70s in
Diguetia spiders Biology letters 3 439-44
Yang Z (2007) Paml 4 a program package for phylogenetic analysis by maximum likelihood
Molecular Biology and Evolution 24 1586-1591
Yang Z Nielsen R (2002) Codon-substitution models for detecting molecular adaptation at individual
sites along specific lineages Molecular biology and evolution 19 908-17
Zhang Z Schwartz S Wagner L Miller W (2000) A greedy algorithm for aligning DNA sequences
Journal of computational biology a journal of computational molecular cell biology 7 203-214