insights from field experiments to conduct thermal response tests with heating cablesjr etal2014...
TRANSCRIPT

Insights from field experiments to conduct thermal response tests with
heating cables
Jasmin Raymond, Louis Lamarche
and Michel Malo
7th Geothermal heat pump business and policy forumMontréal – May 16, 2014

Ground source heat pump systems
• Use to heat and cool buildings withgeothermal resources of very-lowtemperature (< 30 °C)
• Provide energy savings• 60-70 % heating• 30-40 % cooling
• Contribute to greenhouse gassesreductions
• Expensive installation cost

Ground source heat pump systems
• Appropriate design can help toconstrain ground heat exchangerlength
• In situ assessment of the subsurfacetemperature and thermal conductivity(TC) is needed
• Test performed in a explorationborehole with a ground heatexchanger

Conventional thermal response tests (TRTs)
• 50 to 80 W/m• 240 V / 30-50 A• A fuel-fired generator
supplies power• Expensive • Provide a bulk TC value• A fiber optic cable can be
used to obtain aTC profile
Raymond et al. 2011
Acuna
et al. 2009

Thermal response tests with a low power source
• 20 to 40 W/m trough 10-15 sections
• 120 V / 10 A• No need for
a generator• Potential to
save cost (50%)
• Provide a TC profile
Raymond and Lamarche 2014 US Patent: 61859909

Heating sections test methodology
Field operations
• Cable assembly is lowered in the borehole
• Initial temperature is measured at the middle of the heating sections
• Heat is injected during 50-75 h• Recovery temperature is
measured

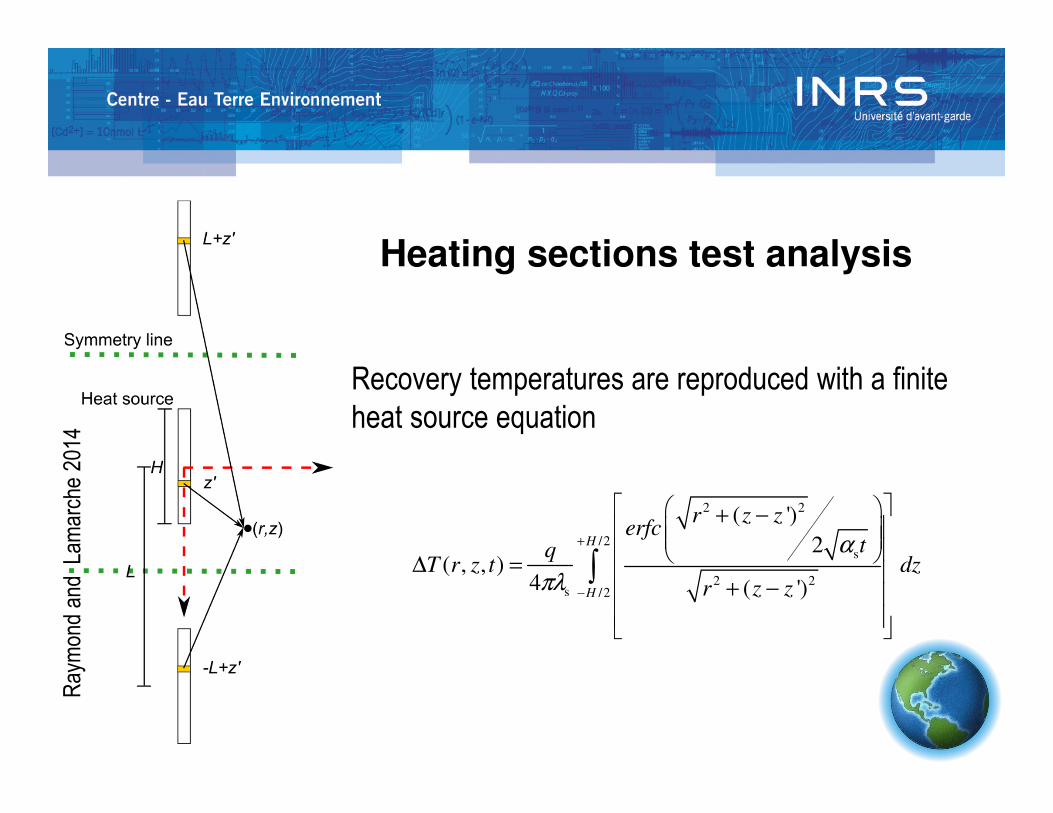
Heating sections test analysis
Recovery temperatures are reproduced with a finite heat source equation
Raymond and Lam
arche 2014
2 2
/2s
2 2s /2
( ')
2( , , )
4 ( ')
H
H
r z zerfc
tqT r z t dz
r z z
α
πλ
+
−
+ − ∆ =
+ −
∫

Heating sections test analysis
• Temperature response approximated with a g-function• r = 0,01 m and H = 1.36 m• Recovery taken into account with the superposition principle
2
offs )(
H
ttFo
−=
α
[ ])'()(2 s
, FogFogq
T rz −=∆πλ
=∆
H
rFog
qTz ,
2 sπλ
2
s
H
tFo
α=

Heating sections test analysis
Comparison of the finite and infinite linear heat source solution
Raymond and Lamarche 2014
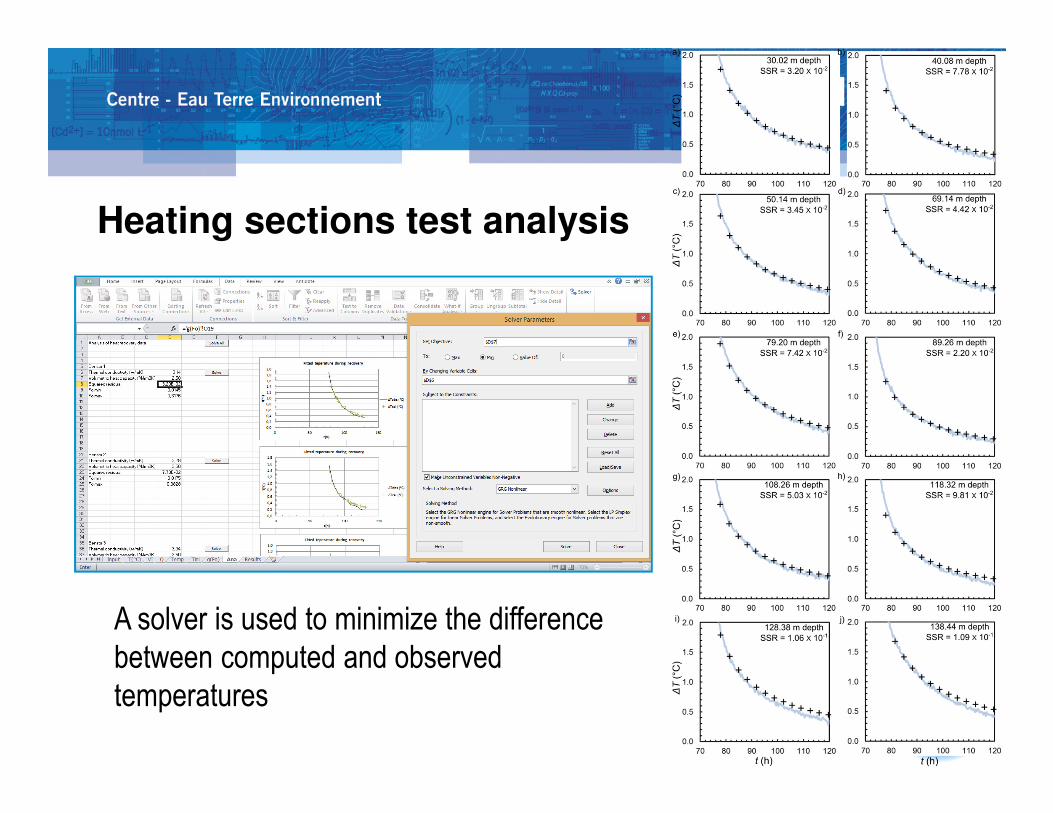
A solver is used to minimize the difference between computed and observed temperatures
Heating sections test analysis

Raymond and Lamarche 2014

Time for
temperature
to become
uniform
ΔT < 0.1 °C within r ≤ 0.042 m
Raymond et al. 2014

Numerical
validation
with analysis
of simulated
tests
Raymond et al. 2014

Perforated disks to block water convection
Field experiments and numerical simulations conducted to evaluate the disk impacts
Raymond et al. 2014

Perforated disks to block water convection
Raymond et al. 2014
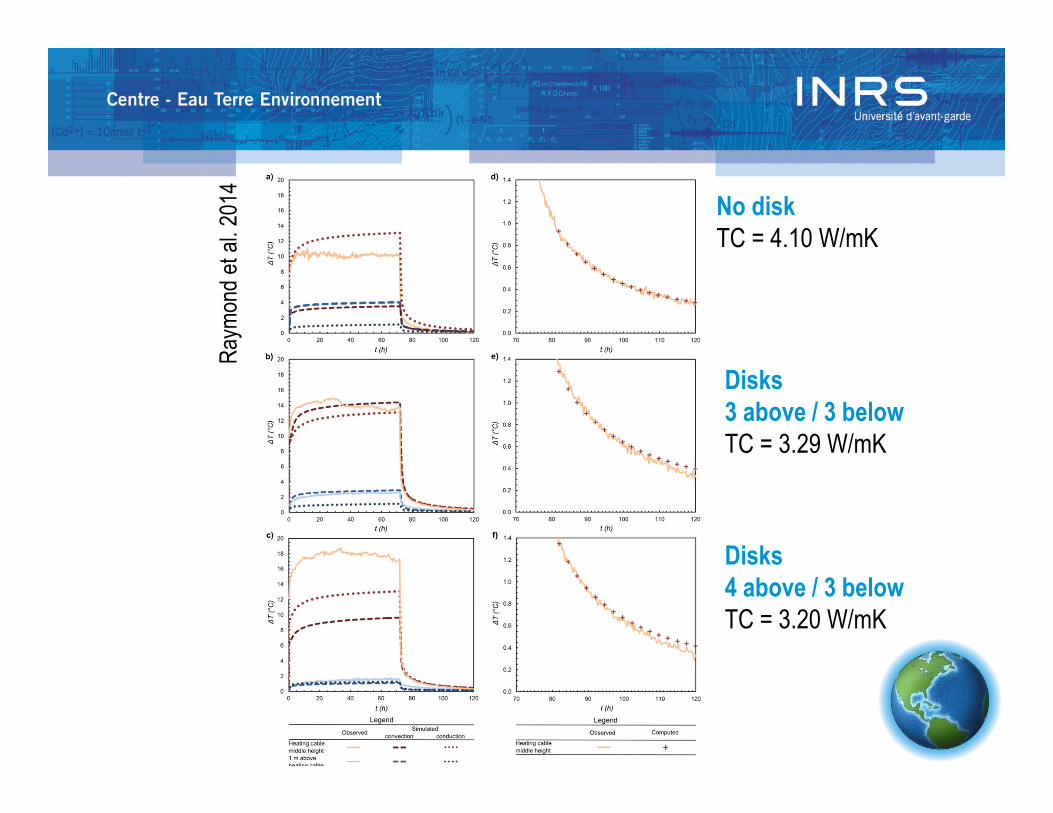
Raymond et al. 2014 No disk
TC = 4.10 W/mK
Disks
3 above / 3 below
TC = 3.29 W/mK
Disks
4 above / 3 below
TC = 3.20 W/mK

• Bulk TC from conventional test3.00 W/mK
• Average TC from heating sections test 3.35 W/mK
Test with 10
heating sections
at Versaprofile
factory

Possible explanations for differences
in bulk and average TC
• Change of the groundwater flow regime• Bedrock is fractured, bottom of hole collapsed• Site topography – 3.3 % slope• Conventional test – Jan 2009• Heating section test – Nov 2013
• Thermal conductivity measurement in the sandy overburden (low TC) was not performed with the heating sections test
• TC values are local estimates
www.geosurvey.state.co.us

Energy consumed during the conventional
and heating sections tests (72 h)
• Conventional • 66.5 W m-1
• 9308 W• 670 kWh
• Heating sections • 32 W m-1
• 105.6 V• 8.0 A• 61 kWh
~9 %~9 %~9 %~9 %

Comparison of various TRT technologies
Conventional
TRT
Flowing
SensorFiber optic
Heating
sections
Thermo-
stratigraphy
Data profiling No Yes Yes Yes Yes
Test time hh hh hhh hhh h
Time spent in the field hh hh hh h h
Equipment weight +++ +++ +++ + -
Equipment complexity ++ +++ ++++ + -
Power requirement High High High Low None
Cost $$$ $$$$ $$$$$ $$ $
Spatial restriction No No No No Yes
Measured parameters T0, λs, R’bh T0, λs T0, λs, R’bh T0, λs T0, λs
Analysis methodInfinite heat
source
Infinite heat source
(assumed)
Infinite heat source
Finite heat source
Earth’s heat flow modeling

Possible market outlets for the heating sections test
• Alternative TRT to design ground source heat pump systems• Low cost• Light equipment• Provides TC profile to identify favorable layers
to reduce bore length
• Assessment of the Earth’s heat flow for theexploration of deep geothermal resources
Bla
ckw
ell
and R
ichard
s 2
004
z
Tq
∂
∂−=
sλ

Exploration for high temperature reservoirs
of hydrothermal systems
• Shallow (2-20 m depth) temperature surveys are carried out to identify thermal anomalies
• A screening method before spending M$ in deep boreholes• Difficultly applicable to subtle thermal anomalies of low-temperature
sedimentary basins – heating sections tests could be an alternativeZehner et al. 2012
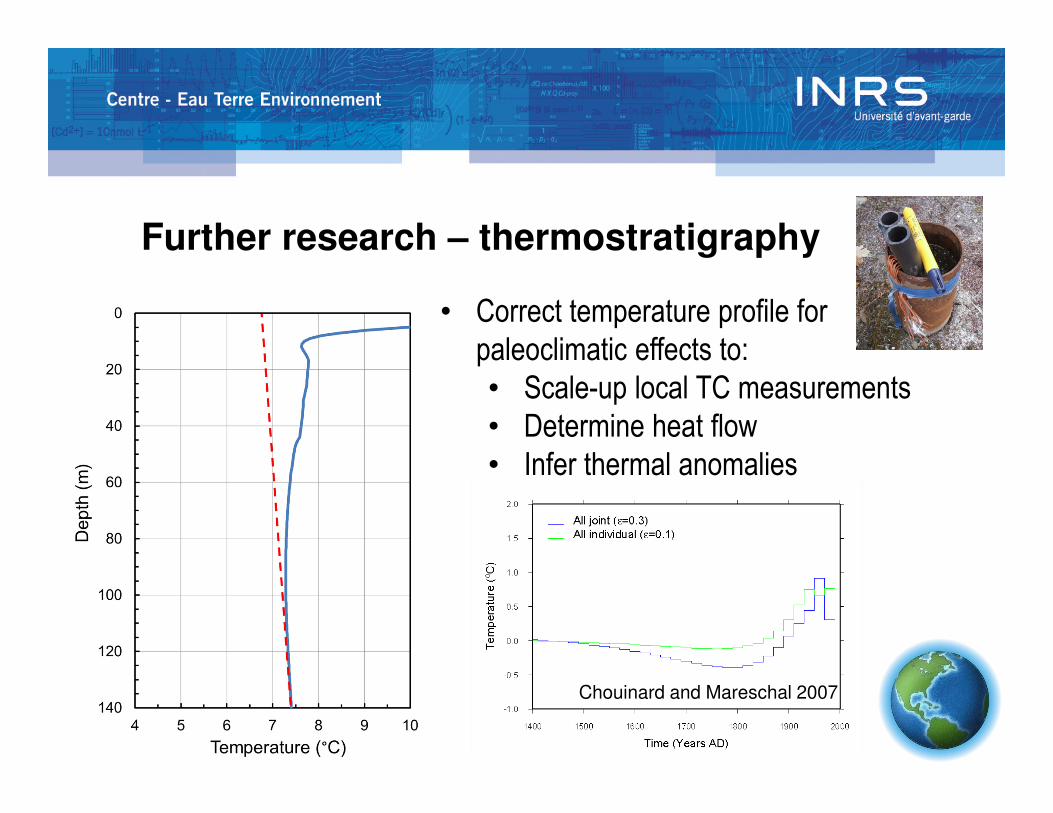
Further research – thermostratigraphy
• Correct temperature profile for paleoclimatic effects to:• Scale-up local TC measurements• Determine heat flow• Infer thermal anomalies
Chouinard and Mareschal 2007