insight report the human capital report 2016
TRANSCRIPT
The Human Capital Report 2016
Insight Report

Insight Report
The HumanCapital Report2016
© World Economic Forum
2016—All rights reserved.
No part of this publication may be
reproduced or transmitted in any form or
by any means, including photocopying and
recording, or by any information storage
and retrieval system.
ISBN 978-1-944835-02-6
TERMS OF USE AND DISCLAIMER
The Human Capital Report 2016 (herein: “Report”) presents
information and data that were compiled and/or collected by the
World Economic Forum (all information and data referred herein as
“Data”). Data in this Report is subject to change without notice.
The terms country and nation as used in this Report do not in
all cases refer to a territorial entity that is a state as understood
by international law and practice. The term covers well-defined,
geographically self-contained economic areas that may not be
states but for which statistical data are maintained on a separate
and independent basis.
Although the World Economic Forum takes every reasonable
step to ensure that the Data thus compiled and/or collected is
accurately reflected in this Report, the World Economic Forum,
its agents, officers, and employees: (i) provide the Data “as is,
as available” and without warranty of any kind, either express or
implied, including, without limitation, warranties of merchantability,
fitness for a particular purpose and non-infringement; (ii) make no
representations, express or implied, as to the accuracy of the Data
contained in this Report or its suitability for any particular purpose;
(iii) accept no liability for any use of the said Data or reliance placed
on it, in particular, for any interpretation, decisions, or actions based
on the Data in this Report.
Other parties may have ownership interests in some of the Data
contained in this Report. The World Economic Forum in no way
represents or warrants that it owns or controls all rights in all Data,
and the World Economic Forum will not be liable to users for any
claims brought against users by third parties in connection with their
use of any Data.
The World Economic Forum, its agents, officers, and employees
do not endorse or in any respect warrant any third-party products
or services by virtue of any Data, material, or content referred to or
included in this Report.
Users shall not infringe upon the integrity of the Data and in
particular shall refrain from any act of alteration of the Data that
intentionally affects its nature or accuracy. If the Data is materially
transformed by the user, this must be stated explicitly along with
the required source citation.
For Data compiled by parties other than the World Economic
Forum, users must refer to these parties’ terms of use, in
particular concerning the attribution, distribution, and
reproduction of the Data.
When Data for which the World Economic Forum is the source
(herein “World Economic Forum”) is distributed or reproduced, it
must appear accurately and be attributed to the World Economic
Forum. This source attribution requirement is attached to any use
of Data, whether obtained directly from the World Economic Forum
or from a user.
Users who make World Economic Forum Data available to other
users through any type of distribution or download environment
agree to make reasonable efforts to communicate and promote
compliance by their end users with these terms.
Users who intend to sell World Economic Forum Data as part
of a database or as a standalone product must first obtain
the permission from the World Economic Forum
iiiThe Human Capital Report 2016
Preface v
The Human Capital Report 2016 1
MEASURING HUMAN CAPITAL 1
Methodology 2
RESULTS AND ANALYSIS 2
Top ten 2Major economies 3
RESULTS BY REGION AND INCOME GROUP 7
East Asia and the Pacific 9Eastern Europe and Central Asia 9Latin America and the Caribbean 9Middle East and North Africa 9North America 10South Asia 10Sub-Saharan Africa 11Western Europe 12
GLOBAL HUMAN CAPITAL TRENDS 13
MAXIMIZING LEARNING AND EMPLOYMENT 14
IN THE FOURTH INDUSTRIAL REVOLUTION
LEARNING THROUGH THE LIFE-COURSE 15
Understanding skills diversity 17Preparing talent for the future 21
EMPLOYMENT THROUGH THE LIFE-COURSE 22
Types of employment 24Digitization of labour markets 24
CONCLUSIONS 28
REFERENCES 29
NOTES 30
APPENDIX 33
Technical Notes and User’s Guide 33Structure and weighting of the Human Capital Index, 2016 34
System Initiative Partners 35
System Initiative Stewards 37
Acknowledgements 39
Contents


vThe Human Capital Report 2016
The Fourth Industrial Revolution will lead to profound shifts across all industries, reshaping production, consumption, transportation and delivery systems, among other factors. At the same time, the very nature of work is changing, in part due to new technologies and their subsequent impact on business models, and in part because of new platforms that allow talent to connect to markets in wholly new ways.
Managing these transitions for optimal outcomes for our societies will require visionary leadership and a wide range of new knowledge and skills. The development of relevant talent will determine whether we all partake in the opportunities of the Fourth Industrial Revolution or experience its disruptions as bystanders. Much as these new technologies are disrupting labour markets, they also provide the potential to change how we learn throughout our lifetimes, how we educate the next generation and how we re-train those that are facing declining returns to their skills. They are also providing robust new data and metrics that allow us to understand the changes underway and manage them better.
This year’s Human Capital Report aims to combine public international statistics, qualitative perception data and big data metrics to provide a comprehensive picture of the situation today as well as the opportunities for the future. The Human Capital Index quantifies how 130 countries are developing and deploying their human capital, and tracks progress over time. It takes a life-course approach to human capital, evaluating the levels of education, skills and employment available to people in five distinct age groups. In addition to the Index, the Report also explores skills in-depth through a unique partnership with LinkedIn and the emerging shape of the labour market on digital platforms, using data from Care.com, Didi Chuxing, Uber and Upwork.
The leadership of governments, business leaders and educational institutions, and collaboration between them, is vital to strengthening the global talent value chain. The World Economic Forum’s System Initiative on Education, Gender and Work provides a platform for dialogue and collaboration between these stakeholders as well as a hub for the latest insights on the issue. In addition to the Human Capital Report, the Initiative provides a range of other tools for mapping current outcomes, forecasts and best practices, shedding light on the talent system broadly as well as specific aspects of it. The Initiative also serves as a platform to act on these findings, by engaging leaders in public-private partnerships to address education, gender and employment issues across regions and industries. Additionally, the Initiative offers a space for dialogue between leaders to develop trust and manage change.
We would like to express our appreciation to Till Leopold, Vesselina Ratcheva, Richard Samans and Saadia Zahidi for their leadership of this Report, and to the broader Education, Gender and Work team for their support to this project. We appreciate the unique data collaboration with LinkedIn, under the direction of Lutz Finger, as well as the input from other partners. Finally, we welcome the leadership and guidance of the Partners and Stewards of the Education, Gender and Work System Initiative and their commitment to addressing talent issues globally.
Investing in human capital goes beyond an economic necessity: it is the basis for all individuals to live up to their full potential. It is our hope that this latest edition of the Report and the platform offered by the Education, Gender and Work System Initiative will serve as a catalyst for unified leadership to positively shape the future of this system, unlocking the world’s latent talent, and, as such, ensure the progress of economies and societies alike.
PrefaceKLAUS SCHWAB
Founder and Executive Chairman, World Economic Forum

1The Human Capital Report 2016
MEASURING HUMAN CAPITALA nation’s human capital endowment—the knowledge and skills embodied in individuals that enable them to create economic value1—can be a more important determinant of its long-term success than virtually any other resource. This resource must be invested in and leveraged efficiently in order for it to generate returns—for the individuals involved as well as an economy as a whole. Because human capital is critical not only to the productivity of society but also the functioning of its political, social and civic institutions, understanding its current state and capacity is valuable to a wide variety of stakeholders.
The Human Capital Index seeks to serve as a tool for capturing the complexity of education, employment and workforce dynamics so that various stakeholders are able to make better-informed decisions. Last year’s edition of the World Economic Forum’s Human Capital Report explored the factors contributing to the development of an educated, productive and healthy workforce. This year’s edition deepens the analysis by focusing on a number of key issues that can support better design of education policy and future workforce planning.
The global human capital landscape is becoming ever more complex and evolving ever more rapidly. Approximately 25,000 new workers will enter the labour market in the developing world every day until 2020, and more than 200 million people globally continue to be out of a job; yet, simultaneously, there is an expected shortage of some 50 million high-skilled job applicants over the coming decade. We also still live in a world in which there are 90 million children without access to primary school, 150 million children unable to attend secondary school and hundreds of millions of young people who cannot afford to go to university, while the world is experiencing a shortage of 4 million qualified teachers per year.2
A new wave of technological innovation—a Fourth Industrial Revolution—will bring radical change to industries and labour markets worldwide.3 For example, some of the fastest adopters of industrial robots now are emerging economies such as China and the Republic of Korea. With a 24-hour working day, the payback period is now 1.5 years in China, versus 10 years not long ago.4 Though countries such as Singapore have had 30 years to develop through a strategy of continuous skills upgrading via export manufacturing in global value chains, China successfully did the same over the past 20 years. Countries in South Asia and Sub-Saharan Africa might have a remaining window of opportunity of at most 10 years before technology permanently closes the door on such strategies.5
The Human Capital Report 2016
At the same time ubiquitous mobile internet is leading to the emergence of a truly global labour market for the first time. Digital talent platforms have the potential to empower millions of poor and marginalized workers to access the global labour market as never before. This new jobs landscape—where work is global, even if workers are not—can create opportunities for developing countries to leapfrog technological development stages by equipping their workforces to directly tap into the global labour market.
Above all, the transition from education to employment has become fraught with uncertainty around the world. There is a pressing need to break down the divide between ministries of labour and education, and between the global education and employment conversations. Business has a critical role in stepping up investment in education, as well as clearly spelling out desired curriculum outcomes. As today’s economies become ever more knowledge-based, technology-driven and globalized, and because we simply don’t know what the jobs of tomorrow will look like, there is also a growing recognition that we have to prepare the next generation with the capacity for lifelong learning.6 The idea of a one-time education providing people with a lifelong skillset is a thing of the past.
The Human Capital Index takes a life-course approach to human capital, evaluating the levels of education, skills and employment available to people in five distinct age groups, starting from under 15 years to over 65 years. The aim is to assess the outcome of past and present investments in human capital and offer insight into what a country’s talent base will look like in the future. The Index provides country rankings that allow for effective comparisons across regions and income groups. The methodology behind the rankings is intended to serve as a basis for time-series analysis that allows countries to track progress, relative to their own performance as well as that of others. Supplementing the Index, the Country Profiles, available on the Report website, provide detailed, indicator-level information for all countries included in the Index.
As a special feature of this year’s Report, our analysis also makes use of a range of unique data on newly emerging digital labour markets and the platform economy, in collaboration with LinkedIn and a number of other partner companies.
In pointing to learning and employment outcome gaps, demographic trends and untapped talent pools, it is our hope that this Report can support governments, businesses, education providers and civil society institutions identifying key areas for focus and investment. All of these entities have a stake in human capital development, whether their primary goal is to power their

2 The Human Capital Report 2016
businesses, strengthen their communities or create a population that is better able to contribute to and share in the rewards of growth and prosperity. The Report also aims to foster public-private collaboration between sectors—as practically demonstrated by its innovative data partnership—ultimately reframing the debate around employment, skills and human capital from today’s focus on problems and challenges towards the opportunities for collaboration that fully leveraging the human capital potential residing in people’s skills and capacities can bring.
MethodologyThe Human Capital Index is among the set of knowledge tools provided by the World Economic Forum as part of its System Initiative on Education, Gender and Work. The System Initiative produces analysis and insights focused on forecasting the future of work and skills across countries and industry sectors as well as best practices from businesses that are taking the lead in addressing skills gaps and gender gaps. The System Initiative also creates dialogues and public-private collaboration on education, gender and work in several regions of the world and within industry groups.
The Human Capital Index ranks 130 countries on how well they are developing and deploying their human capital potential. The Index assesses Learning and Employment outcomes on a scale from 0 (worst) to 100 (best) across five distinct age groups to capture the full demographic profile of a country:
• 0–14 years – the youngest members of the population for whom education is assessed among the most critical factors
• 15–24 years – youth for whom factors such as higher education and skills use in the workplace are assessed
• 25–54 years – the bulk of the labour force, for whom continued learning and employment quality are assessed
• 55–64 years – the most senior members of most workforces for whom attainment and continued engagement are assessed
• 65 and over years – the oldest members of the population, for whom both continued opportunity and health are assessed
The generational lens sheds light on age-specific patterns of labour market exclusion and untapped human capital potential. In total, the Human Capital Index covers 46 indicators. Values for each of the indicators come from publicly available data compiled by international organizations such as the International Labour Organization (ILO); the United Nations Educational, Scientific and Cultural Organization (UNESCO); and the World Health Organization (WHO). In addition to hard data, the Index uses a limited set of qualitative survey data from the World Economic Forum’s Executive Opinion Survey. The methodology also allows for comparisons within a country as well as between countries. For a detailed explanation of the Index methodology, please refer to the Technical Notes on the Report website.
This chapter consists of three core sections. The first section covers the overarching results of the Human Capital Index, paying particular attention to high-performing and major economies. This section also examines the results through the prism of regional and income groupings, placing economies’ performance in context. Sections two and three review the two horizontal sub-themes of the Index—Learning and Employment—and consider their variation by age group segments as well as how to prepare for the future.
Specifically, the second section explores the gap between average Learning scores of those over and under age 25, with a focus on skills diversity upon graduation from university and as an aspect of the skills gained at work. The section’s exploration of skills for the future of work considers different strategies for expanding and nurturing talent as well as hiring pools.
The third section considers the structure of the global workforce across the age group spectrum and highlights particular trends in types of employment across geographies. It highlights the effects of technological disruptions on both regular and own-account work, putting a specific spotlight on “gig workers”.
RESULTS AND ANALYSISLong-term human capital investment and planning is not just crucial at the individual country level, but increasingly demands political leadership at the highest international level to move beyond zero-sum competition and prepare the world’s workforce for the challenges of the 21st century. Issues of global talent mobility and migration call for a coordinated approach to minimize risks and unlock opportunities for individuals and economies as a whole. Many education systems and skills accreditation standards remain primarily national in outlook. Moreover, equipping nations’ young and working-age populations with the education and skills to thrive in the Fourth Industrial Revolution will require collaboration beyond industry sectors and borders. The Human Capital Index seeks to serve as a benchmarking tool for such efforts so that various stakeholders are able to take better-informed decisions.
Detailed results for all 130 countries ranked by the Index are shown in Table 1 (pages 4–5). The appendix provides a full overview of the structure of the Human Capital Index. Please refer to the Report website, for comprehensive ranking tables by age group, regional group and income group. Also available on the Report website are individual Country Profiles providing detailed, indicator-level results and information for all countries included in the Index, as well as a Country Profile User’s Guide and Technical Notes on the Index methodology.
Top TenThis year’s edition of the Human Capital Index sees no new entrants to or dropouts from its top 10 list, although there are some notable rank changes. The Index continues to be dominated by smaller European countries, particularly the Nordics and Benelux states, with two countries from the East Asia and the Pacific region and one country from the North America region also making the cut. The leaders of the Index are high-income economies that have placed

3The Human Capital Report 2016
importance on high educational attainment and putting a correspondingly large share of their workforce in high-skilled occupations.
The top three remains unchanged from last year, with Norway (2) and Switzerland (3) almost drawing level this year and gaining ground on Finland’s (1) top position. All three countries are effectively developing and utilizing about 85% of their full human capital potential.
For the second year running, Finland (1) is the best-performing country in the world when it comes to building and leveraging its human capital potential, taking the top spot on the 0–14, 15–24 and 25–54 Age Group pillars, and scoring in the top 10 for the remaining age groups. The country benefits from a well-educated young population with a near-universal basic education survival rate and the highest score for the quality of primary schools. Its 25–54 age group core working population shows the highest tertiary educational attainment rate in the Western Europe region and fourth best overall in the world. Based on the World Economic Forum’s Executive Opinion Survey, Finland is also the country with the highest overall score on the Ease of finding skilled employees indicator, with even its 55-64 and 65 and over age groups possessing the world’s third highest attainment rate of tertiary education, highlighting the continuing long-term benefits of past human capital investments.
Norway (2) follows Finland in second place on the overall Index with a strong performance across all age groups, although it does not make it into the top 10 in the 0–14 Age Group pillar. The country possesses similar strengths as its Nordic neighbour and also the lowest unemployment rate in the Western Europe region for its 25–54 prime working age group.
The top three is completed by Switzerland (3), which benefits from the very high quality of its primary schools and of the education system as a whole—ranking first in the world this year on the latter—but also from a strong rate of vocational training and high level of skill diversity. Switzerland is also the best performing country on the Staff training, third best on the Economic complexity and third best in the world on the High-skilled employment share indicators.
Japan (4) rises one rank in this year’s Index on the back of its strong performance in the 55–64 and 65 and Over Age Group pillars—taking the top spot on both and boosted by the longevity and education of its older population. However, the country is held back by relatively low labour force participation in the prime working age group, in particular due to the country’s employment gender gap. It has achieved near-universal basic education and has a tertiary education attainment rate of over 50% for its working age population, ranking it first in the world. With the world’s highest aged-dependency ratio and second-highest healthy life expectancy, there is greater room for potential by closing the gender gap and tapping into the skills of the older workforce, particularly as labour force participation falls from 85% in the 25–54 Age Group to 71% for the 55–64 Age Group.
New Zealand (6), the other country in the top 10 from the East Asia and the Pacific region, rises three ranks this year and places in the top 10 for all age groups
except for the 25–54 Age Group pillar, due in particular to a comparatively lower Economic complexity indicator score and labour force participation rate. It ranks second on the 55–64 Age Group pillar due to its high educational attainment and the age group’s active participation in the labour force.
Sweden (5) also rises one rank in this year’s Index, slightly outperforming its neighbour Denmark (7), although both countries have strong results across all age group pillars.
The Netherlands (8) and Belgium (10) maintain their respective rankings. Both countries have strong scores in the younger age group pillars but are penalized by relatively low labour force participation and a relatively high unemployment rate among the 55–64 and 65 and over age groups, despite strong health and education results.
Canada (9), the only North American country in the top 10, drops five ranks this year—due to a multi-year data update concerning the country’s 15-24 Age Group pillar—but maintains a strong showing particularly in the three older age groups. With the world’s highest tertiary education attainment rates in the 55–64 and 65 and over age groups, a 65 and over age group labour force participation rate of 14%, and a healthy life expectancy above 70, Canada enables older workers who choose to remain active to do so, pointing to a high-skilled and productive ‘silver’ workforce in the country.
Major EconomiesWhile the Index demonstrates that many smaller economies perform exceptionally well with regard to nurturing and deploying their human capital potential—in fact dominating the top 10 of the Index—a sizeable share of the global workforce lives and works in a comparatively small number of major economies. Between them, the countries featured in this section of the Report make up 75% of the world’s population and contribute 85% of global gross domestic product (GDP). Like the wider geographic regions in which they are located, these countries exhibit a broad range of overall success in leveraging their human capital potential.
Following Japan (4) and Canada (9), Germany (11) and Singapore (13) are two notable risers in this year’s Human Capital Index on the back of strong performances on staff training, high rates of high-skilled employment and economic complexity, low rates of young people not in employment, education or training (NEET) and high healthy life expectancy among their older populations. While Germany ranks high on the Skill diversity (8th) indicator and the overall quality of its education system, it is held back by a low ranking on its basic education survival rate (89th). Both countries are tapping about 80% of their human capital potential.
Though France (17) performs strongly on the core working age 25-54 Age Group pillar (12th), it suffers from a high youth unemployment rate (placing it 95th in the world) and a 35% drop in labour force participation between the 25–54 and 55–64 age ranges. It is immediately followed in the Index by Australia (18), which ranks 5th in the world on the 15–24 Age Group pillar due to high tertiary enrolment rates and low numbers of young people not in employment, education or training. More than 90%

4 The Human Capital Report 2016
Overall index 0–14 Age Group 15–24 Age Group 25–54 Age Group 55–64 Age Group 65 and Over Age Group
Country Score Rank Score Rank Score Rank Score Rank Score Rank Score Rank
Finland 85.86 1 98.17 1 85.35 1 81.24 1 83.90 7 72.95 9
Norway 84.64 2 94.69 11 84.72 2 80.11 4 85.34 3 74.53 2
Switzerland 84.61 3 95.76 7 83.34 4 80.51 2 83.54 8 73.28 7
Japan 83.44 4 95.78 6 77.26 19 79.13 5 85.72 1 75.61 1
Sweden 83.29 5 93.25 14 81.03 9 80.17 3 84.58 4 70.43 16
New Zealand 82.79 6 95.20 9 82.25 7 76.25 17 85.70 2 74.07 3
Denmark 82.47 7 91.77 22 81.89 8 78.17 8 83.99 6 74.04 4
Netherlands 82.18 8 92.81 17 83.70 3 77.58 10 81.06 13 69.59 18
Canada 81.95 9 93.46 13 77.74 16 77.61 9 84.22 5 73.05 8
Belgium 81.59 10 95.29 8 78.25 13 77.55 11 78.33 27 68.32 23
Germany 81.55 11 89.56 38 79.78 10 78.39 7 83.31 9 73.54 6
Austria 81.52 12 92.29 20 82.41 6 76.75 15 79.06 23 72.00 12
Singapore 80.94 13 95.81 5 76.12 25 78.70 6 75.17 39 60.59 52
Ireland 80.79 14 95.87 4 75.84 29 76.32 16 78.16 28 67.77 26
Estonia 80.63 15 95.09 10 77.35 18 74.02 24 82.98 10 71.77 13
Slovenia 80.33 16 92.90 16 79.13 12 75.30 20 77.04 32 71.39 14
France 80.32 17 93.07 15 76.00 26 77.32 12 77.59 30 66.32 31
Australia 80.08 18 91.36 24 82.56 5 74.33 22 80.85 15 67.27 27
United Kingdom 80.04 19 91.91 21 76.64 22 76.78 14 79.07 22 66.43 30
Iceland 79.74 20 93.85 12 79.63 11 75.78 18 74.62 40 60.30 54
Lithuania 79.34 21 92.38 19 75.87 28 74.25 23 81.24 12 68.30 24
Luxembourg 79.28 22 91.33 26 73.46 36 77.24 13 75.74 36 66.45 29
Israel 78.99 23 89.56 37 76.75 21 75.39 19 79.78 20 67.05 28
United States 78.86 24 88.97 39 75.99 27 74.91 21 80.62 16 70.32 17
Czech Republic 78.45 25 89.66 36 77.49 17 73.72 25 78.43 25 68.38 22
Ukraine 78.42 26 90.73 28 78.04 15 71.83 32 79.14 21 72.21 10
Latvia 78.13 27 88.79 41 76.24 24 72.79 27 80.58 17 72.10 11
Russian Federation 77.86 28 86.95 53 78.21 14 72.74 28 80.46 18 71.14 15
Kazakhstan 77.57 29 91.01 27 75.45 30 70.91 36 80.95 14 68.78 21
Poland 77.34 30 90.66 29 74.67 34 72.53 29 76.12 34 65.61 32
Cyprus 76.97 31 91.33 25 71.05 52 73.36 26 74.23 45 63.98 36
Korea, Rep. 76.89 32 90.34 31 75.39 32 71.68 34 78.42 26 61.64 45
Hungary 76.36 33 87.56 45 73.00 41 71.72 33 78.11 29 68.83 20
Italy 75.85 34 92.77 18 71.82 49 69.25 39 75.95 35 62.95 41
Malta 75.66 35 87.49 47 73.31 37 72.09 31 73.22 50 63.13 39
Cuba 75.55 36 96.87 2 75.00 33 67.80 47 72.49 54 50.94 81
Armenia 75.39 37 87.49 48 69.96 56 68.76 43 81.84 11 74.01 5
Romania 74.99 38 87.30 51 72.42 42 69.01 42 77.47 31 68.18 25
Croatia 74.99 39 90.64 30 72.06 46 69.17 40 72.54 53 62.68 42
Slovak Republic 74.94 40 85.01 60 72.36 43 71.13 35 76.58 33 65.36 33
Portugal 74.39 41 88.91 40 72.16 45 70.46 37 68.10 70 58.98 58
Malaysia 74.26 42 87.51 46 76.78 20 72.13 30 70.03 65 42.36 106
Bulgaria 73.66 43 78.49 83 73.26 40 70.21 38 80.27 19 69.43 19
Greece 73.64 44 88.43 42 71.18 51 68.33 45 71.42 56 60.37 53
Spain 72.79 45 87.31 50 69.07 60 68.35 44 71.06 59 58.02 63
Bahrain 72.69 46 90.11 33 66.47 70 69.08 41 69.33 68 51.35 79
Kyrgyz Republic 72.35 47 83.64 67 74.44 35 65.13 52 75.58 37 65.01 35
Thailand 71.86 48 81.71 74 73.31 39 67.91 46 70.71 62 58.65 60
Philippines 71.75 49 81.41 75 71.01 54 66.62 49 74.46 42 65.34 34
Sri Lanka 71.69 50 91.44 23 67.12 65 62.34 66 72.91 51 63.47 37
Chile 71.45 51 83.17 70 73.31 38 64.60 54 74.55 41 61.50 47
Panama 71.18 52 79.64 80 72.02 47 66.16 50 75.27 38 63.44 38
Ecuador 70.84 53 85.57 58 76.25 23 60.58 76 73.49 48 61.75 43
Azerbaijan 70.72 54 83.18 68 61.65 87 66.66 48 78.85 24 60.93 50
Mongolia 70.71 55 87.42 49 66.84 67 63.19 63 73.64 46 59.81 56
Argentina 70.70 56 83.65 66 69.74 57 64.21 59 72.82 52 61.59 46
Serbia 70.54 57 88.22 43 65.17 75 64.67 53 70.00 66 54.91 69
Tajikistan 70.53 58 87.17 52 63.06 81 65.42 51 74.40 43 53.96 71
Macedonia, FYR 70.01 59 86.60 54 67.03 66 62.17 67 71.09 58 61.21 49
Uruguay 69.96 60 78.74 81 71.03 53 64.42 57 74.32 44 63.06 40
Barbados 69.78 61 95.92 3 55.62 108 63.96 60 63.30 82 50.71 83
Costa Rica 69.72 62 79.72 78 71.92 48 64.54 55 70.89 61 58.26 61
Moldova 69.67 63 82.97 71 68.83 62 62.95 65 73.51 47 58.69 59
Colombia 69.58 64 78.42 85 71.43 50 64.26 58 72.40 55 61.40 48
Mexico 69.25 65 82.03 73 68.60 63 63.60 62 69.35 67 58.06 62
Table 1: Human Capital Index 2016, detailed rankings
(Cont’d.)
5The Human Capital Report 2016
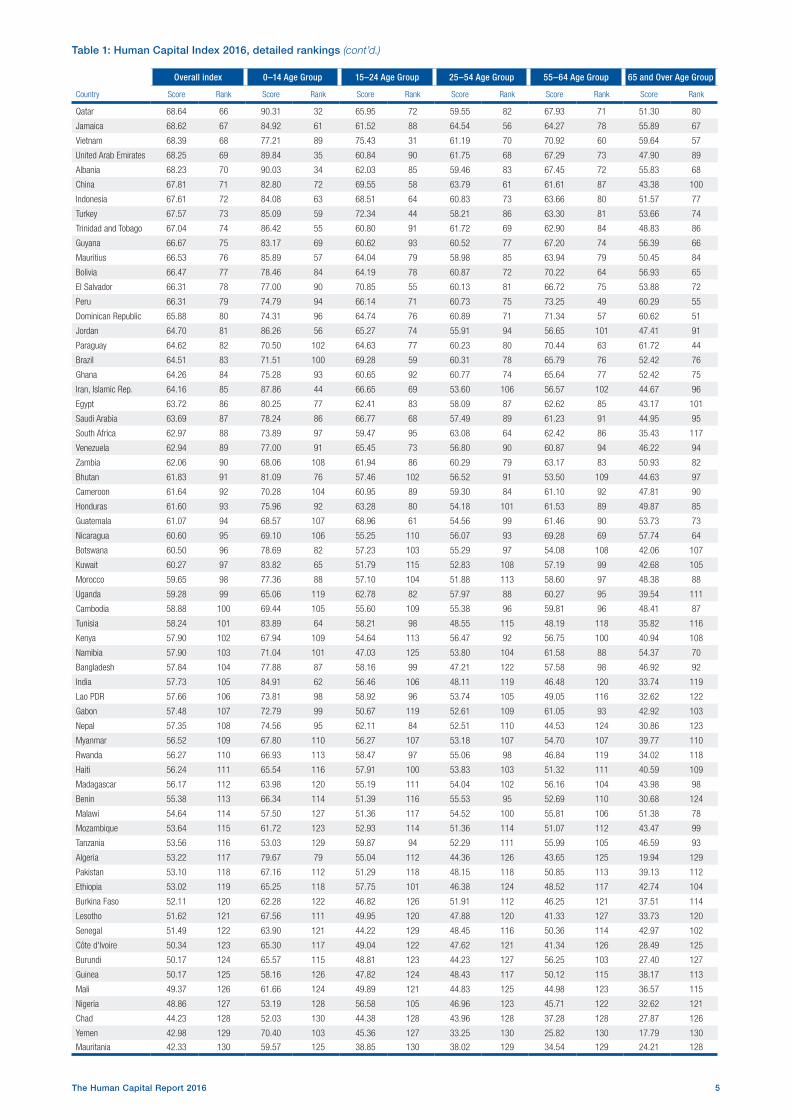
Table 1: Human Capital Index 2016, detailed rankings (cont’d.)
Overall index 0–14 Age Group 15–24 Age Group 25–54 Age Group 55–64 Age Group 65 and Over Age Group
Country Score Rank Score Rank Score Rank Score Rank Score Rank Score Rank
Qatar 68.64 66 90.31 32 65.95 72 59.55 82 67.93 71 51.30 80
Jamaica 68.62 67 84.92 61 61.52 88 64.54 56 64.27 78 55.89 67
Vietnam 68.39 68 77.21 89 75.43 31 61.19 70 70.92 60 59.64 57
United Arab Emirates 68.25 69 89.84 35 60.84 90 61.75 68 67.29 73 47.90 89
Albania 68.23 70 90.03 34 62.03 85 59.46 83 67.45 72 55.83 68
China 67.81 71 82.80 72 69.55 58 63.79 61 61.61 87 43.38 100
Indonesia 67.61 72 84.08 63 68.51 64 60.83 73 63.66 80 51.57 77
Turkey 67.57 73 85.09 59 72.34 44 58.21 86 63.30 81 53.66 74
Trinidad and Tobago 67.04 74 86.42 55 60.80 91 61.72 69 62.90 84 48.83 86
Guyana 66.67 75 83.17 69 60.62 93 60.52 77 67.20 74 56.39 66
Mauritius 66.53 76 85.89 57 64.04 79 58.98 85 63.94 79 50.45 84
Bolivia 66.47 77 78.46 84 64.19 78 60.87 72 70.22 64 56.93 65
El Salvador 66.31 78 77.00 90 70.85 55 60.13 81 66.72 75 53.88 72
Peru 66.31 79 74.79 94 66.14 71 60.73 75 73.25 49 60.29 55
Dominican Republic 65.88 80 74.31 96 64.74 76 60.89 71 71.34 57 60.62 51
Jordan 64.70 81 86.26 56 65.27 74 55.91 94 56.65 101 47.41 91
Paraguay 64.62 82 70.50 102 64.63 77 60.23 80 70.44 63 61.72 44
Brazil 64.51 83 71.51 100 69.28 59 60.31 78 65.79 76 52.42 76
Ghana 64.26 84 75.28 93 60.65 92 60.77 74 65.64 77 52.42 75
Iran, Islamic Rep. 64.16 85 87.86 44 66.65 69 53.60 106 56.57 102 44.67 96
Egypt 63.72 86 80.25 77 62.41 83 58.09 87 62.62 85 43.17 101
Saudi Arabia 63.69 87 78.24 86 66.77 68 57.49 89 61.23 91 44.95 95
South Africa 62.97 88 73.89 97 59.47 95 63.08 64 62.42 86 35.43 117
Venezuela 62.94 89 77.00 91 65.45 73 56.80 90 60.87 94 46.22 94
Zambia 62.06 90 68.06 108 61.94 86 60.29 79 63.17 83 50.93 82
Bhutan 61.83 91 81.09 76 57.46 102 56.52 91 53.50 109 44.63 97
Cameroon 61.64 92 70.28 104 60.95 89 59.30 84 61.10 92 47.81 90
Honduras 61.60 93 75.96 92 63.28 80 54.18 101 61.53 89 49.87 85
Guatemala 61.07 94 68.57 107 68.96 61 54.56 99 61.46 90 53.73 73
Nicaragua 60.60 95 69.10 106 55.25 110 56.07 93 69.28 69 57.74 64
Botswana 60.50 96 78.69 82 57.23 103 55.29 97 54.08 108 42.06 107
Kuwait 60.27 97 83.82 65 51.79 115 52.83 108 57.19 99 42.68 105
Morocco 59.65 98 77.36 88 57.10 104 51.88 113 58.60 97 48.38 88
Uganda 59.28 99 65.06 119 62.78 82 57.97 88 60.27 95 39.54 111
Cambodia 58.88 100 69.44 105 55.60 109 55.38 96 59.81 96 48.41 87
Tunisia 58.24 101 83.89 64 58.21 98 48.55 115 48.19 118 35.82 116
Kenya 57.90 102 67.94 109 54.64 113 56.47 92 56.75 100 40.94 108
Namibia 57.90 103 71.04 101 47.03 125 53.80 104 61.58 88 54.37 70
Bangladesh 57.84 104 77.88 87 58.16 99 47.21 122 57.58 98 46.92 92
India 57.73 105 84.91 62 56.46 106 48.11 119 46.48 120 33.74 119
Lao PDR 57.66 106 73.81 98 58.92 96 53.74 105 49.05 116 32.62 122
Gabon 57.48 107 72.79 99 50.67 119 52.61 109 61.05 93 42.92 103
Nepal 57.35 108 74.56 95 62.11 84 52.51 110 44.53 124 30.86 123
Myanmar 56.52 109 67.80 110 56.27 107 53.18 107 54.70 107 39.77 110
Rwanda 56.27 110 66.93 113 58.47 97 55.06 98 46.84 119 34.02 118
Haiti 56.24 111 65.54 116 57.91 100 53.83 103 51.32 111 40.59 109
Madagascar 56.17 112 63.98 120 55.19 111 54.04 102 56.16 104 43.98 98
Benin 55.38 113 66.34 114 51.39 116 55.53 95 52.69 110 30.68 124
Malawi 54.64 114 57.50 127 51.36 117 54.52 100 55.81 106 51.38 78
Mozambique 53.64 115 61.72 123 52.93 114 51.36 114 51.07 112 43.47 99
Tanzania 53.56 116 53.03 129 59.87 94 52.29 111 55.99 105 46.59 93
Algeria 53.22 117 79.67 79 55.04 112 44.36 126 43.65 125 19.94 129
Pakistan 53.10 118 67.16 112 51.29 118 48.15 118 50.85 113 39.13 112
Ethiopia 53.02 119 65.25 118 57.75 101 46.38 124 48.52 117 42.74 104
Burkina Faso 52.11 120 62.28 122 46.82 126 51.91 112 46.25 121 37.51 114
Lesotho 51.62 121 67.56 111 49.95 120 47.88 120 41.33 127 33.73 120
Senegal 51.49 122 63.90 121 44.22 129 48.45 116 50.36 114 42.97 102
Côte d'Ivoire 50.34 123 65.30 117 49.04 122 47.62 121 41.34 126 28.49 125
Burundi 50.17 124 65.57 115 48.81 123 44.23 127 56.25 103 27.40 127
Guinea 50.17 125 58.16 126 47.82 124 48.43 117 50.12 115 38.17 113
Mali 49.37 126 61.66 124 49.89 121 44.83 125 44.98 123 36.57 115
Nigeria 48.86 127 53.19 128 56.58 105 46.96 123 45.71 122 32.62 121
Chad 44.23 128 52.03 130 44.38 128 43.96 128 37.28 128 27.87 126
Yemen 42.98 129 70.40 103 45.36 127 33.25 130 25.82 130 17.79 130
Mauritania 42.33 130 59.57 125 38.85 130 38.02 129 34.54 129 24.21 128
6 The Human Capital Report 2016
of its employment share is in medium- and high-skilled occupations.
The United Kingdom (19) exhibits a high tertiary attainment rate (33%) and high-skilled employment share (48%) for its 25–54 core working age group, but ranks 46th on the Incidence of overeducation indicator and 33rd for its vocational enrolment rate, indicating that there might be room for improvement with regard to recognizing alternative education paths.
The United States (24) trails Europe’s three biggest economies largely due to relative weaknesses in primary and secondary enrolment rates and the quality of primary education. However, the United States also records an impressive tertiary enrolment rate (4th globally), a continuation of the high proportion of those who already attained tertiary education across the country’s older age groups.
The Russian Federation (28), too, benefits from very high levels of primary, secondary and tertiary education attainment across all of its age groups, but has a low healthy life expectancy of only 61 years (86th globally) and underperforms with regard to the employment dimension.
Korea, Rep. (32) ranks second in the world for its near-universal tertiary enrolment rate. Unlike for the other top performers in the East Asia and Pacific region, however, business perceptions of the overall quality of its education system are undistinguished (59th), and the country also ranks comparatively low in the ease of finding skilled employees and its labour force participation rate, due in part to a rather large employment gender gap. Like the major economies ranked ahead of it, the Republic of Korea scores in the mid-70% range of the Index.
Italy (35) is held back by a low youth labour force participation rate (123rd) and high youth unemployment rate (122nd) for its 15–24 Age Group pillar, and scores poorly on the quality of its on-the-job staff training (119th). The country does, however, perform rather better on the secondary enrolment and basic education survival rates of its younger 0–14 age group as well as on the skill diversity of its graduates. Spain (45), shares the overall human capital profile of its Mediterranean neighbours and reports the second highest 15–24 age group unemployment rate measured in the Index (53.2%), despite its exceptionally high level of graduates’ skill diversity (1st globally).
Several of Latin America’s major economies are in the mid-range of this year’s Index. Chile (51) benefits significantly from a well-educated and healthy older population that remains economically active well into the age of 55–64, compared to other countries in the region. Its 25–54 prime working age group also boasts the highest tertiary education attainment rate in Latin America (10th globally), with one in three people in this age group having completed university. In line with this, Chile’s 15–24 age group continues to have a very high university enrolment rate (8th), with a diverse range of subjects studied. Argentina (56) shares the former’s high tertiary enrolment rate. Both countries, however, also exhibit a rather high unemployment rate in the 15–24 age group.
Colombia (64), performs best when it comes to the educational attainment and tertiary and vocational
0 20 40 60 80 100
MauritaniaYemen
ChadNigeria
MaliGuinea
BurundiCôte d'Ivoire
SenegalLesotho
Burkina FasoEthiopiaPakistan
AlgeriaTanzania
MozambiqueMalawi
BeninMadagascar
HaitiRwanda
MyanmarNepal
GabonLao PDR
IndiaBangladesh
NamibiaKenya
TunisiaCambodia
UgandaMorocco
KuwaitBotswanaNicaraguaGuatemalaHonduras
CameroonBhutanZambia
VenezuelaSouth AfricaSaudi Arabia
EgyptIran, Islamic Rep.
GhanaBrazil
ParaguayJordan
Dominican RepublicPeru
El SalvadorBolivia
MauritiusGuyana
Trinidad and TobagoTurkey
IndonesiaChina
AlbaniaUnited Arab Emirates
VietnamJamaica
QatarMexico
ColombiaMoldova
Costa RicaBarbadosUruguay
Macedonia, FYRTajikistan
SerbiaArgentinaMongolia
AzerbaijanEcuadorPanama
ChileSri Lanka
PhilippinesThailand
Kyrgyz RepublicBahrain
SpainGreece
BulgariaMalaysiaPortugal
Slovak RepublicCroatia
RomaniaArmenia
CubaMalta
ItalyHungary
Korea, Rep.CyprusPoland
KazakhstanRussian Federation
LatviaUkraine
Czech RepublicUnited States
IsraelLuxembourg
LithuaniaIceland
United KingdomAustralia
FranceSloveniaEstoniaIreland
SingaporeAustria
GermanyBelgiumCanada
NetherlandsDenmark
New ZealandSweden
JapanSwitzerland
NorwayFinland
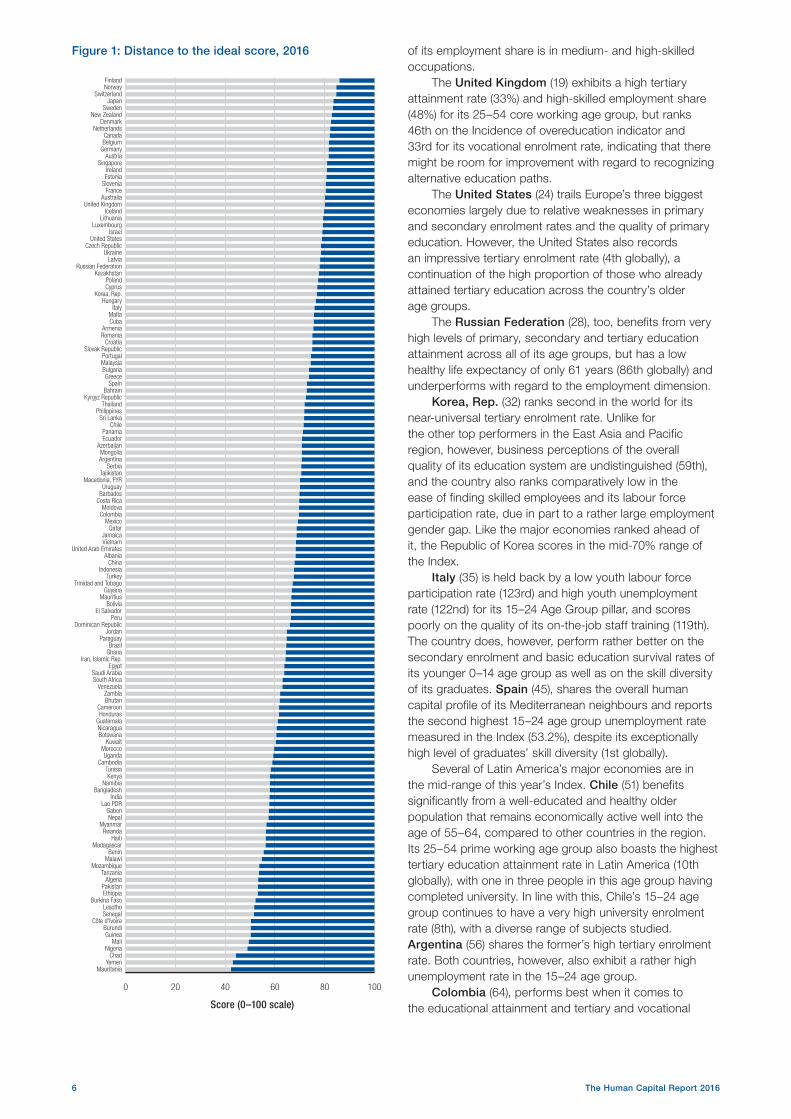
Figure 1: Distance to the ideal score, 2016
Score (0–100 scale)

7The Human Capital Report 2016
enrolment of its 15–24 age group. However, the country also exhibits a big skills mismatch, with one in three 15–24 year-old Colombians currently classified as overeducated for their work. The country comes in one rank ahead of Mexico (65), which rounds out the better-performing countries in the region, although with some distance behind the top group. This is mostly due to a relatively less well-educated population across all age pillars. More positively, Mexico reports a relatively low level of unemployment, even among its youth. Both countries are falling just short of maximizing 70% of their human capital potential.
The United Arab Emirates (69) ranks well ahead of other major economies in the Middle East and North Africa region, benefitting significantly from the strong perceived quality of its primary schools (13th) and overall education system (12th); but it also reports some of the lowest tertiary and vocational enrolment rates in the Index in the 15–24 age group.
China (71) similarly ranks in the mid-range of the overall Index scores, well ahead of the other BRICS nations except for the Russian Federation. Its younger population fares significantly better than its 55–64 and 65 and over age groups as a result of increasing educational attainment in the population. It also scores comparatively well on the Ease of finding skilled employees (39th), Vocational enrolment (29th) and Economic complexity (18th) indicators, setting the country up well for the future.
Rounding off the upper midfield of the Index with scores in the high 60% range are Indonesia (72), which has exhibited a rapid expansion of educational attainment similar to China across its younger age groups and good grades for local staff training (31st globally), and Turkey (73), which has strong tertiary and vocational enrolment rates among its 15–24 age group. Both countries are held back, however, by comparatively low labour participation rates for their 25–54 prime working age population (ranking 100th and 120th, respectively), due in large part to significant employment gender gaps.
Brazil (83), the Latin American region’s largest economy, ranks in the lower half of the Index, with a poor performance on the Basic education survival rate (98th) and Quality of primary education (118th) indicators for its 0–14 age group in particular. Local businesses perceive it as very difficult to hire skilled employees (114th), although the country scores comparatively better on the quality of its on-the-job staff training and a low unemployment rate for its core 25–54 and older age groups.
Egypt (86) and Saudi Arabia (87), the Middle East and North Africa region’s two most populous economies, are nearly tied in the Index. While Egypt ranks somewhat better on vocational enrolment, the overall quality of Saudi Arabia’s education system (42nd) is perceived as much better than Egypt’s (126th), which ranks near the bottom on this indicator. Both countries suffer from high youth unemployment rates and have high employment gender gaps, despite good rankings for tertiary enrolment and attainment and skill diversity, pointing to both countries’ additional untapped human capital potential.
Immediately following is South Africa (88), the Sub-Saharan African region’s second largest economy.
The country has the highest share of its workforce in high-skilled occupations on the continent (49th overall). However, based on business executives’ perceptions in the country, South Africa is ranked 101st for its ease of finding skilled employees and also receives poor marks for the quality of its education system (125th) and struggles with achieving universal primary and secondary school enrolment. While staff training in the country is well regarded (19th globally), the country ranks third in the region overall, four ranks behind Ghana (84), with an overall human capital score in the lower 60% range.
India (105) ranks at the top of the bottom quartile of the Index. Although the country’s educational attainment has improved markedly over the different age groups, its youth literacy rate is still only 90% (103rd globally), well behind the rates of other leading emerging markets. India also ranks poorly on labour force participation, due in part to one of the world’s largest employment gender gaps (121st). More positively, it receives solid rankings on Quality of education system (39th), Staff training (46th) and Ease of finding skilled employees (45th) indicators, suggesting a primary avenue for improvement for the country consists in expanding access to its numerous learning and employment opportunities.
Joining India at the bottom-range of the Index are South Asia’s two other most populous nations, Bangladesh (104) and Pakistan (118), due to poor performances on educational outcomes throughout all the Age Group pillars, and despite a comparatively high tertiary attainment rate among the former’s older population.
The lowest-ranked major economy in the Index—ranked fourth from the bottom, ahead only of Chad, Yemen and Mauritania—is Nigeria (127), Sub-Saharan Africa’s largest economy and most populous country. It suffers from the second lowest primary school enrolment rate globally (65%), and a high incidence of child labour. At 15%, the tertiary attainment rate (65th overall) of its 25–54 age group is a relative highlight, as are the business perceptions of the quality of its staff training (59th).
RESULTS BY REGION AND INCOME GROUPThe Human Capital Index shows that all countries can do more to nurture and fully utilize their human capital potential. Across the Index, there are only 19 nations that have tapped 80% of their human capital potential or more. In addition to these 19 countries, 40 countries score between 70% and 80%. A further 38 countries score between 60% and 70%, while 28 countries score between 50% and 60% and five countries remain below 50%.
At a global level, only one region—North America—narrowly passes the 80% threshold. Two regions—Western Europe and Eastern Europe and Central Asia—score in the 70% to 80% range and three others—East Asia and the Pacific, Latin America and the Caribbean, and the Middle East and North Africa—in the 60% to 70% range. Two regions—South Asia and Sub-Saharan Africa—have not yet crossed the 60% average threshold. However, as illustrated in Figure 2, there is a wide variety of effective human capital utilization in every world region, with both success stories and underperforming countries in each.

8 The Human Capital Report 2016
G20
European Union
East Asia and the Pacific
Eastern Europe and Central Asia
Latin America and the Caribbean
Middle East and North Africa
North America
South Asia
Sub-Saharan Africa
Western Europe
High income
Upper-middle income
Lower-middle income
Low income
Score (0–100 scale)
0 20 40 60 80 1000 20 40 60 80 100
India Canada
Saudi Arabia
Pakistan
Chad South Africa
Myanmar
Japan
Finland
Russia
Korea, Rep.
Yemen United Arab Emirates
Spain
Cambodia China
Albania
BrazilHaiti
Mauritania
India Sri Lanka
Algeria Qatar
United States
Bahrain
Chile Cuba
Estonia
Japan
Nigeria
Switzerland
Ghana
Mauritius
GermanyGreece France
United Kingdom
Singapore
Slovenia
Figure 2: Human Capital Index 2016, by region, income and political grouping
Source: Human Capital Index 2016.

9The Human Capital Report 2016
East Asia and the PacificEast Asia and the Pacific, jointly with South Asia the world’s most populous region, scores towards the middle of the range of the Human Capital Index results, with an overall average score of 69.75. The gap between the best and worst performers in the East Asia and the Pacific region is the second largest of any region, reflecting in part the different stages of economic development of the 15 countries from the region covered in the Index, but also the varying degrees of human capital outcomes even between countries with similar income. Scores for the region’s 0–14 Age Group pillar are much higher relative to other pillars, reflecting the region’s remarkable progress between generations.
The best-performing countries in the region, such as Japan (4), Singapore (13) and the Korea, Rep. (32) are global strongholds of human capital success, while countries such as Cambodia (100), Lao PDR (106) and Myanmar (109) trail the region despite a relatively solid performance relative to their income levels. ASEAN economies such as Malaysia (42) and the Philippines (49) are not too far behind their northern neighbours, while China (71) scores near the regional and overall Index average with regard to its human capital performance.
Over half of the countries in the region have achieved near-universal primary school enrolment rates; yet, on average, over 20% of the region’s 0–14 age group is not enrolled in secondary education. Among its 25–54 age group core working population, the average labour force participation rate is 83%. Singapore (13) has the highest proportion of high-skilled employment, at 55% of its workforce (2nd in the world), with a regional average of 22%. The region includes five countries that are ranked in the top 10 for the highest healthy life expectancy.
Eastern Europe and Central AsiaThe Index covers 22 countries from Eastern Europe and Central Asia. At an overall average score of 75.02, the region ranks in third place globally, after North America and Western Europe. It includes several remarkable success stories with regard to successful human capital potential maximization, including Estonia (15) and Slovenia (16), which both score above the 80% threshold, and the Czech Republic (25), Ukraine (26), the Russian Federation (28), Kazakhstan (29) and Poland (30), which all score within the top 30. Ukraine’s performance is particularly remarkable relative to its GDP per capita levels.
Most countries in the region are close to having achieved near-universal basic education enrolment; however, some, such as Macedonia, FYR (59) and Romania (38), still lag behind. The bottom-ranked countries in the region, Moldova (63) and Albania (70), are also held back by the persistence of issues such as child labour.
In general, countries in the Eastern Europe and Central Asia region benefit from formally well-educated older populations—a legacy of the region’s former heavily state-led school systems—but underperform with regard to labour force participation. Several countries in the region also have a relatively low healthy life expectancy.
Latin America and the CaribbeanThe 24 countries ranked by the Index in the Latin America and the Caribbean region score in the middle range of the Index—just behind the East Asia and the Pacific region—with an overall average score of 66.95. However, scores for the region’s 65 and Over and 55–64 Age Group pillars tend to be much higher than for their peers in the East Asia and the Pacific region; are practically tied between the regions for the 25–54 age group; and lag behind the East Asia and the Pacific region’s younger population in terms of its human capital performance. To some extent, this hints at the rise of East Asia and some missed opportunities in the Latin America and the Caribbean region.
With the exception of Cuba (36) and Haiti (111), the gap between the best and worst performers in the region is much smaller than for any other region. The better performing countries in the region, such Chile (51) and Argentina (56), seem to share similar strengths and weaknesses, passing the 70% overall human capital maximization threshold. By contrast, Brazil (83) somewhat lags behind the regional average.
Several countries in the region have not yet achieved universal primary school enrolment, while, on average, 20% of the region’s children do not finish basic education. On the plus side, there is no observable gender gap in education. Many countries in the region are facing high youth unemployment rates in the 15–24 age group. More positively, unemployment in the 25–54 core working age group tends to be in the single digits, and high-skilled employment is in the range of 20%. Labour force participation in the region begins to decline markedly for the 55–64 age group, while at the same time there is also a relatively large share of people in the 65 and over age group that continues to work past their countries’ years of healthy life expectancy, indicating some challenges with the region’s social welfare net.
The bottom ranks of the region are made up of Venezuela (89)—whose performance is particularly disappointing in light of its level of economic development—and the group of Central American nations, such as Honduras (93), where incomplete primary education and child labour remain a problem.
Middle East and North AfricaThe Middle East and North Africa region comprises 15 countries that had enough data for coverage in the Index. Out of these, only one—Israel (23)—makes it into the top 30 of the Index. The gulf states Bahrain (46), Qatar (66), and the United Arab Emirates (69) outperform the rest of the region in terms of making the best use of their human capital potential and score in the mid-range of countries ranked in the Index overall. However, relative to their income levels these countries have additional opportunities to further boost their human capital performance.
The North African nations Morocco (98), Tunisia (101) and Algeria (117) make up the lower end of the regional rankings, ahead of Yemen (129) and Mauritania (130).
The Middle East and North Africa is one of the most disparate regions in the Index—spanning three income group levels and ranging in age group average scores from those that are in line with other high-income economies in Western Europe and elsewhere to those more in line with
10 The Human Capital Report 2016
the worst-performing countries in Sub-Saharan Africa. For example, Saudi Arabia (87), whose GDP per capita is nearly fivefold higher, performs at a comparable level to Egypt (86), highlighting that economic factors alone are an inadequate measure of a country’s ability to successfully leverage their human capital potential. While the region’s overall average score of 61.54 masks some of these significant differences in countries’ circumstances, it also points to opportunities for countries to learn from one other across the region.
Several critical issues affect the 0–14 age group in certain countries in the Middle East and North Africa region. Gender gaps in secondary school participation and high incidence of child labour in some countries of the region risk leaving a lasting impact on the workforce of the next generation. Youth unemployment continues to be widespread among the 15–24 age group in the region, reaching its highest levels at 33% in Jordan (81) and 38% in Tunisia (101). Additionally, due to low rates of female participation, the region’s 25–54 prime working age group exhibits some of the lowest labour force participation rates in the Index.
North AmericaWith an average score of 80.41, North America is the strongest regional performer on the Human Capital Index, with Canada (9) ranking in the top 10. The United States (24) lags behind its northern neighbour on the 0–14 Age Group pillar, revealing relative weaknesses in primary and secondary enrolment rates and the quality of primary education. However, the United States also records an impressive tertiary enrolment rate (4th globally). In both Canada and the United States this trend is a continuation of the high proportion of those who have already attained tertiary education across the older age groups.
In both countries, more than 40% of the 25–54 age group is employed in high-skilled occupations (ranking
16th and 22nd, respectively), with the United States (24) trumping Canada (9) in economic complexity by leveraging more sophisticated knowledge and skills. Despite strong results in education outcomes, labour force participation indicators across all Age Group pillars rank in the middle range of the Index. However, with a 65 and over age group labour force participation rate of 14% and 19%, respectively, and a healthy life expectancy above 70, the region has a relatively high-skilled and productive ‘silver’ workforce.
South AsiaThe Index covers six countries from the South Asia region: Sri Lanka (50), Bhutan (91), Bangladesh (104), India (105), Nepal (108) and Pakistan (118). The overall average score for the region is 59.92—behind the Middle East and North Africa and ahead of Sub-Saharan Africa—and all but the top two have yet to reach the 60% threshold with regard to optimizing their human capital potential.
The bright spot for the region, Sri Lanka (50), benefits from strong educational enrolment and basic education completion rates as well as positive perceptions of the quality of its primary schools and education system overall (23rd on both). However, it underperforms when it comes to translating the potential of its young population to the workforce, with one in four young people not active in employment, education or training.
The region’s most populous countries—Bangladesh (104), India (105) and Pakistan (118)—are held back by insufficient educational enrolment rates and poor-quality primary schools. The youth literacy rate in the three countries stands at 83%, 89% and 75% respectively, far behind other emerging markets as well as their own
G20
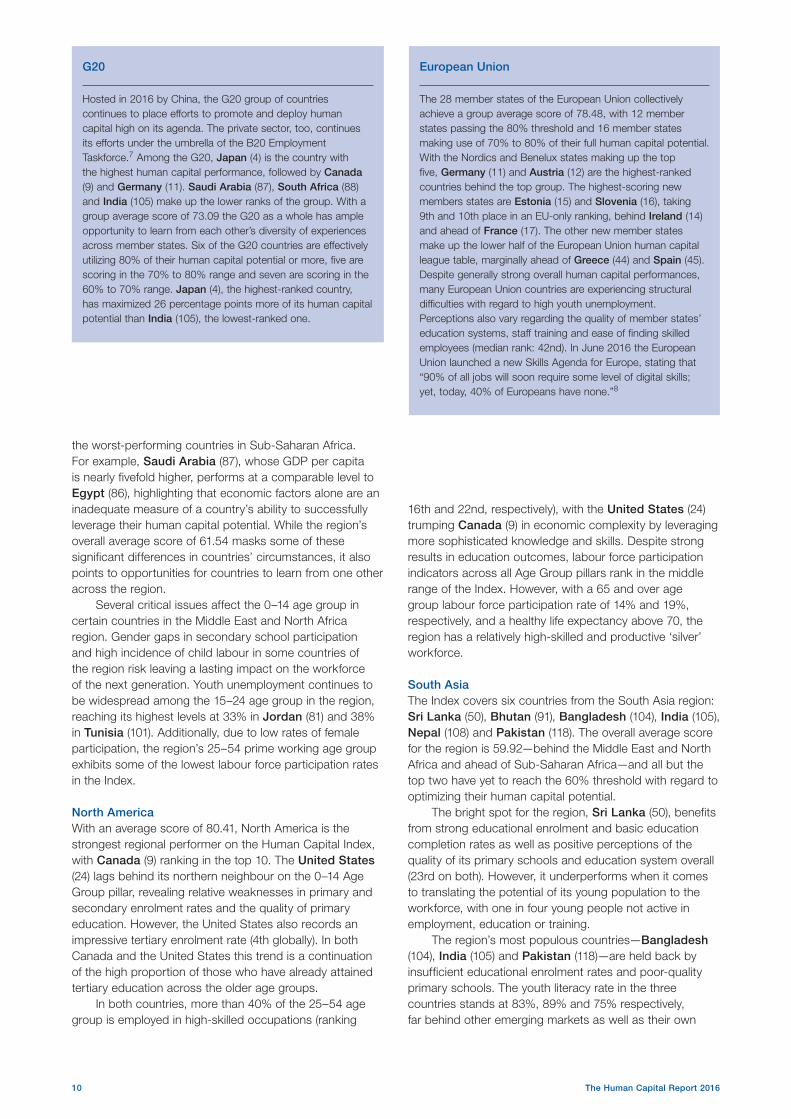
Hosted in 2016 by China, the G20 group of countries continues to place efforts to promote and deploy human capital high on its agenda. The private sector, too, continues its efforts under the umbrella of the B20 Employment Taskforce.7 Among the G20, Japan (4) is the country with the highest human capital performance, followed by Canada (9) and Germany (11). Saudi Arabia (87), South Africa (88) and India (105) make up the lower ranks of the group. With a group average score of 73.09 the G20 as a whole has ample opportunity to learn from each other’s diversity of experiences across member states. Six of the G20 countries are effectively utilizing 80% of their human capital potential or more, five are scoring in the 70% to 80% range and seven are scoring in the 60% to 70% range. Japan (4), the highest-ranked country, has maximized 26 percentage points more of its human capital potential than India (105), the lowest-ranked one.
European Union
The 28 member states of the European Union collectively achieve a group average score of 78.48, with 12 member states passing the 80% threshold and 16 member states making use of 70% to 80% of their full human capital potential. With the Nordics and Benelux states making up the top five, Germany (11) and Austria (12) are the highest-ranked countries behind the top group. The highest-scoring new members states are Estonia (15) and Slovenia (16), taking 9th and 10th place in an EU-only ranking, behind Ireland (14) and ahead of France (17). The other new member states make up the lower half of the European Union human capital league table, marginally ahead of Greece (44) and Spain (45). Despite generally strong overall human capital performances, many European Union countries are experiencing structural difficulties with regard to high youth unemployment. Perceptions also vary regarding the quality of member states’ education systems, staff training and ease of finding skilled employees (median rank: 42nd). In June 2016 the European Union launched a new Skills Agenda for Europe, stating that “90% of all jobs will soon require some level of digital skills; yet, today, 40% of Europeans have none.”8

11The Human Capital Report 2016
lower-middle income group’s average. All three countries’ educational performance is somewhat better at the tertiary level, despite rather low levels of skill diversity among their university graduates, indicating a strong specialization in a limited number of academic subjects. All three countries also exhibit significant employment gender gaps, exacerbating the difficulty of finding skilled employees, which is ranked low in all countries except India, which ranks 45th on this indicator.
Sub-Saharan AfricaOn the Sub-Saharan African continent a cluster of countries, including Mauritius (76), Ghana (84), South Africa (88) and Zambia (90), score in the 60–70% range with regard to their effective overall human capital potential utilization—placing them ahead of the Middle East and North Africa regional average and on a par with the lower half of the Latin American and East Asia and the Pacific regions. Other economies, however, such as Ethiopia (119) and Nigeria (127) face a range of human capital challenges, including low survival rates for basic education. With an overall average score of 55.44, the Sub-Saharan African region is the lowest-ranked region in the Index.
In total, the Index covers 26 countries from the region, of which five are from the upper-middle income group, eight from the lower-middle income group and the remaining 13 from the low-income group. Despite this high regional diversity the Sub-Saharan African region exhibits a number of similar patterns across all age groups.
Ghana (84) and Zambia (90) owe their comparatively strong performance in large part to the significantly improved educational attainment of its younger generations. However, both countries still have room for further improvement in primary school enrolment and even more so with regard to
Ghana’s 21% and Zambia’s 40% incidence of child labour—some of the worst in the region and globally.
Uganda (99) illustrates a number of trends that are also shared by its East African neighbours Kenya (102), Rwanda (110) and Tanzania (116). With a very low NEET rate as well as low tertiary enrolment, the majority of Uganda’s 15–24 age group has an early start into the workforce, having a high labour force participation rate (4th globally). The possible downside to this is indicated by the country’s 73% incidence of undereducation, the second highest measured in the Index. Encouragingly, there has been an increase in vocational enrolment in recent years.
The region has high labour force participation in the 65 and over age group, with all but four countries ranked in the top 30. Yet given the age group’s low educational attainment and a healthy life expectancy below 60 years for all countries in the region except Mauritius, this almost certainly reflects activity due to economic necessity and lack of an adequate welfare or pension system. Before discounting this observation as a pure negative, however, it should be noted that this older generation nevertheless continues to provide its younger peers with its knowledge and experience.
Western EuropeRankings in Western Europe are dominated by the Nordic and Benelux countries—Finland (1), Norway (2), Sweden (5), Denmark (7), Netherlands (8) and Belgium (10)—as well as Switzerland (3)—which collectively take the region’s top spots. Finland’s performance is particularly remarkable, given the much higher GDP per capita levels of the region’s two runners-up.
Germany (11), France (17) and the United Kingdom (19) make up the mid-range of the regional league table,
Figure 3: Distance to the ideal, by region, income and political grouping
Source: Human Capital Index 2016.
Scor
e (0
–100
sca
le)
0
20
40
60
80
100
Low income
Lower-middle income
Upper-middle income
High income
Western Europe
Sub-Saharan Africa
South Asia
North America
Middle East and
North Africa
LatinAmerica and the
Caribbean
Eastern Europe
and Central
Asia
East Asia
and the Pacific
G20European Union
20 383323 46 Distanceto ideal
454020383325302227

12 The Human Capital Report 2016
US$12,735 > upper-m
iddle income
US$4,125 > low
er-middle incom
e
US$1,045 > low
income
US$12,736 < high incom
e
0 10,000 20,000 30,000 40,000 50,000 60,000 70,000 80,000 90,000 10,0000 110,000
0
10
20
30
40
50
60
70
80
90
100
MauritaniaYemen
Chad
VenezuelaBrazil
Ukraine Russian Federation
Bahrain
Saudia Arabia
Kuwait
Qatar
Norway
United Arab Emirates
Finland
United StatesSingapore
Sweden
Australia
United Kingdom
New ZealandSlovenia
Estonia
Pakistan
Turkey
Cuba
China
South Africa
Kyrgyz Rep.
SwitzerlandJapan
Nigeria
Low human capital,low GNI
High human capital,low GNI
High human capital,high GNI
Low human capital,high GNI
and the Mediterranean countries—Italy (34), Portugal (41), Greece (44) and Spain (45)—the bottom ranks.
The overall average score of the region is 79.86, the second highest after North America, and 12 out of the 20 Western European countries covered by the Index have crossed the threshold of effectively utilizing at least 80% of their full human capital potential. The region shows fairly high homogeneity in human capital in contrast to regions such as East Asia and the Pacific or Middle East and North Africa.
Generally, most of the region is performing below the world average for the 15–24 Age Group pillar on four indicators: Labour force participation rate, Unemployment rate, Long-term unemployment rate and Incidence of overeducation, highlighting some of the structural challenges facing the region. The Mediterranean countries, in particular, continue to be affected by high levels of youth unemployment—reaching 52% in Greece (44) and 53% in Spain (45), the third and second highest rates measured in the world—but also by high levels of unemployment among
the 25–54 prime working age group. About half of the youth unemployment in both countries is long term, risking a lasting impact on the workforce of the next generation. More positively, the long-term human capital potential of the Western Europe region is nevertheless substantial, encompassing a well-educated older population with high tertiary attainment among its 55–64 Age Group as well as a high healthy life expectancy.
HUMAN CAPITAL AND GROSS NATIONAL INCOMEThe Human Capital Index finds a clear correlation between an economy’s income level and its capacity to develop and deploy human capital—countries with higher gross national income (GNI) and GDP per capita have on average higher scores. However, there are significant differences and overlaps within and between income brackets, with some lower-income countries far outperforming richer ones.
Out of the 49 economies covered by the Index in the high income bracket (those with a GNI per capita above US$12,736), all 19 economies passing the 80% human
GNI per capita, Atlas method
Scor
e (0
–100
sca
le)
Figure 4: Relationship between GNI per capita and the Human Capital Index 2016, overall
Source: Human Capital Index 2016 and World Bank.

13The Human Capital Report 2016
capital optimization threshold belong to this group, while 22 high income economies score in the 70% to 80% range and eight in the 60% to 70% range.
Among the 32 countries covered by the Index in the upper-middle income bracket (those with a GNI per capita between US$4,126 and US$12,735), 12 countries score within the 70% to 80% tier, 16 countries within the 60% to 70% tier and four have not yet crossed the 60% threshold.
Within the lower-middle income group (countries with a GNI per capita between US$1,046 and US$4,125), six out of 33 countries covered by the Index score above 70%, 14 countries score in the 60% to 70% range and 13 have not crossed the 60% threshold.
Finally, none of the 16 low income economies (those with a GNI per capita under US$1,045) covered by the Index have yet maximized 60% of their human capital potential or more, although Uganda (99) and Cambodia (100) come close.
Figures 4 and 5 display the correlation between GNI per capita levels and performance on the Human Capital Index. For example, Australia (18) and Estonia (15) are practically tied in their human capital outcomes but record very different GNI per capita levels. Conversely, despite very similar GNI per capita levels, Ghana (84) significantly outperforms Nigeria (127), indicating that human capital investment and planning can make a difference to a nation’s human capital endowment regardless of where it
falls on the global income scale. Creating a virtuous cycle of this nature should be the aim of all countries.
GLOBAL HUMAN CAPITAL TRENDSAs of the start of 2016, the world’s population is estimated at about 7.4 billion people. Out of these, just over two fifths (41%) fall within the prime working age group of 25–54 year-olds, 16% fall within the 15–24 age group and 26% are aged under 15. At the upper end of the world population pyramid, 9% of the world’s people fall within the 55–64 age group and 8% are aged 65 and over (see Figure 6). Aiming to be as representative of each segment of the global population as possible, these percentage distributions are also used as pillar weights in constructing the Human Capital Index.9
Going beyond national population averages, our data highlights the unequal development and deployment of human capital across the age-group spectrum (see Figure 6). On average, the world has developed 81% of the human capital potential of the youngest members of the global population for whom the Index assesses education among the most critical factors. This is in line with recent massive investment pushes in this age bracket—such as the former United Nations Millennium Development Goals and UNESCO’s Education for All agenda—and places the 0–14 age group significantly ahead of other parts of the global population with regard to its realized human capital potential.
GNI per capita, Atlas method
Scor
e (0
–100
sca
le)
US$12,735 > upper-m
iddle income
US$4,125 > low
er-middle incom
e
US$1,045 > low
income
US$12,736 < high incom
e
0 1,000 2,000 3,000 4,000 5,000 6,000 7,000 8,000 9,000 1,0000 11,000 12,000 13,000
40
50
60
70
80
High human capital,low GNI
Low human capital,low GNI
High human capital,high GNI
Low human capital,high GNI
Zambia
Philippines
Guatemala
India
Iran, Islamic Rep.
Kazakhstan
Kyrgyz RepublicMalaysia
Morocco
Nigeria
Pakistan
GhanaSouth Africa
Sri Lanka
Tunisia
TurkeyVenezuela
Vietnam
Yemen
Romania
Botswana
Brazil
Bulgaria
Cameroon
Cuba
Egypt
Bolivia
Armenia
Ukraine
AlgeriaEthiopia
Rwanda
Figure 5: Relationship between GNI per capita and the Human Capital Index 2016, low and middle-income countries
Source: Human Capital Index 2016 and World Bank.

14 The Human Capital Report 2016
economies implies that relying wholly on today’s students to meet future skills requirements of the Fourth Industrial Revolution is not going to be enough to stay competitive, since older age groups will continue to form the bulk of these countries’ workforces for a long time to come. With rapidly rising healthy life expectancies, life-long learning and re-skilling of existing workforces will become much more important. Equally important will be the removal of unconscious biases and unintentional disincentives against hiring and retaining older workers.10 Similarly, barriers to women’s employment throughout the life-course need to be addressed through both public policy, particularly an improved care infrastructure, and private sector efforts.
MAXIMIZING LEARNING AND EMPLOYMENT IN THE FOURTH INDUSTRIAL REVOLUTIONThe Human Capital Index is composed of two horizontal sub-themes: Learning and Employment.
The Employment theme spans, among other things, economic participation, overeducation and undereducation relative to available job opportunities and the nature and quality of employment in each country. The Learning theme points to the transition from primary through to vocational and tertiary level education, the quality of that education, as well as opportunities for learning in the workplace—whether through formal courses or the day-to-day, on-the-job acquisition of tacit know-how in a complex working environment.11 (For full details of the Index structure, please refer to Table A1.)
Countries should aim to maximize human capital outcomes across both themes. The challenge lies not only in equipping a nation’s workforce with timely and relevant knowledge and skills but also in deploying these skills in high-quality jobs throughout all age groups.
As illustrated in Figure 7, the Index reveals uneven levels of Learning and Employment outcomes across the
400,000 300,000 200,000 100,000 0
0–4
5–9 27%
16%
41%
8%
8%
25%
16%
41%
9%
9%
10–14
15–19
20–24
25–29
30–34
35–39
40–44
45–49
50–54
55–59
60–64
65–69
70–74
75–79
80–84
85–89
90–94
95–99
100+
0 100,000 200,000 300,000 400,000
Men
Women
Figure 6: Global population distribution and Human Capital Index average scores by Age Group pillar, 2016
Source: Human Capital Index 2016 and UN Population Division.
Age
grou
p
Age group
Scor
e (0
–100
sca
le)
Population (thousands)
0
20
40
60
80
100
65+55–6425–5415–240–14
54
6763
66
81
However, in the 15–24 age group, for whom the Index emphasizes factors such as workplace relevant skills and a successful education-to-employment transition, countries have on average only leveraged 66% of young people’s human capital potential, pointing to a disconnect between learning and employment in many economies around the world.
Moving on to the next stage within the Index’s life-course approach to human capital analysis, countries on average only make use of 63% of the full human capital potential of their 25–54 year-old prime working age population. As discussed above, at the regional and individual country level, there is, however, a wide divergence around the world in human capital outcomes for this age group, for whom the Index emphasizes continuous learning opportunities in the workplace and employment quality. High-performing countries, such as the Nordics and Switzerland, have maximized more than 80% of the human capital of their prime age population; 16 countries in the Index have yet to cross the 50% threshold.
Finally, the world’s older workforce—for whom the Index assesses both continued opportunity and health and quality of life—is the most underinvested-in segment of the global population, with human capital optimization ranging from 67% on average in the 55–64 age group to only 54% on average in the 65 and over age group.
Our analysis shows that—in addition to measures such as bringing young people into work and preparing the next generation of workers in countries with high youth unemployment—human capital investment must also continue building up the human capital potential of the population above age 25 or risk neglecting, on average, 58% of a nation’s total talent. This is particularly true for advanced, ageing economies with a very different population pyramid from the young, emerging world. In fact, the declining share of the youth cohort in ageing

15The Human Capital Report 2016
0 20 40 60 80 100
YemenBurkina Faso
SenegalMali
BurundiEthiopiaGuinea
ChadBhutan
MauritaniaLesotho
BeninAlgeria
MozambiqueCôte d'Ivoire
MalawiTanzania
NepalRwandaKuwait
PakistanTunisia
MadagascarMorocco
CambodiaLao PDR
HaitiBangladesh
UgandaNigeria
BotswanaBarbadosMyanmar
VenezuelaIndia
NamibiaGuatemalaCameroon
KenyaHonduras
QatarZambia
JamaicaGhanaGabonEgypt
United Arab EmiratesIran, Islamic Rep.
VietnamNicaragua
AlbaniaParaguay
TurkeyTrinidad and Tobago
Saudi ArabiaSouth Africa
BoliviaMauritius
El SalvadorBrazil
IndonesiaMexico
PeruJordan
EcuadorDominican Republic
ThailandColombiaArgentinaMoldovaUruguay
Macedonia, FYRSerbia
Costa RicaSri Lanka
GuyanaChina
PortugalPanamaIceland
SpainAzerbaijanMongolia
BahrainTajikistan
CroatiaPhilippines
MalaysiaChileCuba
GreeceMalta
ItalyCyprus
RomaniaIsrael
PolandKazakhstan
Slovak RepublicHungary
LuxembourgArmeniaBulgaria
Kyrgyz RepublicLithuania
SingaporeCzech Republic
UkraineLatvia
Russian FederationUnited Kingdom
EstoniaAustralia
FranceKorea, Rep.
IrelandCanada
SloveniaNew ZealandNetherlands
United StatesAustria
BelgiumSweden
GermanyDenmark
NorwaySwitzerland
JapanFinland
Figure 7: Distance-to-ideal gap for the Employment theme and for the Learning theme
Employment
Learning
Score (0–100 scale)
world.12 Broadly speaking, economies fall into four groups. First, countries such as Finland (1) have developed and deployed their human capital across both dimensions, maximizing their human capital potential. Second, economies such as Rwanda (110) and Vietnam (68) are doing well on deploying their workforce but could radically improve their Index performance and boost their human capital potential by further improving Learning outcomes to keep pace with the requirements of a complex modern economy. Third, a number of countries, such as Saudi Arabia (87) and Korea, Rep. (32), have well-educated populations and perform well across the Learning theme but could do more to also leverage this accumulated human capital potential across the Employment theme. Often, additional progress could be made through more inclusive labour markets, including for women, youth and older people. Finally, in economies such as India (105) and Nigeria (127) efforts are needed to simultaneously improve the development as well as deployment of the nation’s human capital potential across the Learning and Employment dimensions for all age groups.
The World Economic Forum’s Future of Jobs Report,13 among a range of other research, has highlighted that perhaps 60% of children entering primary school today might ultimately work in job types that currently don’t yet exist. This will create opportunities for countries to improve their performance in unexpected ways while cautioning others against resting on their past successes.
For example, the learning and employment landscape of the Fourth Industrial Revolution will increasingly be shaped not only by technology-enabled education but also by the emergence of digital talent platforms, amplifying people’s potential to develop and deploy their skills and experience beyond geographic boundaries while enabling employers to engage and integrate a globally dispersed workforce.14
Moreover, as both the demand and supply of skills and jobs migrate to a digital environment, there is a new horizon for understanding Learning and Employment. The emergence of digital talent platforms and advances in big data analytics increasingly make it possible to complement standardized international statistics to understand a country’s evolving skills requirements and labour market changes in near-real time.15
Accordingly, the following two sections of the Report look at the results of the Human Capital Index—first, with a focus on Learning, then, with a focus on Employment, contextualizing each theme with unique data compiled for this Report in collaboration with LinkedIn and other World Economic Forum partners.
LEARNING THROUGH THE LIFE-COURSEFocusing on the Index’s Learning theme, the average score for the under 25 age group (combining the 0–14 and 15–24 Age Group pillars) is 73, while for those above that age (combining the 25–54, 55–64 and 65 and Over Age Group pillars) it is 51. Particularly in developing countries, recent human capital investment in education has mostly been successful at improving the skills and capabilities of the younger generations—dramatically so in terms of enrolment in education, if not always as consistently in terms of education quality.16 However,

16 The Human Capital Report 2016
many education systems around the world continue to operate on an assumption of front-loading students’ learning in life, leaving older generations behind with the one-time educational attainment they achieved in their own youth, which contributes to global skills gaps and mismatches. The 22-point Learning score gap between younger and older generations highlights the effects of such front-loaded education systems across the globe. To balance the scales, a wider portfolio of lifelong learning opportunities, as well as flexible and modular learning approaches, is needed.
Figure 8 illustrates these points. For countries like Japan (4) and the United States (24), the comparatively small Learning score gap between the under 25 and over 25 age groups points to previously already high educational attainment levels in the older generations. However, for countries such as Brazil (83) and South Africa (88) the small Learning score gap between the under 25 and over 25 age groups points rather to a lack of progress in improving educational attainment across generations. In yet other cases, large Learning score gaps point to especially large improvements across generations—notably in the cases of Yemen (129) (which moves from 12 in the over 25 age groups to 57 in the under 25 age groups), Iran, Islamic Rep. (85) (44 in the over 25 age groups to 80 in the under 25 age groups), Ethiopia (119) (18 to 53) and Iceland (20) (56 to 85).
Policy-makers as well as business and civil society leaders everywhere will increasingly need to consider the preparedness of different age groups in the population for being re-skilled to meet the skills challenges presented by the Fourth Industrial Revolution. As Dorn and Autor note, “because occupations typically expand by hiring young workers and contract by curtailing such hiring … [in-demand] occupations will ‘get younger’ while shrinking occupations will ‘get old.’”17 Accordingly, well-qualified young people are uniquely positioned to meet the demand for newly emerging high quality job types in their country, whether at the vocational or tertiary level.18 Equipping older workers to do the same, however, will require a focus on continuous lifelong learning and skills upgrading.
Among promising approaches, new digital learning platforms enable high-quality, low-cost learning content to be scaled through personalized, adaptive learning and blended learning technologies. As highlighted in the World Economic Forum’s recent New Vision for Education Report, digital learning platforms increasingly cover the entire range of the life-course, ranging from children’s apps and gamified learning; through online university course learning; to self-paced, casual adult upskilling; to formal technology-enabled on-the-job training.19 To reach their full potential, these new technologies will need to avoid replicating the silos that often exist between different modes and levels of learning in their offline counterparts in traditional education systems. They will also need to develop new forms of widely recognized accreditation and certification, for example by linking courses completed on online learning platforms such as Lynda.com and Coursera to learners’ online professional profiles.
Figure 9 groups countries ranked in the Human Capital Index into four quadrants. Those countries in the top right quadrant, such as China (71) and Iceland (20) started out from a solid learning capacity already
0 20 40 60 80 100
ChadGuinea
MauritaniaSenegalNigeria
MaliBurkina Faso
MalawiTanzania
MozambiqueBenin
BurundiMadagascar
EthiopiaLesotho
Côte d'IvoireUgandaYemen
HaitiRwandaPakistan
KenyaCambodiaNicaragua
NamibiaMyanmar
GabonBrazil
ZambiaLao PDR
GuatemalaBhutan
ParaguayAlgeria
South AfricaMorocco
BangladeshCameroon
NepalGhana
Dominican RepublicBotswanaHonduras
KuwaitTunisia
PeruVenezuela
MexicoJamaica
BoliviaEl Salvador
PanamaColombiaVietnam
IndiaUruguay
EgyptPhilippinesCosta Rica
Saudi ArabiaTrinidad and Tobago
GuyanaAzerbaijan
MoldovaThailand
ArgentinaQatar
TajikistanIndonesiaMauritius
JordanUnited Arab Emirates
BulgariaChina
TurkeyKyrgyz Republic
ChileBarbadosHungaryEcuadorArmenia
Macedonia, FYRAlbania
Slovak RepublicMongolia
MaltaIran, Islamic Rep.
Sri LankaBahrain
SpainRomania
IsraelMalaysia
SerbiaUnited States
PortugalLuxembourg
PolandKazakhstan
LatviaCzech Republic
GreeceGermany
Russian FederationCyprusCroatiaCanada
United KingdomUkraine
Korea, Rep.Lithuania
IcelandItaly
FranceJapan
SwedenDenmark
EstoniaAustria
AustraliaSingapore
SloveniaNetherlands
IrelandCuba
New ZealandNorwayBelgium
SwitzerlandFinland
Figure 8: Gap between Learning theme score average, below and above age 25
Score (0–100 scale)
Under 25
Over 25
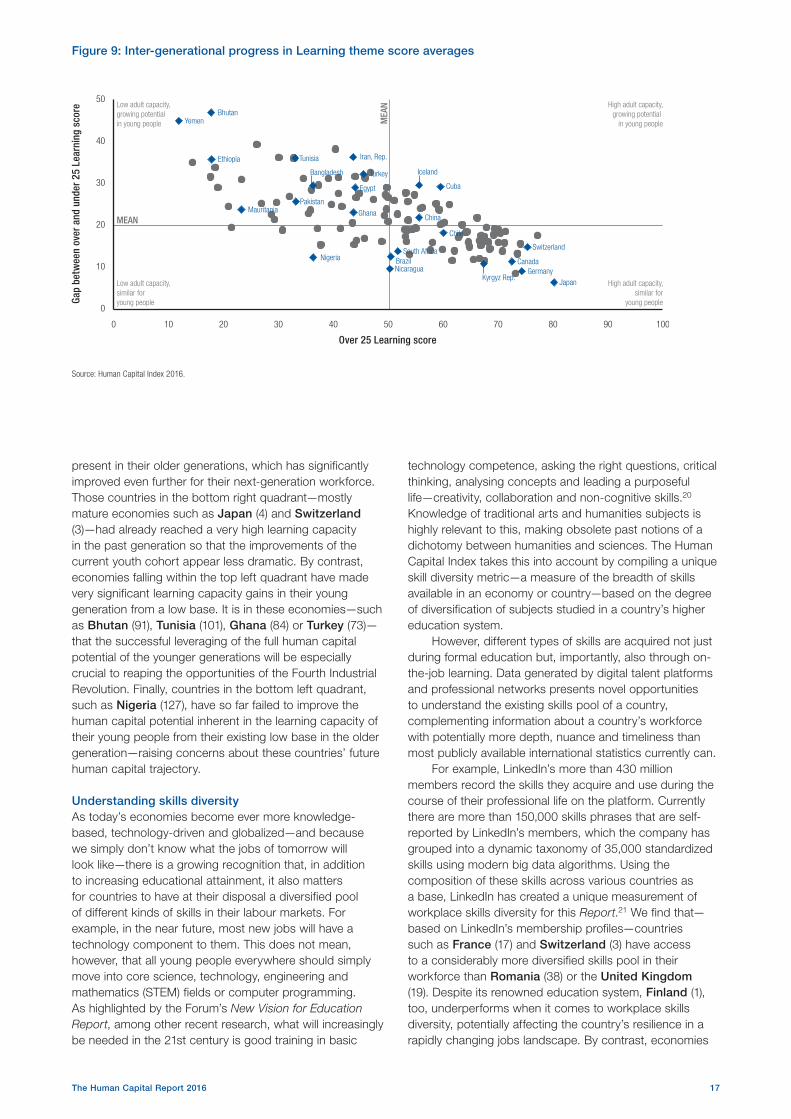
17The Human Capital Report 2016
present in their older generations, which has significantly improved even further for their next-generation workforce. Those countries in the bottom right quadrant—mostly mature economies such as Japan (4) and Switzerland (3)—had already reached a very high learning capacity in the past generation so that the improvements of the current youth cohort appear less dramatic. By contrast, economies falling within the top left quadrant have made very significant learning capacity gains in their young generation from a low base. It is in these economies—such as Bhutan (91), Tunisia (101), Ghana (84) or Turkey (73)—that the successful leveraging of the full human capital potential of the younger generations will be especially crucial to reaping the opportunities of the Fourth Industrial Revolution. Finally, countries in the bottom left quadrant, such as Nigeria (127), have so far failed to improve the human capital potential inherent in the learning capacity of their young people from their existing low base in the older generation—raising concerns about these countries’ future human capital trajectory.
Understanding skills diversityAs today’s economies become ever more knowledge-based, technology-driven and globalized—and because we simply don’t know what the jobs of tomorrow will look like—there is a growing recognition that, in addition to increasing educational attainment, it also matters for countries to have at their disposal a diversified pool of different kinds of skills in their labour markets. For example, in the near future, most new jobs will have a technology component to them. This does not mean, however, that all young people everywhere should simply move into core science, technology, engineering and mathematics (STEM) fields or computer programming. As highlighted by the Forum’s New Vision for Education Report, among other recent research, what will increasingly be needed in the 21st century is good training in basic
technology competence, asking the right questions, critical thinking, analysing concepts and leading a purposeful life—creativity, collaboration and non-cognitive skills.20 Knowledge of traditional arts and humanities subjects is highly relevant to this, making obsolete past notions of a dichotomy between humanities and sciences. The Human Capital Index takes this into account by compiling a unique skill diversity metric—a measure of the breadth of skills available in an economy or country—based on the degree of diversification of subjects studied in a country’s higher education system.
However, different types of skills are acquired not just during formal education but, importantly, also through on-the-job learning. Data generated by digital talent platforms and professional networks presents novel opportunities to understand the existing skills pool of a country, complementing information about a country’s workforce with potentially more depth, nuance and timeliness than most publicly available international statistics currently can.
For example, LinkedIn’s more than 430 million members record the skills they acquire and use during the course of their professional life on the platform. Currently there are more than 150,000 skills phrases that are self-reported by LinkedIn’s members, which the company has grouped into a dynamic taxonomy of 35,000 standardized skills using modern big data algorithms. Using the composition of these skills across various countries as a base, LinkedIn has created a unique measurement of workplace skills diversity for this Report.21 We find that—based on LinkedIn’s membership profiles—countries such as France (17) and Switzerland (3) have access to a considerably more diversified skills pool in their workforce than Romania (38) or the United Kingdom (19). Despite its renowned education system, Finland (1), too, underperforms when it comes to workplace skills diversity, potentially affecting the country’s resilience in a rapidly changing jobs landscape. By contrast, economies
Source: Human Capital Index 2016.
Gap
betw
een
over
and
und
er 2
5 Le
arni
ng s
core
Over 25 Learning score
MEAN
MEA
N
0 10 20 30 40 50 60 70 80 90 100
0
10
20
30
40
50
Mauritania
Ethiopia
YemenBhutan
Tunisia Iran, Rep.
Bangladesh
Pakistan
Egypt
Turkey
Ghana
Iceland
Cuba
China
Chile
South AfricaBrazilNicaragua
Kyrgyz Rep.
CanadaGermany
Switzerland
Japan
Nigeria
Low adult capacity,growing potential in young people
High adult capacity,growing potential
in young people
Low adult capacity,similar foryoung people
High adult capacity,similar for
young people
Figure 9: Inter-generational progress in Learning theme score averages

18 The Human Capital Report 2016
such as Brazil (83) exhibit a comparatively high degree of workplace skills diversity.
As presented in Figure 10, complementing the core indicator data of the Human Capital Index derived from conventional international statistics with the information generated by digital talent platforms also enables us to identify whether a larger share of the skills pool of any given country is acquired during formal education or on-the-job. While in countries such as the United States (24) the young population comes out of the formal education system with broad skills diversity, there is evidence of a much more concentrated set of skills used at work—implying generally narrow specialization in the workplace and, perhaps, fewer workplace learning opportunities. Portugal (41) does well in skills diversity in education and the workplace while Australia (18) performs comparatively poorly in both. Finally, in countries such as Colombia (64), while the education system imparts a relatively concentrated set of skills—more than half of all Colombian students graduate in business or a social science subject, while only 4% graduate in natural sciences—there is much greater skills diversity in the workplace, implying a higher level of learning on the job, as well as staff training and other human capital investment by companies.
This data also helps illuminate the practical relevance of these aggregate country-level findings for business, policymakers and employees. Whereas employers and job seekers generally rely on formal education degrees and job titles to determine fit for a role—and national and international statistics agencies similarly capture a country’s human capital endowment in this way22—the LinkedIn data reveals that understanding an economy’s human capital base at the actual skills level is crucial because formal qualifications alone are often insufficiently meaningful and job titles may imply very different skills requirements in different industries and geographies.23 Therefore, skills are
a foundational block in formulating future workforce and human capital strategies.
Figures 11(a) to (d) illustrate these points through the case of LinkedIn members with the job titles: (a) Care Manager, across the Hospitals & Healthcare and Non-profit industries; (b) Product Development Engineer, across the Automotive and Semiconductor industries; (c) Data Analyst, across the Market Research and Oil & Energy industries; and (d) Data Analyst, across the Financial Services and Consumer Retail industries.
For example, whereas there is some overlap between the skillset of care managers across the two industries, the non-profit sector version of the role requires a much stronger skillset related to crisis intervention whereas the profile of the same role in the hospitals & healthcare industry is more focused on healthcare management. Similarly, the skills profile of product development engineers in the automotive and semiconductor industries differs greatly. The higher the skills overlap between two industries, the easier it is to transfer between them. For example, there is little skills overlap between LinkedIn members with the job title “data analyst” in the market research and oil & energy industries. By contrast, data analysts in the financial services and consumer retail industries exhibit very similar skills.
Practically, this degree of detailed skills information can help business, policymakers and employees in two distinct ways. First, it reduces skills gaps by helping employers—and employees—understand better how far they can cast their net when job searching and recruiting and which set of skills may be most transferable across industry boundaries. For example, an employer in the financial services industry facing a gap in data analyst roles can reasonably expect to consider applicants from the consumer and retail industry given the overlapping skillsets despite the different
Human Capital Index 2016 and LinkedIn.
Univ
ersi
ty s
kills
div
ersi
ty
Workplace skills diversity
0.6 0.7 0.8 0.9 1.0 1.1 1.2 1.3 1.4 1.5
60
65
70
75
80
85
90
Malaysia
Italy
Israel
Greece
France
Finland
Denmark ArgentinaUnited KingdomSwitzerlandSweden
Spain
SingaporeRomania
PortugalNorway
United States Czech Republic
Colombia
ChileCanada
Brazil
Belgium
Australia
Netherlands
High university diversity,low work skills diversity
Low university diversity,low work skills diversity
High university diversity,high work skills diversity
High university diversity,low work skills diversity
Figure 10: Skills diversity in education and in the workplace
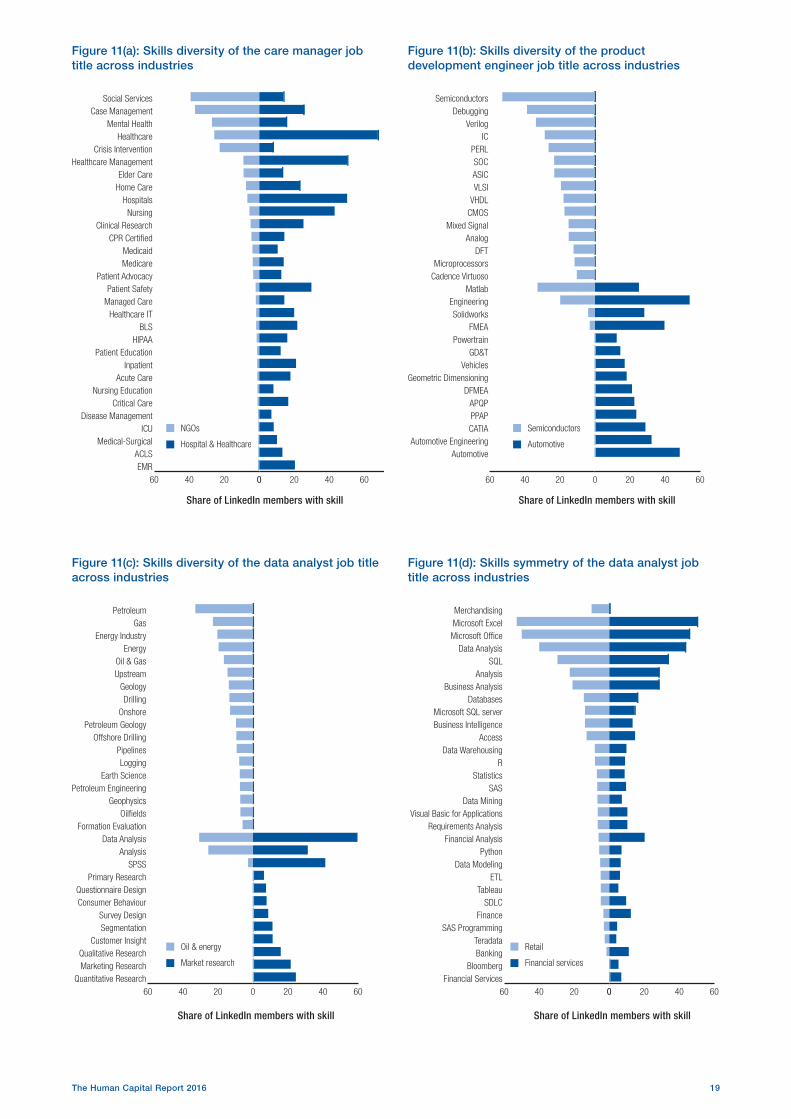
19The Human Capital Report 2016
0 20 40 6060 40 20 0Financial Services
BloombergBankingTeradata
SAS ProgrammingFinance
SDLCTableau
ETLData Modeling
PythonFinancial Analysis
Requirements AnalysisVisual Basic for Applications
Data MiningSAS
StatisticsR
Data WarehousingAccess
Business IntelligenceMicrosoft SQL server
DatabasesBusiness Analysis
AnalysisSQL
Data AnalysisMicrosoft OfficeMicrosoft ExcelMerchandising
20 40 6060 40 20 0
AutomotiveAutomotive Engineering
CATIAPPAPAPQP
DFMEAGeometric Dimensioning
VehiclesGD&T
PowertrainFMEA
SolidworksEngineering
MatlabCadence VirtuosoMicroprocessors
DFTAnalog
Mixed SignalCMOSVHDLVLSIASICSOC
PERLIC
VerilogDebugging
Semiconductors
Figure 11(d): Skills symmetry of the data analyst job title across industries
Figure 11(b): Skills diversity of the product development engineer job title across industries
Share of LinkedIn members with skill
Share of LinkedIn members with skill
Semiconductors
Automotive
20 40 6060 40 20 0Quantitative Research
Marketing ResearchQualitative Research
Customer InsightSegmentationSurvey Design
Consumer BehaviourQuestionnaire Design
Primary ResearchSPSS
AnalysisData Analysis
Formation EvaluationOilfields
GeophysicsPetroleum Engineering
Earth ScienceLogging
PipelinesOffshore Drilling
Petroleum GeologyOnshore
DrillingGeology
UpstreamOil & Gas
EnergyEnergy Industry
GasPetroleum
Figure 11(c): Skills diversity of the data analyst job title across industries
Share of LinkedIn members with skill
Oil & energy
Market research
0 20 40 60 8060 40 20 0EMR
ACLSMedical-Surgical
ICUDisease Management
Critical CareNursing Education
Acute CareInpatient
Patient EducationHIPAA
BLSHealthcare IT
Managed CarePatient Safety
Patient AdvocacyMedicareMedicaid
CPR CertifiedClinical Research
NursingHospitals
Home CareElder Care
Healthcare ManagementCrisis Intervention
HealthcareMental Health
Case ManagementSocial Services
Figure 11(a): Skills diversity of the care manager job title across industries
Share of LinkedIn members with skill
NGOs
Hospital & Healthcare
Retail
Financial services

20 The Human Capital Report 2016
Table 2(a): Job titles with high skills transferability across industries
High skills transferabIlIty Skills-transferability score
HR Business Partner 0.94
Web Developer 0.92
Digital Marketing Specialist 0.91
Network Engineer 0.90
Network Administrator 0.90
Accountant 0.90
Web Designer 0.87
Registered Nurse 0.87
Financial Controller 0.87
Software Developer 0.86
Lawyer 0.85
Graphic Designer 0.85
System Administrator 0.84
Journalist 0.84
IT Project Manager 0.82
Financial Analyst 0.82
Bookkeeper 0.82
Social Media Manager 0.80
Psychologist 0.80
Software Engineer 0.78
Low skills transferability Skills-transferability score
Deputy 0.11
Consultant 0.14
Superintendent 0.17
Technologist 0.18
Contractor 0.19
Technician 0.20
Project Manager 0.22
Lecturer 0.22
Inspector 0.22
Engineer 0.27
Doctor 0.27
Designer 0.28
Coach 0.28
Strategist 0.29
Mechanic 0.29
Sales Representative 0.31
Product Manager 0.31
Developer 0.31
Author 0.31
Investigator 0.33
Table 2(b): Job titles with low skills transferability across industries
Source: LinkedIn.Note: For each job title, a lower score indicates that different industries require different skill
sets; a higher score indicates that different industries require similar skill sets. Scores normalized on a scale from 0 to 1.
Source: LinkedIn.Note: For each job title, a lower score indicates that different industries require different skill
sets; a higher score indicates that different industries require similar skill sets. Scores normalized on a scale from 0 to 1.
Source: LinkedIn.
Figure 12: The hundred largest talent flows between countries

21The Human Capital Report 2016
industries, as per Figure 11 (d), increasing the size of the firm’s potential talent pool and likely reducing time-to-hire.
Second, more specific assessments of the level of skills transferability between selected industries and selected professions could be used to inform reskilling and upskilling strategies, or even facilitate the wholesale retraining and redeployment of workers from one job function or industry to another based on skills-adjacency in industries disrupted by the Fourth Industrial Revolution.24 In the long term, countries can build resilience to labour market disruptions and changing job requirements by amplifying the diversity of their national skills base. Table 2 specifies the level of skills transferability for current job titles and roles across different industries (see Table 2).
Preparing talent for the futureThe degree of skills diversity varies country-by-country. However, just because a country has an abundance of a certain in-demand skill now, there is no guarantee that it will continue to do so indefinitely in the future. Data from LinkedIn’s Economic Graph25 makes it possible to visualize the inflow and outflow of human capital between countries—as workers with in-demand skills go where there is opportunity—to identify the specific skillsets countries are gaining and losing in the global marketplace for talent (Figure 12). A mapping of this kind of skills flows between countries is an opportunity for governments, businesses and employees alike to understand skills hotspots in near real-time.
As the Fourth Industrial Revolution disrupts firms’ business models and economies’ development strategies, countries will require larger pools of particular groups of relevant skills to guarantee their long-term economic success. One set of skills that will be in high demand over the coming years is related to science, technology, engineering and mathematics (STEM), and one measure of the future-readiness of industries and countries will be the breadth and depth of these skills within their overall skills pool. The Human Capital Index reveals that a significant
share of the world’s total graduate pool in STEM subjects—combining the Engineering, Manufacturing, Construction and Natural Sciences fields of study, per UNESCO’s classification—is produced by a relatively small number of countries, not surprisingly those with larger populations (see Figures 13 and 14). While proportionality to local population is also still an important factor in influencing demand, in a world with increasingly mobile talent, someone coming out of university with in-demand talent in any part of the world can become a potential recruit for anyone across the globe, giving rise to new global patterns of physical and digital talent mobility.
Economic Graph data analysed by LinkedIn for this Report shows how countries are gaining or losing in-demand skills, reflecting in part declining opportunity within some countries as well as growing demand in others—and vice versa for net inflows of specific skills. For example, Australia (18), Chile (51) and the United Arab Emirates (69) are all leading their regions in gaining technology-related skills while Mediterranean countries such as Greece (44)—but also Canada (9) and Finland (1)—are losing them (Table 3).26
To prepare talent for the Fourth Industrial Revolution, businesses must re-think their role as a consumer of ‘ready-made’ human capital and instead work with educators and governments to help education systems keep up with the needs of the labour market. Some companies understand this and are already investing in the continuous learning, re-skilling and up-skilling of their employees, but most employers still expect to obtain pre-trained talent from schools, universities and other companies. One important part of the solution is to look beyond formal qualifications, job titles and functions to reveal implicit skills and possibilities for re-skilling and up-skilling, especially in areas where there are global skills shortages and hence unmet demand.
For example, globally, only about 84,000 of LinkedIn’s 430 million members have the job titles Data Analyst or Data Scientist, a highly in-demand job function for which
Source: Human Capital Index 2016 and UNESCO.Note: Values in thousands.
Other: 313,457
Indonesia: 17,451 Russian Federation: 29,145
Japan: 38,988
United States: 67,448
China: 77,670
India: 77,950
Figure 13: Global distribution of tertiary degree holders
Source: Human Capital Index 2016 and UNESCO.Note: Values in thousands.
Other: 3,372
Japan: 195Indonesia: 206
Iran, Rep.: 335
Russian Federation: 561
United States: 568
India: 2,575
China: 4,666
Figure 14: Global distribution of recent graduates, STEM subjects
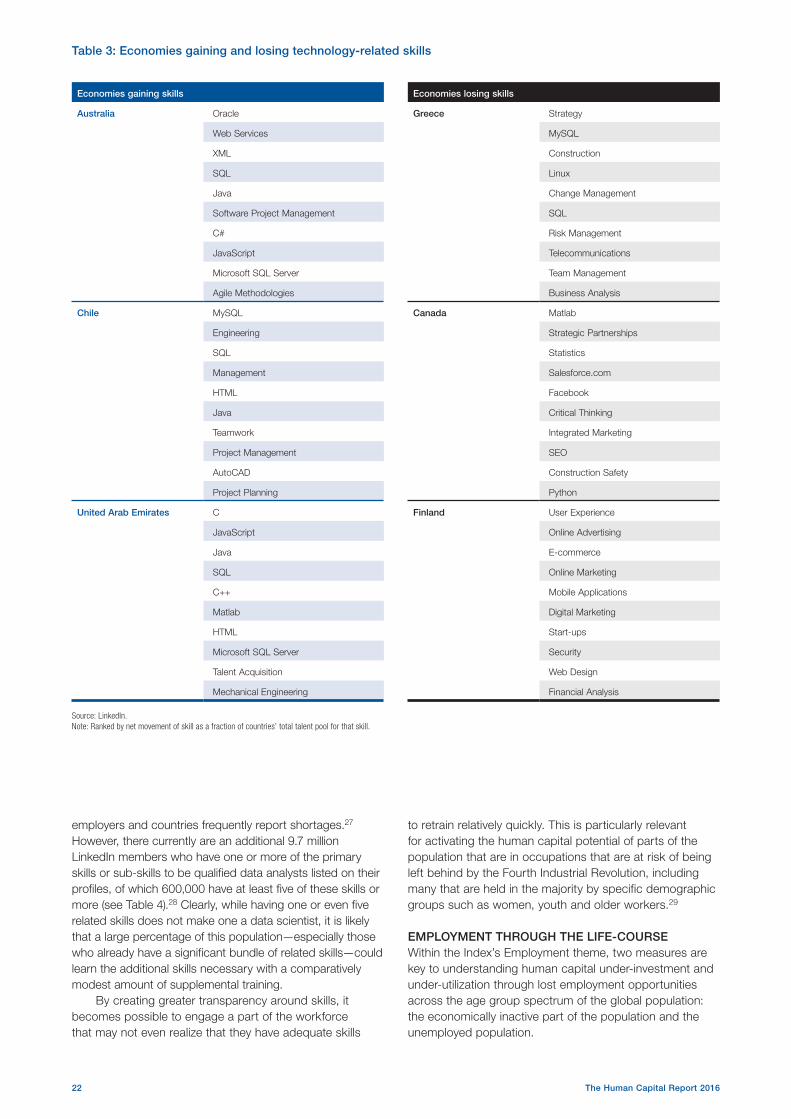
22 The Human Capital Report 2016
Table 3: Economies gaining and losing technology-related skills
Economies gaining skills
Australia Oracle
Web Services
XML
SQL
Java
Software Project Management
C#
JavaScript
Microsoft SQL Server
Agile Methodologies
Chile MySQL
Engineering
SQL
Management
HTML
Java
Teamwork
Project Management
AutoCAD
Project Planning
United Arab Emirates C
JavaScript
Java
SQL
C++
Matlab
HTML
Microsoft SQL Server
Talent Acquisition
Mechanical Engineering
Economies losing skills
Greece Strategy
MySQL
Construction
Linux
Change Management
SQL
Risk Management
Telecommunications
Team Management
Business Analysis
Canada Matlab
Strategic Partnerships
Statistics
Salesforce.com
Critical Thinking
Integrated Marketing
SEO
Construction Safety
Python
Finland User Experience
Online Advertising
E-commerce
Online Marketing
Mobile Applications
Digital Marketing
Start-ups
Security
Web Design
Financial Analysis
Source: LinkedIn.Note: Ranked by net movement of skill as a fraction of countries’ total talent pool for that skill.
employers and countries frequently report shortages.27 However, there currently are an additional 9.7 million LinkedIn members who have one or more of the primary skills or sub-skills to be qualified data analysts listed on their profiles, of which 600,000 have at least five of these skills or more (see Table 4).28 Clearly, while having one or even five related skills does not make one a data scientist, it is likely that a large percentage of this population—especially those who already have a significant bundle of related skills—could learn the additional skills necessary with a comparatively modest amount of supplemental training.
By creating greater transparency around skills, it becomes possible to engage a part of the workforce that may not even realize that they have adequate skills
to retrain relatively quickly. This is particularly relevant for activating the human capital potential of parts of the population that are in occupations that are at risk of being left behind by the Fourth Industrial Revolution, including many that are held in the majority by specific demographic groups such as women, youth and older workers.29
EMPLOYMENT THROUGH THE LIFE-COURSEWithin the Index’s Employment theme, two measures are key to understanding human capital under-investment and under-utilization through lost employment opportunities across the age group spectrum of the global population: the economically inactive part of the population and the unemployed population.

23The Human Capital Report 2016
The economically inactive population includes those not looking to join the labour force for the time being—including individuals who are not of a working age, students enrolled in full-time education, the elderly, primary caregivers in families who take on this responsibility full-time, as well as those who are unable to work due to ill health and those who have abandoned their attempts to find work in the labour market out of an expectation that they won’t find any. The economically active population includes those in any kind of work: part-time or full-time, short-term or long-term, as well as individuals actively looking for work—the unemployed. Despite some internationally coordinated efforts at better measurement, the informal labour market, care work, short-term work and own-account work remain inadequately reflected in conventional labour statistics.
Along the world population’s globally aggregated life-cycle, a series of peaks and troughs can be observed. Among those under age 25, we see high levels of economic inactivity, mostly relating to study and transition-to-work patterns. The expectation that young people should work between the ages of 18 and 24 varies by economy, and this is reflected in the Index’s data. We observe some of the highest unemployment rates globally
among young adults in countries such as Serbia (57), South Africa (88), Spain (45) and Tunisia (101). Only 38 economies in the Index have youth unemployment rates in the single-digits, with Qatar (66) and Japan (4) particularly notable in this regard.
On the other end of the age group spectrum, after the age of 54 we observe a sharp rise in the global economically inactive population—with notable exceptions, for example, in Iceland (20) and Switzerland (3). Most countries see a more dramatic drop in economic activity after the age of 65, corresponding to the legal retirement age in many economies. Nevertheless, about a quarter of the world’s population age 65 and over remains active in the labour force. In predominantly lower-income economies, such as Malawi (114), older people often work past their country’s healthy life expectancy out of economic necessity. By contrast, in higher-income economies such as New Zealand (6), a significant share of older workers remains economically active, corresponding to higher life expectancies, enabling their country to leverage the human capital potential of an experienced ‘silver’ workforce. Among a cluster of countries—principally in the Middle East and North Africa but also, for example, in Korea, Rep. (32)—low workforce participation during the prime working
Table 4(a): LinkedIn members by job title with data specialism
Job TitleLinkedIn members
worldwide with job title
Data Analyst 60,273
Data Scientist 12,680
Database Analyst 4,357
Business Data Analyst 1,709
Senior Data Scientist 1,691
Sr. Data Analyst 1,131
Data Analysis 1,118
Master Data Analyst 1,001
Number of data related skills
LinkedIn members worldwide with number of skills or more
10 37,689
9 60,419
8 98,284
7 169,351
6 305,266
5 576,310
4 1,097,849
3 2,065,318
2 3,870,376
1 9,708,214
Table 4(b): LinkedIn members with data analysis skills
Source: LinkedIn.
Source: LinkedIn.
Table 5: Global population by workforce participation status and age
Age groupEmployed labour force,
% of economically active populationUnemployed labour force,
% of economically active populationEconomically inactive population,
% of total population
15-24 32.36 13.72 53.92
25-54 73.16 5.58 21.26
55-64 56.12 3.72 40.16
65+ 25.78 2.94 74.22
Source: Human Capital Index 2016 and ILOSTAT.

24 The Human Capital Report 2016
age of 25–54 is related to women’s low participation in the labour market.
Across all age groups, a particular case is presented by those considering themselves underemployed–people who would be willing and available to work additional hours but who have failed to obtain such work under prevailing labour market conditions. This ranges from one in three young people age 15-24 in countries such as Ethiopia (119), Indonesia (72) and Paraguay (82) to about 10% of the total older workforce in many European countries.
Types of employmentFull-time work for a single employer is one of a number of avenues through which people earn their livelihood and develop their human capital potential. It is, however, far from the only form of employment. Some people form companies and become employers themselves. Others take part in freelance or limited-time contract work across a wide range of sectors. Especially in the developing world, many people contribute to a family business, often in agriculture.
On average, based on the available data from the Human Capital Index, we estimate that, globally, around 53% of the working age population are employees of some kind—whether working formally for others, working for others without a formal contract in the informal economy or contributing to a family business.30 Another 13% are self-employed, own-account workers, 4% are unemployed and 20% are inactive—having dropped out of, or never entered, the labour market (Figure 15).
Regular employment is highest in countries such as Sweden, Iceland, Switzerland and Germany. More than a quarter of all workers in Bhutan (91), Vietnam (68) and Colombia (64) are own-account workers. In addition, 30% of workers in Ethiopia (119) and 22% in Indonesia (72) are underemployed while in countries such as Morocco (98), Turkey (73), Egypt (86) and South Africa (88) around a third of the population is economically inactive.
Digitization of labour marketsAdvances in technology are leading to a reformulation of the global work landscape. As revealed in the World Economic Forum’s recent Future of Jobs Report, digital disruptions, together with demographic and socio-economic drivers of change are transforming traditional employment. Some disruptions to industries will necessitate a shift in employees’ skillsets, while others will lead to wholly new jobs or make particular roles redundant. A number of these disruptions are impacting the nature of what it means to be an employee, as work begins to be outsourced in new formats. The Future of Jobs Survey data revealed that global business leaders perceive changing work environments and flexible working arrangements to be a key disruption—on average, ahead of drivers of change such as machine learning and automation—and as one that is already felt across countries and industries (Figure 16).
Own-account workers, in their reformulated role within the disrupted labour market, have been re-imagined as the “contingent workforce”, “on-demand workforce”, “online platform economy”, “alternative work arrangements” and “gig economy”. The ways in which workers engage with those formats vary from moonlighting to full-time freelance work, as well as, in some cases, building a business.
0 20 40 60 80 100
Vietnam
Ethiopia
Kazakhstan
Sweden
Iceland
Thailand
Switzerland
Bhutan
Colombia
Jamaica
Uruguay
Paraguay
New Zealand
Norway
Cyprus
Lithuania
Germany
Czech Republic
Dominican Republic
Netherlands
Azerbaijan
Denmark
Singapore
Estonia
United Kingdom
Portugal
Japan
Canada
Finland
Spain
Latvia
Ecuador
Panama
Israel
Argentina
Russian Federation
Slovak Republic
Philippines
El Salvador
France
Austria
Luxembourg
Armenia
Indonesia
Malaysia
Greece
Slovenia
Ireland
Bulgaria
Costa Rica
Belgium
Poland
Mexico
Ukraine
Hungary
Romania
Senegal
Guatemala
Macedonia, FYR
Serbia
Croatia
Italy
Albania
South Africa
Malta
Sri Lanka
Egypt
Turkey
Morocco
Moldova
Figure 15: Distribution of the working age population by employment status, selected countries
Percent
Source: Human Capital Report 2016 and ILOSTAT.
Employers
Employed
Underemployed
Own-account
Unemployed
Inactive

25The Human Capital Report 2016
Some workers enter these new digital landscapes by choice, others more by necessity—seeking to supplement their income. Moreover, a growing number of participants in these roles are those previously outside the labour force due to not being able to find work suiting their circumstances.
Both the real and perceived blurring of boundaries between traditional and own-account work as well as the growth of own-account work through digital platforms has given rise to many uncertainties in modern labour markets—and many new opportunities, if managed well. Using both public and private data from a selection of digital talent platforms, we aim to shed light on some of these unknowns and identify potential opportunities.
First, although digital formats for connecting people to work are relatively new, the act of ad-hoc work or self-employment is not. With a global average of 13% own-account workers, the world working-age population is
already deeply engaged in analogue formats of on-demand work. As Figure 15 highlights for economies where this data is available, these figures vary significantly by economy. Workers enter into formal agreements either directly or through traditional talent platforms, including staffing firms, to provide their skills and services and this is still the majority of own-account work in most countries. Emerging digital platforms have begun to provide potential workers with easy access to an online marketplace—in effect, a newly digitized labour market. This type of work can range from being based on long-term relationships to short-term gigs and can fall under various regulatory classifications.31 Economic Graph data analysed by LinkedIn for this Report indicates that in each country, between 1.8% to 2.6% of members identify themselves as being part of the analogue or digital on-demand economy (Figure 17). Searching the public information listed on members’ profiles for various keywords
0 10 20 30 40 50
0 10 20 30 40 50
Figure 16: Drivers of change, time to impact on business modelsShare of respondents, %
DEMOGRAPHIC AND SOCIO-ECONOMIC
TECHNOLOGICAL
Changing nature of work, flexible work
Middle class in emerging markets
Climate change, natural resources
Geopolitical volatility
Consumer ethics, privacy issues
Longevity, ageing societies
Young demographics in emerging markets
Women’s economic power, aspirations
Rapid urbanization
Mobile internet, cloud technology
Processing power, Big Data
New energy supplies and technologies
Internet of Things
Sharing economy, crowdsourcing
Robotics, autonomous transport
Artificial intelligence
Adv. manufacturing, 3D printing
Adv. materials, biotechnology
n Impact felt already
n 2015–2017
n 2018–2020
n 2021–2025
n Impact felt already
n 2015–2017
n 2018–2020
n 2021–2025
Source: Future of Jobs Survey, World Economic Forum.Note: Names of drivers have been abbreviated to ensure legibility.

26 The Human Capital Report 2016
to identify gig-economy workers, LinkedIn also analysed the on-demand economy at an industry level. As illustrated in Figure 18, as seen through the prism of LinkedIn’s membership, the freelancer economy is most prevalent in the Media, Entertainment and Information industry, at 6%, specifically in writing and editing (21%) and graphic design (14%).
Second, own-account work is growing, including own-account work enabled by digital platforms, but digital formats remain a small portion of own-account work. Some of the fastest growing new opportunities for work in countries such as the United States (24) are on such platforms.32 Recent research by Harvard economist Lawrence Katz and Princeton’s Alan B. Krueger finds that “all … net employment growth in the U.S. economy from 2005 to 2015 [9.4 million jobs] appears to have occurred in alternative work arrangements.”33 However, these arrangements for the most part did not involve work arranged through online gig-economy platforms, which Katz and Krueger estimate to actually only account for 0.5% of the U.S. labour force in 2015. Similarly, De Groen and Maselli estimate that, as of 2015, digital talent platforms accounted for a small fraction of total employment across the European Union.34 However, both sets of researchers acknowledge that the gig workforce is growing rapidly, with some estimates suggesting that 40% of U.S. workers—about 60 million people—might be accessing work opportunities through digital talent platforms by the year 2020. According to the U.S. Congressional Research Service, “to date, no large-scale official data have been collected; and there remains considerable uncertainty about how to best measure this segment of the labour force.”35 LinkedIn’s data was able to shed some light on whether online gig-economy workers represent a new form of work or a continuation and digitization of existing analogue forms of own-account work. LinkedIn specifically analysed the overlap between
members who identify themselves primarily as gig-economy workers and those who call themselves “owners” or “entrepreneurs.” As can be seen in Figure 17, within the LinkedIn membership, there is little overlap between the two, providing further support for the hypothesis that growth in the online gig economy is thus far primarily the result of connecting those who were previously own-account workers.
Third, digital platforms are prevalent in both the developed, emerging and developing world, where the number of own-account and informal workers are traditionally higher. In China (71), Didi Chuxing,36 the country’s largest on-demand transportation platform, is currently utilized by some 13.3 million registered drivers (as of April 2016, a 600% year-on-year growth rate), accounting for 4.2% of overall mobility industry employment in China. Of these, 1.86 million drivers (14%) are women, and also include other demographic groups such as formerly laid-off workers and small business owners. Seventy-five percent of drivers use the platform part-time, driving less than four hours per day, while 78.1% reported a more than 10% income increase—and 39.5% a more than 30% income increase—from using the platform. Countries such as the Philippines (49) and Kenya (102) have staked large parts of their human capital development strategies on digital business process outsourcing (BPO). Companies such as Sama37 have successfully pioneered business models linking low-income populations in parts of Africa and South Asia to digital work.
Fourth, digital work platforms can span a range of both high-skilled, high-paid work and low-skilled, low-paid work as well as varied durations of tasks and relationships associated with them. The selection of platforms highlighted below represent a very wide-range of skills between them.
Less evident but equally illuminating is the range of skills and pay rates within some of these platforms. For
Source: LinkedIn.Note: Industry averages based on countries shown in Figure 17.
0 1 2 3 4 5 6 7 8 9 10
Energy
Mobility
Public Sector & Non-Profit
Financial Services & Investors
Healthcare
Information Technology & Telecomms
Basic and Infrastructure
Consumer
Professional Services
Media, Entertainment and Information 6%
4%
4%
3%
3%
3%
3%
2%
2%
2%
Figure 18: Share of freelancers in selected industries
Proportion of LinkedIn members (%)
Source: LinkedIn.
0 1 2 3 4 5 6 7 8 9 10
Freelancers
Overlap
Owners
United States
Italy
Canada
Greece
Australia
United Kingdom
Israel
Argentina
Finland
Colombia
Chile
Singapore
Malaysia
Hong Kong
Spain
Peru
France
United Arab Emirates
2%
4%
2%
2%
2%
2%
2%
3%
2%
3%
2%
2%
1%
2%
2%
2%
2%
1%
Figure 17: Freelancers and owners across economies, distinction and overlap
Proportion of LinkedIn members (%)

27The Human Capital Report 2016
Table 6: Overview of digital talent platforms
Digitized labour markets in: Mobility Knowledge Work Care
Example: Uber Upwork Care.com
How many providers Over 1 million drivers 12 million freelancers 8.9 million caregivers
How many clients — 5 million clients 11 million families
Where Approximately 70 countries Freelancers from more than 180 countries; top earning: United States, Ukraine, Pakistan, India and Philippines; top commissioning: United States, United Kingdom, Canada, Australia
16 countries spanning North America and Western Europe
United States represents 85% of platform members
Full-time / part-time 50% of drivers work on average less than 10 hours per week*
— 41% full-time care 59% part-time care
Demographics of providers
22% in 50-64 age band; 36% economically inactive before joining; 49% worked as drivers before; 14% female, 37% college-educated; 74% motivated by maintaining a steady income
High-skilled: 27% have a masters degree or higher; range across the working age population and retirees; valuing opportunity for flexibility; 60% started freelancing more by choice than necessity*
94% female, 61% college-educated; experienced care professionals moonlighting, college students 'doing errands'
Demographics of clients — Clients range from sole proprietors to Fortune 500 companies. 50% of clients are start-ups.
82% female; just above the median United States income
Range of services Transportation services encompassing cars with varying levels of luxury, car pooling
Any knowledge-based worked that can be done online: digital development, graphic design, content writing, customer support and others
Childcare to senior care, pet care, housekeeping and a variety of other services
Most in-demand category UberX* Web, mobile and software development (hourly rates up to US$150 and more)
Childcare (hourly rate of US$14.32)
Skills with high relative increase in demand
— Developers with skills in: AngularJS; Node.js; WooCommerce (eCommerce)
Full-time and part-time nannies, childcare
Source: Uber, Upwork, Care.comNote: U.S. figures only where indicated by an asterisk (*).
Source: Care.com Source: Care.com
0 5 10 15 20
Full-time Nanny
Pet Care
Senior Care
Part-time Nanny
Special Needs
Babysitter
Housekeeping
General Errands
Shopping
Parties & Events
Moving Services
Vacation Services
Tutoring
0 5 10 15 20
Driving $ 16.93
Math $ 16.99
English $ 17.03
Social Studies $ 17.09
Cooking & Sewing $ 17.33
Science $ 17.43
Art $ 17.51
Test Prep $ 17.56
Dance $ 17.83
Computers $ 18.05
Special Education $ 18.12
Foreign Language $ 18.12
Sports & Fitness $ 18.22
Musical Instruments $ 18.26
Music & Drama $ 18.40
Business $ 18.99
Engineering $ 19.28
Figure 19: Average hourly pay rate (US$) for care roles(Care.com)
Figure 20: Average hourly pay rate (US$) for tutoring(Care.com)
Hourly pay rate (US$)Hourly pay rate (US$)
Pay rate in 2014
Increase in 2015
Pay rate in 2014
Increase in 2015

28 The Human Capital Report 2016
example, Care.com data shows not only the rates for what was in the past often informal labour—pet care, babysitting, etc. (Figure 19)—but also reveals the pay premium placed on work such as tutoring over traditional care roles (Figure 20).
Online labour markets, crowdsourcing and e-lancing platforms are also creating fluidity in organizational boundaries. Though in the beginning they mostly involved data entry and unskilled work, such platforms now increasingly involve advanced highly-developed specialist skills as well (Table 7).
Finally, online labour markets—cross-sectoral talent platforms such as LinkedIn, Njorku or Dajie and industry-focused talent platforms such as Care.com, Didi, Uber and Upwork—are all shedding new light on information that is either wholly or partly missing from most international and national statistics. For example, the online gig economy provides some transparency on the work of those that were engaged formerly in weakly formalized contingent and own-account work labour markets, such as those in the care economy. Additionally, in the earlier section on learning we outline some of the findings on skills that are currently blind spots in international statistics. To the extent that digital talent platforms make large segments of the labour market more easily visible and measurable, often for the first time, there is unprecedented opportunity for smart regulation.
CONCLUSIONSGlobally, nearly 35% of our human capital potential remains undeveloped, due to lack of learning or employment opportunities or both. The Human Capital Index reveals specific gaps in each country and points to the future outlook for major economies. It finds that many of today’s education systems are disconnected from the skills needed to function in today’s labour markets. While current education systems seek to develop cognitive skills, non-cognitive skills that relate to an individual’s capacity to collaborate, innovate, self-direct and problem-solve are increasingly important. Current education systems are also front-loaded in a way that is not suited to current or future labour markets. In many countries, education investments have not resulted in labour market returns for individuals and their families, due to unemployment, underemployment or large demographic segments remaining economically inactive. In others, regardless of education levels, work may be precarious, may insufficiently tap into existing
knowledge or may not invest in the lifelong learning and retraining that must take place simultaneously throughout the work life cycle.
Technological change may be further exacerbating some of these challenges, but it is also providing a unique new opportunity to address and transform these concerns, both in learning and employment. These developments imply that we need to rethink how the world’s human capital endowment is invested in and leveraged for social and economic prosperity and the well-being of all. Governments, business leaders, educational institutions and individuals must each understand the magnitude of the change underway and fundamentally rethink the global talent value chain. In order to be proactive in our response to the future needs of economies, societies and individuals, we must re-think what it means to learn, what it means to work and what is the role of various stakeholders in ensuring that people are able to fulfil their potential.
The potential for technology to transform educational access and quality has been well documented. In addition, in a world where 13% of the working age population are own-account workers, 4% are unemployed, a further 7% are underemployed and 20% are inactive (in addition to 3 out of 4 increasingly healthy, and in many cases highly skilled, over 65 year-olds)—in all, some 44% of the world’s working age population, or 2 billion people—new technologies may also present an enormous opportunity to unlock and nurture the human capital potential of a sizeable share of the population around the globe. A wide range of research has shown the existing and potential benefits in the form of flexibility, accessibility, transparency and scale provided by new formats of employment. For workers, technology is lowering the access threshold to employment and multiplying opportunities to form new client-provider relationships and find new work. For employers, digital labour markets are expanding access to fresh talent. Yet well-founded concerns also remain about the fragmentation of work and its effects on income equality, income security and social stability, amongst other areas of concern.
Much of the focus of recent policymaking in labour markets has been on the challenges of managing new formats of work. Updated social safety nets and modern forms of unionization—such as digital freelancers’ unions38—are also beginning to emerge in some countries to complement new models of work. It will be important for legislators to develop agile, thoughtful and forward-thinking governance to manage and regulate the rapidly emerging
Table 7: In-demand skills and service functions on Upwork
Upwork category In-demand Fastest growth
Web, mobile and software development
Developers (front- and back-end) with skills in: Android and iOS; HTML5, jQuery and Javascript; PHP
Developers (front- and back-end) with skills in: AngularJS; Node.js; WooCommerce (eCommerce)
Graphic design and creative content
Graphic, web and logo designers; Illustrators UX and UI designers; 3D modelers
Advertising, sales and digital marketing
Internet researchers; SEO and SMM marketers; lead-generation specialists
B2B marketers; pay-per-click advertising specialists; Email and marketing automation experts
Source: Upwork.

29The Human Capital Report 2016
digital labour market as well as the disruptions to traditional forms of work, for optimal socio-economic results. It is also imperative that, in parallel, policymakers work with other stakeholders to deliver on the promise of technology for education and lifelong learning.
Businesses—whether traditional or new—will need to be a part of designing a new social contract, including re-thinking their role as a consumer of ‘ready-made’ human capital. Companies will need to rethink jobs as bundles of skills and invest in the lifelong learning, re-skilling and up-skilling of their present employees in addition to working closely with education systems to support the development of both general and specialized employability skills. In addition, while business cycles can naturally lead to peaks and troughs in employment, any socially responsible business in today’s deeply interconnected and transparent world must consider how it can contribute to mitigating unemployment and enhancing people’s abilities to earn a livelihood.
While much has been written about the various positive and negative employment scenarios that may emerge from the current wave of technological change, these forecasts are highly dependent on the actions we take today to leverage opportunities and mitigate risks. The private sector and public sector, along with other stakeholders, will need to work together to lead adaptation to the new world of learning and work. The World Economic Forum’s platform aims to provide this space, complementing the analysis in this Report and other insight tools, with a space for dialogue and action that is critical to our collective future.
REFERENCESAcemoglu, D. and D. Autor, “What Does Human Capital Do? A Review of
Goldin and Katz’s The Race Between Education and Technology”, NBER Working Paper 17820, The National Bureau of Economic Research, 2012, http://www.nber.org/papers/w17820.
Angrist, N., Patrinos, H. and M. Schlotter, “An Expansion of a Global Data Set on Educational Quality: A Focus on Achievement in Developing Countries”, World Bank Policy Research Working Paper 6536, 2013.
Barro, R. and J.W. Lee, “A New Dataset of Educational Attainment in the World, 1950–2010”, NBER Working Paper 15902, The National Bureau of Economic Research, 2013, http://www.nber.org/papers/w15902.
Bean, C., Independent Review of UK Economic Statistics, March 2016.
Boarini, R., M. Mira d’Ercole and G. Liu, “Approaches to Measuring the Stock of Human Capital: A Review of Country Practices”, OECD Statistics Working Papers, 2012/04, Organisation for Economic Cooperation and Development, 2012, http://dx.doi.org/10.1787/5k8zlm5bc3ns-en.
Broadbent, S., “Collective Intelligence: Questioning Individualised Approaches to Skills Development”, in: IPPR and J.P. Morgan Chase New Skills at Work Initiative, Technology, Globalisation and the Future of Work in Europe: Essays on Employment in a Digitised Economy, March 2015.
Brynjolfsson, E. and A. McAfee, The Second Machine Age: Work, Progress, and Prosperity in a Time of Brilliant Technologies, 2014, http://www.secondmachineage.com.
Burning Glass Technologies, Crunched by the Numbers: The Digital Skills Gap in the Workforce, 2015.
Cappelli, P. and J. Keller, “Classifying Work in the New Economy”, Academy of Management, vol. 38, no. 4, 2013, pp. 575–596.
Carnevale, A., Jayasundera, T. and D. Repnikov, “Understanding Online Job Ads Data: A Technical Report”, Georgetown University Center on Education and the Workforce, April 2014.
CEDEFOP (European Centre for the Development of Vocational Training), Briefing Note: Preventing Skills Obsolescence, July 2012.
Citi GPS: Global Perspectives & Solutions, Technology at Work 2.0: The Future Is Not What It Used to Be, January 2016.
Coase, R., “The Nature of the Firm”, Economica, Volume 4, Number 16, November 1937.
Congressional Research Service, What Does the Gig Economy Mean for Workers?, 2016.
De Groen, W. and I. Maselli, “The Impact of the Collaborative Economy on the Labour Market”, CEPS Special Report No. 138, Centre for European Policy Studies, June 2016.
Dorn, D. and D. Autor, “This Job is Getting Old: Measuring Changes in Job Opportunities Using Occupational Age Structure”, NBER Working Paper 14652, 2009.
Einav, L. and J. Levin, “The Data Revolution and Economic Analysis”, NBER Working Paper 674019, 2014.
Fengler, W., “Don’t let perfect be the enemy of good: To leverage the data revolution we must accept imperfection”, Brookings, April 2016, http://www.brookings.edu/blogs/future-development/posts/2016/04/14-big-data-revolution-technologies-fengler.
Goodhart, C. and M. Pradhan, “Can Demographics Reverse Three Multi-Decade Trends?”, Morgan Stanley Research, October 2015, http://www.morganstanley.com/ideas/demographic-solution-to-inequality.
Hanushek, E., “Economic growth in developing countries: The role of human capital”, Economics of Education Review, vol. 37, 2013, pp. 204–212.
Hanushek, E., Woessmann, L. and L. Zhang, “General Education, Vocational Education, and Labor-Market Outcomes over the Life-Cycle”, IZA DP No. 6083, 2011.
Hausmann, R., C. Hidalgo, et al., “The Atlas of Economic Complexity”, Centre for Economic Development at Harvard University, http://atlas.cid.harvard.edu.
Heckman, J., “Schools, Skills, and Synapses”, IZA DP No. 3515, 2008.
ILO, World Employment and Social Outlook 2015: The Changing Nature of Jobs, 2015.
Infosys, Amplifying human potential: Education and skills for the fourth industrial revolution, 2016.
Jeon, S., “Enhancing Employment for Women, Youth and Older Workers: Why Skills Strategies Matter”, in: Global Talent Competitiveness Index 2014, edited by B. Lanvin and P. Evans, 2014, http://global-indices.insead.edu/documents/INSEADGTCIreport2014.pdf.
JPMorgan Chase Institute, Paychecks, Paydays, and the Online Platform Economy: Big Data on Income Volatility, February 2016.
Katz, L. and A. Krueger, “The Rise and Nature of Alternative Work Arrangements in the United States, 1995-2015”, Working Paper, National Bureau of Economic Research, March 2016.
Lutz, W. et al.,“Validation of the Wittgenstein Centre Back-projections for Populations by Age, Sex, and Six Levels of Education from 2010 to 1970”, IIASA Interim Report IR-15-008, International Institute for Applied Systems Analysis, April 2015, http://www.iiasa.ac.at/publication/more_IR-15-008.php.
Manca, F., “Measuring skills shortages in real time”, OECD Skills and Work Blog, March 2016, https://oecdskillsandwork.wordpress.com/2016/03/16/measuring-skills-shortages-in-real-time/.
Mandel, M. and J. Scherer, “A Low-Cost and Flexible Approach for Tracking Jobs and Economic Activity Related to Innovative Technologies”, Nesta Working Paper No. 15/11, June 2015, www.nesta.org.uk/wp15-11.
Manyika, J., Lund, S., Robinson, K., Valentino, J. and R. Dobbs, “A Labour Market that Works: Connecting talent with opportunity in the digital age”, McKinsey Global Institute, June 2015.
OECD, Universal Basic Skills: What Countries Stand to Gain, 2015.
Quartz, “The Scariest Thing About the Gig Economy is How Little We Actually Know About It”, February 2016.

30 The Human Capital Report 2016
Reamer, A., “Using Real-Time Labor Market Information on A Nationwide Scale: Exploring the Research Tool’s Potential Value to Federal Agencies and National Trade Associations”, Credentials that Work Programme, Jobs for the Future, April 2013.
Reimsbach-Kounatze, C., “The Proliferation of “Big Data” and Implications for Official Statistics and Statistical Agencies: A Preliminary Analysis”, OECD Digital Economy Papers, No. 245, 2015.
Rissing, B., G. Gereffi, R. Ong and V. Wadhwa, “Where the Engineers Are”, Issues in Science and Technology, vol. 23, issue 3, 2005, http://issues.org/23-3/wadhwa.
Rizzo, M., Kilama, B. and M. Wuyts, “The Invisibility of Wage Employment in Statistics on the Informal Economy in Africa: Causes and Consequences”, The Journal of Development Studies, 51:2, pp. 149–161, 2015.
Ross, A., The Industries of the Future: How the Next 10 Years of Innovation Will Transform Our Lives at Work and Home, 2016.
Schwab, K., The Fourth Industrial Revolution, 2016.
SHRM Foundation, “Engaging and Integrating a Global Workforce”, Report prepared by The Economist Intelligence Unit, February 2015.
Spink, J., “Measuring learning: Why we need to work together”, EIU Perspectives, 5 November 2015, www.eiuperspectives.economist.com/talenteducation/measuringlearningwhyweneedworktogether.
Staats, S., “Five Questions for Ruth Levine on How to Close the Gender Data Gap”, Work in Progress: The Hewlett Foundation Blog, The William and Florea Hewlett Foundation, May 2016.
UNCTAD, “Global Assessment of Sex-Disaggregated ICT Employment Statistics: Data Availability and Challenges on Measurement and Compilation”, UNCTAD Technical Notes on ICT for Development, no. 4, 2016.
UNDP, Human Development Report 2015: Work for Human Development, 2015.
Upwork and Freelancers Union, Freelancing in America 2015, October 2015.
Varkey GEMS Foundation, Global Teacher Status Index, 2013.
Winthrop, R., “The global ‘100-year gap’ in education standards”, Brookings Center for Universal Education, April 29, 2015, http://www.brookings.edu/blogs/education-plus-development/posts/2015/04/29-global-100-year-gap-education-standards-winthrop.
Wright, J., “Making a Key Distinction: Real-Time LMI & Traditional Labor Market Data”, Emsi Blog, February 2012, http://www.economicmodeling.com/2012/02/07/making-a-key-distinction-real-time-lmi-traditional-labor-market-data.
World Bank, World Development Report 2016: Digital Dividends, 2016.
World Economic Forum, The Human Capital Report 2015, 2015.
———, The Global Gender Gap Report 2015, 2015.
———, The Future of Jobs: Employment, Skills and Workforce Strategy for the Fourth Industrial Revolution, 2016.
———, New Vision for Education: Unlocking the Potential of Technology, 2015.
———, New Vision for Education: Fostering Social and Emotional Learning through Technology, 2016.
NOTES 1 This updated definition of human capital comes from Bean, C.,
Independent Review of UK Economic Statistics, March 2016, p 104. It goes on to add: “Perhaps more so than in the past, human capital is a key driver of a successful economy, as routine tasks are automated and the premium paid to creativity rises.”
2 See Varkey GEMS Foundation, 2013 and Winthrop, R., 2015.
3 See Schwab, K., 2016 and Ross, A., 2016.
4 See Citi GPS: Global Perspectives & Solutions, Technology at Work 2.0: The Future Is Not What It Used to Be, January 2016.
5 See World Bank, World Development Report 2016: Digital Dividends, 2016.
6 See Acemoglu, D., et al, 2012.
7 See B20 Employment Taskforce, http://en.b20-china.org/taskforce/34 (accessed June 2016).
8 See European Commission, “Ten actions to help equip people in Europe with better skills”, Press Release, Brussels, 10 June 2016, http://europa.eu/rapid/press-release_IP-16-2039_en.htm (accessed June 2016).
9 This is, however, a simplifying assumption, since countries’ exact population distributions tend to bifurcate into those that are ageing and those experiencing a “youth bulge”, with a small cohort of countries undergoing a demographic transition with the potential of a reaping a temporary “demographic dividend” (whereby the share of the prime working age population expands before the older age groups do so as well). In practice, the share of under 25 year-olds in our sample countries ranges from 68.2% in Uganda to 23.1% in Germany, while the share of over 65 year-olds ranges from 26.9% in Japan to 1.2% in the United Arab Emirates. For a detailed discussion of index construction and weighting decisions, please refer to the Technical Notes on the Report website.
10 Some companies are already operating in age-friendly ways. This includes recognizing the value of employees of all ages, creating working cultures that provide access to and sustain employees regardless of age, and keeping opportunities available and open for learning and mentoring. Many companies have also realized the market opportunities presented by longevity, in particular the tech savvy nature of the elderly and their participation in the digital economy.
11 See Hausmann, R., C. Hidalgo, et al., “The Atlas of Economic Complexity”, Centre for Economic Development at Harvard University, http://atlas.cid.harvard.edu.
12 In calculating countries’ sub-scores in the Learning and Employment themes, the overall global population weighting (see Figure 6) is applied to the simple average of the indicator scores across the horizontal themes in each Age Group pillar. Countries are required to have at least 50% indicator coverage for both the Learning and Employment theme in order to be included in the graphs and analysis.
13 See World Economic Forum, The Future of Jobs: Employment, Skills and Workforce Strategy for the Fourth Industrial Revolution, 2016.
14 See SHRM Foundation, “Engaging and Integrating a Global Workforce”, report prepared by the Economist Intelligence Unit, February 2015.
15 For an introductory overview of this dynamic and fast-evolving field, please refer to Einav and Levin, 2014; Manca, 2016; Carnevale et al., 2014; Reamer, 2013; and Wright, 2012.
16 See Winthrop, 2015; Angrist et al., 2013; and Rissing et al., 2005.
17 See Dorn, D. and D. Autor, “This Job is Getting Old: Measuring Changes in Job Opportunities Using Occupational Age Structure”, NBER Working Paper 14652, 2009, and Infosys, Amplifying human potential: Education and skills for the fourth industrial revolution, 2016.
18 The issue is less about vocational training versus university education—but rather about reforming education systems in general to combine theoretical knowledge with practical application and lifelong learning by default; see Hanushek, E., Woessmann, L. and L. Zhang, “General Education, Vocational Education, and Labor-Market Outcomes over the Life-Cycle”, IZA DP No. 6083, 2011.
19 See World Economic Forum, New Vision for Education: Unlocking the Potential of Technology, 2015, and World Economic Forum, New Vision for Education: Fostering Social and Emotional Learning through Technology, 2016.
20 See World Economic Forum, New Vision for Education, op. cit., and OECD, Universal Basic Skills: What Countries Stand to Gain, 2015.
21 To calculate skills diversity, LinkedIn applied the inverse methodology of the Herfindahl-Hirschman index for industry concentration; thus, the higher the number, the more diverse the composition of the skills. The ratio is the number of LinkedIn members with a given skill divided by all LinkedIn members for that given country with any skill. To ensure skill data is representative LinkedIn implemented three thresholds: the following thresholds: 10% to 50% membership coverage relative to the country’s population; countries with a population of more than 5 million.
31The Human Capital Report 2016
22 See Boarini, R., M. Mira d’Ercole and G. Liu, “Approaches to Measuring the Stock of Human Capital: A Review of Country Practices”, OECD Statistics Working Papers, 2012/04, Organisation for Economic Co-operation and Development, 2012, http://dx.doi.org/10.1787/5k8zlm5bc3ns-en.
23 Clear differentiation between job titles and skills should be a foundational block in formulating future workforce and human capital strategies. LinkedIn analysed the skills associated with every job title in every industry, using a variant of Term Frequency Inverse Document Frequency to identify the most “characteristic” skills for each title by finding the most common skills within an industry title pair and normalizing them by how frequently those skills appear in all industry titles. In order to protect members’ privacy, LinkedIn only used frequent and standardized skills in the study. Additionally, to ensure skills data is representative, LinkedIn implemented the following thresholds: 10% to 50% membership coverage relative to the country’s population; countries with a population of more than 5 million.
24 See Broadbent, 2015.
25 The vision of LinkedIn’s Economic Graph is to create “a digital map of the global economy that includes every member of the global workforce and their skills, all open jobs, all employers, and all education institutions”; see https://www.linkedin.com/company/linkedin-economic-graph.
26 Skills migration is an excellent way to model varying inflows and outflows of talent over time across geographies. The methodology is as follows: Timeline: March 2015–2016; skills only considered if added before migration and have moved at least 500 times globally; members who have been out of school for at least one year before move, to account for the fact that many students move to study, and then return home after school.
27 See Burning Glass Technologies, 2015.
28 The investigation of how many potential Data Scientists there are on LinkedIn was driven by an analytics of their respective skills. The primary skills associated with the titles Data Scientist and Data Analyst are: Statistical Analysis, Data Mining, Machine Learning, Mathematics, and Database Management & Software. As higher level skills taxonomy, LinkedIn used a clustering algorithm that brings similar skills together.
29 See UNCTAD, 2016; and Jeon, 2014.
30 Also refer to ILO, 2015; and Rizzo, et al., 2015.
31 See Capelli, et al., 2013.
32 See Katz and Krueger, 2016; Manyika et al., 2015; Upwork and Freelancers Union, 2015.
33 See Katz and Krueger, 2016.
34 See De Groen and Maselli, 2016.
35 See Congressional Research Service, 2016.
36 http://www.xiaojukeji.com/en/index.html
37 http://www.samagroup.co
38 See Upwork and Freelancers Union, 2015.


33The Human Capital Report 2016
Appendix: Technical Notes and User’s Guide
A complete Technical Note and User’s Guide describing the Human Capital Index methodology and data sources used in this Report
and a full set of Country Profiles are available at http://reports.weforum.org/human-capital-report-2016.
Technical NotesThe Technical Note includes details on the following topics:
• Detailed structure of the Human Capital Index 2016• Data standardization methodology used in the Index• Considerations on data weighting and missing data• Comparisons with the 2015 edition of the Index
User’s GuideThe User’s Guide includes details each of the 46 indicators of the Index as well as how to read the Country Profiles.
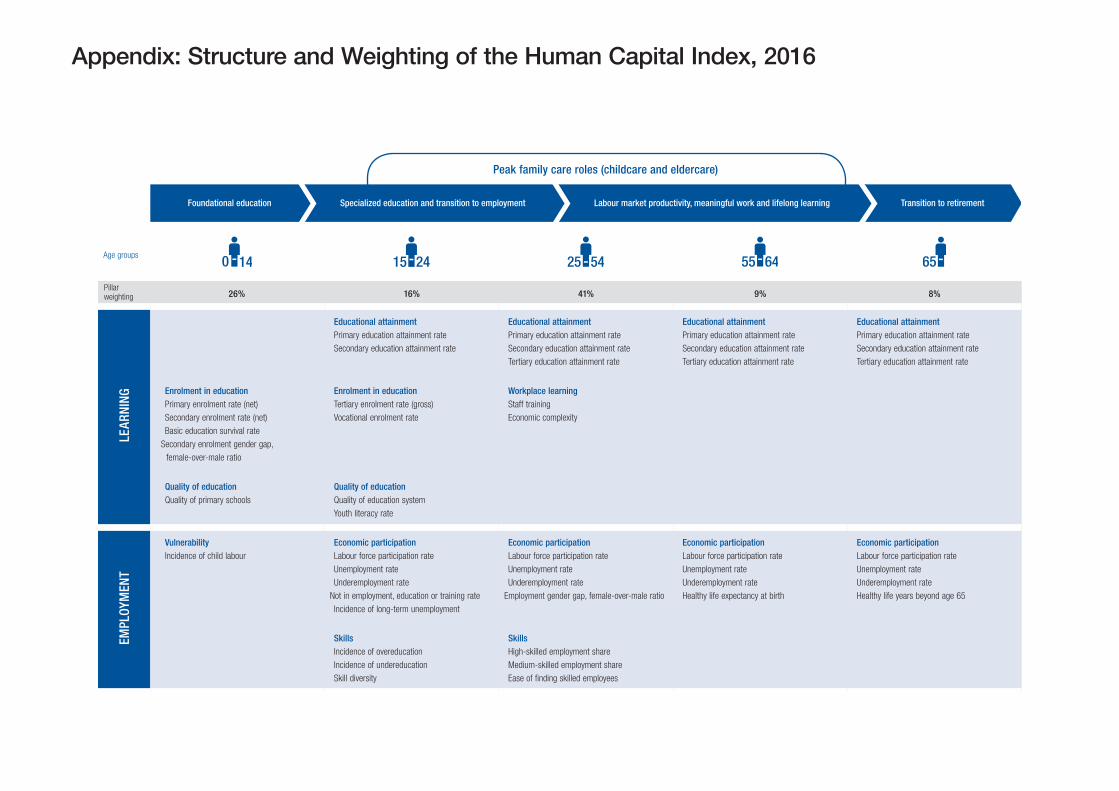
Peak family care roles (childcare and eldercare)
Foundational education Specialized education and transition to employment Labour market productivity, meaningful work and lifelong learning Transition to retirement
Age groups
Pillar weighting 26% 16% 41% 9% 8%
LEAR
NIN
G
Educational attainmentPrimary education attainment rate
Secondary education attainment rate
Educational attainmentPrimary education attainment rate
Secondary education attainment rate
Tertiary education attainment rate
Educational attainmentPrimary education attainment rate
Secondary education attainment rate
Tertiary education attainment rate
Educational attainmentPrimary education attainment rate
Secondary education attainment rate
Tertiary education attainment rate
Enrolment in educationPrimary enrolment rate (net)
Secondary enrolment rate (net)
Basic education survival rate
Secondary enrolment gender gap,
female-over-male ratio
Enrolment in educationTertiary enrolment rate (gross)
Vocational enrolment rate
Workplace learningStaff training
Economic complexity
Quality of educationQuality of primary schools
Quality of educationQuality of education system
Youth literacy rate
EMPL
OYM
ENT
VulnerabilityIncidence of child labour
Economic participationLabour force participation rate
Unemployment rate
Underemployment rate
Not in employment, education or training rate
Incidence of long-term unemployment
Economic participationLabour force participation rate
Unemployment rate
Underemployment rate
Employment gender gap, female-over-male ratio
Economic participationLabour force participation rate
Unemployment rate
Underemployment rate
Healthy life expectancy at birth
Economic participationLabour force participation rate
Unemployment rate
Underemployment rate
Healthy life years beyond age 65
SkillsIncidence of overeducation
Incidence of undereducation
Skill diversity
SkillsHigh-skilled employment share
Medium-skilled employment share
Ease of finding skilled employees
Appendix: Structure and Weighting of the Human Capital Index, 2016

35The Human Capital Report 2016
The World Economic Forum would like to thank the Partners of the System Initiative on Education, Gender and Work for their guidance and support to the System Initiative and this Report.
System Initiative Partners
• Adecco Group• African Rainbow Minerals• Alcoa• Alghanim Industries• AlixPartners• A.T. Kearney• The Bahrain Economic Development Board• Bank of America• Bloomberg• Hubert Burda Media• Centene Corporation• Chobani• The Coca-Cola Company• EY• GEMS Education• Heidrick & Struggles• Infosys• JLL• Johnson Controls
• LinkedIn• ManpowerGroup• Mercer (MMC)• Microsoft Corporation• Nestlé• Omnicom• Ooredoo• Pearson• PwC• Renault-Nissan Alliance• The Rockefeller Foundation• Saudi Aramco• Siemens• Tata Consultancy Services• Tupperware Brands Corporation• Uber• Workday• WPP• Zain
To learn more about the commitment of our System Initiative Partners to addressing talent issues globally, please refer to the Report website.

37The Human Capital Report 2016
The World Economic Forum would like to thank the Stewards of the System Initiative on Education, Gender and Work for their leadership and guidance of the System Initiative and this Report.
System Initiative Stewards
• Abdulla Bin Mohammed Al-Thani, Chairman, Ooredoo
• Asheesh Advani, CEO, JA Worldwide
• Omar Alghanim, CEO, Alghanim Industries
• Irina Bokova, Director-General, UNESCO
• Alain Dehaze, CEO, Adecco Group
• Serge Dumont, Vice-Chairman, Omnicom
• Brian Gallagher, President and CEO, United Way Worldwide
• Scott Gegenheimer, Group CEO, Zain
• Rick Goings, Chairman and CEO, Tupperware Brands Corporation
• Adam Grant, Professor, The Wharton School, University of Pennsylvania
• Peter Grauer, Chairman, Bloomberg
• Justine Greening, Secretary of State, Department for International Development of the United Kingdom (DFID)
• Jeffrey Joerres, Chairman Emeritus, ManpowerGroup
• Muhtar Kent, Chairman and CEO, The Coca-Cola Company
• Laura Liswood, Secretary-General, Council of Women World Leaders
• Andrew McAfee, Principal Research Scientist, MIT Initiative on the Digital Economy, Massachusetts Institute of Technology (MIT)
• Alex Molinaroli, Chairman, President and CEO, Johnson Controls
• Sheila Penrose, Chairman of the Board, JLL
• Julio Portalatin, President and CEO, Mercer (MMC)
• Jonas Prising, CEO, ManpowerGroup
• Judith Rodin, President, The Rockfeller Foundation
• Linda Rottenberg, Co-Founder and CEO, Endeavor
• Guy Ryder, Director-General, International Labour Organization
• Vishal Sikka, CEO and Managing Director, Infosys
• Martin Sorrell, CEO, WPP
• Laura Tyson, Professor and Director, Haas School of Business, University of California, Berkeley
• Sunny Varkey, Chairman, GEMS Education
We also thank the members of our broader core community for their ongoing commitment and support to the System Initiative and addressing talent issues globally.

39The Human Capital Report 2016
The Human Capital Index, initially developed in collaboration with Mercer, is an insight tool published annually by the World Economic Forum’s Global System Initiative on Education, Gender and Work. The 2016 edition of the Report includes an exploration of new data sources beyond the core Index, informed by a collaboration with LinkedIn and with additional data input from Care.com, Didi Chuxing, Uber and Upwork.
AT THE WORLD ECONOMIC FORUM
Richard Samans, Head of the Centre for the Global Agenda, Member of the Managing Board
Saadia Zahidi, Head, Education, Gender and Work System Initiative; Member of the Executive Committee
Till Alexander Leopold, Project Lead, Education, Gender and Work System Initiative
Vesselina Ratcheva, Data Analyst, Education, Gender and Work System Initiative
A special thank you to our colleagues across the Forum and, in particular, to Libby Zhang, Yasmina Bekhouche, Kristin Keveloh, Paulina Padilla Ugarte, Valerie Peyre, Pearl Samandari, Caroline Staffell and Susan Wilkinson.
Thank you to Michael Fisher for his superb editorial work, Neil Weinberg for his excellent graphic design and layout and Kamal Kamaoui and the World Economic Forum’s Publications team.
We gratefully acknowledge the outstanding support of LinkedIn’s project team: Lutz Finger, Sue Duke, Jacqueline Barrett, Guy Berger, Milad Davaloo, Feng Guo, Joseph Roualdes, Jonathan Serfaty, Qin (Iris) Wang, Jiashan Wang, Jia Xie and Sui Yan.
Finally, we appreciate the continued advice and guidance on the initial development of the Report from the Forum’s expert network and, in particular, from Professor David E. Bloom, Clarence James Gamble Professor of Economics and Demography, Harvard School of Public Health; Professor Ricardo Hausmann, Director, Center for International Development, Harvard Kennedy School of Government; and Professor Wolfgang Lutz, Founding Director, Wittgenstein Centre for Demography and Global Human Capital (IIASA, VID/ÖAW, WU).
Acknowledgements

World Economic Forum91–93 route de la CapiteCH-1223 Cologny/GenevaSwitzerland
Tel.: +41 (0) 22 869 1212Fax: +41 (0) 22 786 2744
The World Economic Forum, committed to improving the state of the world, is the International Organization for Public-Private Cooperation. The Forum engages the foremost political, business and other leaders of society to shape global, regional and industry agendas.