insider trading and international cross-listing · insider trading and international cross ... is...
TRANSCRIPT

Insider Trading and International Cross-Listing
Adriana Korczaka,b,1 and M. Ameziane Lasferb∗
a European University Viadrina, Gr. Scharrnstr. 59, 15230 Frankfurt (Oder), Germany
b Cass Business School, 106 Bunhill Row, London, EC1Y 8TZ, UK
31 May 2005
Preliminary and incomplete Please do not quote
Abstract: We study the information content of insider trading of domestic and cross-listed firms. We argue that because of the bonding hypothesis, insiders are less likely to trade on insider information when their company is cross-listed. Consistent with previous evidence, we find that for the sample as a whole, insiders are contrarians as they buy (sell) after significant price decline (increase) and the announcement and post-announcement abnormal returns are positive (negative) for the buy (sell) trades. When the cross-listed and domestically listed companies are considered separately, we find that insider trading in cross-listed companies is significantly less profitable than in companies listed domestically. The cross sectional analysis confirms these findings. Furthermore, we account for possible selectivity bias in the decision to cross-list. The results confirm the bonding effects mainly in case of sales where reduced abnormal returns are observed. Surprisingly, the abnormal returns gained by insiders of cross-listed companies after buy trades are significantly higher than in domestically listed companies. We conjecture that such findings my result from asymmetric effect of possible expropriation. The expropriation may be more severe in case of sales when insiders cash out in the anticipation of bad news leaving the uninformed investors in long positions in losing stocks. On the other hand the expropriation in case of purchases is less harmful when both insiders and outsiders gain from the price increase.
Key words: Insider trading, Information asymmetry, International cross-listing
JEL Classification: F31, G14
∗ Corresponding author: Tel.: +44 20 7040 8634; Fax: +44 20 7040 8648; email: [email protected]. 1
email: [email protected] We are grateful to Stefano Paleari and seminar participants at Cass Business School (London) for their useful comments. We also thank Irma Manasherova for research assistance. Adriana Korczak is grateful for the Marie Currie Young Researchers Scholarship. The usual disclaimer applies.
Insider Trading and International Cross-Listing
1. Introduction
Previous studies document a significant price reaction to the announcement of
insider trading and provide two main distinct reasons for these results by arguing that
insiders trade on private information or when shares in their companies are mis-priced.
The former is based on the premise that insiders use privileged information to buy or
sell shares in their own company and to gain significant abnormal returns on their
trades. Empirically, insiders are found to trade before price sensitive information
releases such as dividends announcement (John and Lang, 1991), earnings forecasts
(Penman, 1982), takeovers (Seyhun, 1990; Bris, 2005), announcement of new stock
offerings (Karpoff and Lee, 1991), stock repurchases (Lee, Mikkelson and Partch,
1992), capital expenditure (John and Mishra, 1990), and bankruptcy filing (Seyhun and
Bradley, 1997). Using UK data, Lasfer (2004) reports that insiders time their trades as
their transactions are undertaken after significant price changes and before news
announcements. In particular, his results show that while more than 94% of the insider
trades are followed by news announcements, the vast majority of the buy transactions
are undertaken prior to good news while the sell transactions are evenly distributed
across the good and bad news. Other studies, on the other hand, argue that insider
trading is related to the ability of the managers to assess better the value of their
company. In particular, they buy when their firm is undervalued and they sell when they
consider that their shares are overvalued. For example, Givoly and Palmon (1985)
introduced the “leading indicator” that allows outside investors to track insiders’ trades,
because insiders are capable of assessing better their companies’ values.
The use of private information unavailable to public investors results in an
expropriation of outside shareholders. There is an intensive debate and many
controversies as to whether insider trading should be prohibited. Comprehensive survey
and summary of arguments in favor of both views are provided by Bainbridge (2002)
and Battahacharya and Daouk (2002). One stream of the literature provides evidence
that insider trading should be illegal because it transfers wealth from the uninformed to
informed investors (Jaffe, 1974; Finnerty, 1976; Seyhun, 1986; Gregory, Matatko and
Tonks, 1997; Friedrich, Gregory, Matatko and Tonks, 2002). These arguments have

3
lead most countries around the world to regulate trading by insiders (Bhattacharya and
Douk, 2002). However, Manne (1966), Givoly and Palmon (1985), and Muelbroek
(1992) support deregulation of insider trading and argue that insider trading increases
the level of market efficiency, as any private information becomes compounded into the
share price. This private information could be related to the news released after the trade
or, alternatively, to the insiders’ assessment of the value of their firm. Moreover, the
fact that fewer cases emerged from this legislation (Bhattacharya and Douk, 2002)
suggests that insiders may not necessarily trade on insider information or that the laws
are not binding.
The purpose of this paper is to extent this line of arguments by investigating the
impact of international cross-listing on insider trading. Insiders of cross-listed
companies are subject to both domestic and foreign country’s insider trading laws. If
both markets on which the company is listed have good corporate governance systems
that prevent insiders from taking advantage of private information, then the two legal
systems are expected to decrease the trading profits of insiders and insider trading is
likely to be undertaken for liquidity rather than information purposes. This impact is
likely to be even more pronounced if the corporate governance system of the domestic
market is lower than that of the foreign market as managers are “bonded” from taking
excessive private benefits by cross-listing firm’s stock on a foreign exchange (Cofee,
1999, 2002; Stulz, 1999). The idea behind the bonding hypothesis is that a cross-listed
company on a foreign exchange with a better corporate governance system will become
subject to increased disclosure requirements, stronger and more effective legal system,
and more thorough investors monitoring. Consistent with this hypothesis, firms from
countries with weaker legal systems are likely to cross-list in countries with stronger
law and to benefit from cross-listing (e.g., Reese and Weisbach, 2002, Doidge, 2004
and Doidge, Karolyi and Stulz, 2004). International cross-listing decreases information
asymmetry and improves firm’s visibility through greater analyst coverage, better
accuracy and increased media attention (Baker, Nofsinger, Weaver, 2002; Lang, Lins
and Miller, 2003, 2004). Moreover, Ejara and Ghosh (2004) suggest that IPOs in
international markets have less information asymmetries due to stricter reporting
requirements and are less likely to be underpriced. These arguments suggest that insider
trading activity is likely to differ between companies that are domestically quoted and

4
cross-listed on foreign market. We, therefore, test the hypothesis that managers of cross-
listed companies are less likely to trade on private information.
We use a large database of more than 13,000 UK directors’ dealings over the
period 1999 to 2003. Our investigation concentrates on insider trading in UK companies
cross-listed in the US for three reasons. First, prior works by Gregory, Matatko and
Tonks (1997), Friederich, Gregory, Matatko and Tonks (2002), and Lasfer (2004)
document trading on privileged information by managers of UK companies. Second,
UK companies are the largest group of European cross-listed companies (171) and third
largest in the world, after Canada (266) and Japan (206) (Sarkissian and Schill, 2004).
Most of the UK companies are cross-listed in the US. Third, although UK is considered
to have well developed corporate governance system, cross-listing by UK firms can
have an impact on insider trading. There is a large group of UK firms that list in the US,
and according to La Porta, Lopez-de-Silanez, Shleifer and Vishny (1997), corporate
governance system in the US is substantially better than in the UK. Wojcik, Clark and
Bauer (2004) confirm that UK firms with a US listing have marginally higher corporate
governance ratings than companies listed domestically. Baker, Nofsinger and Weaver
(2002) show that the US market provides a higher firm’s visibility than the UK market
and listing on the NYSE is associated with improved information environment.
Moreover, Lang, Lins and Miller (2003, 2004) report that international cross-listing has
surprisingly the largest impact on firms’ information environment in developed markets
that choose to list in the US with the lowest level of disclosure requirements (private
placement Rule 144a ADRs and OTC-listed ADRs (Level I)). Such companies amount
to 40% of cross-listed companies in our sample.
Our results show that insiders are contrarians in their trades: They buy after a
significant price decline (-4.8% 40 days before the trade) and they sell after a significant
price run up (+5.6%). We show that the event date abnormal returns are positive for buy
(+1.3%) and negative (-0.5%) for sell transactions. In the post event period we find
momentum behavior as the abnormal returns following the buy are positive (+4.6%) and
negative (-3.0%) after the sell trades. These results suggest that insiders convey
information to the market and that other investors could follow these trades and fortify
the exceptional returns gained by directors. While these overall results are consistent
with previous findings (e.g., Friederich, Gregory, Matatko and Tonks, 2002; and Lasfer,

5
2004), we report significant differences across domestically and cross-listed companies
in the event and post-event period. In particular, on the announcement date of the buy
transactions, the abnormal returns are 0.2% for cross-listed companies compared to
1.5% for domestic companies (t of differences in means = 7.15). Similarly, for the sell
transactions, the respective abnormal returns are -0.3% and -0.5% (t = -0.70). In the
post-announcement period [+2,+40], the respective increases in share prices after the
buy trades are 3.0% compared to 4.9% for domestic companies (t = 4.14), and after the
sell trades the cumulative abnormal returns are 0.2% (not statistically significant) for
cross-listed companies and -3.6% for domestic companies (t = -3.74). We find similar
results when we exclude confounding events and when our event period is defined as
the trading rather than the announcement date. Our results appear to be consistent with
the hypothesis that managers of cross-listed companies do not trade on insider
information, suggesting that dually listed companies are subject to tighter insider
trading rules, or alternatively that these dually listed companies are subject to relatively
lower information asymmetry because of their specific characteristics.
We investigate further these possibilities. First we test for the impact of size. We
find that the cross-listed companies are, on average, significantly larger than the
domestic companies. We tried to construct a control sample by matching each cross-
listed company with a domestic counterpart. We find similar results but we were unable
to match exactly a set of very large cross-listed companies.
Furthermore, we test for the impact of disclosure requirements associated with
the method of cross-listing. We find that the dummy variables for cross-listing are
negative and significant for the case of buys in OTC listing and Amex/NASDAQ/NYSE
when the dependent variable is the announcement date abnormal return. The cross-
listing dummies are significantly positive in case of sales. Similar results are obtained
when the dependent variable is the post-event cumulative abnormal returns. These
results indicate that the insiders in cross-listed companies earn lower abnormal returns
than those from companies listed domestically only. It may suggest that information
content of insider trading is lower for the case of cross-listed companies. We then apply
two-stage estimation method based on Heckman (1979) to account for the endogeneity
of decision to list in a foreign market. The results suggest that the bonding effects are at
work mainly in case of sales where reduced abnormal returns are observed. Surprisingly
6
after buy trades, the abnormal returns gained by insiders of cross-listed companies are
significantly higher than those of domestically listed companies. We conjecture that
such findings my result from asymmetric effect of possible expropriation. The
expropriation may be more severe in case of sales when insiders cash out in the
anticipation of bad news leaving the uninformed investors in long positions in loosing
stocks. On the other hand the expropriation in case of purchases is less harmful when
both insiders and outsiders gain from the price increase.
The remainder of the paper is organized as follows. Section 2 presents the data
and sample selection process. Section 3 focuses on methodology. Section 4 discusses
the results and section 5 concludes.
2. Data and Sample Selection
2.1. Insider Trading
We use a large database of directors’ dealings spanning between January 1999
and December 2003 and hand collected information on foreign listings by UK
companies. This database of directors’ dealings is provided by Directors Deals Ltd. and
includes news items on directors’ trades disclosed by all UK companies to the
Regulatory News Service (RNS). The following information is given for each
transaction: company name and SEDOL number, date of transaction and date of public
announcement, type of transaction, number of securities traded, class of securities
(ordinary, preference etc.) and industry sector of company. Under the 1985 Companies’
Act and the Continuing Obligations Section of the London Stock Exchange Rules
(Yellow Book), companies listed on the LSE are required to report any directors’ trade
in their own firms’ securities. In the UK, the company directors are the insiders obliged
to disclose their trades to the LSE.1 The disclosure requirements specify that directors
must inform their company without delay about any transaction carried out personally,
no later than on the fifth business day after the trading date. Subsequently the company
must inform the stock exchange by the end of the following business day and also enter
this transaction in the Company Register. The stock exchange immediately disseminates
this information via its own online ‘Regulatory and News Service’. Given this legal
requirement, we define the trading date and the announcement date as the event dates.
We also analyse the abnormal returns on the transaction dates and compare the

7
abnormal returns of insider trading transactions that are announced on the same dates
and those with announcement dates some days after the transaction dates.
In line with previous studies we exclude a number of transactions that are not
likely to be driven by privileged information.2 These include transactions involving
insiders exercising their options or derivatives, script dividends or bonus shares, rights
issue, awards made to directors under incentive plans or reinvestment plans, gifts,
transfers and purchase and sales of shares under personal equity plans, operations
derived from tax or “bed & breakfast” purposes, resignation from position, and any
other transaction made for non-informational reasons. In addition, we exclude all
directors’ transactions in investment companies. The screening resulted in 13,535
insider trades in 928 listed companies, over the five-year period, split into 10,541 (78%)
purchases and 2,994 (22%) sells.3 Our sample period is limited to five years because of
data availability. Nevertheless, it covers two main interesting sub-periods: the
worldwide boom (January 1999 to March 2000) and burst (April 2000 to December
2003) in stock markets.
2.2. International Cross-Listing
We hand collect data on international cross-listings by UK companies from
Amex, Nasdaq and NYSE stock exchanges, Bank of New York and JP Morgan.
Sarkissian and Schill (2004) provide country-to-country frequency distribution of
foreign listings among major world stock exchanges as of 1998. This information serves
as a starting point in our investigation. We enter each stock exchange’s web site and
look for a list of foreign companies listed currently and in the past, and for the date of
the first listing. However, in the case where the company is delisted, we were unable to
obtain full data on the first and last dates of listings.4 For missing dates of first listings,
we searched Factiva database. Additionally we searched Bank of New York and JP
Morgan DR databases for OTC listed ADRs (Level I) and private placement Rule
144A. Except for the New York Stock Exchange, stock exchanges do not provide
information on foreign listings in the past.5 Therefore we were unable to find out a
complete list of UK companies delisted from Nasdaq before the end of our sample
period. The information on foreign cross-listings was finally verified with UK
corporations’ web pages and checked for errors.

8
After selecting all UK companies dually-listed in the US on Amex, NASDAQ,
and NYSE, or over the counter, or as private placements, we find insider trading was
reported for 115 companies. Forty six of those companies are cross-listed on NYSE, 21
on NASDAQ and one on AMEX and 48 companies uses OTC-listed ADRs (Level I). 6
In our sample we do not have ADRs that involve only Rule 144a Private Placement.
Consequently, the majority of those companies are subject to stricter corporate
governance system than at home. In the last step of sample selection process, all insider
trading observations are classified into two groups: observations recorded for cross-
listed companies and observations for domestically listed companies. 2,400
announcements of insider trades are dedicated to cross-listed companies and 11,135 to
domestically listed companies.
3. Methodology
3.1. Event Study
To investigate the stock price reaction to insider trading a standard event study
approach based on market model is applied. The market model parameters α and β are
estimated for every stock on the basis of daily log stock returns during 180-day
estimation window, [-220, -41] days relative to the event day. We calculate return on
the market using the FTSE All share index. This index is the most appropriate proxy for
market portfolio because it covers about 800 UK listed companies. The daily stock
prices and FTSE All share index are obtained from Perfect Analysis. The stock prices
are adjusted for capital changes and dividends. Abnormal returns are calculated over [-
40, +40] event window as:
)( mtiiitit RRAR βα +−= (1)
where ARit is company i’s abnormal return on day t. Rit denotes day t stock return
on company i. We check the robustness of our results by using market adjusted and
mean adjusted models to calculate the abnormal stock returns.
Abnormal returns on each day are averaged and then cumulated over time in the
following way:
9
∑=
=N
iitt AR
NAAR
1
1 (2)
∑=2
1
),( 21
t
ttAARttCAAR (3)
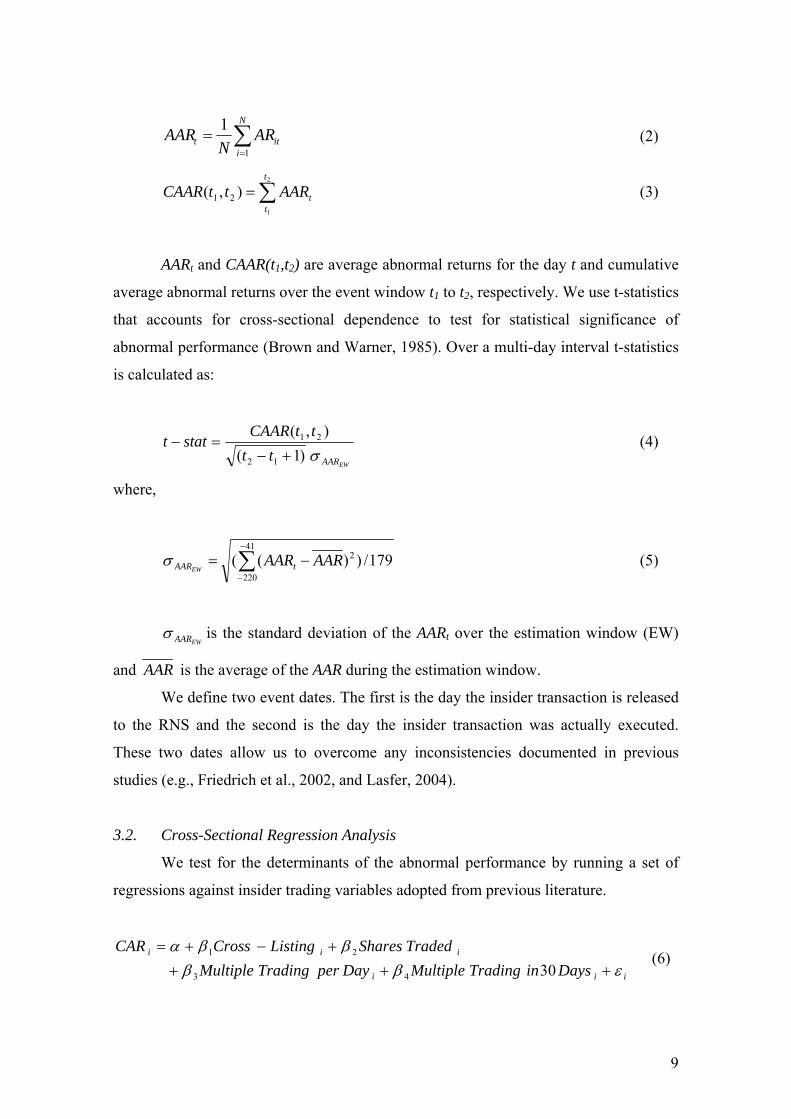
AARt and CAAR(t1,t2) are average abnormal returns for the day t and cumulative
average abnormal returns over the event window t1 to t2, respectively. We use t-statistics
that accounts for cross-sectional dependence to test for statistical significance of
abnormal performance (Brown and Warner, 1985). Over a multi-day interval t-statistics
is calculated as:
EWAARttttCAARstattσ)1(
),(
12
21
+−=− (4)
where,
179/))(( 241
220∑−
−
−= AARAARtAAREWσ (5)
EWAARσ is the standard deviation of the AARt over the estimation window (EW)
and AAR is the average of the AAR during the estimation window.
We define two event dates. The first is the day the insider transaction is released
to the RNS and the second is the day the insider transaction was actually executed.
These two dates allow us to overcome any inconsistencies documented in previous
studies (e.g., Friedrich et al., 2002, and Lasfer, 2004).
3.2. Cross-Sectional Regression Analysis
We test for the determinants of the abnormal performance by running a set of
regressions against insider trading variables adopted from previous literature.
iii
iii
DaysinTradingMultipleDayperTradingMultipleTradedSharesListingCrossCAR
εββββα
++++−+=
3043
21 (6)

10
ii
ii
iii
DaysinTradingMultipleDayperTradingMultipleTradedShares
NYSENASDAQAmexListingOTCCAR
εβββ
ββα
++++
++=
30
//
5
43
21
(7)
The dependent variable in both models is the cumulative abnormal returns
(CAR) over three [-1, +1] and 39 [+2, +40] days around the event day. In the base
model (6) we use a dummy variable equals to one if the firm is cross listed (Cross-
listing) to capture the cross-listing effect. The theoretical literature has not provided a
clear explanation of how insiders trade on private information. The existing literature
suggests that larger trades convey more information and have greater market impact
(Easley and O’Hara, 1987). To test whether the size of trades affects the price impact
we use the ratio of number of shares traded by insiders to the number of shares
outstanding at the end of financial year. In line with the theoretical literature, the
frequency of insider trading serves as a good proxy for informed trading and signaling
because the insiders can split up their trades to mislead uninformed traders (Kyle, 1985;
Easley and O’Hara, 1987; Laffont and Maskin, 1990). We measure insider trading
frequency within one day and within 30 calendar days. Multiple Trading per Day is a
dummy variable that equals one if more than one insider trades are reported in the same
company on the same day. Multiple Trading within 30 Days is a dummy variable that
equals one if more than one insider trades are reported in the same company within 30
calendar days. It reflects either several corporate insiders trading within a short period
of time or the same insider splitting up her trades over a period of time. We have no
data on identity of insiders; therefore we are unable to address the issue in greater detail.
However, it is reasonable to assume that both cases magnify the market impact of
trades. In model (7) we replace dummy for cross-listing by a set of dummies that
correspond to the level of cross-listing and the level of disclosure requirements imposed
by SEC. OTC Listing, and Amex/ NASDAQ/ NYSE are dummy variables and equal
one if insider trading event occurs when a firm’s ADRs involve a OTC listing (Level I),
or listing on one of the three stock exchanges, respectively or zero otherwise.
3.3. Testing for Endogeneity

11
It may be inappropriate to conclude about the influence of cross-listing on
profitability of insider trading without controlling for selection bias. Market response to
insider trading in cross-listed companies can be influenced by changes in the legal and
disclosure environment. Nevertheless, the decision to cross-list may be influenced by
firms’ fundamental characteristics and hence our cross-listing dummy variables may not
be exogenous. Previous findings suggest that cross-listed firms tend to be larger and
faster growing in terms of sales and profit than a typical peer company listed
domestically (Reese and Weisbach, 2002; Doidge, Karolyi and Stulz, 2004). The cross-
listed companies are not random, thus OLS estimators of cross-listing may be biased.
To control for potential selectivity bias we use two-stage Heckman-type procedure
(Heckman, 1979).
The set of regression models is:
iiii ngCrossListiXBCAR εδα +++= ' , (8)
iii WngCrossListi ξγ += '* , (9)
Assumptions:
),0( 2σε Narei ,
ρξε =),( iicorr ,
where iCAR represents CARs, iX are exogenous independent variables used to
explain iCAR , and ingCrossListi is a dummy variable that equals one for cross-listed
companies, and zero, otherwise. The estimated parameter δ measures the association
between cross-listing andCAR . iW represents a set of potential determinants of the
decision to cross-list. The decision to cross-list is made according to the following rule:
⎪⎩
⎪⎨⎧
≤
>=
.0,0,0,1
*
*
i
ii ngCrossListiif
ngCrossListiifngCrossListi (10)

12
The variable ingCrossListi is assumed to result from an unobservable
variable *ingCrossListi . The correlation between *ingCrossListi and iε is nonzero
if iW , the set of exogenous variables in the model (9), affects iCAR , but are not in model
(10), or if the residuals, iε and iξ , are correlated. Equations (8) and (9) are estimated
using the Heckman (1979) approach. Under the above assumptions, the expected value
of iCAR for a cross-listed company is,
)()1( '1
'iiiii WXBngCrossListiCARE γλρσδα ε+++== , (11)
)(/)()( '''1 iiii WWW γγφγλ Φ= , (12)
where )( '1 ii Wγλ is the ‘inverse Mills’ ratio’, )(⋅φ and )(⋅Φ are the density functions
and cumulative distribution functions for the standard normal, respectively. The
expected value of iCAR for a domestically listed company is,
)()0( '2
'iiiii WXBngCrossListiCARE γλρσα ε++== , (13)
)](1/[)()( '''2 iiii WWW γγφγλ Φ−−= , (14)
The difference in the abnormal returns (CAR ) gained by insiders in cross-listed and
domestically listed companies is,
))](1)((/[)(
)0()1('''
iii
iiii
WWW
ngCrossListiCAREngCrossListiCARE
γγγφρσδ ε Φ−Φ+=
==−=, (15)
Model (15) presents the direction of the potential bias in the OLS estimator for δ in the
model (8) depends on the sign of the correlation of the error terms ρ . If the correlation
is negative, as hypothesized for buys in cross-listed firms then δ is biased downward. If
the correlation is positive, as hypothesized for sells in cross-listed firms then δ is
biased upward. In the first step the Heckman procedure estimates γ using a logit model.

13
Next, these consistent estimates are used to calculate 1iλ and 2iλ . In the second step the
procedure estimates model (8) using OLS with additional term iλ , to correct for the
selection bias.
)1)(()( '2
'1 iiiiiii ngCrossListiWngCrossListiW −+= γλγλλ , (16)
iiiii ngCrossListiXBCAR νλδδα λ ++++= ' , (17)
Parameter λδ is associated with iερσ and captures the sign of the correlation between
the residuals in models (8) and (9)7.
4. Empirical Results
4.1. Descriptive Statistics
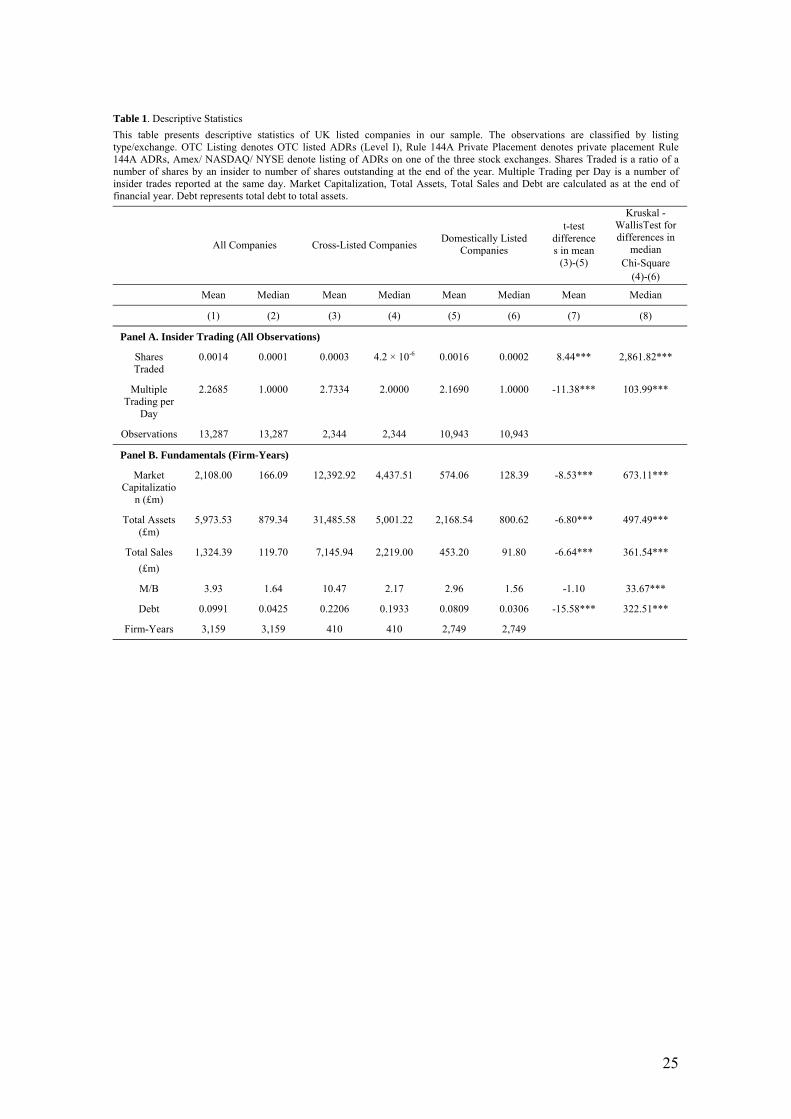
Table 1 presents the descriptive statistics of the sample. The average size of
insider trading, measured by the ratio of shares traded to shares outstanding, is 0.0014
for the full sample. The average ratio of shares traded in cross-listed companies is
statistically lower than in domestically listed (t-stat=-8.44) and equals 0.0003, and
0.0016 respectively. Based on the multiple trading per day measure, we find that insider
trading takes place on average more than twice within given day but the ratio is
statistically higher for cross-listed companies; 2.7334 compared with 2.1690. These
results suggest that either more than one insider trade on the some day or the same
insider split her orders in order to mask her trades. Both cases indicate however that
insider may trade on private information. Overall, insider trading characteristics show
differences between cross-listed and domestically listed companies.
The companies’ fundamental characteristics reported in Table 1, Panel B also
confirm significant differences between companies listed abroad and only domestically.
Cross-listed companies are larger in terms of size, have higher growth opportunities and
higher leverage. T-test for differences in means, and Kruskal-Wallis test for differences
in median show statistical differences between the two groups of companies. Only the
difference in means of growth opportunities is insignificant which is due to large
standard deviation. We use three proxies for size, market capitalization, total assets and

14
total sales. Market to book ratio serves us as a measure of growth opportunities and total
debt to total assets as a proxy for debt.
These apparent differences between cross-listed and domestically listed
companies indicate a selection bias problem and deserve more attention. We will
address this issue in greater detail section 4.6 and 4.7 to control the influence of
selection bias on our results and inferences.
4.2. Abnormal Returns
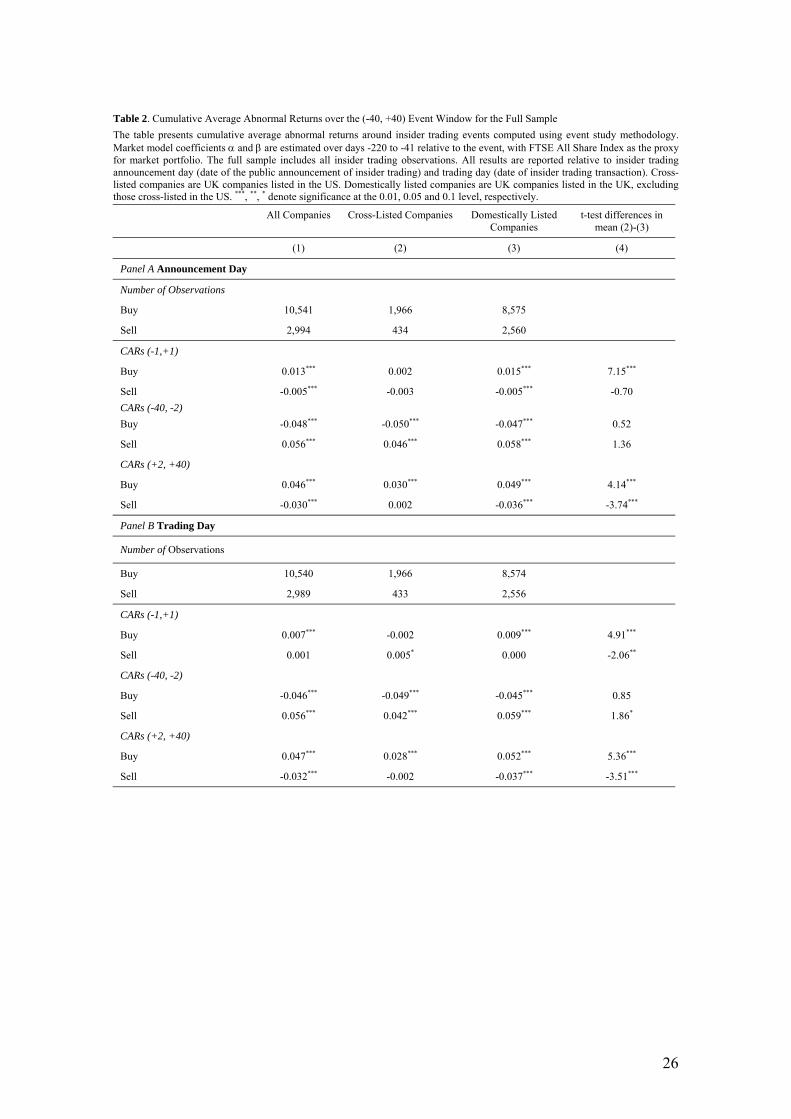
Table 2 Panel A, reports a summary of the behavior of share prices around
insider trading announcement for the sample as a whole and for the two groups of firms.
The results indicate that on the event dates [-1, +1] share prices for buy transactions
increase significantly for domestically listed companies. The cumulative average
abnormal return (CAARs) of 0.2% for cross-listed firms on foreign market is
statistically lower than the 1.5% CAAR for domestically listed companies (t-statistic of
differences in means is 7.15). The CAAR for sell transactions on the event dates [-1,
+1] of -0.4% for domestically listed companies are also significant. In contrast, for the
cross-listed companies the abnormal returns of -0.3% are not statistically significant, but
not significantly different from the CAARs of domestically-listed companies (t=-0.70).
As documented in previous studies (e.g., Hillier and Marshall, 2002) the sells are likely
to be executed for different reasons than buys, and therefore may provide ambiguous
signals for the market. The studies tend to find much stronger reaction to purchases than
to sells. Interestingly, the magnitude of the stock price reaction to both types of
transactions is similar in case of cross-listed companies. It provides further evidence
that information conveyed by directors of cross-listed companies is relatively weak and
we do not observe the buy-sell asymmetry. On the other hand, findings for all
companies and those domestically quoted are in line with trends observed in other
studies (Friedrich et al. 2002, Hillier and Marshall, 2002).
The differences in patterns of abnormal returns and the differences in means
between the CAARs of the same transaction type over the full event window [-40, +40]
presented in the table and in Figure 1 suggest that the insider transactions are driven by
different motives and convey different amount of price sensitive information. The
general pattern in the Figure 1 shows that directors purchase shares in their own

15
company after a period of poor performance and sell after a period of good
performance. The negative trend before purchases leads to highly significant negative
abnormal returns. Prior to the buy transactions the abnormal returns on shares in
internationally cross-listed firms underperform market, on average, to a larger extend
than in domestically listed firms. The abnormal returns over the pre-event period [-40, -
2] decrease significantly by 5.0% and by 4.7% for the cross-listed and domestically
listed companies, respectively. This suggests that directors of cross-listed companies
tend to wait with share purchase in their company for lower stock price than directors of
domestically listed companies.
Prior to sell transactions the abnormal returns are consistently positive. Over the
same pre-event period [-40, -2] the abnormal returns for sell transactions increase
significantly by 4.6% in the companies cross-listed on foreign markets and by 5.8% in
the companies listed domestically. Unlike the buy transactions now directors in
domestically listed companies wait longer with sell transactions, until the abnormal
return on their companies’ shares reach the highest possible level. Abnormal returns of
domestically listed stocks outperform the market before sells trades to a larger extend
than abnormal returns of cross-listed stocks.
The post-event [+2, +40] abnormal returns behavior is of particular interest in
explaining the observed differences in insider treading between groups of companies
listed in the US and domestically. Subsequent to the insider trading announcement the
buy and sell trends revert. We observe greater speed and scale of the market reaction to
insiders’ buy trades in a group of domestically listed companies than internationally
cross-listed. Buy trades are followed by positive and statistically significant returns of
3.0% for cross-listed companies and of 4.9% for domestically listed companies. These
results may imply that the directors in domestically listed companies convey more price
sensitive information in their trades than directors in companies cross-listed abroad.
The post-event abnormal returns behavior after the sell transactions is
considerably different for cross-listed than for domestically listed companies. In case of
companies listed abroad, the abnormal returns move insignificantly around the value
from the announcement day. This may suggest that these sell trades do not convey any
significant information to the market. In case of domestically listed companies,
subsequent to the sell transactions the abnormal returns significantly decrease over the

16
post-event period by 3.6%. This result comply that directors of domestically listed
companies time their transactions and their sell trades convey price sensitive
information.
We observe reduced information asymmetry between cross-listed companies and
their investors. US cross-listing improves firm’s visibility and reduces information
asymmetries between insiders and outsiders due to increased disclosure requirements,
larger analyst following and media attention (Baker, Nofsinger and Weaver, 2002;
Lang, Lins, and Miller, 2003, 2004) higher US corporate governance standards and
more efficient legal system than in the UK (Cofee, 1999; Stulz, 1999; La Porta et al.
1997). Directors from companies cross-listed in the US may avoid trading on private
information to protect themselves from more sever legal consequences. Overall, the
preliminary results support our hypothesis suggesting that, on average, the information
content of insider trading is lower in cross-listed than in domestically listed companies.
The findings however, are not strong enough to fully support the bonding hypothesis,
which predicts that insiders from a company cross-listed in a foreign market with better
corporate governance standards would avoid trading on confidential information to
protect themselves from more severe legal consequences.
[Insert Table 2 here]
[Insert Figure 1 here]
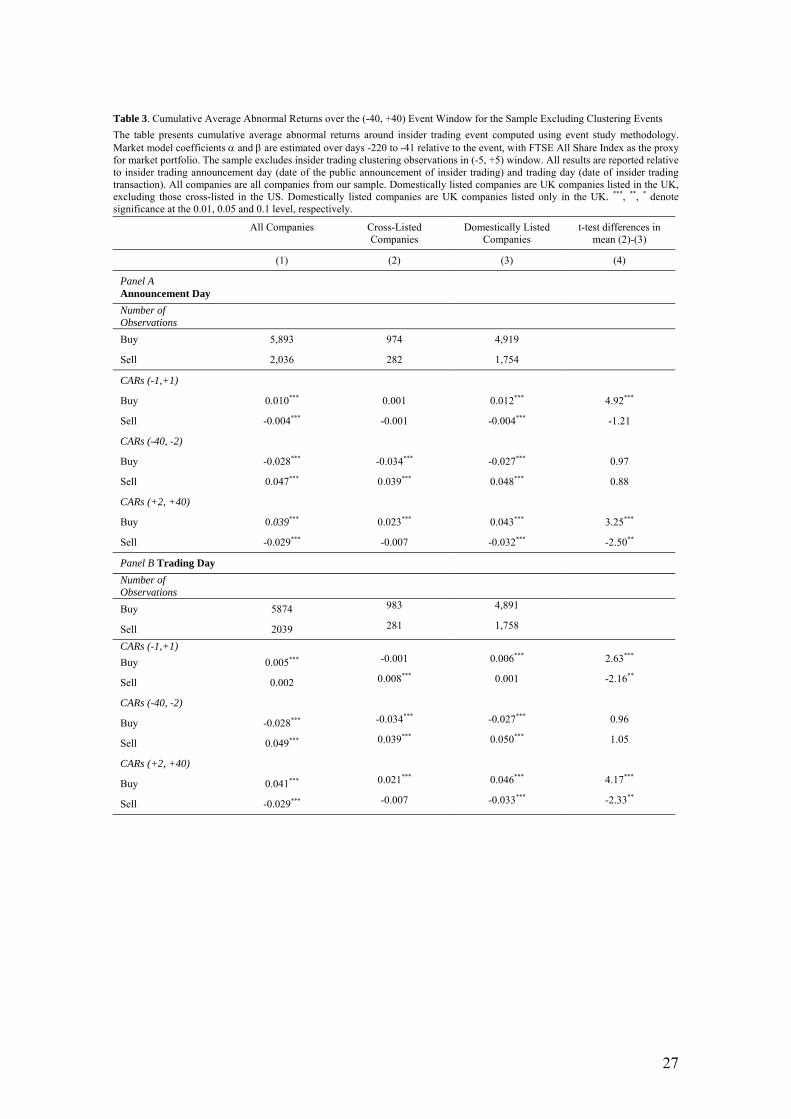
4.3. Clustering Events
Event clustering in data causes potential limitation of the investigation because
the clustering events may drive the abnormal returns. This problem appears when cross-
sectional correlation is present in the sample and the standard errors are not properly
estimated. This difficulty can be circumvented by using daily data, diversifying sample
across industry sectors and accounting for the cross-sectional dependence in the t-
statistics used to test for statistical significance of abnormal performance. Although we
stick to these requirements, in the next step we exclude from our sample all insider
trades announcements that occurred over period [-5, +5]. Similarly to Del Brio, Miguel
and Perote, 2002 we expect the abnormal returns after excluding the clustering events
are lower than in case of full sample, because single trades have lower magnitude than
multiple.

17
Table 3, Panel A reports the results. The number of buy and sell trades
observations decrease by about 45% and 32%, respectively. The abnormal returns for
the sample of cross-listed companies are smaller in value yet still insignificant on the
event dates [-1, +1]. These finding may further comply that the insider trades in
companies listed abroad are not driven entirely by private information. The abnormal
returns for the sample of domestically listed companies are also smaller in value and
their statistical significance remains unchanged at the 0.01 level. The t-test in the last
column confirms the statistical difference between abnormal returns of buy transactions
over the event dates [-1, +1] at the 0.01 level, and of buy and sell transactions over the
post-event period [+2, +40] at the 0.01 and 0.05 level, respectively. Exclusion of
clustering transactions does not alter our results, and support our general finding that the
insider trades executed in domestically listed companies convey more price sensitive
information than those executed by directors from cross-listed companies.
[Insert Table 3 here]
4.4. Announcement Day vs. Trading Day
We follow the discussion in literature and examine empirically whether the
information on the insider trade reaches the market at the same time as the trade is
executed or on the announcement day. The issue does not exist when the trade and the
announcement happen to be on the same day. However, in our sample the information
about insider trading is released, on average, on the fourth day after the trade was
carried out. The median shows that the announcement follows insider transaction on the
next day. Therefore, we expect that the results on the event date [-1, +1] to be
quantitatively and qualitatively weaker than those investigated on the announcement
day. Table 2, Panel B and Table 3, Panel B report summary of the share prices behavior
around insider trading day in group of cross-listed and group of domestically listed
companies. The results for purchases are in line with our expectation. Abnormal returns
for cross-listed firms are insignificant and for domestically listed are smaller in value.
0.9% and 0.6% for the trading compared with 1.5% and 1.2% for the announcement.
The findings for sell transactions of stocks listed abroad are ambiguous. Abnormal
returns for sell of cross-listed companies become significant and abnormal returns of
domestically listed stocks lose their significance.
18
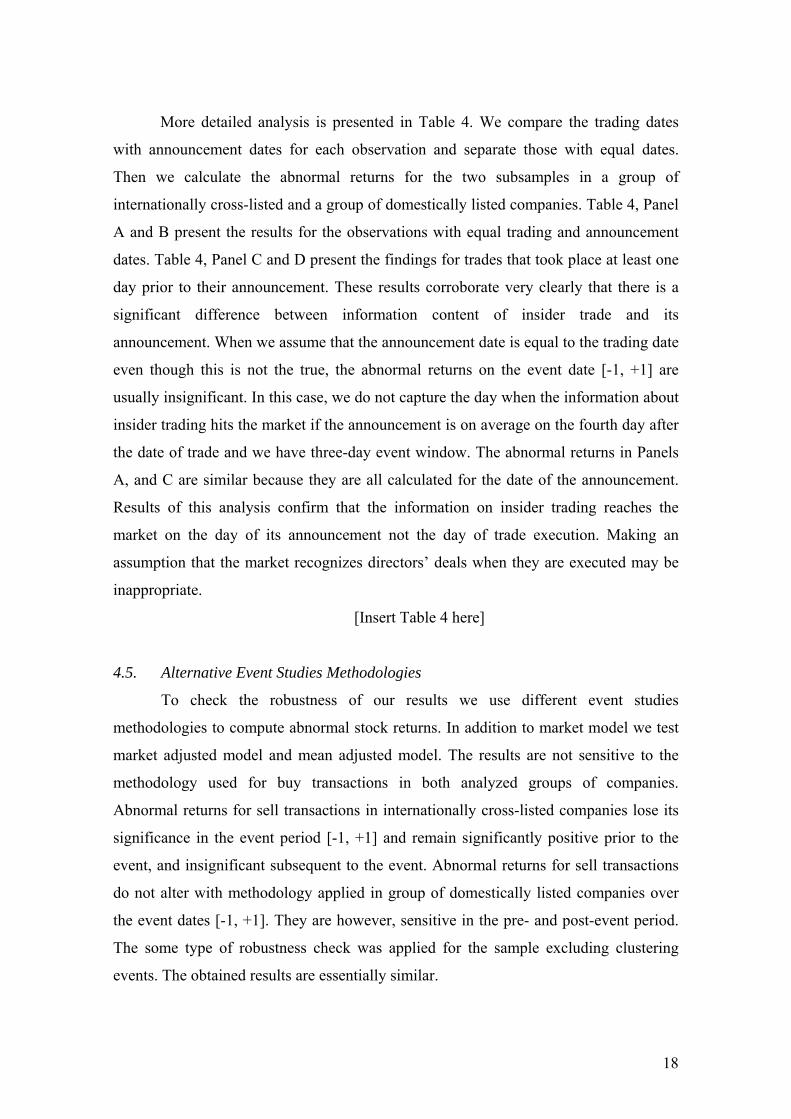
More detailed analysis is presented in Table 4. We compare the trading dates
with announcement dates for each observation and separate those with equal dates.
Then we calculate the abnormal returns for the two subsamples in a group of
internationally cross-listed and a group of domestically listed companies. Table 4, Panel
A and B present the results for the observations with equal trading and announcement
dates. Table 4, Panel C and D present the findings for trades that took place at least one
day prior to their announcement. These results corroborate very clearly that there is a
significant difference between information content of insider trade and its
announcement. When we assume that the announcement date is equal to the trading date
even though this is not the true, the abnormal returns on the event date [-1, +1] are
usually insignificant. In this case, we do not capture the day when the information about
insider trading hits the market if the announcement is on average on the fourth day after
the date of trade and we have three-day event window. The abnormal returns in Panels
A, and C are similar because they are all calculated for the date of the announcement.
Results of this analysis confirm that the information on insider trading reaches the
market on the day of its announcement not the day of trade execution. Making an
assumption that the market recognizes directors’ deals when they are executed may be
inappropriate.
[Insert Table 4 here]
4.5. Alternative Event Studies Methodologies
To check the robustness of our results we use different event studies
methodologies to compute abnormal stock returns. In addition to market model we test
market adjusted model and mean adjusted model. The results are not sensitive to the
methodology used for buy transactions in both analyzed groups of companies.
Abnormal returns for sell transactions in internationally cross-listed companies lose its
significance in the event period [-1, +1] and remain significantly positive prior to the
event, and insignificant subsequent to the event. Abnormal returns for sell transactions
do not alter with methodology applied in group of domestically listed companies over
the event dates [-1, +1]. They are however, sensitive in the pre- and post-event period.
The some type of robustness check was applied for the sample excluding clustering
events. The obtained results are essentially similar.
19
4.6. Control Sample
Since our results on informativeness of insider trading may be driven by the fact
that cross-listed companies are usually larger than domestically listed companies, we
attempt to construct a control sample matching the companies according to size. The
main problem we face is that cross-listed companies are mostly large and we are unable
to find suitable counterparts among companies listed domestically. Nevertheless, we
include in the control sample the largest possibly companies and proceed with event
study for this control sample. The results are similar for cross-listed companies and
control sample quantitatively and qualitatively, despite the differences in size8. These
findings may suggest that our assumption is correct yet more complex regression
analysis that controls for fundamental factors affecting information asymmetry is
required.
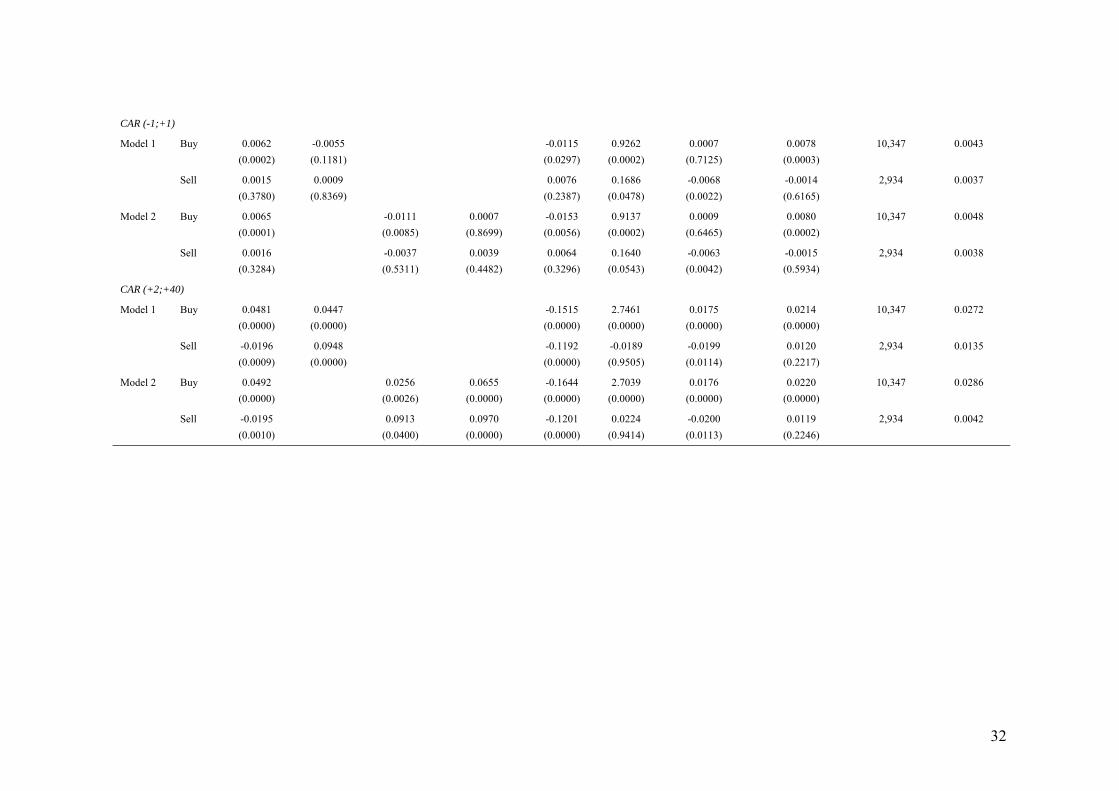
4.7. Cross-Section Analysis and the Endogeneity
Panel I of Table 5 presents the results of cross-sectional regressions to explain
the factors determining price reaction to insider sales and purchases. Cross-listing effect
is captured by a dummy variable, and control variables include the characteristics of
insider trading.
After controlling for other variables in Ordinary Least Squares regressions, we
find that our previous results are confirmed. Abnormal returns in the event window [-1;
+1] in cross-listed companies are lower in absolute values for both sales and purchases.
However, the results for sales are statistically insignificant. In the post event window,
the effects are statistically significant independent of the transaction type. Variables
controlling for the frequency of the transactions, reflecting possible splitting orders or
different insiders trading within a short time period are statistically significant. In these
cases the information content of trades is magnified. The effect of the transaction size is
ambiguous. Larger transactions apparently have larger pricing impact for purchases but
smaller impact for sales.
The comparison of characteristics of cross-listed and domestically listed
companies reveals that decision to cross-list may be endogenously determined (Table1).
Cross-listed companies are definitely larger in terms of market capitalization, total
20
assets and sales. This finding is confirmed in the first step of Heckman-type analysis.
Additionally, debt and market to book ratios appear to be significant determinants of
cross-listing decision. The results of logistic regression are presented in Panel II of
Table 5. The estimated probabilities from logistic regression are then included in cross-
sectional regressions presented in Table 6. The selectivity bias is found to influence the
results. In short window around the insider trading events the cross-listing effect
disappears. The effect of cross-listing on price behavior in post event windows is
somewhat puzzling. The results confirm possible bonding effects in case of sales as we
observe reduced abnormal returns (the coefficient is positive and statistically
significant). However, the effect in case of purchases is reverted and abnormal returns
are significantly higher for cross-listed companies. We conjecture that such findings my
result from asymmetric effect of possible expropriation. The expropriation may be more
severe in case of sales when insiders cash out in the anticipation of bad news leaving the
uninformed investors in long positions in loosing stocks. On the other hand the
expropriation in case of purchases is less harmful when both insiders and outsiders gain
from the price increase. Hence the bonding effect may be more pronounced for sales.
The findings on asymmetry are new for insider trading literature and deserve a further
analysis.
The findings for insider trading day are similar in magnitude.
[Insert Table 5 here]
[Insert Table 6 here]
5. Conclusions
This paper uses a large dataset to analyze the information content of insider
trading in the UK among internationally cross-listed and domestically quoted
companies. The dataset includes over 13,500 observations and spans January 1999 and
December 2003. We test the hypothesis that insider trading is informative and extend
the study to investigate whether insider trades in cross-listed companies are less
informative than insider trades in domestically listed companies.
The results presented in this study corroborate previous findings that insider
trading in the UK conveys price sensitive information. Around the trades and in the
post-event window, we find positive abnormal returns for the purchases and negative
21
abnormal returns for the sells. Moreover, we find that purchases follow significant stock
price declines and sells follow significant stock price run ups. Most of the abnormal
stock price behavior around insider trading is observed in domestically listed
companies. We show that information content of insider trading in cross-listed
companies is relatively small. Our sample of companies with US listings is dominated
by companies that cross-list in the US on stock exchanges, and this way of cross-listing
may improve company’s visibility and reduce information asymmetry mainly due to
high level of disclosure requirements, corporate governance system and law
enforcement. Hence the insider may wish to bond themselves from trading on price
sensitive information. The results of cross-sectional analysis confirm bonding
hypothesis generally in case of sales as we observe reduced abnormal returns. The effect
in case of purchases is somewhat surprising as abnormal returns are significantly higher
for cross-listed companies. We conjecture that such findings my result from asymmetric
effect of possible expropriation. The expropriation may be more severe in case of sales
when insiders cash out in the anticipation of bad news leaving the uninformed investors
in long positions in loosing stocks. In contrast the expropriation in case of purchases is
less harmful when both insiders and outsiders gain from the price increase.
Consequently the bonding effect may be more pronounced for sales.
The conclusions of this paper are based mainly on the preliminary comparison
of abnormal returns for internationally cross-listed and domestically quoted companies
and cross-section analysis. The methodological approach is to be improved, and to fully
identify the impact of cross-listing on insider trading a more accurate model has to be
developed. We need to capture quality of corporate governance systems employed in
each company and control for information asymmetry characteristics to larger extend. It
would be also interesting to investigate insider trading in a larger number of countries.
The existing evidence on insider trading in Europe is scarce and covers few markets.
This would contribute to accomplish comparative analysis and understand the intrinsic
investment behavior of corporate insiders. Moreover, it would help to recognize an
influence of foreign cross-listing on insider trading from broader international
perspective.

References
Bainbridge, S.M., 2002,”Insider Trading: An Overview”. Working Paper (UCLA
School of Law).
Baker, H.K., J.R. Nofsinger and D.G. Weaver, 2002, “International Cross-Listing and
Visibility”. Journal of Financial and Quantitative Analysis 37, 495-521.
Battahacharya, U. and H. Daouk, 2002, “The World Price of Insider Trading”. Journal
of Finance, 57, 75-108.
Bris, A., 2005, “Do Insider Trading Laws Work?”, European Financial Management,
forthcoming
Brown, S. and J. Warner, 1985, “Using Daily Stock returns: The Case of Event
Studies”. Journal of Financial Economics 14, 3-31.
Cofee, J., 1999,”The Future as History: The Prospects for Global Convergence in
Corporate Governance and its Implications”, Northwestern University Law
Review 93, 641-708.
Cofee, J., 2002,”Racing Towards the Top? The impact of Cross-Listing and Stock
Market Competition on International Corporate Governance”. Columbia Law
Review 102, 1757-1831.
Del Brio, E.B., A. Miguel and J. Perote, 2002, “An Investigation of Insider Trading in
the Spanish Stock Market”. The Quarterly Review of Economic and Finance 42,
73-94.
Dimson, E., 1979, “Risk Measurements When Shares are Subject to Infrequent
Trading”. Journal of Financial Economics 7, 197-226.
Doidge, C., 2004, “US Cross-Listings and the Private Benefits of Control: Evidence
from Dual Class Firms”. Journal of Financial Economics 72, 519-554.
Doidge C., G.A. Karolyi and R. Stulz, 2004, “Why are Foreign Firms that are Listed in
the US Worth More?” Journal of Financial Economics 71, 205-238.
Easley, D. and M. O’Hara, 1987, “Price Trade Size and Information in Securities
Markets”, Journal of Financial Economics 19, 69-90.
Ejara, D.D. and C. Ghosh, 2004, “Underpricing and Aftermarket Performance of
American Depositary Receipts (ADR) IPOs”, Journal of Banking and Finance
28, 3151-3186.
Finnerty, J., 1976a, “Insider and Market Efficiency”. Journal of Finance 31, 1141-1148.
23
Finnerty, J., 1976b, “Insiders’ Activity and Inside Information: A Multivariate
Analysis”. Journal of Financial and Quantitative Analysis 11, 205-215.
Friedrich, S., A. Gregory, J. Matatko, and I. Tonks, 2002, “Short-run Returns on
Around the Trades of Corporate Insiders on the LSE”. European Financial
Management, 8(1), 69-87.
Givoly, D. and D. Palmon, 1985, “Insider Trading and the Exploitation of Inside
Information: Some Empirical Evidence”. Journal of Business 58, 69-87.
Gregory, A., J. Matatko and I. Tonks, 1997, “Detecting Information from Directors
Trades: Signal Definition and Variable Size Effects ”. Journal of Business
Finance and Accounting 24, 309-342.
Gregory, A., J. Matatko, I. Tonks and R. Purkis, 1994, “UK Directors’ Trading: the
Impact of Dealing in Smaller Firms”. Economic Journal 104, 37-53.
Heckman, J., 1979, “Sample Selection Bias as a Specification Error”, Econometrica 47,
153-161.
Hillier, D. and A.P. Marshall, 2002, “The Market Evaluation of Information in
Directors’ Trades”. Journal of Business Finance and Accounting 29, 77-110.
Jaffe, J., 1974,”Special Information and Insider Trading”. Journal of Business 47, 410-
428.
John, K. and Lang, 1991, “Insider Trading Around Dividend Announcement: Theory
and Evidence” Journal of Finance 46, 1361-1389.
John , K., and B. Mishra, 1990, “Information Content of Insider Trading Around
Corporate Announcements: The Case of Capital Expenditures”. Journal of
Finance 45, 835-855.
Karpoff, J.M. and D. Lee, 1991, “Insider Trading before New Issue Announcement”.
Financial Management 20, 18-27.
Kyle, A.S., 1985, “Continous Auctions and Insider Trading”, Econometrica 53, 1315-
1335.
La Porta, R., F. Lopez-de-Silanes, A. Schleifer and R.W. Vishny, 1997, “Law and
Finance”. Journal of Political Economy 106, 1113-1155.
Laffont, J. and E.S. Maskin, 1990, “The Efficient Market Hypothesis and Insider
Trading on the Stock Market”, Journal of Political Economy 98, 70-93.

24
Lang, M., K. Lins and D.P. Miller, 2003, “ADRs, Analysts and Accuracy: Does Cross-
Listing in the US Improve a Firm’s Information Environment and Increase
Market Value?, Journal of Accounting Research 41, 317-345.
Lang, M., K. Lins and D.P. Miller, 2004, “Concentrated Control, Analyst Following and
Valuation: Do Analysts Metter Most when Investors are Protected Least”.
Journal of Accounting Research 42, 589-623.
Lasfer, A.M., 2004, “When do Corporate Insiders Trade? The UK evidence”. Working
Paper (Cass Business School).
Lee, D.S., W.H. Mikkelson and M.M. Partch, 1992, “Managers’ Trading Around Stock
Repurchases”. Journal of Finance 47, 1947-1961.
Manne, H.G., 1966, ”Insider Trading and the Sock Market”. Free Press.
Muelbroek, L.K., 1992, “An Empirical Analysis of Illegal Insider Trading”. Journal of
Finance 47, 1661-1699.
Penman, S.H., 1982, “Insider Trading and the Dissemination of Firms’ Forecast
Information”. Journal of Business 55, 479-503.
Reese, W.A.J. and M.S. Weisbach, 2002, “Protection of Minority Shareholders
Interests, Cross-Listing in the United States, and Subsequent Equity Offerings”.
Journal of Financial Economics 66, 65-104.
Sarkissian, S. and M. Schill, 2004, “The Overseas Listing Decision: New Evidence of
Proximity Preference”. Review of Financial Studies 17, 769- 810.
Scholes, M. and J. Williams, 1977, ”Estimating Betas for Non-Synchronous Data ”.
Journal of Financial Economics 5, 309-328.
Seyhun, H., 1986, “Insider’s Profits, Costs of Trading and Market Efficiency”. Journal
of Financial Economics 16, 189-212.
Seyhun, H.N. and M. Bradley, 1997, “Corporate Bankruptcy and Insider Trading”.
Journal of Business 70, 189-216.
Seyhun, H.N., 1990, “Do Bidder Managers Knowingly Pay Too Much for Target
Firms?”. Journal of Business 63, 439-464.
Stulz, R.M., 1999, “Globalisation, Corporate Finance, and the Cost of Capital”. Journal
of Applied Corporate Finance 12, 8-25.
Wojcik, D., G.L. Clark and R. Bauer, 2004, “Corporate Governance and Cross-Listing:
Evidence from European Companies” Working Paper (University of Oxford)
25
Table 1. Descriptive Statistics This table presents descriptive statistics of UK listed companies in our sample. The observations are classified by listing type/exchange. OTC Listing denotes OTC listed ADRs (Level I), Rule 144A Private Placement denotes private placement Rule 144A ADRs, Amex/ NASDAQ/ NYSE denote listing of ADRs on one of the three stock exchanges. Shares Traded is a ratio of a number of shares by an insider to number of shares outstanding at the end of the year. Multiple Trading per Day is a number of insider trades reported at the same day. Market Capitalization, Total Assets, Total Sales and Debt are calculated as at the end of financial year. Debt represents total debt to total assets.
All Companies Cross-Listed Companies Domestically Listed Companies
t-test differences in mean
(3)-(5)
Kruskal -WallisTest for differences in
median Chi-Square
(4)-(6)
Mean Median Mean Median Mean Median Mean Median
(1) (2) (3) (4) (5) (6) (7) (8)
Panel A. Insider Trading (All Observations)
Shares Traded
0.0014 0.0001 0.0003 4.2 × 10⁻⁶ 0.0016 0.0002 8.44*** 2,861.82***
Multiple Trading per
Day
2.2685 1.0000 2.7334 2.0000 2.1690 1.0000 -11.38*** 103.99***
Observations 13,287 13,287 2,344 2,344 10,943 10,943
Panel B. Fundamentals (Firm-Years)
Market Capitalizatio
n (£m)
2,108.00 166.09 12,392.92 4,437.51 574.06 128.39 -8.53*** 673.11***
Total Assets (£m)
5,973.53 879.34 31,485.58 5,001.22 2,168.54 800.62 -6.80*** 497.49***
Total Sales (£m)
1,324.39 119.70 7,145.94 2,219.00 453.20 91.80 -6.64*** 361.54***
M/B 3.93 1.64 10.47 2.17 2.96 1.56 -1.10 33.67***
Debt 0.0991 0.0425 0.2206 0.1933 0.0809 0.0306 -15.58*** 322.51***
Firm-Years 3,159 3,159 410 410 2,749 2,749
26
Table 2. Cumulative Average Abnormal Returns over the (-40, +40) Event Window for the Full Sample The table presents cumulative average abnormal returns around insider trading events computed using event study methodology. Market model coefficients α and β are estimated over days -220 to -41 relative to the event, with FTSE All Share Index as the proxy for market portfolio. The full sample includes all insider trading observations. All results are reported relative to insider trading announcement day (date of the public announcement of insider trading) and trading day (date of insider trading transaction). Cross-listed companies are UK companies listed in the US. Domestically listed companies are UK companies listed in the UK, excluding those cross-listed in the US. ***, **, * denote significance at the 0.01, 0.05 and 0.1 level, respectively.
All Companies Cross-Listed Companies Domestically Listed Companies
t-test differences in mean (2)-(3)
(1) (2) (3) (4)
Panel A Announcement Day
Number of Observations
Buy 10,541 1,966 8,575
Sell 2,994 434 2,560
CARs (-1,+1)
Buy 0.013*** 0.002 0.015*** 7.15***
Sell -0.005*** -0.003 -0.005*** -0.70 CARs (-40, -2) Buy -0.048*** -0.050*** -0.047*** 0.52
Sell 0.056*** 0.046*** 0.058*** 1.36
CARs (+2, +40)
Buy 0.046*** 0.030*** 0.049*** 4.14***
Sell -0.030*** 0.002 -0.036*** -3.74***
Panel B Trading Day
Number of Observations
Buy 10,540 1,966 8,574
Sell 2,989 433 2,556
CARs (-1,+1)
Buy 0.007*** -0.002 0.009*** 4.91***
Sell 0.001 0.005* 0.000 -2.06**
CARs (-40, -2)
Buy -0.046*** -0.049*** -0.045*** 0.85
Sell 0.056*** 0.042*** 0.059*** 1.86*
CARs (+2, +40)
Buy 0.047*** 0.028*** 0.052*** 5.36***
Sell -0.032*** -0.002 -0.037*** -3.51***
27
Table 3. Cumulative Average Abnormal Returns over the (-40, +40) Event Window for the Sample Excluding Clustering Events The table presents cumulative average abnormal returns around insider trading event computed using event study methodology. Market model coefficients α and β are estimated over days -220 to -41 relative to the event, with FTSE All Share Index as the proxy for market portfolio. The sample excludes insider trading clustering observations in (-5, +5) window. All results are reported relative to insider trading announcement day (date of the public announcement of insider trading) and trading day (date of insider trading transaction). All companies are all companies from our sample. Domestically listed companies are UK companies listed in the UK, excluding those cross-listed in the US. Domestically listed companies are UK companies listed only in the UK. ***, **, * denote significance at the 0.01, 0.05 and 0.1 level, respectively.
All Companies Cross-Listed Companies
Domestically Listed Companies
t-test differences in mean (2)-(3)
(1) (2) (3) (4)
Panel A Announcement Day
Number of Observations
Buy 5,893 974 4,919
Sell 2,036 282 1,754
CARs (-1,+1)
Buy 0.010*** 0.001 0.012*** 4.92***
Sell -0.004*** -0.001 -0.004*** -1.21
CARs (-40, -2)
Buy -0.028*** -0.034*** -0.027*** 0.97
Sell 0.047*** 0.039*** 0.048*** 0.88
CARs (+2, +40)
Buy 0.039*** 0.023*** 0.043*** 3.25***
Sell -0.029*** -0.007 -0.032*** -2.50**
Panel B Trading Day
Number of Observations
Buy 5874 983 4,891
Sell 2039 281 1,758
CARs (-1,+1) Buy 0.005*** -0.001 0.006*** 2.63***
Sell 0.002 0.008*** 0.001 -2.16**
CARs (-40, -2)
Buy -0.028*** -0.034*** -0.027*** 0.96
Sell 0.049*** 0.039*** 0.050*** 1.05
CARs (+2, +40)
Buy 0.041*** 0.021*** 0.046*** 4.17***
Sell -0.029*** -0.007 -0.033*** -2.33**

28
Tabela 4. Difference between Announcement Day and Trading Day This table presents analysis of results when announcement day is equal to insider trading day, and when announcement day is greater than insider trading day. The cumulative average abnormal returns around insider trading event are computed using market model event study methodology. Market model coefficients α and β are estimated over days -220 to -41 relative to the event, with FTSE All Share Index as the proxy for market portfolio. The full sample includes all insider trading observations. All results are reported relative to insider trading announcement day (date of the public announcement of insider trading) and trading day (date of insider trading transaction). Cross-listed companies are UK companies listed internationally. Domestically listed companies are UK companies listed only in the UK. ***, **, * denote significance at the 0.01, 0.05 and 0.1 level, respectively.
All Companies Cross-Listed Companies
Domestically Listed Companies
t-test differences in mean (2)-(3)
(1) (2) (3) (4)
Announcement Day = Trading Day
Panel A CAARs calculated for Trading Day Number of Observations Buy 2,689 447 2,242 Sell 598 63 535 CAARs (-1,+1) Buy 0.012*** -0.004 0.015*** 3.70*** Sell 0.001 0.008 0.000 -1.50 (-40, -2) Buy -0.049*** -0.068*** -0.045*** 1.73* Sell 0.067*** 0.051** 0.068*** 0.81 (+2, +40) Buy 0.058*** 0.046*** 0.061*** 1.79* Sell -0.019** 0.024 -0.024** -3.16***
Announcement Day > Trading Day
Panel B CAARs calculated for Trading Day Number of Observations Buy 7,851 1,519 6,332 Sell 2,391 370 2,021 CAARs (-1,+1) Buy 0.005*** -0.001 0.007*** 3.31*** Sell 0.001 0.005 0.000 -1.67* (-40, -2) Buy -0.044*** -0.044*** -0.045*** -0.10 Sell 0.054*** 0.041*** 0.056*** 1.58 (+2, +40) Buy 0.043*** 0.023*** 0.048*** 4.98*** Sell -0.035*** -0.007 -0.040*** -2.96*** Panel C CAARs calculated for Announcement Day Number of Observations Buy 7,852 1,519 6,333 Sell 2,396 371 2,025 CAARs (-1,+1) Buy 0.013*** 0.004** 0.016*** 6.28*** Sell -0.006*** -0.005* -0.006*** -0.40 (-40, -2) Buy -0.047*** -0.045*** -0.048*** -0.46 Sell 0.054*** 0.045*** 0.055*** 1.04 (+2, +40) Buy 0.041*** 0.027*** 0.045*** 3.60*** Sell -0.033*** -0.002 -0.039*** -3.17***

29
Tabela 5. Cross-sectional regressions of cumulative abnormal returns around insider trading announcement and trading day This table presents cross sectional regressions to explain the cumulative abnormal return around insider trading announcement in 3-day and 39-day windows (-1,+1) and (+2,+40), respectively . Cross-Listing is a dummy variable that equals one if the insider trading event involves a firm that is listed in the US, zero otherwise. OTC Listing, and Amex/ NASDAQ/ NYSE are dummy variables and equal one if insider trading event occurs when a firm’s ADRs involve OTC listing (Level I), or listing on one of the three stock exchanges, respectively or zero otherwise. Shares Traded is a ratio of a number of shares by an insider to number of shares outstanding at the end of the year. Multiple Trading per Day is a dummy variable that equals one if more than one insider trades are reported in same company at the same day. Multiple Trading 30 Days is a dummy variable that equals one if more than one insider trades are reported in the same company within 30 calendar days. Size is market capitalization as at insider trading announcement day. Debt is a ratio of total debt to total assets. Specifications in Panel I are the ordinary least square regressions reported relative to insider trading announcement day (date of the public announcement of insider trading) in Panel A and relative to trading day (date of insider trading transaction) in Panel B. Specification in Panel II is a first step Heckman-type procedure, a logistic regression of a probability that a UK firm cross-lists in the US using fundamental and insider trading variables. Pseudo-R2 is goodness of fit of logistic regression model, McFadden’s (1974). P-values are reported in parenthesis.
Constant Cross-Listing
OTC Listing Amex/ NASDAQ/ NYSE
Shares Traded
Multiple Trading per Day
Multiple Trading 30 Days
N Adj. R2
(1) (2) (3) (4) (5) (6) (7) (8) (9)
Panel I. Ordinary Least Square
Panel A. Announcement Day
CAR (-1,+1)
Model 1 Buy 0.0099 (0.0000)
-0.0129 (0.0000)
1.5400 (0.0000)
0.0065 (0.0003)
0.0034 (0.0837)
10,348 0.0092
Sell -0.0039 (0.0079)
0.0023 (0.4272)
0.2102 (0.0083)
-0.0052 (0.0115)
-0.0009 (0.7340)
2,939 0.0032
Model 2 Buy 0.0099 (0.0000)
-0.0135 (0.0001)
-0.0126 (0.0000)
1.5402 (0.0000)
0.0064 (0.0003)
0.0034 (0.0828)
10,348 0.0091
Sell -0.0039 (0.0085)
-0.0009 (0.8544)
0.0037 (0.2732)
0.2085 (0.0089)
-0.0052 (0.0109)
-0.0010 (0.7154)
2,939 0.0031
CAR (+2, +40)
Model 1 Buy 0.0351 (0.0000)
-0.0190 (0.0003)
2.4670 (0.0000)
0.0127 (0.0018)
0.0170 (0.0001)
10,348 0.0053
Sell -0.0302 (0.0000)
0.0402 (0.0001)
0.0849 (0.7722)
-0.0140 (0.0650)
0.0030 (0.7564)
2,939 0.0048
Model 2 Buy 0.0351 (0.0000)
-0.0204 (0.0104)
-0.0181 (0.0045)
2.4673 (0.0000)
0.0127 (0.0018)
0.0170 (0.0001)
10,348 0.0052
Sell -0.0301 0.0104 0.0416 0.0833 -0.0140 0.0029 2,939 0.0045

30
(0.0000) (0.0402) (0.0008) (0.7766) (0.0644) (0.7617)
Panel B. Trading Day
CAR (-1;+1)
Model 1 Buy 0.0053 (0.0013)
-0.0106 (0.0000)
0.9689 (0.0000)
0.0005 (0.8113)
0.0076 (0.0005)
10,347 0.0040
Sell 0.0021 (0.1660)
0.0048 (0.1201)
0.1577 (0.0626)
-0.0067 (0.0024)
-0.0011 (0.7009)
2,934 0.0035
Model 2 Buy 0.0053 (0.0013)
-0.0154 (0.0000)
-0.0076 (0.0156)
0.9699 (0.0000)
0.0004 (0.8250)
0.0077 (0.0004)
10,347 0.0041
Sell 0.0022 (0.1548)
-0.0011 (0.0333)
0.0073 (0.0406)
0.1545 (0.0687)
-0.0068 (0.0022)
-0.0012 (0.6576)
2,934 0.0038
CAR (+2;+40)
Model 1 Buy 0.0358 (0.0000)
-0.0227 (0.0000)
3.3083 (0.0000)
0.0140 (0.0006)
0.0180 (0.0000)
10,347 0.0082
Sell -0.0303 (0.0000)
0.0348 (0.0015)
0.1524 (0.6155)
-0.0207 (0.0088)
0.0069 (0.4821)
2,934 0.0048
Model 2 Buy 0.0358 (0.0000)
-0.0208 (0.0089)
-0.0239 (0.0002)
3.3079 (0.0000)
0.0141 (0.0006)
0.0180 (0.0000)
10,347 0.0081
Sell -0.0304 (0.0000)
0.0431 (0.0213)
0.0312 (0.0153)
0.1568 (0.6055)
-0.0206 (0.0090)
0.0071 (0.3777)
2,934 0.046
Panel II. Logit –First Step Heckman-Type Procedure
Constant Size Debt M/B Shares Traded N Pseudo R2
Model -22.4389 (0.0000)
0.9884 (0.0000)
2.6808 (0.0000)
0.0037 (0.0852)
2.2472 (0.6629)
13,287 0.5526

31
Tabela 6. Second step Heckman-type regression model of cumulative abnormal returns around insider trading announcement and trading day This table reports a second step Heckman-type regression model to explain the cumulative abnormal return around insider trading announcement in 3-day and 39-day windows (-1,+1) and (+2,+40), respectively . λ is a selectivity term computed from the logistic model (the first step Heckman-type model) and used in the second step Heckman-type regression model. Cross-Listing is a dummy variable that equals one if the insider trading event involves a firm that is listed in the US, zero otherwise. OTC Listing, and Amex/ NASDAQ/ NYSE are dummy variables that equal one if insider trading event occurs when a firm’s ADRs involve OTC listing (Level I), or listing on one of the three stock exchanges, respectively, or zero otherwise. Shares Traded is a ratio of a number of shares traded by an insider to number of shares outstanding at the end of the financial year. Multiple Trading per Day is a dummy variable that equals one if more than one insider trades are reported in the same company at the same day. Multiple Trading 30 Days is a dummy variable that equals one if more than one insider trades are reported in the same company within 30 calendar days. Specifications in Panel A are relative to insider trading announcement day (date of the public announcement of insider trading) and relative to trading day (date of insider trading transaction) in Panel B. P-values are reported in parenthesis.
Constant Cross-Listing
OTC Listing Amex/ NASDAQ/ NYSE
λ Shares Traded
Multiple Trading per Day
Multiple Trading 30 Days
N R2
(1) (2) (3) (4) (5) (6) (7) (8) (9) (10)
Panel A. Announcement Day
CAR (-1;+1)
Model 1 Buy 0.0123 (0.0000)
0.0003 (0.9257)
-0.0298 (0.0000)
1.4303 (0.0000)
0.0071 (0.0000)
0.0042 (0.0306)
10,348 0.0130
Sell -0.0044 (0.0047)
-0.0007 (0.8617)
0.0060 (0.3262)
0.2188 (0.0063)
-0.0052 (0.0114)
-0.0012 (0.6607)
2,939 0.0032
Model 2 Buy 0.0125 (0.0000)
-0.0043 (0.2520)
0.0052 (0.1718)
-0.0328 (0.0000)
1.4204 (0.0000)
0.0072 (0.0000)
0.0044 (0.0238)
10,348 0.0134
Sell -0.0044 (0.0057)
-0.0030 (0.5790)
-0.0008 (0.8738)
0.0053 (0.3859)
0.2165 (0.0069)
-0.0052 (0.0190)
-0.0012 (0.6536)
2,939 0.0030
CAR (+2;+40)
Model 1 Buy 0.0464 (0.0000)
0.0436 (0.0000)
-0.1409 (0.0000)
1.9477 (0.0000)
0.0159 (0.0000)
0.0210 (0.0000)
10,348 0.0218
Sell -0.0185 (0.0013)
0.1048 (0.0000)
-0.1284 (0.0000)
-0.0999 (0.7336)
-0.0137 (0.0681)
0.0087 (0.3670)
2,939 0.0156
Model 2 Buy 0.0474 (0.0000)
0.0231 (0.0064)
0.0558 (0.0000)
-0.1546 (0.0000)
1.9033 (0.0001)
0.0161 (0.0000)
0.0219 (0.0000)
10,348 0.0235
Sell -0.0179 (0.0009)
0.0901 (0.0000)
0.1143 (0.0000)
-0.1324 (0.0000)
-0.1143 (0.6972)
-0.0139 (0.0641)
0.0085 (0.3763)
2,939 0.0157
Panel B. Trading Day
32
CAR (-1;+1)
Model 1 Buy 0.0062 (0.0002)
-0.0055 (0.1181)
-0.0115 (0.0297)
0.9262 (0.0002)
0.0007 (0.7125)
0.0078 (0.0003)
10,347
0.0043
Sell 0.0015 (0.3780)
0.0009 (0.8369)
0.0076 (0.2387)
0.1686 (0.0478)
-0.0068 (0.0022)
-0.0014 (0.6165)
2,934 0.0037
Model 2 Buy 0.0065 (0.0001)
-0.0111 (0.0085)
0.0007 (0.8699)
-0.0153 (0.0056)
0.9137 (0.0002)
0.0009 (0.6465)
0.0080 (0.0002)
10,347 0.0048
Sell 0.0016 (0.3284)
-0.0037 (0.5311)
0.0039 (0.4482)
0.0064 (0.3296)
0.1640 (0.0543)
-0.0063 (0.0042)
-0.0015 (0.5934)
2,934 0.0038
CAR (+2;+40)
Model 1 Buy 0.0481 (0.0000)
0.0447 (0.0000)
-0.1515 (0.0000)
2.7461 (0.0000)
0.0175 (0.0000)
0.0214 (0.0000)
10,347 0.0272
Sell -0.0196 (0.0009)
0.0948 (0.0000)
-0.1192 (0.0000)
-0.0189 (0.9505)
-0.0199 (0.0114)
0.0120 (0.2217)
2,934 0.0135
Model 2 Buy 0.0492 (0.0000)
0.0256 (0.0026)
0.0655 (0.0000)
-0.1644 (0.0000)
2.7039 (0.0000)
0.0176 (0.0000)
0.0220 (0.0000)
10,347 0.0286
Sell -0.0195 (0.0010)
0.0913 (0.0400)
0.0970 (0.0000)
-0.1201 (0.0000)
0.0224 (0.9414)
-0.0200 (0.0113)
0.0119 (0.2246)
2,934 0.0042

33
-0,06
-0,04
-0,02
0
0,02
0,04
0,06
-40 -35 -30 -25 -20 -15 -10 -5 0 5 10 15 20 25 30 35 40
Purchases Cross-Listed Stocks
Sells Cross-Listed Stocks
Purchases Domesticly-Listed StocksSells Domesticly-Listed Stocks
Figure 1. Cumulative Abnormal Returns around Insider Trading Announcement

34
1 Corporate insider definition is narrower in the UK law, than in the US where corporate
insider definition includes officers, directors and shareholders of at lest 10% of any
equity class. 2 See for example, Jaffe, 1974; Finnerty, 1976a and 1976b; Pope, Morris and Peel,
1990; Gregory, Matatko, Tonks and Purkis, 1994; Grgory et al. 1997, Friederich et al.,
2002, and Hillier and Marshall, 2002. 3 We find a number of days with more than one transaction or announcement of
transaction in shares of the same company. Sometimes a few transactions made on
different days are reported in one announcement. Overall, our sample size is larger than
any other recent insider trading study on UK data. Gregory et al.1997 use 6,756
transactions for 1,683 companies between January 1986 and December 1990, Friedrich
et al. 2002 use 4,399 transaction for 196 companies between October 1986 and
December 1994, and Hillier and Marshall, 2002 use 7,796 transaction for 1,350
companies between September 1991 and March 1997. 4 This data unavailability issue has also been one of the limitations of previous studies.
For example, Karolyi (1998) checked thourouly for this type of data but was unable to
complete his dataset. 5 Our sample is biased toward more recent ADRs programs because Bank of New York
and JP Morgan provide information on the most recent programs only. 6 Some of the cross-listed companies use two ways to list their ADRs, for instance over
the counter and stock exchange. In such a case we consider such a company as listed on
the stock exchange because it implies stricter disclosure requirements. 7 See Greene, 1997, Chapter 20. 8 These results are available from the authors upon request.