insider power and wage determination in bulgaria€¦wage determination and insider power in...
TRANSCRIPT
FACULTEIT ECONOMIEEN BEDRIJFSKUNDE
HOVENIERSBERG 24B-9000 GENT
Tel. : 32 - (0)9 – 264.34.61Fax. : 32 - (0)9 – 264.35.92
WORKING PAPER
Insider Power and Wage Determination in Bulgaria
An Econometric Investigation
Sabien Dobbelaere∗
Ghent University, Belgium∗∗
LICOS Centre for Transition Economics, KUL, Belgium
October 2001
2001/117
∗ We are grateful to Prof. Dr. J. Konings, Director of LICOS Centre for Transition Economics, Catholic Universityof Leuven, Belgium, Prof. Dr. F. Heylen, Ghent University, Belgium and participants at the EEA-IZA SummerSchool in Labor Economics 2001 for helpful comments and suggestions. Financial support from the FlemishScience Foundation (FWO) is gratefully acknowledged.∗∗ Department of Social Economics, Ghent University, Hoveniersberg 24, B-9000 Ghent, Belgium. E-mail:[email protected].
D/2001/7012/18
ABSTRACT
Using a unique 3-digit firm level data set of all medium and large sized manufacturing enterprises in
Bulgaria covering the years 1997/1998, we investigate how wage determination is related to
ownership status. Building on a slightly modified version of the Right-To-Manage Model, our pooled
OLS, panel and first-differences TSLS estimates show statistically significant differences in the share
of rents taken by workers employed in state, private domestic and foreign firms. Taking account of
firm heterogeneity, we find that rent sharing is nearly non-existent in foreign-owned firms while the
level of pay is higher compared to state-owned companies. Further, rent sharing seems to be highly
pronounced in state-owned enterprises while on average domestically private-owned companies are
characterised by less rent sharing. Overall, our robustness checks confirm these findings.
JEL Classification : C23, D21, J30, P31.
Key Words : Bulgarian Labour Market, Enterprise Behaviour, Insider Effects, Panel Data.
Wage Determination and Insider Power in Bulgaria 2
I. INTRODUCTION
One of the oldest questions in economics is whether the market for labour can be represented
satisfactorily by a standard competitive model. The importance of this question, which has
implications for macroeconomics as well as labour economics, has stimulated much research and more
than a little controversy. In a prominent early attack on traditional analysis, Sumner Slichter (1950)
argued that a competitive model fails to explain the empirical evidence that apparently homogeneous
types of employees earn significantly different amounts in different industries. His data, drawn from
the US manufacturing sector, showed that wages appeared to be positively correlated with various
measures of firm’s ability-to-pay. Slichter concluded that this correlation provides prima facie
evidence against a conventional competitive model.
In the literature, there exist three types of rent-sharing models in which the firm’s ability-to-pay
explains its wage payments1. In the Modified Competitive Model, the combination of product demand
shocks and a strictly upward sloping labour supply curve leads to a positive short-run causality from
profits to wages in a competitive framework. (Hildreth, Oswald, 1994) Intuitively, this is the result of
temporary frictions causing wages to be bid up by a demand shock. However, there is no long-run or
steady-state relation between wages and profit variables. This arises from the fact that in the long run,
there should be free entry along a perfectly elastic labour supply curve.
The Optimal Labour Contract Model is a generalisation of the Baily (1974) and Azariadis (1975)
optimal contract framework in which firms are allowed to be averse to risk. Intuitively, the firm and
the workers reach an implicit contract in which wages are set to provide efficient insurance against
random demand shocks, resulting in a long-run co-movement of profits and wages.
In the Rent-sharing Bargaining Model inside forces cause externalities on the labour market2.
Intuitively, insiders appropriate some of the firm’s non-competitive rents, causing a long-run positive
partial correlation between wages and profits.
Empirically, there are different approaches to estimate the effect of industry or firm performance on
wages within a collective bargaining framework. Each of them focuses on the twin roles of internal
pressure from the firm’s or sector’s product market and external pressure from the geographical labour
market in which the firm or sector operates.
First, some studies concentrate explicitly on the impact of profits per employee on the level of pay.
Among them are Abowd and Lemieux (1993) [Canada]; Blanchflower, Oswald and Garrett (1989)
[UK]; Blanchflower, Oswald and Sanfey (1996) [US]; Christofides and Oswald (1992) [Canada];
1 For a theoretical framework, see Blanchflower, Oswald and Sanfey (1992, 1996).2 For a theoretical framework, see Section 2.
Wage Determination and Insider Power in Bulgaria 3
Goos and Konings (2001) [Belgium]; Hildreth and Oswald (1994) [UK]; Teal (1996) [Ghana] and Van
Reenen (1996) [UK].
A second group of papers focuses on the effect of value added or sales per employee together with
quasi-rents. Carneiro (1997) [Brazil]; Currie and McConnell (1992) [US]; Grosfeld and Nivet (1999)
[Poland]; Lever and Marquering (1996) [the Netherlands]; Luke and Schaffer (1999) [Russia]; Nickell
and Kong (1992) [UK]; Nickell and Wadhwani (1990) [UK] and Teulings and Hartog (1998) [the
Nordic countries, Germany, US, Canada, Australia] follow this line of reasoning.
A third category of studies estimates directly the effect of product market power on wages. For
example, Abowd and Lemieux (1993) [Canada]; Budd and Slaughter (2000)3 [Canada]; Konings and
Walsh (1994) [UK]; Lever and Marquering (1996) [the Netherlands] and Van Reenen (1996) [Britain]
provide evidence that a highly oligopolised market structure may be conducive to rent sharing, hence
leading to higher wages.
Considering a range of estimation methods, all these studies strongly support the rent-sharing
hypothesis. When using the current or the lagged value of the variables measuring firm/sector
performance, the elasticity of wages with respect to the internal variable lies in general between 0.01
and 0.09. Using Lester’s (1952) methodology for parameterising the size of rent sharing in labour
markets, it is found that 18-36% of wage inequality may be the result of rent sharing. Instrumenting
the profit terms by variables capturing truly exogenous profit shocks, increases the importance of the
rent-sharing parameter greatly. OLS estimates are typically different from instrumental variable
estimates by a factor of ten. For example, Abowd and Lemieux (1993) using a foreign competition
measure, Teal (1996) using the share of intermediate input costs in total output and Van Reenen
(1996) using innovation measures as instruments find a profitability-wages elasticity of 0.27-0.39.
These findings are however criticised by some authors who point to the implausibly high induced
Lester’s range of wages. Moreover, Blanchflower, Oswald and Sanfey (1996) conclude that using
sector-average cost shocks to energy as instruments yields the same results as using the lag procedure
although the former estimates are less precise. Most studies -among them Blanchflower, Oswald and
Sanfey (1992), Goos and Konings (2001), Hildreth and Oswald (1994) and Teal (1996)- indicate that
rent sharing is not solely driven by (highly) unionised sectors.
In this paper, we want to shed light on the economics of wage determination in a reforming country,
Bulgaria. Bulgaria can be considered as lagging behind in the transition process: GDP-growth was still
negative in 1997 and 1998 and the GDP-level is still far below the pre-transition level. (EBRD, 2000)
The analysis draws upon a unique representative panel of firms in manufacturing with detailed
information on output and input factors and firm ownership (company accounts data) for the period
1997-1998. We estimate a modified version of the Right-to-Manage model to test the existence of
3 These authors provide evidence of international rent sharing and reveal that the organisation structure as well as tradebarriers influence the rent-sharing pattern considerably.
Wage Determination and Insider Power in Bulgaria 4
non-competitive elements in the Bulgarian labour market. As the prevailing wage setting mechanism
reveals to some extent the objectives underlying firm’s behaviour, the central question investigated in
this paper is whether and how wage determination is related to form of ownership. In particular, the
wage formation process in state-owned, private domestic-owned and foreign-owned firms may reflect
the relative strength of their insiders and the relative importance given to profitability considerations.
We take into account unobserved firm heterogeneity that may have an important impact on the wage
formation process.
In the remainder, the paper will first provide a theoretical model and a model in terms of observables.
Section III presents the data set and some summary statistics. Section IV discusses the estimation
method and confronts the different theoretical hypotheses with Bulgarian firm-level data. Some
robustness checks are reported in Section V. Section VI gives an interpretation of the results. Section
VII concludes.
II. THEORETICAL AND EMPIRICAL FRAMEWORK
1. Theoretical Framework
Given the important role of insiders especially in the beginning of the transition period, wages are
considered to be the result of bargaining between the workers and the firm represented by its manager.
Using this framework, we want to investigate one aspect of enterprise behaviour -wage determination-
somewhat further on the transition path.
Right-To-Manage Model. In attempting to model how labour unions/insiders may raise their wage
above the outside option or the alternative wage, the literature developed two basic models of rent
sharing in a collective bargaining framework4. In the Right-To-Manage model (Nickell, Andrews,
1983), the union and the firm bargain over wages in the first stage. In the second stage, the firm
unilaterally determines its optimal level of employment subject to constraints implied by the labour
demand function, taking the wage rate as given. In the Efficient Bargaining model, both parties
determine simultaneously wages and employment5. For our purpose, we use the Right-To-Manage
model adjusted to a transition context.
In its general form, the Right-To-Manage model has a generalised Nash bargaining solution which is
the product of each agent’s gain from reaching an agreement, weighted by their respective bargaining 4 For a good summary of the issues, see Booth (1995).5 Both models produce the same wage equations and predict that unions with any bargaining power will lift the wage rateabove the competitive level, whether along the labour demand curve or along the contract curve (rent sharing). The twomodels are however characterised by fundamental differences regarding employment. First, the Right-To-Manage modelpredicts that unions can only raise wages above the market equilibrium at the cost of reducing employment whereas in theEfficient Bargaining model unions will raise wages as well as employment above the competitive level. Second, in the Right-
Wage Determination and Insider Power in Bulgaria 5
strengths. In case no bargain is reached with the unionised workforce, the fall-back position of the firm
equals zero because it cannot obtain other workers since -by assumption- there are no non-union
workers in the sector. As a result, the firm’s net gain is equal to its profit function ( ) ,Y N WNπ = −
with π real profits, W the real wage, N the employment level and ( )Y N a twice differentiable real
value added function characterised by '( ) 0, "( ) 0Y N Y N> < and (0) 0.Y = The status-quo position for a
representative union member amounts to ( ),u A with A a weighted average of the unemployment
benefit and the wage that a worker would obtain elsewhere with weights being determined by the
probability of finding another job. Using the expected utility representation, the union’s net gain
amounts to [ ( ) ( )] ,Nu W u A
L− with L membership, W A> and 0 .N L< ≤
When β represents the bargaining strength of the employees, the generalised Nash bargaining
problem can be written as:
[ ]{ } [ ]{ }
[ ]{ } { }
1
1
max , ( ), , ( )
max ( ) ( ) ( )
W
W
U W N W A W N W
Nu W u A Y N WN
L
πβ −β
β−β
�
− −
=ф
ф=
(1.1)
Modified Right-To-Manage Model. What is the impact of labour market conditions on wage
determination at the firm level? Can we observe upward responsiveness of wages to labour
productivity? Is this effect differentiated according to insider power? To study these questions, we
modify the basic Right-To-Manage model slightly.
First, union members are regarded as being risk neutral. Second, we assume that in the short run
employment is not an argument in the union’s utility function. In other words, the median worker is
considered to be certain of his job such that utility is only affected by the wage rate in the short run.
Algebraically, the real wage W is assumed to result from the maximisation of the following Nash-
bargaining maximand:
[ ]{ } [ ]{ }
{ } { }
1
1
, , ( )U W A W N W
W A Y WN
πβ −β
β −β
�
− −
=ф
ф =
(1.2)
with A the outside option expressed in real terms, π real profits and Y real value added.
To-Manage model employment is highly endogenous with respect to wages while in the Efficient Bargaining frameworkemployment is independent of the wage actually agreed upon. (Nickell, Andrews, 1983)
Wage Determination and Insider Power in Bulgaria 6
Rewriting (1.2) in logs, we obtain:
( ) ( )1ln ln lnW A π− − ββ +ф= (1.3)
For a maximum of this function with respect to the wage, it is required that:
( )ln ln(1 ) 0
ln ln
(1 ) 0
W A
W W
W W
W A W
π
ππ
−
∂
− ∂
∂ ∂β + −β =
∂ ∂�
β + − β =
(1.4)
Since ,W
Nπ∂
∂= − equation (1.4) can be written as:
1W A
N
πβ= +
− β(1.5)
Third, value added is used to capture the firm’s good fortune. Our motivation is twofold. The first
reason is that it can be argued that accounting profits may bear little resemblance to economic profits
or the size of rents. This is especially the case when economic and accounting rates of depreciation
differ significantly. Hence, the value-added variable might be a better proxy for economic rents. A
second reason is that although the profits per worker variable has the advantage that it controls for all
costs, it has the disadvantage that it is negatively related to wages by construction, hence creating a
severe endogeneity bias. Switching to value added per employee eliminates the direct endogeneity
problem6.
As real profits equal real value added minus the wage bill ( WNYπ = − ), the term 1
Wβ
− βshould be
added to both sides of equation (1.5) to obtain an expression for the equilibrium wage in function of
real value added per worker:
[ ]
' (1 )
1 1
' with A A
WNW W A
N
YW A
N
π
= − β
+β β+ = +
− β − β
= + β
� (1.6)
6 This does however not imply that endogeneity is not an issue anymore. For example, wage shocks affecting productivitymay cause endogeneity problems when using real value added per employee.
Wage Determination and Insider Power in Bulgaria 7
According to this model, real firm-level wages are affected by both internal conditions or inside forces
(represented by value added per employee) and external factors or outside forces (taken up by the
outside option or the alternative wage) and the bargaining power of the employees. Most studies
measure the latter parameter explicitly by variables such as union density/coverage or strike intensity.
In this study, the correlation between real wages and variables measuring firm performance is taken to
be indicative of insider power.
As we are particularly interested in the impact of ownership form on wage formation, the fourth
modification consists in adding an extra dimension to the original Right-To-Manage model. More
specifically, the ownership status of the firm is expected to be a potential determinant of insider
power. Therefore, in the estimations we allow both for ownership-specific (state-owned, private
domestic-owned and foreign-owned) coefficients on the proxy for internal factors and ownership
intercept coefficients.
2. Empirical Model
The specification that acts as the bedrock for our regressions is given by:
it privd it for it rt it privd it it for it it itPRIVD FOR PRIVD FORW A valad valad valad= α + α + α + δ + γ + γ + γ + ε (1.7)
where subscript i is used to index observations on individual firms, r denotes region and t represents
year (1997 and 1998 respectively). The dependent variable is the annual real wage per worker in firm
.i In our main results, real value added per worker ( )valad is used to capture the internal conditions of
the firm. To check robustness, we will later proxy inside forces by the impact of real profits or real
sales per worker on real firm-level wages.
The variables PRIVD and FOR refer to the fraction of shares held by private domestic owners and
foreign owners in the firm at time t . The ownership category that is left out is the state, which refers
to the fraction of shares in the firm held by the state, municipalities or Treasury.
The conditions on the labour market (external conditions or indicators of the workers’ fall-back utility)
are represented by different variables (denoted by A in specification (1.7)). First, we incorporate
regional dummies to capture regional effects. These dummies can be interpreted as a very crude
measure for outside pressure because they are likely to reflect some of the geographical element of
excess labour supply. Controlling for region-specific effects is in the context of Bulgaria particularly
important as there are considerable disparities between the regions in which the firms are located (see
below). Second, we take the running average regional wage per worker as a proxy for the outside
option or alternative wage. Third, the regional unemployment rate, which takes into account low
mobility of labour, is used. Finally, the external factors are captured by the average two-digit sectoral
wage, reflecting relative conditions of labour demand and supply. After all, wage bargainers are
expected to take account of industry-wide wage agreements in their own wages. Next to it, the
Wage Determination and Insider Power in Bulgaria 8
specifications combine the average sectoral wage with either the regional unemployment rate or the
regional dummies7.
ε represents a white noise error term. All specifications include a year dummy to capture possible
unobservable aggregate shocks. Finally, we control for unobserved firm heterogeneity by including a
firm level fixed effect, even within the separate ownership groups. With a view to really testing the
basic Right-To-Manage model, we do not take the logarithm of the variables under consideration.
Hypotheses. When the outside forces are proxied by either the average regional wage or the average
sectoral wage per worker, the bargaining framework predicts a positive coefficient of .δ In case A is
measured by the regional unemployment rate, the sign of δ is expected to be negative since regional
unemployment signals labour market tightness to the insiders. The higher the regional unemployment
rate, the lower the probability of finding an alternative job in the same region. As a result, the insiders
will moderate their wage claims.
Based on efficiency-wage considerations, the level of inside wages in private firms is expected to be
higher than the wage level in state firms, i.e. privdα and forα are expected to be positive. Next to it, it
is often argued that foreign firms have superior technological know-how and expertise compared to
domestic firms, which leads them to be more efficient than domestic companies. (Djankov and
Hoekman, 1998) In the literature on multinational enterprises (MNE), it is also a stylised fact that
foreign firms pay on average higher wages than their domestic counterparts. The reasoning behind this
is that they try to attract the best-educated and motivated workers by paying the highest wages.
Therefore, we expect the coefficient of forα to be larger than the coefficient of .privdα
A priori, we anticipate an upward responsiveness of real firm-level wages to rents per worker. At the
same time, important differences of the insider effect across different types of firms (i.e. differences in
the absolute size of the coefficients , privdγ γ and )forγ are expected.
III. DATA AND SUMMARY STATISTICS
We use a panel of 1514 manufacturing firms from the 28 regions (‘oblasti’) in Bulgaria covering the
period 1997-1998. To be included in the data set at least one of the following criteria has to be
satisfied: number of employees greater than 100, total assets and sales exceed 8 and 16 million USD
respectively. All the variables are taken from published annual company accounts which were made
consistent across countries by “Bureau Van Dyck”. The monetary variables are expressed in millions
of leva. The data set is called the Amadeus data set.
7 As the average regional wage and the regional unemployment rate (correlation: -0.60) already filter out regional effects,they are not taken up together with the regional dummies.
Wage Determination and Insider Power in Bulgaria 9
This unique data set allows us to make at least two main contributions. First, scarce existing empirical
work on transition economies in this field mostly had to rely on small samples of firms collected
through surveys. In contrast, our sample contains virtually the entire population of medium and large
firms in manufacturing. Comparing the employment and sales coverage of the data with the total
employment and sales in manufacturing reported in the statistical yearbooks reveals that the data cover
82% of total sales and 66% of total employment in manufacturing8. In Appendix, table A1 presents a
comparison between the sample and the population for all two-digit sectors. From table A1, it follows
that the data are also quite representative at the 2-digit NACE sector level. Thus, our data set can be
considered as fairly representative of the population of firms operating in the manufacturing sector.
Furthermore, the data set is collected from company accounts at the three-digit level of sectoral
disaggregation. To our knowledge, this kind of detailed firm-level data for a transition country has not
been used before for this purpose.
A second strength of the data set is that it offers detailed information on the ownership structure of
firms for two consecutive years. In particular, we know the fraction of shares held by the state and by
private investors and can observe its evolution over time. Next to it, we are able to make a distinction
between private domestic investors and foreign investors. Based on this detailed description of the
shareholding structure and in line with the literature on the effect of ownership in transition countries,
we also classify firms as being majority state-owned, majority private domestic-owned or majority
foreign-owned. Earlier studies for Central and Eastern Europe in this field had to rely on ownership
dummies to investigate the crucial question of how wage formation is related to form of ownership.
(Grosfeld, Nivet, 1997, 1999; Luke, Schaffer, 1999) The use of fractions of shares also enables us to
perform some additional robustness checks. Table 1 shows how ownership is distributed on average.
Table 1 Distribution of Ownership1997 1998
Mean (St.Dev.) Mean (St.Dev.)
% State ownership (STATE) 0.34 (0.38) 0.27 (0.35)Fraction of STATE firms in total number of firms 0.70 0.66% State of all state firms 0.49 (0.36) 0.40 (0.35)
% Private domestic ownership (PRIVD) 0.62 (0.39) 0.68 (0.37)Fraction of PRIVD firms in total number of firms 0.79 0.83% Private domestic of all private domestic firms 0.78 (0.26) 0.82 (0.23)
% Foreign ownership (FOR) 0.04 (0.17) 0.05 (0.19)Fraction of FOR firms in total number of firms 0.06 0.08% Foreign of all foreign firms 0.68 (0.23) 0.63 (0.29)
Number of majority state firms 332 269Number of majority private domestic firms 897 1150Number of majority foreign firms 63 83Source: Amadeus Database
8 Sales coverage ratio = total sales of firms in Amadeus in 1998 divided by total national sales as reported by the NationalStatistical Offices. Idem for employment.

Wage Determination and Insider Power in Bulgaria 10
Note from table 1 that state ownership is relatively important but decreased very much in 1998 while
the average fraction of shares in 1998 held by private domestic owners increased up to 68%. This
ownership change is the result of a major privatisation program that finally took place. (EBRD, 2000)
The fraction of shares held by foreign owners is only 4% on average, meaning that only a relative
small fraction of firms do have some foreign participation. If we look at shareholding in foreign firms
only, however, we can see that the low average share of foreign ownership hides the fact that foreign
investors are concentrated in a few firms. For example, in 1998 119 firms had a foreign owner, the
average share was 63% and 83 firms were holding more than 50% of the shares. Hence, foreign
investors own most of the time a majority share. Concentration on shareholding in domestically
private firms only reveals that private domestic investors hold on average 80% of the total shares in
domestically private firms. Finally, we can observe that the fraction of private domestic and foreign
firms in the total number of firms increases over time9. Recently, the flows of foreign direct
investment started to increase rapidly. By 1998 there was almost a 10-fold increase in FDI compared
to 1991. (EBRD, 2000) The rising number of firms in total reflects a better coverage in the latest year
and indicates that our analysis draws upon an unbalanced panel.
The regional variables (at the NUTS3-regional level) are collected from the National Statistical
Institute and the United Nations Development Program10.
Table 2 presents summary statistics for the variables used in the regression analysis.
Table 2 Summary statisticsVariables 1997 1998 1997-1998
Obs. Mean St. Dev. Obs. Mean St. Dev. Obs. Mean St. Dev.Employment 1306 374.12 759.47 1381 348.03 693.74 2687 360.71 726.41Average wage 1043 98.62 101.86 1109 112.22 76.55 2152 105.63 89.95Alternative wage1 1514 97.71 16.71 1514 111.81 15.17 3028 104.76 17.44Alternative wage2 1509 97.11 25.53 1509 110.33 32.87 3018 103.72 30.16Regional unemployment rate 1514 15.42 5.64 1514 16.39 5.25 3028 15.91 5.47Sales per employee 1045 652.04 1245.87 1111 1349.29 18863.37 2156 1011.34 13570.30Profits per employee 1038 178.08 601.59 1106 303.45 3277.26 2144 242.75 2391.06Value added per employee 1038 277.09 663.89 1108 415.98 3279.45 2146 348.80 2401.73Source: Amadeus Database, NSI (1998, 1999), UNDP (1999)
All annual wages are expressed as real wages per worker, i.e. nominal wages deflated by a three-digit
producer price index, normalised to 1 in 1995. This price index is obtained from the central statistical
offices. Alternative wage 1 represents the running average regional wage per worker and alternative
wage 2 the average two-digit sectoral wage per worker. Profits, value added and sales per worker are
also expressed in real terms. Value added is calculated as sales minus material costs and profits as
value added minus the wage bill. Average measures are constructed by dividing the variables by the
9 Note that the sum of the fractions of respectively state, private domestic and foreign firms in the total number of firms donot add up to 1 as each firm can have multiple owners.10 We are grateful to Dr. A. Ivanov (National Coordinator, Human Development Team, Bulgaria) for providing useful data.
Wage Determination and Insider Power in Bulgaria 11
average number of employees in each firm for each year respectively. The average employment level
is 361 and employment ranges from 6 to 16280 employees.
From table 2, it is clear that profits, value added as well as sales vary much more than wages.
Restricting the data to the balanced panel indicates that over the sample period the producer price
index increases by 24% and the average employment level decreases by 5%. Real wages per worker,
real sales per worker and real value added per worker display an increase of 17%, 27% and 36%
respectively whereas real profits per worker decreases by 7%.
The spread of the regional unemployment rate reveals considerable regional variation and disparities.
A closer look at the regional data shows that the region Sofia (situated in the district Sofia-City) is
characterised by the lowest average unemployment rate (8.4%) and the highest real wages. In contrast,
the highest unemployment rate is to be found in the region Montana (situated in the North-West,
district Montana). Real wages are the lowest in the region Kyusendil (situated in the South-West,
Sofia district). The National Human Development Reports (UNDP, 1999, 2000) indicate that the
income gap between the richer and the poorer regions is almost 50%. Moreover, there is strong
evidence of a dramatically increasing income gap and hence rising disparities and inequality among
and within regions. The uneven distribution of resources and access to policies may help explain these
regional differences.
The classification of firms according to majority shareholding shows that the average employment
level is the highest in majority foreign firms (652), followed by majority state firms (441) and the
lowest in majority private domestic firms (331) (see lower part of table 3). Workers in majority
foreign firms get the highest wages (mean wage of 153). Wages in majority state and majority private
domestic companies are much lower (mean wage of 100 and 106 respectively). Privatisation is clearly
associated with better firm performance. Majority private domestic firms outperform majority state
firms. Furthermore, majority foreign firms outperform majority state firms as well as majority private
domestic firms. Using the same data set, recent empirical research has found that privatisation has
positive effects on firm performance and that foreign-owned firms do better than domestically private-
owned firms. (Estrin et al., 2001) Strikingly, 18% of majority state companies (87 out of 476) are
classified as loss-making firms, reporting non-positive profits per employee over the sample period.
Concentration on the evolution of the variables over time and restriction to the balanced panel reveals
that, apart from the employment level and real profits per worker, majority state, majority private
domestic and majority foreign companies behave in the same way. Two proxies for internal
conditions, real sales and real value added per worker, show a considerable increase over the sample
period. Real value added per worker, for example, increases by 32%, 21%, 32% and 16% in the total
sample, in majority state firms, in majority private domestic enterprises and in majority foreign
companies respectively. Real profits per worker decrease by 6%, 4% and 7% in the total sample, in
Wage Determination and Insider Power in Bulgaria 12
majority state companies and in majority private domestic firms while majority foreign companies
record an increase in real profits per worker of 12%. Real wages per worker display a rise of 17% in
the whole sample and in majority private domestic firms, an increase of 10% in majority state
companies and a rise of 25% in majority foreign firms.
Table 3 Summary statistics by Ownership Category11
Variables Obs. Total SampleMean (St. Dev.)
Obs. Maj. StateFirms
Mean (St. Dev.)
Obs. Maj. Priv. Dom.Firms
Mean (St. Dev.)
Obs. Maj. ForeignFirms
Mean (St. Dev.)1997Employment 1163 400.4 (799.0) 303 528.6 (1398.4) 802 335.0 (390.4) 58 635.3 (553.3)Average wage 933 101.7 (105.6) 265 98.2 (84.2) 620 100.3 (114.3) 48 137.9 (89.0)Sales per employee 936 633.5 (1160.5) 265 498.5 (740.2) 623 651.1 (1295.2) 48 1150.8 (1066.1)Profits per employee 931 167.3 (595.5) 265 111.5 (396.3) 618 179.1 (667.2) 48 323.8 (495.2)Value added per employee 931 269.1 (663.3) 265 209.7 (446.5) 618 279.6 (742.0) 48 461.7 (545.8)
1998Employment 1371 346.8 (695.0) 236 328.5 (609.3) 1058 327.8 (708.5) 77 664.1 (685.7)Average wage 1102 112.2 (76.7) 211 102.0 (78.0) 828 110.8 (71.5) 63 164.7 (112.2)Sales per employee 1104 1351.1 (18922.8) 211 381.8 (428.1) 830 1578.1 (21809.9) 63 1606.3 (2338.0)Profits per employee 1099 303.4 (3287.5) 211 98.5 (271.5) 827 337.2 (3741.0) 61 553.9 (2153.0)Value added per employee 1101 415.9 (3289.7) 211 200.6 (304.1) 828 447.6 (3743.2) 62 725.8 (2145.3)
1997-1998Employment 2534 371.4 (744.8) 539 441.0 (1126.8) 1860 330.9 (592.5) 135 651.7 (630.1)Average wage 2035 107.4 (91.2) 476 99.9 (81.5) 1448 106.3 (92.4) 111 153.1 (103.2)Sales per employee 2040 1021.9 (13944.3) 476 446.8 (623.6) 1453 1180.7 (16507.8) 111 1409.3 (1902.1)Profits per employee 2030 241.0 (2452.7) 476 105.7 (346.3) 1445 269.6 (2863.8) 109 452.6 (1641.7)Value added per employee 2032 348.7 (2463.3) 476 205.6 (389.5) 1446 375.8 (2874.2) 110 610.5 (1649.7)Source: Amadeus Database
IV. ESTIMATION METHOD AND RESULTS
1. Estimation Method
The estimation strategy consists of three parts. First, in line with existing empirical research, the
Pooled Ordinary Least Squares estimator is used as a benchmark for cross-sectional time-series
estimates. The standard linear model is given by:
β εy = x + (1.8)
where y is 1NT ∗ , x is *NT K and εεεε is 1NT ∗ . As it is assumed that 2(0, )it IID∼ σε for all i and ,t
the panel structure of the data is essentially ignored. Therefore, the pooled OLS results are mostly
presented for illustrative purpose. To take somehow into account that individual firm data are not
independent over time, the cluster(identification) option is applied. This option specifies that the
11 In table 3, the sample is restricted to firms which are classified according to majority shareholding. In contrast, the samplein table 2 also contains firms which have multiple owners. Consequently, the number of observations in table 3 differs fromthe number in table 2.
Wage Determination and Insider Power in Bulgaria 13
observations are independent across clusters but not necessarily independent within clusters12. In
attempting to lessen or accommodate the influence of any outlying observations in the estimators, the
robust regression approach is taken.
One correct way to deal with a model in which observations are not independent within clusters (here
firms) is to estimate a random-effects model. Therefore, our principal results are obtained using the
Panel Data Estimation method. A one-way error component panel data model is given by:
withit it it i itctey u u= + + = ν + εitx β (1.9)
with , ...,i 1 N= denoting the cross-section dimension and , ...,t 1 T= denoting the time-series
dimension. iν is the unobservable unit-specific residual and itε is the ‘usual’ residual with usual
properties (mean 0, uncorrelated with itself, uncorrelated with x , uncorrelated with ν and
homoscedastic). The panel structure of the sample offers the opportunity to control for firm-specific
heterogeneity, which may capture various unobservables, such as the quality of capital and labour.
In the last part, we try to deal with two problems that have not been addressed so far. First,
simultaneity may obscure the true relationship between wages and the variables reflecting internal
conditions. Second, the level of employment entering both the definition of the wage and the measure
of rents per worker raises the standard problem that measurement error may induce spurious
correlation between these two key variables.
In general, there are two approaches to circumvent these problems: the recursive equation approach
and the instrumental variable approach. The reasoning behind the former is that if shocks to internal
factors were only passed on into higher wages after some time, the appropriate structure for estimation
would be to regress wages on lagged values of the proxies for internal factors. According to this view,
movements in previous internal conditions are treated as predetermined. The latter approach suggests
finding good instrumental variables and applying the Two-Stage Least Squares procedure. To check
the robustness of the results, this paper adopts the instrumental variable approach. Using the ordinary
Two-Stage Least Squares method, however, brings us back to the problem we faced when employing
pooled OLS, i.e. the panel structure of the data is completely ignored. In order to remove pay
differentials between firms which are not related to firm performance but to the character of the firm,
the First-differences Instrumental Variable Method suggested for dynamic fixed-effects models by
Anderson and Hsiao (1982) is used. Under the assumption that endogeneity is constant across years,
these results are expected to be in line with those obtained by the fixed-effects estimator.
12 As cluster() implies robust, the Huber/White estimator of variance is used instead of traditional calculation. The cluster-option hence affects the estimated standard errors and variance-covariance matrix of the estimators but not the estimated
Wage Determination and Insider Power in Bulgaria 14
2. Estimation Results
In this section, our main findings are presented. In the specifications taking up regional dummies, the
omitted regional intercept dummy variable is Sofia City. For reasons of brevity, the remaining regional
intercept dummies are not reported. The pooled OLS as well as the panel estimates consist of two
parts. In the first part, interaction-effects are ignored and the modified Right-To-Manage model
augmented with the variables capturing the fraction of shares held by private domestic and foreign
investors is estimated13. This part hence analyses to what extent the level of pay is related to
ownership status. The pooled OLS estimates do not allow for clear-cut conclusions concerning the
level of inside wages in private domestic-owned and foreign-owned companies. Once we control for
unobserved fixed effects, however, we do find evidence that private firms pay higher wages than state
firms. In accordance with the MNE-literature, we also find that foreign firms pay the highest wages.
In the second part, we test whether the ownership structure of the firm is a potential determinant of
insider power. In other words, we look not only at the direct effects of ownership changes but also at
the interactions with firm performance. The benchmark ownership type is state-owned firms. The
interactive coefficients on value added for private domestic and foreign firms are deviations from this
benchmark. An explanation of the variables used in the regression analysis is given in Appendix.
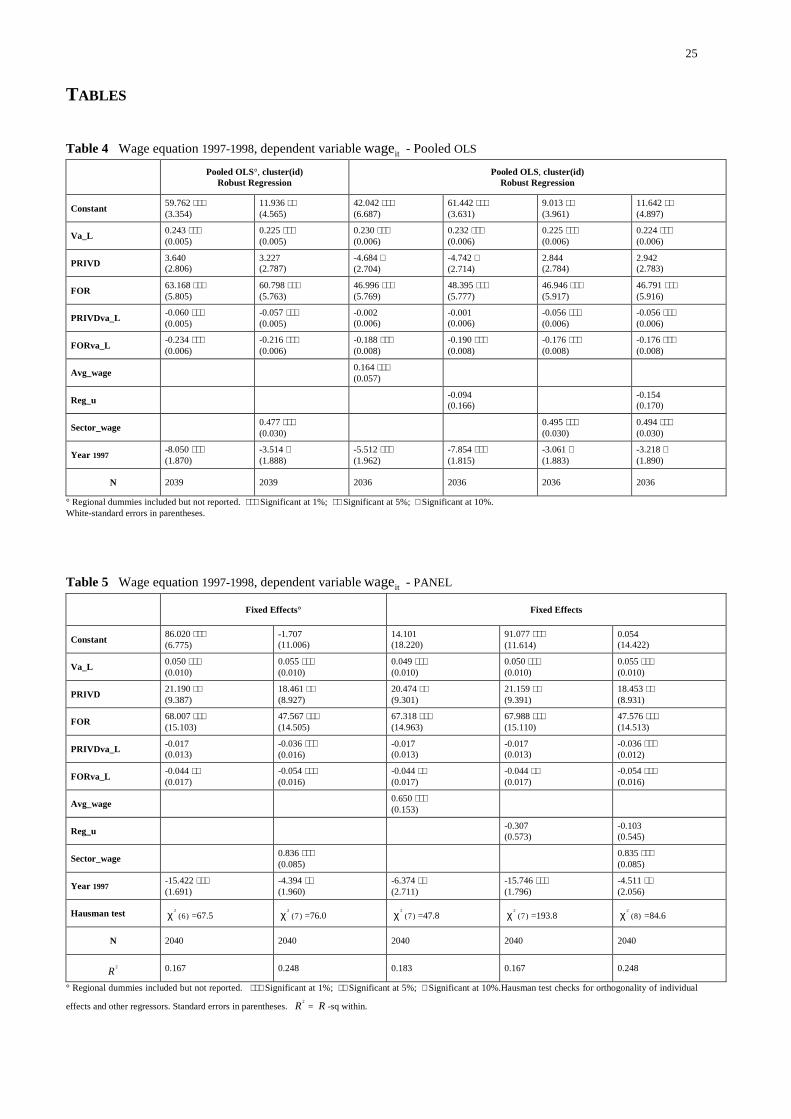
Pooled Ordinary Least Squares. Table 4 reports the pooled OLS estimation results. Focusing on the
question whether different ownership categories have a different impact on the insider power of
employees, the estimates indicate that workers in state-owned firms seem to appropriate a large part of
the rents (average point estimate of 0.230). On average, the employees’ capacity to capture
productivity gains is significantly lower in both private domestic and foreign firms. Since the value of
the share of rents taken by insiders for private domestic and foreign firms is obtained from the sum of
the benchmark (state) coefficient and the estimated coefficient, the coefficient on value added per
worker appears to be close to zero (0.033) in foreign firms whereas the average point estimate is about
0.172 in private domestic firms, the latter resulting in an elasticity at the mean of 0.61.
As expected, foreign firms pay significantly higher wages than state-owned companies. The results for
the wage level in private domestic firms, however, do not allow for clear-cut conclusions.
Finally, the estimates show that outside forces play an important role in the wage determination
process. The coefficients of all the variables capturing external conditions have the expected sign and
are -apart from the regional unemployment rate- highly significant. The cross-section elasticity of pay
with respect to region-average wages and sector-average wages amounts to 0.16 and 0.48 respectively.
In all specifications, the control variable for overall economic changes during the sample period has a
statistically significant negative impact on real wages. This effect is the result of the economic and
political crisis in which Bulgaria entered 1997. After a short and fragile burst of growth in 1994 and
coefficients.13 These results are not reported but are available upon request.
Wage Determination and Insider Power in Bulgaria 15
1995, the Bulgarian economy relapsed into deep recession in late 1996 with figures showing a real
growth rate of minus 11%, an annual inflation rate of 311% and currency depreciation hitting 3000%.
The lack of a consistent economic policy and the imitation of market economy measures are blamed
for the 1996-crisis. (OECD, 1998) In terms of economic performance as well as reform in general,
1997 was the year of the ‘second start’.
TABLE 4
Panel Data Estimation. The cross-section evidence shows strong effects from two potential sources of
rents onto wages, i.e. (some form of) ownership and value added. It can however be objected that such
evidence is unconvincing as the cross-section estimates are biased if omitted variables, of which the
unobserved quality of workers is probably an important one, are correlated with ownership and value
added. Since such unobserved fixed effects are likely to be positively correlated with private
ownership, we are implicitly controlling for one of the potential sources of endogeneity of ownership
by using the fixed-effects estimator. (Estrin et al., 2001) As mentioned above, we control for firm
heterogeneity for each individual firm, even within the different ownership categories. Hence, our
principal results are based on the panel data estimation method and are reported in table 5.
For a choice between the fixed-effects (within) estimator and the random-effects estimator, Hausman’s
(1978) test to test 0
: ( / ) 0i it
H E xν = is performed. For all specifications, the Hausman test reveals that
the subset of coefficients estimated by the fixed-effects estimator do differ statistically from the same
coefficients estimated by the random-effects estimator. Under the assumption that our model is
correctly specified, the observed differences must be due to the assumption of zero-correlation
between iν and itx . Therefore, we should base our interpretation on the fixed-effects model. Only the
results of the fixed-effects estimator are reported14.
With respect to rent sharing, we find again that employees in state-owned firms manage to cream off a
significantly larger share of the rents compared to workers in private companies. Foreign-owned firms
are in fact characterised by zero rent sharing. On average, the point estimate for state-owned firms is
0.052, which yields an elasticity of 0.11 at sample means. As the variable measuring the ratio of value
added to employment in state-owned companies has a mean value of 205.65 and a maximum value of
4910.18, the state value-added series on the microeconomic level is much more volatile than that of a
typical economic variable. As a result, an elasticity of 0.11 has very important consequences. The
standard deviation of value added per employee in state firms equals 389.48 and the range amounts to
5731.34. This large range is probably due to outlying observations. There is no generally accepted way
to parameterise the size of rent sharing in labour markets, but it is possible to calculate a version of
Lester’s (1952) ‘range’ of wages. Given the large variance of average value added, we assume that the
14 A critique to the use of within-group estimation is that the assumption of non-zero correlation between the time-invariantfixed effect and the exogenous variables does not allow for doing out-of sample inference. (Baltagi, 1995) Since we rely on alarge representative sample of manufacturing firms, however, we argue that this critique does not apply to our results.
Wage Determination and Insider Power in Bulgaria 16
width of the distribution can be thought of as two standard deviations. Under this assumption, the
regression estimates allow a tentative calculation of the spread of pay induced, other factors held
constant, solely by the dispersion of value added across firms. The ‘range’ of wages due to rent
sharing in state-owned firms is then approximately 42 percent of the mean wage15. In contrast, the
bargaining power of employees in foreign firms seems too weak to let them push up wages in response
to productivity gains. The average point estimate for foreign companies is 0.004, which results in a
very small elasticity between wages and rents (0.02). Although not always significant, private
domestic firms also seem to be characterised by less rent sharing.
Compared to the benchmark case, employees in both private domestic and foreign firms are paid
significantly higher wages with wages being the highest in foreign companies.
In general, labour market conditions appear to be important for wage bargaining. A doubling of the
region-average wage rate would push up real wages by 64 percent and a doubling of the sector-
average wage rate would increase real wages by 82 percent. Again, regional unemployment exerts a
downward pressure on wages but this effect is not accurately estimated.
TABLE 5
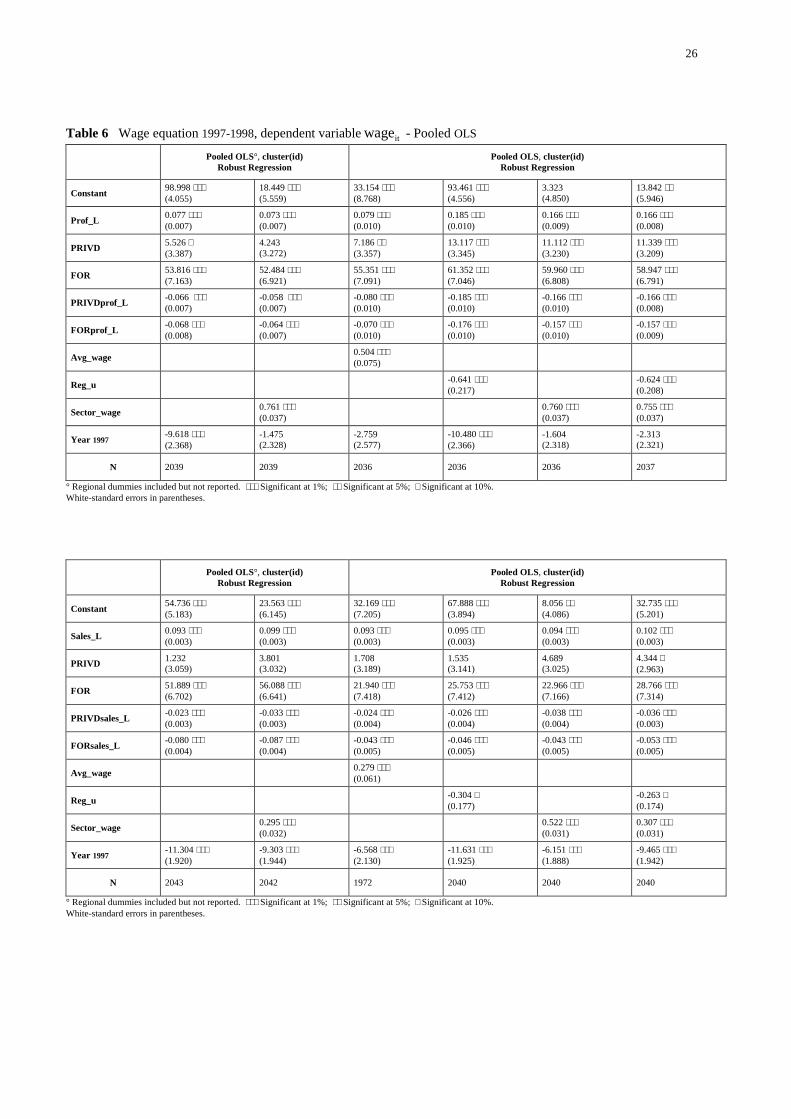
V. ROBUSTNESS CHECKS
To investigate whether our estimation results are robust to the use of different variables and estimation
techniques, two robustness checks are carried out. The first one is related to the measurement of
internal conditions and ownership status. Following the empirical literature, we estimate all
specifications using accounting profits per worker or sales per worker instead of value added per
worker. Next to it, we use a slightly different sample to investigate whether majority shareholding has
an effect on our earlier results. The second check refers to the estimation method: the robustness of the
fixed-effects estimator is checked by applying the first-differences instrumental variable approach.
1. Measurement Check
Internal Conditions. When value added per worker is substituted by profits per worker, the pooled
OLS estimates are well in line with the earlier results, i.e. rent sharing in private firms is considerably
lower than in state firms (see upper part of table 6). Strikingly, the degree of rent sharing is
significantly lower in all ownership categories compared to the estimates using value added per
worker. This finding is highly pronounced for private domestic companies: the average point estimate
drops from 0.172 (table 4) to 0.004 (table 6), resulting in an average elasticity of nearly zero. As a
15 This number emerges from sd(SOEva_L) 389.48
0.11 2 0.11 2mean(SOEva_L) 205.65
,∗ ∗ = ∗ ∗ with SOEva_L real average value added in state-
owned companies. Note that this calculation is a modified version of Lester’s range of feasible wages. He assumed that -under a normal distribution- the width of a distribution is equal to four standard deviations.
Wage Determination and Insider Power in Bulgaria 17
consequence, the bargaining power of insiders in domestically private-owned enterprises is too small
to let them raise wages in response to increases in profitability. The average point estimate for foreign
firms (0.009), which is slightly higher than the one for private domestic firms, also gives rise to a very
small elasticity between wages and profits (0.03). As mentioned above, the profit per worker variable
being negatively related to wages by construction may result in an underestimation of the rent-sharing
effect.
Whereas we initially could not reach a clear conclusion concerning the wage level in domestically
private-owned companies, the results using average profits indicate that employees in both private
domestic and foreign firms are paid significantly higher wages than those in state-owned firms.
Outside pressure plays an even more important role in the bargaining process. A doubling of the local
unemployment rate would according to the calculations depress real wages by about 10 percent.
Doubling region-specific or sector-specific wages would raise real wages by approximately 50 and 75
percent respectively. These elasticities are considerably higher than in our earlier results.
From the bottom part of table 6, it follows that the pooled OLS results with sales per worker
measuring the firm’s ability-to-pay also accord very well with those using value added per worker, be
it that the degree of rent sharing is again clearly lower. On average, the estimated coefficient capturing
rent sharing amounts to 0.10, 0.06 and 0.03 in state, private domestic and foreign companies
respectively.
Again, we find the empirical regularity that the level of foreign wages is significantly higher than the
level of pay in state-owned firms.
The variables capturing outside forces are also in the current setting highly significant: regional
unemployment affects wages negatively while both regional and sectoral wages exert an upward
pressure on the level of pay. The respective elasticities are -0.04, 0.28 and 0.37.
TABLE 6
Before interpreting the panel estimates, it should be mentioned that for all variants of the earlier
specifications, Hausman’s test always rejects the random-effects model.
The panel results with profits per worker as internal variable are presented in the upper part of table 7.
As before, rent sharing appears to be most prevalent in state firms. The responsiveness of real wages
with respect to profits per worker is clearly lower than their responsiveness with respect to value
added per worker: the average point estimate of 0.036 yields a profits-wages elasticity of 0.04
(compared to 0.11 using value added). Again, we can point to the direct endogeneity bias as a possible
explanation for the lower estimated rent-sharing effect. Remarkably, the coefficient on both private
domestic and foreign rents is found to be significantly negative and highest in absolute value for
foreign firms. This finding leads to the strong conclusion that an increase in profitability in private
Wage Determination and Insider Power in Bulgaria 18
companies results in lower wages. The conclusions concerning the level of inside wages and labour
market conditions equal those of the first panel estimates.
TABLE 7
The lower part of table 7 reports the panel estimates when sales per worker is substituted for value
added per worker. As before, wages in state-owned companies appear to be quite responsive to
changes in sales (average point estimate of 0.047). Surprisingly, the slope coefficients related to both
ownership categories appear to be insignificant, implying that we are unable to detect significant
differences with respect to rent sharing in state, private domestic or foreign firms.
In line with the first panel results, private companies pay significantly higher wages compared to the
benchmark case. The highest level of pay is still to be found in foreign firms. The estimates regarding
outside forces confirm the previous results.
Ownership Variable. As an additional measurement control, we check whether the results are
invariant to the choice of the sample. When substituting ownership dummies for the fraction of shares
held by the various ownership categories, we can firmly conclude that our main results remain robust
to restraining the analysis to majority ownership groups only16. For the pooled OLS results, the only
difference is that rent sharing appears to be even lower in foreign firms. The coefficient on value
added in foreign firms drops by 73%, i.e. from 0.033 to 0.009. The panel results are nearly unchanged.
2. Methodological Check
To correct for possible simultaneity between the internal variable and the wage and to allow for firm-
specific effects, the results of the first-differences instrumental variable procedure are reported in table
817. The various specifications take up the first differences of all variables, including the ownership
intercept and slope coefficients. As suggested by Arellano (1989), the instruments are taken in levels.
(Baltagi, 1995) More specifically, the 2-period and the 3-period lagged value of value added combined
with the 2-period and the 3-period lagged value of real average wages at the firm level are used as
instruments to solve for the least squares of the sample’s first moment conditions. The choice of the
lagged value of real average wages as additional instrument can be motivated by efficiency-wage
considerations. According to this channel, higher wages stimulate work effort and hence productivity.
From table 8, it follows that the findings of the fixed-effects model appear to be quite robust. In line
with the panel estimates, the results confirm the existence of crucial differences in insider effect across
different types of firms. Interestingly, the conclusion to be drawn from comparing the fixed-effects
estimates with the first-differences TSLS estimates is that the extent of rent sharing in state-owned
16 Instead of using continuous shareholding variables ranging between zero and one, we now replace them with dummies formajority ownership. These results, which are very well in line with the earlier findings, are available upon request.17 In addition to wiping out fixed-effects, differencing makes the variables stationary. In our setting, however, this is notlikely to be an important issue as the cross-section dimension greatly exceeds the time-series dimension.
Wage Determination and Insider Power in Bulgaria 19
companies is underestimated using an OLS technique. The first-differences TSLS approach points to
an average estimate of 0.080 for state firms, resulting in an elasticity at sample means of 0.17.
According to the panel results, the corresponding average point estimate is 0.052 and the
corresponding elasticity amounts to 0.11. Consistent with the panel estimates, in foreign firms the
bargaining strength of insiders seems to be too weak to let them push up wages in response to firm
performance. Even stronger, the coefficient on foreign rents is found to be significantly negative. In
the first-differences TSLS estimates, we find the same result for private domestic firms. In accordance
with the panel estimates, inside wages in private firms are higher than those in state firms.
TABLE 8
VI. INTERPRETATION
Before interpreting the results, we should bear in mind that the pooled OLS estimation method on the
one hand and the panel and first-differences procedures on the other hand can basically not be
compared. The use of the three different estimation procedures, however, leads to one striking result
that emerges from nearly all specifications: rent sharing is highly pronounced in state-owned firms
whereas both private domestic and foreign companies are characterised by considerably less rent
sharing. The results regarding state-owned and domestically private-owned firms are in line with those
of scarce existing empirical research for Poland (period 1992-1994) and Russia (1996-1997) in this
field. Both studies use ownership dummies to discriminate between state, privatised and
commercialised enterprises and find that the share of rents taken by workers in privatised companies is
significantly less than the share taken by state-owned employees. When focusing on the preferred
estimation method, which takes account of firm-specific effects, and when correcting for endogeneity,
we find in addition that the level of inside wages is on average higher in private firms compared to
state firms and that foreign enterprises pay the highest wages.
Within the bargaining framework, the findings for foreign-owned companies can be explained in two
ways. First, foreign firms appear to be characterised by a relatively high level of inside wages, which
prevents insiders from translating productivity gains into wage increases. Moreover, if one thinks
about a two-stage game in which the location decision of foreign firms occurs after firms and insiders
bargain over wages, the ‘threat of relocation’ possibility of foreign firms vis-à-vis the insiders
increases the bargaining position of foreign firms. If bargaining breaks down, the conflict payoff (or
outside option for the firm) is positive as foreign firms can relocate activity to other countries. Hence,
firm mobility curbs insider power. This leads to a low -in our case sometimes a reverse-
responsiveness of real wages to productivity gains, generating in turn lower wages in equilibrium.
(Zhao, 1995) A second possible explanation is that foreign firms are typified by ‘low’-wage
Wage Determination and Insider Power in Bulgaria 20
considerations, meaning that they resist letting wages increase in response to productivity
improvements.
Next to it, it can be said that wage determination in foreign firms is driven more by profitability
considerations than wage formation in state-owned firms. Given the economic and financial crisis in
1996, it is very reasonable to assume that during the considered timespan firms in Bulgarian regions
financed most of their investment from retained earnings. The statistically significant negative
coefficient on the interaction term related to foreign ownership in the first-differences TSLS estimates
may reflect that investment effort strongly dominates other objectives in foreign companies. Higher
investment spending in foreign firms could then be explained by more efficient corporate governance
and a probably different time horizon underlying economic decisions. Empirical research has already
found evidence of investment behaviour being related to form of ownership. (Grosfeld, Nivet, 1997)
Finally, the rejection of rent sharing in a non-standard competitive framework may be the result of a
clustering of foreign firms in sectors operating in a perfectly competitive market. To gain a first
insight into that issue, we divided the sample into 6 subsamples according to the 2-digit NACE
industry classification18. The underlying idea was to examine in which subsectors rent sharing is not
an issue and then to check the homogeneity/heterogeneity of firms according to ownership type within
these subsectors. The presence of predominantly foreign-owned firms in subsectors with perfectly
competitive elements would then explain our findings. A closer look at the data of the subsamples
leads to the following conclusions. First, the different ownership categories are evenly distributed
across subsectors. Within each subsector, on average 20-30% of the firms are majority state-owned,
65-80% are majority private domestic-owned and 3-10% are majority foreign-owned. Second, the
shareholding structure is quite similar within each subsector. The average fraction of shares held by
state owners is 32%, private domestic investors retain on average 64% of the shares and foreign
investors hold on average 4% of the shares. Third, within each subsector foreign investors are
concentrated in a few firms and hence own most of the time a majority stake. Based on this
information, we do not expect to see crucial differences in labour market performance across
subsectors. To test this hypothesis, we performed the regressions for each subsector separately. As
anticipated, the pooled OLS and the panel results do not point to significant differences in labour
market performance across subsectors.
The result that the strongest positive relationship between firm’s ability-to-pay and wages is found in
state-owned firms can partly be explained by the fact that insiders in these companies still play an
important role. This is however not a sufficient explanation as increased product market competition
18 Sectors with a small number of observations were dropped. To be specific, subsample 1 comprises firms from industry 15,subsample 2 from industry 17 and 18, subsample 3 from industry 24 and 26, subsample 4 from industry 27 and 28, subsample 5from industry 29 and 31 and subsample 6 from industry 36 respectively. Subsample 1 and 2 cover both 25% of the sample,subsample 3 and 4 both 12% and subsample 5 and 6 cover 19% and 7% respectively. In the aggregate, the 6 subsamples coverabout 80% of the original sample. In line with the original sample, 21% of the firms are majority state-owned, 74% majoritydomestically private-owned and 5% majority foreign-owned.
Wage Determination and Insider Power in Bulgaria 21
(resulting for example from higher FDI) may prevent insiders from exploiting their power on the
bargaining table. In this context, further research aims at analysing the impact of competitive pressure
on labour market performance by introducing explicitly measures of market concentration and import
penetration into the analysis. The motivation is that competitive pressure may result in disciplining
firm behaviour and that the effect may depend on the ownership type of the firm. Empirical research
has already found evidence of the existence of complementarities between competitive pressure and
ownership changes in the Bulgarian product market. (Estrin et al., 2001)
The economic chaos following the 1996-crisis and the coefficient of the regional unemployment rate
showing the expected sign but being insignificant (in contrast to the other variables capturing outside
forces) brings us to another, rather tentative, explanation. More specifically, a second interpretation
rests on the wage-unemployment ratchet effect, introduced by Lindbeck and Snower (1987). The
underlying idea is that after an adverse shock to which firms reacted by reducing employment, the
probability for each employee of being laid off decreases and the incumbent workforce with important
bargaining power responds by pushing for higher wages. Based on our evidence, it seems that in the
aftermath of the 1996-crisis, this effect was really pronounced in state-owned firms.
From a policy point of view, the results tentatively suggest that FDI should be promoted. This policy
implication is based on the high inside wages and the high investment efforts, stimulating job creation,
in foreign firms.
Finally, a caveat to our results is the possibility of residual selection bias. It could be that some
categories of owners were able to obtain shares in better firms, in ways which are unobservable to the
researcher but possibly observable to the buyers. This problem arises in all studies of privatisation and
firm performance. In our analysis, we argue that the fixed-effects estimator controls for ownership
endogeneity. This is valid if the unobservable quality is fixed for each firm. The effect may be
dynamic, however, if for example the unobservable quality relates to potential for restructuring and
improvements in productivity rather than being intertemporally fixed. We control implicitly for this
dynamic effect by using the first-differences TSLS method. Nevertheless, the possibility of selection
bias should be borne in mind in interpreting our findings.
VII. CONCLUSION
This paper focuses on wage determination in Bulgaria. Wage equations derived from a slightly
modified Right-To-Manage model are estimated using a unique firm level data set covering all
medium and large sized manufacturing firms from the 28 regions of Bulgaria during the period 1997-
1998. Starting from the simplest method to analyse cross-section time-series data, we apply alternative
panel procedures, exploiting the rich panel structure of the data as well as controlling for the
Wage Determination and Insider Power in Bulgaria 22
endogeneity bias. The central question investigated is whether and how wage determination is related
to ownership status. The broad conclusion to be drawn from this paper is that the wage formation
process is clearly related to form of ownership: there are statistically significant differences in the
share of surplus taken by employees in state, private domestic and foreign companies. When taking
account of firm heterogeneity, it is found that rent sharing is nearly non-existent in foreign-owned
firms while the level of pay is higher compared to the benchmark, state-owned firms. Rent sharing
appears to be highly pronounced in state-owned firms and rent sharing is on average considerably
lower in domestically private-owned firms. Private domestic firms also pay higher wages than state
firms but the highest level of inside wages is to be found in foreign firms. From a policy point of view,
the results might be interpreted as promoting FDI in terms of wage discipline and job creation.
REFERENCES
Abowd J.A. and Lemieux T., 1993, “The Effects of Product Market Competition on Collective Bargaining
Agreements : The Case of Foreign Competition in Canada”, in : The Quarterly Journal of Economics, Vol.
108(4), 983-1014.
Anderson T.W. and Hsiao C., 1982, “Formulation and Estimation of Dynamic Models using Panel Data”, in :
Journal of Econometrics, Vol. 18, 47-82.
Azariadis S., 1975, “Implicit Contracts and Underemployment Equilibria”, in : Journal of Political Economy,
Vol. 83, 1183-1202.
Baily M.N., 1974, “Wages and Employment under Uncertain Demand”, in : Review of Economic Studies, Vol.
41, 37-50.
Baltagi B.H., 1995, Econometric Analysis of Panel Data, John Wiley & Sons, Chichester.
Blanchflower D.G., Oswald A.J. and Garrett M.D., 1989, “Insider Power and Wage Determination”, NBER
Working Paper 3179, National Bureau for Economic Research, Cambridge.
Blanchflower D.G., Oswald A.J. and Sanfey P., 1992, “Wages, Profits and Rent-sharing”, NBER Working Paper
4222, National Bureau for Economic Research, Cambridge.
Blanchflower D.G., Oswald A.J. and Sanfey P., 1996, “Wages, Profits and Rent-sharing”, in : The Quarterly
Journal of Economics, 227-250.
Booth A., 1995, The Economics of the Trade Union, Chapter 4-5, Cambridge University Press, Cambridge.
Budd J.W. and Slaughter M.J., 2000, “Are Profits Shared across Borders ? Evidence on International Rent
Sharing”, NBER Working Paper 4222, National Bureau for Economic Research, Cambridge.
Carneiro F.G., 1997, “Productivity Effects in Brazilian Wage Determination”, in : World Development, Vol.
26(1), 139-153.
Christofides L.N. and Oswald A.J., 1992, “Real Wage Determination and Rent-sharing in Collective Bargaining
Agreements”, in : Quarterly Journal of Economics, Vol. 107(3), 985-1002.
Currie J. and McConnell S., 1992, “Firm-specific Determinants of the Real Wage”, in : The Review of
Economics and Statistics, Vol. 74(2), 297-304.
Wage Determination and Insider Power in Bulgaria 23
Djankov S. and Hoekman B., 1998, “Avenues of Technology Transfer: Foreign Investment and Productivity
Change in the Czech Republic”, CEPR Discussion Paper 1883, Centre for Economic Policy Research,
London.
EBRD, 2000, Transition Report 2000, European Bank for Reconstruction and Development, London.
Estrin S., Konings, J., Zolkiewski Z. and Angelucci M., 2001, “The Effect of Ownership and Competitive
Pressure on Firm Performance in Transition Countries: Micro Evidence from Bulgaria, Romania and
Poland”, LICOS Discussion Paper 104/2001, LICOS Centre for Transition Economics, Catholic University
of Leuven.
Goos M. and Konings J., 2001, “Does Rent-Sharing Exist in Belgium? An Empirical Analysis Using Firm Level
Data”, in : Reflets et Perspectives de la vie économique, XL, N°1-2, 65-79.
Grosfeld I. and Nivet J-F., 1997, “Wage and Investment Behaviour in Transition : Evidence from a Polish Panel
Data Set”, CEPR Discussion Paper 1726, Centre for Economic Policy Research, London.
Grosfeld I. and Nivet J-F., 1999, “Insider Power and Wage Setting in Transition : Evidence from a Panel of
Large Polish Firms, 1988-1994”, in : European Economic Review, Vol. 43, 1137-1147.
Hildreth A. and Oswald A., 1994, “Rent-sharing and Wages : Evidence from Company and Establishment
Panels”, University of Essex Discussion Paper 425, Essex.
Konings J. and Walsh P., 1994, “Evidence of Efficiency Wage Payments in UK Firm Level Panel Data”, in :
Economic Journal, Vol. 104, 542-555.
Layard R. and Nickell S., 1990, “Is Unemployment Lower if Unions Bargain over Employment?”, in : Quarterly
Journal of Economics, Vol. 105(3), 773-787.
Lester R.A., 1952, “A Range Theory of Wage Differentials”, in : Industrial and Labor Relations Review, Vol. 5,
483-500.
Lever M.H.C. and Marquering W.A., 1996, “Union Coverage and Sectoral Wages : Evidence from the
Netherlands”, in : Empirical Economics, Vol. 21(4), 483-499.
Lindbeck A. and Snower D.J., 1987, “Union Activity, Unemployment Persistence and Wage-Employment
Ratchets”, in : European Economic Review, Vol. 31, 157-167.
Luke P.J. and Schaffer M.E., 1999, “Wage Determination in Russia : An Econometric Investigation”, CERT
Discussion Paper 99/08, Centre for Economic Reform and Transformation, Edinburgh.
McDonald I.M. and Solow R.M., 1981, “Wage Bargaining and Employment”, in : American Economic Review,
Vol. 81, 896-908.
Nickell S. and Andrews M., 1983, “Unions, Real Wages and Employment in Britain 1951-79”, Oxford
Economic Papers, 183-205, Oxford.
Nickell S. and Kong P., 1992, “An Investigation into the Power of Insiders in Wage Determination”, in :
European Economic Review, Vol. 36, 1573-1599.
Nickell S. and Wadhwani S., 1990, “Insider Forces and Wage Determination”, in : The Economic Journal, Vol.
100, 496-509.
NSI, 1998, Statistical Yearbook 1998, National Statistical Institute, Sofia.
NSI, 1999, Statistical Yearbook 1999, National Statistical Institute, Sofia.
OECD, 1998, Labour Market and Social Policy in Bulgaria, Seminar held in Sofia on March 5 1998,
Organisation for Economic Cooperation and Development.
Slichter S., 1950, “Notes on the Structure of Wages”, in : Review of Economics and Statistics, Vol. 32, 80-91.
Wage Determination and Insider Power in Bulgaria 24
Teal F., 1996, “The Size and Sources of Economic Rents in a Developing Country Manufacturing Labour
Market”, in : The Economic Journal, Vol. 106(437), 963-976.
Teulings C. and Hartog J., 1998, Corporatism or Competition ? Labour Contracts , Institutions and Wage
Structures in International Comparison, Chapter 4-5, Cambridge University Press, Cambridge.
UNDP, 1999, National Human Development Report Bulgaria 1999, Volume I-II, United Nations Development
Program.
UNDP, 2000, Bulgaria 2000 Human Development Report, The Municipal Mosaic, United Nations Development
Program.
Van Reenen J., 1996, “The Creation and Capture of Rents : Wages and Innovation in a Panel of UK
Companies”, in : Quarterly Journal of Economics, Vol. 107(3), 985-1002.
Zhao L., 1995, “Cross-hauling Direct Foreign Investment and Unionised Oligopoly”, in : European Economic
Review, Vol. 39, 1237-1253.
25
TABLES
Table 4 Wage equation 1997-1998, dependent variable itwage - Pooled OLS
Pooled OLS°, cluster(id)Robust Regression
Pooled OLS, cluster(id)Robust Regression
Constant 59.762 ∗∗∗(3.354)
11.936 ∗∗(4.565)
42.042 ∗∗∗(6.687)
61.442 ∗∗∗(3.631)
9.013 ∗∗(3.961)
11.642 ∗∗(4.897)
Va_L 0.243 ∗∗∗(0.005)
0.225 ∗∗∗(0.005)
0.230 ∗∗∗(0.006)
0.232 ∗∗∗(0.006)
0.225 ∗∗∗(0.006)
0.224 ∗∗∗(0.006)
PRIVD 3.640(2.806)
3.227(2.787)
-4.684 ∗(2.704)
-4.742 ∗(2.714)
2.844(2.784)
2.942(2.783)
FOR 63.168 ∗∗∗(5.805)
60.798 ∗∗∗(5.763)
46.996 ∗∗∗(5.769)
48.395 ∗∗∗(5.777)
46.946 ∗∗∗(5.917)
46.791 ∗∗∗(5.916)
PRIVDva_L -0.060 ∗∗∗(0.005)
-0.057 ∗∗∗(0.005)
-0.002(0.006)
-0.001(0.006)
-0.056 ∗∗∗(0.006)
-0.056 ∗∗∗(0.006)
FORva_L -0.234 ∗∗∗(0.006)
-0.216 ∗∗∗(0.006)
-0.188 ∗∗∗(0.008)
-0.190 ∗∗∗(0.008)
-0.176 ∗∗∗(0.008)
-0.176 ∗∗∗(0.008)
Avg_wage 0.164 ∗∗∗(0.057)
Reg_u -0.094(0.166)
-0.154(0.170)
Sector_wage 0.477 ∗∗∗(0.030)
0.495 ∗∗∗(0.030)
0.494 ∗∗∗(0.030)
Year 1997-8.050 ∗∗∗(1.870)
-3.514 ∗(1.888)
-5.512 ∗∗∗(1.962)
-7.854 ∗∗∗(1.815)
-3.061 ∗(1.883)
-3.218 ∗(1.890)
N 2039 2039 2036 2036 2036 2036
° Regional dummies included but not reported. ∗∗∗ Significant at 1%; ∗∗ Significant at 5%; ∗ Significant at 10%.White-standard errors in parentheses.
Table 5 Wage equation 1997-1998, dependent variable itwage - PANEL
Fixed Effects° Fixed Effects
Constant 86.020 ∗∗∗(6.775)
-1.707(11.006)
14.101(18.220)
91.077 ∗∗∗(11.614)
0.054(14.422)
Va_L 0.050 ∗∗∗(0.010)
0.055 ∗∗∗(0.010)
0.049 ∗∗∗(0.010)
0.050 ∗∗∗(0.010)
0.055 ∗∗∗(0.010)
PRIVD 21.190 ∗∗(9.387)
18.461 ∗∗(8.927)
20.474 ∗∗(9.301)
21.159 ∗∗(9.391)
18.453 ∗∗(8.931)
FOR 68.007 ∗∗∗(15.103)
47.567 ∗∗∗(14.505)
67.318 ∗∗∗(14.963)
67.988 ∗∗∗(15.110)
47.576 ∗∗∗(14.513)
PRIVDva_L -0.017(0.013)
-0.036 ∗∗∗(0.016)
-0.017(0.013)
-0.017(0.013)
-0.036 ∗∗∗(0.012)
FORva_L -0.044 ∗∗(0.017)
-0.054 ∗∗∗(0.016)
-0.044 ∗∗(0.017)
-0.044 ∗∗(0.017)
-0.054 ∗∗∗(0.016)
Avg_wage 0.650 ∗∗∗(0.153)
Reg_u -0.307(0.573)
-0.103(0.545)
Sector_wage 0.836 ∗∗∗(0.085)
0.835 ∗∗∗(0.085)
Year 1997-15.422 ∗∗∗(1.691)
-4.394 ∗∗(1.960)
-6.374 ∗∗(2.711)
-15.746 ∗∗∗(1.796)
-4.511 ∗∗(2.056)
Hausman test 2(6)χ =67.5
2(7)χ =76.0
2(7)χ =47.8
2(7)χ =193.8
2(8)χ =84.6
N 2040 2040 2040 2040 2040
2R 0.167 0.248 0.183 0.167 0.248
° Regional dummies included but not reported. ∗∗∗ Significant at 1%; ∗∗ Significant at 5%; ∗ Significant at 10%.Hausman test checks for orthogonality of individual
effects and other regressors. Standard errors in parentheses. 2R = R -sq within.
26
Table 6 Wage equation 1997-1998, dependent variable itwage - Pooled OLS
Pooled OLS°, cluster(id)Robust Regression
Pooled OLS, cluster(id)Robust Regression
Constant 98.998 ∗∗∗(4.055)
18.449 ∗∗∗(5.559)
33.154 ∗∗∗(8.768)
93.461 ∗∗∗(4.556)
3.323(4.850)
13.842 ∗∗(5.946)
Prof_L 0.077 ∗∗∗(0.007)
0.073 ∗∗∗(0.007)
0.079 ∗∗∗(0.010)
0.185 ∗∗∗(0.010)
0.166 ∗∗∗(0.009)
0.166 ∗∗∗(0.008)
PRIVD 5.526 ∗(3.387)
4.243(3.272)
7.186 ∗∗(3.357)
13.117 ∗∗∗(3.345)
11.112 ∗∗∗(3.230)
11.339 ∗∗∗(3.209)
FOR 53.816 ∗∗∗(7.163)
52.484 ∗∗∗(6.921)
55.351 ∗∗∗(7.091)
61.352 ∗∗∗(7.046)
59.960 ∗∗∗(6.808)
58.947 ∗∗∗(6.791)
PRIVDprof_L -0.066 ∗∗∗(0.007)
-0.058 ∗∗∗(0.007)
-0.080 ∗∗∗(0.010)
-0.185 ∗∗∗(0.010)
-0.166 ∗∗∗(0.010)
-0.166 ∗∗∗(0.008)
FORprof_L -0.068 ∗∗∗(0.008)
-0.064 ∗∗∗(0.007)
-0.070 ∗∗∗(0.010)
-0.176 ∗∗∗(0.010)
-0.157 ∗∗∗(0.010)
-0.157 ∗∗∗(0.009)
Avg_wage 0.504 ∗∗∗(0.075)
Reg_u -0.641 ∗∗∗(0.217)
-0.624 ∗∗∗(0.208)
Sector_wage 0.761 ∗∗∗(0.037)
0.760 ∗∗∗(0.037)
0.755 ∗∗∗(0.037)
Year 1997-9.618 ∗∗∗(2.368)
-1.475(2.328)
-2.759(2.577)
-10.480 ∗∗∗(2.366)
-1.604(2.318)
-2.313(2.321)
N 2039 2039 2036 2036 2036 2037
° Regional dummies included but not reported. ∗∗∗ Significant at 1%; ∗∗ Significant at 5%; ∗ Significant at 10%.White-standard errors in parentheses.
Pooled OLS°, cluster(id)Robust Regression
Pooled OLS, cluster(id)Robust Regression
Constant 54.736 ∗∗∗(5.183)
23.563 ∗∗∗(6.145)
32.169 ∗∗∗(7.205)
67.888 ∗∗∗(3.894)
8.056 ∗∗(4.086)
32.735 ∗∗∗(5.201)
Sales_L 0.093 ∗∗∗(0.003)
0.099 ∗∗∗(0.003)
0.093 ∗∗∗(0.003)
0.095 ∗∗∗(0.003)
0.094 ∗∗∗(0.003)
0.102 ∗∗∗(0.003)
PRIVD 1.232(3.059)
3.801(3.032)
1.708(3.189)
1.535(3.141)
4.689(3.025)
4.344 ∗(2.963)
FOR 51.889 ∗∗∗(6.702)
56.088 ∗∗∗(6.641)
21.940 ∗∗∗(7.418)
25.753 ∗∗∗(7.412)
22.966 ∗∗∗(7.166)
28.766 ∗∗∗(7.314)
PRIVDsales_L -0.023 ∗∗∗(0.003)
-0.033 ∗∗∗(0.003)
-0.024 ∗∗∗(0.004)
-0.026 ∗∗∗(0.004)
-0.038 ∗∗∗(0.004)
-0.036 ∗∗∗(0.003)
FORsales_L -0.080 ∗∗∗(0.004)
-0.087 ∗∗∗(0.004)
-0.043 ∗∗∗(0.005)
-0.046 ∗∗∗(0.005)
-0.043 ∗∗∗(0.005)
-0.053 ∗∗∗(0.005)
Avg_wage 0.279 ∗∗∗(0.061)
Reg_u -0.304 ∗(0.177)
-0.263 ∗(0.174)
Sector_wage 0.295 ∗∗∗(0.032)
0.522 ∗∗∗(0.031)
0.307 ∗∗∗(0.031)
Year 1997-11.304 ∗∗∗(1.920)
-9.303 ∗∗∗(1.944)
-6.568 ∗∗∗(2.130)
-11.631 ∗∗∗(1.925)
-6.151 ∗∗∗(1.888)
-9.465 ∗∗∗(1.942)
N 2043 2042 1972 2040 2040 2040
° Regional dummies included but not reported. ∗∗∗ Significant at 1%; ∗∗ Significant at 5%; ∗ Significant at 10%.White-standard errors in parentheses.
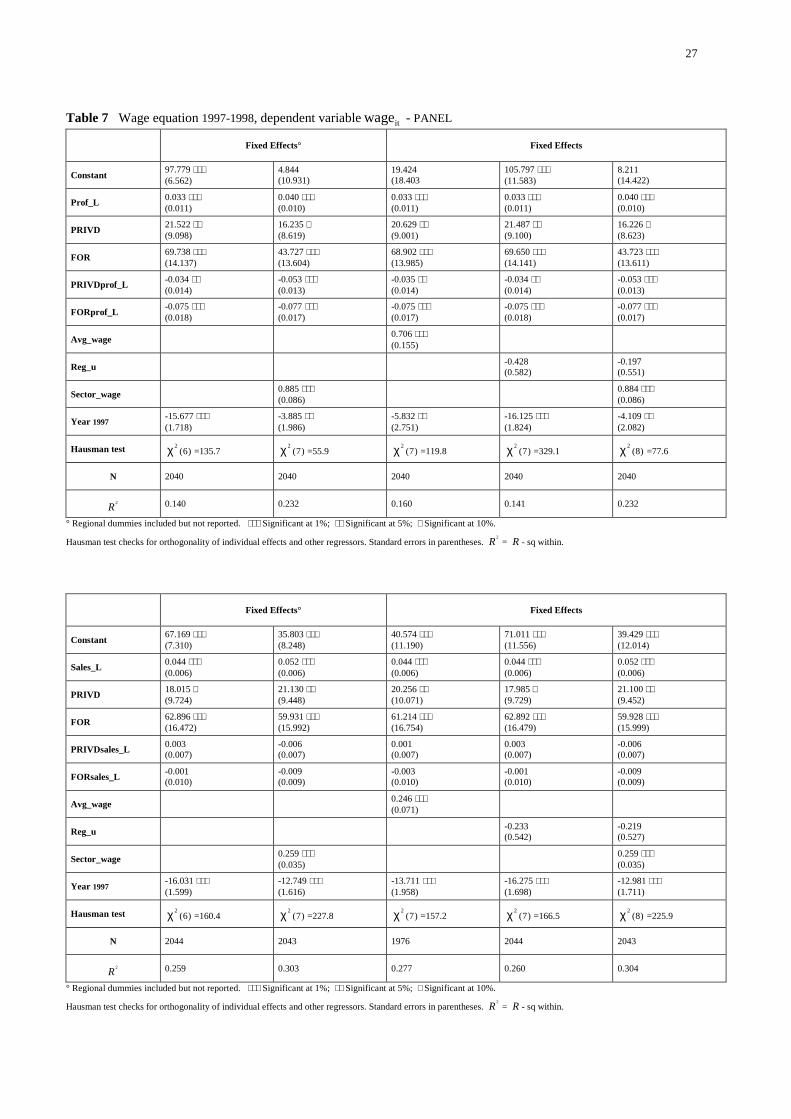
27
Table 7 Wage equation 1997-1998, dependent variable itwage - PANEL
Fixed Effects° Fixed Effects
Constant 97.779 ∗∗∗(6.562)
4.844(10.931)
19.424(18.403
105.797 ∗∗∗(11.583)
8.211(14.422)
Prof_L 0.033 ∗∗∗(0.011)
0.040 ∗∗∗(0.010)
0.033 ∗∗∗(0.011)
0.033 ∗∗∗(0.011)
0.040 ∗∗∗(0.010)
PRIVD 21.522 ∗∗(9.098)
16.235 ∗(8.619)
20.629 ∗∗(9.001)
21.487 ∗∗(9.100)
16.226 ∗(8.623)
FOR 69.738 ∗∗∗(14.137)
43.727 ∗∗∗(13.604)
68.902 ∗∗∗(13.985)
69.650 ∗∗∗(14.141)
43.723 ∗∗∗(13.611)
PRIVDprof_L -0.034 ∗∗(0.014)
-0.053 ∗∗∗(0.013)
-0.035 ∗∗(0.014)
-0.034 ∗∗(0.014)
-0.053 ∗∗∗(0.013)
FORprof_L -0.075 ∗∗∗(0.018)
-0.077 ∗∗∗(0.017)
-0.075 ∗∗∗(0.017)
-0.075 ∗∗∗(0.018)
-0.077 ∗∗∗(0.017)
Avg_wage 0.706 ∗∗∗(0.155)
Reg_u -0.428(0.582)
-0.197(0.551)
Sector_wage 0.885 ∗∗∗(0.086)
0.884 ∗∗∗(0.086)
Year 1997-15.677 ∗∗∗(1.718)
-3.885 ∗∗(1.986)
-5.832 ∗∗(2.751)
-16.125 ∗∗∗(1.824)
-4.109 ∗∗(2.082)
Hausman test 2(6)χ =135.7
2(7)χ =55.9
2(7)χ =119.8
2(7)χ =329.1
2(8)χ =77.6
N 2040 2040 2040 2040 2040
2R 0.140 0.232 0.160 0.141 0.232
° Regional dummies included but not reported. ∗∗∗ Significant at 1%; ∗∗ Significant at 5%; ∗ Significant at 10%.
Hausman test checks for orthogonality of individual effects and other regressors. Standard errors in parentheses. 2R = R - sq within.
Fixed Effects° Fixed Effects
Constant 67.169 ∗∗∗(7.310)
35.803 ∗∗∗(8.248)
40.574 ∗∗∗(11.190)
71.011 ∗∗∗(11.556)
39.429 ∗∗∗(12.014)
Sales_L 0.044 ∗∗∗(0.006)
0.052 ∗∗∗(0.006)
0.044 ∗∗∗(0.006)
0.044 ∗∗∗(0.006)
0.052 ∗∗∗(0.006)
PRIVD 18.015 ∗(9.724)
21.130 ∗∗(9.448)
20.256 ∗∗(10.071)
17.985 ∗(9.729)
21.100 ∗∗(9.452)
FOR 62.896 ∗∗∗(16.472)
59.931 ∗∗∗(15.992)
61.214 ∗∗∗(16.754)
62.892 ∗∗∗(16.479)
59.928 ∗∗∗(15.999)
PRIVDsales_L 0.003(0.007)
-0.006(0.007)
0.001(0.007)
0.003(0.007)
-0.006(0.007)
FORsales_L -0.001(0.010)
-0.009(0.009)
-0.003(0.010)
-0.001(0.010)
-0.009(0.009)
Avg_wage 0.246 ∗∗∗(0.071)
Reg_u -0.233(0.542)
-0.219(0.527)
Sector_wage 0.259 ∗∗∗(0.035)
0.259 ∗∗∗(0.035)
Year 1997-16.031 ∗∗∗(1.599)
-12.749 ∗∗∗(1.616)
-13.711 ∗∗∗(1.958)
-16.275 ∗∗∗(1.698)
-12.981 ∗∗∗(1.711)
Hausman test 2(6)χ =160.4
2(7)χ =227.8
2(7)χ =157.2
2(7)χ =166.5
2(8)χ =225.9
N 2044 2043 1976 2044 2043
2R 0.259 0.303 0.277 0.260 0.304
° Regional dummies included but not reported. ∗∗∗ Significant at 1%; ∗∗ Significant at 5%; ∗ Significant at 10%.
Hausman test checks for orthogonality of individual effects and other regressors. Standard errors in parentheses. 2R = R - sq within.
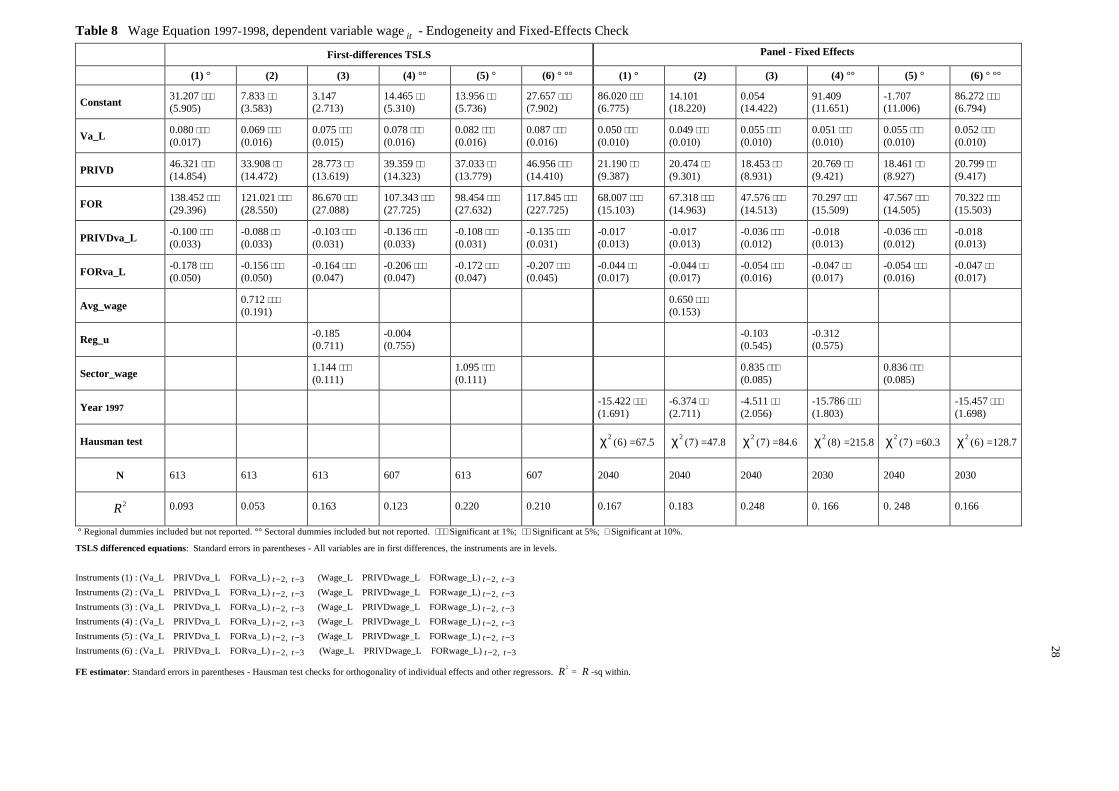
Table 8 Wage Equation 1997-1998, dependent variable wage it - Endogeneity and Fixed-Effects Check
First-differences TSLS Panel - Fixed Effects
(1) ° (2) (3) (4) °° (5) ° (6) ° °° (1) ° (2) (3) (4) °° (5) ° (6) ° °°
Constant 31.207 ∗∗∗(5.905)
7.833 ∗∗(3.583)
3.147(2.713)
14.465 ∗∗(5.310)
13.956 ∗∗(5.736)
27.657 ∗∗∗(7.902)
86.020 ∗∗∗(6.775)
14.101(18.220)
0.054(14.422)
91.409(11.651)
-1.707(11.006)
86.272 ∗∗∗(6.794)
Va_L 0.080 ∗∗∗(0.017)
0.069 ∗∗∗(0.016)
0.075 ∗∗∗(0.015)
0.078 ∗∗∗(0.016)
0.082 ∗∗∗(0.016)
0.087 ∗∗∗(0.016)
0.050 ∗∗∗(0.010)
0.049 ∗∗∗(0.010)
0.055 ∗∗∗(0.010)
0.051 ∗∗∗(0.010)
0.055 ∗∗∗(0.010)
0.052 ∗∗∗(0.010)
PRIVD 46.321 ∗∗∗(14.854)
33.908 ∗∗(14.472)
28.773 ∗∗(13.619)
39.359 ∗∗(14.323)
37.033 ∗∗(13.779)
46.956 ∗∗∗(14.410)
21.190 ∗∗(9.387)
20.474 ∗∗(9.301)
18.453 ∗∗(8.931)
20.769 ∗∗(9.421)
18.461 ∗∗(8.927)
20.799 ∗∗(9.417)
FOR 138.452 ∗∗∗(29.396)
121.021 ∗∗∗(28.550)
86.670 ∗∗∗(27.088)
107.343 ∗∗∗(27.725)
98.454 ∗∗∗(27.632)
117.845 ∗∗∗(227.725)
68.007 ∗∗∗(15.103)
67.318 ∗∗∗(14.963)
47.576 ∗∗∗(14.513)
70.297 ∗∗∗(15.509)
47.567 ∗∗∗(14.505)
70.322 ∗∗∗(15.503)
PRIVDva_L -0.100 ∗∗∗(0.033)
-0.088 ∗∗(0.033)
-0.103 ∗∗∗(0.031)
-0.136 ∗∗∗(0.033)
-0.108 ∗∗∗(0.031)
-0.135 ∗∗∗(0.031)
-0.017(0.013)
-0.017(0.013)
-0.036 ∗∗∗(0.012)
-0.018(0.013)
-0.036 ∗∗∗(0.012)
-0.018(0.013)
FORva_L -0.178 ∗∗∗(0.050)
-0.156 ∗∗∗(0.050)
-0.164 ∗∗∗(0.047)
-0.206 ∗∗∗(0.047)
-0.172 ∗∗∗(0.047)
-0.207 ∗∗∗(0.045)
-0.044 ∗∗(0.017)
-0.044 ∗∗(0.017)
-0.054 ∗∗∗(0.016)
-0.047 ∗∗(0.017)
-0.054 ∗∗∗(0.016)
-0.047 ∗∗(0.017)
Avg_wage 0.712 ∗∗∗(0.191)
0.650 ∗∗∗(0.153)
Reg_u -0.185(0.711)
-0.004(0.755)
-0.103(0.545)
-0.312(0.575)
Sector_wage 1.144 ∗∗∗(0.111)
1.095 ∗∗∗(0.111)
0.835 ∗∗∗(0.085)
0.836 ∗∗∗(0.085)
Year 1997-15.422 ∗∗∗(1.691)
-6.374 ∗∗(2.711)
-4.511 ∗∗(2.056)
-15.786 ∗∗∗(1.803)
-15.457 ∗∗∗(1.698)
Hausman test 2 (6)χ =67.5 2 (7)χ =47.8 2 (7)χ =84.6 2 (8)χ =215.8 2 (7)χ =60.3 2 (6)χ =128.7
N 613 613 613 607 613 607 2040 2040 2040 2030 2040 2030
2R 0.093 0.053 0.163 0.123 0.220 0.210 0.167 0.183 0.248 0. 166 0. 248 0.166
° Regional dummies included but not reported. °° Sectoral dummies included but not reported. ∗∗∗ Significant at 1%; ∗∗ Significant at 5%; ∗ Significant at 10%.
TSLS differenced equations: Standard errors in parentheses - All variables are in first differences, the instruments are in levels.
Instruments (1) : (Va_L PRIVDva_L FORva_L) 2, 3t t− − (Wage_L PRIVDwage_L FORwage_L) 2, 3t t− −Instruments (2) : (Va_L PRIVDva_L FORva_L) 2, 3t t− − (Wage_L PRIVDwage_L FORwage_L) 2, 3t t− −Instruments (3) : (Va_L PRIVDva_L FORva_L) 2, 3t t− − (Wage_L PRIVDwage_L FORwage_L) 2, 3t t− −Instruments (4) : (Va_L PRIVDva_L FORva_L) 2, 3t t− − (Wage_L PRIVDwage_L FORwage_L) 2, 3t t− −Instruments (5) : (Va_L PRIVDva_L FORva_L) 2, 3t t− − (Wage_L PRIVDwage_L FORwage_L) 2, 3t t− −Instruments (6) : (Va_L PRIVDva_L FORva_L) 2, 3t t− − (Wage_L PRIVDwage_L FORwage_L) 2, 3t t− −
FE estimator: Standard errors in parentheses - Hausman test checks for orthogonality of individual effects and other regressors. 2R = R -sq within.
28
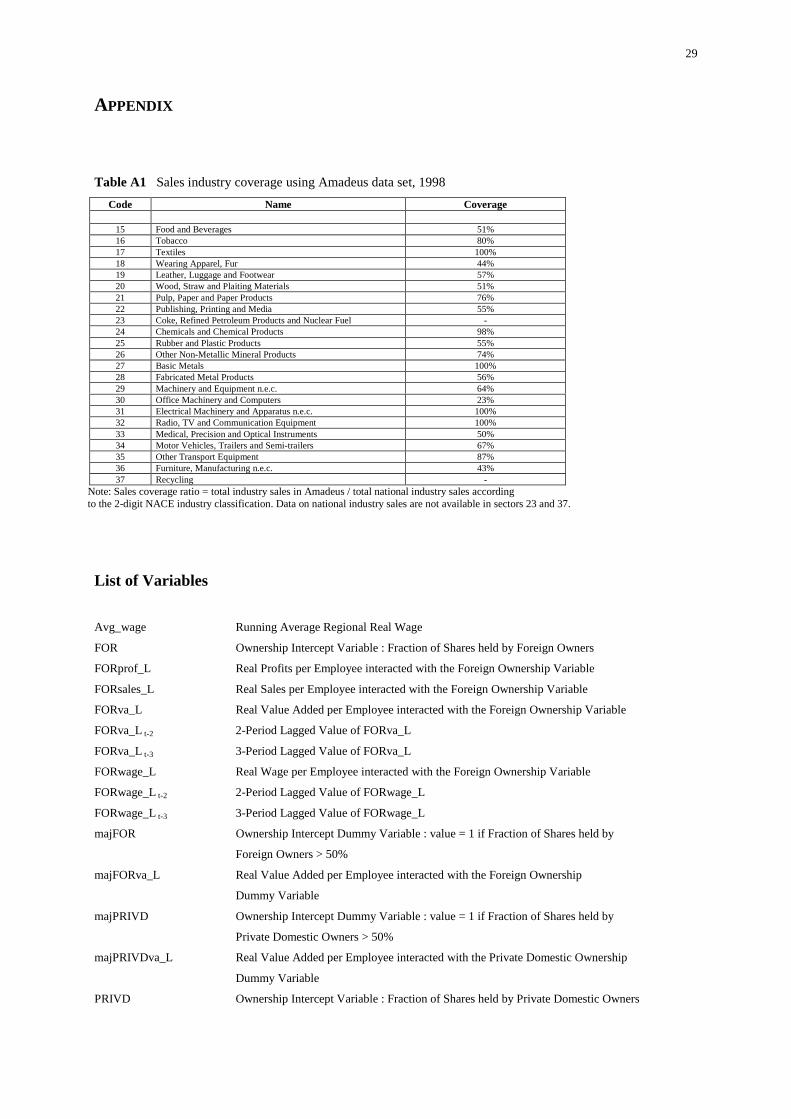
29
APPENDIX
Table A1 Sales industry coverage using Amadeus data set, 1998Code Name Coverage
15 Food and Beverages 51%16 Tobacco 80%17 Textiles 100%18 Wearing Apparel, Fur 44%19 Leather, Luggage and Footwear 57%20 Wood, Straw and Plaiting Materials 51%21 Pulp, Paper and Paper Products 76%22 Publishing, Printing and Media 55%23 Coke, Refined Petroleum Products and Nuclear Fuel -24 Chemicals and Chemical Products 98%25 Rubber and Plastic Products 55%26 Other Non-Metallic Mineral Products 74%27 Basic Metals 100%28 Fabricated Metal Products 56%29 Machinery and Equipment n.e.c. 64%30 Office Machinery and Computers 23%31 Electrical Machinery and Apparatus n.e.c. 100%32 Radio, TV and Communication Equipment 100%33 Medical, Precision and Optical Instruments 50%34 Motor Vehicles, Trailers and Semi-trailers 67%35 Other Transport Equipment 87%36 Furniture, Manufacturing n.e.c. 43%37 Recycling -
Note: Sales coverage ratio = total industry sales in Amadeus / total national industry sales according to the 2-digit NACE industry classification. Data on national industry sales are not available in sectors 23 and 37.
List of Variables
Avg_wage Running Average Regional Real Wage
FOR Ownership Intercept Variable : Fraction of Shares held by Foreign Owners
FORprof_L Real Profits per Employee interacted with the Foreign Ownership Variable
FORsales_L Real Sales per Employee interacted with the Foreign Ownership Variable
FORva_L Real Value Added per Employee interacted with the Foreign Ownership Variable
FORva_L t-2 2-Period Lagged Value of FORva_L
FORva_L t-3 3-Period Lagged Value of FORva_L
FORwage_L Real Wage per Employee interacted with the Foreign Ownership Variable
FORwage_L t-2 2-Period Lagged Value of FORwage_L
FORwage_L t-3 3-Period Lagged Value of FORwage_L
majFOR Ownership Intercept Dummy Variable : value = 1 if Fraction of Shares held by
Foreign Owners > 50%
majFORva_L Real Value Added per Employee interacted with the Foreign Ownership
Dummy Variable
majPRIVD Ownership Intercept Dummy Variable : value = 1 if Fraction of Shares held by
Private Domestic Owners > 50%
majPRIVDva_L Real Value Added per Employee interacted with the Private Domestic Ownership
Dummy Variable
PRIVD Ownership Intercept Variable : Fraction of Shares held by Private Domestic Owners
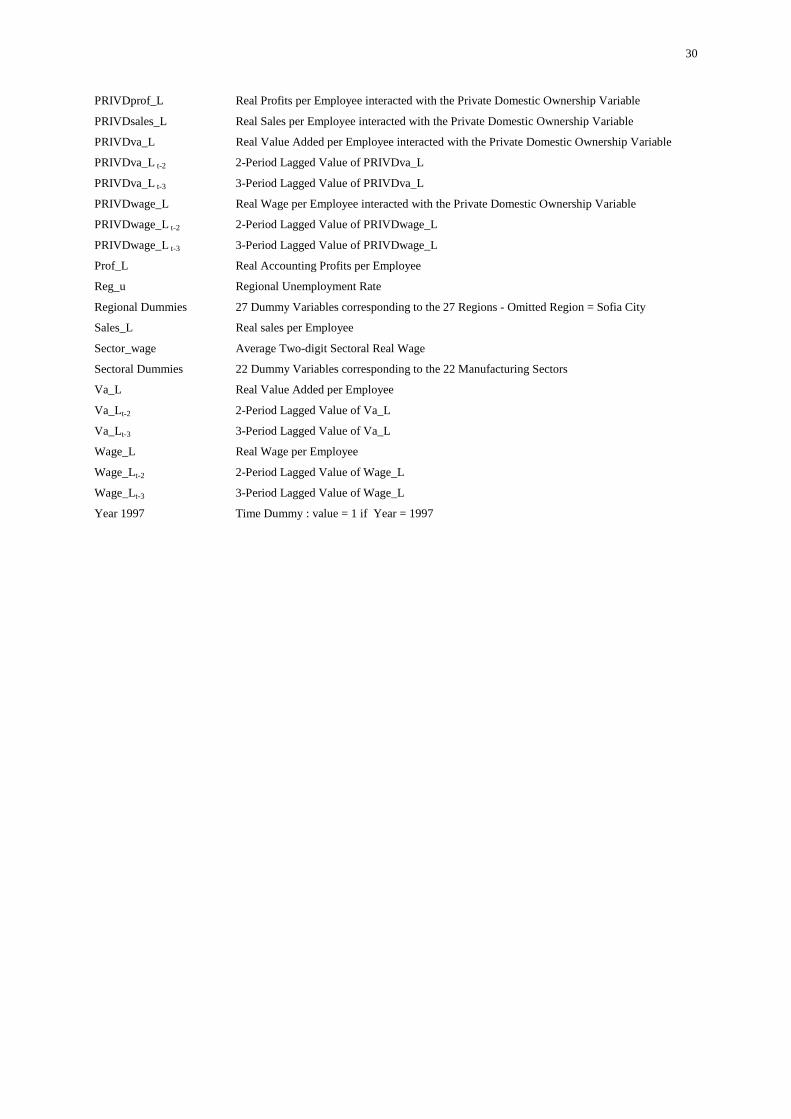
30
PRIVDprof_L Real Profits per Employee interacted with the Private Domestic Ownership Variable
PRIVDsales_L Real Sales per Employee interacted with the Private Domestic Ownership Variable
PRIVDva_L Real Value Added per Employee interacted with the Private Domestic Ownership Variable
PRIVDva_L t-2 2-Period Lagged Value of PRIVDva_L
PRIVDva_L t-3 3-Period Lagged Value of PRIVDva_L
PRIVDwage_L Real Wage per Employee interacted with the Private Domestic Ownership Variable
PRIVDwage_L t-2 2-Period Lagged Value of PRIVDwage_L
PRIVDwage_L t-3 3-Period Lagged Value of PRIVDwage_L
Prof_L Real Accounting Profits per Employee
Reg_u Regional Unemployment Rate
Regional Dummies 27 Dummy Variables corresponding to the 27 Regions - Omitted Region = Sofia City
Sales_L Real sales per Employee
Sector_wage Average Two-digit Sectoral Real Wage
Sectoral Dummies 22 Dummy Variables corresponding to the 22 Manufacturing Sectors
Va_L Real Value Added per Employee
Va_Lt-2 2-Period Lagged Value of Va_L
Va_Lt-3 3-Period Lagged Value of Va_L
Wage_L Real Wage per Employee
Wage_Lt-2 2-Period Lagged Value of Wage_L
Wage_Lt-3 3-Period Lagged Value of Wage_L
Year 1997 Time Dummy : value = 1 if Year = 1997
FACULTEIT ECONOMIE EN BEDRIJFSKUNDE HOVENIERSBERG 24 9000 GENT Tel. : 32 - (0)9 – 264.34.61
Fax. : 32 - (0)9 – 264.35.92
WORKING PAPER SERIES 1
94/01 L. GOUBERT, E. OMEY, The long-term labour demand and the role of productivity in manufacturing in eightOECD-countries, June 1994, 24 p.
94/02 F. HEYLEN, Social, economic and political institutions and taxes on labour, September 1994, 38 p. (published inWeltwirtschaftliches Archiv, 1995).
94/03 P. JOOS, H. OOGHE, Comparison between market determined and accounting determined measures of risk : anempirical assessment for the non-financial firms listed on the Brussels stock exhange, October 1994, 35 p.
94/04 R. VANDER VENNET, Market structure and operational efficiency a determinants of EC bank profitability,September 1994, 25 p. (published in Journal of International Financial Markets, Institutions and Money, 1994).
94/05 S. MANIGART, B. CLARYSSE, K. DEBACKERE, Entry despite the network : exploring the relationship betweennetwork structure and entry patterns in emergent organizational populations, December 1994, 39 p.
95/06 G. VAN HUFFEL, P. JOOS, H. OOGHE, Semi-annual earnings announcements and market reaction : some recentfindings for a small capital market, February 1995, 23 p. (published in European Accounting Review, 1996).
95/07 H. SAPIENZA, S. MANIGART, W. VERMEIR, A comparison of venture capitalist governance and value-added inthe U.S. and Western Europe, February 1995, 31 p. (published in Journal of Business Venturing, 1996).
95/08 F. HEYLEN, L. GOUBERT, E. OMEY, Unemployment in Europe : a problem of relative or aggregate demandshocks ? , March 1995, 16 p. (published in International Labour Review, 1996).
95/09 R. VANDER VENNET, The effect of mergers and acquisitions on the efficiency and profitability of EC creditinstitutions, April 1995, 35 p. (published in Journal of Banking and Finance, 1996).
95/10 P. VAN KENHOVE, A comparison between the "pick any" method of scaling and the semantic differential, April1995, 14 p.
95/11 K. SCHOORS, Bad loans in transition economies, May 1995, 42 p.
95/12 P. JOOS, H. OOGHE, Problemen bij het opstellen van classificatiemodellen : een toepassing op commerciëlekredietscoring bij financiële instellingen, Juni 1995, 39 p. (gepubliceerd in Tijdschrift voor Economie enManagement, 1998).
95/13 I. DE BEELDE, The evolution of industrial accounting thought in Belgium in the first half of the 20th century. Atextbook approach, July 1995, 29 p.
95/14 D. SCHOCKAERT, Japanse laagconjunctuur en vastgoedmarktontwikkelingen, Oktober 1995, 24 p. (gepubliceerdin Maandschrift Economie, 1996).
95/15 P. GEMMEL, R. VAN DIERDONCK, The design of a MRP-based hospital service requirements planning system :the impact of different sources of uncertainty, October 1995, October 1995, 23 p.
95/16 J. MATON, The Cape of Good Hope. Employment and income distribution in South Africa, September 1995,October 1995, 59 p.
96/17 D. WAEYTENS, Activity-based information in budgeting : the impact on information asymmetry, budget slackcreation and related dysfunctional behaviors - a lab experiment, February 1996, 40 p.
96/18 R. SLAGMULDER, Using management control systems to achieve alignment between strategic investmentdecisions and strategy, February 1996, 36 p. (published in Management Accounting Research, 1997).
96/19 N. VALCKX, W. DE VIJLDER, Monetary policy and asset prices : a comparison of the Fed's announcementpolicies 1987-1995, March 1996, 19 p. (published in Bank- en Financiewezen, 1996).
96/20 S. VANDORPE, J. DENYS, E. OMEY, De arbeidsmarktintegratie van afgestudeerden uit TSO en BSO : eenlongitudinale studie, Mei 1996, 21 p. (gepubliceerd in Economisch en Sociaal Tijdschrift, 1997)
FACULTEIT ECONOMIE EN BEDRIJFSKUNDE HOVENIERSBERG 24 9000 GENT Tel. : 32 - (0)9 – 264.34.61
Fax. : 32 - (0)9 – 264.35.92
WORKING PAPER SERIES 2
96/21 N. VALCKX, Business cycle properties of financial indicators in Germany, October 1996, 29 p.
96/22 T. TERMOTE, De arbeidsmarktparticipatie van de vrouw, ontwikkeling van de dienstensector en werkgelegenheid,November 1996, 35 p.
97/23 M. VERHUE, Demand for unemployment insurance : a survey-based analysis, January 1997, 25 p.
97/24 R. VAN HOVE, R. FRAMBACH, P. VAN KENHOVE, The impact of physical attractiveness in advertising onconsumer attitude : the role of product involvement, January 1997, 25 p.
97/25 I. DE BEELDE, Creating a profession 'out of nothing'. The case of the Belgian auditing profession, February 1997,27 p.
97/26 L. GOUBERT, De flexibiliteit van de Belgische relatieve lonen, Maart 1997, 27 p.
97/27 S. MANIGART, K. DE WAELE, M. WRIGHT, K. ROBBIE, Venture capitalist's appraisal of investment projects : anempirical study in four European countries, March 1997, 18 p. (published in Entrepreneurship Theory & Practice,1997).
97/28 P. DE PELSMACKER, J. VAN DEN BERGH, Advertising content and irritation. A Study of 226 TV commercials,April 1997, 27 p. (published in Journal of International Consumer Marketing, 1998).
97/29 R. VANDER VENNET, Determinants of EU bank takeovers : a logit analysis, April 1997, 23 p. (published as‘Causes and consequences of EU bank takeovers’, in S. Eijffinger, K. Koedijk, M. Pagano and R. Portes (eds.), TheChanging European Financial Landscape, CEPR, 1999).
97/30 R. COOPER, R. SLAGMULDER, Factors influencing the target costing process : lessons from Japanese practice,April 1997, 29 p.
97/31 E. SCHOKKAERT, M. VERHUE, E. OMEY, Individual preferences concerning unemployment compensation :insurance and solidarity, June 1997, 24 p.
97/32 F. HEYLEN, A contribution to the empirical analysis of the effects of fiscal consolidation : explanation of failure inEurope in the 1990s, June 1997, 30 p. (revised version, co-authored by G. Everaert, published in Public Choice,2000).
97/33 R. FRAMBACH, E. NIJSSEN, Industrial pricing practices and determinants, June 1997, 33 p. (published in D.Thorne Leclair and M. Hartline (eds.), Marketing theory and applications, vol. 8, Proceedings AMA WinterConference 1997).
97/34 I. DE BEELDE, An exploratory investigation of industry specialization of large audit firms, July 1997, 19 p.(published in International Journal of Accounting, 1997).
97/35 G. EVERAERT, Negative economic growth externalities from crumbling public investment in Europe : evidencebased on a cross-section analysis for the OECD-countries, July 1997, 34 p.
97/36 M. VERHUE, E. SCHOKKAERT, E. OMEY, De kloof tussen laag- en hooggeschoolden en de politiekehoudbaarheid van de Belgische werkloosheidsverzekering : een empirische analyse, augustus 1997, 30 p.(gepubliceerd in Economisch en Sociaal Tijdschrift, 1999).
97/37 J. CROMBEZ, R. VANDER VENNET, The performance of conditional betas on the Brussels Stock exchange,September 1997, 21 p. (published in Tijdschrift voor Economie en Management, 2000).
97/38 M. DEBRUYNE, R. FRAMBACH, Effective pricing of new industrial products, September 1997, 23 p. (published inD. Grewal and C. Pechmann (eds.), Marketing theory and applications, vol. 9, Proceedings AMA WinterConference 1998).
97/39 J. ALBRECHT, Environmental policy and the inward investment position of US 'dirty' industries, October 1997,20 p. (published in Intereconomics, 1998).
FACULTEIT ECONOMIE EN BEDRIJFSKUNDE HOVENIERSBERG 24 9000 GENT Tel. : 32 - (0)9 – 264.34.61
Fax. : 32 - (0)9 – 264.35.92
WORKING PAPER SERIES 3
97/40 A. DEHAENE, H. OOGHE, De disciplinering van het management : een literatuuroverzicht, oktober 1997, 28 p.(published in Economisch en Sociaal Tijdschrift, 2000).
97/41 G. PEERSMAN, The monetary transmission mechanism : empirical evidence for EU-countries, November 1997, 25p.
97/42 S. MANIGART, K. DE WAELE, Choice dividends and contemporaneous earnings announcements in Belgium,November 1997, 25 p. (published in Cahiers Economiques de Bruxelles, 1999).
97/43 H. OOGHE, Financial Management Practices in China, December 1997, 24 p. (published in European BusinessReview, 1998).
98/44 B. CLARYSSE, R. VAN DIERDONCK, Inside the black box of innovation : strategic differences between SMEs,January 1998, 30 p.
98/45 B. CLARYSSE, K. DEBACKERE, P. TEMIN, Innovative productivity of US biopharmaceutical start-ups : insightsfrom industrial organization and strategic management, January 1998, 27 p. (published in International Journal ofBiotechnology, 2000).
98/46 R. VANDER VENNET, Convergence and the growth pattern of OECD bank markets, February 1998, 21 p.(forthcoming as ‘The law of proportionate effect and OECD bank sectors’ in Applied Economics, 2001).
98/47 B. CLARYSSE, U. MULDUR, Regional cohesion in Europe ? The role of EU RTD policy reconsidered, April 1998,28 p. (published in Research Policy, 2000).
98/48 A. DEHAENE, H. OOGHE, Board composition, corporate performance and dividend policy, April 1998, 22 p.(published as ‘Corporate performance and board structure in Belgian companies’ in Long Range Planning, 2001).
98/49 P. JOOS, K. VANHOOF, H. OOGHE, N. SIERENS, Credit classification : a comparison of logit models anddecision trees, May 1998, 15 p.
98/50 J. ALBRECHT, Environmental regulation, comparative advantage and the Porter hypothesis, May 1998, 35 p.(published in International Journal of Development Planning Literature, 1999)
98/51 S. VANDORPE, I. NICAISE, E. OMEY, ‘Work Sharing Insurance’ : the need for government support, June 1998,20 p.
98/52 G. D. BRUTON, H. J. SAPIENZA, V. FRIED, S. MANIGART, U.S., European and Asian venture capitalists’governance : are theories employed in the examination of U.S. entrepreneurship universally applicable?, June1998, 31 p.
98/53 S. MANIGART, K. DE WAELE, M. WRIGHT, K. ROBBIE, P. DESBRIERES, H. SAPIENZA, A. BEEKMAN,Determinants of required return in venture capital investments : a five country study, June 1998, 36 p. (forthcomingin Journal of Business Venturing, 2001)
98/54 J. BOUCKAERT, H. DEGRYSE, Price competition between an expert and a non-expert, June 1998,29p. (published in International Journal of Industrial Organisation, 2000).
98/55 N. SCHILLEWAERT, F. LANGERAK, T. DUHAMEL, Non probability sampling for WWW surveys : a comparison ofmethods, June 1998, 12 p. (published in Journal of the Market Research Society, 1999).
98/56 F. HEYLEN. Monetaire Unie en arbeidsmarkt : reflecties over loonvorming en macro-economisch beleid, juni 1998,15 p. (gepubliceerd in M. Eyskens e.a., De euro en de toekomst van het Europese maatschappijmodel, Intersentia,1999).
98/57 G. EVERAERT, F. HEYLEN, Public capital and productivity growth in Belgium, July 1998, 20 p. (published inEconomic Modelling, 2001).
98/58 G. PEERSMAN, F. SMETS, The Taylor rule : a useful monetary policy guide for the ECB ?, September 1998, 28 p.(published in International Finance, 1999).
FACULTEIT ECONOMIE EN BEDRIJFSKUNDE HOVENIERSBERG 24 9000 GENT Tel. : 32 - (0)9 – 264.34.61
Fax. : 32 - (0)9 – 264.35.92
WORKING PAPER SERIES 4
98/59 J. ALBRECHT, Environmental consumer subsidies and potential reductions of CO2 emissions, October 1998, 28 p.
98/60 K. SCHOORS, A payment system failure and its consequences for interrepublican trade in the former Soviet Union,December 1998, 31 p.
98/61 M. DE LOOF, Intragroup relations and the determinants of corporate liquid reserves : Belgian evidence, December1998, 29 p. (published in European Financial Management, 2000).
98/62 P. VAN KENHOVE, W. VAN WATERSCHOOT, K. DE WULF, The impact of task definition on store choice andstore-attribute saliences, December 1998, 16 p. (published in Journal of Retailing, 1999).
99/63 P. GEMMEL, F. BOURGONJON, Divergent perceptions of TQM implementation in hospitals, January 1999, 25 p.(forthcoming in Journal of Management in Medicine, 2000)
99/64 K. SCHOORS, The credit squeeze during Russia's early transition. A bank-based view, January 1999, 26 p.
99/65 G. EVERAERT, Shifts in balanced growth and public capital - an empirical analysis for Belgium, March 1999, 24 p.
99/66 M. DE LOOF, M. JEGERS, Trade Credit, Corporate Groups, and the Financing of Belgian Firms, March 1999, 31 p.(published in Journal of Business Finance and Accounting, 1999).
99/67 M. DE LOOF, I. VERSCHUEREN, Are leases and debt substitutes ? Evidence from Belgian firms, March 1999,11 p. (published in Financial Management, 1999).
99/68 H. OOGHE, A. DEHAENE, De sociale balans in België : voorstel van analysemethode en toepassing op hetboekjaar 1996, April 1999, 28 p. (gepubliceerd in Accountancy en Bedrijfskunde Kwartaalschrift, 1999).
99/69 J. BOUCKAERT, Monopolistic competition with a mail order business, May 1999, 9 p. (published in EconomicsLetters, 2000).
99/70 R. MOENAERT, F. CAELDRIES, A. LIEVENS, E. WOUTERS, Communication flows in international productinnovation teams, June 1999, p. (published in Journal of Product Innovation Management, 2000).
99/71 G. EVERAERT, Infrequent large shocks to unemployment. New evidence on alternative persistence perspectives,July 1999, 28 p.
99/72 L. POZZI, Tax discounting and direct crowding-out in Belgium : implications for fiscal policy, August 1999, 21 p.
99/73 I. VERSCHUEREN, M. DE LOOF, Intragroup debt, intragroup guaranties and the capital structure of Belgian firms,August 1999, 26 p.
99/74 A. BOSMANS, P. VAN KENHOVE, P. VLERICK, H. HENDRICKX, Automatic Activation of the Self in a PersuasionContext , September 1999, 19 p. (forthcoming in Advances in Consumer Research, 2000).
99/75 I. DE BEELDE, S. COOREMAN, H. LEYDENS, Expectations of users of financial information with regard to thetasks carried out by auditors , October 1999, 17 p.
99/76 J. CHRISTIAENS, Converging new public management reforms and diverging accounting practices in Belgian localgovernments, October 1999, 26 p. (forthcoming in Financial Accountability & Management, 2001)
99/77 V. WEETS, Who will be the new auditor ?, October 1999, 22 p.
99/78 M. DEBRUYNE, R. MOENAERT, A. GRIFFIN, S. HART, E.J. HULTINK, H. ROBBEN, The impact of new productlaunch strategies on competitive reaction in industrial markets, November 1999, 25 p.
99/79 H. OOGHE, H. CLAUS, N. SIERENS, J. CAMERLYNCK, International comparison of failure prediction modelsfrom different countries: an empirical analysis, December 1999, 33 p.

FACULTEIT ECONOMIE EN BEDRIJFSKUNDE HOVENIERSBERG 24 9000 GENT Tel. : 32 - (0)9 – 264.34.61
Fax. : 32 - (0)9 – 264.35.92
WORKING PAPER SERIES 5
00/80 K. DE WULF, G. ODEKERKEN-SCHRÖDER, The influence of seller relationship orientation and buyer relationshipproneness on trust, commitment, and behavioral loyalty in a consumer environment, January 2000, 27 p.
00/81 R. VANDER VENNET, Cost and profit efficiency of financial conglomerates and universal banks in Europe.,February 2000, 33 p. (forthcoming in Journal of Money, Credit, and Banking, 2001)
00/82 J. BOUCKAERT, Bargaining in markets with simultaneous and sequential suppliers, April 2000, 23 p. (forthcomingin Journal of Economic Behavior and Organization, 2001)
00/83 N. HOUTHOOFD, A. HEENE, A systems view on what matters to excel, May 2000, 22 p.
00/84 D. VAN DE GAER, E. SCHOKKAERT, M. MARTINEZ, Three meanings of intergenerational mobility, May 2000, 20p. (forthcoming in Economica, 2001)
00/85 G. DHAENE, E. SCHOKKAERT, C. VAN DE VOORDE, Best affine unbiased response decomposition, May 2000,9 p.
00/86 D. BUYENS, A. DE VOS, The added value of the HR-department : empirical study and development of anintegrated framework, June 2000, 37 p.
00/87 K. CAMPO, E. GIJSBRECHTS, P. NISOL, The impact of stock-outs on whether, how much and what to buy, June2000, 50 p.
00/88 K. CAMPO, E. GIJSBRECHTS, P. NISOL, Towards understanding consumer response to stock-outs, June 2000,40 p. (published in Journal of Retailing, 2000)
00/89 K. DE WULF, G. ODEKERKEN-SCHRÖDER, P. SCHUMACHER, Why it takes two to build succesful buyer-sellerrelationships July 2000, 31 p.
00/90 J. CROMBEZ, R. VANDER VENNET, Exact factor pricing in a European framework, September 2000, 38 p.
00/91 J. CAMERLYNCK, H. OOGHE, Pre-acquisition profile of privately held companies involved in takeovers : anempirical study, October 2000, 34 p.
00/92 K. DENECKER, S. VAN ASSCHE, J. CROMBEZ, R. VANDER VENNET, I. LEMAHIEU, Value-at-risk predictionusing context modeling, November 2000, 24 p. (forthcoming in European Physical Journal B, 2001)
00/93 P. VAN KENHOVE, I. VERMEIR, S. VERNIERS, An empirical investigation of the relationships between ethicalbeliefs, ethical ideology, political preference and need for closure of Dutch-speaking consumers in Belgium,November 2000, 37 p. (forthcoming in Journal of Business Ethics, 2001)
00/94 P. VAN KENHOVE, K. WIJNEN, K. DE WULF, The influence of topic involvement on mail survey responsebehavior, November 2000, 40 p.
00/95 A. BOSMANS, P. VAN KENHOVE, P. VLERICK, H. HENDRICKX, The effect of mood on self-referencing in apersuasion context, November 2000, 26 p. (forthcoming in Advances in Consumer Research, 2001)
00/96 P. EVERAERT, G. BOËR, W. BRUGGEMAN, The Impact of Target Costing on Cost, Quality and DevelopmentTime of New Products: Conflicting Evidence from Lab Experiments, December 2000, 47 p.
00/97 G. EVERAERT, Balanced growth and public capital: An empirical analysis with I(2)-trends in capital stock data,December 2000, 29 p.
00/98 G. EVERAERT, F. HEYLEN, Public capital and labour market performance in Belgium, December 2000, 45 p.
00/99 G. DHAENE, O. SCAILLET, Reversed Score and Likelihood Ratio Tests, December 2000, 16 p.
FACULTEIT ECONOMIE EN BEDRIJFSKUNDE HOVENIERSBERG 24 9000 GENT Tel. : 32 - (0)9 – 264.34.61
Fax. : 32 - (0)9 – 264.35.92
WORKING PAPER SERIES 6
01/100 A. DE VOS, D. BUYENS, Managing the psychological contract of graduate recruits: a challenge for humanresource management, January 2001, 35 p.
01/101 J. CHRISTIAENS, Financial Accounting Reform in Flemish Universities: An Empirical Study of the implementation,February 2001, 22 p.
01/102 S. VIAENE, B. BAESENS, D. VAN DEN POEL, G. DEDENE, J. VANTHIENEN, Wrapped Input Selection usingMultilayer Perceptrons for Repeat-Purchase Modeling in Direct Marketing, June 2001, 23 p.
01/103 J. ANNAERT, J. VAN DEN BROECK, R. VANDER VENNET, Determinants of Mutual Fund Performance: ABayesian Stochastic Frontier Approach, June 2001, 31 p.
01/104 S. VIAENE, B. BAESENS, T. VAN GESTEL, J.A.K. SUYKENS, D. VAN DEN POEL, J. VANTHIENEN, B. DEMOOR, G. DEDENE, Knowledge Discovery in a Direct Marketing Case using Least Square Support VectorMachines, June 2001, 27 p.
01/105 S. VIAENE, B. BAESENS, D. VAN DEN POEL, J. VANTHIENEN, G. DEDENE, Bayesian Neural Network Learningfor Repeat Purchase Modelling in Direct Marketing, June 2001, 33 p.
01/106 H.P. HUIZINGA, J.H.M. NELISSEN, R. VANDER VENNET, Efficiency Effects of Bank Mergers and Acquisitions inEurope, June 2001, 33 p.
01/107 H. OOGHE, J. CAMERLYNCK, S. BALCAEN, The Ooghe-Joos-De Vos Failure Prediction Models: a Cross-Industry Validation, July 2001, 42 p.
01/108 D. BUYENS, K. DE WITTE, G. MARTENS, Building a Conceptual Framework on the Exploratory Job Search, July2001, 31 p.
01/109 J. BOUCKAERT, Recente inzichten in de industriële economie op de ontwikkelingen in de telecommunicatie,augustus 2001, 26 p.
01/110 A. VEREECKE, R. VAN DIERDONCK, The Strategic Role of the Plant: Testing Ferdows' Model, August 2001, 31 p.
01/111 S. MANIGART, C. BEUSELINCK, Supply of Venture Capital by European Governments, August 2001, 20 p.
01/112 S. MANIGART, K. BAEYENS, W. VAN HYFTE, The survival of venture capital backed companies, September2001, 32 p.
01/113 J. CHRISTIAENS, C. VANHEE, Innovations in Governmental Accounting Systems: the Concept of a "Mega GeneralLedger" in Belgian Provinces, September 2001, 20 p.
01/114 M. GEUENS, P. DE PELSMACKER, Validity and reliability of scores on the reduced Emotional Intensity Scale,September 2001, 25 p.
01/115 B. CLARYSSE, N. MORAY, A process study of entrepreneurial team formation: the case of a research based spinoff, October 2001, 29 p.
01/116 F. HEYLEN, L. DOBBELAERE, A. SCHOLLAERT, Inflation, human capital and long-run growth. An empiricalanalysis, October 2001, 17p.