inside out … right-side up? bubble residue and recession · right-side up? bubble residue and...
TRANSCRIPT

Inside Out … Right-Side Up?Bubble residue and recession
Presentation toNAIOP Northern Virginia
July 9, 2009
Anthony B. SandersGeorge Mason University
http://mason.gmu.edu/~asander7/
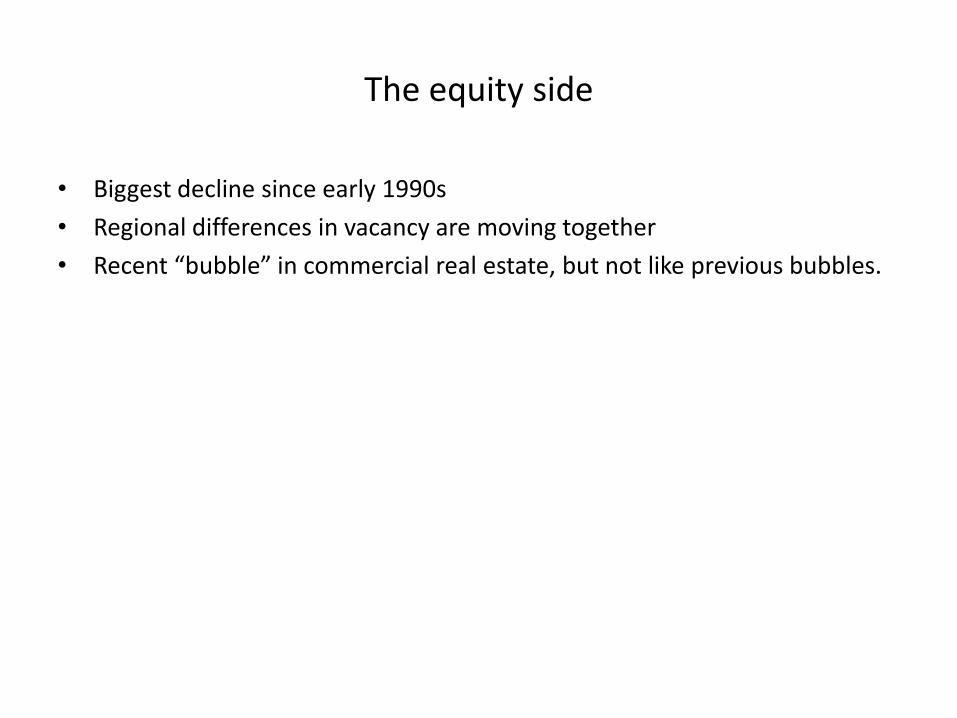
The equity side
• Biggest decline since early 1990s
• Regional differences in vacancy are moving together
• Recent “bubble” in commercial real estate, but not like previous bubbles.
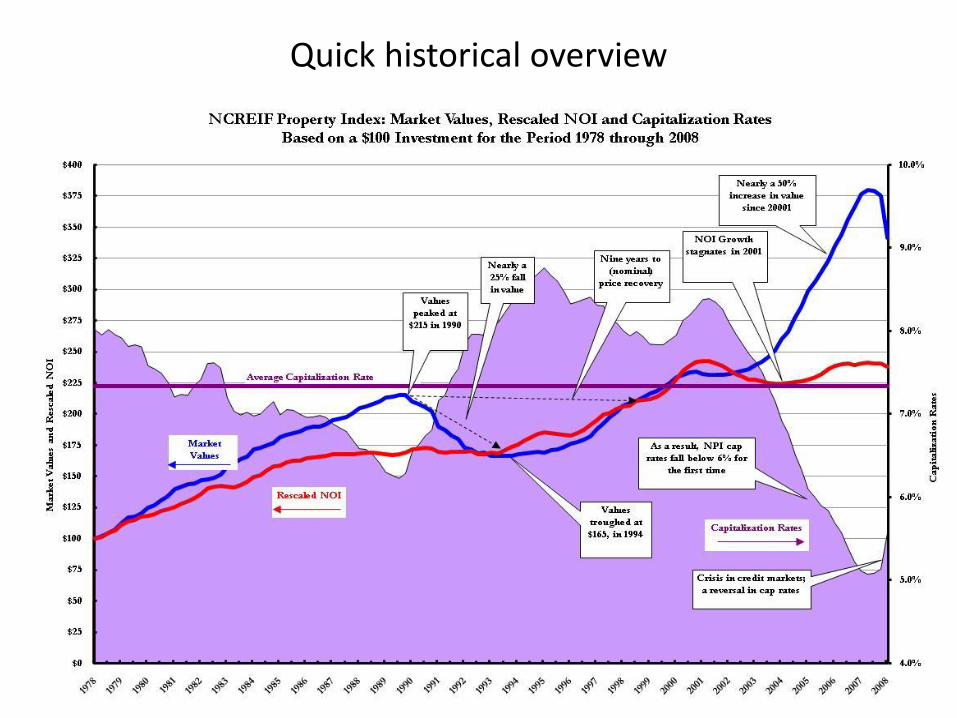
Quick historical overview
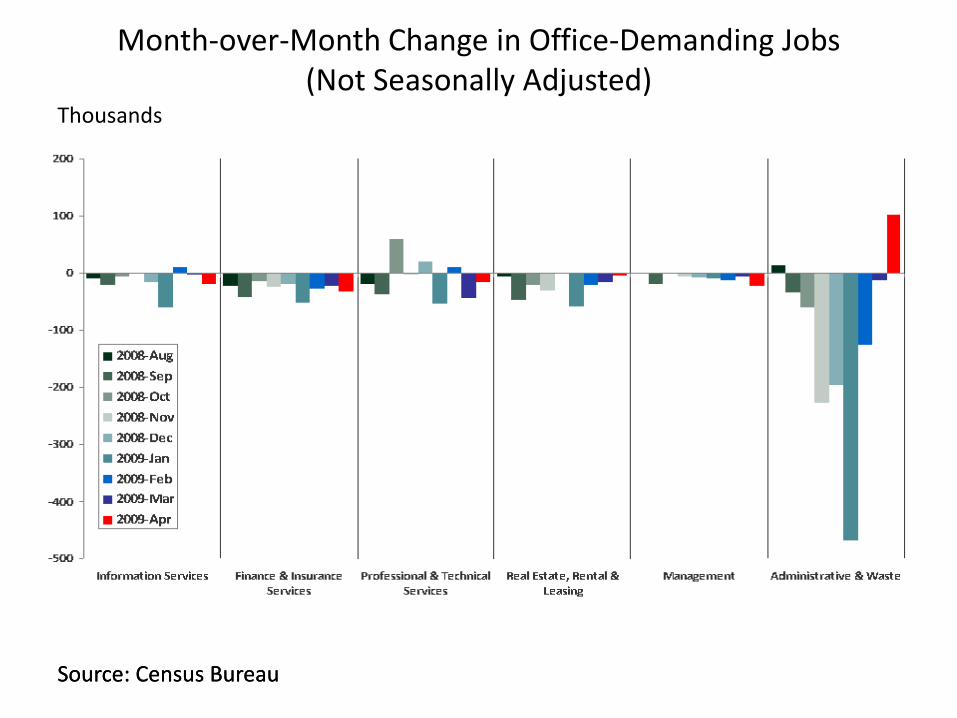
Month-over-Month Change in Office-Demanding Jobs (Not Seasonally Adjusted)
Source: Census Bureau
Thousands
Source: Census Bureau
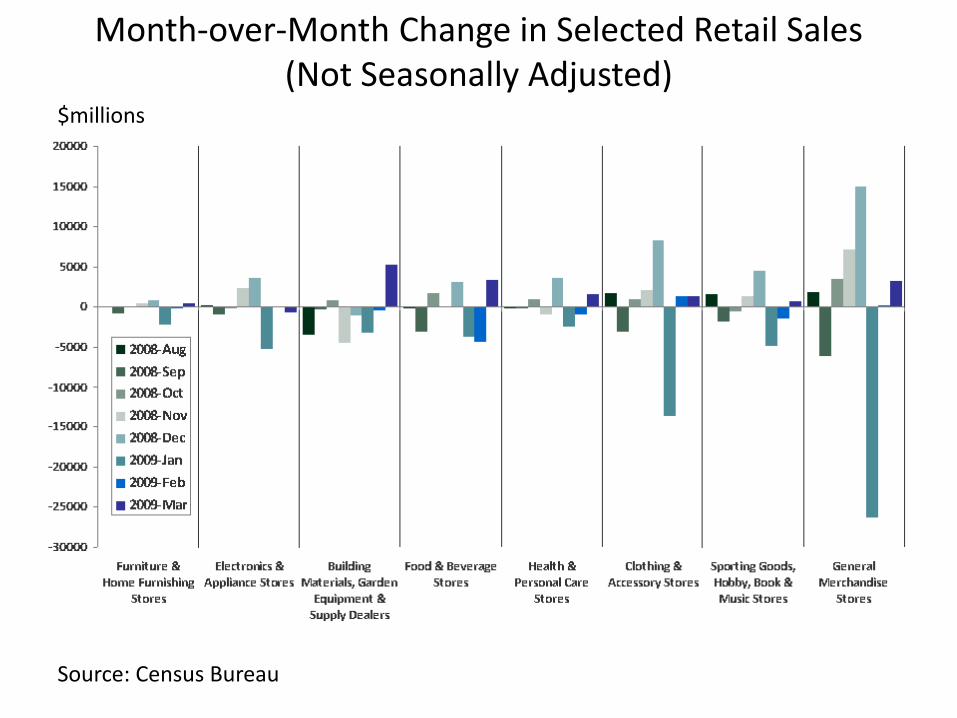
Month-over-Month Change in Selected Retail Sales(Not Seasonally Adjusted)
Source: Census Bureau
$millions
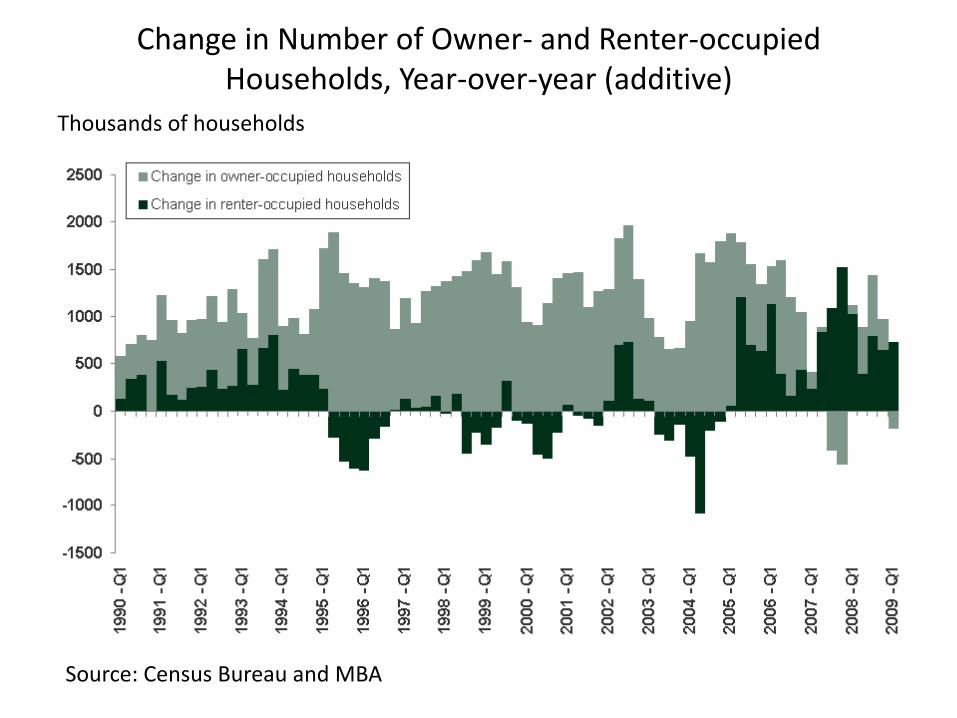
Change in Number of Owner- and Renter-occupied Households, Year-over-year (additive)
Source: Census Bureau and MBA
Thousands of households
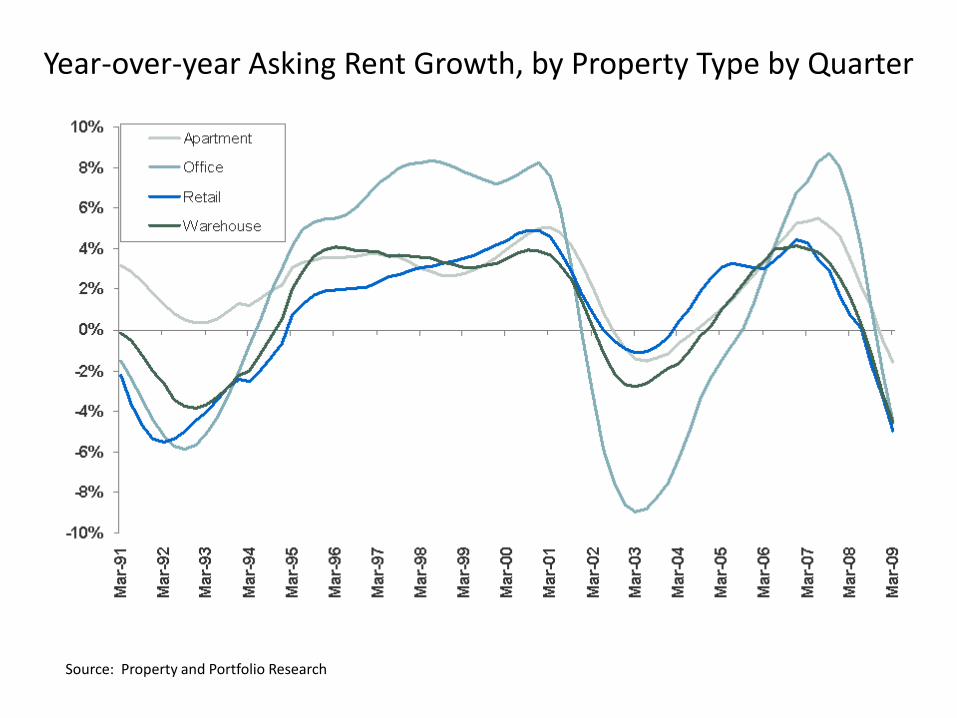
Year-over-year Asking Rent Growth, by Property Type by Quarter
Source: Property and Portfolio Research

2009 is the worst market since the early 1990s
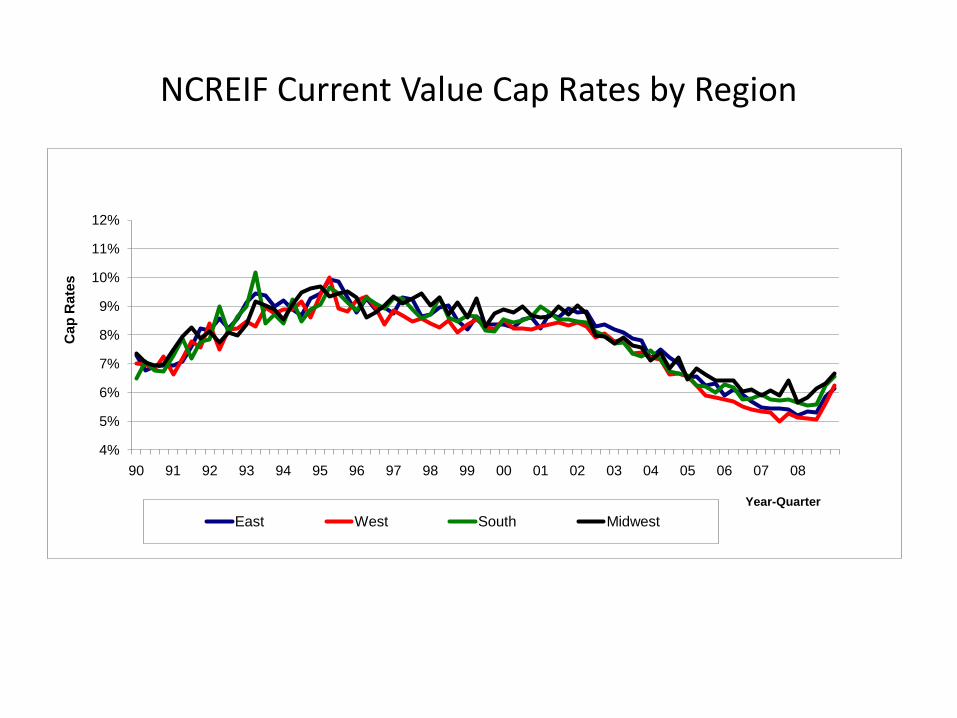
NCREIF Current Value Cap Rates by Region
4%
5%
6%
7%
8%
9%
10%
11%
12%
90 91 92 93 94 95 96 97 98 99 00 01 02 03 04 05 06 07 08
Ca
p R
ate
s
Year-Quarter
East West South Midwest
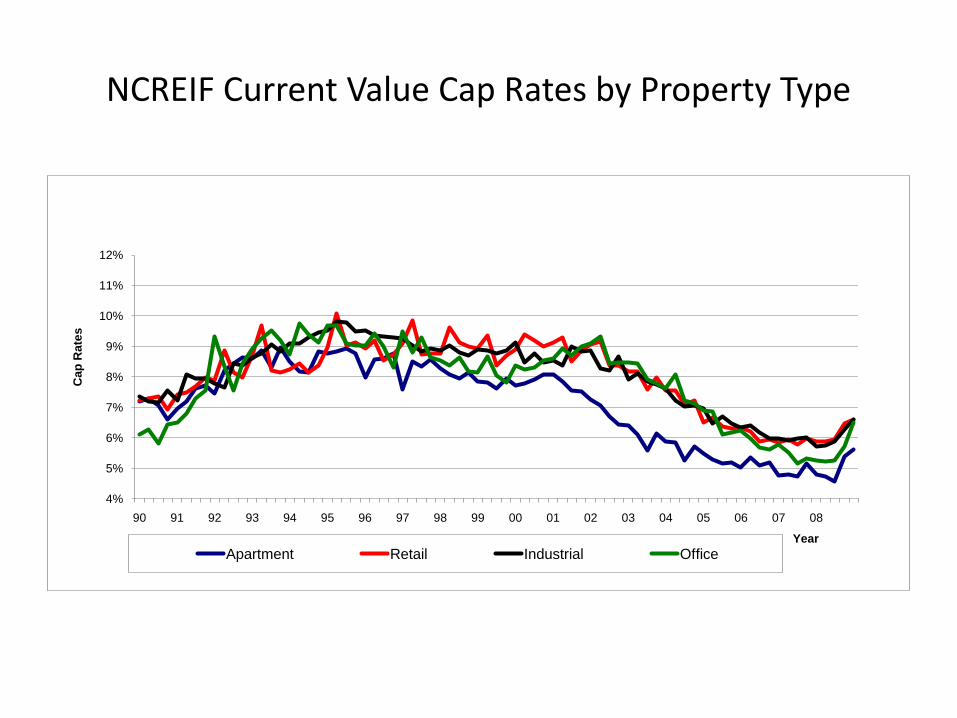
NCREIF Current Value Cap Rates by Property Type
4%
5%
6%
7%
8%
9%
10%
11%
12%
90 91 92 93 94 95 96 97 98 99 00 01 02 03 04 05 06 07 08
Cap
Rate
s
Year
Apartment Retail Industrial Office
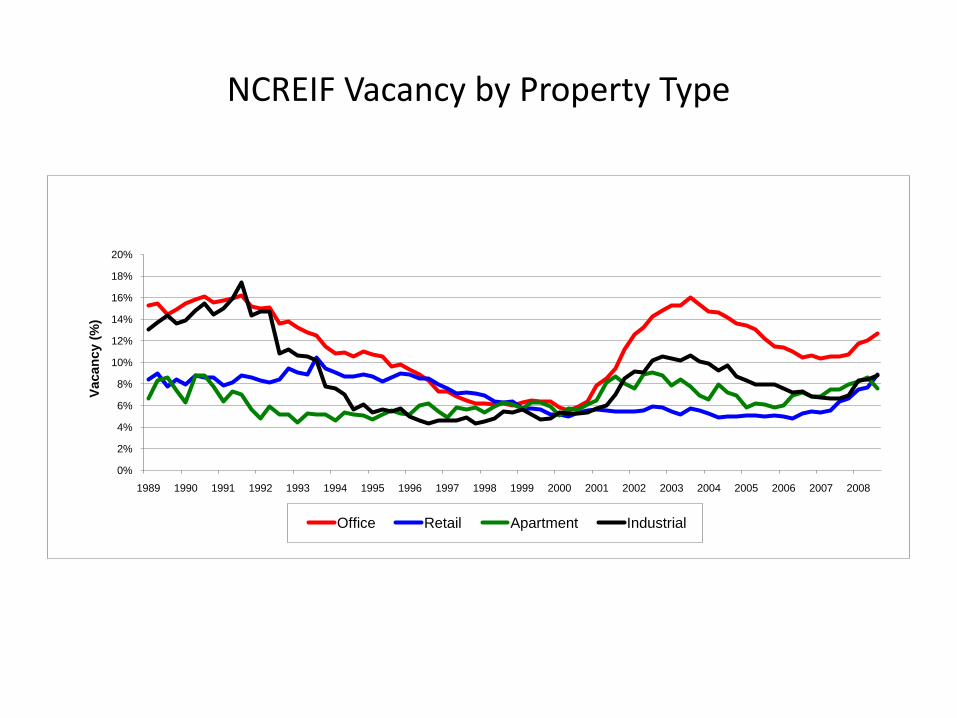
NCREIF Vacancy by Property Type
0%
2%
4%
6%
8%
10%
12%
14%
16%
18%
20%
1989 1990 1991 1992 1993 1994 1995 1996 1997 1998 1999 2000 2001 2002 2003 2004 2005 2006 2007 2008
Vacan
cy (
%)
Office Retail Apartment Industrial
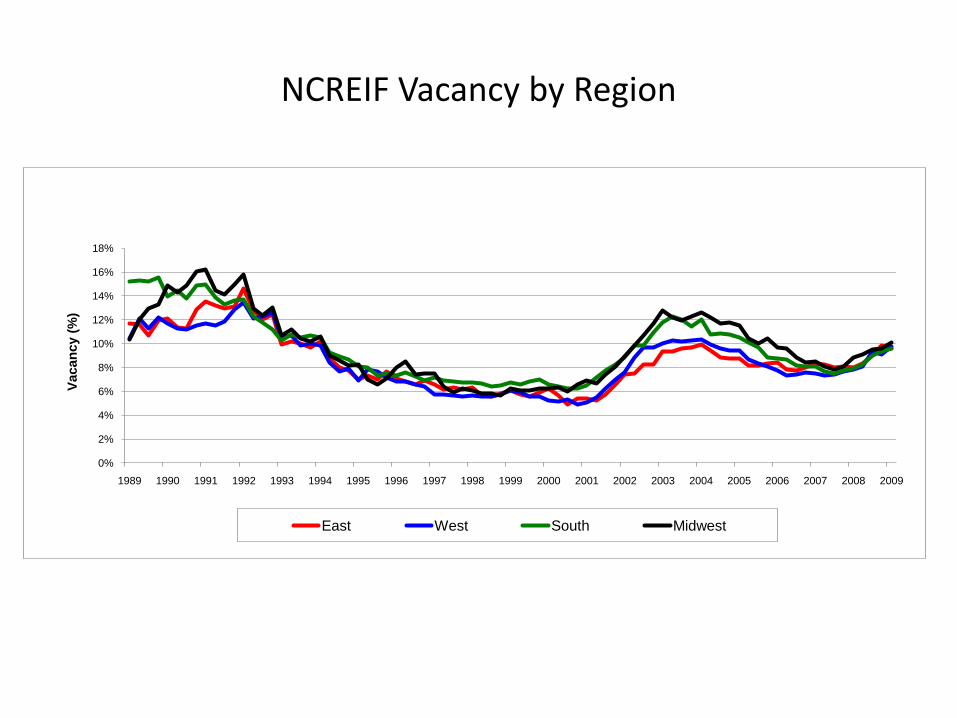
NCREIF Vacancy by Region
0%
2%
4%
6%
8%
10%
12%
14%
16%
18%
1989 1990 1991 1992 1993 1994 1995 1996 1997 1998 1999 2000 2001 2002 2003 2004 2005 2006 2007 2008 2009
Vacan
cy (
%)
East West South Midwest
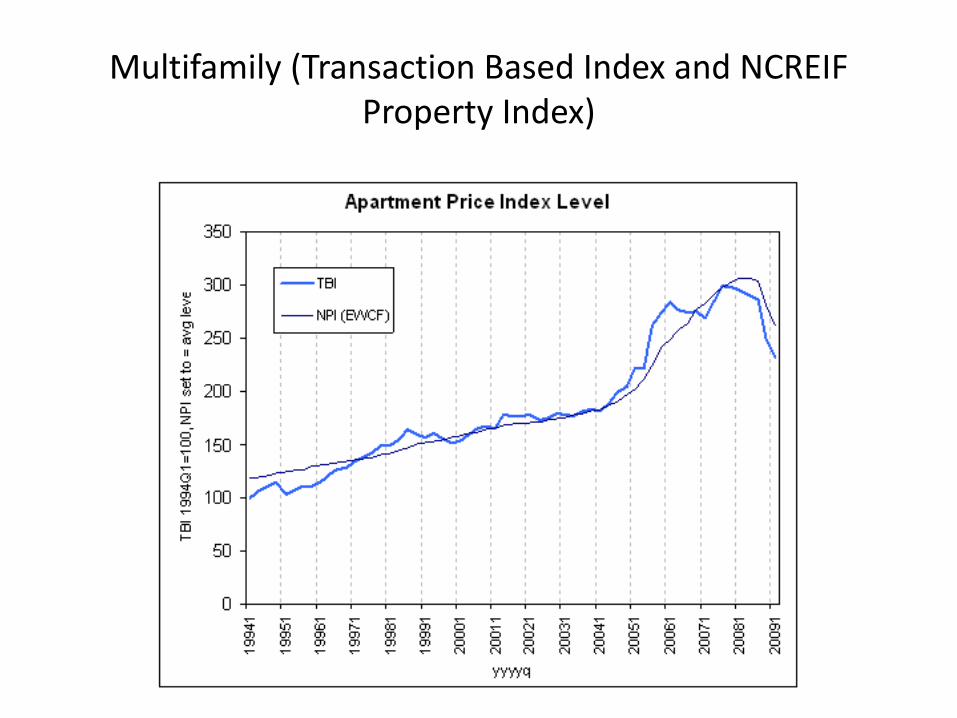
Multifamily (Transaction Based Index and NCREIF Property Index)
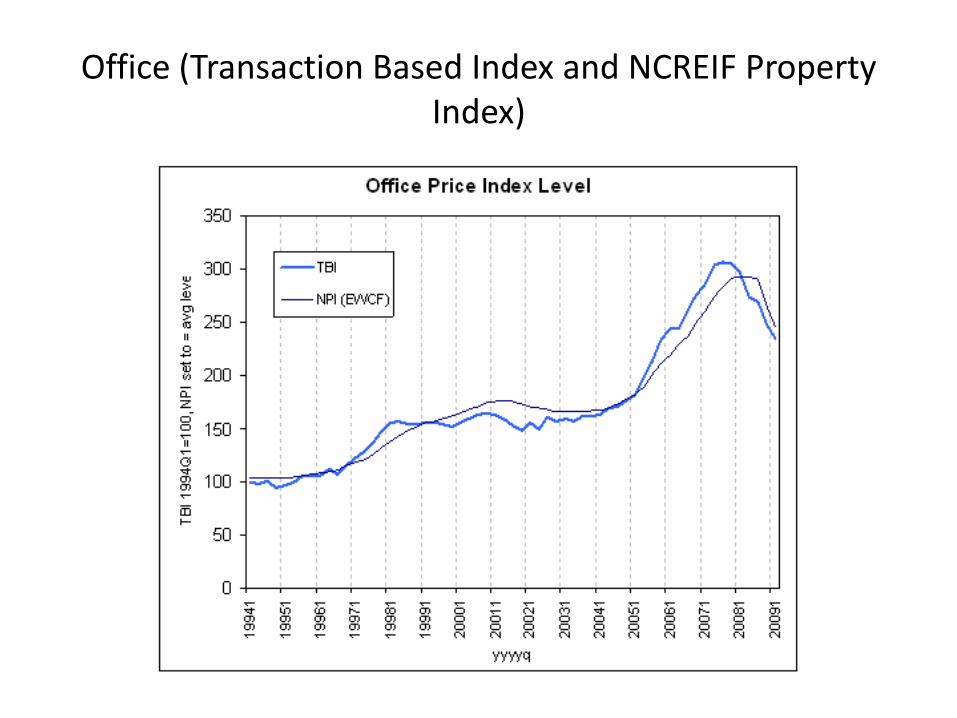
Office (Transaction Based Index and NCREIF Property Index)
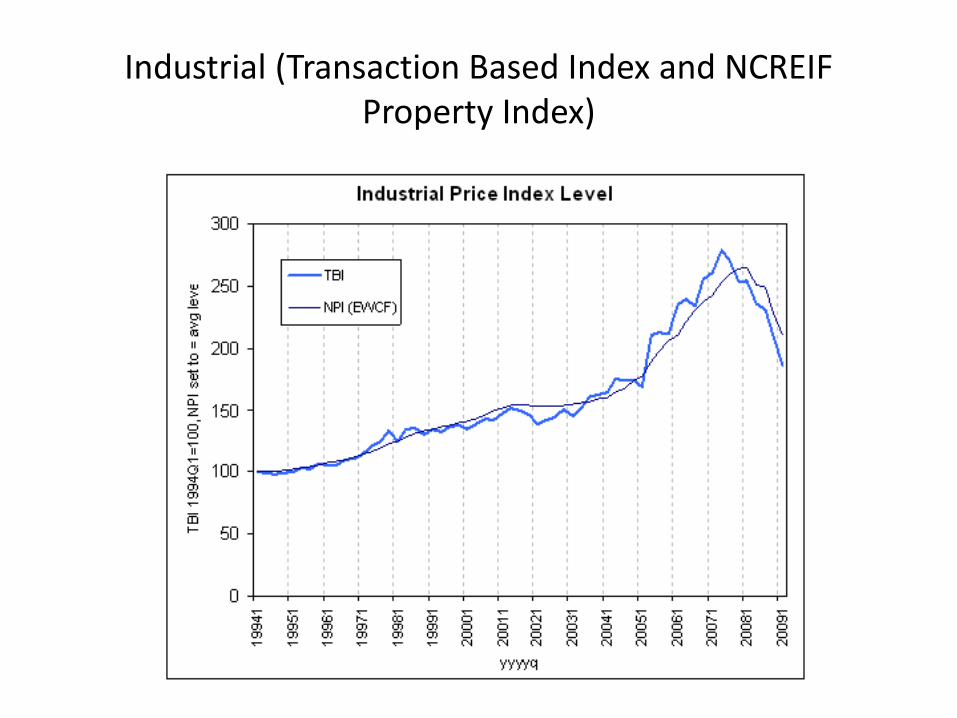
Industrial (Transaction Based Index and NCREIF Property Index)
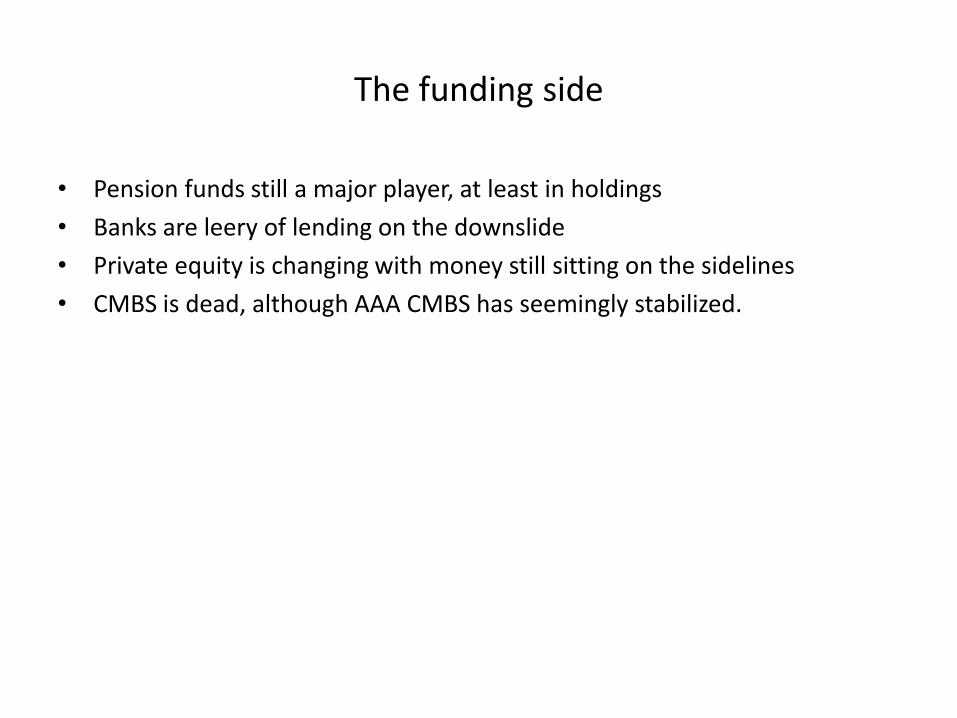
The funding side
• Pension funds still a major player, at least in holdings
• Banks are leery of lending on the downslide
• Private equity is changing with money still sitting on the sidelines
• CMBS is dead, although AAA CMBS has seemingly stabilized.
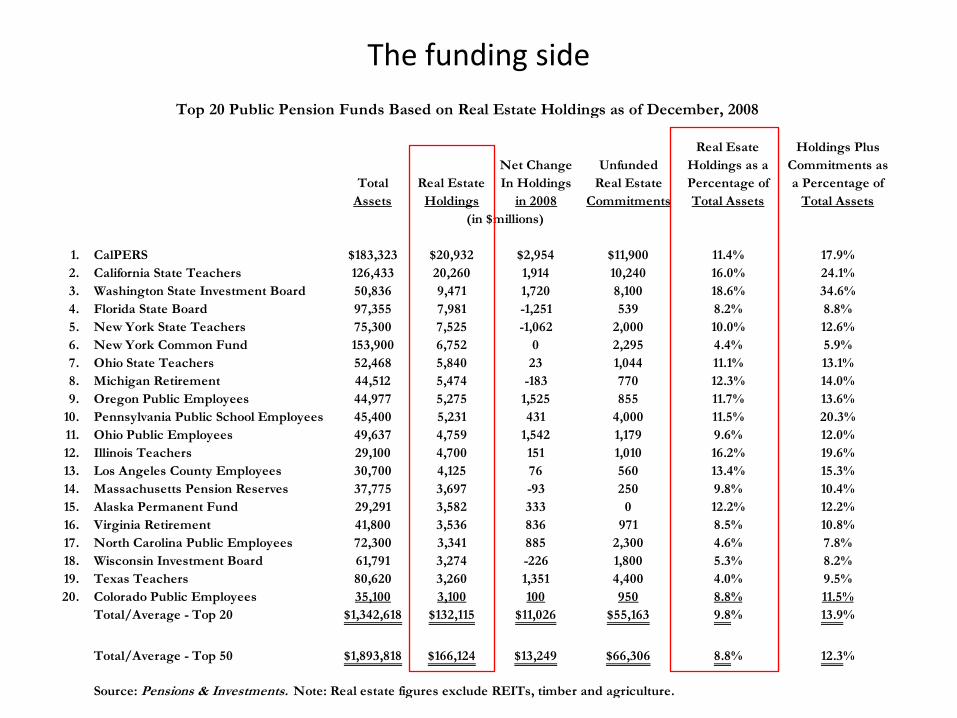
The funding side
Real Esate Holdings Plus
Net Change Unfunded Holdings as a Commitments as
Total Real Estate In Holdings Real Estate Percentage of a Percentage of
Assets Holdings in 2008 Commitments Total Assets Total Assets
1. CalPERS $183,323 $20,932 $2,954 $11,900 11.4% 17.9%
2. California State Teachers 126,433 20,260 1,914 10,240 16.0% 24.1%
3. Washington State Investment Board 50,836 9,471 1,720 8,100 18.6% 34.6%
4. Florida State Board 97,355 7,981 -1,251 539 8.2% 8.8%
5. New York State Teachers 75,300 7,525 -1,062 2,000 10.0% 12.6%
6. New York Common Fund 153,900 6,752 0 2,295 4.4% 5.9%
7. Ohio State Teachers 52,468 5,840 23 1,044 11.1% 13.1%
8. Michigan Retirement 44,512 5,474 -183 770 12.3% 14.0%
9. Oregon Public Employees 44,977 5,275 1,525 855 11.7% 13.6%
10. Pennsylvania Public School Employees 45,400 5,231 431 4,000 11.5% 20.3%
11. Ohio Public Employees 49,637 4,759 1,542 1,179 9.6% 12.0%
12. Illinois Teachers 29,100 4,700 151 1,010 16.2% 19.6%
13. Los Angeles County Employees 30,700 4,125 76 560 13.4% 15.3%
14. Massachusetts Pension Reserves 37,775 3,697 -93 250 9.8% 10.4%
15. Alaska Permanent Fund 29,291 3,582 333 0 12.2% 12.2%
16. Virginia Retirement 41,800 3,536 836 971 8.5% 10.8%
17. North Carolina Public Employees 72,300 3,341 885 2,300 4.6% 7.8%
18. Wisconsin Investment Board 61,791 3,274 -226 1,800 5.3% 8.2%
19. Texas Teachers 80,620 3,260 1,351 4,400 4.0% 9.5%
20. Colorado Public Employees 35,100 3,100 100 950 8.8% 11.5%
Total/Average - Top 20 $1,342,618 $132,115 $11,026 $55,163 9.8% 13.9%
Total/Average - Top 50 $1,893,818 $166,124 $13,249 $66,306 8.8% 12.3%
Source: Pensions & Investments. Note: Real estate figures exclude REITs, timber and agriculture.
Top 20 Public Pension Funds Based on Real Estate Holdings as of December, 2008
(in $millions)
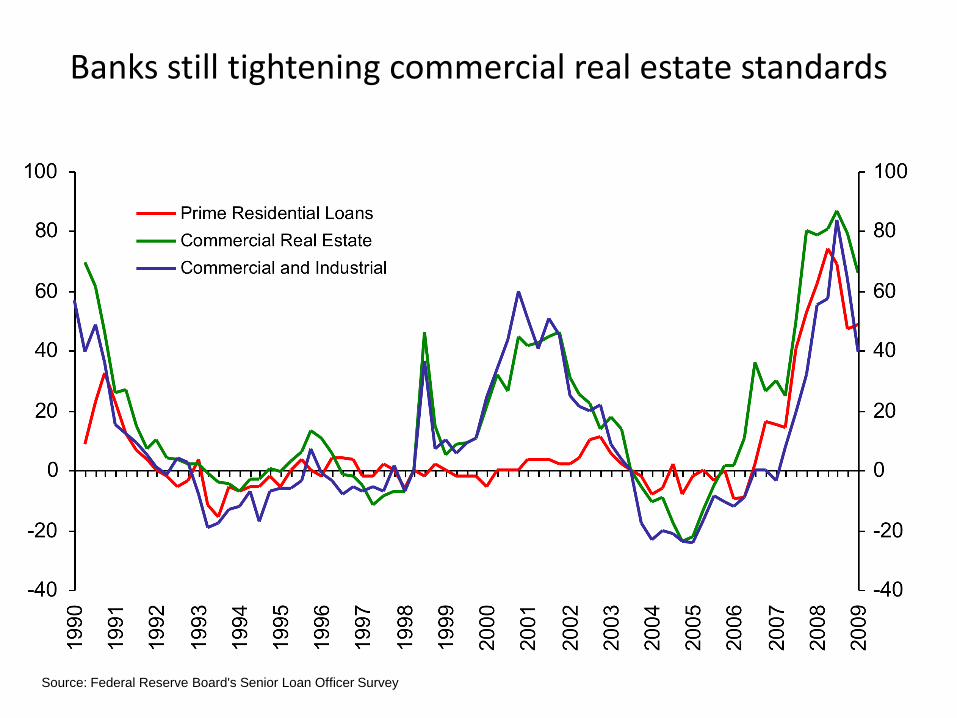
Banks still tightening commercial real estate standards
Source: Federal Reserve Board's Senior Loan Officer Survey
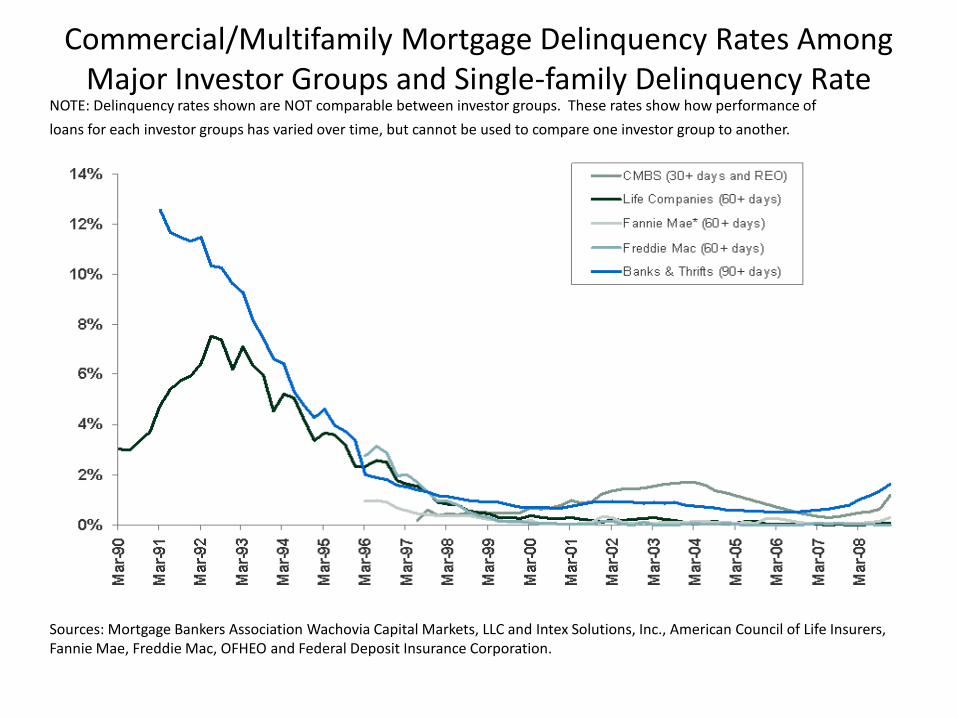
Commercial/Multifamily Mortgage Delinquency Rates Among Major Investor Groups and Single-family Delinquency Rate
NOTE: Delinquency rates shown are NOT comparable between investor groups. These rates show how performance of
loans for each investor groups has varied over time, but cannot be used to compare one investor group to another.
Sources: Mortgage Bankers Association Wachovia Capital Markets, LLC and Intex Solutions, Inc., American Council of Life Insurers, Fannie Mae, Freddie Mac, OFHEO and Federal Deposit Insurance Corporation.
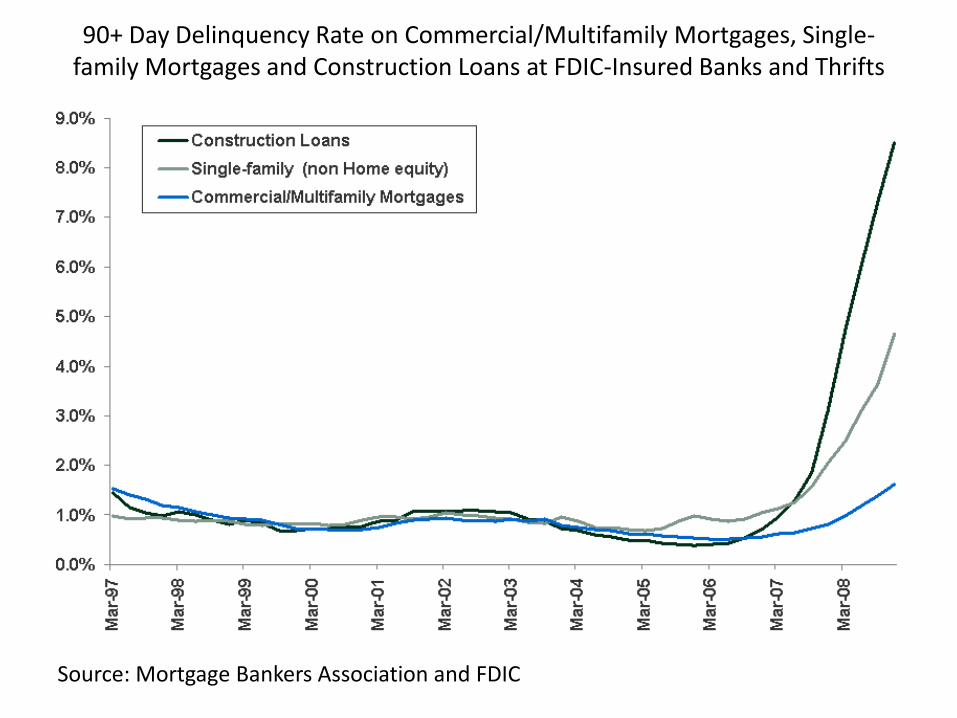
90+ Day Delinquency Rate on Commercial/Multifamily Mortgages, Single-family Mortgages and Construction Loans at FDIC-Insured Banks and Thrifts
Source: Mortgage Bankers Association and FDIC
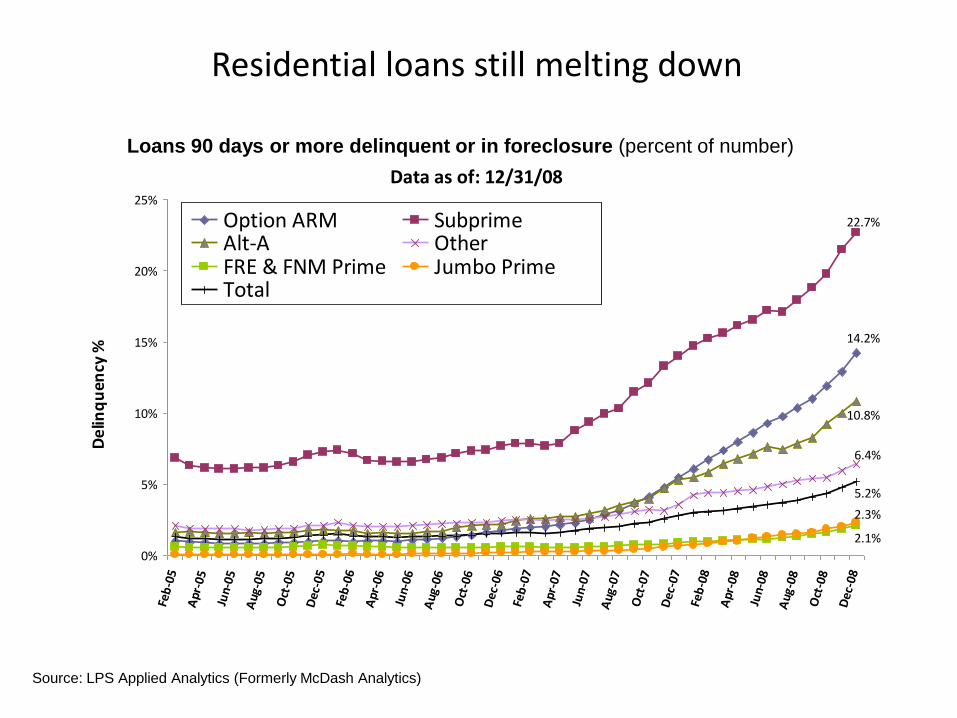
Residential loans still melting down
Source: LPS Applied Analytics (Formerly McDash Analytics)
Serious Delinquency (90+ Days Delinquent including FCL) by Product Type
Data as of: 12/31/08
14.2%
22.7%
10.8%
6.4%
2.1%
2.3%
5.2%
0%
5%
10%
15%
20%
25%
Feb
-05
Apr
-05
Jun-
05
Aug
-05
Oct
-05
Dec
-05
Feb
-06
Apr
-06
Jun-
06
Aug
-06
Oct
-06
Dec
-06
Feb
-07
Apr
-07
Jun-
07
Aug
-07
Oct
-07
Dec
-07
Feb
-08
Apr
-08
Jun-
08
Aug
-08
Oct
-08
Dec
-08
De
linq
uen
cy %
Option ARM SubprimeAlt-A OtherFRE & FNM Prime Jumbo PrimeTotal
Loans 90 days or more delinquent or in foreclosure (percent of number)
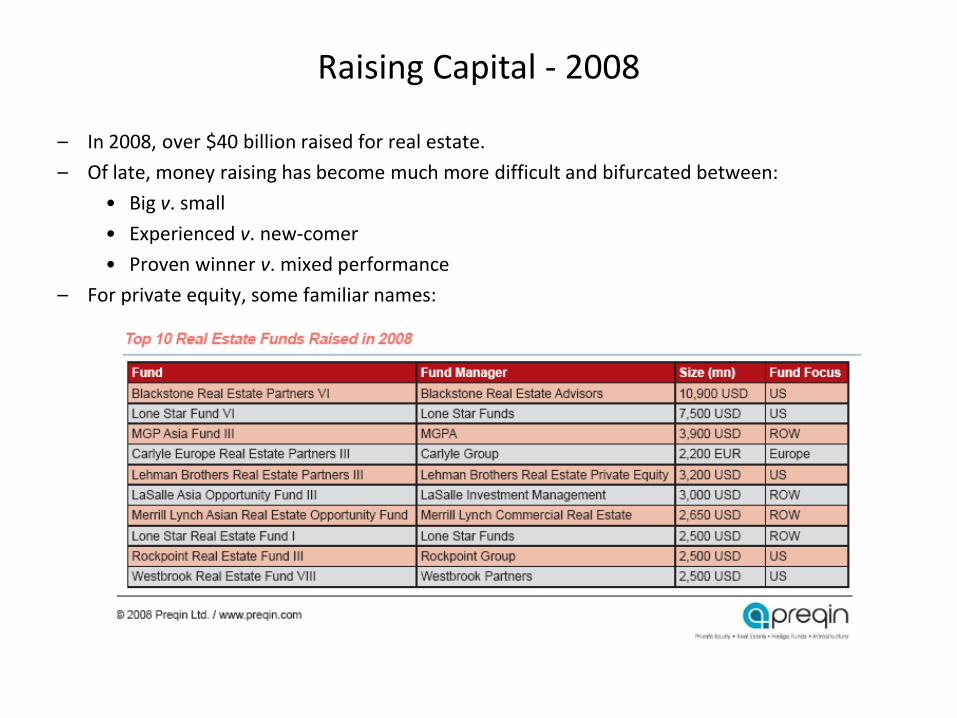
Raising Capital - 2008
– In 2008, over $40 billion raised for real estate.
– Of late, money raising has become much more difficult and bifurcated between:
• Big v. small
• Experienced v. new-comer
• Proven winner v. mixed performance
– For private equity, some familiar names:
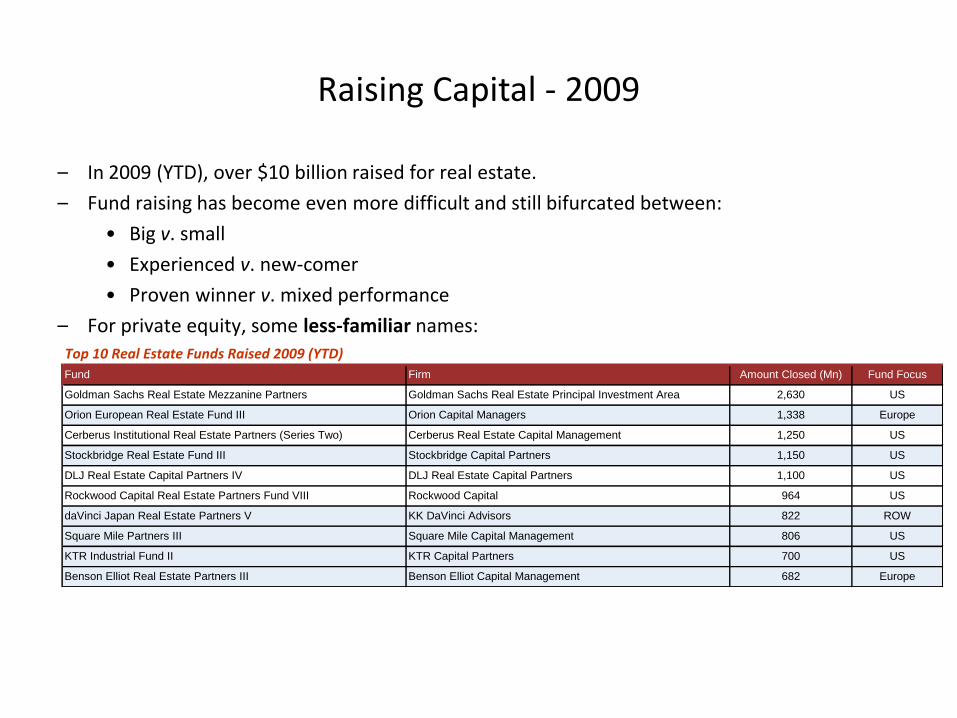
– In 2009 (YTD), over $10 billion raised for real estate.
– Fund raising has become even more difficult and still bifurcated between:
• Big v. small
• Experienced v. new-comer
• Proven winner v. mixed performance
– For private equity, some less-familiar names:Top 10 Real Estate Funds Raised 2009 (YTD)
Fund Firm Amount Closed (Mn) Fund Focus
Goldman Sachs Real Estate Mezzanine Partners Goldman Sachs Real Estate Principal Investment Area 2,630 US
Orion European Real Estate Fund III Orion Capital Managers 1,338 Europe
Cerberus Institutional Real Estate Partners (Series Two) Cerberus Real Estate Capital Management 1,250 US
Stockbridge Real Estate Fund III Stockbridge Capital Partners 1,150 US
DLJ Real Estate Capital Partners IV DLJ Real Estate Capital Partners 1,100 US
Rockwood Capital Real Estate Partners Fund VIII Rockwood Capital 964 US
daVinci Japan Real Estate Partners V KK DaVinci Advisors 822 ROW
Square Mile Partners III Square Mile Capital Management 806 US
KTR Industrial Fund II KTR Capital Partners 700 US
Benson Elliot Real Estate Partners III Benson Elliot Capital Management 682 Europe
Raising Capital - 2009
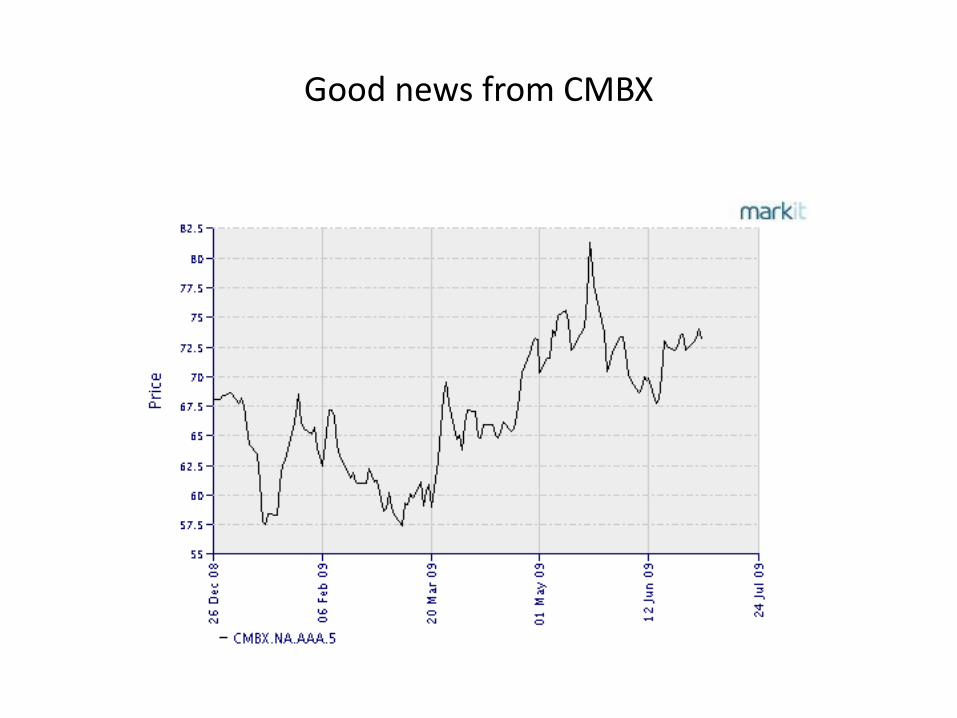
Good news from CMBX
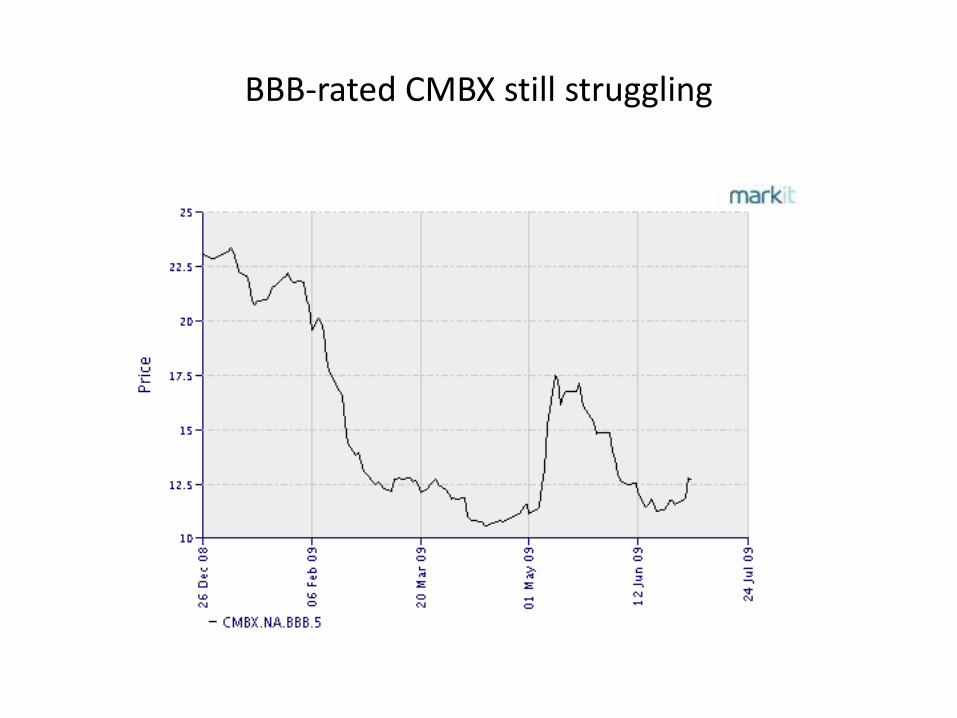
BBB-rated CMBX still struggling
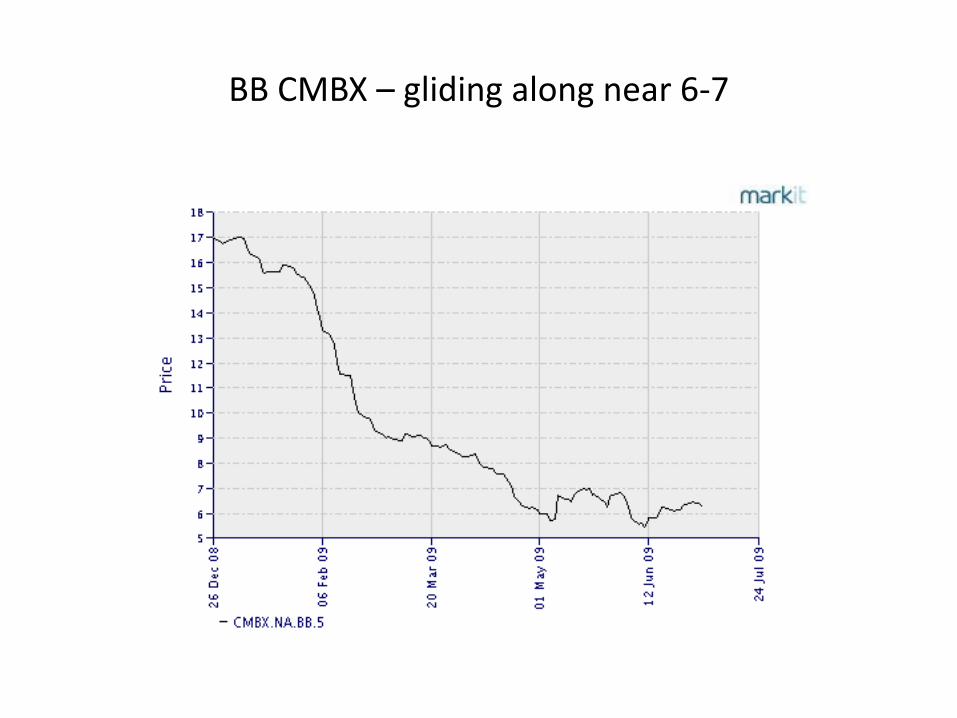
BB CMBX – gliding along near 6-7
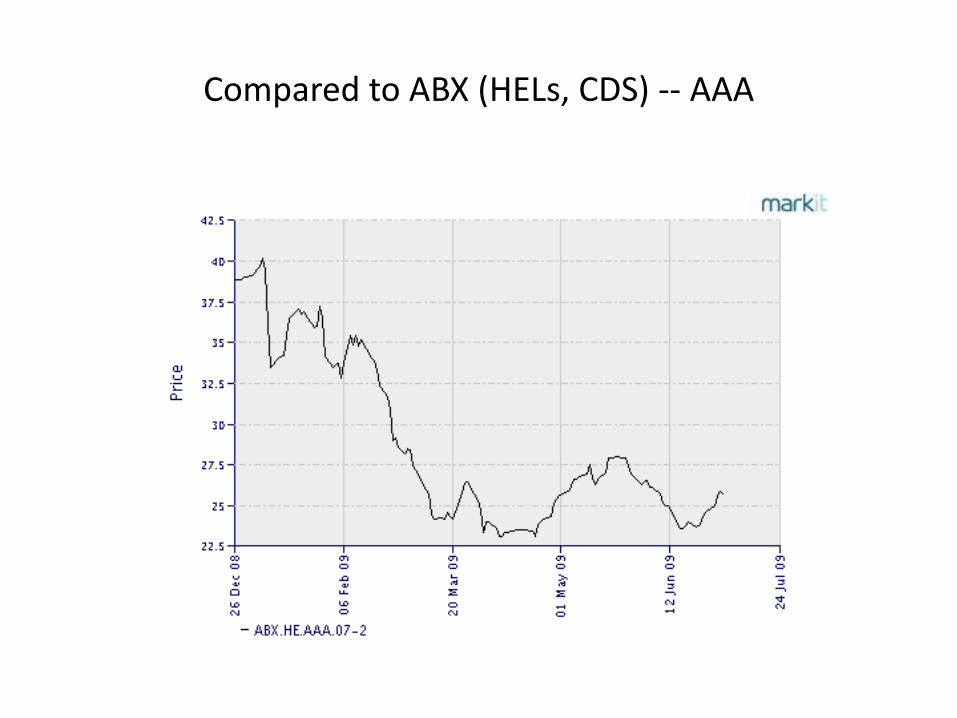
Compared to ABX (HELs, CDS) -- AAA
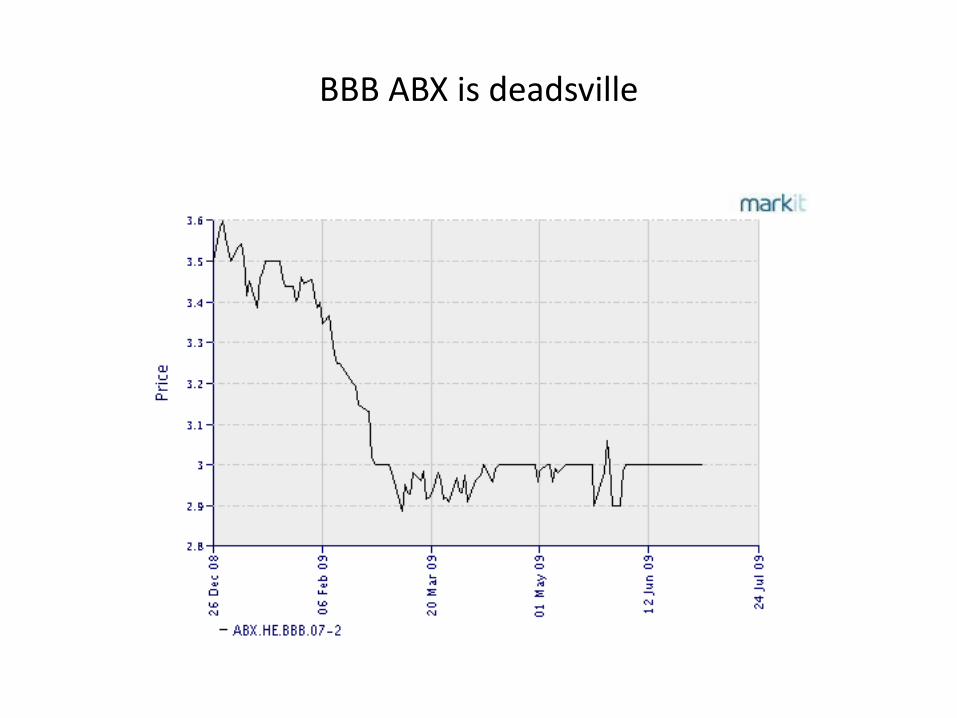
BBB ABX is deadsville
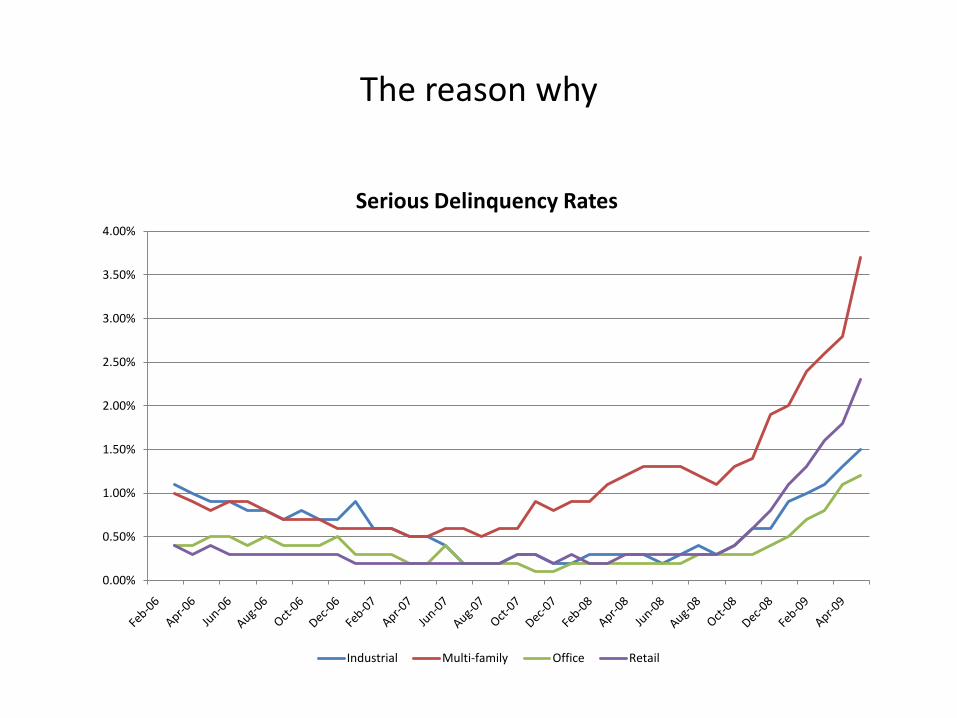
The reason why
0.00%
0.50%
1.00%
1.50%
2.00%
2.50%
3.00%
3.50%
4.00%
Serious Delinquency Rates
Industrial Multi-family Office Retail
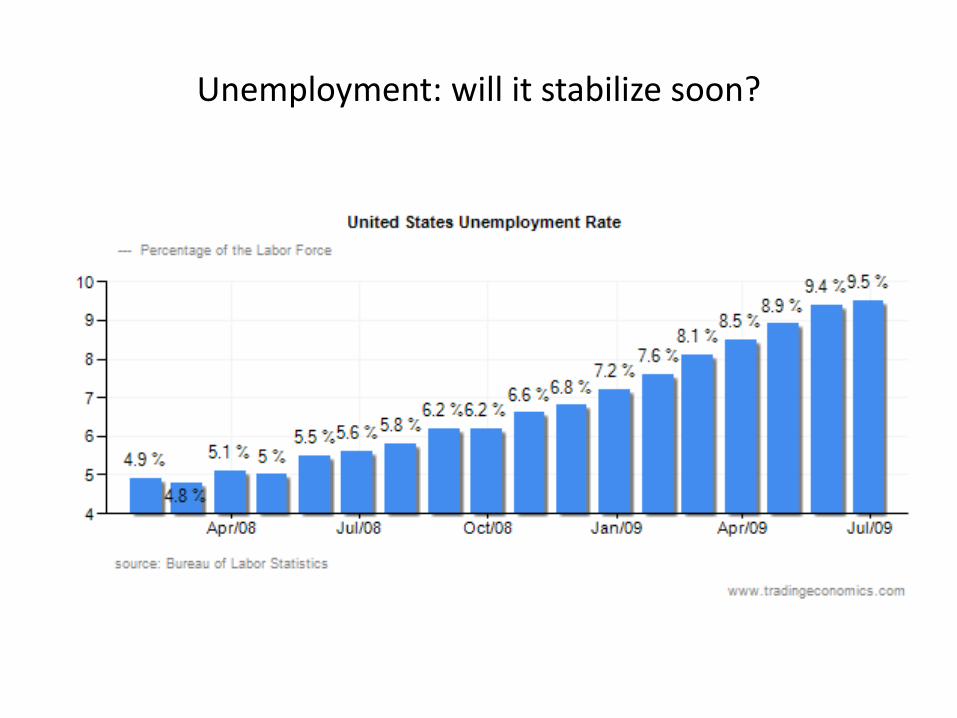
Unemployment: will it stabilize soon?
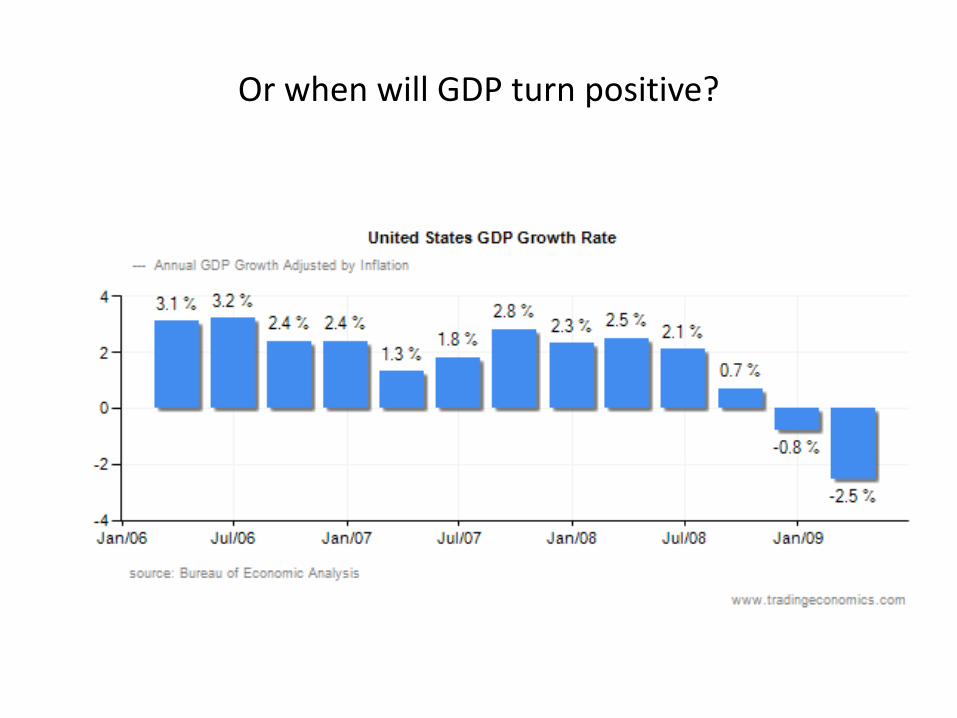
Or when will GDP turn positive?
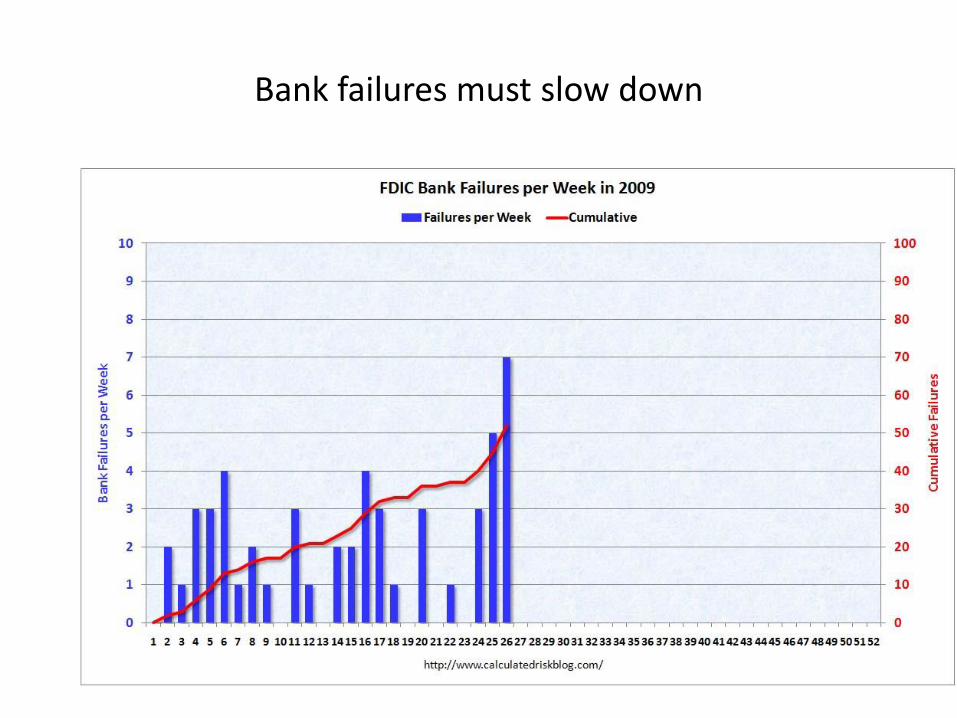
Bank failures must slow down
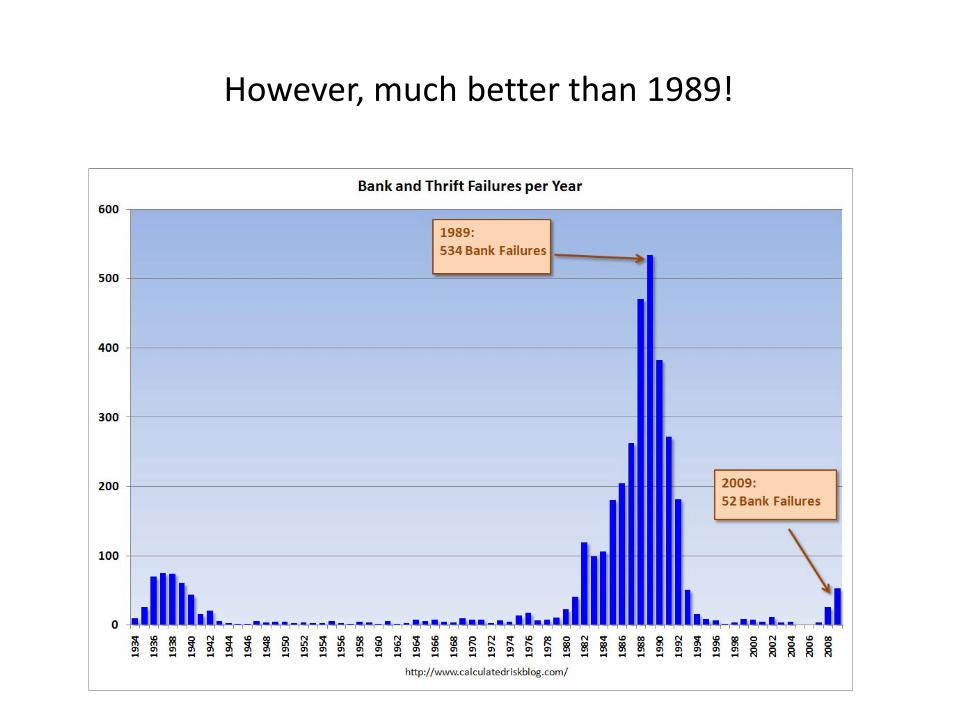
However, much better than 1989!
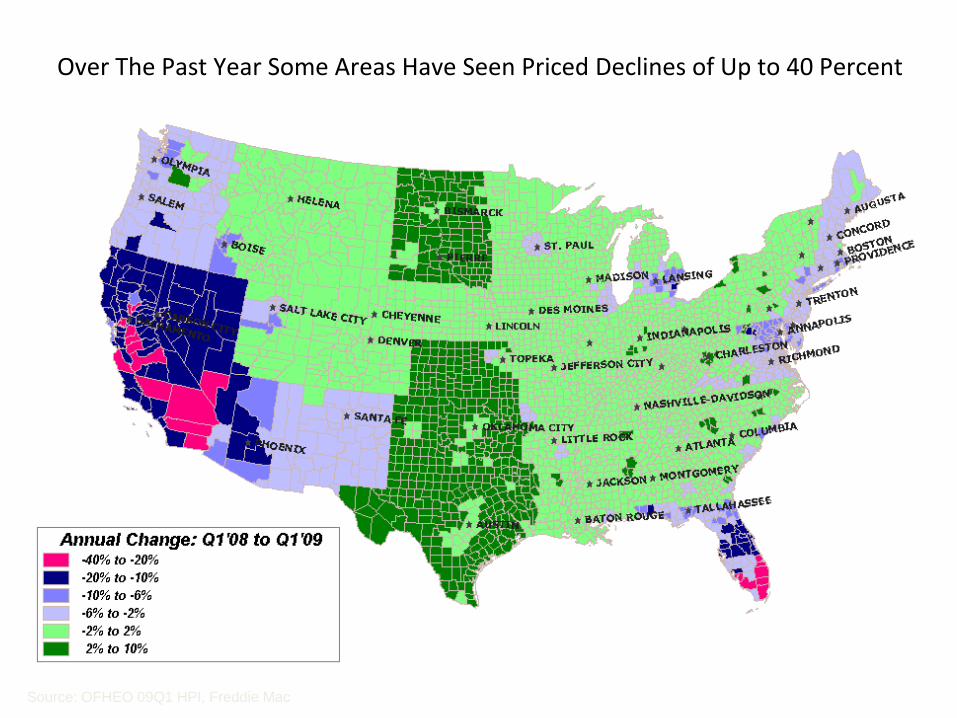
Over The Past Year Some Areas Have Seen Priced Declines of Up to 40 Percent
Source: OFHEO 09Q1 HPI, Freddie Mac
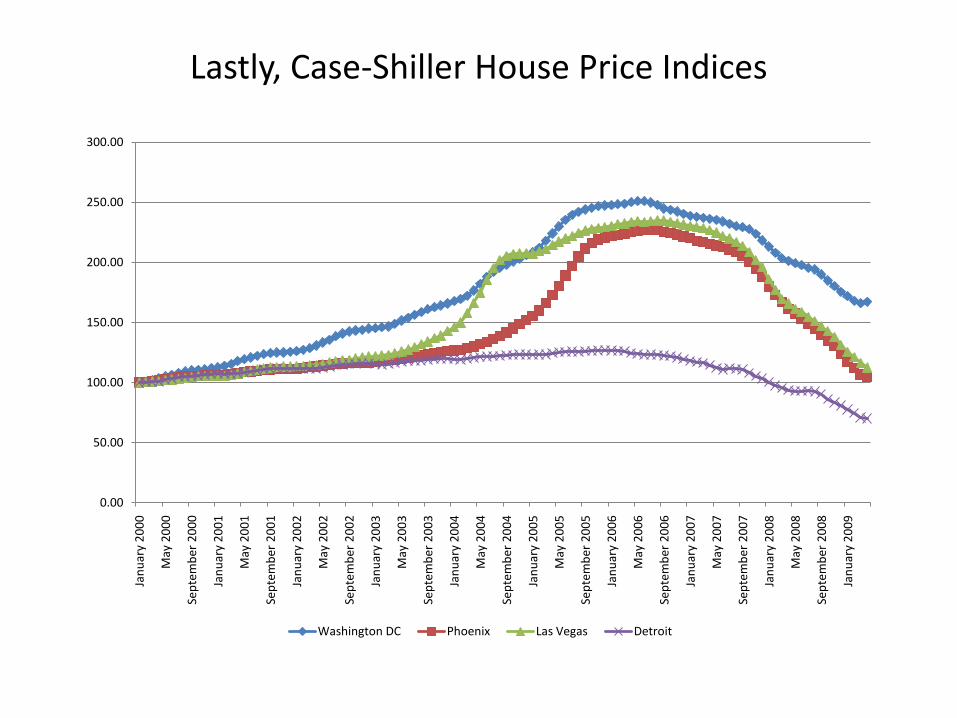
Lastly, Case-Shiller House Price Indices
0.00
50.00
100.00
150.00
200.00
250.00
300.00Ja
nu
ary
20
00
May
20
00
Sep
tem
ber
20
00
Jan
uar
y 2
00
1
May
20
01
Sep
tem
ber
20
01
Jan
uar
y 2
00
2
May
20
02
Sep
tem
ber
20
02
Jan
uar
y 2
00
3
May
20
03
Sep
tem
ber
20
03
Jan
uar
y 2
00
4
May
20
04
Sep
tem
ber
20
04
Jan
uar
y 2
00
5
May
20
05
Sep
tem
ber
20
05
Jan
uar
y 2
00
6
May
20
06
Sep
tem
ber
20
06
Jan
uar
y 2
00
7
May
20
07
Sep
tem
ber
20
07
Jan
uar
y 2
00
8
May
20
08
Sep
tem
ber
20
08
Jan
uar
y 2
00
9
Washington DC Phoenix Las Vegas Detroit

Finale
• Questions?
• Thank you!