inside - indiana university bloomingtonnsse.indiana.edu/pdf/2006_institutional_report/using nsse...
TRANSCRIPT

USING NSSE DATA �
Using NSSE DataNSSE results are being used across all sectors and types of institutions. The examples in this document represent a snapshot of changes in educational policy and practice informed by NSSE data, giving schools a broad overview of the possibilities for using their data in meaningful ways.
Several initiatives at NSSE in the upcoming year will provide opportunities for more in-depth exploration as to how NSSE data can be incorporated into educational decision-making. We are constantly seeking examples and stories of NSSE data use to feature in publications and presentations. The NSSE Institute for Effective Educational Practice continues to schedule regional workshops for NSSE users to help schools better inter-pret their results and learn how other institutions are using their data. The Institute has also developed a Web resource to collect detailed examples to guide schools seeking to get the most from their data. Please share your success stories with us so other institutions can learn from your experiences.
Because NSSE focuses on student behavior and effective educational practice, colleges and universities have found many productive ways to use survey results:
• Assessment and improvement
• General education reform
• Benchmarking
• Alumni outreach
• Accountability
• Grant writing
• Institutional research
• Institutional advancement
• Accreditation & self-studies
• Faculty and staff development
• Retention
• Communication with students
• Institutional communication
• State system performance reviews
Maximizing the Use and Impact of NSSE DataIn order to make the best use of NSSE data, here are some things to consider before, during, and after survey administration:
• Before survey administration begins, generate enthusiasm and commitment to the survey and its results across campus.
• Identify sub-populations of interest such as specific groups of students and/or academic departments.
• During the administration period, develop a communications strategy to get people to attend to and take interest in the findings.
• Identify peer or aspirational institutions.
• Once Institutional Reports are received, corroborate student engagement results with other data sources to increase confidence in using the results.
• Translate data into action.
Inside
1 Maximizing the Use and Impact of NSSE Data 2 Lessons Learned About Using NSSE Data 3 Establishing Standards of Comparison 4 Communicating Results 6 Institutional Improvement Examples11 Coordinated Uses of NSSE Results12 Public Disclosure of Student Engagement Results13 Overcoming Potential Obstacles to Using NSSE Data Effectively

USING NSSE DATA �
Lessons Learned About Using NSSE DataBased on the collective experience of NSSE schools, we offer the following suggestions for incorporating NSSE data in institutional change efforts.
1. Make sure faculty and staff understand the concept of student engagement. The value of student engagement results to improving teaching and learning needs to be convincingly explained to those faculty less familiar with assessment in general and the engagement concept in particular.
2. Collect results from enough students so the information is usable at the department or unit level. Surveying more students than called for by NSSE’s standard sampling strategy can allow schools to drill down to the department or unit level, which may increase faculty interest in using engagement data.
3. Understand what student engagement data do and do not represent and use the results wisely. It takes time, perspective, and experience to understand and make the best use of NSSE results.
4. Report student engagement results in a respon- sible way. NSSE encourages schools to share their results in ways that lead to a better under- standing of collegiate quality and promote institutional improvement efforts.
5. Don’t allow the numbers to speak for themselves. Every number and comparison reported should be accompanied by an explana- tion and interpretation of what can and cannot be concluded from the results. Create opportu- nities for conversations that can help people better understand the results and their implications.
6. Examine the results from multiple perspectives. Use peer comparisons to confirm or challenge assumptions about performance quality, but
also consider a criterion-referenced view of student engagement in the context of the school’s mission. It is also wise to compare the engagement levels of specific student groups, such as first-year women students or seniors in various majors.
7. Link the results to other information about the student experience and complementary initia- tives. The positive impact of student engagement results will be multiplied if the data can be made relevant to groups of faculty and staff working on different reform efforts around the campus.
8. Don’t go it alone. Experts argue that the chances of successful innovation improve when campus teams are formed and institutions work together in consortial arrangements on topics of mutual interest. Greater success may be achieved when institutions develop these partnerships at the start of a NSSE administration cycle to make early decisions about strategic use of the data.
How Often to Use NSSE?
On average, a school’s NSSE results do not change dramatically from one year to the next. Knowing this, NSSE recommends that an institution use the survey every three to four years. That said, some colleges and universities have specific reasons for using NSSE more frequently, even annually. For example, some schools want data every year for longitudinal tracking purposes or to monitor the impact of specific
NSSE TIP #�: NSSE on the Web
Many colleges and universities have disclosed some or all of their results on the Web. This is an appropriate way to highlight institutional strengths, and demonstrate your school’s commitment to quality improvement.
Some NSSE schools display their entire means and frequency reports. Others post selected results highlighting particular strengths or news releases emphasizing institutional participation and the importance of the study.

USING NSSE DATA �
“The NSSE results catalyzed additional, qualitative research….together, the quantitative and qualitative data provide a richer picture of students’ experiences.”
—Erin Frew, Director of Assessment, Indiana University-Purdue University Fort Wayne
in ongoing academic activities. The NSSE data have the potential to provide an external point of reference with nationally normed data for assessing cadets’ achievement of USMA academic goals.
• Augusta State in Georgia compares its NSSE results on both the national and institutional level, but as a consortium participant in the Georgia State System, they compare perfor- mance with other in-state institutions.
Criterion Approach
A second approach to benchmarking is criterion-refer-enced, whereby you compare your school’s performance against a predetermined value or level that you and your colleagues deem appropriate for your students, given your institutional mission, size, curricular offerings, funding, and so forth.
• Swarthmore College selected a number of NSSE items central to its institutional mission and reported to its board of trustees and president’s staff about the degree to which its student engagement results were consistent with its mission.
• Saint Francis University revised its data report format to clearly link all NSSE items with its new general education learning outcomes. These learning outcomes will be also linked to the school’s reframed institutional goals. This will help inform budgetary decisions and institutional planning processes.
• Jacksonville University triangulates NSSE’s Benchmark Report, its institutional mission statement, and certain strategic objectives. The data are used in combination to answer the question, “Are we on track to accomplish- ing our mission by 2010?”
• Beginning with the 2005 academic year, all de- partments at Central Missouri State University (CMSU) received a data pack that included information on departmental programs assessed in a number of key areas (e.g., student quality and faculty productivity). NSSE data comprised part of the data pack. The university will estab- lish standards of performance for the various measures in the data pack and a program “re- port card” will be produced. Each department’s progress towards attainment of the standards will be evaluated and reviewed annually by
improvement initiatives. Bridgewater State College uses NSSE data to inform its planning processes and to assess campus programs and decided to move to an annual administration to better inform the institutional assessment process. Sometimes NSSE participation is linked to an institution’s accreditation cycle. For those institutions using NSSE in their accreditation process, the Accreditation Toolkit section of the Institutional Report contains more information that may help you determine the frequency of administering the survey. Still others are using NSSE to obtain information they can use in funding proposals. Ideally, NSSE should be used in combination with other assessment tools to capture a comprehensive picture of the college student experience.
Establishing Standards of ComparisonNSSE data serve a diagnostic function by identifying institutional strengths and weaknesses in terms of effective educational practices. Comparisons with peer institutions and the national averages help reveal aspects of institutional and student performance not readily available from other sources.
Benchmarking
There are two basic approaches to benchmarking that NSSE schools are using. One or both may be appropriate, depending on your institution’s situation.
Normative Approach
The normative approach compares your students’ responses to those of students at other colleges and uni-versities. If enough students have participated, this can also be done at the department or major field level – a particularly effective way of stimulating faculty interest in the findings.
• The Indiana University South Bend Institutional Research Office was asked to track certain metrics, such as how much time students spend working off-campus. Institutional research staff compared their students’ responses with other master’s institutions. Being a one-person office, this approach was an efficient way to monitor students’ responses and behavior patterns in a comparative way.
• Xavier University of Louisiana formed a team to address the areas in which they would like to improve. The team identified these areas by comparing their performance with other institu- tions and with past NSSE performance.
• The United States Military Academy (USMA) assesses its academic program goals through surveys of cadets, surveys of graduates and commanders, and through indicators embedded

USING NSSE DATA �
deans and the provost. The information allows departments to identify areas of strength and weakness and provide the information needed to continuously improve programs. The results, along with other information in the departmental annual report, will guide action planning and resource reallocation. The same strategy will be used for the student support services areas. The Student Life division of CMSU’s Student Affairs Office has been using Cooperative Institutional Research Program (CIRP), Your First College Year (YFCY) and NSSE data to guide department programming and program evaluation for the past three years.
Communicating Results Institutions often use several approaches to share their results. It is usually most effective to use a combination of dissemination strategies.
Selected Audiences
Targeting specific audiences that may have expressed an interest in, or that should be aware of, one or more aspects of the results can facilitate focused dialogue about implications of the findings for policy and practice.
• At the University of Vermont, every dean received university-wide NSSE results as well as their individual college or school data. Some deans share the information with their department chairs and faculty committees. The Institution also collaborates with the university communications offices to provide information about NSSE results to alumni, the media, and prospective students.
• The college assessment director at Providence College prepared a comprehensive special analysis featuring NSSE data in addition to other assessment measures. The report was distributed to several campus constituencies including the Core Curriculum Committee, which is composed of faculty and other decision makers on campus.
• The University of North Florida sought to proactively build a sense of partnership around NSSE administration. To more fully involve both student affairs and academic affairs in the assessment process, the NSSE institutional review board (IRB) application was routed primarily through the student affairs division in partnership with academic affairs. This partner ship prompted discussions between the divisions on decisions about sampling and survey protocol.
Extended Audiences
To distribute NSSE results broadly, many schools post summaries of important findings and invite colleagues to review the full report online or by request through the appropriate office. Another way to share results is to post them to internal or public Web sites or create displays in public areas such as student unions or dining halls. Various colleges and universities provide information via news releases and special feature articles for student, local, and regional newspapers. Some schools choose not to share their data with external audiences and use it solely for institutional improvement, others delay public data sharing until triangulating the results with other institutional data.
• At the School of Visual Arts, NSSE data represent one among several sources of information used to identify topics for discussions about campus issues. Enrollment management, curriculum development, retention, and faculty development are all informed by the data as it is used to guide discussions within all of these areas.
NSSE TIP #� Peer Comparisons
To assist in benchmarking efforts, NSSE allows schools to select other participating institutions for peer comparison reports with a minimum of six schools in the aggregated request.
Starting with the 2005 administration, in addition to the standard comparison groups, schools not already participating as part of a consortium or state system were given the opportunity to select an additional group of peer institutions within the annual survey cohort at no charge.
NSSE also conducts specialized analyses on an as-needed basis to assist schools in answering specific questions (e.g. how do our women engineering students compare with other women engineering students from across the country?). The fees for special analyses are based upon time required to complete the project. Please contact your NSSE representative for more details.

USING NSSE DATA �
• Iowa State University has participated in NSSE since 2000 and uses the results in several ways. A summary of the results comparing Iowa State with the national norms and peer-university benchmarks is prepared annually by the Office of Institutional Research and presented at a President’s Council meeting. The summary report is posted at the Office of the President’s Web site following the presetation.
• At William Woods University, the Academic Dean established the Academic Challenge NSSE benchmarks as the focus for this year. She conducted sessions with the entire faculty in which they reviewed NSSE results, and then were assigned departments to develop strategies for addressing the level of this benchmark.
• Medaille College established an Institutional Effectiveness Task Force, a group established to review institutional assessment, which dedicates time to determining what data to share externally on Web sites and through other media.
• Accreditors are the most common external audience for NSSE results. Examples can be found later in this document, and more detailed information is located in the Accreditation Toolkit section of the NSSE Institutional Report binder. Governing boards, state oversight agencies, and university systems also are expressing interest in student engagement data.
Posting Your Results on the Web
As previously mentioned, a growing number of colleges and universities report their NSSE results on institutional Web sites. In order to promote and facilitate such public reporting, we encourage schools to use a standard Web protocol for posting NSSE information on campus Web sites. If at all possible, we ask that you post your NSSE information using the following address: www.[insert the appropriate name or letters of your insti-tution].edu/nsse. For example, Indiana University Bloom-ington would post its NSSE results at www.iub.edu/nsse. Earlham College would post its results at www.earlham.edu/nsse, and so on. For most colleges and universities, rather than creating a separate NSSE page, it will likely be easier to have your information technology depart-ment establish a simple re-direct for the new NSSE Web protocol address that links to your existing institutional research office Web site or wherever you post your NSSE results. Thus, if another institutional researcher types in the recommended NSSE protocol Web URL for a respec-tive institution, it would automatically take them to the Web page where NSSE results are found on campus (such as the institutional research office, assessment office, and so forth).
If this is unclear or if you have questions please contact NSSE at 812-856-5824. Thanks for your help in mak-ing student engagement results more widely accessible, understood, and used!
“The NSSE data is one among several pieces of information that is used to organize discussions about enrollment management, curricula, retention, and faculty development.”
—Christopher Cyphers, Provost, School of Visual Arts
How Schools Communicate NSSE Results
INTERNAL USE %
President 81
Faculty Members 74
Administrative Staff 75
Department Chairs 64
Academic Advisors 49
Governing Board 35
Students 31
Other (Web site, fact book, etc.) 18
EXTERNAL USE %
Accreditation Agencies 34
Web Site 22
Media 13
Prospective Students 11
Alumni 10
Parents 11
State Agencies 14
Professional Conference Presentation 10
Other 17
No External Disclosure 24
Source: NSSE 2005 Report Card

USING NSSE DATA �
Institutional Improvement ExamplesIn this section we offer examples of how colleges and universities are using NSSE data for different purposes.
Civic Engagement
• Albany State University uses NSSE data to support its service learning and mentoring programs. Given its commitment to provide quality education for many first-generation and underserved students, they reach beyond the campus community to businesses, government, and non-profit agencies. NSSE data help them monitor the level of civic engagement of its students and provides supporting rationale for such programs.
• The American Democracy Project, a joint venture of the American Association of Colleges and Universities and The New York Times, seeks to increase undergraduate participation in civic life. NSSE’s assessment of student and civic engagement at participating colleges and universities will help gauge the effectiveness of programs designed to foster this involvement.
General Education• In addition to receiving NSSE results, Brigham Young University Hawaii also conducted student focus groups to supplement its NSSE data.The results from the focus groups in concert with NSSE data were used to track the level of academic challenge students reported by ethnicity to better understand the experiences of students from different backgrounds and how their learning can be enhanced. Specifically faculty and staff have examined teaching style, faculty interaction, and how test questions are written.
• Illinois Wesleyan University will use NSSE results in concert with other assessment information as it implements the teaching and learning goal in its recently approved strategic plan.
• In addition to other data, NSSE results have prompted several positive actions at the University of Georgia. The provost appointed a task force on general education and student learning. Some of the major recommendations in the task force report spring from NSSE data. For instance, there is an increasing emphasis on academic rigor and a development of ways for student to do more writing.
• General Education and NSSE, a report com- piled by the South Dakota Board of Regents, presents data from the both NSSE and the Faculty Survey of Student Engagement (FSSE). Following background information on the surveys, a review of the principles of good practice, and a general education review report matrix, the paper presents table displays of NSSE results.
• Truman State University developed a General Education Matrix to monitor state-level goals to Truman’s institutional competencies, supporting courses and associated assessment instruments to measure performance.
NSSE Tip #� Using NSSE Multimedia Resources to Increase Awareness and Buy-in
Included with the Institutional Reports are a professionally produced video and a PowerPoint template into which you can insert institution-specific results to introduce the student engagement construct and how NSSE measures it.
Schools can use these materials as part of faculty workshop sessions or presentations to student government or trustees to give an overview of what NSSE entails.
NSSE Institute Services
NSSE Institute associates are available to provide direct assistance to individual institutions or university systems.
Regional Users Workshops — NSSE staff and institutional representatives facilitate daylong workshops throughout the year to help schools make the most of their data.
Campus Audits — NSSE staff can con-duct comprehensive or targeted campus audits to identify institutional strengths and weaknesses.
Consulting — NSSE staff can help develop improvement initiatives and address accreditation or other campus goals.
Presentations & Conferences — NSSE staff may be available to participate in panels or research presentations at professional meetings and conferences.
Workshops and Retreats — NSSE staff can assist with presenting information at faculty and staff workshops and retreats.

USING NSSE DATA �
• The University of Nebraska at Kearney General Studies Council identified NSSE items to serve as indicators for the general objectives of the General Studies Program. These items were incorporated into the Council’s General Studies Assessment Plan as indirect measures of student engagement. The items were found to be a particularly good fit for its program, because freshmen are typically enrolled exclusively in General Studies Program courses. The results for the three baseline years are currently being analyzed. Recommendations regarding faculty development and related General Studies Program initiatives will be derived from these analyses.
• The University of Nevada Reno used NSSE data pertaining to general education in combination with similar items on in-house alumni and employer surveys to triangulate, and subsequently, corroborate subjective assessments of the core curriculum.
Active and Collaborative Learning
Research shows students learn more when they are intensely involved in their education and asked to think about what they are learning in different settings. Collaborating with others in solving problems prepares students for the messy, unscripted problems they will encounter daily, during and after college.
• Centre College uses NSSE results to improve active modes of learning. Specifically, faculty members began to incorporate more active learning type activities within their upper-level courses.
• Ringling School of Art and Design uses NSSE data as part of a larger assessment program related to students’ activities and learning experiences. This larger picture contributes to the decision making process at all levels.
• Hendrix College has established a program called “Your Hendrix Odyssey” that requires students to complete at least three experiential learning projects before graduation. Students
embark on educational adventures, such as research, study abroad, artistic creativity, and service projects.
• The University of Toronto uses NSSE results to determine the impact of several student-experience initiatives already introduced or in development, such as the University’s first-year seminar courses in the faculty of arts and science and the planned creation of small “learning communities” within larger first-year science classes.
Supportive Campus Environment
Students perform better and are more satisfied at colleges that are committed to their success as well as the working and social relations among different groups on campus.
• An annual report is prepared for the Ursinus College faculty related to the benchmarks and additional reports on specific areas related to the assessment of core curriculum issues. As a result, during the 2005-2006 academic year, diversity was the topic being examined most closely on the campus.
• Colby-Sawyer College has put forth greater efforts to improve diversity-related campus programming in addition to increasing programs related to spirituality.
• Based on NSSE results and collaborating data from other sources, Medaille College is more actively examining how to enhance multiculturalism and internationalization long-term.
Involving Students in Interpreting NSSE Data
Some schools are making strong efforts to share their NSSE data with undergraduates, inviting them to help interpret the results. Student representatives are included on assessment committees at some institutions. Sharing results with student government and other student organizations are other ways to involve students in seeking ways to enhance student engagement.
• After receiving NSSE data, New England College presented results to students and talked with them about their perceptions of the campus.
“Our use of the NSSE data for institutional planning is one example of how NSSE results have provoked thought, prompted discussion, and promoted change on our campus.”
—Suzanne Pieper, Assessment Specialist, Truman State University

USING NSSE DATA �
• At the University of Maine at Farmington, professional staff members visit classrooms to show students how its responses are being interpreted and used by the University to inform decisions.
• Illinois State University is planning a series of programs with the Student Government Association that will focus on engagement, drawing on its five-year NSSE findings as well as information from FSSE.
Enriching the Undergraduate Experience
Several schools have responded to their NSSE results by increasing opportunities to study abroad, adding service-learning components to courses, creating living-learning communities, and further developing capstone experiences for seniors.
• Grand View College is initiating transfer student learning communities and a residential learning community in Fall 2006. Faculty development activities reinforce themes of learning--centered pedagogies and active learning.
• The University of Texas of the Permian Basin charged its institutional BEAMS (Building Engagement and Attainment of Minority Students) team with designing projects to increase student participation in community service and service learning activities.
• Calumet College of Saint Joseph is piloting a new program to provide students with an opportunity to participate in international service learning experiences.
• The Iowa State University Research Institute for Studies in Education (RISE) analyzed its NSSE data to determine whether participation in a learning community at Iowa State is linked with student engagement, gains in educational outcomes, and overall student satisfaction.
These reports have been shared with the deans and associate deans of the colleges. The results have also been presented at the annual Iowa State Learning Community Institute and shared at national presentations on the Iowa State Learning Community program.
Faculty and Staff Development
NSSE results can be used productively in faculty and staff development workshops and retreats, such as those sponsored by the local chapter of The Carnegie Academy for the Scholarship of Teaching and Learning (SOTL). Presenting student engagement data is one way to initiate discussions about a variety of teaching and learning issues, and the use of FSSE can be used to compare faculty and student perceptions.
• The University of Wyoming Center for Teaching and Learning facilitates presentations for faculty about NSSE results. After participating in FSSE, the institution will focus on two or three areas where the data indicate improvement in teaching and learning are desirable.
• The United States Naval Academy Faculty Senate Assessment Committee reported on the school’s NSSE results the full Faculty Senate in March. Several community conversations are planned for Fall 2006. They will meet with faculty in the divisions of Engineering, Math and Science, Humanities and Social Sciences, and Professional Development to discuss how they might use NSSE data to improve its programs.
Enrollment Management and Recruiting
NSSE data are also used to provide more accurate and realistic descriptions of campus life to prospective students and parents. Some schools use NSSE data to present empirically-derived portraits of the typical student in viewbooks, recruitment literature, brochures, and gatherings of prospective students to accurately convey expectations for college life. Others use NSSE results to guide decisions about institutional size.
The recently revised NSSE report, A Pocket Guide to Choosing a College, provides prospective students with a list of questions organized around NSSE benchmarks to help them focus on issues of student engagement as they investigate various college options. Copies of the guide can be provided to high school guidance offices as well as college and university admissions offices. For-profit organizations can order copies for a small fee. Schools with NSSE data can design publications and train staff to answer the questions students might ask based on this guide. To access the Pocket Guide online and get

USING NSSE DATA �
For more information on applying NSSE to accreditation please see our Accreditation Toolkit, which is available under a tab in the Institutional Report binder or at the NSSE Web site: www.nsse.iub.edu. The toolkit provides guidelines for using NSSE in accreditation self-study and maps NSSE items to accreditation body standards.
Student-Faculty Interaction
The level of student interaction with faculty members is a frequently expressed concern. For instance, some small liberal arts colleges were surprised to find that
NSSE Research
The following publications provide detailed information about national data and benchmarks
NSSE Viewpoint — This annual pub-lication provides a condensed overview of NSSE findings for that year as well as guidelines for interpreting the data.
Annual Report — The Annual Report summarizes major findings for the year and highlights ways that schools are using NSSE data to improve collegiate quality at their institutions. The report also outlines the NSSE conceptual framework and lists which schools have participated.
NSSE Technical and Norms Report — This report provides technical and statistical information, in addition to descriptive statistics for first-year students and seniors, broken down by class, sex, race, age, enrollment status, major field of study, and Carnegie classification.
Comparative Data on NSSE Bench-marks — Tables on NSSE’s Web site show the specific items that make up the benchmarks by class and by Carn-egie classification. Another column reports results for schools scoring in the top five percent nationally.
Research Papers — NSSE staff have published a number of articles focusing on specific areas of the results, as well as the research methodology. Details can be found on our Web site (www.nsse.iub.edu/html/research.htm).
“NSSE is part of a larger picture that is drawn through numerous sources about the activity and experiences of our students and their relationship to learning. This larger picture contributes to the decision making process at all levels.”
—Alison Watkins, Director, Student Outcomes Assessment, Ringling School of Art & Design
information about ordering copies, please visit www.nsse.iub.edu/html/pocket_guide_intro.cfm.
• The College of St. Scholastica’s Admissions Office uses selected data from the benchmark report to monitor its first-year students’ academic experience, and how it is enriched by the time they are seniors.
• At Hanover College, NSSE data have helped steer the strategic plan in two ways. The strength of senior versus first-year results overall has caused them to focus improvement (enhanced programs and added faculty) disproportionately in the first two of the four years. Furthermore, lower scores on Supportive Campus Environment versus other areas led to two of the five initiatives in the strategic plan – developing a permanent Student Success structure within a new Enrollment Management framework, and a “campus culture and engagement” initiative.
Accreditation
As mentioned earlier, about one third of NSSE schools use student engagement data in accreditation, both for regional and discipline-specific reviews (teacher education, social work, music, nursing, business, etc.).
• Daemen College used findings from NSSE during a regional accreditation visit to support work done on its core curriculum and to provide evidence that opportunities for specific educational outcomes are indeed available and experienced by its students.
• Wayne State University is using NSSE/FSSE in its 2007 NCA Reaccreditation Self-Study and has made available on its institutional research Web site the data for all years in which it participated.
• In conjunction with the vice provost for Under- graduate Programs and the Center for Excellence in Learning and Teaching, the Iowa State University Research Institute for Studies in Education (RISE) conducted a longitudinal analysis of NSSE data in 2004 in support of institutional efforts to prepare its self-study related to accreditation.
USING NSSE DATA �0
students did not report as much contact with faculty as institutional leaders expected. NSSE results related to student-faculty interaction are also disquieting for many research-intensive universities.
• After reviewing its NSSE results, Grand View College has initiated a faculty-student engagement grant program where instructors can apply for funds to host engagement activities with students outside of class.
• To increase student-faculty interaction, the provost at George Mason University provided funds to encourage academic units to hold various kinds of student/faculty get-togethers. One result was an afternoon social set up in the hallway of a classroom building so that students would not feel intimidated about stopping and talking with faculty. Two staff members from the Office of Institutional Assessment conducted brief interviews with student participants to evaluate their reactions to the event. Although the number of students participating was small, those who did were quite happy to have this opportunity to interact with faculty. As a result of this activity, the vice president for University Life is assuming responsibility for planning such department-related events this coming academic year.
• The California State University-Fresno president formed a Student Success Task Force to identify ways to improve student success based on its NSSE results, which showed that student-faculty interaction was lower than expected. As a result, Cal State at Fresno submitted a proposal to the BEAMS program to develop the Mentoring Institute. The proposal was accepted and a campus team participated in the 2004 BEAMS Summer Academy, returning to campus with an implementation plan. The Mentoring Institute began Fall 2005 and has resulted in the recruitment and training of over 200 faculty members, staff and student mentors.
First-Year Experience
First-year experience programs are commonplace today. Student responses to these items can assist institutions in determining the effectiveness of those first-year experience programs.
• Information generated from NSSE and subsequent discussions at Georgian Court University indicated a need to revise its first- year experience program. The first-year experience program now provides activities to ensure students are interacting with faculty outside of class and are involved in a certain
number of campus activities. First-year students also have the opportunity to now participate in a first-year abroad experience, in addition to service learning opportunities. A commuter campus, Georgian Court has experienced an increase in first-year retention numbers since implementing the revised first-year experience program.
• From analysis of NSSE data and other indicators, such as the State University of New York (SUNY) Student Opinion Survey, SUNY Plattsburgh created a new office for first-year programs. The University has also created a newresidential living-learning program for
“Our Center for Excellence in Learning and Teaching is so grateful to have the (NSSE) benchmarks which clearly identify areas of needed attention and create interest in topics we hold near and dear.”
—Corly Brooke, Director, Center for Excellence in Learning and Teaching, Iowa State University
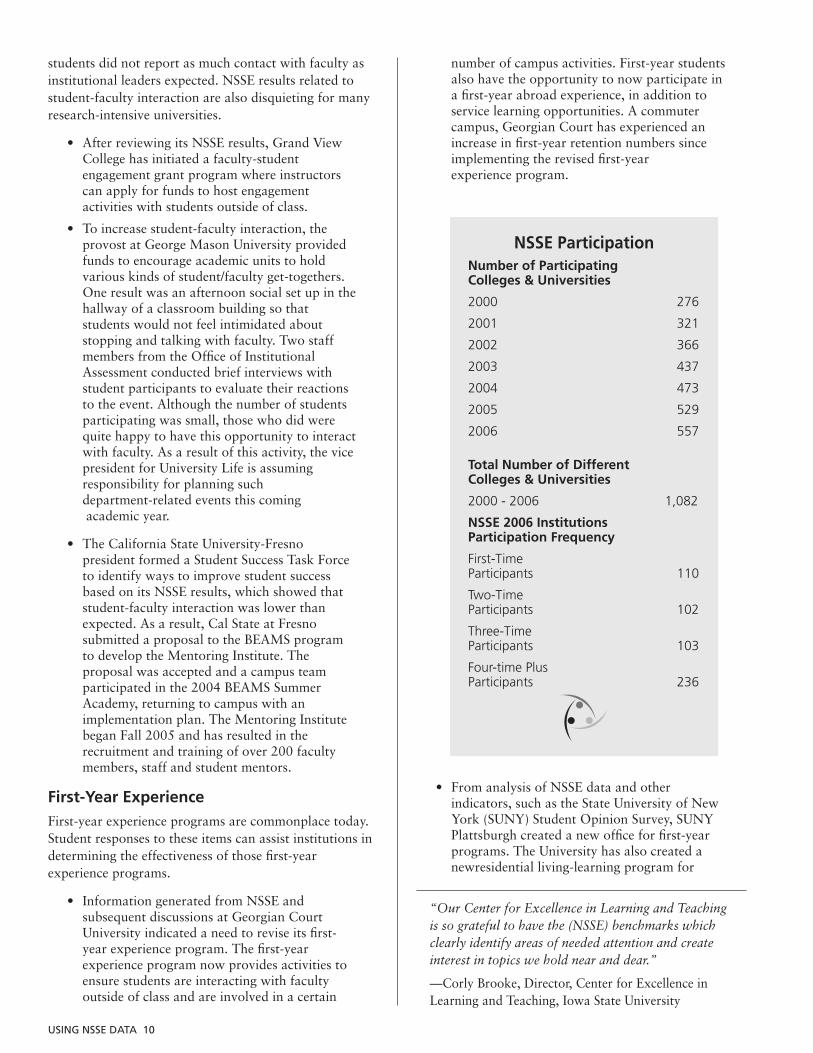
NSSE ParticipationNumber of Participating Colleges & Universities
2000 276
2001 321
2002 366
2003 437
2004 473
2005 529
2006 557
Total Number of Different Colleges & Universities
2000 - 2006 1,082
NSSE 2006 Institutions Participation Frequency
First-Time Participants 110
Two-Time Participants 102
Three-Time Participants 103
Four-time Plus Participants 236

USING NSSE DATA ��
NSSE Tip #� Linking NSSE Data with Other Sources
NSSE results can and should be linked to other data sources on campus to determine whether improvement efforts are having the desired effect.
Some schools want multiple years of data before taking action. Other institutions corroborate NSSE results with existing evidence and are confident in moving ahead to address areas of concern, such as student use of technology, increasing the amount of assigned reading and writing in certain majors, and quality of academic advising.
effect diagrams to uncover areas of concern and determine five root causes. Finally, the Team merged the five root causes into two with corresponding recommendations and rationale.
• The University of Wisconsin System (UW) accountability report for 2004-2005, Achieving Excellence, presents a balanced approach to system-wide accountability reporting that reflects a broad spectrum of stakeholder interests. Achieving Excellence focuses on two approaches to the measurement of university performance. First, it presents the UW System’s progress toward its goals for specific student and institutional outcomes. Second, it examines the ways in which the UW provides positive campus environments that promote learning and student achievement.
Coordinated Uses of NSSE ResultsIn the first seven years, more than 550 colleges and universities participated in 50 self selected consortia and systems representing different types of institutions. They include women’s colleges, urban universities, Jesuit institutions, engineering colleges, art and design colleges, and research universities. Institutions participating in consortia or state systems typically share results with a central office, though some communicate directly with other members of the group.
The eleven campuses in the University of Wisconsin system twice coordinated NSSE administrations as a system, yielding comparable indicators for the system’s annual Achieving Excellence accountability reports. This approach allows for system-wide assessment while also providing each institution with data to guide local initiatives.
NSSE results can be linked with information from academic transcripts, retention studies, focus groups, and results from other surveys to develop a rich, comprehensive picture of the undergraduate experience.
first-year students that encompasses about 25 percent of the first-year class and has begun new retention efforts aimed at students identified as at-risk.
• University of Maryland Baltimore County (UMBC) uses NSSE data specifically with faculty who teach first-year seminars to inform them about student trends. UMBC used 2005 NSSE data to examine the effectiveness of its First-Year Seminars and Introduction to an Honors University Seminars. Each first-year program has distinct programmatic goals that comport with the NSSE Benchmarks for Effective Educational Practice.
• Based on NSSE, YFCY, and the Student Opinion Survey (SOS) data, the State University of New York at Oneonta president established a commission to review the first-year academic experience and work has begun to improve data-sharing with the campus community.
Planning and Accountability
NSSE results are used along with other surveys and existing institutional data for strategic planning and key performance indicators to fulfill standards established by state systems and other governing agencies.
• In addition to NSSE, Earlham College is also using the Collegiate Learning Assessment for re-accreditation and for improving teaching and learning.
• NSSE data are being used to gauge progress on a number of Saint Anselm College’s strategic indicators and goals. For example, one institutional goal is to implement a living and learning environment that promotes community and increases student engagement. Reporting the variety of measures of student engagement is an important way of supporting goals within its strategic plan.
• The University of Central Oklahoma’s NSSE Action Team was comprised of representatives from a variety of administrative areas and from the five undergraduate colleges. The Team then worked through cause and

USING NSSE DATA ��
For instance, New Jersey City University conducted focus groups with both faculty and staff to discuss NSSE findings as a means to interpret results.
State & University Consortia from 2000-06
California State University City University of New York Connecticut Georgia Indiana University Kentucky Maryland New Jersey North Dakota Ontario Universities South Dakota Tennessee Texas A & M University of Hawaii University of Massachusetts University of New Hampshire University of North Carolina University of Texas University of Wisconsin West Virginia
Public Disclosure of Student Engagement ResultsProspective students, parents, the media, and others have expressed interest in seeing institution-level NSSE results. In a given year, about one quarter of NSSE schools make some or all of their NSSE results available to the public (e.g. Web site, alumni magazine, press release). Other schools see NSSE primarily as a tool for internal improvement initiatives. Some schools are triangulating the results with other institutional data before deciding on appropriate communication strategies.
NSSE’s Position on the Public Disclosure of Student Engagement Data
NSSE encourages public disclosure of student
NSSE Tip #� Improving Campus Confidence in Your Results
Faculty members and administrative staff often raise questions about the validity and reliability of student self-reported data. It may be helpful to build a case for the validity of the findings at your school.
In response to skeptics who question whether their results really capture students’ educational experiences, some schools have administered local instruments with items similar to those in NSSE to validate their NSSE results to the campus community. The use of additional instruments may help build a stronger sense of the validity of the findings.
NSSE has amassed a good bit of information to establish the robustness of the survey. Consider reviewing the “Frequently Asked Questions About NSSE’s Psychometric Properties” (see “Additional Information” inside the NSSE tab of the Institutional Report.) when planning a faculty or administrative retreat and, perhaps, have a few copies on hand.
engagement results in ways that serve to increase understanding of collegiate quality and that support institutional improvement efforts.
Disclosing institutional results from the survey provides an opportunity to help educate the public about the value of student engagement as a new metric for defining and examining collegiate quality. NSSE especially supports public reporting of student engagement results in ways that enable thoughtful, responsible institutional comparisons while encouraging and celebrating institutional diversity.
Whether a participating institution makes public its student engagement results is up to the institution.
Consistent with the NSSE Participation Agreement, NSSE does not make institutional scores available to third parties. Institutions may do so if they wish as stated in the NSSE Participation Agreement. While organizations and individuals are entitled to request NSSE results from participating schools, NSSE is neutral as to whether institutions supply their results. Some colleges and universities will be understandably cautious about releasing their scores with only one or two years of information available, or if the institution has not thoroughly vetted and had an opportunity to take action on the results. Premature disclosure could inadvertently divert the focus away from improvement if the data are used in inappropriate or irresponsible ways.
NSSE does not support the use of student engagement results for the purpose of rankings.
The NSSE National Advisory Board and The Carnegie Foundation for the Advancement of Teaching which sponsors NSSE believe that reducing student engagement to a single indicator obscures complex dimensions of student behavior and institutional performance. For this and other reasons, rankings are inherently flawed as a tool for accountability and improvement, whatever the information on which they are based. Such comparisons become even more problematic in the case of schools that differ in terms of mission and resources and percentages of students who are enrolled full- or part-time, who are transfers, or who major in various fields.
“It (NSSE) has created more conversation among faculty and administrators, and it has prompted various academic departments to complete assessment plans for improvement ”
—Susan King, Director, Office of Academic Assessment, University of Southern Maine

USING NSSE DATA ��
Overcoming Potential Obstacles to Using NSSE Data EffectivelyConverting assessment information into action is a challenge for all colleges and universities. Below we provide ways to address some of the more common obstacles.
Obstacle Approach
Small number of Check to see how representative the sample is compared respondents to the respective populations. Review sampling error. Try over-sampling to increase number of respondents.
Questions about validity NSSE has conducted a number of studies to document and reliability the validity of the instrument, including stability analyses, test-retest, focus groups, and non-responder bias checks. The FAQ section of the NSSE psychometrics report (located in the Additional Information section of the Institutional Report) provides more information about this important set of issues.
Inappropriate comparison Contact NSSE for another peer comparison or special group analyses to capture a better fit.
Limited capacity to The reports that NSSE sends institutions can be quickly analyze and report results packaged and sent to faculty and staff with little work.
“Average” results across Try using a different comparison group or consider a the board criterion-based approach to determine to what degree student performance is inconsistent with institutional expectations.
Lack of faculty awareness Consider administering the FSSE, a modified version of, or interest in, learning of NSSE that looks at student engagement from about and using student the faculty perspective. Results may be useful to discuss engagement results at a retreat or workshop. Also, make available a of the literature on the value of effective educational practices.
Final WordCollecting and documenting how NSSE colleges and universities are using their results is an ongoing process. We would very much like to hear about how you are us-ing your NSSE data. Please send us specific examples of internal reports or brochures highlighting NSSE data, us-age strategies, and special activities. These examples will form a shared resource for colleges and universities and assist in our continuing efforts to improve the quality of the undergraduate experience for all students.
National Survey of Student Engagement
Center for Postsecondary Research Indiana University Bloomington School of Education ��00 East Tenth Street Eigenmann Hall, Suite ��� Bloomington, IN ���0�-����
Phone: ���-���-���� Fax: ���-���-���0 E-mail: [email protected]
www.nsse.iub.edu