insecticide-treated nets and malaria prevalence, papua new ... · insect vectors tended to feed...
TRANSCRIPT

Bull World Health Organ 2017;95:695–705B | doi: http://dx.doi.org/10.2471/BLT.16.189902
Research
695
Insecticide-treated nets and malaria prevalence, Papua New Guinea, 2008–2014Manuel W Hetzel,a Justin Pulford,b Yangta Ura,c Sharon Jamea-Maiasa,c Anthony Tandrapah,c Nandao Tarongka,* Lina Lorry,c Leanne J Robinson,c Ken Lilley,d Leo Makita,e Peter M Sibac & Ivo Muellerf
IntroductionHistorically, malaria has been endemic throughout Papua New Guinea, except in highland areas over 1600 m, where temperatures are low and there is no stable local transmis-sion, though imported cases and epidemics do occur.1–3 The causative parasites Plasmodium falciparum, Plasmodium vivax, Plasmodium malariae and Plasmodium ovale are transmitted by various Anopheles mosquito species adapted to distinct ecological niches.4 The epidemiology of malaria in the country and, consequently, its control are complex due to the number of parasite and mosquito species present, the variety of mos-quito behaviour, the diversity of the natural environment and operational difficulties.
Since 2004, the country’s national malaria control pro-gramme has been supported by the Global Fund to Fight AIDS, Tuberculosis and Malaria. National campaigns were organized to distribute free, long-lasting insecticide-treated nets at the household level and, since late 2011, malaria rapid diagnostics tests, improved diagnostic microscopy and artemisinin-based combination therapy have increasingly been provided at public and church-run health-care facilities.5,6
In 2008–2009, towards the end of the first insecticide-treated net campaign, the Papua New Guinean Institute of Medical Research conducted a country-wide malaria indicator survey. It documented that 65% of households in areas covered by the campaign owned long-lasting insecticide-treated nets
and that 33% of people were using them.5 In addition, malaria was found to be widespread, with a heterogeneous prevalence.7 Light microscopy diagnosis indicated that P. falciparum was the most common species, followed by P. vivax, which domi-nated in several locations. A few P. malariae infections were found but P. ovale was not detected in any sample. Within 1 year of the initial insecticide-treated net campaign, a signifi-cant reduction in the prevalence, incidence and transmission of malaria was documented at selected sites, even though insect vectors tended to feed outdoors.8 However, entomologi-cal investigations indicated that biting patterns and changes in these patterns may reduce the impact of vector control.9
Subsequent national malaria surveys conducted by the Papua New Guinean Institute of Medical Research in 2010–2011 and 2013–2014 to evaluate the national malaria control programme provided evidence that coverage with long-lasting insecticide-treated nets had increased.6,10 Here, we present data on malaria prevalence from these follow-up surveys and analyse changes relative to the baseline survey of 2008–2009.
MethodsNational malaria surveys were conducted from November 2010 to August 2011 and from November 2013 to August 2014. In both surveys, five villages were randomly selected from each of the country’s 20 provinces – organized in four regions – using a list of villages identified in the 2000 national
Objective To investigate changes in malaria prevalence in Papua New Guinea after the distribution of long-lasting Insecticide-treated nets, starting in 2004, and the introduction of artemisinin-based combination therapy in 2011.Methods Two malaria surveys were conducted in 2010–2011 and 2013–2014. They included 77 and 92 randomly selected villages, respectively. In each village, all members of 30 randomly selected households gave blood samples and were assessed for malaria infection by light microscopy. In addition, data were obtained from a malaria survey performed in 2008–2009.Results The prevalence of malaria below 1600 m in altitude decreased from 11.1% (95% confidence interval, CI: 8.5–14.3) in 2008–2009 to 5.1% (95% CI 3.6–7.4) in 2010–2011 and 0.9% (95% CI 0.6–1.5) in 2013–2014. Prevalence decreased with altitude. Plasmodium falciparum was more common than P. vivax overall, but not everywhere, and initially the prevalence of P. vivax infection decreased more slowly than P. falciparum infection. Malaria infections were clustered in households. In contrast to findings in 2008–2009, no significant association between net use and prevalence was found in the later two surveys. The prevalence of both fever and splenomegaly also decreased but their association with malaria infection became stronger.Conclusion Large-scale insecticide-treated net distribution was associated with an unprecedented decline in malaria prevalence throughout Papua New Guinea, including epidemic-prone highland areas. The decline was accompanied by broader health benefits, such as decreased morbidity. Better clinical management of nonmalarial fever and research into residual malaria transmission are required.
a Swiss Tropical and Public Health Institute, Socinstrasse 57, Basel, 4002, Switzerland.b International Public Health, Liverpool School of Tropical Medicine, Liverpool, United Kingdom.c Papua New Guinea Institute of Medical Research, Goroka and Madang, Papua New Guinea.d Australian Army Malaria Institute, Enoggera, Australia.e National Department of Health, Waigani, Papua New Guinea.f Division of Population Health and Immunity, Walter and Eliza Hall Institute of Medical Research, Parkville, Australia.* Deceased, formerly, Papua New Guinea Institute of Medical Research, Madang, Papua New Guinea.Correspondence to Manuel W. Hetzel (email: [email protected])(Submitted: 15 December 2016 – Revised version received: 8 August 2017 – Accepted: 9 August 2017 – Published online: 5 September 2017 )

Bull World Health Organ 2017;95:695–705B| doi: http://dx.doi.org/10.2471/BLT.16.189902696
ResearchMalaria in Papua New Guinea Manuel W Hetzel et al.
census – the most up-to-date.11 Not all provinces or selected villages could be included because of problems with ac-cess and security. The pre-2012 province structure was adopted to ensure com-parability over time: Hela Province was considered part of Southern Highlands Province and Jiwaka Province, part of Western Highlands Province. For each village, the survey team leader selected a random sample of 30 households us-ing a list compiled by village leaders. All members of sampled households were eligible for inclusion. The sample size, which took into account financial and operational constraints, was adequate for detecting a 25% reduction in para-sitaemia from 2008–2009 to 2010–2011 at the regional level at a 95% level of significance with 80% power. The first survey in 2008–2009, whose results are presented for comparison, included villages from only districts covered by the long-lasting insecticide-treated net campaign, but the method of selecting households and their members was identical to that in subsequent surveys.7
Data were collected using an adapt-ed Malaria Indicator Survey question-naire.12 Household heads provided details of each household member’s demographic characteristics and cover-age by malaria interventions. A capillary blood sample was collected by finger-stick from each available, consenting household member aged over 5 months. Trained study nurses prepared one thick and one thin blood film for light micros-copy. The haemoglobin concentration was measured using a portable He-moCue Hb 201+ photometric analyser (HemoCue AB, Ängelholm, Sweden). Symptomatic household members were offered a malaria rapid diagnostic test and treatment or referral to the nearest health-care facility, where appropriate. Axillary temperature was measured using an electronic thermometer and children aged between 2 and 9 years had their spleen palpated. Each patient’s blood sample was accompanied by in-formation on recent travel. The locations of the survey villages were determined using a hand-held Garmin eTrex Global Positioning System device (Garmin Ltd., Olathe, United States of America).
Malaria was diagnosed by light microscopy at the Papua New Guinean Institute of Medical Research following established procedures.7,13 Each slide was examined independently by two microscopists, each viewing a minimum
of 200 thick film fields. Slides with discordant results were examined by a third microscopist, who was certified at World Health Organization (WHO) level 1 or 2. A slide was considered positive for malaria if judged positive by at least two microscopists. For the 2010–2011 survey, additional assess-ments of unclear species identifications
were performed at the Australian Army Malaria Institute in Australia by WHO-certified level-1 malaria microscopists. The number of parasites per 200 white blood cells was determined. The study was approved by the Papua New Guinea Medical Research Advisory Committee (MRAC no. 07.30 and no. 10.12).
Table 1. National malaria surveys, Papua New Guinea, 2010–2014
Region and province 2010–2011 survey 2013–2014 survey
Villagesa Individuals tested
Villagesa Individuals tested
No. (%) No. (%) No. (%) No. (%)
Total 77 (100) 10 060 (100) 92 (100) 8408 (100)Southern Region01. Western 3 (3.9) 376 (3.7) 5 (5.4) 504 (6.0)02. Gulf 4 (5.2) 577 (5.7) 4 (4.3) 504 (6.0)03. Central 5 (6.5) 814 (8.1) 5 (5.4) 474 (5.6)04. National Capital District 5 (6.5) 673 (6.7) 4 (4.3) 301 (3.6)05. Milne Bay 5 (6.5) 721 (7.2) 4 (4.3) 324 (3.9)06. Oro 5 (6.5) 740 (7.4) 5 (5.4) 631 (7.5)Total 27 (35.1) 3 901 (38.8) 27 (29.3) 2738 (32.6)Highlands Region07. Southern Highlands Altitude ≥ 1600 m 4 (5.2) 494 (4.9) 4 (4.3) 335 (4.0)08. Enga Altitude ≥ 1600 m 5 (6.5) 498 (5.0) 6 (6.5) 335 (4.0)09. Western Highlands Altitude < 1600 m 3 (3.9) 295 (2.9) 2 (2.2) 164 (2.0) Altitude ≥ 1600 m 2 (2.6) 188 (1.9) 3 (3.3) 213 (2.5)10. Chimbu Altitude < 1600 m 1 (1.3) 140 (1.4) 1 (1.1) 85 (1.0) Altitude ≥ 1600 m 3 (3.9) 359 (3.6) 4 (4.3) 253 (3.0)11. Eastern Highlands Altitude < 1600 m ND ND 2 (2.2) 171 (2.0) Altitude ≥ 1600 m ND ND 3 (3.3) 258 (3.1)Total 18 (23.4) 1 974 (19.6) 25 (27.2) 1814 (21.6)Momase Region12. Morobe Altitude < 1600 m 5 (6.5) 672 (6.7) 3 (3.3) 282 (3.4) Altitude ≥ 1600 m 0 (0) 0 (0) 2 (2.2) 142 (1.7)13. Madang 4 (5.2) 479 (4.8) 5 (5.4) 447 (5.3)14. East Sepik 5 (6.5) 665 (6.6) 6 (6.5) 461 (5.5)15. Sandaun 3 (3.9) 403 (4.0) 4 (4.3) 645 (7.7)Total 17 (22.1) 2 219 (22.1) 20 (21.7) 1977 (23.5)Islands Region16. Manus 5 (6.5) 629 (6.3) 5 (5.4) 547 (6.5)17. New Ireland 5 (6.5) 708 (7.0) 5 (5.4) 494 (5.9)18. East New Britain 5 (6.5) 629 (6.3) 5 (5.4) 409 (4.9)19. West New Britain ND ND ND ND20. Bougainville ND ND 5 (5.4) 429 (5.1)Total 15 (19.5) 1 966 (19.5) 20 (21.7) 1879 (22.3)
ND: not determined.a For security and operational reasons, 23 villages could not be surveyed in 2010 to 2011 and 10 could not
be surveyed in 2013 to 2014.

Bull World Health Organ 2017;95:695–705B| doi: http://dx.doi.org/10.2471/BLT.16.189902 697
ResearchMalaria in Papua New GuineaManuel W Hetzel et al.
Data analysis
Measures of the prevalence of malaria infection and morbidity were age-stan-dardized using the standard popula-tion for Asia given by the International Network for the Demographic Evalu-ation of Populations and Their Health (INDEPTH).14 Results are presented separately for villages below 1600 m in altitude and include comparisons with data from the 2008–2009 survey. For vil-lages at 1600 m or higher, we compared data from the 2010–2011 and 2013–2014 surveys only as the 2008–2009 survey included few highland villages. To ac-count for stratified sampling, national estimates were weighted, as described elsewhere.5 Splenomegaly was defined as a palpable spleen (i.e. Hackett grade 1 to 5) and anaemia was defined accord-ing to WHO recommendations, which include age-specific cut-offs and altitude corrections.15 Living in a high-quality house served as a proxy for having both good sanitation and a relatively high socioeconomic status, as defined else-where.10 Binary variables were compared using χ2 tests and logistic regression, and non-normally distributed variables were compared using the non-parametric Mann–Whitney U test. Data analyses were conducted using Stata/IC v. 14.0 (StataCorp LP., College Station, USA) and the survey design was taken into account by using Statas set of commands for survey data analysis (svy).
ResultsIn the 2010–2011 survey, blood samples were collected from 10 060 individuals. Of the 77 villages included, 58 (75.3%) were below 1200 m in altitude, 5 (6.5%) were between 1200 and 1599 m and 14 (18.2%), with 1539 participants, were at 1600 m or higher (Table 1). In the 2013–2014 survey, blood samples were collected from 8408 individuals. Of the 92 villages included, 66 (71.7%) were below 1200 m, 4 (4.3%) were between 1200 and 1599 m and 22 (23.9%), with 1536 participants, were at 1600 m or higher (Table 1). The small number of villages at intermediate altitudes reflects the population distribution in Papua New Guinea.1 The age distribu-tion of survey participants is shown in Table 2. In the 2010–2011 survey, the participants’ median age was 19 years (interquartile range, IQR: 8–36): 14.1% (1418/10 060) were aged under 5 years
Table 2. Age of participants, national malaria surveys, Papua New Guinea, 2010–2014
Age, years 2010–2011 survey 2013–2014 survey
No. (%) No. (%)
< 1 72 (0.7) 95 (1.1)1–4 1346 (13.4) 890 (10.6)5–9 1621 (16.1) 1218 (14.5)10–14 1137 (11.3) 944 (11.2)15–19 888 (8.8) 728 (8.7)20–39 2885 (28.7) 2510 (29.9)≥ 40 2080 (20.7) 1967 (23.4)Missing values 31 (0.3) 56 (0.7)Total 10060 (100) 8408 (100)
Table 3. Age-standardized prevalence of Plasmodium infection below 1600m, by species, national malaria surveys, Papua New Guinea, 2008–2014
Plasmodium species Infection prevalence % (95% CI)
2008–2009 surveya 2010–2011 survey 2013–2014 survey
(n = 6424)b (n = 8521)b (n = 6872)b
All species 11.1 (8.5–14.3) 5.1 (3.6–7.4) 0.9 (0.6–1.5)P. falciparum 6.6 (4.9–8.8) 3.0 (1.9–4.6) 0.8 (0.5–1.2)P. vivax 3.1 (1.9–4.9) 2.0 (1.4–2.9) 0.1 (0.0–0.3)P. malariae 0.3 (0.1–0.6) 0.1 (0.0–0.2) 0P. falciparum and P. vivax 0.3 (0.1–0.5) 0.2 (0.1–0.4) 0.01 (0.0–0.08)
CI: confidence interval; P. falciparum: Plasmodium falciparum; P. malariae: Plasmodium malariae; P. vivax: Plasmodium vivax.a Data from the 2008–2009 survey7 were re-analysed by applying age-standardization.b The number of survey participants living in villages below 1600 m in altitude.
Fig. 1. Age-standardized prevalence of Plasmodium infection and insecticide-treated net use, by region and survey date, national malaria surveys, Papua New Guinea, 2008–2014
Long
-last
ing
inse
ctici
de-tr
eate
d ne
t use
(%)
Prev
alen
ce o
f Pla
smod
ium
infe
ctio
n (%
)100
0
100
0
100
0
100
0
10
0
10
0
10
0
10
0
Survey year Survey year
2008-2009 2010-2011 2013-2014
2008-2009 2010-2011 2013-2014
2008-2009 2010-2011 2013-2014
2008-2009 2010-2011 2013-2014
Southern region
Momase region
Highlands region
Islands region
P. falciparum infection P. vivax infection Long-lasting insecticide-treated net use (%)
P. falciparum: Plasmodium falciparum; P. vivax: Plasmodium vivax.Note: Error bars represent 95% confidence intervals.

Bull World Health Organ 2017;95:695–705B| doi: http://dx.doi.org/10.2471/BLT.16.189902698
ResearchMalaria in Papua New Guinea Manuel W Hetzel et al.
and 52.8% (5290/10 028) were female. In the 2013–2014 survey, the comparable figures were 22 years (IQR: 9–38), 11.7% (985/8408) and 52.3% (4363/8348), respectively.
Malaria prevalence
Nationally, in villages below 1600 m in altitude, the age-standardized preva-lence of malaria, as diagnosed by light microscopy, decreased significantly from 11.1% (95% confidence interval, CI: 8.5–14.3) in 2008–2009 to 5.1% (95% CI: 3.6–7.4) in 2010–2011 (P < 0.001) and to 0.9% (95% CI: 0.6–1.5) in 2013–2014
(P < 0.001). The prevalence of P. falci-parum infection was higher than that of P. vivax infection in all surveys (Table 3). There was no evidence of P. ovale in any sample. For individual Plasmo-dium species, the difference in infection prevalence between subsequent surveys was significant at a P-value ≤ 0.001 for all comparisons except for P. malariae infection, for which the P-value for the difference between subsequent surveys was < 0.05, and for mixed P. falciparum and P. vivax infection between the 2008–2009 and 2010–2011 surveys, where the decrease was not significant.
Between the 2008–2009 and 2010–2011 surveys, an increase in the preva-lence of P. vivax infection was noted in two of the country’s four regions (Fig. 1) and in several provinces (Fig. 2 and Fig. 3), which led to a decrease in the ratio of P. falciparum to P. vivax infection. However, the prevalence of infection by both species decreased in all provinces between 2010–2011 and 2013–2014. In 2013–2014, no parasites were detected in any sample from 11 of the 19 provinces surveyed (Table 4; available at: http://www.who.int/bul-letin/volumes/94/10/16-189902).
Fig 2. Age-standardized prevalence of Plasmodium infection and insecticide-treated net use in lower-prevalence areas, by province and survey date, national malaria surveys, Papua New Guinea, 2008–2014
100
0
100
0
100
0
100
0
100
0
100
0
100
0
100
0
100
0
100
0
100
0
100
0
5
0
5
0
5
0
5
0
5
0
5
0
5
0
5
0
5
0
5
0
5
0
5
0
Survey year Survey year Survey year
2008-2009 2010-2011 2013-2014
2008-2009 2010-2011 2013-2014
2008-2009 2010-2011 2013-2014
2008-2009 2010-2011 2013-2014
2008-2009 2010-2011 2013-2014
2008-2009 2010-2011 2013-2014
2008-2009 2010-2011 2013-2014
2008-2009 2010-2011 2013-2014
2008-2009 2010-2011 2013-2014
2008-2009 2010-2011 2013-2014
2008-2009 2010-2011 2013-2014
2008-2009 2010-2011 2013-2014
01 Western
04 National Capital District
09 Western Highlands
12 Morobe
02 Gulf
07 Southern Highlands
10 Chimbu
14 East Sepik
03 Central
08 Enga
11 Eastern Highlands
20 Bougainville
No su
rvey
No su
rvey
No su
rvey
No su
rvey
No su
rvey
P. falciparum infection P. vivax infection Long-lasting insecticide-treated net use (%)
Prev
alen
ce o
f Pla
smod
ium
infe
ctio
n (%
)
Long
-last
ing
inse
ctici
de-tr
eate
d ne
t use
(%)
P. falciparum: Plasmodium falciparum; P. vivax: Plasmodium vivax.

Bull World Health Organ 2017;95:695–705B| doi: http://dx.doi.org/10.2471/BLT.16.189902 699
ResearchMalaria in Papua New GuineaManuel W Hetzel et al.
In highland villages at 1600 m and above, the age-standardized prevalence of malaria decreased from 0.7% (95% CI: 0.3–1.2) in 2010–2011 to 0.1% (95% CI: 0–0.7) in 2013–2014 (P = 0.004). In the 2010–2011 survey, the prevalence of P. falciparum infection was higher than that of P. vivax infection in highland villages: 0.6% (95% CI: 0.3–1.1) and 0.1% (95% CI: 0–0.7), respectively. In the 2013–2014 survey, the prevalence of P. falciparum infection was 0.1% (95% CI: 0–0.4), whereas no P. vivax infections were detected. Moreover, no P. malariae, P. ovale or mixed infections were found.
Predictors of infection
Regression analysis findings are pre-sented in Table 5. Univariable logistic regression found that, in 2010–2011, malaria infection was significantly less likely above 1600 m (odds ratio, OR: 0.15; 95% CI: 0.06–0.38); in 2013–2014, the corresponding OR was 0.04 (95% CI: 0.00–0.33). The prevalence of infection below 1600 m was significantly
Fig 3. Age-standardized prevalence of Plasmodium infection and insecticide-treated net use in higher-prevalence areas, by province and survey date, national malaria surveys, Papua New Guinea, 2008–2014
100
0
100
0
100
0
100
0
100
0
100
0
100
0
100
0
20
0
20
0
20
0
20
0
20
0
20
0
20
0
20
0
Survey year Survey year
Survey year
2008-2009 2010-2011 2013-2014
2008-2009 2010-2011 2013-2014
2008-2009 2010-2011 2013-2014
2008-2009 2010-2011 2013-2014
2008-2009 2010-2011 2013-2014
2008-2009 2010-2011 2013-2014
2008-2009 2010-2011 2013-2014
2008-2009 2010-2011 2013-2014
05 Milne Bay
15 Sandaun
18 East New Britain
06 Oro
16 Manus
19 West New Britain
13 Madang
17 New Ireland
No su
rvey
No su
rvey
P. falciparum infection P. vivax infection Long-lasting insecticide-treated net use (%)
Long
-last
ing
inse
ctici
de-tr
eate
d ne
t use
(%)
Prev
alen
ce o
f Pla
smod
ium
infe
ctio
n (%
)
P. falciparum: Plasmodium falciparum; P. vivax: Plasmodium vivax.
Table 5. Factors associated with malaria infection, national malaria surveys, Papua New Guinea, 2010–2014
Risk factor Risk of malaria infection
Univariable logistic regression analysis
Multivariable logistic regression analysis
OR (95% CI) aOR (95% CI)
2010–2011 surveyVillage at 1600 m or higher 0.15 (0.06–0.38) 0.16 (0.06–0.42)Age < 5 years 2.98 (2.40–3.71) 2.59 (2.08–3.23)Long-lasting insecticide-treated net use
1.38 (1.00–1.90) 1.09 (0.82–1.45)
High-quality housea 0.30 (0.11–0.83) 0.25 (0.08–0.79)Percentage net use in village 1.01 (1.00–1.02) ND2013–2014 surveyVillage at 1600 m or higher 0.04 (0.00–0.33) 0.04 (0.00–0.36)Age < 5 years 1.59 (0.74–3.44) 1.47 (0.68–3.21)Long-lasting insecticide-treated net use
1.42 (0.83–2.45) 1.08 (0.64–1.82)
High-quality housea 1.00 NDPercentage net use in village 1.01 (1.00–1.03) ND
aOR: adjusted odds ratio; CI: confidence interval; ND: not determined; OR: odds ratio.a Living in a high-quality house served as a proxy for having both good sanitation and a relatively high
socioeconomic status.

Bull World Health Organ 2017;95:695–705B| doi: http://dx.doi.org/10.2471/BLT.16.189902700
ResearchMalaria in Papua New Guinea Manuel W Hetzel et al.
lower in older individuals in all years (Fig. 4): P < 0.001 for the 2008–2009 and 2010–2011 surveys and P = 0.03 for the 2013–2014 survey. For P. falciparum infection, the peak prevalence shifted to a younger age between 2008–2009 and 2010–2011, but there was no cor-responding change for P. vivax infection (Fig. 5). In 2013–2014, the difference in the prevalence of P. falciparum and P. vivax infection between age groups was not significant. However, 62.7% (95% CI: 42.2–79.4) of P. vivax infections and 9.1% (95% CI: 3.4–22.0) of P. falciparum infections occurred in children aged under 5 years.
Long-lasting insecticide-treated nets were used by 32.5% (95% CI: 27.0–38.4) of the population nation-ally in 2008–2009,5 by 48.3% (95% CI: 41.8–54.9) in 2010–201110 and by 53.9% (95% CI: 49.4–58.4) in 2013–2014.16 In the 2008–2009 survey, a significant association was found between net use and a lower risk of malaria infection (adjusted odds ratio, aOR: 0.64; 95% CI: 0.54–0.76).7 However, no corre-sponding association was found in the 2010–2011 survey (aOR: 1.09; 95% CI: 0.82–1.45), in an analysis that adjusted for altitude, age and housing quality, or in the 2013–2014 survey (aOR: 1.08; 95% CI: 0.64–1.82), in an analysis that adjusted for altitude and age (Table 5). In 2010–2011, people living in high-quality houses were significantly less likely to be infected (aOR: 0.25; 95% CI: 0.08–0.79). Malaria cases were clustered in house-holds. Univariable analysis found that, in 2010–2011, the odds of infection were over 26 times higher for individu-als living with an infected person than for those who were not (OR: 25.65; 95% CI: 16.18–40.67); in 2013–2014, the odds were over 77 times higher (OR: 77.16; 95% CI: 41.61–143.09). In 2010–2011, 47% of malaria-infected individuals lived in a household with another infected person; in 2013–2014, the corresponding proportion was 25%.
Morbidity
In all surveys, individuals infected with malaria were significantly more likely than those without to report a recent fever episode, to show symptoms of acute fever (i.e. an axillary temperature over 37.5 °C), to be anaemic or, in those aged 2 to 9 years, to have splenomegaly (P < 0.01 for all). Although the propor-tion of the population with a recent
Fig. 4. Prevalence of Plasmodium infection below 1600 m, by age and survey date, national malaria surveys, Papua New Guinea, 2008–2014
Prev
alen
ce o
f Pla
smod
ium
infe
ctio
n (%
)
25
20
15
10
5
0
Age (years)2008–2009 survey 2010–2011 survey 2013–2014 survey
1 5 10 15 20 40
Note: The study age groups, as indicated in the figure, were 0–0.9, 1.0–4.9, 5.0–9.9, 10.0–14.9, 15.0–19.9, 20.0–39.9 and ≥40 years.
Fig. 5. Prevalence of P. falciparum and P. vivax infection below 1600 m, by age and survey date, national malaria surveys, Papua New Guinea, 2008–2014
Prev
alen
ce o
f P.
falci
paru
m in
fect
ion
(%)
Prev
alen
ce o
f P.
viva
x inf
ectio
n (%
)15
10
5
0
15
10
5
0
Age (years) Age (years)2008–2009 survey 2010–2011 survey 2013–2014 survey
1 5 10 15 20 40 1 5 10 15 20 40
P. falciparum: Plasmodium falciparum; P. vivax: Plasmodium vivax.Note: The study age groups, as indicated in the figures, were 0–0.9, 1.0–4.9, 5.0–9.9, 10.0–14.9, 15.0–19.9, 20.0–39.9 and ≥40 years.
Fig. 6. Participants with a history of fever in villages below 1600 m, national malaria surveys, Papua New Guinea, 2008–2014
Prop
ortio
n of
par
ticip
ants
with
a r
ecen
t hist
ory o
f fev
er (%
) 40
30
20
10
0
Survey yearParticipants testing positive for malariaParticipants testing negative for malaria
2008-2009 2010-2011 2013-2014
Notes: The black line shows the proportion for each whole survey population. Differences between subsequent years in the proportion of the overall population were significant (P < 0.01).

Bull World Health Organ 2017;95:695–705B| doi: http://dx.doi.org/10.2471/BLT.16.189902 701
ResearchMalaria in Papua New GuineaManuel W Hetzel et al.
history of fever decreased over time (Fig. 6), the association between ma-laria infection and a recent history of fever became stronger, particularly after 2010: the OR adjusted for age was 2.05 (95% CI: 1.41–2.99) in 2008–2009, 2.57 (95% CI: 1.74–3.81) in 2010–2011 and 12.34 (95% CI: 4.56–33.33) in 2013–2014. In 2013–2014, 37.4% of all infected individuals reported a recent fever episode (Fig. 6) and 3.7% had an acute fever (Fig. 7). The prevalence of splenomegaly in participants aged 2 to 9 years also decreased over time (Fig. 8) and again the association with infection tended to become stronger: the OR adjusted for age was 4.72 (95% CI: 2.38–9.34) in 2008–2009, 10.0 (95% CI: 5.10–19.60) in 2010–2011 and 21.84 (95% CI: 5.52–88.46) in 2013–2014. The prevalence of anaemia remained high over time and increased between 2010–2011 and 2013–2014 (Fig. 9 and Fig. 10). Independent of the effect of malaria infection, in 2013–2014, anae-mia was significantly associated with residing in a village below 1200 m in altitude (aOR: 8.63; 95% CI: 6.66–11.18), age under 5 years (aOR: 4.38; 95% CI: 2.96–6.46) and female sex (aOR: 1.54; 95% CI: 1.35–1.75).
DiscussionWithin 5 years, the prevalence of malar-ia in Papua New Guinea decreased from 11.1% to 0.9% and during 2013–2014 no parasites were detected by light micros-copy in most provinces. This is a greater reduction than the 26% observed in Af-rica between 2000 and 2016.17 Moreover, the prevalence in 2014 was lower than that in other countries in the Asia–Pa-cific region, including the neighbouring Papua province of Indonesia.18–21 An initial shift towards proportionally more P. vivax than P. falciparum infections ap-peared to be transient and was followed by a clear reduction in both species, as observed elsewhere.22,23 These trends are in line with previously documented declines in malaria following the in-troduction of long-lasting insecticide-treated nets.8,9,24 Provinces in which no malaria parasites were found should not be considered malaria-free because, as parasite density decreases, an increasing proportion of infections becomes sub-microscopic,13,18,25 particularly if trans-mission decreases faster than the loss of
Fig. 7. Participants with acute fever in villages below 1600 m, national malaria surveys, Papua New Guinea, 2008–2014
Prop
ortio
n of
par
ticip
ants
w
ith ac
ute f
ever
(%)
8
6
4
2
0
Survey yearParticipants testing positive for malariaParticipants testing negative for malaria
2008-2009 2010-2011 2013-2014
Notes: The black line shows the proportion for each whole survey population. Differences between subsequent years in the proportion of the overall population were significant (P < 0.01).
Fig. 8. Participants aged 2 to 9 years with splenomegaly in villages below 1600 m, national malaria surveys, Papua New Guinea, 2008–2014
Prop
ortio
n of
par
ticip
ants
w
ith sp
leno
meg
aly (
%) 40
30
20
10
0
Survey yearParticipants testing positive for malariaParticipants testing negative for malaria
2008-2009 2010-2011 2013-2014
Notes: The black line shows the proportion for each whole survey population. Differences between subsequent years in the proportion of the overall population were significant (P < 0.01).
Fig. 9. Participants with anaemia in villages below 1600 m, national malaria surveys, Papua New Guinea, 2008–2014
Prop
ortio
n of
par
ticip
ants
w
ith an
aem
ia (%
)
100
80
60
40
20
0
Survey yearParticipants testing positive for malariaParticipants testing negative for malaria
2008-2009 2010-2011 2013-2014
Notes: The black line shows the proportion for each whole survey population. Differences between subsequent years in the proportion of the overall population were significant (P < 0.01). Anaemia was defined according to WHO recommendations, which included age-specific cut-offs and altitude corrections.15

Bull World Health Organ 2017;95:695–705B| doi: http://dx.doi.org/10.2471/BLT.16.189902702
ResearchMalaria in Papua New Guinea Manuel W Hetzel et al.
immunity. In three provinces with zero prevalence, rapid diagnostic tests found that people with fever who had not left the province had a current or recent infection. Consequently, maintaining a high level of intervention coverage is crucial for avoiding resurgence. The notion that climatic change might have increased malaria in the highlands could not be substantiated.26 In locations above 1600 m, malaria prevalence was lower in 2010–2011 and 2013–2014 than between 2000 and 2005.2 The protective effect of insecticide-treated nets in both the highlands and lowlands, from where infections are often imported,27 may have outweighed the impact of changing weather patterns or increased people movement. Unlike in previous years,2,3 P. falciparum was the dominant species in the highlands.
The prevalence of fever and sple-nomegaly declined with that of parasite infection. However, the association be-tween infection and symptoms became stronger over time, perhaps because the proportion of microscopically detect-able infections that were symptomatic increased as transmission and immunity declined. The decrease in splenomegaly was most marked, which may reflect a reduction in chronic malaria infection.7 On the other hand, anaemia remained common, indicating that the cause is multifactorial.28 Anaemia may not, therefore, be useful for monitoring rapid changes in malaria prevalence.29 As severe anaemia, in particular, affects children’s health and development, its causes and appropriate mitigating mea-sures should be investigated.28,30
Between 2004 and 2012, the dis-tribution of insecticide-treated nets to households was the only large-scale ma-laria intervention in Papua New Guin-ea.10 The baseline survey demonstrated a strong negative association between net coverage and malaria prevalence.7 In the absence of other factors, such as major economic developments or a prolonged drought,9 it is plausible that the drop in prevalence between the 2008–2009 and 2010–2011 surveys resulted from in-creased provision of nets and measures promoting their use. The lack of an as-sociation between net use and malaria prevalence in the last two surveys may have been due to factors such as out-door biting, which sustained disease transmission, and the mass effect of net use on all community members.31 With our survey design, it was not possible to quantify the relative contributions of net use and artemisinin-based combination therapy to the reduction in prevalence. Combination therapy was introduced in November 2011 and, by late 2012, was available at approximately half of health-care facilities.32 Nevertheless, although the treatment’s gametocidal effect can reduce transmission from pa-tients, its prophylactic effect is limited. Moreover, in 2014, only 45% of patients with confirmed or suspected malaria who attended health-care facilities were treated with artemisinin-based combi-nation therapy,33 which corresponds to a population coverage of 19% at best. The community benefits of combination therapy can be maximized by prompt diagnosis and treatment.34 With de-creasing malaria prevalence, clinicians
across Papua New Guinea should be encouraged to administer antimalarials only to people with a positive test result, which has proven to be a safe approach,35 and to thoroughly investigate the causes of nonmalarial fevers. Better guidance on differential diagnosis and on fever management is warranted.36
We found that individuals cohabit-ing with another infected person were more likely to carry parasites, possibly due to similar exposure patterns. There were fewer infections in high-quality houses occupied by better-off house-holds, possibly because of economic factors or the building’s structure or location – most high-quality houses were in urban areas. Earlier studies in Papua New Guinea found conflicting evidence of the impact of housing, namely raised structures, on mosquito exposure.37,38 As indoor exposure to malaria vectors has been reduced by nets, people’s outdoor behaviour may be an increasingly im-portant determinant of exposure as many vectors tend to bite outdoors.9,39 The in-vestigation of residual malaria transmis-sion is crucial for eliminating the disease and should take into account human and mosquito behaviour patterns, including the distribution of different Anopheles populations, their biting preferences and their susceptibility to interventions.8,9,37
In our study, we used age-stan-dardization to account for differences in the age-composition of participants between surveys and between partici-pants who gave blood samples and the general population. However, as the 2008–2009 survey included only dis-tricts where nets were distributed, the national prevalence of parasite infec-tion may have been underestimated. Data from sentinel sites showed that the prevalence after net distribution was 4.8% compared with 15.7% before.8 In addition, the estimated prevalence in the 2010–2011 and 2013–2014 surveys may have been too low because, due to secu-rity concerns, they excluded West New Britain Province, where the prevalence is traditionally high.40
In conclusion, increased use of long-lasting insecticide-treated nets in Papua New Guinea was associated with a rapid and significant decline in malaria prevalence – the low-est prevalence ever recorded was in 2013–2014. The decline also occurred in the epidemic-prone highlands. Light microscopy showed that P. falciparum remained more common than P. vivax.
Fig. 10. Participants with severe anaemia in villages below 1600 m, national malaria surveys, Papua New Guinea, 2008–2014
Prop
ortio
n of
par
ticip
ants
w
ith se
vere
anae
mia
(%) 10
8
6
4
2
0
Survey yearParticipants testing positive for malariaParticipants testing negative for malaria
2008-2009 2010-2011 2013-2014
Notes: The black line shows the proportion for each whole survey population. Differences between subsequent years in the proportion of the overall population were significant (P < 0.01). Severe anaemia was defined according to WHO recommendations, which included age-specific cut-offs and altitude corrections.15

Bull World Health Organ 2017;95:695–705B| doi: http://dx.doi.org/10.2471/BLT.16.189902 703
ResearchMalaria in Papua New GuineaManuel W Hetzel et al.
ملخصالناموسيات املعاجلة باملبيد احلرشي وانتشار املالريا يف بابوا غينيا اجلديدة يف الفرتة ما بني عامّي 2008 و2014
اجلديدة غينيا بابوا يف املالريا انتشار تغريات يف التحقيق الغرض بعد توزيع الناموسيات امُلعاجَلة باملبيد احلرشي ذات املفعول املمتد، مادة عىل املرتكز املجّمع العالج وطرح ،2004 عام من بدًءا
األرتيميسينني يف عام 2011.الطريقة ُأجريت دراستان استقصائيتان للمالريا يف عامي 2010-اختيارها تم و92 قرية 77 وشملتا و2014-2013. 2011عشوائًيا عىل التوايل. يف كل قرية، قدم مجيع أفراد الثالثني أرسة التي تم اختيارها عشوائًيا عينات من الدم وتم تقييمها بواسطة الفحص إىل وباإلضافة باملالريا. إصابة هناك كان إذا ما ملعرفة املجهري ذلك، تم احلصول عىل البيانات من مسح املالريا الذي تم إجراؤه
يف الفرتة ما بني عامي 2009-2008.يزيد ال التي املناطق يف املالريا انتشار معدل انخفض النتائج :% 95 يبلغ ثقة )بنطاق % من 11.1 1600 مرت عن ارتفاعها إىل 5.1 % 2009–2008 عامّي بني ما الفرتة يف )14.3–8.5–2010 عامّي بني ما الفرتة يف )7.4–3.6 ثقة 95 %: )بنطاق بني ما الفرتة يف )1.5–0.6 :% 95 ثقة )بنطاق و0.9 % ،2011
عامي 2013–2014، بام يعني انخفاض انتشار املرض مع زيادة االرتفاع. كانت “املتصورة املنجلية” )املالريا اخلبيثة( أكثر شيوًعا من “املتصورة النشيطة” بشكل إمجايل ولكن ليس يف كل األماكن، بمعدل النشيطة” “باملتصورة اإلصابة انتشار معدل انخفض كام أبطأ من اإلصابة “باملتصورة املنجلية”. وتم جتميع إصابات املالريا يف األرس. ويف مقابل النتائج التي تم التوصل إليها يف الفرتة ما بني عامي 2008-2009، مل يتم العثور عىل ارتباط كبري بني استخدام الدراستني األخريتني. كام انخفض الناموسية ومعدل االنتشار يف بعدوى ارتباطهام أصبح ولكن الطحال وتضخم احلمى انتشار
املالريا أقوى.عىل احلرشي باملبيد امُلعاجَلة الناموسية توزيع ارتبط االستنتاج يف املالريا انتشار يف مسبوق غري انخفاض بحدوث واسع نطاق مجيع أنحاء بابوا غينيا اجلديدة، بام يف ذلك املناطق املرتفعة املعرضة لألوبئة. ورافق هذا االنخفاض فوائد صحية أكثر، مثل انخفاض معدالت االعتالل. ويلزم توفري إدارة رسيرية أفضل للحمى غري
املالرية وإجراء األبحاث حول انتقال املالريا املتبقية.
Declining prevalence was accom-panied by broader health benefits, such as decreased morbidity. How-ever, nonmalarial fever now requires better clinical management. Research into the drivers of residual malaria transmission and the burden and role of submicroscopic parasite infection are crucial for better targeting of interventions and for eliminating the disease. ■
AcknowledgementsWe thank all participating individu-als, communities and village leaders, government officials in the provinces
and at the National Department of Health, all partners in the Malaria Technical Working Group, staff at the Papua New Guinean Institute of Medi-cal Research and the Australian Army Malaria Institute and field data collec-tors and we remember the five team members who disappeared without trace in West New Britain province. MWH is also affiliated with the Uni-versity of Basel, Switzerland, LJR is af-filiated with the Walter and Eliza Hall Institute, the University of Melbourne and the MacFarlane Burnet Institute of Medical Research, Australia and IM is affiliated with the University of
Melbourne, Australia and the Institut Pasteur, France.
Funding: The surveys were funded by the Global Fund to Fight AIDS, Tuberculo-sis and Malaria. LJR was supported by an NHMRC Early Career Fellowship #1016443, IM was supported by an NHMRC Senior Research Fellowship (SRF-B), and MWH was supported by a Novartis University of Basel Excellence Scholarship for Life Sciences.
Competing interests: None declared.
摘要新几内亚(旧称巴布亚) 2008-2014 年驱虫蚊帐普及率与疟疾患病率目的 旨在调查自 2004 年开始分发长效驱虫蚊帐并于 2011 年开始引入青蒿素联合疗法后,新几内亚(旧称巴布亚)疟疾患病率的变化。方法 在 2010 年至 2011 年和 2013 年至 2014 期间分别进行过两次疟疾调查。这两次调查分别包括了 77 个和 92 个随机选择的村庄。 在每个村庄,30 个随机选择的家庭的所有成员均提供了血液样本,并通过光学显微镜评估疟疾感染情况。 另外,数据还来自于 2008 年至 2009 年进行的疟疾调查。结果 自 2008 年至 2009 年期间,海拔 1600 米以下的疟疾患病率从 2008 年至 2009 年的 11.1%(95% 置信区间,CI: 8.5–14.3)降到 2010 年至 2011 年的 5.1%
(95% 置信区间,CI :3.6–7.4)并在 2013 年至 2014 年降到 0.9%(95% 置信区间,CI :0.6–1.5)。患病率随
着海拔高度下降而降低。 总体而言恶性疟原虫比间日疟原虫更常见 , 但也并非随处可见。最初,间日疟原虫感染的患病率比恶性疟原虫感染患病率降低的速度更慢。 疟疾感染聚集在家庭中。 与 2008 年至 2009 年的调查结果相反,后两次调查显示,驱虫蚊帐使用率与患病率之间没有明显的联系。 发热和脾肿大的患病率也有所下降,但其与疟疾感染的相关性日益增强。结论 大规模驱虫蚊帐的普及与新几内亚(旧称巴布亚)疟疾患病率前所未有的下降之间有相关性,包括流行病高发的高海拔地带。 这种下降伴随着范围更广的健康益处,如发病率下降。 需要对非疟疾发烧进行更有效的临床管理和研究,以降低尚有残留的疟疾传播。

Bull World Health Organ 2017;95:695–705B| doi: http://dx.doi.org/10.2471/BLT.16.189902704
ResearchMalaria in Papua New Guinea Manuel W Hetzel et al.
Résumé
Moustiquaires imprégnées d’insecticides et prévalence du paludisme en Papouasie-Nouvelle-Guinée entre 2008 et 2014Objectif Étudier les changements observés à l’égard de la prévalence du paludisme en Papouasie-Nouvelle-Guinée suite à la distribution, depuis 2004, de moustiquaires imprégnées d’insecticides de longue durée et à l’introduction, depuis 2011, d’une combinaison thérapeutique à base d’artémisinine.Méthodes Deux enquêtes portant sur le paludisme ont été menées en 2010-2011 et 2013-2014. Elles incluaient respectivement 77 et 92 villages, sélectionnés d’une manière aléatoire. Dans chacun de ces villages, tous les membres de 30 foyers sélectionnés aléatoirement ont donné des échantillons sanguins et été soumis à un test de dépistage de l’infection palustre par microscopie optique. Des données ont par ailleurs été tirées d’une enquête sur le paludisme réalisée en 2008-2009.Résultats La prévalence du paludisme à moins de 1600 m d’altitude est passée de 11,1% (intervalle de confiance, IC, à 95%: 8,5–14,3) en 2008–2009 à 5,1% (IC à 95%: 3,6–7,4) en 2010–2011 et 0,9% (IC à 95%: 0,6–1,5) en 2013–2014. La prévalence diminuait avec l’altitude. Plasmodium falciparum n’était pas systématiquement plus courant que P. vivax, mais l’était dans l’ensemble
et, dans un premier temps, la prévalence de l’infection à P. vivax a diminué plus lentement que la prévalence de l’infection à P. falciparum. Les infections palustres ont été regroupées par foyers. Contrairement à ce qu’indiquaient les résultats obtenus en 2008-2009, aucune corrélation significative entre l’utilisation d’une moustiquaire et la prévalence n’a été constatée dans le cadre des deux dernières enquêtes. Les prévalences de la fièvre et de la splénomégalie ont également diminué, mais leur corrélation avec l’infection palustre est devenue plus forte.Conclusion La distribution à grande échelle de moustiquaires imprégnées d’insecticides a été associée à un déclin sans précédent de la prévalence du paludisme dans l’ensemble de la Papouasie-Nouvelle-Guinée, et notamment dans les régions montagneuses sujettes aux épidémies. Ce déclin s’est accompagné d’autres bienfaits sur la santé, et notamment d’une diminution de la morbidité. Il est nécessaire d’améliorer la prise en charge clinique de la fièvre non palustre ainsi que les recherches sur la transmission résiduelle du paludisme.
Резюме
Обработанные инсектицидами сетки и распространенность малярии, Папуа — Новая Гвинея, 2008–2014 гг.Цель Изучить изменения в распространенности малярии в Папуа — Новой Гвинее после внедрения сеток, обработанных инсектицидами длительного действия, с 2004 года и после введения в 2011 году комбинированной терапии на основе артемизинина.Методы В 2010–2011 гг. и 2013–2014 гг. были проведены два обследования на инфицирование малярией. Они включали соответственно 77 и 92 случайно выбранных поселка. В каждом поселке все представители 30 случайно отобранных домохозяйств сдали образцы крови, которые прошли исследование с использованием световой микроскопии на предмет заражения малярией. Кроме того, были получены результаты обследования на малярию, проведенного в 2008–2009 гг.Результаты Распространенность малярии на высоте ниже 1600 м над уровнем моря снизилась с 11,1% (95%-й доверительный интервал, ДИ: 8,5–14,3) в 2008–2009 гг. до 5,1% (95%-й ДИ: 3,6–7,4) в 2010–2011 гг. и до 0,9% (95%-й ДИ: 0,6–1,5) в 2013–2014 гг. Распространенность инфекции снижалась по мере роста высоты над уровнем моря. Возбудитель Plasmodium falciparum встречался
чаще, чем P. vivax, но не везде, и изначально распространенность инфицирования P. vivax снижалась медленнее, чем инфицирование P. falciparum. Случаи заболевания малярией концентрировались в домашних хозяйствах. В отличие от результатов, полученных в 2008–2009 гг., в двух более поздних исследованиях не было выявлено существенной взаимосвязи между использованием сеток и распространенностью инфекции. Распространенность как лихорадки, так и спленомегалии также снизилась, но их взаимосвязь с малярией стала более явной.Вывод Широкомасштабное распространение использования сеток, обработанных инсектицидами длительного действия, было связано с беспрецедентным снижением распространенности малярии во всей Папуа — Новой Гвинее, включая районы, подверженные эпидемии. Снижение распространенности инфекции сопровождалось более широкими преимуществами для здоровья, такими как снижение заболеваемости. Требуется введение более качественных клинических протоколов ведения и лечения лихорадки, не связанной с малярией, а также проведение исследования оставшихся очагов распространения малярии.
Resumen
Mosquiteros tratados con insecticida y prevalencia de la malaria, Papua Nueva Guinea, 2008–2014Objetivo Investigar los cambios en la prevalencia de la malaria en Papua Nueva Guinea tras la distribución de mosquiteros tratados con insecticida de larga duración, a partir de 2004, y la introducción de terapias combinadas basadas en la artemisinina en 2011.Métodos Se llevaron a cabo dos encuestas sobre la malaria en 2010–2011 y 2013–2014. Incluían 77 y 92 aldeas seleccionadas al azar, respectivamente. En cada aldea, todos los miembros de 30 hogares seleccionados al azar dieron muestras de sangre y se evaluaron de infección de malaria con microscopio óptico. Además, se obtuvieron datos de la encuesta sobre la malaria realizada en 2008–2009.Resultados La prevalencia de la malaria por debajo de 1600 m de altitud descendió del 11.1% (intervalo de confidencia (IC) del 95%: 8.5–14.3) en 2008–2009 al 5.1% (95% IC 3.6–7.4) en 2010–2011 y 0.9% (95% IC 0.6–1.5) en 2013–2014. La prevalencia descendía con la altitud. Plasmodium falciparum fue más común que P. vivax en general, pero no en todas partes e
inicialmente la prevalencia de la infección P. vivax descendió más lentamente que la infección P. falciparum. Las infecciones de malaria se agruparon en los hogares. Al contrario que los hallazgos en 2008–2009, no se encontró ninguna asociación significativa entre el uso del mosquitero y la prevalencia en las dos últimas encuestas. La prevalencia tanto de la fiebre como de la esplenomegalia también descendió, pero su asociación con la infección de malaria se hizo más fuerte.Conclusión La distribución de mosquiteros tratados con insecticida a gran escala se asoció con un descenso sin precedentes en la prevalencia de la malaria en toda Papua Nueva Guinea, incluidas las áreas altas con propensión a causar epidemias. El descenso estuvo acompañado de beneficios saludables más amplios, como el descenso de la morbilidad. Se requieren una mejor gestión clínica de la fiebre no relacionada con la malaria y la investigación de la transmisión residual de la malaria.

Bull World Health Organ 2017;95:695–705B| doi: http://dx.doi.org/10.2471/BLT.16.189902 705
ResearchMalaria in Papua New GuineaManuel W Hetzel et al.
References1. Müller I, Bockarie M, Alpers M, Smith T. The epidemiology of malaria in Papua New
Guinea. Trends Parasitol. 2003 Jun;19(6):253–9. doi: http://dx.doi.org/10.1016/S1471-4922(03)00091-6 PMID: 12798082
2. Betuela I, Maraga S, Hetzel MW, Tandrapah T, Sie A, Yala S, et al. Epidemiology of malaria in the Papua New Guinean highlands. Trop Med Int Health. 2012 Oct;17(10):1181–91. doi: http://dx.doi.org/10.1111/j.1365-3156.2012.03062.x PMID: 22925472
3. Mueller I, Namuigi P, Kundi J, Ivivi R, Tandrapah T, Bjorge S, et al. Epidemic malaria in the highlands of Papua New Guinea. Am J Trop Med Hyg. 2005 May;72(5):554–60. PMID: 15891129
4. Cooper RD, Waterson DG, Frances SP, Beebe NW, Pluess B, Sweeney AW. Malaria vectors of Papua New Guinea. Int J Parasitol. 2009 Nov;39(13):1495–501. doi: http://dx.doi.org/10.1016/j.ijpara.2009.05.009 PMID: 19505467
5. Hetzel MW, Gideon G, Lote N, Makita L, Siba PM, Mueller I. Ownership and usage of mosquito nets after four years of large-scale free distribution in Papua New Guinea. Malar J. 2012 06 10;11(1):192. doi: http://dx.doi.org/10.1186/1475-2875-11-192 PMID: 22682111
6. Hetzel MW, Pulford J, Maraga S, Barnadas C, Reimer LJ, Tavul L, et al. Evaluation of the Global Fund-supported National Malaria Control Program in Papua New Guinea, 2009–2014. P N G Med J. 2014 Mar-Dec;57(1-4):7–29. PMID: 26930885
7. Hetzel MW, Morris H, Tarongka N, Barnadas C, Pulford J, Makita L, et al. Prevalence of malaria across Papua New Guinea after initial roll-out of insecticide-treated mosquito nets. Trop Med Int Health. 2015 Dec;20(12):1745–55. doi: http://dx.doi.org/10.1111/tmi.12616 PMID: 26427024
8. Hetzel MW, Reimer LJ, Gideon G, Koimbu G, Barnadas C, Makita L, et al. Changes in malaria burden and transmission in sentinel sites after the roll-out of long-lasting insecticidal nets in Papua New Guinea. Parasit Vectors. 2016 06 14;9(1):340. doi: http://dx.doi.org/10.1186/s13071-016-1635-x PMID: 27301964
9. Reimer LJ, Thomsen EK, Koimbu G, Keven JB, Mueller I, Siba PM, et al. Malaria transmission dynamics surrounding the first nationwide long-lasting insecticidal net distribution in Papua New Guinea. Malar J. 2016 01 12;15(1):25. doi: http://dx.doi.org/10.1186/s12936-015-1067-7 PMID: 26753618
10. Hetzel MW, Choudhury AAK, Pulford J, Ura Y, Whittaker M, Siba PM, et al. Progress in mosquito net coverage in Papua New Guinea. Malar J. 2014 Jun 24;13:242.
11. PNG 2000 national census. Port Moresby: National Statistical Office; 2000.12. Malaria Indicator Survey toolkit. Vernier: Roll Back Malaria Partnership; 2013.
Available from: http://malariasurveys.org/toolkit.cfm [cited 2017 Aug 20].13. Robinson LJ, Wampfler R, Betuela I, Karl S, White MT, Li Wai Suen CS, et al. Strategies
for understanding and reducing the Plasmodium vivax and Plasmodium ovale hypnozoite reservoir in Papua New Guinean children: a randomised placebo-controlled trial and mathematical model. PLoS Med. 2015 10 27;12(10):e1001891. doi: http://dx.doi.org/10.1371/journal.pmed.1001891 PMID: 26505753
14. Sankoh O, Sharrow D, Herbst K, Whiteson Kabudula C, Alam N, Kant S, et al. The INDEPTH standard population for low- and middle-income countries, 2013. Glob Health Action. 2014;7(1):23286. doi: http://dx.doi.org/10.3402/gha.v7.23286
15. Haemoglobin concentrations for the diagnosis of anaemia and assessment of severity. Geneva: World Health Organization; 2011. Available from: http://www.who.int/vmnis/indicators/haemoglobin/en/ [cited 2017 Aug 20].
16. Hetzel MW, Pulford J, Gouda H, Hodge A, Siba PM, Mueller I. The Papua New Guinea national malaria control program: primary outcome and impact indicators, 2009–2014. Goroka: Papua New Guinea Institute of Medical Research; 2014.
17. World malaria report 2015. Geneva: World Health Organization; 2015. Available from: http://www.who.int/malaria/publications/world-malaria-report-2015/report/en/ [cited 2017 Aug 20].
18. Imwong M, Nguyen TN, Tripura R, Peto TJ, Lee SJ, Lwin KM, et al. The epidemiology of subclinical malaria infections in South-East Asia: findings from cross-sectional surveys in Thailand–Myanmar border areas, Cambodia, and Vietnam. Malar J. 2015 09 30;14(1):381. doi: http://dx.doi.org/10.1186/s12936-015-0906-x PMID: 26424000
19. Lek D, Popovici J, Ariey F, Vinjamuri SB, Meek S, Bruce J, et al. National malaria prevalence in Cambodia: microscopy versus polymerase chain reaction estimates. Am J Trop Med Hyg. 2016 Sep 7;95(3):588–94. doi: http://dx.doi.org/10.4269/ajtmh.15-0908 PMID: 27402511
20. Pava Z, Burdam FH, Handayuni I, Trianty L, Utami RA, Tirta YK, et al. Submicroscopic and asymptomatic Plasmodium parasitaemia associated with significant risk of anaemia in Papua, Indonesia. PLoS One. 2016 10 27;11(10):e0165340. doi: http://dx.doi.org/10.1371/journal.pone.0165340 PMID: 27788243
21. Parkinson AD. Malaria in Papua New Guinea 1973. P N G Med J. 1974;17(1):8–16.22. Maude RJ, Nguon C, Ly P, Bunkea T, Ngor P, Canavati de la Torre SE, et al. Spatial and
temporal epidemiology of clinical malaria in Cambodia 2004–2013. Malar J. 2014 09 30;13(1):385. doi: http://dx.doi.org/10.1186/1475-2875-13-385 PMID: 25266007
23. William T, Rahman HA, Jelip J, Ibrahim MY, Menon J, Grigg MJ, et al. Increasing incidence of Plasmodium knowlesi malaria following control of P. falciparum and P. vivax malaria in Sabah, Malaysia. PLoS Negl Trop Dis. 2013;7(1):e2026. doi: http://dx.doi.org/10.1371/journal.pntd.0002026 PMID: 23359830
24. Betuela I, Rosanas-Urgell A, Kiniboro B, Stanisic DI, Samol L, de Lazzari E, et al. Relapses contribute significantly to the risk of Plasmodium vivax infection and disease in Papua New Guinean children 1–5 years of age. J Infect Dis. 2012 Dec 1;206(11):1771–80. doi: http://dx.doi.org/10.1093/infdis/jis580 PMID: 22966124
25. Bousema T, Okell L, Felger I, Drakeley C. Asymptomatic malaria infections: detectability, transmissibility and public health relevance. Nat Rev Microbiol. 2014 12;12(12):833–40. doi: http://dx.doi.org/10.1038/nrmicro3364 PMID: 25329408
26. Park J-W, Cheong H-K, Honda Y, Ha M, Kim H, Kolam J, et al. Time trend of malaria in relation to climate variability in Papua New Guinea. Environ Health Toxicol. 2016 02 25;31(0):e2016003–0. doi: http://dx.doi.org/10.5620/eht.e2016003 PMID: 26987606
27. Radford AJ, Van Leeuwen H, Christian SH. Social aspects in the changing epidemiology of malaria in the highlands of New Guinea. Ann Trop Med Parasitol. 1976 Mar;70(1):11–23. doi: http://dx.doi.org/10.1080/00034983.1976.11687091 PMID: 1267506
28. Manning L, Laman M, Rosanas-Urgell A, Michon P, Aipit S, Bona C, et al. Severe anemia in Papua New Guinean children from a malaria-endemic area: a case-control etiologic study. PLoS Negl Trop Dis. 2012;6(12):e1972. doi: http://dx.doi.org/10.1371/journal.pntd.0001972 PMID: 23272266
29. Senn N, Maraga S, Sie A, Rogerson SJ, Reeder JC, Siba P, et al. Population hemoglobin mean and anemia prevalence in Papua New Guinea: new metrics for defining malaria endemicity? PLoS One. 2010 02 24;5(2):e9375. doi: http://dx.doi.org/10.1371/journal.pone.0009375 PMID: 20195369
30. Low M, Farrell A, Biggs B-A, Pasricha S-R. Effects of daily iron supplementation in primary-school-aged children: systematic review and meta-analysis of randomized controlled trials. CMAJ. 2013 Nov 19;185(17):E791–802. doi: http://dx.doi.org/10.1503/cmaj.130628 PMID: 24130243
31. Killeen GF, Smith TA, Ferguson HM, Mshinda H, Abdulla S, Lengeler C, et al. Preventing childhood malaria in Africa by protecting adults from mosquitoes with insecticide-treated nets. PLoS Med. 2007 Jul;4(7):e229. doi: http://dx.doi.org/10.1371/journal.pmed.0040229 PMID: 17608562
32. Pulford J, Kurumop SF, Ura Y, Siba PM, Mueller I, Hetzel MW. Malaria case management in Papua New Guinea following the introduction of a revised treatment protocol. Malar J. 2013 11 27;12(1):433. doi: http://dx.doi.org/10.1186/1475-2875-12-433 PMID: 24279720
33. Pulford J, Smith I, Mueller I, Siba PM, Hetzel MW. Health worker compliance with a ‘test and treat’ malaria case management protocol in Papua New Guinea. PLoS One. 2016 07 8;11(7):e0158780. doi: http://dx.doi.org/10.1371/journal.pone.0158780 PMID: 27391594
34. Karunajeewa HA, Mueller I, Senn M, Lin E, Law I, Gomorrai PS, et al. A trial of combination antimalarial therapies in children from Papua New Guinea. N Engl J Med. 2008 Dec 11;359(24):2545–57. doi: http://dx.doi.org/10.1056/NEJMoa0804915 PMID: 19064624
35. Senn N, Rarau P, Manong D, Salib M, Siba P, Robinson LJ, et al. Rapid diagnostic test-based management of malaria: an effectiveness study in Papua New Guinean infants with Plasmodium falciparum and Plasmodium vivax malaria. Clin Infect Dis. 2012 Mar 1;54(5):644–51. doi: http://dx.doi.org/10.1093/cid/cir901 PMID: 22198787
36. Saweri OP, Hetzel MW, Mueller I, Siba PM, Pulford J. The treatment of non-malarial febrile illness in Papua New Guinea: findings from cross sectional and longitudinal studies of health worker practice. BMC Health Serv Res. 2017 01 5;17(1):10. doi: http://dx.doi.org/10.1186/s12913-016-1965-6 PMID: 28056949
37. Hii JL, Smith T, Mai A, Mellor S, Lewis D, Alexander N, et al. Spatial and temporal variation in abundance of Anopheles (Diptera:Culicidae) in a malaria endemic area in Papua New Guinea. J Med Entomol. 1997 Mar;34(2):193–205. doi: http://dx.doi.org/10.1093/jmedent/34.2.193 PMID: 9103763
38. Charlwood JD, Paru R, Dagoro H. Raised platforms reduce mosquito bites. Trans R Soc Trop Med Hyg. 1984;78(1):141–2. doi: http://dx.doi.org/10.1016/0035-9203(84)90204-9 PMID: 6143428
39. Charlwood JD, Graves PM, Alpers MP. The ecology of the Anopheles punctulatus group of mosquitoes from Papua New Guinea: a review of recent work. P N G Med J. 1986 Mar;29(1):19–26. PMID: 3463014
40. Hetzel MW, Pulford J, Tandrapah T, Jamea-Maiasa S; PNGIMR MalCon Team. Missing in the line of duty. P N G Med J. 2014 Mar-Dec;57(1-4):94–102. PMID: 26930893

Bull World Health Organ 2017;95:695–705B| doi: http://dx.doi.org/10.2471/BLT.16.189902 705A
ResearchMalaria in Papua New GuineaManuel W Hetzel et al.
Tabl
e 4.
Ag
e-st
anda
rdize
d pr
eval
ence
of P
lasm
odiu
m in
fect
ion,
by p
rovi
nce,
nat
iona
l mal
aria
surv
eys,
Papu
a Ne
w G
uine
a, 2
010–
2014
Prov
ince
and
regi
on20
10–2
011
surv
ey20
13–2
014
surv
ey
No. o
f par
ticip
ants
Neta u
se
(%)
Infe
ctio
n pr
eval
ence
(%
)No
. of p
artic
ipan
tsNe
ta use
(%
)In
fect
ion
prev
alen
ce
(%)
All P
lasm
odiu
m
spec
ies
P. fa
lcipa
rum
P. vi
vax
All P
lasm
odiu
m
spec
ies
P. fa
lcipa
rum
P. vi
vax
Sout
hern
Reg
ion
01. W
este
rn37
683
.91.
10.
90.
250
473
.10.
00.
00.
002
. Gul
f57
780
.60.
80.
80.
050
480
.00.
00.
00.
003
. Cen
tral
814
75.2
5.6
2.4
3.2
474
62.6
0.0
0.0
0.0
04. N
atio
nal C
apita
l Dist
rict
673
15.7
0.6
0.2
0.2
301
20.7
0.0
0.0
0.0
05. M
ilne
Bay
721
73.5
8.3
2.9
4.2
324
63.5
0.9
0.0
0.9
06. O
ro74
065
.52.
21.
60.
663
162
.50.
00.
00.
0To
tal
3901
60.0
3.3
1.5
1.5
2738
59.8
0.1
0.0
0.1
Hig
hlan
ds R
egio
n07
. Sou
ther
n H
ighl
ands
Al
titud
e ≥
160
0 m
494
50.5
1.0
0.7
0.3
335
28.9
0.4
0.4
0.0
08. E
nga
Al
titud
e ≥
160
0 m
498
31.2
0.8
0.8
0.0
335
7.4
0.0
0.0
0.0
09. W
este
rn H
ighl
ands
Al
titud
e <
160
0 m
295
32.3
0.5
0.5
0.0
164
47.9
0.0
0.0
0.0
Al
titud
e ≥
160
0 m
188
29.5
0.0
0.0
0.0
213
42.2
0.0
0.0
0.0
10. C
him
bu
Altit
ude
< 1
600
m14
041
.80.
00.
00.
085
29.9
0.0
0.0
0.0
Al
titud
e ≥
160
0 m
359
33.5
0.5
0.5
0.0
253
53.1
0.0
0.0
0.0
11. E
aste
rn H
ighl
ands
Al
titud
e <
160
0 m
ND
ND
ND
ND
ND
171
38.0
0.0
0.0
0.0
Al
titud
e ≥
160
0 m
ND
ND
ND
ND
ND
258
38.4
0.0
0.0
0.0
Tota
l 19
7436
.20.
60.
50.
118
1432
.90.
10.
10.
0M
omas
e Re
gion
12. M
orob
e
Altit
ude
< 1
600
m67
245
.74.
83.
61.
228
277
.30.
30.
30.
0
Altit
ude
≥ 1
600
m0
NA
NA
NA
NA
142
55.0
0.0
0.0
0.0
13. M
adan
g47
945
.76.
34.
51.
844
770
.33.
33.
30.
014
. Eas
t Sep
ik66
561
.93.
92.
11.
746
183
.10.
00.
00.
015
. San
daun
403
30.1
11.0
5.0
4.9
645
52.8
3.0
2.4
0.5
Tota
l22
1947
.05.
93.
62.
119
7767
.71.
91.
60.
2
(con
tinue
s. . .
)
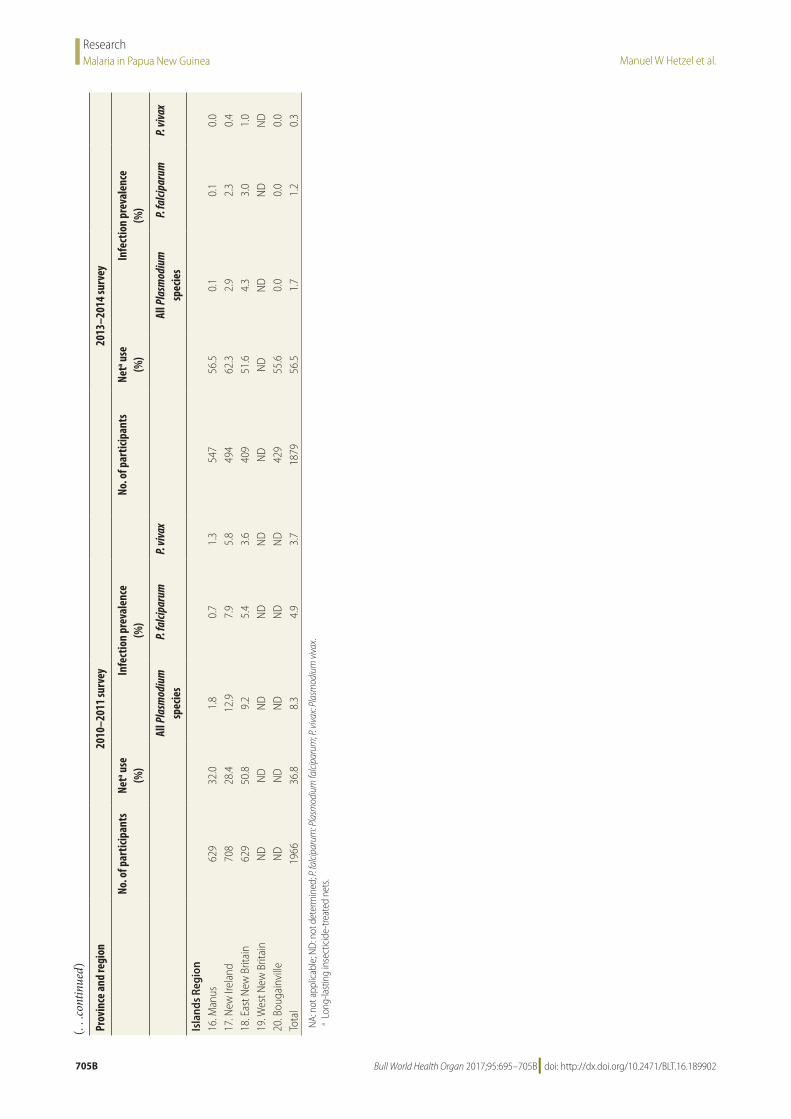
Manuel W Hetzel et al.Malaria in Papua New GuineaResearch
705B Bull World Health Organ 2017;95:695–705B| doi: http://dx.doi.org/10.2471/BLT.16.189902
Pr
ovin
ce a
nd re
gion
2010
–201
1 su
rvey
2013
–201
4 su
rvey
No. o
f par
ticip
ants
Neta u
se
(%)
Infe
ctio
n pr
eval
ence
(%
)No
. of p
artic
ipan
tsNe
ta use
(%
)In
fect
ion
prev
alen
ce
(%)
All P
lasm
odiu
m
spec
ies
P. fa
lcipa
rum
P. vi
vax
All P
lasm
odiu
m
spec
ies
P. fa
lcipa
rum
P. vi
vax
Isla
nds
Regi
on16
. Man
us62
932
.01.
80.
71.
354
756
.50.
10.
10.
017
. New
Irel
and
708
28.4
12.9
7.9
5.8
494
62.3
2.9
2.3
0.4
18. E
ast N
ew B
ritai
n62
950
.89.
25.
43.
640
951
.64.
33.
01.
019
. Wes
t New
Brit
ain
ND
ND
ND
ND
ND
ND
ND
ND
ND
ND
20. B
ouga
invi
lleN
DN
DN
DN
DN
D42
955
.60.
00.
00.
0To
tal
1966
36.8
8.3
4.9
3.7
1879
56.5
1.7
1.2
0.3
NA:
not
app
licab
le; N
D: n
ot d
eter
min
ed; P
. falci
paru
m: P
lasm
odiu
m fa
lcipa
rum
; P. v
ivax:
Plas
mod
ium
viva
x.a L
ong-
last
ing
inse
ctic
ide-
treat
ed n
ets.
(. . .
cont
inue
d)